soundpro user manual - 3m · soundpro user manual. models se and dl ... c-a measurement settings...
TRANSCRIPT

3M Personal Safety Division3MTM SoundPro SE/DL Series Sound Level Meters
SoundPro User Manual

Models SE and DL
3MTM SoundPro Sound Level Meter
Dangers, Warnings, Cautions & Battery
Danger! Failure to observe the following procedures may result in serious personal injury • Not for use in explosive or hazardous locations. This product is not intrinsically safe.
Warning! Failure to observe the following procedures could damage the instrument
• Read the manual before operation. • Do not store in temperatures exceeding 60°C (140°F). • Do not immerse in liquids. • Condensation may damage your instrument. • Substitution of components may impair the accuracy of the instrument. Repair
should be performed by authorized service personnel only. Caution! General
• The battery in this instrument has limited shelf-life, even if never used. • A non-condensing environment is required for proper measurements.
Intended Use: The SoundPro is intended to measure sound pressure levels in air. Consult your company’s safety professional for local standards, or call 3M at 1-800-243-4630.

ii Table of Contents
Models SE and DL
TABLE OF CONTENTS
Introduction .............................................................................................................. 1
Models and options .................................................................................................. 1
Frequency resolution ............................................................................................... 2
Octave bands .......................................................................................................................... 2 Third -octave bands ................................................................................................................ 3
Naming bands ......................................................................................................................... 3
Analysis type ........................................................................................................................... 5
Logging explained.................................................................................................... 5
Physical Characteristics .......................................................................................... 5
The Display ............................................................................................................................. 5 Hardware interfaces ................................................................................................................ 6
Memory card slot ............................................................................................................... 6 USB port ............................................................................................................................ 6 AC/DC port ........................................................................................................................ 7 Power jack ......................................................................................................................... 7 Auxiliary port ...................................................................................................................... 7
Information screen ................................................................................................... 8
Screen contents ...................................................................................................................... 8
Detection Management Software DMS ................................................................... 9
DMS Start Page ...................................................................................................................... 9
Getting Started ....................................................................................................... 11
Checking the equipment ........................................................................................ 11
Installing the preamp ............................................................................................................. 12
Microphone and accessories ................................................................................ 12
Class/Type 1 and Class/Type 2 instrument .......................................................................... 13 Windscreen ...................................................................................................................... 13
Providing power ..................................................................................................... 14
Installing Batteries ................................................................................................................. 14
Battery power explained ....................................................................................................... 15

iii Table of Contents
Models SE and DL
Checking or changing type .................................................................................................. 15
Using power supply or auto adapter ..................................................................................... 17
Turning on .............................................................................................................. 18
Start screen and the keypad ................................................................................................. 18
SoundPro functionality .......................................................................................... 19
The keypad explained ........................................................................................................... 19
Indicators explained .............................................................................................................. 20
Navigating ............................................................................................................................. 21
Turning off .............................................................................................................. 21
Basic setups ........................................................................................................... 23
Changing microphone settings ............................................................................................. 24 Time and date ....................................................................................................................... 25
Measurement type (SLM, 1/1, 1/3, STI-PA, RT60) ............................................................... 26
Meter 1/Meter 2 Parameters (i.e. response time, weighting) ................................................ 27
Measurement setup (for community noise) .......................................................................... 28 C-A measurement settings .............................................................................................. 30
Logging ................................................................................................................... 31
Logging options ..................................................................................................................... 31
Exceedance level .................................................................................................................. 31
Filters .................................................................................................................................... 31 Logging interval ..................................................................................................................... 31
Setting logging options .......................................................................................................... 32
Setting up display options ..................................................................................... 33
Language .............................................................................................................................. 34
Backlight ................................................................................................................................ 35
Contrast ................................................................................................................................. 36
Advanced setups ................................................................................................... 37
Auto-Run ................................................................................................................. 38

iv Table of Contents
Models SE and DL
Setting up auto-run ................................................................................................ 38
Date setting ........................................................................................................................... 38
Days of week setting ............................................................................................................. 40
Auto-run shutdown screen .................................................................................................... 42 Auto-run shutdown screen explained .............................................................................. 42
Timed run setting .................................................................................................................. 43
Level-triggered auto-on setting ............................................................................................. 44
Locking setup or run mode ................................................................................... 46
Setting secure run or secure setup (locking) ........................................................................ 46 About Secure Run ........................................................................................................... 46 About Secure Setup ........................................................................................................ 46
Disabling secure run or secure setup (unlocking)................................................................. 49 Secure code backup number .......................................................................................... 49
Digital outputs/Triggering ...................................................................................... 50
Tracking runs ........................................................................................................................ 50
Digital outputs and SPL ........................................................................................................ 51
Communications .................................................................................................... 51
QSP/Serial ............................................................................................................................ 52
Mass Storage ........................................................................................................................ 52
Viewing real-time measurements remotely ........................................................................... 53
GPS ....................................................................................................................................... 54 GPS display ..................................................................................................................... 54 GPS explained ................................................................................................................. 54
Preparing to measure & running ........................................................................... 57
Virtual meters ......................................................................................................... 57
Meter 1/Meter 2 explained .................................................................................................... 57
Measurement notation (IEC/ISO) ........................................................................... 57
Overview of running a session/study ................................................................... 58
Preparing to measure ............................................................................................ 59
Sessions and Studies ........................................................................................................... 59

v Table of Contents
Models SE and DL
Measurement range .............................................................................................................. 60
Calibrate .................................................................................................................. 61
Calibration screen ................................................................................................................. 61 Pre-Calibration ................................................................................................................. 61 Post-Calibration ............................................................................................................... 61
Performing a calibration ........................................................................................................ 62
Running a session/study ....................................................................................... 64
Measurement navigation ....................................................................................... 65
Using softkeys in measurement screens .............................................................................. 65 Changing displayed measurement .................................................................................. 66 Analysis type, time response and weighting ................................................................... 66
Measurement screen icons ................................................................................... 67
Descriptor types .................................................................................................................... 67
Measurement screens ............................................................................................ 68
Bar Chart and Filtered Bar Chart .......................................................................................... 68
Community Noise screen ...................................................................................................... 69
Dosimetry screen .................................................................................................................. 70 Dosimetry measurements ............................................................................................... 70
Tabulation screens ................................................................................................................ 71 1/1 and 1/3 octave analysis measurement results .................................................................... 71
Time History/Back-erase screen ........................................................................... 72
Back-erasing........................................................................................................... 72
Results of back-erasing ........................................................................................................ 73 Stopping a session ................................................................................................................ 75
Stopping and pausing ...................................................................................................... 75
RT60, Curves, and STI-PA ..................................................................................... 77
Additional options .................................................................................................. 77
Reverberation........................................................................................................................ 77
Reverberation time (RT60) ................................................................................................... 78
Reverberation (RT60) methods ............................................................................................ 78 Interrupted noise .............................................................................................................. 79

vi Table of Contents
Models SE and DL
Impulse noise .................................................................................................................. 79
Reverberation options ........................................................................................................... 80
Setting up reverberation ........................................................................................................ 81 Running reverberation test .................................................................................................... 82
Reverberation results ............................................................................................................ 83 RT60 summary screen .................................................................................................... 84 Viewing RT60 values of each band ................................................................................. 84 Deleting RT60 value in a filtered band ............................................................................ 84 Decay curve screen ......................................................................................................... 85 Tabular RT60 screen ....................................................................................................... 86
Curves ..................................................................................................................... 87
Captured curves ..................................................................................................... 87
Captured curve applications ................................................................................................. 87
Setting up captured curves ................................................................................................... 88
Running captured curves ...................................................................................................... 90
Criterion curve families ......................................................................................... 91
Types of Criterion Curves ..................................................................................................... 91
Setting up criterion curves .................................................................................................... 92
Audiometric background curves ........................................................................... 94
Setting up audiometric background curves ........................................................................... 94
Running and viewing curves ................................................................................. 96
Curve measurements and results ......................................................................................... 96
Speech Intelligibility ............................................................................................... 98
STI-PA testing ....................................................................................................................... 98
Zones .................................................................................................................................... 98
Selecting STI scale or CIS scale .......................................................................................... 98 STI scale .......................................................................................................................... 99 Common Intelligibility Scale (CIS) ................................................................................... 99 When to take STI-PA readings? ...................................................................................... 99
Conducting a STI-PA test (overview of steps) .................................................................... 100
STI-PA setup ....................................................................................................................... 100

vii Table of Contents
Models SE and DL
Conducting a level setup (for STI-PA) ................................................................................ 103
Running a speech intelligibility study .................................................................................. 103
STI-PA results screens ....................................................................................................... 104 STI-PA measurement and scale results screen ............................................................ 104 STI-PA modulation screen ............................................................................................ 105 STI-PA modulation envelope screen ............................................................................. 106
Applying captured curves for STI-PA testing ...................................................................... 108
Viewing Past Measurements ............................................................................... 111
Files ....................................................................................................................... 111
File directories ...................................................................................................... 111
File directory screen explained ........................................................................................... 112
Viewing past sessions/studies (review mode) .................................................................... 112
Loading and deleting files ................................................................................................... 115 Session directory ................................................................................................................ 116
Navigating in a session/config. directory ....................................................................... 117 Naming and renaming files ............................................................................................ 117
Configuration directory ....................................................................................... 118
Saving (& naming) setup file (config. file) ........................................................................... 118
Viewing, loading, deleting setup files (config.) .................................................................... 119
Memory card ......................................................................................................... 120
Compatibility........................................................................................................................ 120
Formatting a card with the SoundPro ................................................................................. 120
Communicating .................................................................................................... 121
Communicating with a PC ................................................................................... 121
Using Detection Management Software DMS .................................................................... 121 Using an external card reader ....................................................................................... 121
Working with measurement data in DMS ........................................................................... 121 DMS and working with SoundPro data ............................................................................... 122
AC/DC output ........................................................................................................ 123
AC output ............................................................................................................................ 123

viii Table of Contents
Models SE and DL
DC output ............................................................................................................................ 123
Specifications ....................................................................................................... 125
Conformance to standards .................................................................................. 125 Acoustics ....................................................................................................................... 125 EMC emissions and immunity ....................................................................................... 125
Mechanical characteristics .................................................................................. 125
Electrical characteristics ..................................................................................... 126 Power sources ............................................................................................................... 126
Internal power ......................................................................................................................... 126 External power ........................................................................................................................ 127
Preamplifier (removable) ............................................................................................... 127 Meters ............................................................................................................................ 127 Bandwidth ...................................................................................................................... 127 Octave filters (optional) ................................................................................................. 128 Third-octave filters (optional) ......................................................................................... 128 Instrument noise ............................................................................................................ 128
Environmental effects .......................................................................................... 128 Temperature .................................................................................................................. 128 Humidity ......................................................................................................................... 129
User interface ....................................................................................................... 129 Display ........................................................................................................................... 129 Keypad .......................................................................................................................... 129 Languages ..................................................................................................................... 129
Input/output .......................................................................................................... 129 Microphones .................................................................................................................. 129 AC/DC outputs ............................................................................................................... 130 Communications ports ................................................................................................... 131
Measurements ...................................................................................................... 131 Types ............................................................................................................................. 131 Ranges .......................................................................................................................... 131 Measurement parameters ............................................................................................. 131 Other .............................................................................................................................. 132
Calibration ............................................................................................................ 132
Studies and sessions ........................................................................................... 132
Special features .................................................................................................... 132 Security .......................................................................................................................... 132 Back-erase .................................................................................................................... 133

ix Table of Contents
Models SE and DL
Logging (optional) ................................................................................................ 133
Part numbers ........................................................................................................ 133 Replacement parts ........................................................................................................ 133 Optional parts ................................................................................................................ 134
Port pinouts .......................................................................................................... 135
AC/DC jack.......................................................................................................................... 135
Auxiliary connector .............................................................................................................. 135
Block Diagram for SoundPro .............................................................................. 136
Glossary of Terms ................................................................................................ 137
Customer service ................................................................................................. 149
Contacting 3M ...................................................................................................... 149
Warranty ............................................................................................................... 150
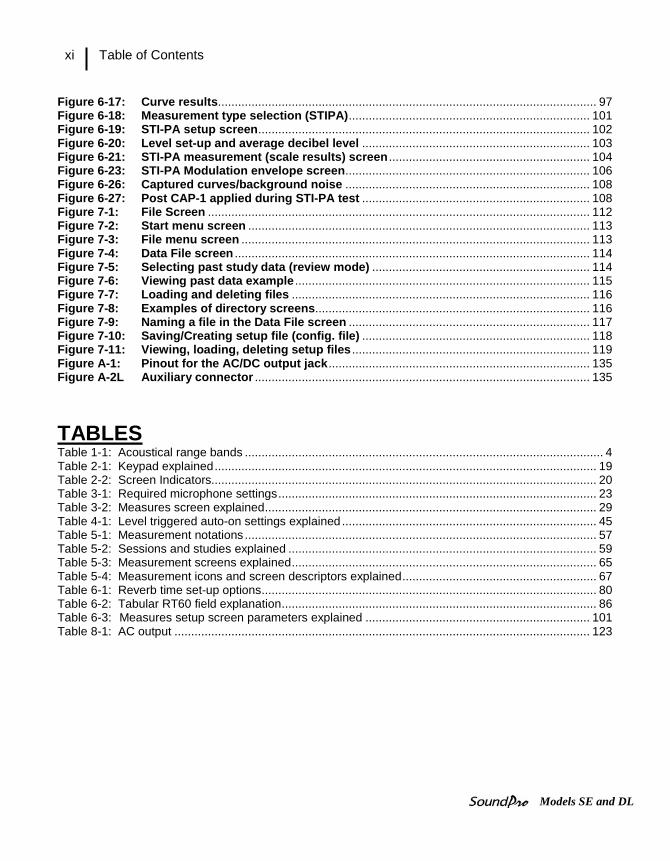
FIGURES Figure 1-1: SoundPro Models SE and DL and Option 1 and Option 2........................................... 1 Figure 1-2: Octave bands .................................................................................................................. 2 Figure 1-3: Third Octave bands ........................................................................................................ 3 Figure 1-4: Hardware Interface Panel ............................................................................................... 6 Figure 1-5: The Unit Information screen .......................................................................................... 8 Figure 2-1: Identify SoundPro equipment ...................................................................................... 11 Figure 2-2: SoundPro & Preamp ..................................................................................................... 12 Figure 2-3: SoundPro with microphone and windscreen ............................................................. 13 Figure 2-4: Installing batteries ........................................................................................................ 14 Figure 2-5: Battery check screen ................................................................................................... 15 Figure 2-6: Selecting Setup in the Start Screen ............................................................................ 16 Figure 2-7: Selecting battery type in battery check screen .......................................................... 16 Figure 2-8: Attaching the charger adapter with the plug adapter ................................................ 17 Figure 2-9: Base (or bottom) of SoundPro .................................................................................... 17 Figure 2-10: SoundPro SE/DL start screen and keypad ................................................................. 18 Figure 3-1: Microphone Settings (Signal Input screen) ................................................................ 24 Figure 3-2: Time and Date Settings ................................................................................................ 25 Figure 3-3: Measurement type and start screen ........................................................................... 26 Figure 3-4: Meter 1 and Meter 2 parameters .................................................................................. 27 Figure 3-5: Measures screen for community noise settings ........................................................ 28 Figure 3-6: C-A measurement settings for Meter 1 and Meter 2 .................................................. 30 Figure 3-7: Logged Data Chart example ........................................................................................ 31 Figure 3-8: Logging screen explained ........................................................................................... 32 Figure 3-9: Display setup screen .................................................................................................... 33 Figure 3-10: Language screen .......................................................................................................... 34 Figure 3-11: Backlight setting ........................................................................................................... 35 Figure 4-1: Auto-Run with Date selected ....................................................................................... 38

x Table of Contents
Models SE and DL
Figure 4-2: Setting Date parameters for Auto-Run #1 .................................................................. 39 Figure 4-3: Example of setting up Auto-Run (QSP-II) ................................................................... 40 Figure 4-4: Day of the Week (DOW) setup ..................................................................................... 41 Figure 4-5: Auto-Run Shutdown screen ........................................................................................ 42 Figure 4-6: Timed Run setup screen .............................................................................................. 43 Figure 4-7: Level-Triggered screen ................................................................................................ 44 Figure 4-8: Secure/Lock option ...................................................................................................... 47 Figure 4-9: Secure/Lock screen ...................................................................................................... 47 Figure 4-10: Adding code for secure/lock screen ........................................................................... 48 Figure 4-11: Secure/lock run prompt ............................................................................................... 48 Figure 4-12: Secure/lock setup prompt............................................................................................ 49 Figure 4-13: Digital-Out screen ......................................................................................................... 50 Figure 4-14: QSP/Serial ..................................................................................................................... 52 Figure 4-15: Mass Storage ................................................................................................................ 52 Figure 4-16: Log to Port .................................................................................................................... 53 Figure 4-17: Comm-Set screen for GPS data .................................................................................. 54 Figure 4-18: Viewing GPS coordinates in COMM-Set screen ........................................................ 55 Figure 5-1: Bar chart screen (A) and Filtered Bar Chart (B) ......................................................... 60 Figure 5-2: Attaching calibrator to SoundPro ............................................................................... 62 Figure 5-3: Setting pre-cal screen .................................................................................................. 63 Figure 5-4: Calibration history screen ........................................................................................... 63 Figure 5-5: Post-Calibrate history screen ...................................................................................... 64 Figure 5-6: Bar Chart screen in run mode ..................................................................................... 64 Figure 5-7: Selecting measurements with Lookup softkey .......................................................... 66 Figure 5-8: Example measurement icons & descriptors .............................................................. 67 Figure 5-9: Bar Chart screen and Filtered Bar Chart screen ........................................................ 68 Figure 5-10: Community Noise screen............................................................................................. 69 Figure 5-11: Dosimetry screen ......................................................................................................... 70 Figure 5-12: Tabulation screen for octave filtering ......................................................................... 71 Figure 5-13: Back-erasing ................................................................................................................. 72 Figure 5-14: Time Log screen ........................................................................................................... 74 Figure 5-15: Stopping and pausing .................................................................................................. 75 Figure 6-1: Reverb Time .................................................................................................................. 78 Figure 6-2: Interrupted noise example ........................................................................................... 79 Figure 6-3: Reverb Time Setup screen........................................................................................... 81 Figure 6-4: Reverb Time Setup screen........................................................................................... 83 Figure 6-5: RT60 bar chart screen .................................................................................................. 84 Figure 6-6: Decay curve screen ...................................................................................................... 85 Figure 6-7: Tabular octave filtering RT screen .............................................................................. 86 Figure 6-8: Selecting measurement type for curves ..................................................................... 88 Figure 6-9: Captured Curves and Survey mode ............................................................................ 89 Figure 6-10: Selecting 1/1 or 1/3 for measurement type ................................................................. 90 Figure 6-11: Capturing a curve (CAP-1) ........................................................................................... 91 Figure 6-12: Selecting measurement type for curves ..................................................................... 92 Figure 6-13: Curves setup screen example ..................................................................................... 93 Figure 6-14: 1/1 or 1/3 octave measurement type for audiometric testing ................................... 94 Figure 6-15: Selecting measurement type for curves ..................................................................... 95 Figure 6-16: Audiometric booth setup in the curves screen .......................................................... 95
xi Table of Contents
Models SE and DL
Figure 6-17: Curve results ................................................................................................................. 97 Figure 6-18: Measurement type selection (STIPA) ........................................................................ 101 Figure 6-19: STI-PA setup screen ................................................................................................... 102 Figure 6-20: Level set-up and average decibel level .................................................................... 103 Figure 6-21: STI-PA measurement (scale results) screen ............................................................ 104 Figure 6-23: STI-PA Modulation envelope screen ......................................................................... 106 Figure 6-26: Captured curves/background noise ......................................................................... 108 Figure 6-27: Post CAP-1 applied during STI-PA test .................................................................... 108 Figure 7-1: File Screen .................................................................................................................. 112 Figure 7-2: Start menu screen ...................................................................................................... 113 Figure 7-3: File menu screen ........................................................................................................ 113 Figure 7-4: Data File screen .......................................................................................................... 114 Figure 7-5: Selecting past study data (review mode) ................................................................. 114 Figure 7-6: Viewing past data example ........................................................................................ 115 Figure 7-7: Loading and deleting files ......................................................................................... 116 Figure 7-8: Examples of directory screens.................................................................................. 116 Figure 7-9: Naming a file in the Data File screen ........................................................................ 117 Figure 7-10: Saving/Creating setup file (config. file) .................................................................... 118 Figure 7-11: Viewing, loading, deleting setup files ....................................................................... 119 Figure A-1: Pinout for the AC/DC output jack .............................................................................. 135 Figure A-2L Auxiliary connector .................................................................................................... 135
TABLES Table 1-1: Acoustical range bands ........................................................................................................... 4 Table 2-1: Keypad explained .................................................................................................................. 19 Table 2-2: Screen Indicators................................................................................................................... 20 Table 3-1: Required microphone settings ............................................................................................... 23 Table 3-2: Measures screen explained ................................................................................................... 29 Table 4-1: Level triggered auto-on settings explained ............................................................................ 45 Table 5-1: Measurement notations ......................................................................................................... 57 Table 5-2: Sessions and studies explained ............................................................................................ 59 Table 5-3: Measurement screens explained ........................................................................................... 65 Table 5-4: Measurement icons and screen descriptors explained .......................................................... 67 Table 6-1: Reverb time set-up options .................................................................................................... 80 Table 6-2: Tabular RT60 field explanation .............................................................................................. 86 Table 6-3: Measures setup screen parameters explained ................................................................... 101 Table 8-1: AC output ............................................................................................................................ 123

xii Table of Contents
Models SE and DL
This page left blank intentionally

1 Models and options Octave bands
Models SE and DL
Introduction The SoundPro SE and DL series of sound level meters (SLM) from 3M are advanced instruments with highly adaptable characteristics. This manual explains the features and functions of all models in the series and points out distinctions between the models.
Models and options There are twelve models in the SoundPro SE and DL series. The differences between models are accounted for by three primary characteristics: accuracy of measurement, frequency resolution, and the types of data stored. The table in Figure 1-1 summarizes the characteristics of all twelve models and includes add-on features for Reverberation, Speech Intelligibility and Acoustic Spectral Curves.
Figure 1-1: SoundPro Models SE and DL and Option 1 and Option 2
Part # Model C
lass
/Typ
e 2
Cla
ss/T
ype
1
Sum
mar
y a
nd
Stat
istic
al D
ata
Tim
e H
isto
ry
Dat
a
1/1
Oct
ave
RTA
1/3
Oct
ave
RTA
SP-SE-2 SoundPro SE SLM X X SP-SE-2-1/1
SoundPro SE 1/1 Octave RTA X X X SP-SE-2-1/3
SoundPro SE 1/1 & 1/3 Octave RTA X SP-SE-1
SoundPro SE Sound Level Meter X X SP-SE-1- 1/1
SoundPro SE 1/1 Octave RTA X X X SP-SE-1-1/3
SoundPro SE 1/1 & 1/3 Octave RTA X X X X SP-DL-2
SoundPro DL Datalogging SLM X X X SP-DL-2 – 1/1
SoundPro DL 1/1 Octave Datalogging RTA X SP-DL-2 – 1/3
SoundPro DL 1/1 & 1/3 Octave Datalogging RTA X X X X X SP-DL-1
SoundPro DL Datalogging SLM X X X SP-DL-1 – 1/1
SoundPro DL 1/1 Datalogging RTA X X X X SP-DL-1 – 1/3
SoundPro DL 1/1 & 1/3 Octave Datalogging RTA X X X X X
Part # Description Compatible with the following models:
Option-1 Speech Intelligibility (STI-PA) and Acoustic Spectral Curves
SP-SE-2-1/1 SP-SE-2-1/3 SP-SE-1-1/1 SP-SE-1-1/3 SP-DL-2-1/1 SP-DL-2-1/3 SP-DL-1-1/1 SP-DL-1-1/3
Option – 2
Speech Intelligibility (STI-PA) with accessories and Acoustic Spectral Curves
SP-SE-2-1/1 SP-SE-2-1/3 SP-SE-1-1/1 SP-SE-1-1/3 SP-DL-2-1/1 SP-DL-2-1/3 SP-DL-1-1/1 SP-DL-1-1/3
Reverberation
Reverberation measurement and RT60 analysis (part number: 053-768)
(SoundPro SE and DL models with 1/1 and/ or 1/3 only) includes: SP-SE-2-1/1 SP-SE-2-1/3 SP-SE-1-1/1 SP-SE-1-1/3 SP-DL-2-1/1 SP-DL-2-1/3 SP-DL-1-1/1 SP-DL-1-1/3
CHAPTER
1

2 Frequency resolution Octave bands
Models SE and DL
Frequency resolution The sounds we hear are rarely pure tones at a single frequency but rather a mixture of frequencies of varying amplitudes. Some sounds, such as a whistle or a horn, have frequencies concentrated in relatively narrow regions of the audio spectrum, which ranges from approximately 20 Hz to 20,000 Hz. Other sounds, more generally thought of as noise, include components from many regions of the entire spectrum. When analyzing sound as noise, we usually are concerned with the total impact of the sound signal. In other words, we are usually satisfied with a broadband measurement of sound in the environment. When we are seeking to isolate a sound from other sounds, for instance to detect the source of a sound or to measure how much particular sounds contribute to the overall sound level, we may want to look at the frequency components of the sound.
Octave bands The ability of an instrument to separate a signal into its frequency components is known as a spectral analysis. In sound pressure measurement, the audio spectrum is divided into adjacent frequency bands called octaves, where the center frequency of each octave band is twice the center frequency of the octave band directly below it. There are eleven octave bands in the audio spectrum. Figure 1-2 illustrates the relationship between the bandwidth of a typical sound measuring instrument and the octave bands that span the audio spec-trum. Note that the highest and lowest octaves at 16 Hz and 16 kHz lie entirely within the bandwidth of the instrument.
Figure 1-2: Octave bands
Leve
l

3 Frequency resolution Third -octave bands
Models SE and DL
Third -octave bands Each octave band can be divided into three adjacent bands called third-octave band. Because of the logarithmic relationship between adjacent bands, the center frequencies of third-octave bands differ from each other by 26%. For example, the center frequency of the next third-octave band above the 1000 Hz third-octave band is at 1260 Hz. Figure 1-3 is similar to Figure 1-2 but shows the thirty-three third-octave bands in relation to the instrument’s bandwidth.
Figure 1-3: Third Octave bands
Naming bands Bands are conventionally named for their center frequencies in accordance with acoustical industry standards. Table 1-1 identifies the SoundPro SE or DL models that have octave and third-octave bands option with their exact center frequencies and their corresponding standardized names.
Leve
l

4 Frequency resolution Naming bands
Models SE and DL
Exact Center
Frequency (Hz) Names of Octave
Bands (Hz) Names of Third-octave
Bands (Hz)
12.589 12.5 15.849 16 16 19.953 20 25.119 25 31.623 31.5 31.5 39.811 40 50.119 50 63.096 63 63 79.433 80 100.00 100 125.89 125 125 158.49 160 199.53 200 251.19 250 250 316.23 315 398.11 400 501.19 500 500 630.96 630 794.33 800 1000.0 1000 1000 1258.9 1250 1584.9 1600 1995.3 2000 2000 2511.9 2500 3162.3 3150 3981.1 4000 4000 5011.9 5000 6309.6 6300 7943.3 8000 8000 10000 10000 12589 12500 15849 16000 16000 19953 20000
Table 1-1: Acoustical range bands

5 Logging explained Analysis type
Models SE and DL
Analysis type All SoundPro SE/DL instruments are capable of analyzing sound signals over the full bandwidth of the instrument also referred to as “broadband measurement”. If your instrument comes equipped with a filter, it can perform an octave or a third-octave analysis, or both, depending upon the type of filter installed. You can vary the analysis type between sessions, and the analysis type selection remains constant throughout the session. Analysis types are identified in SoundPro SE/DL by the following names:
• SLM - Broadband measurements • 1/1 - Octave filtering • 1/3 - Third-octave filtering • STI-PA -Speech Intelligibility
Logging explained Although you can view the current sound pressure level at any time that the instrument is operating (See “Bar Chart and Filtered Bar Chart” on page 67), most measurements are reported for data obtained over the entire course of a study or session. In some circumstances, however, you may want to save intermediate measurement results. The SoundPro DL logging option provides you with that capability. With logging enabled, you can save selected measurements at fixed intervals during a session. You can set logging to occur as often as once per second or as seldom as once per hour. Once the logging characteristics are determined, the setup remains the same for the duration of the session. Logged data is automatically saved to the instrument’s memory card and can be viewed in QSP II (“Information screen” on page 8).
NOTE: You must use a compatible SD card. For information about replacing the SD card, see “Compatibility” on page 117.
Physical Characteristics
The Display The transflective LCD display contains an area on the top of the screen for indicators including run, pause, stop icons and a run time clock. The middle of the screen contains a fine resolution of pixels in which data is displayed

6 Physical Characteristics Hardware interfaces
Models SE and DL
both numerically and graphically. This is explained in further detail in Chapter 2, “The Display and keypad”).
Hardware interfaces The Hardware Interface Panel, shown in Figure 1- 4, is located under a hinged cover in the base of the instrument. The cover can be lifted by a tab at one side, and snapped shut again by closing and pressing firmly at the center.
Figure 1-4: Hardware Interface Panel
Memory card slot A Secure Digital (SD) removable memory card is shipped with each SoundPro SE/DL instrument. The card should always be in place when you are operating the instrument. More information about operating with the memory card is given under “Memory card” on page 106.
NOTE: You must use a compatible SD card. For information about replacing the SD card, see “Compatibility” on page 117.
USB port A USB cable is shipped with each SoundPro SE/DL instrument. One end fits the mini B port in the instrument. The other end fits a standard USB connector on a personal computer. A USB connection to a personal computer allows files to be transferred, settings to be downloaded to the instrument, and post- session analysis to be performed in the computer using data files created in the instrument.

7 Physical Characteristics Hardware interfaces
Models SE and DL
AC/DC port Connect a cable with a standard 3.5 mm stereo plug to this jack to obtain AC and DC output signals. Users are responsible for providing their own cable.
Power jack DC power can be delivered to the instrument through the Power jack. Power will be taken from the external source rather than the instrument’s batteries when the external source provides 8 to 16 volts DC (300ma minimum). Two optional sources for this power are available: a switching power supply connected to an AC source and DC power provided through the accessory jack of most automobiles. For the technical specifications, see “Power sources” in Appendix A. Part numbers are given under “Optional parts” in Appendix A.
Auxiliary port Use this port to connect the SoundPro SE/DL instrument to other devices. The two types of functions, described below, are available through the terminals of this port. A pinout of the port is provided under “Auxiliary connector” on page 139. • Digital I/O - A group of contacts within the port provides one, logic- level
input and three, logic-level outputs. See “Digital Outputs/Triggering” on page 50 are information about configuring and using the triggers.
• RS-232 - A group of contacts within the port supports the RS-232 protocol for communication between the instrument and other devices, such as a Global Positioning Satellite (GPS) receiver. See “GPS” on page 54 for information about configuring the port for this purpose.

8 Information screen Screen contents
Models SE and DL
Information screen Every SoundPro SE/DL instrument describes its unique characteristics in its Information screen. In the Start screen, press to select Unit Info, then press . The Unit Info screen appears (Figure 1-5).
Figure 1-5: The Unit Information screen
Screen contents The lines indicated in Figure 1-7 will contain the following information. Line 1 - Model number showing, in order, the 3M designation (SE or DL), the Class/Type (1 or 2) and the filter, if installed (1/1, 1/3 or blank). Line 2 - Unique serial number assigned when the instrument was manufactured. Line 3 – The installed feature’s field lists any extra options (note: these may be additionally purchased features as displayed above for Curves and STI-PA.)
NOTE: It’s a good idea to record Information screen data in the event that you need assistance and the instrument refuses to power up. For 3M assistance, see “Contacting 3M” on page 149.
\UNIT INFO SoundPro DL-1-1/3 Serial # BIF120010 Revision B 12M Installed Features: CURVES STI-PA
12 3

9 Detection Management Software DMS DMS Start Page
Models SE and DL
Detection Management Software DMS 3M™ Detection Management Software DMS is used to record, report, chart and analyze data collected for assessment of select occupational health hazards in the workplace. Designed for dosimetry, sound level measurements, heat stress assessments and environmental monitoring, the software helps safety and occupational professionals: • Retrieve, download, share and save instrument data • Generate insightful charts and reports • Export and share recorded data • Perform “What If” analysis and recalculate data based on selected time intervals • Set up instruments and check for firmware updates Some data can only be displayed in DMS. One example is logging data obtained when logging is enabled in an instrument equipped with that option (“Logging” on page 33). Another example is with the GPS function. When enabled the data is viewable in DMS.
DMS Start Page
Navigational buttons (1) Setup (2) Download (3) Data Finder (look
at your session data or use Quick Report feature)

10 Detection Management Software DMS DMS Start Page
Models SE and DL
This page left intentionally blank
11 Checking the equipment DMS Start Page
Models SE and DL
Getting Started This chapter provides the basic information you need to “get up and go” essentially right out of the box, including getting your first glimpses of SPL.
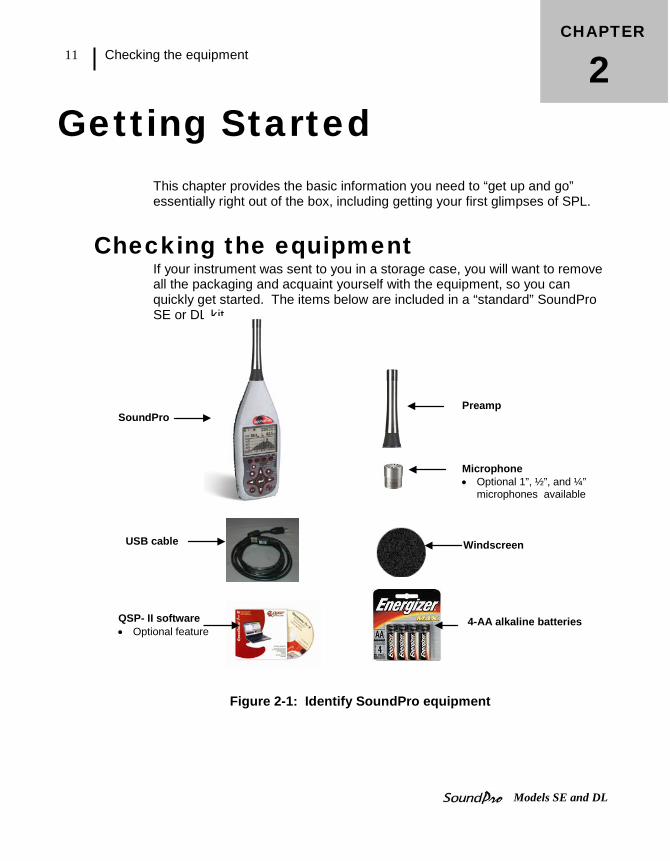
Checking the equipment If your instrument was sent to you in a storage case, you will want to remove all the packaging and acquaint yourself with the equipment, so you can quickly get started. The items below are included in a “standard” SoundPro SE or DL kit.
Figure 2-1: Identify SoundPro equipment
CHAPTER
2
SoundPro Preamp
Windscreen
Microphone • Optional 1”, ½”, and ¼”
microphones available
USB cable
QSP- II software • Optional feature
4-AA alkaline batteries

12 Microphone and accessories Installing the preamp
Models SE and DL
Installing the preamp The preamplifier is detachable for storage purposes or if you wish to connect an extension cable for distance monitoring. Connecting to the instrument
Place the preamp connector over the mating connector at the top of the instrument. Gently press down while rotating the preamp until the preamp connector drops slightly in place.
Figure 2-2: SoundPro & Preamp
1. While pressing the connector together to engage the threads, rotate the black knob clockwise to secure the preamp to the instrument. It will fit snuggly.
Connecting an extension cable Extension cables are available from 3M as options and are typically used to distance the instrument body from the microphone to reduce distorting reflections from the instrument’s case. 1. Attach the cable to the base as if it were the preamp and then follow
the steps above “Connecting to the instrument”. Attach the preamp to the other end of the cable.
Microphone and accessories The instrument is ordered either for Class/Type 1 or Class/Type 2 use. See “Distinctions between models” on page 1 for information about this classifi-cation. The microphones are treated differently for the two classes of instru-ments.
Twist preamp locking ring onto SoundPro

13 Microphone and accessories Class/Type 1 and Class/Type 2 instrument
Models SE and DL
Class/Type 1 and Class/Type 2 instrument The SoundPro is shipped with the Type 1 in a protective case with a serial number labeled on the side of the microphone. Similarly, the SoundPro with the Class/Type 2 microphone is also shipped in a protective case. To attach and remove the microphone, please follow one of the types below:
• BK4936 microphone - Remove the microphone from its case and thread it on the SoundPro SE/DL preamp in accordance with the instructions provided in the microphone case. Note that the BK4936 microphone is provided with a Random Incidence Corrector (RIC). Use the same microphone instructions for information about using and installing that device.
• All other Class/Type 1 microphones - Remove the microphone from its protective case and thread it on the preamp. Before using, be sure to remove the plastic cap and save it in the case for future use.
• Class/Type 2 microphones – Remove the microphone from its protective case and thread it on the preamp. Before using, be sure to remove plastic cap and save it in the case for future use.
NOTE: to properly remove the microphone, please adhere to the caution sticker located on the backside of the instrument and the drawing to the right.
Windscreen Use a windscreen that fits the tip of the microphone to reduce sound disturbances caused by physical contact and wind turbulence. 3M provides the WS-7 windscreen that fits a ½-inch microphone with every instrument kit. If you didn’t order a ½-inch microphone, or if you have one of different size, you may wish to order a windscreen for the other size.
Figure 2-3: SoundPro with microphone and windscreen
Yes
No

14 Providing power Installing Batteries
Models SE and DL
Providing power You can power the instrument with internal batteries or from an external power source. There are two optional sources which include a universal power supply 9V/.66A 2.1 mm and an auto DC jack cable 12V. (See Optional Parts, in Appendix A for more details.)
Installing Batteries The instrument requires four AA-sized batteries. Disposable alkaline batteries are satisfactory, but you may also use rechargeable Nickel Metal Hydride (NiMH) batteries. • Rechargeable batteries ~ The instrument does not contain a recharging
circuit. Recharge batteries externally using the recharging device available from 3M or a compatible device available elsewhere.
• Selecting batteries ~ Do not mix battery types or batteries with significantly different charge levels.
NOTE: To avoid possible battery leakage, remove the batteries when the meter is not in use for prolonged periods.
To install batteries 1. With the back of the instrument facing up, push the release latch to pop
open the battery lid (Figure 2-1).
Figure 2-4: Installing batteries
2. Lift off the lid and set aside. Wedge out the four batteries. 3. Replace the batteries with fresh batteries, taking care that you orient all
batteries with the positive ends toward the base, as shown in the drawing. 4. Re-insert the lid by fitting its locator pins into slots in the base end of the
battery compartment. The lid should fit snugly when correctly inserted.

15 Providing power Battery power explained
Models SE and DL
5. Press the top edge of the lid to snap it into the latch. 6. Verify or set the type in the Battery Check screen. (See the next section
“Checking battery power”.)
Battery power explained The battery check screen is used to determine the battery/power status of the instrument. When operating on batteries, the grey area in each cell graphic indicates the charge on each cell (Figure 2-5).
When operating on an external power source (see next section, “external power sources”), the external power will take precedence over batteries if installed.
Figure 2-5: Battery check screen
Checking or changing type The battery type selection in this display affects the accuracy of the Battery Indicator that appears in many SoundPro SE/DL displays. NOTE: It is recommended to match the battery type to the type
of batteries installed in the instrument, or you may experience an unexpected shutdown.
Battery indicator If all bars appear up to starting line, this indicates full battery power
Externally powered If using an external power source, EXT will appear and all batteries will be fully shaded indicating full power capacity.

16 Providing power Checking or changing type
Models SE and DL
Battery Check screen 1. Turn on the SoundPro SE/DL by pressing On/Off/ESC . You will be at
the start screen.
• If turned on, ensure you are at the start screen by pressing On/Off/Esc repeatedly until the start screen appears.
Figure 2-6: Selecting Setup in the Start Screen
2. Press Up/Down arrows to highlight Setup and then press Enter .
3. In the Setup screen, select Battery, then press Enter . The Battery Check screen appears.
Figure 2-7: Selecting battery type in battery check screen
4. Press the softkey that corresponds with the installed battery type (See “A” or “B” in Figure 2-7 for selection). The label above the softkey is underlined to indicate the current selection.
5. When completed, press On/Off/Esc once to return to the Setup screen and twice to return to the start screen.
Setup
Softkey buttons
A: Press softkey to select Alkaline
B : Press softkey to select NiMH

17 Providing power Using power supply or auto adapter
Models SE and DL
Using power supply or auto adapter If you obtained the optional Universal power supply 9V cable or the Auto DC Jack 12 VDC adapter from 3M, plug them into their respective power sources and the other end into the Power jack of the instrument. If the external power source provides the correct voltage (8-16 VDC) and sufficient current (300 mA minimum), it will be used in place of the batteries if they’re installed in the instrument.
Figure 2-8 illustrates the assembly of the Universal power supply and the plug adapter. It slides into place by guiding it down the back cavity (opening) of the power supply.
- NOTE: the example is a typical adapter which may be different than the one you are using. Mechanically, it will function similarly.
Figure 2-8: Attaching the charger adapter with the plug adapter
Connecting power supply source 1. Ensure the power supply is assembled (for universal power supply only). 2. Plug the power cord into the power jack by opening the base cover. Attach the
opposite end into the power supply (i.e., outlet/automobile jack) (as discussed in “Hardware interfaces”, page 6.)
Figure 2-9: Base (or bottom) of SoundPro
3. Plug the opposite end into the power supply.
B. Slide plug adapter into the crevices of base A. Universal power supply 9V
Universal power supply
Auto adapter
Power Jack

18 Turning on Start screen and the keypad
Models SE and DL
Turning on 1. To turn on the SoundPro, press the On/Off/Esc key until the start
screen appears.
Start screen and the keypad The Start screen is the first screen you see when you power on and the last screen you see when you shut down. This essential main screen is also used to navigate through the menu options. The keypad and softkeys are used to setup the instrument, run a study, stop a study, view your measurement values, and power on and off the meter.
Figure 2-10: SoundPro SE/DL start screen and keypad
1. Display
8. Softkeys
12. ON/Off and ESC
2. Backlight
9. AltF
6. Run/Pause
Indicators
• Battery power: • Stop: • Run time: 00:00:00
<SLM> CAL FILE COMM
5. Up/Down arrows
7. “Softkey” Menu: Correspond with softkeys
3. Stop
11. Right arrow 4. Left
10. Enter
19 SoundPro functionality The keypad explained
Models SE and DL
SoundPro functionality
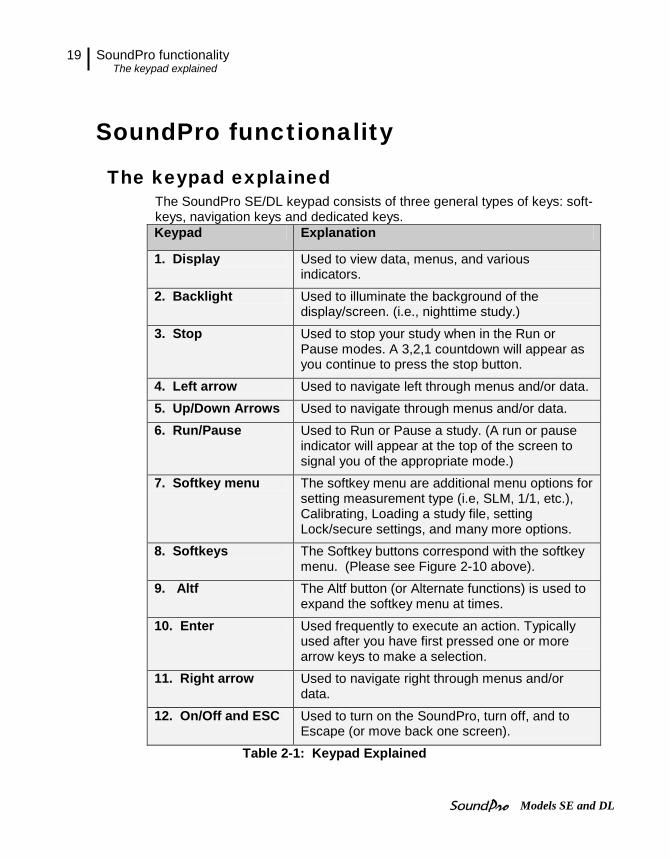
The keypad explained The SoundPro SE/DL keypad consists of three general types of keys: soft-keys, navigation keys and dedicated keys. Keypad Explanation
1. Display Used to view data, menus, and various indicators.
2. Backlight Used to illuminate the background of the display/screen. (i.e., nighttime study.)
3. Stop Used to stop your study when in the Run or Pause modes. A 3,2,1 countdown will appear as you continue to press the stop button.
4. Left arrow Used to navigate left through menus and/or data.
5. Up/Down Arrows Used to navigate through menus and/or data.
6. Run/Pause Used to Run or Pause a study. (A run or pause indicator will appear at the top of the screen to signal you of the appropriate mode.)
7. Softkey menu The softkey menu are additional menu options for setting measurement type (i.e, SLM, 1/1, etc.), Calibrating, Loading a study file, setting Lock/secure settings, and many more options.
8. Softkeys The Softkey buttons correspond with the softkey menu. (Please see Figure 2-10 above).
9. Altf The Altf button (or Alternate functions) is used to expand the softkey menu at times.
10. Enter Used frequently to execute an action. Typically used after you have first pressed one or more arrow keys to make a selection.
11. Right arrow Used to navigate right through menus and/or data.
12. On/Off and ESC Used to turn on the SoundPro, turn off, and to Escape (or move back one screen).
Table 2-1: Keypad Explained

20 SoundPro functionality Indicators explained
Models SE and DL
Indicators explained Status information is provided by the instrument at the top of the display. Below is a summary of all of the indicators.
Icon Significance
Battery charge status. This icon shows the status/level of the
batteries. A full battery indicates one of the following: • externally powered • or the SoundPro is fully charged.
Run state. This icon appears when a study is running.
Paused state. This icon appears when the current session is open but paused.
Stop state. This icon appears when the current session is stopped.
Review mode. When the pause and stop icons appear, this indicates that you are viewing a saved file.
Overload condition. When an overload occurs during a study, this indicator appears and remains lit until the beginning of the next study.
Underrange condition. When an underrange condition occurs during a study, this indicator appears and remains lit until the beginning of the next study.
Alternate functions. This icon appears below the Battery Charge Indicator when alternate functions are being displayed.
Table 2-2: Screen Indicators
UR
OL

21 Turning off Navigating
Models SE and DL
Navigating To navigate to menus and data screens, the up/down arrows and left/right arrows are primarily used.
The On/Off Esc button is also used as a navigational tool at any time you wish to move back one level. If you press ESC repeatedly, you will return to the start screen.
Turning off
1. To turn off the SoundPro, ensure the meter is stopped (i.e., indicator will display on the top of the screen).
2. Press and hold the On/Off/ESC button until the start screen
disappears.

22 Turning off Navigating
Models SE and DL
This page left blank intentionally

23 Basic setups Navigating
Models SE and DL
Basic setups This chapter covers the basic features and setups of SoundPro SE/DL that establish the instrument’s operating conditions. For information about the more advanced SoundPro SE/DL features and their setups, see Chapter 4, “Advanced setups.” For information on setting-up and measuring add-on features (Reverberation, STI-PA, or Curves), please see Chapter 6.
• Microphone Settings
• Setting Date-Time
• Setting Measurement type (SLM, 1/1, 1/3, STI-PA)
• Setting up Meter 1/Meter 2 parameters
• Setting up Exceedance levels
• Setting up Logging
• Setting physical settings: backlight “on” time, contrast, choosing a language
• Microphone settings
With Class/Type 1 models, the microphone’s sensitivity, range cap, and polarization can be checked and/or changed in the “Signal Input” menu (when stopped). Alternatively, Class/Type 2 models settings are viewable at any time the session is stopped but cannot be modified. The following table displays the required microphone settings.
Table 3-1: Required microphone settings
Signal Input BK4936 QE7052 QE4110 QE4130 QE4150 QE4170 Sensitivity a -28.0 -29.0 -49.1 -36.0 -26.0 -28.0 Range Cap (dB) 140 140 160 140 140 140 Polarization (V) 0 0 200 200 200 200
CHAPTER
3
24 Basic setups Changing microphone settings
Models SE and DL
Changing microphone settings Microphone settings This procedure applies only to Class/Type 1 models.
1. Turn on the SoundPro SE/DL by pressing On/Off/Esc .
• If turned on, ensure you are at the start screen by pressing On/Off/Esc repeatedly until you return to start screen (see Figure 2-10).
2. Press Up/Down arrows to highlight Setup and then press Enter .
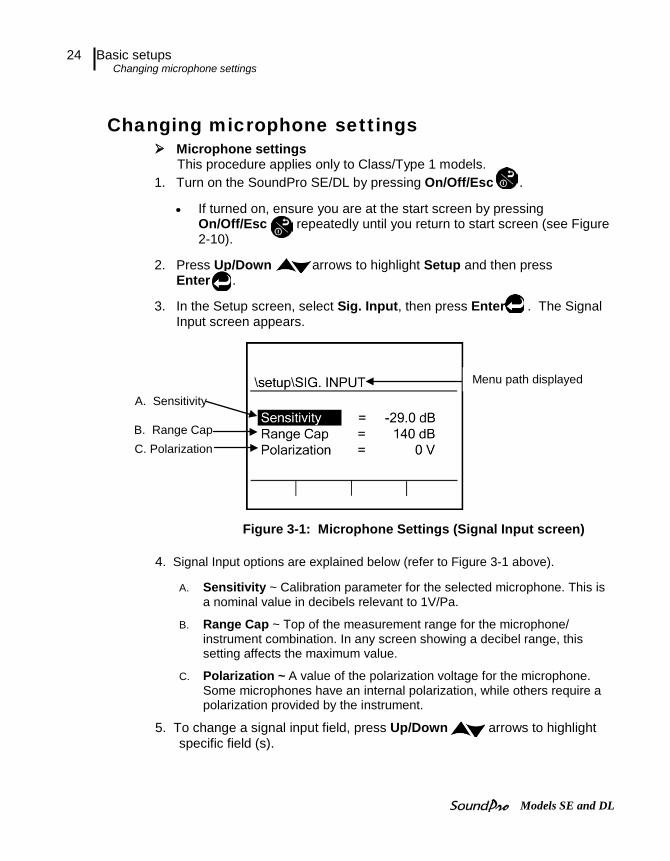
3. In the Setup screen, select Sig. Input, then press Enter . The Signal Input screen appears.
Figure 3-1: Microphone Settings (Signal Input screen)
4. Signal Input options are explained below (refer to Figure 3-1 above).
A. Sensitivity ~ Calibration parameter for the selected microphone. This is a nominal value in decibels relevant to 1V/Pa.
B. Range Cap ~ Top of the measurement range for the microphone/ instrument combination. In any screen showing a decibel range, this setting affects the maximum value.
C. Polarization ~ A value of the polarization voltage for the microphone. Some microphones have an internal polarization, while others require a polarization provided by the instrument.
5. To change a signal input field, press Up/Down arrows to highlight specific field (s).
A. Sensitivity
B. Range Cap C. Polarization
Menu path displayed

25 Basic setups Time and date
Models SE and DL
6. Press Enter . The result will be one of the following: • For Sensitivity and Range Cap fields - The highlighting moves to the
data field. Press Up/Down arrows to change the value.
• Polarization field - Polarization remains highlighted. Continue to press Enter to change (or toggle) the value from 0 V to 200 V.
7. Once desired fields are changed, press On/Off/ Esc twice to return to the Start screen.
Time and date SoundPro SE/DL uses a 24-hour clock and specifies date by month and year. Changing time and date settings 1. Turn on the SoundPro SE/DL by pressing On/Off/Esc .
• If turned on, ensure you are at the start screen by pressing On/Off/esc repeatedly until you return to start screen (see Figure 2-10).
2. Press Up/Down to highlight Setup and then press Enter .
3. In the Setup screen, select Time-Date, then press Enter .
4. In the Time-Date screen, press to select either the Time, Date, Day fields. Then do one of the following:
a. For Time field, press Enter repeatedly to highlight either the hour, minutes, or seconds. Next, press Up/Down to change the value.
b. For Date field, press Enter repeatedly to highlight either day, month, or year. Next, press Up/Down to change the value.
c. For Day field, press Enter repeatedly to highlight either day, month, or year. Next, press Up/Down to change the value.
Figure 3-2: Time and Date Settings
a. Time
b. Date
c. Day

26 Basic setups Measurement type (SLM, 1/1, 1/3, STI-PA, RT60)
Models SE and DL
NOTE: To move to between the time, day, day fields, press Enter repeatedly until one of these fields are highlighted and then press Up/Down arrow to move between the fields.
5. If you’re finished working in the Time-Date screen, press On/Off/Esc once to return to the Setup screen and twice to return to the Start screen.
Measurement type (SLM, 1/1, 1/3, STI-PA, RT60)
The measurement type is easily selectable at the start screen via a softkey button. This is assessable at all times unless you are running a study. To change or set the measurement type, ensure the SoundPro is stopped as indicated by the stop icon. Depending on the options you ordered with your SoundPro it may or may not have all the measurement types indicated above. NOTE: For STI-PA and RT60, please see Chapter 6, “Additional Options”.
Setting Measurement type 1. Turn on the SoundPro SE/DL by pressing On/Off/Esc .
• If turned on and you are not at the start screen, press On/Off/Esc repeatedly until the start screen appears (see Figure 3-3).
2. At the start screen, select the first softkey button repeatedly until the appropriate measurement type is selected.
• You may have the following selectable options: Sound level meter (SLM), 1/1 octave, 1/3 octave, and/or STI-PA (Speech Transmission Index).
Figure 3-3: Measurement type and start screen
1st softkey Repeatedly press to move (toggle) through measurement types
Softkey menu Measurement type (Sound Level Meter)

27 Basic setups Meter 1/Meter 2 Parameters (i.e. response time, weighting)
Models SE and DL
Meter 1/Meter 2 Parameters (i.e. response time, weighting)
Setting up Meter 1 and Meter 2 parameter settings are changed through the softkeys and the Measure Set screen of the SoundPro. Setting up Meter 1 and/or Meter 2 parameters 1. Ensure you are at the start screen.
• If turned on, press On/Off/Esc repeatedly until you return to the start screen (see Figure 3-3).
2. Press Up/Down to highlight Setup and then press Enter .
3. Select Meter Set by pressing Up/Down to highlight and then press Enter .
4. To set the response time for Meter 1, press the second softkey repeatedly
until the either Fast (F), Slow (S), or Impulse (I) is selected. • An underline denotes which feature is selected.
5. To set the weighting for Meter 1, press the third softkey repeatedly until either A, C, Z, of F is underlined (or selected).
• To set Meter 2 response time and weighting, press 4th softkey until Meter 2 is selected. Then repeat steps 4 & 5.
6. To change the Meter parameters, press Up/Down to select one of the Meter Set fields.
7. To change any of the values, press Enter to move to the data fields.
• Continue to press Enter until the specified setting is selected. Press the Left arrow to return to the Meter Set fields.
Figure 3-4: Meter 1 and Meter 2 parameters
Meter Set fields Press up/down arrows to move between the parameters
Parameters Press Enter repeatedly to toggle through the selections
2ND softkey– Response time 3RD softkey– Weighting 4th softkey– Meter 1/Meter 2

28 Basic setups Measurement setup (for community noise)
Models SE and DL
1 2
NOTE: For quick and easy access, there are three optional screens to change the timed response and the weighting. These are in the following SoundPro screens: Measures Set screen, View Current Study screen, and View Session study screen.
Measurement setup (for community noise) The measure screen is used to select community noise settings for meter 1 only. Table 3-2 below explains the settings and options. Setting up community noise measurements (refer to figure 3-5 below) 1. Ensure you are at the start screen.
• If turned on, repeatedly press On/Off/Esc until you return to the start screen (see Figure 3-3).
2. Press Up/Down to highlight Setup and then press Enter . 3. Select Measures from the Setup screen by pressing Up/Down to
highlight and then press Enter . 4. In the Measures screen, press Up/Down to select one of the
measurements. To select second column, first press Up/Down arrows then press Right arrow.
Figure 3-5: Measures screen for community noise settings
5. To make changes to the data fields, do one of the following:
• L1-L4 - Press Enter to move to the data field. In the data field, repeatedly press Enter to change your selection.
• Press arrows to change percentage.
• LDN - Press Enter to move to data field and continue to press Enter to toggle between On/Off setting.
Data fields • Edit column 1 or column 2
fields by pressing enter repeatedly to toggle through selections.
Measurements • L1-L4 • LDN, CNEL • Lc-a, TAKTMX

29 Basic setups Measurement setup (for community noise)
Models SE and DL
• CNEL – Press Enter to select data field. Press Enter repeatedly to toggle between On/Off setting.
• Lc-a – Press Enter to select data field. If marked “N/A,” see “C-A measurement settings.”
• TAKTMX ~ Press Enter one or more times to select 3 sec., 5 sec., or Off.
6. To change other measurement settings, repeat steps 4-5.
7. When finished, press On/Off/Esc to exit the screen. The following table explains your selections in the Measures screen (Please see Appendix B, Glossary of Terms for more details.)
Measurements Explanation
L1-L4 (Exceedance)
L1-L4 are types of exceedance levels. This is defined as the level exceeded by the measured noise level for an identified fraction of time. Exceedance levels may be calculated for many time fractions (or percentages).
• Optional Settings: Set to “Off” or to a percentage value of your choice (1-99%).
LDN Representing the Day/Night sound level, this measurement is 24-hour average sound level where 10 dB is added to all of the readings that occur between 10pm to 7am. (Please see glossary of terms for more details).
• Optional Settings: Set to “Off” or “On”. CNEL Community Noise Exposure Level. The accumulated exposure
to sound measured in 24-hour sampling interval and artificially boosted during certain hours.
Optional Settings: Set to “Off” or “On”. Lc-a This measurement (also commonly called C-A measurement) is
only available under certain conditions. Information about viewing and changing these meter settings is discussed under the next section, “C-A measurement settings”. Optional Settings: Set to “On” and “Off”. See C-A section below for parameter settings.
TAKTMX A time average over a sampling that uses the highest level occurring during the preceding Taktmaximal interval (either three or five seconds), and assumes it was present for the whole Taktmx interval. Optional Settings: Set to “Off”, “3sec”, or “5sec”
Table 3-2: Measures screen explained

30 Basic setups Measurement setup (for community noise)
Models SE and DL
C-A measurement settings The C-A measurement is determined from concurrent measurements of the SPL by both meters. It can only be made if certain settings for Meter 1 and Meter 2 are compatible. If any incompatibility exists, the Lc-a selection in this screen will be marked N/A (Not Available). If you want to activate Lc-a, have the following settings in place before you visit the Measures screen. • Thresholds - Both meters set to “Off” or the same value.
• Exchange rates- Both meters set to the same value.
• Time response - Both meters set to the same value.
• Frequency weightings- Meter 1 must be set to A-weighting; Meter 2 must be set to C-weighting.
Figure 3-6 is an example of the appropriate C-A settings for Meter 1 (left side) and Meter 2 (right side). (Please see “Meter 1/Meter 2 Parameters” on page 27 for setup details.)
Figure 3-6: C-A measurement settings for Meter 1 and Meter 2
Meter 1 • Press softkey to
toggle between Meter 1/Meter 2
Slow response A-weighting Slow response C-weighting Meter 2

31 Logging Logging options
Models SE and DL
Logging
Logging options If the logging option was purchased, you will have the following four types of measurement options:
Figure 3-7: Logged Data Chart example
• Average (AVG on the display), Peak, Maximum (MAX on the display), Minimum (MIN on the display).
NOTE: When logging is enabled and you are viewing these
measurements on the SoundPro display, these are labeled as: L_avg (or L_eq if the exchange rate is set to 3 dB), L_Pk, L_Mx and L_Mn, respectively (See Chapter 5, “Preparing to measure and running”.)
Exceedance level Up to two different exceedance level percentages, ranging from 1-99, can be set in the Meter 1 Logging screen when the logging interval is set to 1 minute. NOTE: if the logging interval field is not set to 1 minute, “N/A” (not
available) will appear in the data field.
Filters The filter option is either a “On” or “Off” setting in Meter 1 and is only available if the instrument contains a filter option. NOTE: The filter option must be set to “on” to data log filtered data.
Logging interval The logging interval is the length of time between logging events.
NOTE: The inverse of the logging interval is the logging rate.

32 Logging Setting logging options
Models SE and DL
Setting logging options To set logging only options (Average, Peak, Maximum, Minimum) Enabling or disabling logging options 1. Ensure you are at the start screen.
• If turned on, repeatedly press On/Off/Esc until you return to the start screen (see Figure 3-3 above).
• To turn on, press and hold On/Off/Esc until the start screen appears.
2. Press Up/Down to highlight Setup and then press Enter .
3. Select Logging by pressing Up/Down to highlight and then press Enter .
4. To change the Logging options for Meter 1 do the following:
a. Press Up/Down to highlight either AVG, PEAK, MAX, MIN. b. Once the measurement is selected, press Enter button to
toggle between “On” or “Off”. Press right/left arrow to move back to logging field.
NOTE: If you are setting Meter 2 options, ensure you are on Meter 2 by pressing the Meter 1/Meter 2 softkey, and then repeat step 4a-b.
Figure 3-8: Logging screen explained
5. To change the Exceedance Levels on Meter 1, press Up/Down to select either L1 or L2
Exceedance options Set % by using the up/down arrows. • L1 • L5
Filters • On/Off setting
Logging Interval • Logging rate which can
be set at various minutes and second values
Logging options On/Off setting • AVG (average) • Peak • MAX (maximum) • MIN (minimum)
Softkey: Meter 1/Meter 2
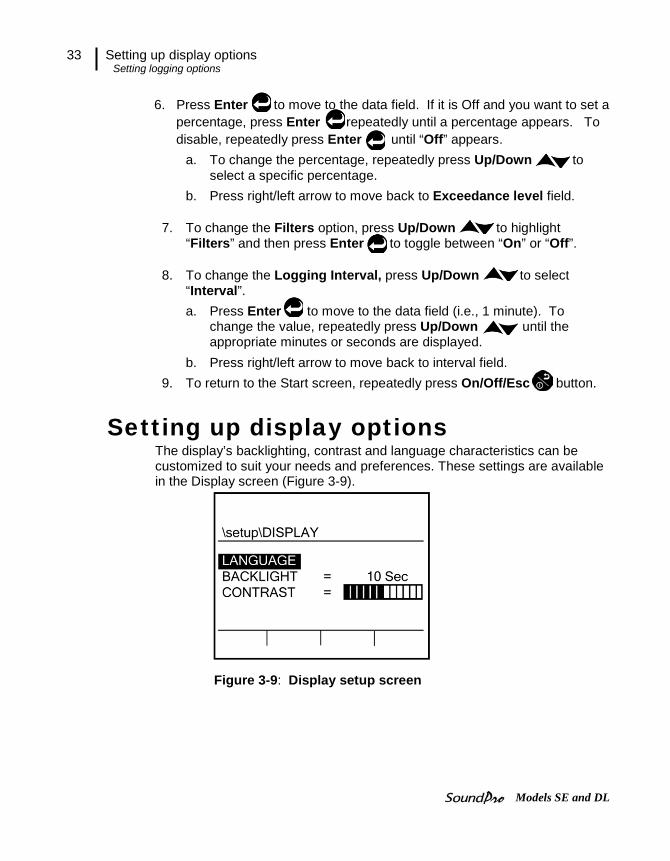
33 Setting up display options Setting logging options
Models SE and DL
6. Press Enter to move to the data field. If it is Off and you want to set a percentage, press Enter repeatedly until a percentage appears. To disable, repeatedly press Enter until “Off” appears.
a. To change the percentage, repeatedly press Up/Down to select a specific percentage.
b. Press right/left arrow to move back to Exceedance level field.
7. To change the Filters option, press Up/Down to highlight “Filters” and then press Enter to toggle between “On” or “Off”.
8. To change the Logging Interval, press Up/Down to select “Interval”. a. Press Enter to move to the data field (i.e., 1 minute). To
change the value, repeatedly press Up/Down until the appropriate minutes or seconds are displayed.
b. Press right/left arrow to move back to interval field. 9. To return to the Start screen, repeatedly press On/Off/Esc button.
Setting up display options The display’s backlighting, contrast and language characteristics can be customized to suit your needs and preferences. These settings are available in the Display screen (Figure 3-9).
Figure 3-9: Display setup screen

34 Setting up display options Language
Models SE and DL
Language You can choose a different language for the displayed text. A change in lan-guage takes effect when you exit the Language screen.
Changing the language
1. Ensure you are at the start screen. • If turned on, repeatedly press On/Off/ESC until you return to the
start screen (see Figure 3-3 above).
• To turn on, press and hold On/Off/ESC until the start screen appears.
2. Press Up/Down to highlight Setup and then press Enter . 3. Select Display by pressing Up/Down to highlight and then press
Enter .
4. In the Display screen, ensure Language is highlighted (or press up/down arrow to select) and press Enter .
• The Language screen appears. An asterisk (*) precedes the name of the currently selected language.
5. Press Up/Down to select a language (an asterisk will appear if selected) and then press Enter .
6. Press On/Off/ESC twice to return to the start screen. The new language will be displayed.
Figure 3-10: Language screen
\setup\display\LANGUAGE *ENGLISH ITALIANO FRANçAIS DEUTSCH
ESPAÑOL PORTUGUESE
*ENGLISH

35 Setting up display options Backlight
Models SE and DL
LANGUAGE
CONTRAST
BACKLIGHT
Backlight
Backlight Typically, the SoundPro is shipped with the backlight setting enabled. With a quick press of the backlight button from the keypad, you can quickly turn on and turn off the backlight.
The backlight feature has an optional timed setting for various second intervals ranging from 1 second to 60 seconds. Once a timed setting is activated and you press the backlight button, the backlight will illuminate for the selected interval (i.e., 10 seconds) and then turn off.
NOTE: Backlighting consumes energy at an increased rate. Leaving it on while operating with batteries will decrease battery life by up to 10%.
Setting or viewing Backlight options 1. From the start screen, press Up/Down to highlight Setup and
press Enter .
2. In the Setup screen, press Up/Down to highlight Display and press Enter .
3. In the Display screen, press Up/Down to highlight Backlight.
4. Press Enter to move to the data field. Repeatedly press Enter to
toggle between “Manual” and “XX Sec” fields.
NOTE: if you are not setting the timed backlight, skip step four.
5. To change the timed backlight, ensure you are on a timed value (i.e., 10 seconds) and repeatedly press Up/Down to increase or decrease the time. Once set, press the Left arrow.
Figure 3-11: Backlight setting
6. Press On/Off/ESC twice to return to the start screen.
Backlight settings • Manual – The backlight is turned on
and turned off by pressing the backlight button on the keypad.
• Interval time – repeatedly press Up/Down arrow to increase or decrease the seconds.

36 Setting up display options Contrast
Models SE and DL
7. To set the backlight, press the backlight button on the keypad.
Contrast The contrast adjustment affects all pixels in the LCD screen. Choose a level that looks best to you.
NOTE: If the contrast level is set too high, icons and the RunTime clock in the Status Region of the display can be ghosted (visible in this display although they’re not supposed to show). Reduce setting to avoid ghosting.
Changing the contrast on the display 1. From the start screen, press Up/Down to highlight Setup and
press Enter .
2. In the Setup screen, press Up/Down to highlight Display and press Enter .
3. Press Up/Down to highlight Contrast and then press Enter .
4. Repeatedly press the left or right arrow to decrease or increase the contrast.
NOTE: The contrast will change as you change the contrast color with
the left or right arrows. 5. To exit the display screen, press the On/Off/Esc twice to return to the
Start screen.
Figure 3-12: Contrast setting
LANGUAGE BACKLIGHT
CONTRAST Contrast setting Press Left arrow or Right arrow repeatedly to decrease or increase the contrast.

37
Models SE and DL
Advanced setups This chapter covers the SoundPro models SE and DL features listed below, all of which provide capabilities beyond the essential ones required for basic model setup and basic sound measurement. For information about basic SoundPro models SE and DL features and setups, see Chapter 3, “Basic setups.” For information about the notation and navigation conventions that are used in these explanations, see Chapter 1, “Introduction.” • Auto-Run - Similar to an “Auto-Start” feature, it will automatically start
and stop sessions based on time, date, duration settings and level- triggered run mode (which is used to control runtimes of studies and sessions using internal and external signals.)
• Triggering - Control the runtimes of studies and sessions using internal and external signals.
• Security - Prevent certain uses of the instrument by someone who doesn’t know the security codes (available for all instruments).
• Logging - Periodically save selected measurements at a preset interval during all studies of a session (only for DL models).
• GPS - Obtain position and time information from the global positioning satellite system, and store that information with each study that you perform (only available if you have a compatible GPS receiver).
CHAPTER
4

38 Auto-Run Date setting
Models SE and DL
Auto-Run SoundPro SE/DL has four automatic run modes which include: Date auto-start with duration, Day of the Week auto-start with duration, Timed Run (duration only setting), and Level Triggered Runs (or Level auto-start runs).
Setting up auto-run All Auto-Run setups begin in the Auto-Run screen. The Auto-Run screen shows the current status of the Auto-Run feature. The following features are available: Disabled, Timed Run, DOW (day of week), Date, and Level-Triggered settings.
Date setting A Date mode run wakes up the instrument from a powered down condition, runs the study, saves it, then powers down again and is only executable once. The parameters are selectable by specified dates and times with up to four programmable individual setups.
A plus sign preceding a number (i.e., +1) indicates if one of the four settings is enabled (or activated) where as a negative sign (i.e. -4) represents a disabled (or deactivated) setting.
Setting up or changing auto-run with date parameter 1. From the start screen, press Up/Down to highlight Setup and press
Enter .
2. Select Auto-Run by using Up/Down to highlight and press Enter to select.
3. In the Auto-Run screen, repeatedly press Enter until Date appears.
Figure 4-1: Auto-Run with Date selected
4. To select View/Set Parameters, press the Down arrow to highlight and press Enter .
Date setting
View/Set Parameters – when selected a new menu appears

39 Setting up auto-run Date setting
Models SE and DL
5. Press one of the four softkeys in the Auto-Run Date screen to assign a numbered setting (i.e., “Auto-Run #1).
NOTE: if setting up for the first time, the Date screen will appear as “Auto-Run” “Off”. To turn on Auto-Run # 1, #2, #3, or #4, select the appropriate softkey. (For example, Figure 4-3 displays setting up softkey #1 parameters. When activated a “+” symbol appears.)
6. To set Date values, press Enter to move to the first field. • To change the fields, press repeatedly Up/Down . To move
between the day, month, and year fields, press the right/left arrows.
Figure 4-2: Setting Date parameters for Auto-Run #1
7. To enter Start (S) Time and Duration (D) Time, it is important to note that the settings are formatted as Hours:Minutes:Seconds and based on a 24-hour clock. In Figure 4-3, the Start time is indicated as “16:30:00” which is equivalent to 4:30pm.
• To Set, press Up/Down arrows to increase/decrease values. To move between each increment, press Enter .
8. To set additional Auto-Runs, repeatedly press Enter until “Auto-Run” is highlighted. Then press Enter to toggle on the Date and Time settings. Then follow steps 5-7.
9. To exit the screen, press On/Off/Esc repeatedly until you return to the main screen. Press and hold the On/Off/Esc to power off.
Date Settings Day, Month, Year fields
Time settings Add Start time (S) (8:15:00am) Add Duration (D) (16 hr, 30min, 0 sec.) (or 6:30:00pm)
Example: Press first softkey to activate “Auto-run #1” settings
Auto-Run #1 Indicates which 1-4 softkeys is being viewed or set

40 Setting up auto-run Days of week setting
Models SE and DL
NOTE: To enable Auto-run, ensure the instrument is powered off and the date and time settings were programmed for the future.
10. When powered off, an Auto-Run shutdown screen will appear. (Please see section, “Auto-Run shutdown screen”.)
Days of week setting The Days of the Week (DOW) setting is a pre-programmed weekly auto-run with specified days, start time, duration. You can pre-program two auto-on settings with Sunday through Saturday parameters, one specific start time, and a specified duration for each auto-on setting. (See Figure 4-4 as an example for settings.) NOTE: In order for the Days of the Week mode to autorun, ensure the instrument is in the “off” position. The meter will then automatically switch into Auto-Run based on your setup.
Figure 4-3: Example of setting up Auto-Run (QSP-II)
A study run under the DOW mode wakes up the instrument from a powered down condition, runs the study, saves it, then powers the instrument down again. The cycle repeats for the next time and day in the setup, and for the other Auto-on 2 if that is also activated in the mode. Setting the Date of Week (DOW) 1. From the start screen, press Up/Down to highlight Setup and
press Enter .
2. Select Auto-Run by using Up/Down to highlight and press Enter to select.
3. In the Auto-Run screen, repeatedly press Enter until DOW appears. 4. Press the Down arrow to select View/Set Parameters and press Enter .
Days of Week (Auto-Run) setting To program Auto-On 1, first select the days of the week, then specify a start time for your test with a duration (to end your test).
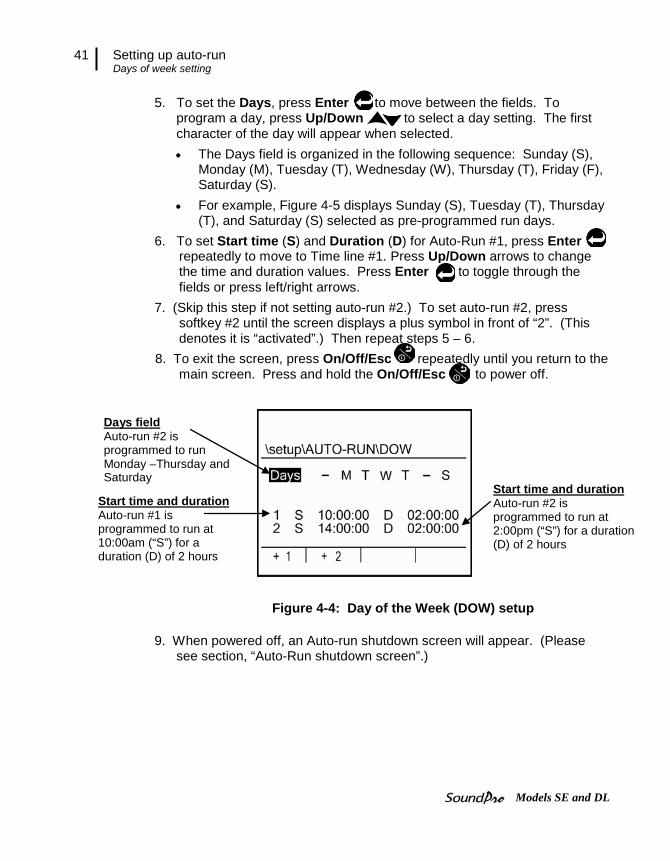
41 Setting up auto-run Days of week setting
Models SE and DL
5. To set the Days, press Enter to move between the fields. To program a day, press Up/Down to select a day setting. The first character of the day will appear when selected. • The Days field is organized in the following sequence: Sunday (S),
Monday (M), Tuesday (T), Wednesday (W), Thursday (T), Friday (F), Saturday (S).
• For example, Figure 4-5 displays Sunday (S), Tuesday (T), Thursday (T), and Saturday (S) selected as pre-programmed run days.
6. To set Start time (S) and Duration (D) for Auto-Run #1, press Enter repeatedly to move to Time line #1. Press Up/Down arrows to change the time and duration values. Press Enter to toggle through the fields or press left/right arrows.
7. (Skip this step if not setting auto-run #2.) To set auto-run #2, press softkey #2 until the screen displays a plus symbol in front of “2”. (This denotes it is “activated”.) Then repeat steps 5 – 6.
8. To exit the screen, press On/Off/Esc repeatedly until you return to the main screen. Press and hold the On/Off/Esc to power off.
Figure 4-4: Day of the Week (DOW) setup
9. When powered off, an Auto-run shutdown screen will appear. (Please see section, “Auto-Run shutdown screen”.)
Days field Auto-run #2 is programmed to run Monday –Thursday and Saturday
Start time and duration Auto-run #1 is programmed to run at 10:00am (“S”) for a duration (D) of 2 hours
Start time and duration Auto-run #2 is programmed to run at 2:00pm (“S”) for a duration (D) of 2 hours

42 Setting up auto-run Auto-run shutdown screen
Models SE and DL
Auto-run shutdown screen When either the Date mode or the Date of the Week (DOW) settings is enabled and you power down the instrument, you will be alerted by an Auto-Run Shutdown screen just before the instrument turns off. This screen, illustrated below, appears after the normal power-down countdown and remains visible for approximately ten seconds. NOTE: The Auto-Run Shutdown screen never appears when Timed
Run is enabled because that mode requires the instrument to be powered on.
Figure 4-5: Auto-Run Shutdown screen
Auto-run shutdown screen explained The Auto-Run Shutdown screen is a map of your auto-run settings. It identifies the mode, the activated setups in that mode (AR) and the order in which the setups will occur. If Auto-Run is enabled in the Date mode and more than two setups are activated, only the first two will be shown because of limited screen space. If you power on the instrument after the first auto-run has been saved, view the study, and then power off the SoundPro, it will display the next two remaining auto-run settings.
NOTE: If the start time and date for a setup is already past, the run will not be identified in this screen.
Auto-Run (AR) #1 settings • Date is displayed on first line • Start time (ST) and
runtime(RT) is displayed on second line
Auto-Run (AR) #2 settings
Displays the # of pre-programmed runs.
Mode • Either Date/ DOW

43 Setting up auto-run Timed run setting
Models SE and DL
Timed run setting In Timed Run mode, you program the instrument’s duration (or timed run) and then manually start your study, which can be applied as many times as you wish. The auto-run will end when the duration expires. Viewing or changing the Timed Run setup 1. From the start screen, press Up/Down to highlight Setup and
press Enter .
2. Select Auto-Run by using Up/Down to highlight and press Enter to select.
3. In the Auto-Run screen, repeatedly press Enter until Timed-Run appears.
4. To set the duration, press Enter to toggle between the Hours, Minutes, and Seconds field. To change the time values, press Up/Down repeatedly until the specified value is selected.
5. Press On/Off/Esc repeatedly to return to the start screen. When you are ready to run your study, press Run/Pause .
Figure 4-6: Timed Run setup screen
Duration Formatted as Hours:Minutes:Seconds
Timed-Run Auto-run setting with timed run selected

44 Setting up auto-run Level-triggered auto-on setting
Models SE and DL
Level-triggered auto-on setting The level-triggered screen contains meter 1 parameters which include a Filter mode, Frequency level, “Level On” and “Level Off” modes, and a specification for either run/stop or run/pause modes.
Viewing or changing level-triggered mode
1. From the start screen, press Up/Down to highlight Setup and press Enter .
2. Select Auto-Run by using Up/Down to highlight and press Enter to select.
3. In the Auto-Run screen, repeatedly press Enter until Level-Triggered appears.
4. Press the Down arrow to select View/Set Parameters and press Enter . The Level-Triggered Auto-Run screen will appear.
• See Table 4-1 below for explanation of settings.
Figure 4-7: Level-Triggered screen
Level- Triggered
Explanation of Settings
A. Mode The mode, or Filtered Mode, can be set to Level On/Off and Windowed settings. • In Level On/Off mode, the unit starts a run when the source level
exceeds the specified criteria and stops/pauses when level falls below the off criteria. The on criteria is met and either pause or stop a run when the off criteria is met.
• In Windowed mode, the unit starts a run when the selected criteria falls outside the defined window. This is intended primarily for curves but can also be used with broadband or individual filter measurements.
\setup\LVL-TRG-RUN MODE LEVEL ON/OFF ACTION RUN/PSE TRIGGER RUN PAUSE SOURCE METER 1 METER 2 LEVEL 90.0 OFF
Mode: to enable a filter mode, select Level On/Off or Windowed
Action: Run/Pause or Run/Stop
Source/Level: Select one of the 5 features and then set an appropriate Level.
A B
C
D

45 Setting up auto-run Level-triggered auto-on setting
Models SE and DL
Level- Triggered
Explanation of Settings
B. Action After selecting specific filter mode settings, the instrument is set to trigger based on Run/Pause mode or Run/Stop mode.
C. Source The source can be set to Meter 1, Meter 2, filters, curve, external trigger, timed run trigger mode, and a delay. which are explained below:
• Broadband: When selecting Meter 1 or Meter 2 for the triggering source, you then specify a specific value in the “level” field such as 85dB.
• Filters: Octave band filters are selectable as a triggering source such as: 12.5Hz, 16Hz, 20Hz through 20KHz. Note: this is only available if they have purchased the 1/1 or 1/3 features. To select a filter, select a an octave band value (.i.e. 10KHz) in the source field. Then, select a Level value (i.e., 90dB).
• Delay: When selecting Delay with a specified time value, it will trigger the auto-run after the timed-delay surpasses. (This is similar to setting a delay on a camera.) To select “Delay”, select the Source as “Delay” and for Level select a specific time value (the range is from 00:01 seconds to 59:00 minutes).
• Curve: If the curves feature has been purchased, you have the option of selecting one of the 4 captured curves to trigger a run. To select a captured curve, set the Source as “Curve” and then change the “Level” field to one of the following: CAP-1, CAP-2, CAP-3, or CAP-4.
• EXT: External Trigger feature is triggered by the digital input on the curve indicator. To select external trigger, select “EXT” as the source field, and select “LO” for the level field.
• TIMED: When selected as the RUN trigger, it will cause a delay of specified direction between the timed RUN button is pressed and the time the RUN actually starts. When selected as the PAUSE/STOP trigger, it sets a run length. To select under the Source and Pause fields, chose Timed. Next, select a timed value (or duration) in the Level field. (This is formatted as hours:minutes:seconds.)
D. Level The level field corresponds with your selection from the Source field and is explained under “C. Source”.
Table 4-1: Level Triggered Auto-On settings explained
5. To select the Mode, press Enter repeatedly until you are viewing either Level On/Off or Windowed.
6. To move to the next field, press the Down arrow. 7. To set the Action, press Enter repeatedly until you are viewing
either Run/Pause or Run/Stop. 8. To move to the next field press the Down arrow.
9. To change the Source, press the right arrow. To select one of the five Sources (as explained above in Table 4-1), press Enter repeatedly until you are viewing the appropriate feature.

46 Locking setup or run mode Setting secure run or secure setup (locking)
Models SE and DL
10. To activate Triggered Run on the Meter 2, press the right arrow and select one of the five sources by pressing Enter repeatedly until you are viewing the appropriate feature. (If you are only setting Meter 1, please skip this step.)
11. To move to the next field press the Down arrow.
12. To select a Level, press the Right arrow. Press Enter repeatedly until you are viewing the appropriate setting.
13. Press On/Off/Esc repeatedly to return to the start screen. When you are ready to run your study, press Run/Pause .
Locking setup or run mode The locking or security feature is designed to lock the SoundPro during a run to ensure the study will not be stopped unless the lock feature is disabled. Likewise, this feature includes a locked (or secure) setup mode which will stop a user from editing a programmed setup. Once setup and enabled, the secure run or secure setup are unlocked, by pressing the Lock softkey and entering in the code. NOTE: Security settings survive a shutdown.
Setting secure run or secure setup (locking) Run Security and Setup Security are both enabled and disabled in the Lock screen. For Secure Run, you can be in pause or stop mode when locking. For Secure Setup, you must be in stop mode to set and enable this feature.
About Secure Run When you enable Run Mode Security and start a run, the Secure Run Mode screen appears (Figure 4-10). This will prevent users from viewing the measurements, changing parameters, and/or stopping the run. To stop the secured run, you will have to press the Lock softkey and enter in the code. Then, you would be able to stop the run by pressing the Stop key. NOTE: With Run Mode security enabled, the Secure Run Mode screen
always appears regardless whether the study was started manually, by Auto-Run or by Triggered studies.
About Secure Setup Setup Mode security blocks access to setup screens while in stop mode. (NOTE: When in run mode, the SoundPro automatically blocks the user from changing settings to ensure the settings remain the same throughout the session.) Once enabled and the user selects setup, the Secure Setup mode prompt will appear and it prevents someone from changing settings until unlocked.

47 Locking setup or run mode Setting secure run or secure setup (locking)
Models SE and DL
Setting secure run or secure setup (locking) 1. From the start screen, press the Lock softkey.
Figure 4-8: Secure/Lock option
2. In the Lock screen, there are two selectable fields: • Secure Run Mode with a status line • Secure Setup Mode with a status line. • Each Status Line is used to specify either a “disabled” state or an
enabled state when a code is entered to assign an unlock code.
Figure 4-9: Secure/Lock screen
Setting Lock feature: • Enable or Disable “Secure Run Mode” • Enable or Disable “Secure Setup Mode”
Lock: Press 4th softkey to select “Lock” screen

48 Locking setup or run mode Setting secure run or secure setup (locking)
Models SE and DL
3. (Skip this step if securing setup and see step 4.) To set Secure Run Mode, press Enter and “0000” will appear.
NOTE: if you want to set the code as “0000,” press Enter
repeatedly until “enabled” appears. This will be the unlock code.
Figure 4-10: Adding code for secure/lock screen
• To select a numeric code, press Up/Down arrows to select a number, press Enter to toggle between the fields.
• Press Enter to Enable.
• Press On/Off/Esc key to return to the Start screen. When you are ready to run a session, press the Run/Pause key and the Secure Run Mode prompt will appear. (See “Disabling secure run or secure setup” below for details on stopping the run.)
Figure 4-11: Secure/lock run prompt
• Selected value is shaded • Enter code by pressing up/down
arrows to change value • Press enter to move to each field
To unlock/unsecure Press lock softkey and then enter in code.
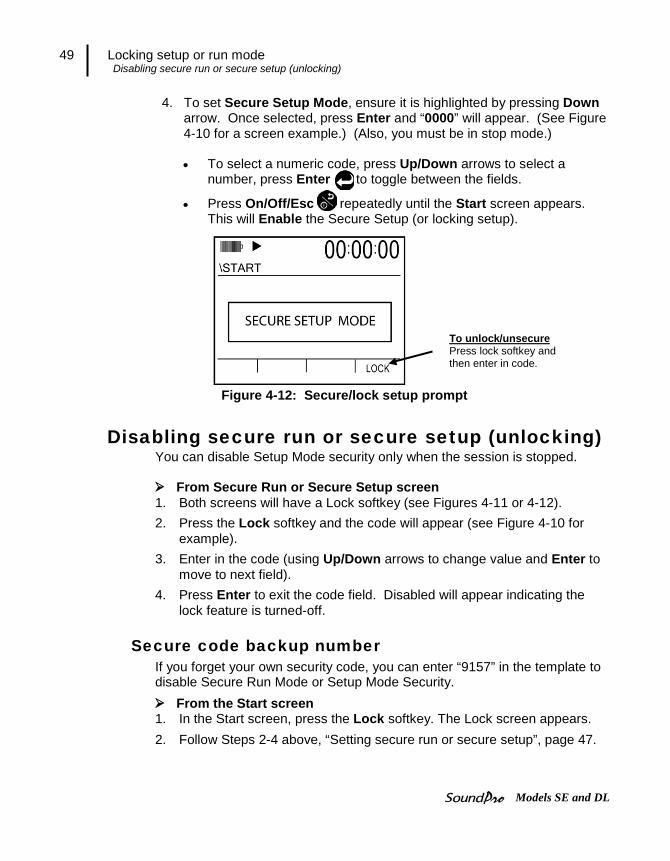
49 Locking setup or run mode Disabling secure run or secure setup (unlocking)
Models SE and DL
4. To set Secure Setup Mode, ensure it is highlighted by pressing Down arrow. Once selected, press Enter and “0000” will appear. (See Figure 4-10 for a screen example.) (Also, you must be in stop mode.)
• To select a numeric code, press Up/Down arrows to select a
number, press Enter to toggle between the fields.
• Press On/Off/Esc repeatedly until the Start screen appears. This will Enable the Secure Setup (or locking setup).
Figure 4-12: Secure/lock setup prompt
Disabling secure run or secure setup (unlocking) You can disable Setup Mode security only when the session is stopped. From Secure Run or Secure Setup screen 1. Both screens will have a Lock softkey (see Figures 4-11 or 4-12). 2. Press the Lock softkey and the code will appear (see Figure 4-10 for
example). 3. Enter in the code (using Up/Down arrows to change value and Enter to
move to next field). 4. Press Enter to exit the code field. Disabled will appear indicating the
lock feature is turned-off.
Secure code backup number If you forget your own security code, you can enter “9157” in the template to disable Secure Run Mode or Setup Mode Security.
From the Start screen 1. In the Start screen, press the Lock softkey. The Lock screen appears. 2. Follow Steps 2-4 above, “Setting secure run or secure setup”, page 47.
To unlock/unsecure Press lock softkey and then enter in code.

50 Digital outputs/Triggering Tracking runs
Models SE and DL
Digital outputs/Triggering All digital output signals (also referred to as “Triggering”) appear on pins of the Auxiliary Port (“Auxiliary port” on page 7). Manage these digital outputs in the Ext-Trigger screen.
Tracking runs The instrument can be configured to use a digital output to signal the start or end of a run.
Enabling or Disabling run/pause digital outputs/triggers 1. From the start screen, press Up/Down to highlight Setup and
press Enter .
2. Select Digital-Out by using Up/Down to highlight and press Enter to select.
3. Press to select Output 1. 4. Press to enable (Run/Pse) or disable (Off) run tracking. 5. If you enabled and want to reverse the trigger logic, continue below.
Otherwise, skip to step 9. 6. Press to select Logic 123, then press to enter the first data
field. The second data field is for Output 1.
7. Press to select the second data field, then press to toggle the logic state. The displayed logic state is for a running study.
8. Press to exit the Logic 123 data field. 9. If finished, press to exit the screen.
Figure 4-13: Digital-Out screen
OUTPUT 1 Select Run/Pause to enable

51 Communications Digital outputs and SPL
Models SE and DL
Digital outputs and SPL The instrument can also be configured to use a digital output to signal if the current SPL measurements exceeds a specified level.
Managing SPL digital outputs (See Figure 4-13 above) 1. Open the Digital-Out screen, by selecting Setup from the start screen.
(Press arrows to select Setup and press . 2. Press to select Output 2 or Output 3, then press to move the
cursor to the data field at the right. You have two options for each output. • OFF - Disables SPL tracking for that output.
• dB level - Enables and shows the current setpoint for that output.
3. Press to toggle between these options. If you select “Off,” press to exit the data field, then skip to the last step of this procedure. If you
enable the trigger, continue below. 4. Press if you wish, to change the setpoint. 5. Press to exit the data field. 6. If satisfied with the trigger logic, skip to the last step of this procedure. To
toggle the logic setting, continue below. 7. Press to select Logic 123, then press to enter the first data
field. The third and fourth data fields are for Output 1 and Output 2, respectively.
8. Press to select the appropriate data field. 9. Press to toggle the logic state. The displayed logic state is for SPL
that equals or exceeds the setpoint. 10. Press to exit the Logic 123 data fields. 11. If finished working in the Ext-Trigger screen, press to exit the screen.
Communications The SoundPro has both USB and RS-232 communication channels. The majority of users should only require USB communications, which is vastly faster than the RS-232 channel which is intended for low speed modems GPS applications, and/or log-to-port applications but may be used to communicate to a PC as well. The optional 053-729 Serial Cable is required for RS-232 communications. The SoundPro has two USB communications modes “QSP/Serial and “Mass Storage.

52 Communications QSP/Serial
Models SE and DL
QSP/Serial (Figure 4-14). For QSP-II communications, USB should be set to “QSP/Serial”. The RS-232 channel should be turned off for low power consumption.
Figure 4-14: QSP/Serial
Mass Storage When the USB channel is set for Mass Storage mode the user will have direct access to the instruments SD card through programs such as “Windows file manager”. Much the same way a small pocket USB flash drive operates. When obtaining data from the SoundPro via Mass Storage, it is important to remember that the data obtained is in Native SoundPro SES format (It cannot be read with Excel, Word, etc.) A SoundPro SES to XML conversion utility is available.
NOTE: When using Mass storage, the user must use the Windows “Safely Remove Hardware” feature to un-mount the SoundPro from the PC in the same manner a user must remove a flash drive. This “Windows” feature is usually found in the lower right-hand side of the windows systems tray.
Figure 4-15: Mass Storage

53 Communications Viewing real-time measurements remotely
Models SE and DL
USB communications 1. If a session is running, stop it. 2. In the Start screen, press to select Setup, then press . The Setup
screen appears. 3. In the Setup screen, press the arrow keys to select Comm Set, then press
and the Comm-Set screen appears. 4. USB should be Highlighted. Press to toggle between “QSP/Serial” and
“Mass Storage”. 5. If the RS-232 channel is not set to “Off/Lo-Pwr”, press the left arrow to
highlight RS-232 and repeatedly press until Off/Lo-Pwr is displayed. 6. Press to exit the screen. 7. Connect the small end of the USB cable to the USB port (“Hardware
interfaces” on page 6). 8. Connect the large end of the USB cable to a standard-sized USB connector
on the computer.
Viewing real-time measurements remotely On the SoundPro, the “Log to Port” feature, provides the functionality to stream logged data out the serial port at the log rate to an external device (such as a pc). With this feature, you are able to view logged measurements for broadband as well as filter band average measurements (depending on the model you ordered). It will not report Lmax, Lmin, or Lpk for each filter band.
Turning on log to port 1. In the Comm Set screen (selectable via the Set-up screen), select RS-232
field (by pressing the down arrow). 2. Press repeatedly to turn on LOG PRN.
Figure 4-16: Log to Port
LOG to Port Press Enter key repeatedly to activate

54 Communications GPS
Models SE and DL
GPS The SoundPro has the capability of embedding GPS information into study headers. To interface a GPS, you need a GPS receiver with RS-232 communications that conform to NMEA 0183 version 2 and the optional 053-729 Serial Cable. In many cases, a Male-Male DB-9 null modem connector will be required as well. The SoundPro will keep a GPS fix for up to 1 minute before declaring it invalid at which time “No Fix” will appear if you are in the “COMM-SET” menu. In other screens where a RUN may be initiated, “GPS +” or “GPS-” is momentarily flashed in the Right Soft key indicating either a valid fix “GPS +” or an invalid or timed out fix “GPS-”.
NOTE: GPS time can be viewed in the Comm Set screen but is not used in the instrument or added to session files. Time and date stamping in session files uses information that is manually entered (“Time and date” on page 25) or downloaded from QSP II (“Information screen” on page 8).
GPS display You can view GPS data in the Comm-Set screen. The position coordinates are stored in each study, when GPS is enabled and can be viewed with DMS (see page 9 for details.)
Figure 4-17: Comm-Set screen for GPS data
GPS explained The top two screen selections, Interface and Baud Rate, specify the GPS setup, which is explained under “Enabling GPS communications,” below. The rest of the information in the screen appears when GPS communications is enabled and data is being received from a GPS satellite.
GPS selected
“NO Fix” indicates GPS is not connected or not reading from GPS satellite

55 Communications GPS
Models SE and DL
• Status line - This data field at the right on this line tells you whether GPS is enabled or not. You may see “No Fix” below this line, which tells you that, although enabled, the instrument is not receiving the satellite signal.
• Position line - When the satellite signal is being received, there will be two data fields on this line that give the instrument’s latitude (N or S) and longitude (E or W) position in degrees and minutes.
• Other line - When the satellite signal is being received, there will be two data fields on this line that give the instrument’s altitude and time, in that order. The altitude is given in meters above mean sea level. The time is given for Greenwich, England (GMT) and differs in hours from your time by the number of time zones between your location and Greenwich.
Enabling GPS communications 1. If a session is running, stop it. 2. Connect the RS-232 cable to the GPS receiver and to the auxiliary
port of the SoundPro SE/DL instrument (“Auxiliary port” on page 7). 3. Referring to the user manual for the GPS receiver, prepare the device
to receive satellite signals. 4. In the SoundPro SE/DL Setup screen, press the arrow keys to
select Comm-Set, then press , and the Comm-Set screen appears.
Figure 4-18: Viewing GPS coordinates in COMM-Set screen
5. Press the down arrow to highlight “RS-232”. 6. Repeatedly press until “GPS” is displayed. The Baud rate should be kept
at 4800 unless otherwise specified by your GPS manufacturer. NOTES: If you are not using RS-232 communications in any way, you
should keep the RS-232 channel set to the Off/Lo-Pwr setting.
Viewing GPS coordinates

56 Communications GPS
Models SE and DL
This page left blank intentionally
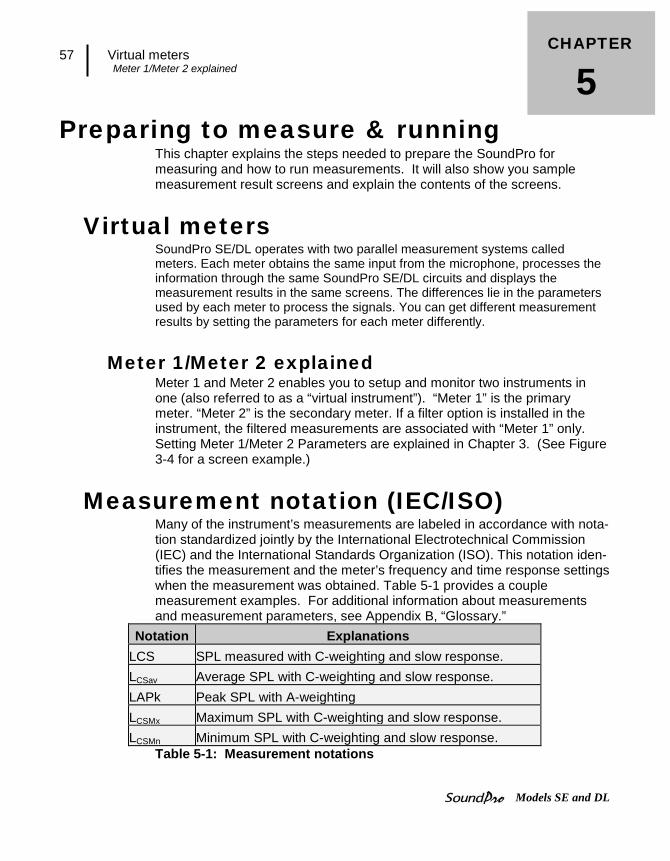
57 Virtual meters Meter 1/Meter 2 explained
Models SE and DL
Preparing to measure & running This chapter explains the steps needed to prepare the SoundPro for measuring and how to run measurements. It will also show you sample measurement result screens and explain the contents of the screens.
Virtual meters SoundPro SE/DL operates with two parallel measurement systems called meters. Each meter obtains the same input from the microphone, processes the information through the same SoundPro SE/DL circuits and displays the measurement results in the same screens. The differences lie in the parameters used by each meter to process the signals. You can get different measurement results by setting the parameters for each meter differently.
Meter 1/Meter 2 explained Meter 1 and Meter 2 enables you to setup and monitor two instruments in one (also referred to as a “virtual instrument”). “Meter 1” is the primary meter. “Meter 2” is the secondary meter. If a filter option is installed in the instrument, the filtered measurements are associated with “Meter 1” only. Setting Meter 1/Meter 2 Parameters are explained in Chapter 3. (See Figure 3-4 for a screen example.)
Measurement notation (IEC/ISO) Many of the instrument’s measurements are labeled in accordance with nota-tion standardized jointly by the International Electrotechnical Commission (IEC) and the International Standards Organization (ISO). This notation iden-tifies the measurement and the meter’s frequency and time response settings when the measurement was obtained. Table 5-1 provides a couple measurement examples. For additional information about measurements and measurement parameters, see Appendix B, “Glossary.”
Notation Explanations LCS SPL measured with C-weighting and slow response. LCSav Average SPL with C-weighting and slow response. LAPk Peak SPL with A-weighting LCSMx Maximum SPL with C-weighting and slow response. LCSMn Minimum SPL with C-weighting and slow response.
Table 5-1: Measurement notations
CHAPTER
5

58 Overview of running a session/study Meter 1/Meter 2 explained
Models SE and DL
Overview of running a session/study The list below is a brief overview of the steps for running a study.
Quick Help List 1. Turn the SoundPro on and check your battery power. (See Chapter 1). 2. Format the card or delete session files from the SoundPro.
o Formatting the card will clear out all of data before your study begins. Choosing to select specific session files and delete will also clean up the instrument’s sessions. (See Chapter 7).
3. Adjust your settings to fit the specifications of your sound study. (See
Chapter 4 and Chapter 6) 4. Set the measurement range (Chapter 5) 5. Calibrate the SoundPro (Chapter 5) 6. Position the SoundPro in the field and connect appropriate external
devices if applicable. 7. Press the Run/Pause key to start the session. (Chapter 5) 8. To Pause the session (if needed) press the Run/Pause key. (Chapter 5) 9. When you are ready to end your session/study, press the Stop key.
NOTE: You must be in pause mode to stop a session/study. (Chapter 5) 10. Review your measurement results on the SoundPro display (Chapter 5).
Or view results in QSP-II, see Communicating in Chapter 8.

59 Preparing to measure Sessions and Studies
Models SE and DL
Preparing to measure
Sessions and Studies Before you begin running a session/study, there are a couple items to consider:
• Understanding sessions and studies • Adjusting the measurement range before running a study • Calibrating the instrument
The following components explain how the data is stored on the instrument. Storing Data Explanations
Session A session is comprised of one or more studies and uses data derived or accumulated from those studies to arrive at session results. The measurements in a session are the same ones made in each study in the session. For example, the maximum SPL determined for each study in a session is compared to the maximums for each other study in the session to determine the maximum SPL for the entire session. Likewise, an average or an accumulation for a study is continued using data from subsequent studies in the session to arrive at the corresponding average or accumulation for the entire session.
Studies
Studies are periods in a session during which measurements are acquired, processed and saved by the instrument. The duration of each study period is called the study’s run time.
Session and Study Scenario
You will be running a sound test in a machine shop. Your main objective is to determine the noise in three different work areas of the plant which include two different machinist areas and a welding area. You set the SoundPro to run and pause three times at one-hour intervals. When the tests are completed, you upload the data into QSP-II. The tests will store as one “Session” under “Downloaded” node and each one-hour test is denoted as a “Study”.
Table 5-2: Sessions and studies explained
CAUTION: The memory card should not be inserted or removed during a study—
you can lose data.

60 Preparing to measure Measurement range
Models SE and DL
Measurement range You select the decibel range before running the first study in the session. Setting the measurement range helps keep the desired measurements within the linear range of operation. If you don’t make an optimal range selection, low levels of sound can be hidden in the instrument noise (below the noise floor of the instrument), and high levels of sound can be distorted (the instrument is “overloaded”). Measurements at these extremes are invalid. For information about these and other terms that may be unfamiliar to you, see the glossary in this manual (Appendix B, “Glossary”).
Measurement range selection 1. From Start screen, select either View Current Study or View Session.
The bar chart screen appears. To select, press arrows and then press .
- NOTE: The bar chart screen may appear with a different measurement displayed and a different range. This is dependent on the settings you may have selected. (For more information, please see “Measurement Type”, on page 26)
2. (Depending on if you selected basic SLM or applied 1/1 or 1/3 octave band filters) a bar chart screen or a filtered bar chart screen will appear, press . This changes the range, and the change is confirmed in the screen in two ways. • Ranges - A different range may appear each time you press an arrow key.
The instrument provides eight selectable ranges, each with different minimum and maximum values. (For more information about ranges, please see “Ranges” in the Specifications in Appendix A, on page 123).
• SPL value – Depending on if you have the instrument set to measure basic sound level measurements (see “A” below) or filtered sound level measurements (see “B” below), the following two types of screens may appear. The level increases or decreases in relation to the range selection
Figure 5-1: Bar chart screen (A) and Filtered Bar Chart (B)
Range
Range

61 Calibrate Calibration screen
Models SE and DL
Calibrate 3M recommends calibrating your Verifier before you run a STI-PA measurement and after to ensure highly accurate measurement results. The microphone should be calibrated before use for a number of reasons. First, the microphone is sensitive to humidity and pressure changes. Calibrating before taking measurements assures that your level measurements are accurate for the current environment. Performing a calibration verification (post-cal) allows you to verify that conditions have not significantly affected your readings. Calibrating also serves the dual purpose of checking the microphone for significant damage, such as a torn or contaminated diaphragm. You can calibrate the instrument in the field with reference to the output of a calibrated sound source. 3M offers a line of acoustic calibrators that are available (such as the QC10/20).
Calibration screen The Calibration screen contains a calibration option, called Calibrate, and a Calibration History. The history shows Pre-Calibration (Pre-Cal) and Post-Calibration (Post-Cal) results for previous calibrations, as applicable. For each calibration type, the resulting SPL level is shown along with the time and the date of the calibration.
Pre-Calibration The main reason to calibrate is to adjust the current microphone reading to match a reference input, usually provided by a calibrator. A Pre-Calibration is conducted when the session is stopped. When you calibrate during a stopped session, the new calibration results replace the previous Pre-Calibration results and the Post-Calibration results are removed. You will always see the last Pre- Calibration results.
Post-Calibration A post-cal is really a calibration verification; that is, it does not change the instrument’s calibration. It compares the microphone's current level with the value read from the last calibration (assuming that the same source is used).
A Post-Calibration is a calibration done during a session pause. When you

62 Calibrate Performing a calibration
Models SE and DL
calibrate during a pause, the new calibration results replace the previous Post-Calibration results without affecting the Pre-Calibration results. You will not see Post-Calibration results if a pre- calibration was performed but not followed by a Post-Calibration.
Performing a calibration Before beginning your calibration, ensure the calibrator has sufficient battery power to perform the calibration. Also, you will want to insert the “cal adapter” into the mouth of the calibrator. If the SoundPro has a windscreen, please remove. Calibrating 1. Ensure the SoundPro is turned On and is either stopped or paused.
2. Attach the calibrator and cal adapter to the SoundPro. Set the calibrator to 1 KHz and 114 dB (if it is a selectable).
Figure 5-2: Attaching calibrator to SoundPro
3. From the Start screen, press the Cal softkey and the Cal screen will open.
4. Select Calibrate by pressing Arrows (if not selected) and press Enter to open the Pre-Cal screen.
5. Switch On the Calibrator.
Cal Adapter Insert into cavity of QC10/QC20
QC10/QC20 Select 1kHz and 114 dB
Microphone Place calibrator over microphone

63 Calibrate Performing a calibration
Models SE and DL
Figure 5-3: Setting pre-cal screen
6. Allow the measurement to stabilize and then press Arrows to set 114.0 dB level.
7. Press Enter to store the new calibration. The Calibration History screen will appear with the new calibration values in the display.
Figure 5-4: Calibration history screen
8. Press On/Off/Esc key to exit the Cal screen. 9. For a Post Calibration, ensure the SoundPro is in “Pause” mode. (Essentially,
run a measurement and press the run/pause key.) The Pause indicator will appear at the top of the display.) Then repeat the Calibration steps above and press Enter to store the Post Calibration information. A sample screen is displayed below with post calibration history.
Measurement value
Measurement value displayed graphically
Pre-Cal Displays pre-calibration information
Press up/down softkey to increase/decrease cal value

64 Running a session/study Performing a calibration
Models SE and DL
Figure 5-5: Post-Calibrate history screen
Running a session/study You run a “session”, commonly called opening a session, by running (or starting) the first measurement. To run a “study”, you would press pause and then proceed in the run mode. This would save the measurement as a “study”. Studies will be saved as you continue to run and pause your measurements. Once stopped, this will save as one session.
Running a session/study 1. From the Start screen, select either View Session or select View
Current Study. 2. To select, press arrows and then press . 3. Press to begin measuring. A session is currently open for the
instrument when either the Run icon or the Pause icon appears in the Status Area at the top of the screen.
Figure 5-6: Bar Chart screen in run mode
RunTime
Run icon
Battery icon
Lookup softkey
Post-Cal Displays post-calibration information
Pause indicator

65 Measurement navigation Using softkeys in measurement screens
Models SE and DL
NOTE: The Lookup softkey is used to change the measurement options. There are five selections which include: SPL, Leq, Lpk, Lmax, Lmin.(See “Changing displayed measurement” for more information, on page 66.)
Measurement navigation You can navigate through the measurement screens by repeatedly pressing . The first screen you encounter when viewing a measurement screen is a bar chart or filtered bar chart screen. The subsequent screens that appear depend upon the measurement setup, the meter selection and the type of analysis. There are four possible screen types:
Measurement screens
Explanations
Bar Chart or Filtered Bar Chart
Depending on if you selected SLM, 1/1 octave, or 1/3 octave, one of these screens will appear.
Tabular screen Available for Meter 1 only. If your instrument contains a filter option and is set to an octave or third-octave analysis type, the screen that appears next in order after the Bar Chart is a Tabular screen. There may be one or more additional Tabular screens depending upon the analysis type that’s in effect.
Dosimetry screen
Available for both meters, all viewing areas and all instrument types.
Community screen
Available only for Meter 1 and all instrument types, but not for studies. This screen will not appear when viewing the current study.
Time Log screen
Available for both meters, but only for broadband studies.
Table 5-3: Measurement screens explained NOTE: If you’re not running a study when you enter a viewing area, only the SPL
measurement is being measured and is available for viewing. The values for any other measurement in the Selection Panel discussed under, “Changing displayed measurement”, are replaced by dashed lines.
Using softkeys in measurement screens The softkeys function in relation to the contents of the Softkey Region of the display. To use the

66 Measurement navigation Using softkeys in measurement screens
Models SE and DL
softkeys, the menus are visible in Softkey Region (i.e., “Cal” for Calibration menu). If necessary, press the Alternate Functions key ( ) to toggle the contents of the Softkey Region.
Changing displayed measurement You can change the displayed measurement in any viewing area at any time. There are five measurement options available: SPL (L_), average SPL (L_av or L_eq depending upon the exchange rate setting for the selected meter), peak SPL (L_Pk), maximum SPL (L_Mx) and minimum SPL (L_Mn). The labels comply with IEC/ISO notation (“IEC/ISO notation” on page 57), where the underline character represents the time response and frequency weighting settings for the selected meter.
Changing displayed measurement 1. If necessary, press (Alternate Functions key) to show the softkey
labels. 2. Press the softkey to display the Selection Panel. The available
measurements are arranged in a column, with the selected measurement marked.
Figure 5-7: Selecting measurements with Lookup softkey
3. Press to make a different selection. 4. With your selection marked, press or press to make the
change effective. NOTE: When viewing during broadband analysis, you can use the left/ right arrow
keys to change measurements.
Analysis type, time response and weighting If your instrument has a filtering option, you can change the analysis type. To change the analysis type, time response, and/or weighting, you must be in the View Current Studies screen or in the View Session screen. Also, the current session must be stopped (or “closed”). For more details on changing these
Lookup softkey
Selection Panel This appears when lookup softkey is pressed. • The diamond symbol u indicates
which measurement is selected. (L_eq). Press Enter key to confirm new selection.
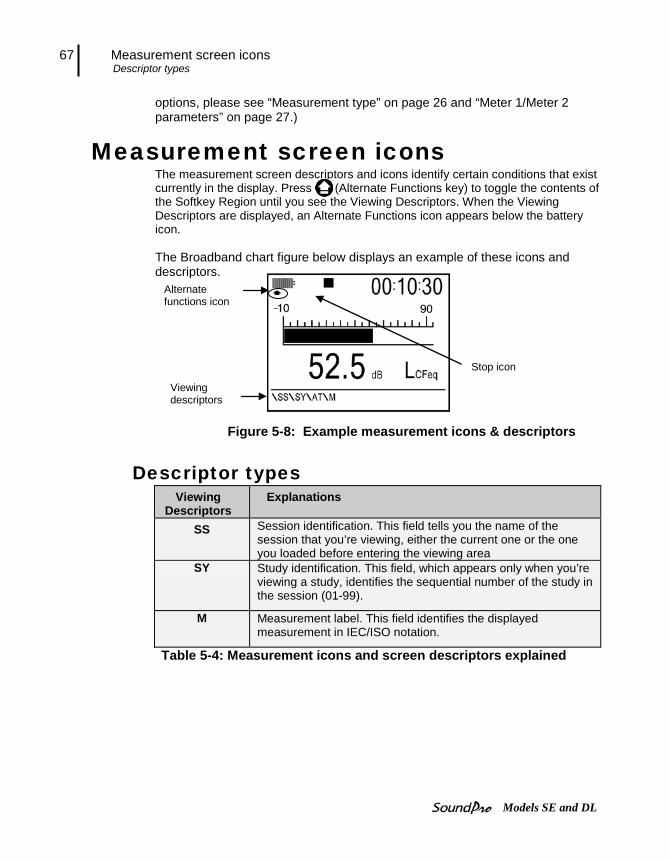
67 Measurement screen icons Descriptor types
Models SE and DL
options, please see “Measurement type” on page 26 and “Meter 1/Meter 2 parameters” on page 27.)
Measurement screen icons The measurement screen descriptors and icons identify certain conditions that exist currently in the display. Press (Alternate Functions key) to toggle the contents of the Softkey Region until you see the Viewing Descriptors. When the Viewing Descriptors are displayed, an Alternate Functions icon appears below the battery icon. The Broadband chart figure below displays an example of these icons and descriptors.
Figure 5-8: Example measurement icons & descriptors
Descriptor types Viewing
Descriptors Explanations
SS Session identification. This field tells you the name of the session that you’re viewing, either the current one or the one you loaded before entering the viewing area
SY
Study identification. This field, which appears only when you’re viewing a study, identifies the sequential number of the study in the session (01-99).
M Measurement label. This field identifies the displayed measurement in IEC/ISO notation.
Table 5-4: Measurement icons and screen descriptors explained
Alternate functions icon
Viewing descriptors
Stop icon

68 Measurement screens Bar Chart and Filtered Bar Chart
Models SE and DL
Measurement screens
Bar Chart and Filtered Bar Chart The first screen you’ll see in a viewing area contains a bar chart for broadband or filtered measurements. For the bar chart screen, the amplitude of the displayed measurement is shown both graphically by the length of the bar and numerically below the bar. The bar appears (and usually fluctuates) if the measured value is above the minimum value for the selected measurement range. For the filtered bar chart screen, the dominant characteristic of this screen is the multi-element bar chart. The chart shows measurements in each filter band and broadband values for both meters. That means that for octave analysis the screen contains 13 bars (11 for filters and 2 for broadband), and for third-octave analysis the screen contains 35 bars (33 for filters and 2 for broadband). A bars appears (and usually fluctuate) if the measured value for the bar is above the minimum value for the selected measurement range.
Figure 5-9: Bar Chart screen and Filtered Bar Chart screen
Bar Chart View Shows SPL average value of Meter 1. • Will display only if SLM is selected as
the measurement mode.
Broadband amplitude
Amplitude in the band
Selected band
Broadband Bar Chart view Shows SPL average amplitude (or value) of Meter 1 • Will display only if octave
band is enabled
Softkeys (menus options)
Softkeys (menus options)

69 Measurement screens Community Noise screen
Models SE and DL
Making changes to the Bar Chart or Filtered Bar Chart screen 1. The Range - The scale, shown above the chart, is fixed and cannot be changed
in the run or pause mode (or if you are viewing past studies). If the session is in stop mode (or closed), press to change the range.
2. Softkeys- If the session is in run, pause or stop mode you can change the following: Measurement displayed (via the lookup softkey) or Meter 1/Meter 2 screen. If the session is stopped (or closed), then you can also change the response time and weighting.
Community Noise screen This screen shows the results of measurements commonly associated with community noise studies. Results are only available in this screen for those measurements that are activated for the current session on meter 1. The screen components are explained in detail in the “Measurement setup for Community Noise” on pages 28-29.
Figure 5-10: Community Noise screen
NOTE: Community noise measures are determined only for sessions, not for studies, so you will not see this screen when viewing current studies.
Community Noise View Only appears on Meter 1 when you are not viewing the current study and when the community noise parameters are activated.
Exceedance levels • L1 = 99% dB • L10 = 85.1% dB • L50 = 82.9% dB
Taxtmaximal • Value is 90 dB at 3 sec.
intervals
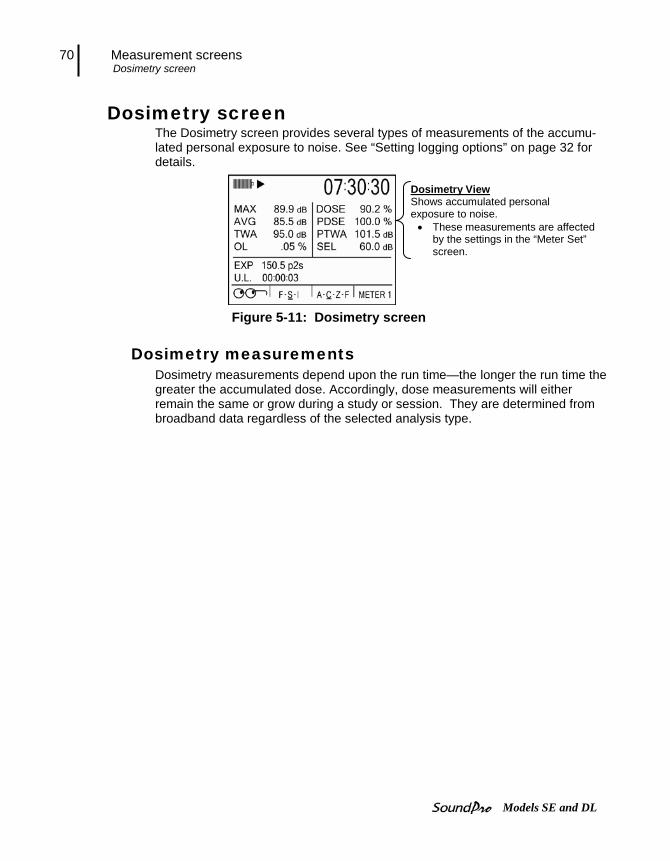
70 Measurement screens Dosimetry screen
Models SE and DL
Dosimetry screen The Dosimetry screen provides several types of measurements of the accumu-lated personal exposure to noise. See “Setting logging options” on page 32 for details.
Figure 5-11: Dosimetry screen
Dosimetry measurements Dosimetry measurements depend upon the run time—the longer the run time the greater the accumulated dose. Accordingly, dose measurements will either remain the same or grow during a study or session. They are determined from broadband data regardless of the selected analysis type.
Dosimetry View Shows accumulated personal exposure to noise.
• These measurements are affected by the settings in the “Meter Set” screen.
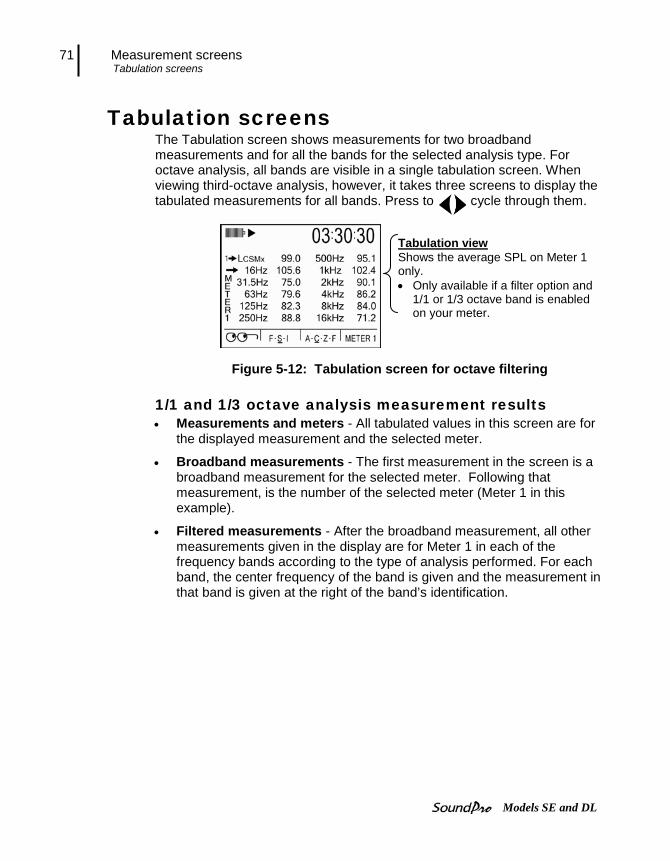
71 Measurement screens Tabulation screens
Models SE and DL
Tabulation screens The Tabulation screen shows measurements for two broadband measurements and for all the bands for the selected analysis type. For octave analysis, all bands are visible in a single tabulation screen. When viewing third-octave analysis, however, it takes three screens to display the tabulated measurements for all bands. Press to cycle through them.
Figure 5-12: Tabulation screen for octave filtering
1/1 and 1/3 octave analysis measurement results • Measurements and meters - All tabulated values in this screen are for
the displayed measurement and the selected meter.
• Broadband measurements - The first measurement in the screen is a broadband measurement for the selected meter. Following that measurement, is the number of the selected meter (Meter 1 in this example).
• Filtered measurements - After the broadband measurement, all other measurements given in the display are for Meter 1 in each of the frequency bands according to the type of analysis performed. For each band, the center frequency of the band is given and the measurement in that band is given at the right of the band’s identification.
Tabulation view Shows the average SPL on Meter 1 only. • Only available if a filter option and
1/1 or 1/3 octave band is enabled on your meter.

72 Time History/Back-erase screen Tabulation screens
Models SE and DL
Time History/Back-erase screen When conducting a broadband study, you can view as much as the last 20 seconds of Max SPL in this screen. The current Max appears at the right border of the Time Log chart (time=0) and advances, in one-second increments, toward the left border of the chart. The data leaving the chart at the left border is always a measurement that occurred 20 seconds ago.
Figure 5-13: Back-erasing
Back-erasing You can remove undesirable data at the end of a study with a process called back-erasing. Back-erasing is available only under these conditions. • Analysis type - Back-erasing is unavailable for filtered studies.
• Viewing areas - You must be in either the View Current Studies or View Session viewing area. Back-erasing is not available in View Past Studies.
• Restricted to the pause -You can back-erase only during the pause that follows a study. Back-erasing is not available for past studies in the session.
• Not all studies - Because back-erasing requires a manual intervention, it is unavailable for triggered or Auto-Run studies.

73 Back-erasing Results of back-erasing
Models SE and DL
Results of back-erasing Back erasing causes the following changes to the study and to the session in which the study occurs.
• Run times - The run time of the back-erased study is shortened by the duration of the removed segment. The run time of the session is also reduced by the same amount.
• Measurements - All measurements that use data that was removed by back-erasing are corrected, as appropriate. For example, if the maximum SPL had occurred in that erased segment, the instrument re-evaluates the remaining data in the study to find a different maximum value.
• Meters - Back-erasing applies on the same basis to both meters.
• Storage - The session file is corrected to reflect the new run times and other changes that resulted from the back-erasing.
• Back erased raw data - The raw data that you removed by back-erasing is saved in the session’s file. You can post-edit back-erased data with DMS software.
How to back-erase 1. While running a study, view the Time Log screen in either the View
Current Study or the View Session viewing area. 2. If you see data that you would like to remove from the study, press the
pause key to pause the study. 3. Press the left arrow to move the back-erase Time Line from right to left.
With reference to the Time Log figure below, the Time Line starts at the Zero Marker and can be moved all the way across the screen to the 20-second Marker. All of these characteristics help you identify the segment to be back- erased. • Zero Marker - Identifies the end of the back-erased segment. This is
always the end of the study.
• Time Line - Identifies the beginning of the back-erased segment.

74 Back-erasing Results of back-erasing
Models SE and DL
• Duration - The length, in time, of the segment to be back-erased is given in the Softkey Region of the display.
Figure 5-14: Time Log screen
4. You can adjust the Time Line by pressing .
5. When you have the Time Line in position, press . The Time Line disappears and the softkey labels appear in the Softkey Region of the display.
6. To cancel this screen, press to begin the process again. The Time Line will reappear and you can select a different segment to back-erase. NOTE: At anytime you can leave the time log screen, and return another
time to edit the back-erase segment provided that you have not started another study.

75 Back-erasing Stopping a session
Models SE and DL
Stopping a session You can stop the session manually or with a trigger command, but only when the instrument is in the Pause state. When the session is stopped, the Stop icon , appears in the Status Area and the RunTime clock is zeroed. For information about using triggers, see “Digital Outputs/Triggers” on page 50. Stopping a session is sometimes referred to as “closing the session.” Conversely, a session is often described as “open” when the instrument is either in a run or pause state.
Stopping and pausing A manual session stop is a little different from a study pause. To pause a study, , you simply press the Run/Pause key and the command is immediately executed. To stop a session, , however, you need to press and hold the Stop key. If you don’t press and hold the stop key for the 3-second countdown period, the stop command is ignored and the session remains open. If you hold throughout the countdown, the following events occur in proper sequence.
Figure 5-15: Stopping and pausing
• Stopped - The session is stopped.
• Transferred - The session data in memory is transferred to the memory card.
• Cleared - The instrument’s memory is cleared of session data.
• Zeroed - The RunTime clock is cleared to zero.
Stop icon
Stop key
Run/Pause key

76 Back-erasing Stopping a session
Models SE and DL
This page left blank intentionally

77 Additional options Reverberation
Models SE and DL
RT60, Curves, and STI-PA
Additional options In this chapter, it is important to note that these features are additional add-on options and may not be available on your SoundPro model unless you specifically purchased these features. Please see 3M’s website 3m.com/detection for more information:
• Reverberation • STI-PA • Curves
Reverberation Reverberation is the distribution of sound in an enclosed space after the sound is removed or decayed. How is reverberation, or reverb, created in enclosed spaces? A sound is generated in an enclosed structure with a combination of the direct sound source (which travels from the sound source to listener by the shortest path without interfering with room surfaces) and the reflected indirect sound source. The total sound source echoes and decays as the sound is absorbed by the materials in the room (i.e., walls, carpet, furniture, concrete, etc...) and air. This is noticeable when the sound source stops but the reflections continue, decreasing in amplitude, until they can no longer be heard.
CHAPTER
6

78 Additional options Reverberation time (RT60)
Models SE and DL
Reverberation time (RT60) Reverberation time is a measurement used to evaluate and measure sound decay in a specific space, tailored to speech or music, such as: classrooms, auditoriums, gymnasiums, concert halls/theatres, (etc..). For room acoustic, results are used to ensure quality sound is evenly dispersed throughout a specific room with limited echoes/refractions. For music or performance auditoriums (i.e., symphonies), higher reverb. time is preferred so the ending results are more robust. The Reverberation Time over each octave band can be analyzed using a decay curve. Each octave band shows the time of sound at the start and after the activation of the noise system using either interrupted or impulse sound methods. The example below displays the Reverberation Time in an enclosed room. How it is measured with the impulse method: (1) A starter gun provides a broad impulsive spectrum noise at 110 dB. The instrument automatically begins plotting the sound decay (see dB level 1) and stops as the noise falls off (see dB level 2). Hence, the rate of decay is calculated from decay curve (or regression line) which will give you the rate of decay in the room. The RT60 measurement is calculated with the Txx time (i.e., T20) factored in and extrapolated to a 60 dB drop.
Figure 6-1: Reverb Time
Reverberation (RT60) methods The two methods supported by the SoundPro are the Interrupted noise method and the Impulse noise method. While the initial sound source used is different, the ending decay curve results are very similar providing accurate RT60 measurements.
Decay Curve Drop of sound pressure from Maximum to its ambient background level.
dB level 1
dB level2

79 Additional options Reverberation (RT60) methods
Models SE and DL
Interrupted noise The Interrupted noise method, applied with pink noise, is used with a portable sound system, such as a dodecahedral speaker, or with an existing sound system (only recommended if the sound system has a quality, omni-directional, sound system.) With the interrupted noise method, the sound source emits a high-level source and falls-off, returning to its original ambient background level. The Reverb Time is measured between T1 and T2 indicators with an ending RT60 time value. NOTE: T1 is calculated from two reference points on the regression line to ensure an accurate sound level capture
Figure 6-2: Interrupted noise example
Impulse noise The Impulse noise method requires a broad-spectrum impulsive noise source, such as a starter pistol, in a room to be tested. Typically, the RT60 decay start will begin at a high-level source and decays, reporting a Reverberberation Time.
T1
T2
Background noise level

80 Additional options Reverberation options
Models SE and DL
Reverberation options The following setup options are selectable via the Reverberation Time Options Setup menu (displayed in Figure 6-3).
Table 6-1: Reverberation time set-up options
Field Description Explanation of field selections
Method - Selecting the calculation process of RT60 reverb time.
Interrupted – (This is the default method setting.) Interrupted method uses a constant sound source (i.e., dodecahedral speaker), waiting for the level to stabilize, and then the source is turned off. (The method uses random noise or pink noise to test reverb. time.) Impulse – Impulse method is when the user tests the room with a broad spectrum impulsive noise, such as a starter pistol or a balloon popping.
Averaging – Selecting how it will calculate Average for Reverb-time
Measurement – The RT60 result times for each filter band of the 1/1 Octave or 1/3 Octave modes are averaged across the studies to arrive at a session average RT60 for that frequency band. Ensemble - The decay curves for each filter band of the 1/1 Octave or 1/3 Octave modes are averaged across the studies to arrive at an average session decay curve for that frequency band that is then used to calculate the session RT60 for that band. This results in either eight or twenty-four session ensembles, one for each frequency band in 1/1 Octave or 1/3 Octave modes, respectively.
Threshold - Specifies the dB level for triggering the start or run of the instrument. The interpretation of this field is dependent on the measurement method.
Auto - (This is the default threshold setting.) The instrument will automatically chose the level and calculate RT60. When in run mode, it sets the threshold relative to the noise level in the room. It provides a trigger level which is customized to each band. 40 dB – 140 dB (in 1dB increments). The threshold decibel is user-selectable between 40 dB to 140 dB in one decibel increments. • For Interrupted Noise method, level below this threshold will trigger
the start of a measurement. • For Impulse method, levels above this threshold will trigger the start
of a measurement.
Measure - The expected decay value
Auto - (This is the default Measure setting.) The instrument will automatically pick the best Txx value based on the expected decay (i.e., T20). T60 (T10 – T60) – (The default setting is Auto.) The selected “Txx” value is the actual amount of drop/decay the instrument measured. The selectable ranges are T10-T60.
Filters - 1/1 or 1/3 bands
Measurements are plotted and stored in 1/1 or 1/3 octave band chart and decay chart. This field is only selectable if both 1/1 and 1/3 octave filter bands are installed features. Otherwise, the instrument will apply the installed filter.

81 Additional options Setting up reverberation
Models SE and DL
Setting up reverberation The Reverb Time screen is used to change or view your reverberation settings. The steps below outline how to change the parameters. Please review Table 6-1: “Reverb time set-up options” for an explanation of parameters.
1. From the start screen, select Setup (by using Arrows) & press .
2. Select Options menu (by using Arrows) and press .
3. Select Reverb Time (by using Arrows) and press .
4. In the Reverb Time screen to change the settings, follow below:
• To change the Method field, press to switch between “Interrupted” or “Impulse” (when Method is selected).
• To change the Averaging field, press to switch between “Measurement” or “Ensemble” (when Averaging is selected).
• To change the Threshold, press . Press to toggle between “Auto” or a “dB” level value. To change the dB level, press Arrows to a specific decibel level is selected (i.e., 80 dB) (when Threshold is selected).
• To change the Measure field, press to toggle between “Auto” or an “RT” value is selected (when Measure is selected). To change, press Arrows to a specific decibel level is selected (i.e., 80 dB) (when Threshold is selected).
• To change the Filters field, press to switch between “1/1” or “1/3” (when Filters is selected).
Figure 6-3: Reverb Time Setup screen
Reverb Time options a. Method field
b. Averaging field
c. Threshold field
d. Measure field e. Filters field
a
b c
d
e

82 Additional options Running reverberation test
Models SE and DL
Running reverberation test There are a couple factors to consider when conducting a reverberation test. Depending on if you will be measuring voice in a room, hall, theatre (etc..), ISO 3382 standard recommends measuring reverberation time for speech from 63 HZ to 4 kHz. However for rooms with other intentions (i.e., music/acoustical concerts), one-third octave bands from 100 Hz to 5 kHz can be used/applied. ISO 3382 also recommends a minimum number of recorded studies in order to obtain a reliable reverb measurement session. This is done for two reasons: (1) because the test signal is random noise, there will be a bit of run-to-run variance. By taking a number of measurements from the same location and averaging them together, you get a more reliable estimate of the actual measurement (2) Because the acoustics in a room may vary, it is suggested to do spatial averaging - taking measurements from multiple locations in the room and average them together to get an average measurement for the room. Once the setup options are selected, please follow the procedures below to run and view RT60 measurements. Reverberation (RT60) Test 1. Select setup parameters via the Reverb Time screen (see “Setting up
Reverberation” above).
2. (Skip this step if threshold is set to “Auto”.) View the ambient noise in the room (the LZMAXvalue) and note the value. (NOTE: To ensure a decay curve, at least 45 dB above background noise level is recommended.)
• To view the ambient sound in the room do one of the following: (A) From the Start screen, select SLM as the measurement type and
select View Current Study. • Verify that the range setting is appropriate for the level being
measured. It is desirable to select the longest range that will not overload. Press Up/Down Arrows to change range. (For more details, please see “Measurement range”, page 60.)
• Press Run/Pause key and notate the average level. (NOTE: you may need to press the Look-up softkey and select Leq to view the average ambient sound level. For more information please refer to, “Changing displayed measurements”.) When completed, press Run/Pause key and then press Stop key to end the session.
(B) Follow “A” above but select 1/1 or 1/3 as the measurement type.

83 Additional options Reverberation results
Models SE and DL
3. Select RT60 as the measurement mode from the Start screen.
Figure 6-4: Reverb Time Setup screen
4. , Please choose one of the following methods to conduct your test:
• Interrupted Method: Pump noise through room with existing sound system or a portable sound system. Allow level to stabilize. Then press Run .
• Impulse Method: Press Run . Impulse the room with a broad
spectrum impulsive noise (i.e., starter gun). 5. Depending on your Setup options, the Reverb Time will automatically
trigger and record the results. NOTE: You may want to repeat this process a few times to ensure the
readings are accurate. Once the RT60 is captured, a pause indicator will appear at the top of the screen. To run another study, press the run key again and follow step 4. Or if you do not want to combine all of the run/pauses into a session, press Stop and then Proceed with the Run key and follow step 4.
Reverberation results There are three viewable screen reverberation results which include the RT60 Summary chart, Decay Curve screen, and the Tabular Summary screen. When the SoundPro is in pause mode, you can view the charts and graphs by toggling through the screens via the Enter key. If you will be running multiple
Measurement type Select RT60 for Reverb testing

84 Additional options Reverberation results
Models SE and DL
studies, you may want to review the data at the end of the session. In this example, you would access the File\Session\Data File screen and select a past study. (For more information, see “Viewing past sessions/studies” in Chapter 7.)
RT60 summary screen This is a vertical bar chart that will plot the T60 values taken from each octave band or 1/3 octave band.
Viewing RT60 values of each band 1. The decay value for each specific band is viewable by pressing the
left/right arrow keys. NOTE: Bands with invalid T60 values will show dashes (---) instead of a
value.
Figure 6-5: RT60 bar chart screen
Deleting RT60 value in a filtered band This optional feature allows you to delete a selected filtered band from the session average and is available when in review mode of “view current study” screens. (This may be used, if for example, you had someone accidentally walk in during your test and begin speaking. You could delete the bands which interfered with your test from the RT60 average results.) 1. To delete a filtered band, select either the RT60 Summary screen or the
Decay curve screen.
Filter band results Displays the RT60 filter band frequency values
T60(20) States that T60 measurement was extrapolated from a T20 measure.
Overall RT60 value of selected band.
Selected band
RT60 bar chart
Decay (To view decay results, press softkey)

85 Additional options Reverberation results
Models SE and DL
2. Select the band to be deleted (by pressing left or right arrows.)
3. Press the Delete softkey. (Repeat steps if you wish to delete more bands.)
Decay curve screen This chart displays the (average or ensemble) results of a single Reverb Decay curve from the study (i.e., one filter band)/or the average of all studies within that session. (For more information, refer to “Sessions and Studies” in Chapter 5). Viewing decay value of each band 1. The decay value for each specific band is viewable by pressing the
left/right arrow keys.
Figure 6-6: Decay curve screen
NOTE: To delete a curve, please see “Deleting RT60 value in a filtered band” above.
Overall decay time
Sound pressure level
RT60 (To view RT60 results, press softkey)
Decay curve

86 Additional options Reverberation results
Models SE and DL
Tabular RT60 screen This is a table-formatted screen which details a summary of the Reverb Decay Curve of each band. The following table is a brief summary of the tabular data.
Table 6-2: Tabular RT60 field explanation
Figure 6-7: Tabular octave filtering RT screen
NOTE: if “---”dashes appear, this indicates the measurement values are invalid.
Viewing Tabulation RT60 screen 1. To view all of the octave band filters, press the Up/Down Arrow keys to
page through the filters’ data results.
Column Explanation of data
Freq
The Frequency column displays the chosen filter bands (for 1/1 Octave the range is 63Hz – 8KHz and for 1/3 Octave the range is 50Hz – 10KHz).
T60
T60 column displays the results of the decay curve in seconds.
R2 R2 column displays the reverberation time measurements. The values represent a “goodness to fit” ranging between 0 to 1 values, where 0 = failed and 1 = perfect.
Txx Txx column displays the actual measurements of the RT60s’ values.
Summary of the Reverb Decay curve results for each octave band.
NOTE: The Txx value may show different ranges when “Auto” is selected for the trigger mode.
87 Curves Captured curve applications
Models SE and DL
Curves Curves, also referred to as “Acoustic Spectral Curves”, is used to evaluate the quality of noise in new or existing buildings. The SoundPro models SE and DL support the following:
• Captured curves • Noise Criterion curves: NC curves, PNC curves, NCB curves, NR
curves, RC curves, • Audiometric Booth Background Curves: ANSI 53.1, OSHA, and ISO
AM Booth
Captured curves Captured Curves, is a user-defined criterion curve, which allows the user to make a measurement with a 1/1 octave band frequency or a 1/3 octave band frequency distribution and save or capture the spectral curve. This snapshot can be displayed in DMS as a baseline or reference curve. A new measurement is then made and superimposed over the captured baseline curve to illustrate octave band frequency deviations from the original distribution, creating a user-defined criterion curve. This may be kept just as a reference, or it may be used as an evaluation for product or process comparisons, job task risk assessments, environmental investigations, and other applications.
Captured curve applications Application 1 - Baseline: Applying a captured curve as a baseline or reference
curve for noise abatement investigation. • The operator captures the original noise and then makes various changes to the
machine and/or enclosure and looks to see how much of a difference the change made.
Application 2- Quality Control: Using a captured curve as a Quality Control (QC) evaluation. The instrument has been pre-loaded with a sound curve that represents the allowable levels for some product. • Once the product comes off the assembly line, it runs and the measurements are
compared to the allowable levels. If levels exceed the curve, it is sent back for rework.
Application 3: Process monitoring: A set of machinery is monitored to watch for changes in the operating sound. • If the measured sound exceeds the sound curve, it is an indication to the operator
that “something bad” is happening (i.e., over exposure) and he needs to shut things down and call maintenance before more damage occurs.

88 Captured curves Setting up captured curves
Models SE and DL
Setting up captured curves Setting up Captured Curves Settings and measurement settings
1. From the start screen, select either 1/1 octave or 1/3 octave for the measurement type. (Repeatedly press first softkey.)
Figure 6-8: Selecting measurement type for curves
2. Next, select the measurement type, by selecting View Session (use Up/Down Arrow to select) and press Enter . Select the appropriate meter 1 settings (using the softkeys) and set the response time, weighting, and measurement type. (See Figure 3-4, page 27 for an example).
NOTE: It is recommended to set Meter 1 to Slow response, Z-weighting, and
measurement to Leq.
3. Press On/Off/Esc to return to the start screen.
4. Select Setup (use up/down arrows to highlight) and press Enter .
5. Select Options menu (use up/down arrows to highlight)and press Enter .
6. Select Curves menu (use up/down arrows to highlight) and press Enter .
7. For the Mode, press Enter repeatedly to select either Survey or Evaluation setting. (Please see explanation below).
• Survey Mode: dynamically evaluates the noise and reports the appropriate noise curve. Typically used if you wish to take multiple curve samples to evaluate and re-evaluate noise in a room/zone.
Selecting Measurement type Press first softkey until 1/1 or 1/3 is selected

89 Captured curves Setting up captured curves
Models SE and DL
• Evaluation Mode: evaluates the noise levels against specific criterion. This is primarily used when you are capturing one to four different curves. With this option, you assign a Capture name (Cap-1, Cap-2, Cap-3, Cap-4) in the setup menu and then run a captured curve study. To assign a new captured curve name, you return to the Options menu, select a name and then return back to view session mode and run your study.
NOTE: Whether you choose Survey or Evaluation mode, the captured curved results will report the same data. The survey mode is recommended for Captured Curves since it is slightly easier to use in the field.
8. Depending on your selection in step 4, refer to the following:
• If Survey Mode was selected, please see step 6. • If Evaluation mode was selected, press Up/Down to highlight
Criterion. Repeatedly press Enter to select Cap-1, Cap-2, Cap-3, Cap-4.
9. Press On/Off/Esc twice to return to the start screen.
Figure 6-9: Captured Curves and Survey mode
Mode Press Enter repeatedly to toggle between Survey and Evaluation modes.
Curves screen
Type “Captured (CAP)” automatically appears when you select Survey as the type.

90 Captured curves Running captured curves
Models SE and DL
Running captured curves Capturing a curve allows you to take a snapshot of the current octave noise profile. Once the captured curve is selected and applied, the SoundPro will automatically calculate the captured curve results with the STI-PA measurement.
1. From the Start screen, select either 1/1 octave or 1/3 octave for the measurement type. (Repeatedly press first softkey.)
Figure 6-10: Selecting 1/1 or 1/3 for measurement type
2. To run a captured curve study, press Up/Down to select (or highlight) View Session and press Enter .
3. In the View session screen, select the appropriate meter 1 settings by
using the corresponding softkeys for response time, weighting and measurement type (lookup key).
4. Press Run to start your study. Depending on if you chose survey mode (see “a” below) or evaluation mode (see “b” below) in the setup screen, do one of the following:
a. Survey mode: when you are ready to capture a curve, press Altf key (on keypad) and the softkey menu will expand. Repeatedly press first softkey to assign a capture curve name (You have four options: Cap-1, Cap-2, Cap-3, or Cap-4). Then, to Capture, press the second softkey.
Selecting Measurement type Press first softkey until 1/1 or 1/3 is selected

91 Criterion curve families Types of Criterion Curves
Models SE and DL
Figure 6-11: Capturing a curve (CAP-1)
b. Evaluation mode: to capture a curve, the curve indicators will appear before and during your run. It will automatically save the run with curve indicators and assign the name you applied during the Options setup. To capture additional curves, assign a new name via the Options menu and then run another test. (See “Setting up Captured Curves” for details)
5. To view your results, repeatedly press Enter (See section, “Running a curve study and viewing results”, page 96.)
Criterion curve families Criterion curves is another option to display and record a selection of spectral curves for use in room and building acoustic measurements and noise control engineering. The objective of a criterion curve is to specify the ambient noise in a room or environment with a single number or statement, rather than individually specifying multiple octave or third-octave band limits (as you do with captured curves).
Types of Criterion Curves The SoundPro Models SE/DL support a family of criterion curve families which are explained below. (For more information, please see glossary.) • Noise Criterion Curves (NC) – uses a tangency method and is typically
used for HVAC room or building acoustic comparisons.
CAP-1 Press first softkey to assign a captured curve name (i.e., CAP-1, CAP-2, CAP-3, or CAP-4)
Capture Press Capture softkey to Capture a curve.
Curve indicator
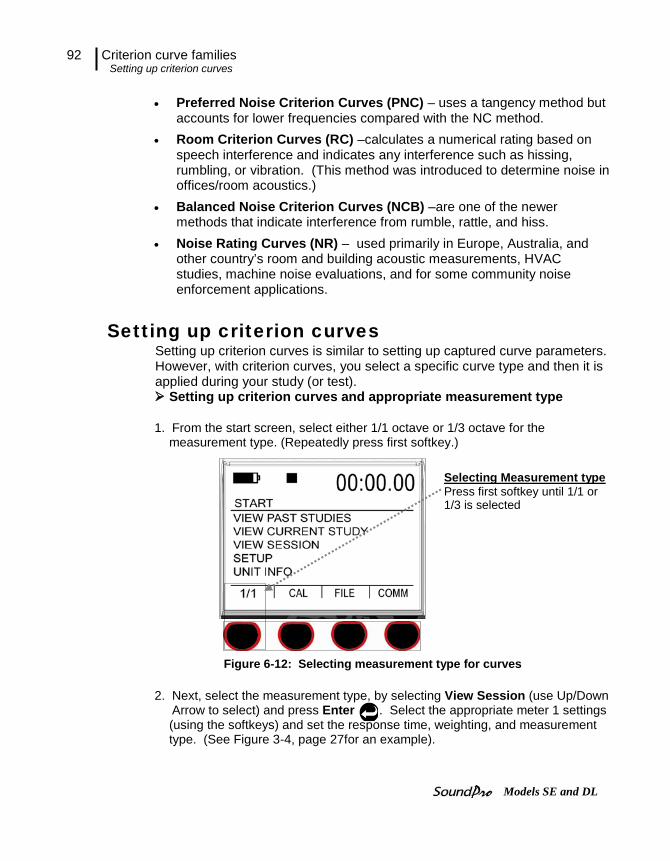
92 Criterion curve families Setting up criterion curves
Models SE and DL
• Preferred Noise Criterion Curves (PNC) – uses a tangency method but accounts for lower frequencies compared with the NC method.
• Room Criterion Curves (RC) –calculates a numerical rating based on speech interference and indicates any interference such as hissing, rumbling, or vibration. (This method was introduced to determine noise in offices/room acoustics.)
• Balanced Noise Criterion Curves (NCB) –are one of the newer methods that indicate interference from rumble, rattle, and hiss.
• Noise Rating Curves (NR) – used primarily in Europe, Australia, and other country’s room and building acoustic measurements, HVAC studies, machine noise evaluations, and for some community noise enforcement applications.
Setting up criterion curves Setting up criterion curves is similar to setting up captured curve parameters. However, with criterion curves, you select a specific curve type and then it is applied during your study (or test). Setting up criterion curves and appropriate measurement type
1. From the start screen, select either 1/1 octave or 1/3 octave for the measurement type. (Repeatedly press first softkey.)
Figure 6-12: Selecting measurement type for curves
2. Next, select the measurement type, by selecting View Session (use Up/Down Arrow to select) and press Enter . Select the appropriate meter 1 settings
(using the softkeys) and set the response time, weighting, and measurement type. (See Figure 3-4, page 27for an example).
Selecting Measurement type Press first softkey until 1/1 or 1/3 is selected

93 Criterion curve families Setting up criterion curves
Models SE and DL
3. Press On/Off/Esc to return to the start screen.
4. Select Setup (use up/down arrows to highlight) and press Enter .
5. Select Options menu (use up/down arrows to highlight) and press Enter .
6. Select Curves menu (use up/down arrows to highlight) and press Enter .
Figure 6-13: Curves setup screen example
7. For the Mode, press Enter repeatedly to select either Survey or
Evaluation setting. (Please see explanation below).
• Survey Mode: dynamically evaluates the noise and reports the appropriate noise curve. Typically used if you wish to take multiple curve samples to evaluate and re-evaluate noise in a room/zone.
• Evaluation Mode: evaluates the noise levels against specific criterion.
NOTE: Whether you choose Survey or Evaluation mode, the criterion curved results will report the same data.
8. Select a type by pressing Up/Down to move to the Type field.
9. Repeatedly press Enter to toggle between the five-criterion curve options.
NOTE: Depending on the Criterion curve you select, you may or may not have the option to set the Criterion field. If the Criterion field appears once you select the type, adjust this field by using the Up/Down arrows to move to the field and press enter repeatedly to change the criterion.
10. Press On/Off/Esc twice to return to the start screen.
• To run your Curve study, please see section, “Running and viewing a curve study.
Curves screen
Evaluation mode

94 Audiometric background curves Setting up audiometric background curves
Models SE and DL
Audiometric background curves The SoundPro SE/DL series supports the following two types of audiometric test room sound level curves:
• Audiometric Test Room Background Sound Level Curves (OSHA) which compares the ambient noise readings to the maximum permissible ambient noise levels (MPANLs) at 500 Hz, 1K, 4K, 8K as specified by the OSHA Hearing Conservation Amendment (1983).
• Audiometric Test Room Background Sound Level Curves (ANSI) which compares the ambient noise to selectable criterions specified in ANSI S3.1-1999 and allows for a variety of audiometric earphones using 1/1 and 1/3 octave band analysis.
Setting up audiometric background curves For set-up parameters, it is recommended to set Meter 1 to Slow Response, Z-Weighting, and measurement to Leq before you run your study.
Additionally, the measurement type should be set to 1/1 octave for OSHA audiometric testing and should be set to 1/1 or 1/3 octave for ANSI audiometric testing. The steps below detail the procedures. Setting up audiometric background curves and measurement parameters
1. From the start screen, select either 1/1 octave or 1/3 octave for the measurement type. (Repeatedly press first softkey.)
Figure 6-14: 1/1 or 1/3 octave measurement type for audiometric testing
Selecting measurement type Press first softkey until 1/1 or 1/3 is selected

95 Audiometric background curves Setting up audiometric background curves
Models SE and DL
2. Next, select the measurement settings, by selecting View Session (use
Up/Down Arrow to select) and press Enter .
3. Select the following recommended meter 1 settings using the softkeys using the softkeys: measurement to Leq, Slow response, and Z-weighting. • Setting measurement to Leq: Press the 1st softkey to access the
“Lookup” menu. Using up/down arrows on the keypad, select “L_eq”. A diamond character u indicates the “selected” measurement.
• Setting timed response: Repeatedly press 2nd softkey to select appropriate setting (recommended is “S” for slow response.) An underline denotes the “selected” response.
• Setting Weighting: Repeatedly press 3rd softkey to select appropriate setting (recommended is “Z” for Z-weighting).
Figure 6-15: Selecting measurement type for curves
4. Press On/Off/Esc to return to the start screen. 5. Select Setup (use up/down arrows to highlight) and press Enter . 6. Select Options menu (use up/down arrows to highlight) and press Enter . 7. Select Curves menu (use up/down arrows to highlight) and press Enter .
8. For the Mode field, select Eval (“Evaluation”) by repeatedly pressing Enter .
9. For the Type field, select one of the following by pressing the down arrow to move to the type field and repeatedly press Enter .
• ANSI AM Booth or OSHA AM Booth
Figure 6-16: Audiometric booth setup in the curves screen
Lookup menu
Timed Response
Weighting
Mode – select Eval
Type – ANSI Booth
Criterion - field will only appear if ANSI AM Booth is selected in type field
Curves screen

96 Running and viewing curves Curve measurements and results
Models SE and DL
10. (Skip this step if you selected OSHA AM Booth). To select a Criterion, press the down arrow and repeatedly press Enter . You have the following three settings in the testing ranges of 125Hz-kHz, 250Hz – 8kHz, and 500Hz-8kHz octave or one-third octave bands. • NC refers to “not covered” ears in relation to a person in a hearing
booth without the use of hearing protection.
• SA refers to “Supra-aural” which is used when a persons is in a hearing booth with large headphones.
• INS refers to “Insert” which is used when a person is in a hearing booth with ear inserts.
11. Press On/Off/Esc twice to return to the start screen.
• To run your Curve study, please see section, “Running and viewing a curve study”.
Running and viewing curves After you have enabled curve mode, type, and criterion (only applicable for evaluation mode), you are now ready to run a curve study. When viewing your measurements it is important to understand how your results will display. The following is an explanation of the curve types:
• If NC, PNC, NR, NCB, or RC are selected these will display in 1/1 octave only.
• If Captured Curves are selected, this will display in 1/1 octave or 1/3 octave.
• If OSHA Audiometric is selected, it will display in 1/1 octave only. If ANSI Audiometric is selected, it will display in 1/1 octave or 1/3 octave.
Curve measurements and results Running a curve study and viewing results 1. From the Start screen, ensure you are in 1/1 or 1/3 mode. Then, press the
Up/Down arrows until “View Session” is highlighted. 2. Press the Run key to begin your study. When completed, press pause
and stop keys to end the session.

97 Running and viewing curves Curve measurements and results
Models SE and DL
3. To view your results, press Enter . The following screens appear. (a) Sample bar chart – displays 1/1 octave band with curve and sound values
plotted on the spectrum. (See “a” below: A- selected band, B- curve indicator, C- amplitude in band).
(b) Tabular screen – shows 1/1 octave band values in a table format. (see “b” below).
(c) Community noise – displays community noise (Please see “Community Noise screen”, on page 69 for a screen example.)
(d) Dosimetry screen - shows dosimetry measurements (see “e” below).
(e) Delta screen – displays difference between the selected curve and current measurement, in each filter band. A positive value is the amount exceeding the curve (see “e Delta screen” and reference “A” in the figure) and a negative value is the amount below the curve. NOTE: for a captured curve, it will display CAP-1(or applied captured 1-4) in the top left instead of a criterion curve (NC-30). You may have to select LEQ to view the results via the Look-up key.
Figure 6-17: Curve results
A
B C
A
(a) Sample bar chart with curves (b) Tabulation screen
(d) Dosimetry screen (e) Delta screen

98 Speech Intelligibility STI-PA testing
Models SE and DL
Speech Intelligibility Another available add-on feature is Speech Transmission Index (STI) used to evaluate and classify speech intelligibility dependent of background noise level. STI is the standardized measurement in the IEC 60268-16:1998 standard.
STI-PA testing STI refers to the amount of modulation preserved in the broadcasting of an artificial speech signal through an alarm system. The intelligibility measurement is a single value between zero and one, which factors in corruption of speech, with modulating speech frequencies over octave bands between 125Hz to 8kHz.
STI-PA is measured using seven octave bands and 2 modulation indices per octave band simultaneously allowing a 15 second measurement. In essence, any noise which masks (or corrupts) the talker-to-listener path is evaluated and a recommended measurement is computed at the end of an intelligibility test. The following sections briefly address points to consider when setting up a STI-PA test.
Zones Where do I measure speech intelligibility?” A building or stadium can be broken into “zones”. Each “zone” has a room with one alarm system. In some situations, one room may have more than one alarm system or may have a change in ceiling height (such as an atrium or a balcony seating versus lower level seating). In those instances, each section would be considered a zone and each zone would be tested. After determining the “zones” in your building, it is recommended to design a map of the key zones/rooms. Generally, a zone is a 20X20 area. If the room is larger than 20X20, it is recommended to take another measurement in this section.
Selecting STI scale or CIS scale
With the SoundPro, you have two measurement options which will determine the intelligibility of your building which are the STI scale and the CIS scale (explained below.)

99 Speech Intelligibility Selecting STI scale or CIS scale
Models SE and DL
STI scale The scale identifies if the mass notification system is intelligible or unintelligible based on a STI scale ranging from 0.0 to 1.0 where 0.5 to 1.0 is considered a passing score, per NFPA 72 and IEC 60849.
Common Intelligibility Scale (CIS) Similar to the STI scale, the CIS scale uses a range from 0.0 to 1.0 to determine if the MNS is intelligible. However, with the CIS scale, a rating of 0.7 to 1.0 is an “intelligible” score, per the IEC 608489 and NFPA 72.
When to take STI-PA readings? Scenario one You may be able to run the test signal through the PA system during normal business hours. In this scenario, you would set the meter to STI-PA and select either STI scale or CIS scale and run your study in the mapped “zone” areas.
Scenario two In other situations, running a test tone through a PA system during business hours could be distracting and not feasible for your environment. In this situation, it is recommended to follow these procedures:
• First, take sample background noise measurements during business hours. These are saved and stored on the Verifier as “Captured Curves”. The verifier will save up to four “captured curves”
• Second, in the STI-PA options, select the appropriate captured curve.
• Third, run your measurements at the appropriate time of day (i.e., late evening/early morning). (The applied captured curve will automatically factor into your study.)
• Fourth, view your results on the display of the instrument (or in Excel by using the File converter tool.)
STI 00 - 0.30 0.3 - 0.45 0.45 - 0.60 0.60 - 0.75 0.75 - 1.00
scale Unacceptable Poor Fair Good Excellent
CIS 00-0.48 0.48 - 0.65 0.65 - 0.78 0.78 - 0.88 0.88 - 1.0
scale Bad Poor Fair Good Excellent

100 Speech Intelligibility Conducting a STI-PA test (overview of steps)
Models SE and DL
Conducting a STI-PA test (overview of steps)
1. Calibrate the SoundPro.
2. Set-up your STI-PA options via the” Measures” setup screen. (Select the measurement type as STI-PA.)
3. A level setup is conducted. From a fixed-point, the technician measures the A-weighted SPL of MNS message (or alarm system). The test signal volume should approximately match the MNS message volume. (You would adjust the test signal to match the LAS value.)
4. The test signal is played through buildings voice system (PA system).
5. The technician/sound tester positions himself/herself in “zones”/building areas.
• It is recommended to design a map of “zones”(or rooms) to indicate where you will be taking your measurements.
• Set measuring range appropriately.
6. STI-PA measurement is conducted. Press the Run/Pause key to start the study. NOTE: If you want to post-process your intelligibility measurements with previously captured
background noise, you would first capture curves and then apply this during your study.
7. After a 15-second countdown, either a STI or CIS level is displayed with a pass/fail message.
8. The technician/sound tester moves throughout the building and measures in all zones/rooms. NOTE: A zone/room is typically a room 20x20. More than one measurement may be
required if the room exceeds this size.
9. The tests are noted as pass/fail. NOTE: the past tests can be reviewed and loaded via the File System screen.
STI-PA setup The following table explains all of the parameters found in the measures setup screen.
Measures setup screen
Explanation
Scale type field Select either STI scale or CIS scale. (Please refer to Chapter 1, “STI scale or CIS scale”)
Gender field The voice can be set according to the test signal being use, male or female voice. NOTE: the Verifier default setting is Male. If using the test signal supplied by 3M, this uses a male test signal; so; you will not have to change this field if you only use the male test tone signal.
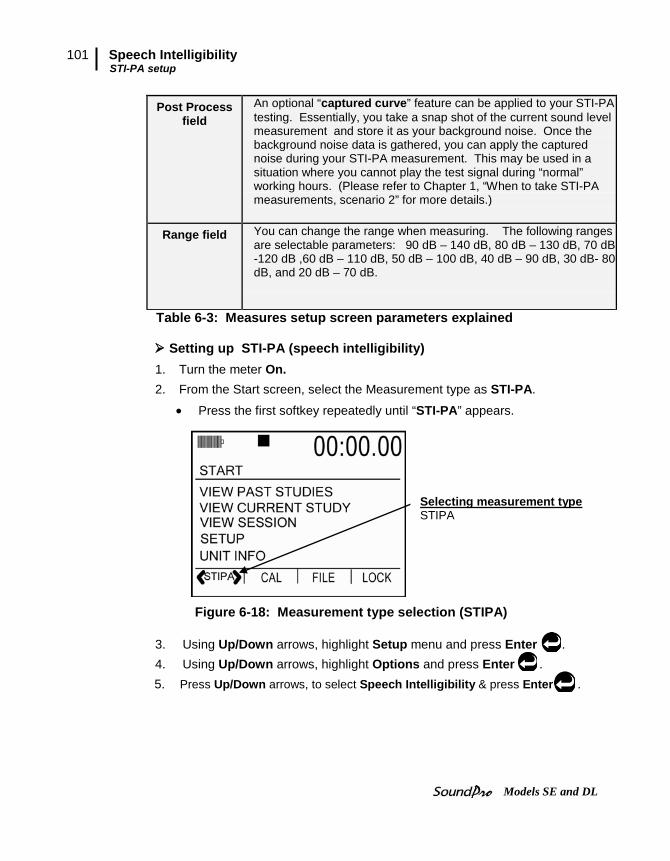
101 Speech Intelligibility STI-PA setup
Models SE and DL
Post Process field
An optional “captured curve” feature can be applied to your STI-PA testing. Essentially, you take a snap shot of the current sound level measurement and store it as your background noise. Once the background noise data is gathered, you can apply the captured noise during your STI-PA measurement. This may be used in a situation where you cannot play the test signal during “normal” working hours. (Please refer to Chapter 1, “When to take STI-PA measurements, scenario 2” for more details.)
Range field You can change the range when measuring. The following ranges are selectable parameters: 90 dB – 140 dB, 80 dB – 130 dB, 70 dB -120 dB ,60 dB – 110 dB, 50 dB – 100 dB, 40 dB – 90 dB, 30 dB- 80 dB, and 20 dB – 70 dB.
Table 6-3: Measures setup screen parameters explained Setting up STI-PA (speech intelligibility)
1. Turn the meter On. 2. From the Start screen, select the Measurement type as STI-PA.
• Press the first softkey repeatedly until “STI-PA” appears.
Figure 6-18: Measurement type selection (STIPA)
3. Using Up/Down arrows, highlight Setup menu and press Enter . 4. Using Up/Down arrows, highlight Options and press Enter . 5. Press Up/Down arrows, to select Speech Intelligibility & press Enter .
Selecting measurement type STIPA

102 Speech Intelligibility STI-PA setup
Models SE and DL
6. To change the Scale field, press Up/Down arrows until Scale is highlighted and press Enter to change to either STI or CIS.
Figure 6-19: STI-PA setup screen
7. To change the Gender field, press Up/Down arrows until Gender is highlighted and repeatedly press Enter to select Male or Female.
8. To change the Post Processing field, press up/down arrows to select the field and repeatedly press Enter to select a Captured Curve or Off.
9. To change the Range, press Down arrow and then repeatedly press Enter to select a specific range.
10. Once set, press Enter to return to the Start screen.
Speech Intelligibility screen • Setup screen
Captured Curve selection • If you captured background
noise and want to apply it, select Cap1, Cap2, Cap3, or Cap4 to apply during STI-PA test

103 Speech Intelligibility Conducting a level setup (for STI-PA)
Models SE and DL
Conducting a level setup (for STI-PA) • From a fixed-point, measure the A-weighted Sound Pressure Level of your
mass notification system (or alarm system). When in the STI-PA screen, adjust the range as needed via the Up/Down Arrows.
• The average dB level is displayed when in stop mode. NOTE: the instrument will display the LAS when in stop mode. This is
also called “survey mode”.
Figure 6-20: Level set-up and average decibel level
Running a speech intelligibility study Before proceeding with a STI-PA measurement, ensure you calibrated the Verifier and conducted a Sound Level setup. NOTE: if there is impulsive noise present, it is best to capture the background noise (via the Captured Curve pop-menu), remove the noise, or come back later when the noise is not present. That is because impulsive noise and strong voices can skew the measurement results. If you captured the background noise, you would then come back when the noise is not present and apply the captured curve during a STI-PA measurement. (See “Applying captured curves for STI-PA testing for more details, on page 106.)
The following instructions explain how to run, pause, and stop a STI-PA study without captured curves. (If you wish to take a background noise sample, also called “captured curves see “Applying captured curves for STI-PA testing” for more details, 106.)
NOTE: it is optional to organize your measurements into Sessions & Studies. How to run a STI-PA study?
1. The SoundPro should be powered on and you should be viewing the STI-PA measurement screen.
Average dB level Displayed while in run or pause mode
Average decibel
Stop mode
Range Press up/down arrows to adjust the range values

104 Speech Intelligibility STI-PA results screens
Models SE and DL
2. Play the signal over the loudspeaker and then locate yourself in the appropriate zone/room.
3. Verify that the range setting is appropriate for the level being measured. It is desirable to select the longest range that does not overload. (To change the range, press Up/Down Arrows from the STI-PA screen.)
4. Press the Run key to begin your study. 5. The meter will run for 15 seconds and then pause.
• To continue to take measurements, repeat step 3. • To terminate your study, please see step 6.
6. Press the Stop key to end your study. (Three viewable results screens are explained in the next section.)
STI-PA results screens The test signal is made up of 7 octave band signals which encompasses a combination of vowels and syllables from common speech. There are 14 modulating frequencies that emulate a male/female’s speech patterns. The STI method is based on the determination of the modulation transfer function (MTF) which is the ratio of measured modulation to the overall signal strength at each modulation frequency. Viewing STI-PA results 1. Once in pause or review mode, press repeatedly to toggle through
the STI-PA results screen.
STI-PA measurement and scale results screen In the STI-PA measurement screen, the MTF is combined according to IEC 60268-16 and presented on a scale between 0 to 1 representing the quality or intelligibility of the mass notification system.
Figure 6-21: STI-PA measurement (scale results) screen
STI-PA scale results
STI-PA results graphical view
Range

105 Speech Intelligibility STI-PA results screens
Models SE and DL
STI-PA modulation screen In the Modulation measurement screen, the average decibel level over the run-time in seven octave bands ranging from 125HZ to 8KHz with 14 frequencies is displayed in a tabular format. These values are the signal to noise ratio (accounts for any interfering background noise such as non-linear distortions, electronics, reverberation, HVAC systems) in each attenuation band and indicates which values are intelligible/unintelligible based on the CIS/STI scale. NOTE: A high MTF value indicates that the listeners received the
message without any distortions or interference. Figure 6-22: STI-PA Modulation screen
Table 6-4 defines the STI-PA: modulation frequencies for the seven octave bands (per the IEC 60268-16 standard).
Table 6-5 defines the STI octave band with specific male and female weighting factors used with STI-PA measurements (per the IEC 60268-16 standard).
Octave band Hz 125-250 500 1 k 2 k 4 k 8 k
First modulation frequency Hz
1.00 .63 2.00 1.25 0.80 2.50
Second modulation frequency Hz
5.00 3.15 10.0 6.25 4.00 12.5
Octave band Hz 125-250 500 1 k 2 k 4 k 8 k
Males 0.127 0.230
0.233
0.309
0.224 0.173
0.078 0.065
0.011
0.047
0.095 -
Females
0.117 0.223
0.216
0.328
0.250 0.194
0.099 0.066
0.062
0.025
0.076 -
LEQ Average dB level in band
Signal to noise ratio for each band * Based on the CIS/STI scale ranging from 0.00 – 1.00

106 Speech Intelligibility STI-PA results screens
Models SE and DL
STI-PA modulation envelope screen This screen reports a summary of the STI-PA modulation screen. 1. To view each band’s results, press Arrow key. NOTE: The results can be used to assess each frequency’s band modulation
level to determine why it passed or failed (in order to correct any issues).
Figure 6-23: STI-PA Modulation envelope screen
Storing background noise/capture curve In order to measure and store background noise prior to STI-PA testing, you will want to measure (or “capture”) the level via the Captured Curve Setup and then apply it during the STI-PA test. (Note: this is only performed if you do not want to play the test tone during “normal” business hours.)
1. From the Start screen, select either 1/1 octave or 1/3 octave for the measurement type.
Figure 6-24: Selecting 1/1 or 1/3 for measurement type
Scale
MTF scale rating results across bands
Selected band
Scale Results of selected band
Selecting Measurement type Press first softkey until 1/1 or 1/3 is selected

107 Speech Intelligibility STI-PA results screens
Models SE and DL
2. Setting up Curves: Select Setup and press Enter .
• Select Options (via the Down Arrow and press Enter ). • Curves will be highlighted, press Enter . • Choose Survey as the Mode and Captured (CAP) as the Type and then
press On/Off/Esc repeatedly to return to the Start screen. Figure 6-25: Captured curve/background noise setup for STI-PA testing
3. Capturing curve/background noise: (See Figure 6-26 below.) • Select View Session by pressing Up/Down and press Enter . • Note: it is recommended to capture either the SPL or the Leq level. To
change the measurement displayed, press the Lookup softkey and select either L_ or L_eq. (For more information, please see “Changing displayed measurements”.)
• In the broadband/RTA screen, press Altf key. (This will expand the softkeys and Cap will appear.)
• When the level is stabilized, press the “Capture” key. (See Figure 6-26.)
4. Optional: To capture additional background levels, change the 1st softkey to either (Cap-1, Cap-2, Cap-3, Cap-4) and then press the Capture (2nd) softkey. Repeat this step as needed. (You can store and apply up to 4 background noise SPL levels.)
Captured (CAP) To select the Type field press down arrow. Press Enter repeatedly to select Captured (CAP).
Mode When highlighted, press Enter continuously to toggle through the menu options and select Survey. NOTE: Survey/Eval. mode will compute the same results.
Selection Panel This appears when lookup softkey is pressed. • The diamond symbol u indicates
which measurement is selected. (L_ denotes SPL). Press Enter key to confirm new selection.

108 Speech Intelligibility STI-PA results screens
Models SE and DL
Figure 6-26: Captured curves/background noise
5. Once all background noise has been captured, refer to, “Applying captured curves” below.
Applying captured curves for STI-PA testing To apply the curves during a STI-PA measurement remember to complete one and two below before applying the curve.
Applying captured curves
1. From the Start screen, select View Session and press .. Press Altf key.
2. Select one of the captured curves by pressing the 1st softkey (i.e, Cap-1). Press On/Off/Esc key.
3. From the Start screen, press the 1st softkey continuously until STI-PA is selected. Then, select View Session and the STI-PA screen will open.
Figure 6-27: Post CAP-1 applied during STI-PA test
CAP-1 Press first softkey to assign a captured curve name (i.e., CAP-1, CAP-2, CAP-3, or CAP-4)
Capture Press Capture softkey to save the background noise/SPL.
Curve indicator
POST CAP-1 The selected Captured Curve, i.e., CAP-1, will appear on the STI-PA screen. To change the Cap-x, repeat steps 1-2 above.

109 Speech Intelligibility STI-PA results screens
Models SE and DL
4. Press the Run/Stop key while playing the test signal in the appropriate location/zone. The captured curve will automatically calculate with the STI-PA results.
NOTE: press the left/right arrow to view the modulation screen and/or the modulation envelope screen if desired.
STI-PA test results screen

110 Speech Intelligibility STI-PA results screens
Models SE and DL
This page left blank intentionally

Files STI-PA results screens
111
Models SE and DL
Viewing Past Measurements This chapter explains how to view your past sessions and studies. It will also explain how to rename your sessions/studies and how to clear/reset the data on the memory card.
Files A session file is automatically created when you begin the first study in that session. It contains the following types of information, as applicable: • Measurements - Measurements for each study in the session and
overall measurements for the session. • Run times - Run time for each study in the session and overall for the
session. If back-erasing was used for a study (“Back-erasing”), the run time for that study will be reduced by the duration of the back-erased segment.
• Analysis type - The analysis type selection, if available in your
instrument, that applied when the measurements were made. • Calibrations - If performed, Pre-Calibration results for the session and
Post-Calibration results for studies in the session. • Logged data - Stored with the session if the instrument contains the
logging option and logging was enabled for at least one measurement. • Parameters - All user-adjustable settings in setup screens that are
involved in the data processing that leads to the measurements. • Instrument settings - All user-adjustable settings in setup screens that
affect the operation of the instrument, but not including those in the Time- Date, Sig. Input and Battery Check screens.
File directories Files on the memory card are stored in directories. Session files are
CHAPTER
7
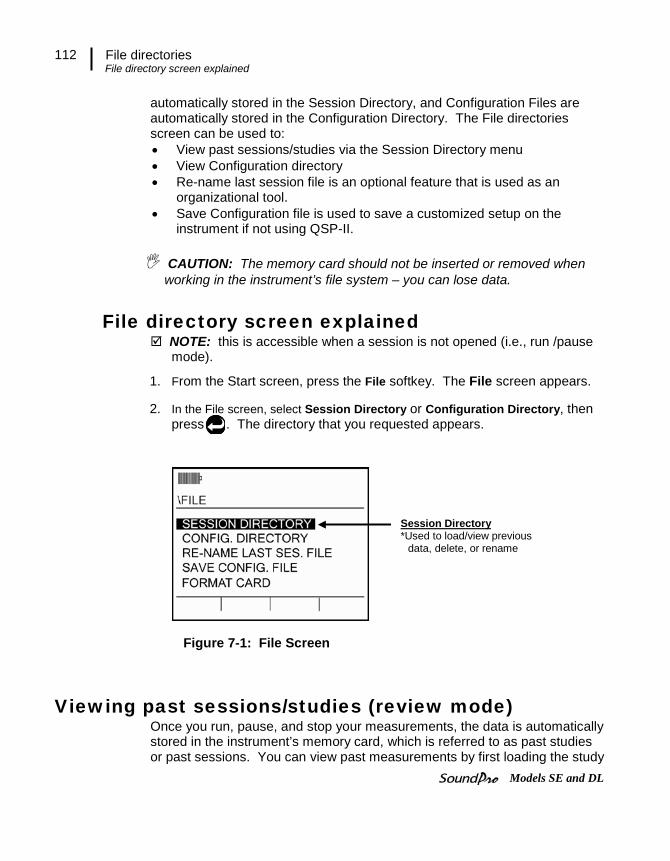
File directories File directory screen explained
112
Models SE and DL
automatically stored in the Session Directory, and Configuration Files are automatically stored in the Configuration Directory. The File directories screen can be used to: • View past sessions/studies via the Session Directory menu • View Configuration directory • Re-name last session file is an optional feature that is used as an
organizational tool. • Save Configuration file is used to save a customized setup on the
instrument if not using QSP-II. CAUTION: The memory card should not be inserted or removed when
working in the instrument’s file system – you can lose data.
File directory screen explained NOTE: this is accessible when a session is not opened (i.e., run /pause
mode).
1. From the Start screen, press the File softkey. The File screen appears.
2. In the File screen, select Session Directory or Configuration Directory, then press . The directory that you requested appears.
Figure 7-1: File Screen
Viewing past sessions/studies (review mode) Once you run, pause, and stop your measurements, the data is automatically stored in the instrument’s memory card, which is referred to as past studies or past sessions. You can view past measurements by first loading the study
Session Directory *Used to load/view previous
data, delete, or rename
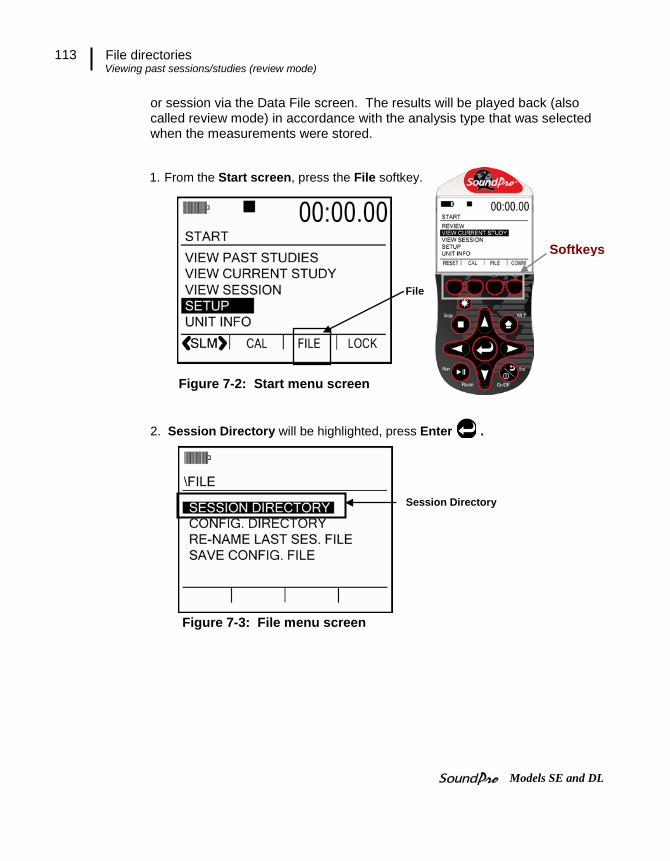
File directories Viewing past sessions/studies (review mode)
113
Models SE and DL
or session via the Data File screen. The results will be played back (also called review mode) in accordance with the analysis type that was selected when the measurements were stored.
1. From the Start screen, press the File softkey.
Figure 7-2: Start menu screen
2. Session Directory will be highlighted, press Enter .
Figure 7-3: File menu screen
File
Session Directory
Softkeys

File directories Viewing past sessions/studies (review mode)
114
Models SE and DL
3. In the Data File screen, press Arrows to select one of the saved
sessions and press Enter (to load the file).
Figure 7-4: Data File screen
4. It will state “Loaded”. Press either Enter or On/Off/Esc key.
5. In the Start screen, the review indicator appears. Select either View Session or View Current Study (by pressing and ).
Figure 7-5: Selecting past study data (review mode)
Press “Load” softkey
Data file
View current study is selected. Press enter to view data.
Review mode - when both Pause and Stop indicators appear, this signifies you can view your saved session or study.
Run time

File directories Loading and deleting files
115
Models SE and DL
6. A bar chart or a filtered bar chart may appear (depending on your
measurement setting). Press Enter to view various measurement screens.
Figure 7-6: Viewing past data example
7. Press Stop key to exit Review Mode. (The Pause icon will disappear leaving only the Stop indicator displayed on your screen.)
Loading and deleting files As you are working with loading past files and possibly deleting files which have been imported into QSP-II, it is important to note that the delete operations take place as soon as you press the respective softkey. While you can re-load a file, you cannot un-delete a file, so be careful. (Loading and deleting files is accessed via the File softkey\Session Directory menu.)
Loading or deleting a file 1. From the start screen, press the File softkey. 2. In the File menu, ensure Session Directory is highlighted (if it is not,
press until it is selected.) Press key. 3. To load a file, press to select the appropriate file and press Load
softkey (see “b”) or press key (skip this step if you are deleting a file).
File path – indicates the name of session/study, the analysis type (SLM, 1/1, 1/3)
Bar chart (SLM mode) results
Review mode indicator

File directories Session directory
116
Models SE and DL
4. To delete a file (if not applicable see step five), press to select appropriate file and press Delete softkey (see “a”). (The display will state the file was deleted.) Press key to return to the Data File screen. To delete more files, repeat this step. Press repeatedly to return to the start screen.+
Figure 7-7: Loading and deleting files
NOTE: You may have dozens of files saved. Press the More softkey to expand the file list for the appropriate selection.
5. If you loaded a file, please see next section, “Viewing past sessions/studies”.
Session directory The Session Directory contains the past saved sessions and studies. To navigate to this screen, select Setup\File softkey\Session Directory menu. (Refer to Figure 7-2 and Figure 7-3 for screen examples.)
Figure 7-8: Examples of directory screens
Data File screen • Retrieve your past session/studies
by selecting a file.
a b c
Softkey menus
Softkeys Delete (a), Load (b), More (c)

File directories Session directory
117
Models SE and DL
Navigating in a session/config. directory Press any arrow key to move around in the directory. If there are multiple files, press the More softkey to navigate to additional screens. Press On/Off/Esc key to return to previous screen(s).
Naming and renaming files There are common procedures that you can use to name and rename files, including a lookup capability that allows you to determine if a filename is already in use.
You cannot rename a session file unless it is in the instrument’s memory. Accordingly, you can rename the closed session currently residing in memory, but you must first load a past session file before you can rename it. NOTE: For past sessions, please follow these steps but first load the file.
Renaming the session in memory 1. In the Start screen, press the File softkey. The File screen appears. 2. Press to select Re-name Last Session File, then press . The session file renaming screen appears. 3. In the File Name screen, press and the following changes will occur:
• The highlighted cursor moves to the field of one of the four softkeys, depending upon the last character in the existing filename.
• The last character in the filename is underlined.
Figure 7-9: Naming a file in the Data File screen
4. Take the following actions to change the underlined character: • Press to move sequentially until the appropriate character is selected.
The underlined character in the name changes as you press the keys. • (Optional Shortcut): Press a softkey to select a different character set.
• Press Enter to add another field.
• Press Up/Down arrows to change character
• Softkeys may be used to quickly select a letter/number character.
• Or repeatedly press Up/Down Arrows to select appropriate character.

Configuration directory Saving (& naming) setup file (config. file)
118
Models SE and DL
• Add a character by pressing the right arrow key. • Delete a character by pressing the left arrow key. • Repeat this step as necessary.
5. When finished, press and Save will appear. 6. Press to save the file name (or press On/Off/Esc to cancel).
Configuration directory File Setups, or File Configurations, can be saved to the instrument in order to save and reuse for future. (This can also be performed via QSP-II when you save a setup.) The naming/renaming procedure below includes a lookup utility that you can use to determine what name to assign.
Saving (& naming) setup file (config. file) When saving a setup, you first select the settings and then save via the Save Config File (accessed from the File softkey in the start menu.) Once a configuration is saved, you can view or delete it via the Config. Directory. Naming and Saving set-up 1. Ensure the SoundPro is in Stop mode and the parameters are selected.
(See Chapter 3 and Chapter 4 for details.) 2. In the Start screen, press the File softkey and select Save Config. File. 3. In the Setup File screen, press to move to the name/rename file field.
Figure 7-10: Saving/Creating setup file (config. file)
Name/Rename file Save Press on/off/esc to move to this field
Press a softkey to quickly select a character set. Then, press up/down arrows.
Selected character (indicated by the underline). Press up/down to change character. Press Left arrow to move to add another character. Press Right to delete or change a character.

Configuration directory Viewing, loading, deleting setup files (config.)
119
Models SE and DL
4. To change the file name follow below:
• Press to change the selected character (denoted by the underline).
• Optional Shortcut: press a softkey (has a character range) and then press to quickly move to the appropriate value.
• Press Left arrow to delete a character (or move backwards). • Press Right arrow to add a character. • Repeat as necessary.
5. To save your setup, press the On/Off/Esc and the Save option will be highlighted. Press Enter key to save (or press On/Off/Esc key to cancel).
Viewing, loading, deleting setup files (config.) Viewing, loading, deleting setup files 1. Open the Configuration Directory screen (follow steps 1-2 above ,
“Saving setup file”). 2. The Setup File screen will appear. Depending on what setups you
saved, these will appear in this screen. 3. To Load or Delete a file configuration, do the following:
• Select a file you wish to load/delete (by pressing up/down arrow until selected.)
• Once selected, press either the Load softkey (to load and apply the saved setup) or press Delete (to delete a setup).
• Press On/Off/Esc to repeatedly to return to the Start screen.
Figure 7-11: Viewing, loading, deleting setup files
Load softkey Once selected, it will apply the saved setup.
Delete softkey Select a set-up then press Delete softkey

Memory card Compatibility
120
Models SE and DL
Memory card The memory card supplied with the instrument is used to store session and configuration files. If you run studies and sessions without a memory card, it will not store session files. In that case, running a session will automatically overwrite the information in the instrument’s memory from the previous session. Essentially, lack of a memory card converts a multi-session instrument into a single session instrument.
Compatibility Steps have been taken to make sure the SoundPro is compatible with as many SD cards as possible. Because of the many SD card manufacturers and the varying low-level formats they use, 3M can only guarantee operation with cards available from 3M. If using a memory card with 2GB or less, FAT 16 format is required. For cards ranging from 2GB to 32GB, a FAT 32 format is required. Determining the format of an SD card 1. Insert the card in the computer’s card reader drive. 2. Open Windows Explorer. 3. Right-click on the CD drive listed under My Computer. 4. From the right-click menu, select Properties. 5. On the General Tab, the File System field identifies the card’s format.
Formatting a card with the SoundPro The SoundPro has the capability of doing a Quick Format or Full Format. A Quick Format is all that is required in most cases to format a card in FAT 16 or FAT 32. A Full Format will verify each sector of the card as it formats with the penalty of taking much longer. CAUTION: A Quick Format may be used to delete all files from the card.

Communicating with a PC Using Detection Management Software DMS
121
Models SE and DL
Communicating This chapter covers issues related to the memory card, the USB port and the AC/DC outputs.
Communicating with a PC
Using Detection Management Software DMS When you download the data via the the download feature, the data is stored and viewable via the data finder page with advanced charting, tables, and reporting capability. The information is viewed in customizable graphs and/or charts in the panel layout page.
Using an external card reader DMS can import data/configurations with an external SD card reader. You should never remove a card from a reader without first ejecting it from the drive. Eject using the following Windows procedure.
Eject procedure 1. In the computer, right-click the Removable Disk entry under My
Computer. A menu appears. 2. Click Eject in the right-click menu.
Working with measurement data in DMS The downloading of data enables you to analyze your data in customizable charts and graphs with reporting capability. with optional reporting capability. Note: please reference the online DMS User Manual under Help menu, DMS user manual for
more information.
CHAPTER
8

AC/DC output Using Detection Management Software DMS
122
Models SE and DL
DMS and working with SoundPro data
Viewing data and Data Finder Page
1. Communicating/connecting the Edge to the pc
A. Turn On the Sound Pro. B. Plug in USB cable from SoundPro to pc.
3. SoundPro and downloading A. Select the SLM family and the SoundPro mode from the
Instrument window (see A). Click on “Go to session finder after download” box.
B. Click the button (See B).
C. Once downloaded, click the Data Finder tab (if you did not select “go to session finder in step A”.) (See C).
A
2. DMS Welcome page and instrument communication A. Click on icon (see A) to access the Instrument download panel.
4. Selecting and viewing data A. The Data Finder page (see A) is used to view, select, and
preview reports. Note: Click Browse to view all data files. B. Select the data by clicking on either the session/study (Note:
you may need to expand to see the study data. C. To view in Graphs and Tables, click on or buttons.
B
A Data Finder page
A
5. Viewing Data in graphs & tables & Report View The graphs and tables page is noted as the panel layout view page.
A. The session/study data page displays the data in logged data charts/tables (see A).
B. Click on to view the panels in a report format (see B).
A
B
C

AC/DC output AC output
123
Models SE and DL
AC/DC output Output signals are available at the AC/DC jack in the hardware interface panel at the base of the instrument (“Hardware interfaces” on page 6). Users are responsible for providing the cable to attach to this jack. For information about the pinout, see “AC/DC jack” on page 134.
AC output The AC output is the amplified SPL of Meter 1. It is weighted depending on the "A, C, Z or F" selection for Meter 1. The maximum full-scale output voltage occurs near the upper dB level of the selected range and is approximately 3.16 volts "before clipping." The full usable range of this output is 60 dB. The relationship is shown in Table 8-1.
Relative dB Output (Vrms) Full scale 3.16
-10 dB 1.00 -20 dB 0.316 -30 dB 0.100 -40 dB 0.0316 -50 dB 0.0100 -60 dB 0.00316
Table 8-1: AC output
NOTE: The AC output signal is not intended to be used for testing instrument performance.
DC output The DC output has a voltage range between 0 and 4.0 VDC that is produced by Meter 1 and includes the time response and frequency weighting settings for that meter. It represents and tracks the displayed dB level in one second increments. The DC output is linearly scaled over the range of –20 to 180 decibels. The highest level that can be represented on any selected range is always the ceiling of that range and depends upon the selected microphone model.
The DC output voltage level is related to the measured decibel value without regard to the range setting. You can calculate the SPL in decibels from the DC output voltage, VDC, by this equation:
SPL = 50 (VDC – 0.4) dB

AC/DC output DC output
124
Models SE and DL
This page left blank intentionally

Appendix A
125
Models SE and DL
Specifications Conformance to standards
Acoustics IEC 61672-1 (2003) (2002-05) - Electroacoustics, Sound level meters, Part 1: Specifications. IEC 61672-2 (2003-04) - Electroacoustics, Sound level meters, Part 2: Pat-tern evaluation tests. IEC 61260 (1995-08) - Electroacoustics, Octave-band and fractional-octave- band filters. ANSI S1.11-2004 - American National Standard “Specification for Octave- Band and Fractional-Octave-Band Analog and Digital Filters.” ANSI S1.4-1983 (R2001) - American National Standard “Specification for Sound Level Meters.” ANSI S1.43-1997 (R2002) - American National Standard “Specifications for Integrating Averaging Sound Level Meters.” Earlier standards - IEC 60651 and IEC 60804.
EMC emissions and immunity Pending testing on production products.
References Air temperature: 23 C Static pressure: 101,325 kPa Relative humidity: 50% Level: 114 dB Frequency: 1 kHz Microphone Capacitance: 18 pf Microphone Sensitivity: -28 dB Range: 140 dB Angle: 0
Mechanical characteristics Housing - Stainless fiber-filled ABS/polycarbonate with internal EMC shielding.
APPENDIX
A

Appendix A
126
Models SE and DL
Size - 7.9 cm(W) X 28.2 cm (H) X 4.1 cm (thick); (with preamp and microphone) 3.1"(W) X 11.1"(H) X 1.6" (thick) (with preamp and microphone)
• The width is measured across the face of the instrument. The length, which includes the preamplifier but not the microphone, is measured along the longest axis of the instrument.
Weight - 0.54 kg (1.2 lbs), including batteries. Tripod mount - Threaded insert on the back of the instrument. Accepts a 1/4"-20 screw.
Electrical characteristics While the instrument is operating from battery or external power it conforms to all applicable tolerance limits of the stated standards. While operating on battery power alone the instrument will automatically shut down when the battery power is depleted. The total battery voltage range is between the maximum overcharge voltage of the NiMH cells 6.6 volts and the low voltage automatic shut down voltage of 4.4 volts.
Power sources
Internal power Approximately 8 hours of continuous operation at normal mode of operation under reference environmental conditions when full capacity batteries are installed. Main batteries - Four, replaceable alkaline AA batteries included as original equipment. Rechargeable NiMH batteries available as an option.
• Battery life (Constant run without backlighting) - Varies greatly depending on whether alkaline or NiMH batteries are in use and the logging configuration. You can expect the longest battery life when using rechargeable 2700 mAH (or greater) cells. Battery life is slightly shorter in units that contain either filter option.
• Battery life (Constant run with backlighting) - Will reduce battery life by approximately 10%.
Auxiliary battery - Internal battery protects against loss of settings when the main batteries are being replaced.
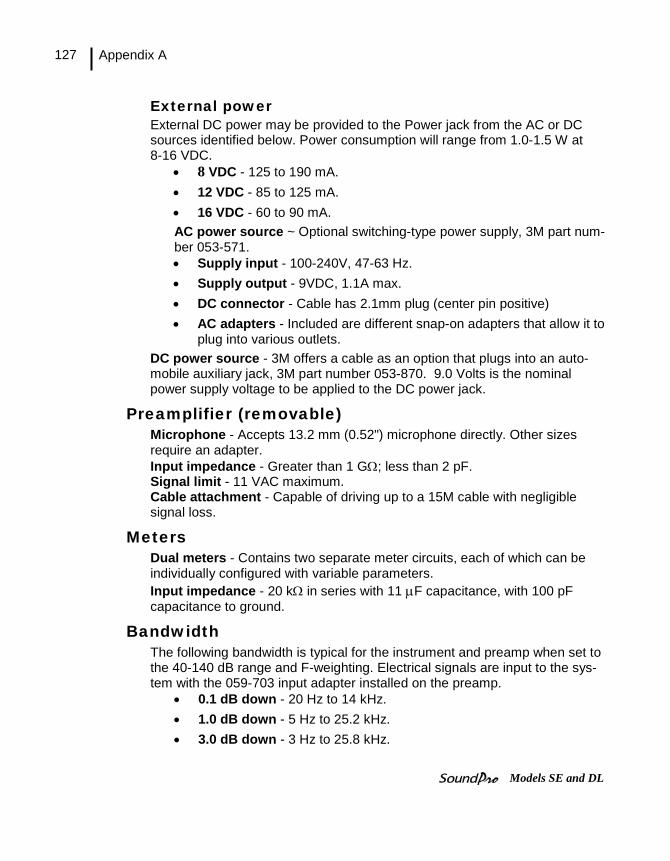
Appendix A
127
Models SE and DL
External power External DC power may be provided to the Power jack from the AC or DC sources identified below. Power consumption will range from 1.0-1.5 W at 8-16 VDC.
• 8 VDC - 125 to 190 mA. • 12 VDC - 85 to 125 mA. • 16 VDC - 60 to 90 mA. AC power source ~ Optional switching-type power supply, 3M part num-ber 053-571. • Supply input - 100-240V, 47-63 Hz. • Supply output - 9VDC, 1.1A max. • DC connector - Cable has 2.1mm plug (center pin positive) • AC adapters - Included are different snap-on adapters that allow it to
plug into various outlets. DC power source - 3M offers a cable as an option that plugs into an auto-mobile auxiliary jack, 3M part number 053-870. 9.0 Volts is the nominal power supply voltage to be applied to the DC power jack.
Preamplifier (removable) Microphone - Accepts 13.2 mm (0.52") microphone directly. Other sizes require an adapter. Input impedance - Greater than 1 GΩ; less than 2 pF. Signal limit - 11 VAC maximum. Cable attachment - Capable of driving up to a 15M cable with negligible signal loss.
Meters Dual meters - Contains two separate meter circuits, each of which can be individually configured with variable parameters. Input impedance - 20 kΩ in series with 11 µF capacitance, with 100 pF capacitance to ground.
Bandwidth The following bandwidth is typical for the instrument and preamp when set to the 40-140 dB range and F-weighting. Electrical signals are input to the sys-tem with the 059-703 input adapter installed on the preamp.
• 0.1 dB down - 20 Hz to 14 kHz. • 1.0 dB down - 5 Hz to 25.2 kHz. • 3.0 dB down - 3 Hz to 25.8 kHz.

Appendix A
128
Models SE and DL
Octave filters (optional) Number of bands ~ Eleven bands, with center frequencies (fc) ranging from 16 Hz to 16 kHz. The octave filters are flat within < 0.3 dB in each passband. The half-power points are at 0.707 fc and 1.414 fc. Octave skirts ~ With respect to fc:
• fc/2 frequencies - Approximately 20 dB down. • 2fc frequencies - Approximately 30 dB down. • fc/10 frequencies - Approximately 70 dB down. • 10fc frequencies - Approximately 95 dB down.
Third-octave filters (optional) Number of bands - Thirty-three bands, with center frequencies from 12.5 Hz to 20 kHz. The 1/3 octave filters are flat within <0.3 dB in each passband. The half-power points are at 0.89 fc and 1.12 fc. Third-octave skirts ~ With respect to fc, the fc/2 and 2fc frequencies are both approximately 50 dB down.
Instrument noise Noise floor depends upon which microphone is being used. The following measurements are for a typical instrument, with the 059-703 adapter (18 pF) connected to the preamp and shorted at the BNC end. This condition closely simulates the noise floor of a ½-inch microphone. For these measurements, the instrument was set to the lowest range and to a slow response time.
• 22 dBA. • 30 dBC. • 35 dBZ. • 40 dBF.
Environmental effects The typical time interval needed to stabilize after changes in environmental conditions is 5 minutes for each 10 C change.
Temperature Operating - Less than ±0.5dB effect over -10 oC to 50 oC (14 oF to 122 oF). Storage - 25 oC to 70 oC (-13 oF to 158 oF).

Appendix A
129
Models SE and DL
Humidity 10% to 90% RH (non condensing).
User interface Display
Size - 128 x 64 pixel display that measures 6 cm x 4.8 cm (2.4" x 1.9"). Lighting ~ Transflective to take advantage of ambient lighting plus fiberoptic backlighting that can be manually operated or set to turn off after a timed interval.
Keypad Construction - Molded layer that holds fourteen press-sensitive buttons. Buttons - Five buttons have dedicated control functions, another five are pri-marily used for selection and navigation, and another four provide variable functions when they are defined in the display (softkeys).
Languages English, Spanish, German, French, Italian and Portuguese.
Input/output Memory card ~ Removable Secure Digital (SD) data storage device that is inserted in a slot at the base of the instrument. Stores measurements made in studies and sessions in session files. If the instrument has a logging option installed and is logging measurements, the logged values are stored in the applicable session file as well. The card also stores configuration files.
Microphones The following specifications apply to microphones connected to the instru-ment. QE7052 - Free-field, Class/Type 2, (standard), low cost ½-inch diameter (.52"), electret (200 volts must be set to “Off”) BK4936 - Free-field, Class/Type 1, (standard) ½-inch diameter (.52"), elec-tret (200 volts must be set to “Off”) QE4110 - Free-field, Class/Type 1 (optional) ¼-inch diameter (.276"), con-denser (200 Volts must be set to “On”). Use for very high dB level free-field measurements. Requires a special preamp to handle high levels. Please contact 3M. QE4130 - Free field, Class/Type 1 (optional), ½-inch diameter (.52"), con-

Appendix A
130
Models SE and DL
denser (200 volts must be set to “On”). Use for general, higher-level, free- field measurements. QE4150 - Free-field, Class/Type 1 (optional) ½-inch diameter (.52"), con-denser (200 volts must be set to “On”). Use for general free-field measure-ments. QE4170 - Pressure, Class/Type 1 (optional), 1-inch diameter (.938"), con-denser (200 volts must be set to “On”). Use for coupler measurements, audi-ometer calibration, low-frequency measurements, low level measurements (due to low noise floor) or as a laboratory standard.
Characteristic BK4936 QE7052 QE4110 QE4130 QE4150 QE4170 Accuracy Class 1 Class 2 Class 1 Class 1 Class 1 Class 1 Polarization Electret Electret 200V 200V 200V 200V Diameter (inches) ½ ½ ¼ ½ ½ 1 Response characteristic
Free- Field Free- Field Free- Field Free- Field Free- Field Pressure
Frequency response (± 2 dB)
8 Hz to 20 kHz 20 Hz to 17 kHz
20 Hz to 24.5 kHz
5 Hz to 24.5 kHz
5 Hz to 20 kHz
3 Hz to 10 kHz
Sensitivity (dBV) -28 -29 -49.1 -36 -26 -26 Sensitivity (mV) 40 35 3.5 15.8 50 50 dB noise (1 kHz third- octave band)
0 0 - 10 0 -1
dBA noise 22 22 - 32 22 18 dBC noise 31 31 - 41 31 21 dBZ noise 35 35 - 45 35 25 dBF noise 40 40 - 50 40 33 Mic range dBA min. (recommended)
27 27 60 37 27 23
dB Peak 142 143 167 150 143 140 Nominal capacitance (pF)
12 15 6.5 18 18 60
Part number 059-523 056-317 059-413 058-659 058-489 058-488
AC/DC outputs Connector - One 3.5 mm stereo plug connector for both AC and DC outputs. AC output ~ Meter 1 output, and includes the frequency response setting for that meter. The AC output is affected by the instrument’s range setting.
DC output - Meter 1 output, and includes the effects of the time response and frequency weighing for the meter.

Appendix A
131
Models SE and DL
Communications ports Auxiliary - For trigger signals and RS-232 communication. USB - Mini USB connector. This port is used for data and file transfers between the instrument and a personal computer.
Measurements Types
SPL measures - SPL, Average value (Lavg or Leq), Maximum value (LMx), Minimum value (LMn), Peak value (LPk). Noise dosimetry - Sound Exposure Level (SEL), Time Weighted Average (TWA), Projected TWA (PTWA), Taktmaximal (TAKTMX), Dose, Projected Dose (PDSE), Exposure (EXP). Community noise dosimetry - Exceedance (Ln), Day-Night average (Ldn), Community Noise Exposure Level (CNEL), SPL difference for “C” and “A” time response settings (Lc-a). Overload Time (OL) - The percentage of time over the OL setting.
Ranges Broadband - Eight selectable ranges of 90 dB each. Filtered - Eight selectable ranges of 80 dB each.
Measurement parameters Response time - Fast, slow and impulse. Frequency weighting - A, C, Z and F (flat). Threshold - 10 to 140 dB or OFF. Exchange Rate (ER) - 3, 4, 5 and 6 dB. Criterion Level (CL) - 40 to 100 dB. Upper Limit (UL) - 10 to 140 dB. Projected Time - 1 to 24 hours.

Appendix A
132
Models SE and DL
Other Maximum peak level - 3 dB over the full scale reading.
Calibration Pre-calibration - When performed, valid prior to the start of a session. Post-calibration - When performed, valid for the previous study in the ses-sion. Storage - All calibrations for a session are stored in the related session file. Calibrators - All 3M Calibrators have an output of 114dB at 1 kHz, and some may have other settings. See “Preparing to calibrate” in Chapter 6) or additional information about calibrators.
Studies and sessions Run-time clock - Duration of every run and session shown in screens as well as added to the session file. Manual operation - Run, Pause and Stop keys. Programmed operation - Three Auto-Run modes:
• Date (four options). • Day of the week (any time on any day). • Timed (future start time).
Triggered runs - Trigger on measured SPL or on external input. Triggers can start a study, then either pause in the session or stop the session. Triggered outputs - Output logic signals related to run status.
Special features Security
Runs - Prevents the pausing of a study without first providing a 4-digit code. Setups - Prevents the changing of settings without first providing a 4-digit code. Codes - Run and setup security can use different codes.

Appendix A
133
Models SE and DL
Back-erase Erasing - Up to 20 seconds of sampled SPL data can be removed from the end of the last study. When removed, all calculations based on the removed segment of data are immediately updated. Editing - The length of the back-erased segment can be edited. Storage - Data removed by back-erasing is retained in the session file.
Logging (optional) Measurements - User-selectable for each of the two meters. Includes two measurements of exceedance for Meter 1 (only for logging intervals equal or greater than one minute). With filtering - If a filtering option is installed, either broadband or filtered logging can be selected, where filtered logging will depend upon the analysis type setting for the session. Logging interval - User-selectable from among 11 settings ranging from 1 second to one hour.
Part numbers Replacement parts Part Number Description 053-840 SoundPro SE/DL Class 1 BK4936 microphone kit (BK4936 microphone,
056-990 microphone-to-calibrator adapter and 059-344 windscreen). 053-841 SoundPro SE/DL Class 2 QE7052 microphone kit (QE7052 microphone,
056-990 microphone-to-calibrator adapter and 059-344 windscreen). 053-700 SoundPro SE/DL standard preamp.
017-524 SD card.
053-575 SoundPro SE/DL USB cable to pc.
056-164 Wrist strap, 1/4" - 20.
058-115 WS-3 windscreen for 1.0" microphone. Package of 3.
059-344 WS-7 windscreen for 0.5" microphone. Package of 3.
WS-307-5 Windscreen for 0.25" microphone. Package of 5.
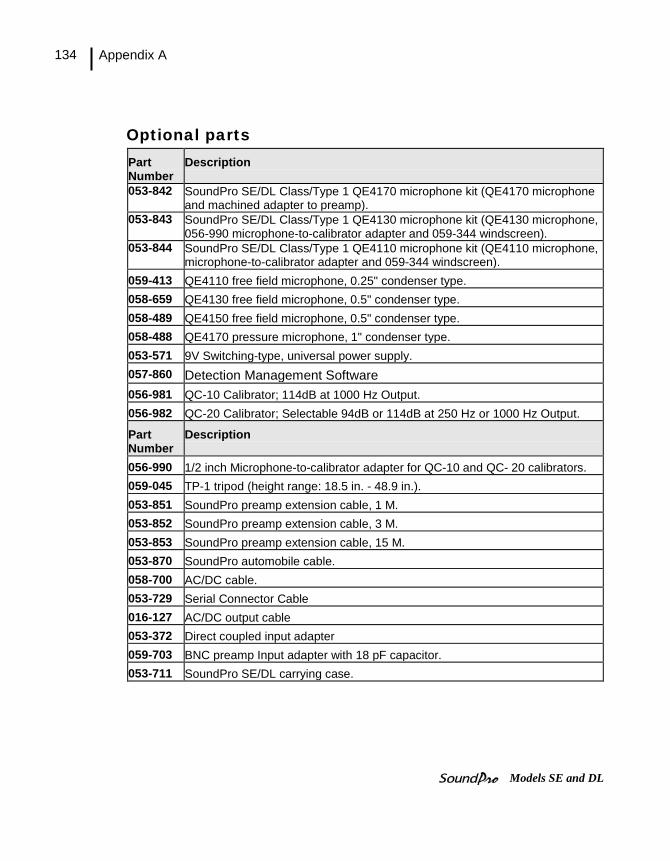
Appendix A
134
Models SE and DL
Optional parts Part Number
Description
053-842 SoundPro SE/DL Class/Type 1 QE4170 microphone kit (QE4170 microphone and machined adapter to preamp).
053-843 SoundPro SE/DL Class/Type 1 QE4130 microphone kit (QE4130 microphone, 056-990 microphone-to-calibrator adapter and 059-344 windscreen).
053-844 SoundPro SE/DL Class/Type 1 QE4110 microphone kit (QE4110 microphone, microphone-to-calibrator adapter and 059-344 windscreen).
059-413 QE4110 free field microphone, 0.25" condenser type. 058-659 QE4130 free field microphone, 0.5" condenser type. 058-489 QE4150 free field microphone, 0.5" condenser type. 058-488 QE4170 pressure microphone, 1" condenser type. 053-571 9V Switching-type, universal power supply. 057-860 Detection Management Software 056-981 QC-10 Calibrator; 114dB at 1000 Hz Output. 056-982 QC-20 Calibrator; Selectable 94dB or 114dB at 250 Hz or 1000 Hz Output.
Part Number
Description
056-990 1/2 inch Microphone-to-calibrator adapter for QC-10 and QC- 20 calibrators. 059-045 TP-1 tripod (height range: 18.5 in. - 48.9 in.). 053-851 SoundPro preamp extension cable, 1 M. 053-852 SoundPro preamp extension cable, 3 M. 053-853 SoundPro preamp extension cable, 15 M. 053-870 SoundPro automobile cable. 058-700 AC/DC cable. 053-729 Serial Connector Cable 016-127 AC/DC output cable 053-372 Direct coupled input adapter 059-703 BNC preamp Input adapter with 18 pF capacitor. 053-711 SoundPro SE/DL carrying case.

Appendix A
135
Models SE and DL
Port pinouts
AC/DC jack The pinout for the jack used for the AC/DC signals is displayed below in Figure A-1. This 3.5 millimeter jack is the same type of jack commonly used for stereo outputs in music systems.
Figure A-1: Pinout for the AC/DC output jack
Auxiliary connector The auxiliary connector in the base of the instrument can be used for input and output triggers (See “Triggers”) to receive GPS signals or for RS-232 serial communications. Figure A-2 shows the pinout for the auxiliary connector.
Figure A-2: Auxiliary connector

Appendix A
136
Models SE and DL
Block Diagram for SoundPro

Appendix B
137
Models SE and DL
Glossary of Terms C-A The C-A measurement is an SPL average that enhances the low- frequency components of the sound signal.
Figure B-1: C-A weighting response curve
Center frequency The center frequency of each octave and third octave filter band.
CNEL Community Noise Exposure Level. The accumulated exposure to sound measured in a 24-hour sampling interval and artificially boosted during certain hours. For CNEL, samples taken between 7 p.m. and 10 p.m. are boosted by 5 dB; samples taken between 10 p.m. and 7 a.m. are boosted by 10 dB. The values reported by SoundPro SE/DL ignore the threshold and use a 3 dB Exchange Rate, regardless how those parameters are set.
Criterion Level Criterion Level. The average SPL that would result in 100% dose over the Criterion Time (usually 8 hours).
APPENDIX
B

Appendix B
138
Models SE and DL
CT Criterion Time. At the Criterion Level, the time period over which the resulting dose is 100%. Usually is 8 hours.
dB Sound Level Meters use the decibel as the unit of measure known as Sound Pressure Level (SPL). SPL uses the ratio between a reference level of 20 microPascals (.00002 Pascals) and the level being measured.
SPL = 20 log (measured level/reference level)
Example: the SPL for 1 Pascal is 20 log (1 Pascal/.00002 Pascal) = 94 dB 20 microPascals (.00002 Pascals) is considered the average threshold of hearing.
A whisper is about 20 dB. A normal conversation is typically from 60 to 70 dB, and a noisy factory from 90 to 100 dB. Loud thunder is approximately 110 dB, and 120 dB borders on the threshold of pain.
Dose Related to the Criterion Level, a dose reading of 100% is the maximum allowable exposure to accumulated noise. For OSHA, 100% dose occurs for an average sound level of 90 dB over an 8 hour period (or any equivalent exposure). By using a TWA reading rather than the average sound level, the time period is no longer explicitly needed. A TWA of 90 dB is the equivalent of 100% dose. The dose will double (halve) every time the TWA increases (decreases) by the Exchange Rate.
Example: OSHA uses an Exchange Rate of 5 dB. Suppose the TWA is 100 dB. The dose would double for each 5 dB increase over the Criterion Level of 90 dB. The resulting dose is therefore 400%. If the TWA was instead equal to 80 dB then the dose would halve for each 5 dB below the Criterion Level. The resulting dose would be 25%.
When taking noise samples less that the full workday, dose is an easy number to work with because it is linear with respect to time.
Example: If a 0.5 hour sample results in 9% dose and the workday is 7.5 hours long, then the dose for the full workday would be a 135% dose (7.5 / 0.5 x 9%). This is computed making the assumption that the sampled noise will continue at the same levels for the full 7.5 hour workday.
Dynamic range The range of input amplitudes on any given range setting over which the instrument can produce a meaningful response. The bottom of the dynamic range is the instrument’s Noise Floor for that range setting, and the top of the dynamic range is the maximum input signal that will not overload the instrument on that range setting.
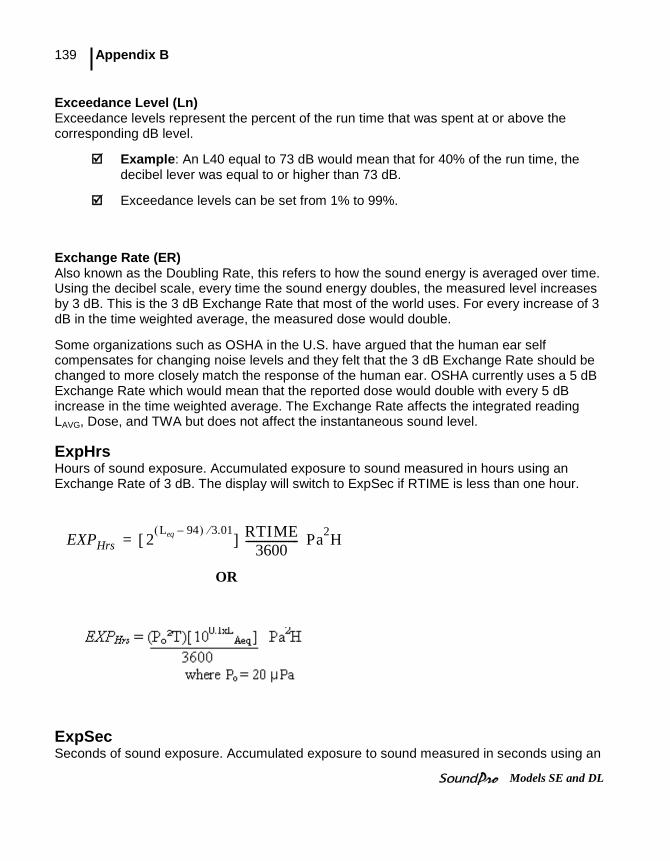
Appendix B
139
Models SE and DL
Exceedance Level (Ln) Exceedance levels represent the percent of the run time that was spent at or above the corresponding dB level.
Example: An L40 equal to 73 dB would mean that for 40% of the run time, the decibel lever was equal to or higher than 73 dB.
Exceedance levels can be set from 1% to 99%.
Exchange Rate (ER) Also known as the Doubling Rate, this refers to how the sound energy is averaged over time. Using the decibel scale, every time the sound energy doubles, the measured level increases by 3 dB. This is the 3 dB Exchange Rate that most of the world uses. For every increase of 3 dB in the time weighted average, the measured dose would double.
Some organizations such as OSHA in the U.S. have argued that the human ear self compensates for changing noise levels and they felt that the 3 dB Exchange Rate should be changed to more closely match the response of the human ear. OSHA currently uses a 5 dB Exchange Rate which would mean that the reported dose would double with every 5 dB increase in the time weighted average. The Exchange Rate affects the integrated reading LAVG, Dose, and TWA but does not affect the instantaneous sound level.
ExpHrs Hours of sound exposure. Accumulated exposure to sound measured in hours using an Exchange Rate of 3 dB. The display will switch to ExpSec if RTIME is less than one hour.
ExpSec Seconds of sound exposure. Accumulated exposure to sound measured in seconds using an
EXPHrs 2Leq 94–( ) 3.01⁄
[ ] RTIME3600-------------------- Pa2H=
OR

Appendix B
140
Models SE and DL
Exchange Rate of 3 dB. The display will switch to ExpHrs if RTIME is greater than 3600 seconds.
Level (LFT) Notation used to represent sound pressure level measurements in IEC/ISO notation, where the measurements are made with particular frequency (F) and time (T) response parameters. For an actual measurement, the F and T parameters are replaced by standardized notation for those parameters.
L_AV Average sound level measured over the run time. This becomes a bit confusing when thresholds are used. Any sound below the threshold is not included in this average. Remember that sound is measured in the logarithmic scale of decibels therefore the average can not be computed by simply adding the levels and dividing by the number of samples. When averaging decibels, short durations of high levels can significantly contribute to the average level.
Example: Assume the threshold is set to 80 dB and the Exchange Rate is 5 dB (the settings of OSHA’s Hearing Conservation Amendment). Consider taking a one hour noise measurement in an office where the A- weighted sound level was typically between 50 dB and 70 dB. If the sound level never exceeded the 80 dB threshold during the one hour period, then the LAVG would not indicate a reading of zero. If 80 dB was exceeded for only a few seconds due to a telephone ringing near the instrument, then only those seconds will contribute to the LAVG resulting in a level perhaps around 40 dB (notably lower than the actual levels in the environment).
L_EQ
The true equivalent sound level measured over the run time. The term L_EQ is functionally the same as L_AV except that it is only used when the Exchange Rate is set to 3 dB and the threshold is set to none.
EXP Sec 2Leq 94–( ) 3.01⁄
[ ] RTIME Pa2S=
Lavg ER log2 2LS ER⁄ td log2 RTIME( )–0
RTIME∫ dB=
Appendix B
141
Models SE and DL
LDN Representing the Day/Night sound level, this measurement is a 24-hour average sound level where 10 dB is added to all of the readings that occur between 10pm and 7am. This is primarily used in community noise regulations where there is a 10 dB “penalty” for night time noise. Typically LDN’s are measured using A weighting, a 3 dB Exchange Rate, and no Threshold.
L_Mn Minimum SPL. Lowest SPL measured over a time interval.
L_Mx Maximum SPL. Highest SPL measured over a time interval.
Logging In sound studies, the saving of measurements at fixed intervals during a study, where each measurement is determined from data processed in the previous logging interval.
L_Pk Peak SPL. This is the highest SPL value obtained during a study or a session. A peak SPL measurement is affected by the frequency response setting but not by the time response setting of the meter.
Octave band An Octave band is defined as a frequency band whose upper band-edge frequency is twice the lower band frequency.
Noise Unwanted sound.
Appendix B
142
Models SE and DL
NCB (Balanced Noise Criterion Curves ) This is the most recent incarnation of the curves based on Beranek’s work (1987). This curve family goes beyond a simple tangency method to try to ensure a more neutral characteristic to the noise spectrum and also accounts for speech interference such as: rumble, rattle, and hiss. NCB was recommended for use with HVAC systems and similar applications and accounts for lower frequency sounds in comparison to NC curves. When setting NCB as the type on the meter, you should use S12.1 unless a local ordinance or similar requirement specifies the use of a tangency technique. (This is usually specified in a standard.)
Noise Criterion Curves (NC) With NC curve evaluation, sound is measured in octave bands in 8 octave bands ranging from 63 to 8000 Hz and is then plotted on the octave band spectrum using a set of curves.
NC curve evaluation uses a tangency method. A tangency method is a process of comparing your measurements to a fixed curve. The correct curve number is the lowest curve that meets or exceeds the measured octave values. Typically, this is used in HVAC applications.
Noise Rating Curves (NR) This curve family is a tangency technique and is used primarily in Europe and Australia. It is used not only for HVAC and machine noise applications, but also in community noise enforcement.
Noise Floor The signal magnitude at the bottom of the instrument’s linear range. Input signals below the noise floor cannot be differentiated from the internal noise of the instrument.
Overload (OL) An overload will occur whenever the input signal exceeds the dynamic range of the instrument.
Pascal (Pa) Unit of pressure equal to 1 Newton per square meter.

Appendix B
143
Models SE and DL
TWA Lavg ER log2PrtCT---------
dB+=
PTWA This is a projected TWA determined for a projected time (Prt) in relation to the Criterion Time (CT) as follows.
Peak –C
The following chart illustrates the range of Sound Level with C-weighted Peak.
Level Range (dB) Peak C Level Range (dB) Level Range (dB) Peak C Level Range
(dB) -20 to 70 42.2 to 73 20 to 110 42.7 to 113 -10 to 80 42.6 to 83 30 to 120 46.7 to 123
0 to 90 41.6 to 93 40 to 130 55.4 to 132 10 to 100 43.4 to 103 50 to 140 66.3 to 142
Preferred Noise Criterion (PNC) Curves The Preferred Noise Criterion Curves, a type of tangency method, was an update to Beranek’s original NC curves that accounted for the lower frequency side of the criterion curves (1971). The PNC curves extended the range to 32 Hz instead of 63 Hz used in NC curves. Projected time (Prt) A time interval used in some calculations, usually different from the actual run time of a study or session.
Reference pressure The sound pressure at the threshold of human hearing, as measured under standard conditions. This generally accepted magnitude of this pressure is 2 × 10⁻⁵ Pascals (Pa).

Appendix B
144
Models SE and DL
Response time (F,S, I)
Selectable time response settings used in SoundPro SE/DL measurements. The response time is a standardized exponential time weighting of the input signal according to fast (F), slow (S) or impulse (I) time response relationships. Time response can be described with a time constant. The time constants for fast, slow and impulse responses are 0.125 s, 1.0 s and 35 ms, respectively. Impulse time response is 35ms rise with a constant decay of 2.9dB/sec.
Figure B-2: Slow response to a tone burst
Figure B-3: Fast response to a tone burst
Burst duration, t (seconds)
Rel
ativ
e re
spon
se (d
B)
Rel
ativ
e re
spon
se (d
B)
Burst duration, t (milliseconds)

Appendix B
145
Models SE and DL
Figure B-4: Impulse response to a tone burst
Room Criterion Curves (RC) Room Criterion curve’s was introduced in 1981 by Blazier to primarily rate noise in offices/room acoustics. This methodology calculates a numerical rating based on speech interference and indicates any interference such as hissing, rumbling, or vibration.
SEL Sound Exposure Level. The continuous SPL lasting one-second that would deliver the same sound exposure as an accumulated exposure determined over a sampling interval (RTime). SEL is typically determined with a 3 dB Exchange Rate, slow exponential time-weighting, and without regard to an Integrating Threshold.
SPL Sound pressure level. A ratio of one sound pressure to a reference pressure (See Reference Pressure on page 141). Because of the enormous dynamic range of the human ear, the ratio is calculated logarithmically by the formula below, where Lr is the reference pressure.
SPL 20 log LLr-----
dB=
SEL ER log2 2L ER⁄ td0
RTI ME∫ dB=
Rel
ativ
e re
spon
se (d
B)
Burst duration, t (milliseconds)

Appendix B
146
Models SE and DL
Taktmx A time average over a sampling interval that uses the highest level occurring during the preceding Taktmaximal Interval, either three or five seconds, and assumes that it was present for the whole Taktmaximal Interval.
Third-octave band A Third-octave band is defined as a frequency band whose upper band- edge frequency is 1.26 times the lower band frequency.
Threshold An SPL value that defines a lower level of acceptable values. Only SPL samples that exceed the threshold are used in some calculations.
TWA Time weighted average. The constant SPL over an 8-hour interval that would produce the same exposure to sound as an exposure measured over a run time sampling interval (Rtime).
Upper Limit (UL) The total time during a study that the SPL exceeds the Upper Limit meter setting.
TWA ER log2 2L ER⁄ td log2 CT( )–0
RTIME∫ dB=

Appendix B
147
Models SE and DL
Weighting (A, C, Z, F) SPL measurements are commonly weighted (scaled) in relation to their frequency components in order to provide a consistent basis for comparison to other measurements of the same type. In addition to the standardized A, C and Z weighting curves, you can select F-weighting (flat) which provides no weighting at all. The four SoundPro SE/DL weighting curves are plotted together in Figure B-5, where the F-weighting curve has been shifted up by 5 dB for graphical clarity. The tolerance limits for F frequency weighting are the same as A, C, and Z frequency weighting.
Figure B-5: All frequency weightings plotted together
Windscreen A covering for a microphone that reduces disturbances caused by wind and direct contact with other surfaces.

Appendix B
148
Models SE and DL
This page left blank intentionally

Appendix C
149
Models SE and DL
Customer service Customer service
Contacting 3M Instrumentation Should your 3M equipment need to be returned for repair or for recalibration, please contact the service department at the following number or access the online form via the website. For technical issues, please contact Technical Support.
Service Department and Technical Support: 1 (800) 245-0779. Fax: 1 (262) 567-4047. Office hours are 8:00 a.m. to 5:00 p.m. United States Central. • E-mail: [email protected] • Internet: www.3M.com/detection
International customers Contact your local, factory-authorized distributor from whom the product was purchased. You can obtain the name and contact information of your local factory-authorized distributor from 3M by using the e-mail, telephone, or fax information given under “Contacting 3M” above.
Calibration The SoundPro and 3M field calibrator devices should be examined regularly by the factory. An annual calibration is recommended. (Please see Service Department above.)
.
APPENDIX
C

Appendix C
150
Models SE and DL
Warranty 3MTM SoundPro Sound Level Meter LIMITED WARRANTY. 3M warrants SoundPro Sound Level Meter will be from free defective materials and workmanship for one year from date of purchase (indicated on the sales receipt), provided it is maintained and used in accordance with 3M instructions and/or recommendations. If any component becomes defective during the warranty period, it will be replaced or repaired free of charge. This warranty does not apply to units that have been altered or had repair attempted, or that have been subjected to abuse, accidental or otherwise. The above warranty is in lieu of all other express warranties, obligations or liabilities. For warranty outside the United States, a minimum of one year warranty applies subject to the same limitation and exceptions as above with service provided or arranged through the authorized 3M distributor or our 3M European Service Laboratory. Foreign purchasers should contact the local 3M authorized sales agent for detail. THE IMPLIED WARRANTIES OF MERCHANTABILITY AND FITNESS FOR PARTICULAR PURPOSE ARE LIMITED TO ONE YEAR FROM THE PURCHASE DATE. 3M shall not be liable for any other warranty, express or implied, arising out of or related to the appropriate use of hearing protection devices. Manufacturer or its agent’s liability shall be limited to replacement or repair as set forth above. Buyer’s sole and exclusive remedies are return of the goods and repayment of the price, or repair and replacement of defective goods or parts.
Index
151
Models SE and DL
APPENDIX D: INDEX
AC/DC Output explained ................................. 122 Port location ............................................ 7
Alternate functions Indicator ................................................ 20
Altf ............................................................. 19 Arrows ....................................................... 19 Attaching calibrator to the SoundPro ......... 62 Audiometric background curves
Setting-up .............................................. 94 Audiometric Background curves
Running ................................................. 96 Auto-Run
Date setting ........................................... 38 Days of week ......................................... 40 Setting date ........................................... 39
Auto-run shutdown screen ........................ 42 Auxiliary
Port location ............................................ 7 Average SPL
Defined; ................................................... 140 Back-erasing
Explained .............................................. 72 Results .................................................. 73
Backlight ................................................... 19 Setting ................................................... 35
Backlight setting ........................................ 35 Balanced noise criterion curves
Defined ................................................ 142 Batteries
Checking or changing ........................... 15 Indicator ................................................ 20 Installing ................................................ 14 Power explained .................................... 15
C-A Defined ................................................ 137
C-A measurement ..................................... 30 Calibrate
About ..................................................... 61 History cal screen .................................. 64 Post-cal ................................................. 61 Pre-Cal .................................................. 61 Steps ..................................................... 62
Calibrating ........................................... 61, 63
Captured curves Running ................................................. 90
Captured curves Applications ........................................... 87 Runing and viewing results .................... 96 Setting up .............................................. 88
Center frequency Defined ................................................ 137
CNEL Defined ................................................ 137
Communications View measurements remotley (log-to-port) ... 53
Contacting 3M ......................................... 149 Criterion curves
Running ................................................. 96 Setting-up .............................................. 92 Types ..................................................... 91
Criterion Level Defined ................................................ 137
CT Defined ................................................ 138
dB Defined ................................................ 138
DC output Explained ............................................. 123
Display ....................................................... 19 DMS
Retrieve data ....................................... 121 Retrieving your data diagram............... 122
DMS Back-erased data .................................. 73
DMS Downloaded......................................... 122 Explained ................................................. 9 Retrieving data .................................... 121
Dose Defined ................................................ 138
Dynamic range Defined ................................................ 138
Enter .......................................................... 19 Exceedance Level (Ln)
Defined ................................................ 139 Exchange Rate (ER)
Defined ................................................ 139

Index
152
Models SE and DL
ExpHrs Defined ................................................ 139
ExpSec Defined ................................................ 139
File Setups(Config) Creating or saving ............................... 118
Files Loading and deleting ........................... 115 Naming/Renaming .............................. 117
FSetup Files (Config) Creating or saving ............................... 118
GPS Explained .............................................. 54 Setting ................................................... 55
Hardware interface ...................................... 6 Indicators
Explained .............................................. 20 Information screen
Explained ................................................ 8 Keypad
Example ................................................ 18 Explained .............................................. 19
L_EQ Defined ................................................ 140
L_Mn Defined ................................................ 141
L_Mx Defined ................................................ 141
L_Pk Defined ................................................ 141
LDN Defined ................................................ 141
Level (LFT) Defined ................................................ 140
Level-triggered Screen explained .................................. 44
Lock screen ............................................... 47 Log -to-Port ............................................... 53 Logging
Defined ................................................ 141 Setup screen ......................................... 32
Measurement Changing Display .................................. 66 Explained .............................................. 29 IEC/ISO ................................................. 57 Octave bands .......................................... 2 Overview ............................................... 58 Range ................................................... 60
Setting measurement type ..................... 26 Third-octave band .................................... 3
Measurements Audiometric background curves ............ 94 Bar chart ................................................ 68 Changing what is displayed ................... 66 Community noise ................................... 69 Criterion curves ..................................... 91 Curves explained ................................... 87 Dosimetry screen ................................... 70 Filtered bar chart ................................... 68 Indicators/descriptors ............................ 67 Navigational screens explained ............. 65 Pause .................................................... 75 Running ................................................. 64 Setting captured curves ......................... 88 STI-PA testing ....................................... 98 Stop ....................................................... 75 Tabulation screen .................................. 71 Time History .......................................... 72
Measures setup screen Gender field ......................................... 100 Post process field ................................ 101
Memory card Slot location ............................................. 6
Memory Card About ................................................... 120 Ejecting ................................................ 121 Formatting ........................................... 120
Microphone Installing ................................................ 12 Installing windscreen ............................. 13
Models ......................................................... 1 Navigating
Keypad .................................................. 21 NCB
Defined ................................................ 142 Noise
Defined ................................................ 141 Noise Criterion Curves (NC)
Defined ................................................ 142 Noise Floor
Defined ................................................ 142 Noise Rating Curves (NR)
Defined ................................................ 142 Octave band
Defined ................................................ 141 On/off/esc

Index
153
Models SE and DL
Identified................................................ 18 Turning off ............................................. 21
Overload Indicator ................................................ 20
Overload (OL) Defined ................................................ 142
Pascal (Pa) Defined ................................................ 142
Past data
Viewing ......................................112 Past Data
Loading and deleting files ................... 115 Pause
Indicator ................................................ 20 Peak –C
Defined ................................................ 143 Power jack
Location .................................................. 7 Power supply
Auto and universal explained ................ 17 Connecting ............................................ 17
Pre-Calibrate history screen ...................... 63 Preferred Noise Criterion (PNC) Curves
Defined ................................................ 143 Projected time (Prt)
Defined ................................................ 143 PTWA
Defined ................................................ 143 Reference pressure
Defined ................................................ 143 Response time
Fast, slow, impulse ................................ 27 Response time (F,S, I)
Defined ................................................ 144 Reverberation
About ..................................................... 77 Impulse noise method ........................... 79 Interrupted noise method ...................... 79 Reverb time (RT60) ............................... 78 Reverb Time example chart .................. 78 RT60 measurement mode..................... 83 RT60 Test ............................................. 82 Setup options ........................................ 80 Setup screen ......................................... 80
Review Indicator ................................................ 20
Review mode .......................................... 113
Room Criterion Curves (RC) Defined ................................................ 145
Run Indicator ................................................. 20 Lock ....................................................... 47
Run Mode security ..................................... 46 Running
Quick help list ........................................ 58 Saving Setup ........................................... 118 Screens, general
Diagram ................................................. 18 Start ....................................................... 16
Screens, setup Battery check ......................................... 16 Comm-Set; ............................................ 54
Screens, time-history/back-erase .............. 72 Screens, viewing
Community noise ................................... 69 Dosimetry screen ................................... 70 File ....................................................... 112 Filtered bar chart ................................... 68 Icons ...................................................... 67 Past Measurements ............................. 115 STI-PA ................................................. 104 Tabulation .............................................. 71 Tabulation screen .................................. 71 Time log ................................................. 72
Screens, Viewing Bart chart ............................................... 68
Screens,viewing Bar chart ................................................ 64
Secure mode Disabling and backup number ............... 49
Secure run About ..................................................... 46
Secure run/setup Setting ................................................... 47
Secure setup About ..................................................... 46
Secure Setup ............................................. 49 SEL
Defined ................................................ 145 Sessions
Explained ............................................... 59 Introduced.............................................. 75 Scenario ................................................ 59
Setup files(Config) Deleting ............................................... 119

Index
154
Models SE and DL
Loading ............................................... 119 Setup files(Config.)
Viewing ............................................... 119 Setup screen
Auto-run with date of week .................... 40 Backlight................................................ 35 Contrast................................................. 36 Display .................................................. 33 Language .............................................. 34 Measaurement type .............................. 26 Meter 1 and meter 2 parameter ............. 27 Time and date ....................................... 25
Setup screens Microphone/signal input ........................ 24
Softkey Lookup .................................................. 66
Softkey buttons ......................................... 19 Softkey menu ............................................ 19 Softkeys
Explained .............................................. 66 SoundPro SE or DL kit .............................. 11 Speech Transmission Index
Explained .............................................. 98 SPL
Defined ................................................ 145 STI-PA
Applying background noise (capture curve) overview ................................... 108 General setup guidelines .................... 100 Modulation envelope screen ............... 106 Modulation screen ............................... 105 Running a study .................................. 103 Setup ................................................... 100
Steps, applying captured curves .......... 108 Viewing result screens ......................... 104
Stop ........................................................... 19 Indicator ................................................. 20
Stop and pause Explained ............................................... 75
Studies Explained ............................................... 59
Study Scenario ................................................ 59
Taktmx Defined ................................................ 146
Third-octave band Defined ................................................ 146
Threshold Defined ................................................ 146
Timed Run ................................................. 43 Triggering
Setting ................................................... 50 Turning off ................................................. 21 TWA
Defined ................................................ 146 Underrange
Indicator ................................................. 20 Upper Limit (UL)
Defined ................................................ 146 USB port location........................................ 6 Weighting .................................................. 27 Weighting (A, C, Z, F)
Defined ................................................ 147 Windscreen
Defined ................................................ 147

Personal Safety Division3M Detection SolutionsISO 9001 Registered CompanyISO 17025 Accredited Calibration Lab1060 Corporate Center DriveOconomowoc, WI 53066Customer Service: 262-567-9157Toll Free: 800-245-0779
3M and SoundPro are trademarks of 3M Company, used under license in Canada. Please recycle. Printed in USA.© 2014 3M CompanyAll rights reserved.053-576 Rev.L 8/14
About Us 3M Detection Solutions is a world class manufacturer of rugged, reliable instrumentation and software systems that help monitor and evaluate occupational and environmental health and safety hazards, including noise dosimetry, sound level monitoring, heat stress, indoor air quality and select toxic/combustible gases. The 3M Detection brand of instrumentation is used by safety and industrial hygiene professionals to help comply with applicable occupational standards and regulations.
About 3M Personal Safety3M offers a comprehensive, diverse portfolio of Personal Safety solutions providing respiratory protection, hearing protection, fall protection, reflective materials for high visibility, protective clothing, protective eyewear, head and face protection, welding helmets, and other adjacent products and solutions such as tactical safety equipment, detection, monitoring equipment, active communications equipment and compliance management. In 2012, 3M celebrated 40 years of safety leadership – recognizing the company’s respiratory and hearing protection solutions introduced in 1972. Visit www.3M.com/PPESafety or http://m.3m.com/PPESafety