sound system design - acoustics today · that the sound is coming from the source, (5) control...
TRANSCRIPT

Sound System Design 23
At the beginning of certain soundsystem design projects there is amoment of panic when the
whole thing seems totally impossible.Usually the difficulties arise from acombination of a challenging acousti-cal environment and complicated clientdemands. At these times it is useful to take a deep breathand review the overall design objectives, which are relative-ly simple: (1) distribute direct sound evenly to the listeningarea, (2) provide adequate intelligibility, (3) deliver suffi-cient level, frequency response, and natural sound qualityfor the intended use, (4) leave the listener with the sensethat the sound is coming from the source, (5) control feed-back at the microphone positions, (6) avoid acousticaldefects such as long delayed reflections, and (7) respect thearchitecture of the space.
Sound system design combines the arts of architecture,audio, and acoustical engineering and can be surprisinglycomplicated. The sound system designer is often asked toprovide a solution in a less than ideal acoustic environmentfor a variety of potential uses. Figure 1 illustrates a goodexample of a challenging project. It is a sketch by the archi-tects, Armando Ruiz and Associates, of their concept of thereconfiguration of a traditional gothic chapel at Mount SaintMary’s College, a small Catholic women’s college in Los
SOUND SYSTEM DESIGNMarshall Long
Marshall Long/AcousticsSherman Oaks, California 91423
Angeles. The existing room had a cruci-form shape with wooden pews facingthe sanctuary. The building has 40-foot-high arched ceilings and is built of stoneand concrete with unpadded woodenpews and tile floors.
It is being redesigned to accommo-date services in the round in keeping with the Vatican IIencyclical that encourages “full active and conscious participa-tion in the liturgy.” The existing pews will be removed, and anew seating configuration installed, which can be rearrangedusing moveable chairs, into any configuration to accommo-date various uses. In addition to traditional Masses with pre-senters located at six different locations distributed throughoutthe space, the room will be used for lectures, working grouppresentations, choral singing, and small musical ensembles.Attendance can vary from 6 to 200 at any given time.
The transmission of speech over the existing sound sys-tem was difficult to understand, as was unamplified speechbeyond about 20 feet. Organ and sacred music sounded won-derful over the existing sound system and the music directordid not want to loose those special qualities. The architectwanted to preserve the existing visual ambience. Not surpris-ingly the budget was small and the time frame short. Thisproject, which was completed in late 2006, serves as a goodexample of the audio design process.
“Vendors should publish the
formulas and assumptions
behind their software.”
Fig. 1. Mount Saint Mary’s College Chapel.

24 Acoustics Today, January 2008
Design approachesSound system design is handled using three basic tools:
(1) loudspeaker selection, placement, and orientation, (2)electronic component selection and utilization, and (3) roomacoustics. Thus, it is important for the designer to be able tocontrol of each of these tools. There are a number ofapproaches to the loudspeaker layout that can be used.Several are shown in Fig. 2 and can be summarized as: (1) useone or more groups or clusters of loudspeakers to cover theroom from a position above the focus of interest, (2) use mul-tiple distributed (usually overhead) loudspeakers positionedrelatively close to the listeners, and (3) use a combination of1 and 2 with electronic delays.
In this church, a cluster solution was inappropriate since itwould be unsightly and inflexible when the source originationpoint was moved. Similarly loudspeakers mounted on the sidewalls were a poor choice, since it would not be possible to con-trol the perceived direction of the sound source. Thus an over-head distributed system remained the best approach. It wouldprovide even coverage, with minimal visual intrusion, whileoffering enough flexibility to maintain source localization.
Sound quality The quality of a sound system is something of an aes-
thetic choice. The simplest aspects—level and frequencyrange—have much to do with the size and type of loudspeak-ers. Larger loudspeakers extend lower in frequency, can han-dle greater power, and provide more directional control thansmaller loudspeakers. Cone loudspeakers sound more realis-tic than horns. Horns are more efficient and have better pat-tern control than cones.
The directivity of a cone loudspeaker at agiven frequency depends on its diameter. Thecoverage (-6 dB) angle is about 90 degrees whenthe wavelength is equal to the cone diameter andnarrower above that frequency. Home stereo sys-tems use small diameter cones to obtain wide dis-persion. Sound reinforcement systems use largearea horns, line arrays, or distributed loudspeak-ers to obtain high direct field levels and goodfeedback control. Cone loudspeakers can nowgenerate relatively high sound pressure levelswith low distortion and excellent fidelity.
Systems used only for speech do not requirelarge transducers. A good example is the tele-phone, where adequate intelligibility can beachieved in a modest space. Music systems, withtheir extended bass requirements, use largerloudspeakers, although in home systems bassdrivers are rarely bigger than 10–12-inches indiameter. Distributed systems for music need 12-inch diameter loudspeakers, often coaxial, tocover the frequency range. Subwoofers, usually15- to 18-inch cones, can be used for bass rein-forcement where organ or other low frequencyinstruments are supported.
Many manufacturers offer high quality cabi-net loudspeakers, with a combination of horns
and cone drivers in a two- or three-way enclosure. Anotherapproach uses a number of small two- or three-way cabinets,each having two or more cones bracketing a high frequencywave guide. These are linked together like tank treads andhung vertically in a line or J-shaped ribbon.
In the chapel it was decided to use 12-inch diametercoaxial loudspeakers in 2 cubic foot cylindrical enclosures.This combination offers excellent frequency response andprovides enough bass for live music and choral singing.Where distributed systems are used, the bass is supported bythe combined area of many loudspeakers so subwoofers maynot be required. Where necessary, 18-inch drivers in individ-ual boxes can be added.
ModelingMost designers use a computer model to assist with the
loudspeaker layout. This has led to the plaintive cry, heardafter installation, “But the computer said it would be OK,”which is why it is important to look behind the curtain andask the Wizard of 0’s (and 1’s) what is in his secret code.Vendors should publish the formulas and assumptionsbehind their software. Otherwise designers have no clueabout what they are calculating. A computer model locatesand orients the loudspeakers, a three dimensional coordinatesystem. An individual loudspeaker is characterized mathe-matically by its sound power, as a function of frequency, andits directivity, as a function of both frequency and direction.The direct field levels are calculated at various receiver loca-tions, based on direction and distance from the loudspeakers.The power and directivity data, furnished by the loudspeak-er manufacturer, are calculated from sound pressure levelmeasurements, taken on the surface of an imaginary sphere
Fig. 2. General types of sound systems (Klepper, 1999).

Sound System Design 25
surrounding the device. Based on these measurements, man-ufacturers publish the directional properties in octave orthird octave bands, expressed as the on-axis sensitivity (thesound pressure level at 1 meter for a 1 watt electrical input),and the change in level in directions other than on-axis.Angular increments of 5 or 10 degrees are most commonlyused. Programs interpolate level values between the meas-urement points. Directivity data, given in standard unen-crypted ASCII files, are the most useful since it allows theraw data to be examined directly.
When loudspeakers are arranged in lines or clusters, theyshould be treated as individual sources by the model. Whenthe sound fields from two loudspeakers overlap, there is aninteraction due to the differences in phase, which createslocal increases and decreases in the received signal. In thesecases the signals from each loudspeaker must be combinedby taking both their level and relative phase into considera-tion. Direct field levels should be calculated in this mannerwhen the sound pressure levels of overlapping sound fieldsare nearly the same.
It is also important to use the sound power levels of indi-vidual loudspeakers to calculate the reverberant field contri-bution, since the phase relationships are not maintained atlarge distances or after many reflections. Programs that bun-dle groups of loudspeakers together and treat them as onesource, do not accurately calculate their reverberant fieldcontribution since the reverberant field sound power level isunderestimated.
CoverageCalculating the direct sound level at each receiver is one
of the main objectives of a computer model. Direct field datacan be presented numerically as sound pressure levels at eachreceiver location, or can be displayed graphically. Thenumeric approach has the advantage of allowing adjustmentof the gain of individual loudspeakers to achieve the most
even coverage. A calculation of the standard deviation of thedirect field level within the intended coverage area is a usefulmeasure of evenness (usually plus or minus 2 dB). Programsshould, at a minimum, calculate levels in the 500 Hz, 1 kHz,and 2 kHz bands. The 500 Hz band is particularly importantfor feedback control since loudspeakers tend to be less direc-tional in this band.
The final design in the Mount Saint Mary’s Chapel isshown in Fig. 3, a drawing of the floor plan with the loud-speakers superimposed. Normally distributed loudspeakersare positioned at an elevation approximately equal to theirspacing but preferably not farther than 20-25 feet above thelistener. In this design they were pointed straight down, butthat is not always necessary. Even where the ceilings are slant-ed, distributed loudspeakers can be used, although the spac-ing depends on the pitch of the ceiling. In this church com-puter calculations yielded standard deviations of 0.8, 1.1, and1.4 dB in the 500 Hz, 1 kHz, and 2 kHz bands, which is satis-factory.
Intelligibility—LivenessEven coverage is not the only goal. Don Davis once
observed that even coverage can be obtained by pointing allthe loudspeakers at the ceiling. The next concern in thedesign is intelligibility, clearly the sound should be intelligi-ble, and this requires pointing the loudspeakers at the listen-ers. One of the traditional measures of intelligibility is thenumber of consonant-vowel-consonant syllables misunder-stood. In early studies listening tests were carried out using agroup of spoken words in a neutral carrier sentence. Theintelligibility was expressed in terms of badness, that is, lossof intelligibility, instead of goodness. Intelligibility metricswere studied at Bell Labs in the 1920’s and 30’s using a singlesource and receiver in listening tests.
Later the intelligibility was expressed in terms of bad-ness, that is, loss of intelligibility in a measure called Liveness.
Fig. 3. Floor plan with loudspeaker layout.

26 Acoustics Today, January 2008
Maxfield and Albersheim, (1947) wrote about the Liveness interms of the ratio of the reverberant-to-direct energy densi-ties times the reverberation time for a source having a direc-tivity of one.
(1)
The familiar reverberation time in metric units is defined in the usual way as
(2)
Intelligibility—Articulation lossIn 1971 Peutz published a formula similar to that previ-
ously found, for the percentage articulation loss of conso-nants or %ALcons. In metric units an equation can be writ-ten in terms of the properties of a room for a single source,having a directivity of 1.
(3)
It is intuitive that when the receiving room is highlyreverberant, speech is more difficult to understand. Thestandard practice is to use the 2000 Hz octave band to calcu-late the articulation loss of consonants. Values less than5–10% are considered good.
Intelligibility—Signal to noise ratioWhile there are many ways of measuring intelligibility,
they are all based on some sort of signal-to-noise ratio.Different metrics use different definitions of what constitutesthe signal and what constitutes the noise. The consensus isthat the direct signal (or most of it) is good for intelligibilityand the reverberant noise (or most of it) is bad for intelligi-bility, and a ratio of the two is a measure of how good or badthe intelligibility is.
Notice that noise, other than the reverberant field, is leftout of this discussion to make things easier, even though it,too, is bad.
The articulation loss formula is relatively easy when thereis only one source. Early pioneers converted levels into dis-tances to make the comparison easier. When there are multiple
loudspeakers of different types, with different gains, distancesbecome awkward to use. Under these conditions, the simpleform of the articulation loss equation can no longer be used.
Fortunately %ALcons can also be expressed in terms of asignal to noise energy ratio, or rather the noise to signal ener-gy ratio times the reverberation time (Bistafa and Bradley,2000). This allows us to apply it to complex sound systems.
(4)
There are more complex versions of this relationship thatinclude extraneous noise and extend the formula to long dis-tances, but for our purposes this will suffice.
Another approach is to use raw signal to noise ratios inseveral octave bands. For our purposes the signal is the com-bined direct field level from all loudspeakers and the noise isthe combined reverberant field level from all loudspeakers.With these assumptions
(5)
In this metric the signal and the noise are expressed asenergies, both of which are steady state values. There is noconsideration of when the signals arrive or how they havereflected. We rely on the relative levels to sort this out.Loudspeakers contribute to the useful energy only to theextent that the levels they produce affect the direct field levelat a particular receiver.
Table 1 (Long, 2006) shows a chart of steady state signal-to-noise ratios which can be used to judge how intelligible asystem will be. The comparisons are made in three octavebands centered at 500, 1k, and 2k Hz.
In almost all locations in a room the calculated reverber-ant field levels are higher than the direct field levels, but evenin these areas, good intelligibility can be achieved. By com-paring signal to noise ratios in several octave bands we havea useful tool for sound system design.
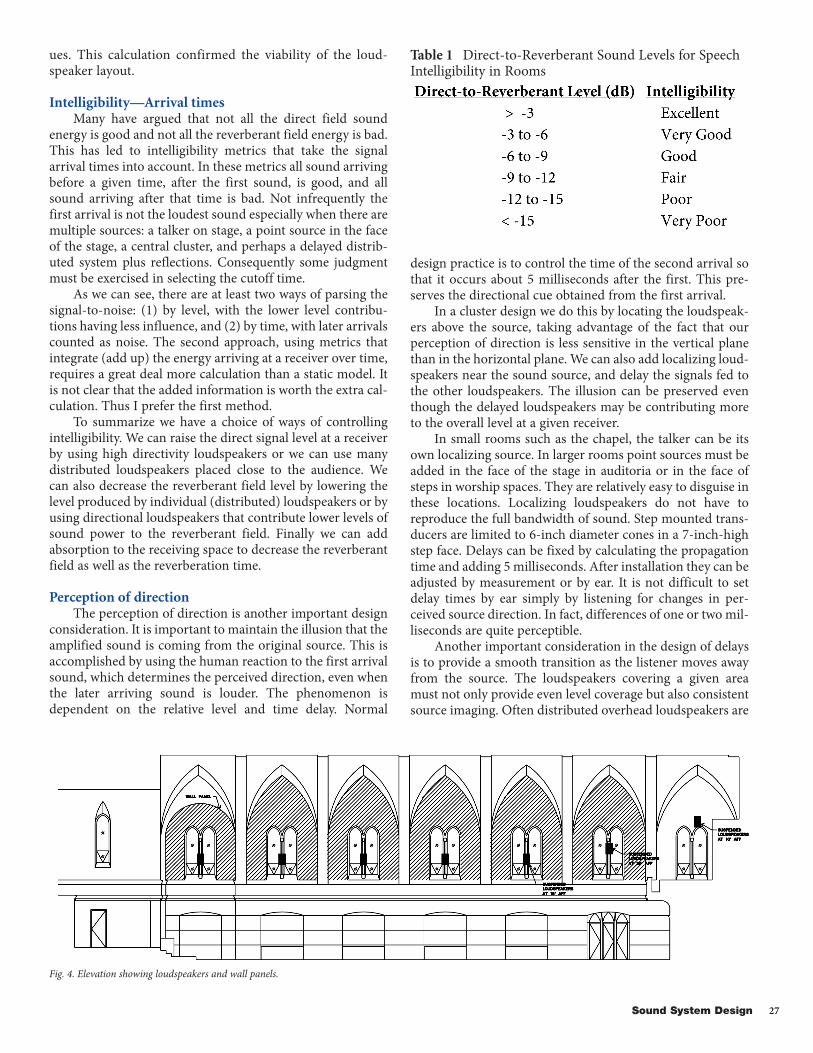
As part of the computer modeling the reverberationtimes and the signal to noise ratios were calculated atMount Saint Mary’s Chapel. In the existing church in theempty condition, the mid frequency reverberation timeswere around 4 seconds, much too high for optimal results.Even with the distributed loudspeakers, the signal-to-noiseratios were about -10 dB, which yielded only fair intelligi-bility. As a result it was decided to add some absorption tothe room. Normally it is best to do this in the high ceilingareas, where surfaces do not provide useful reflections forenvelopment or intelligibility. In this room those surfaceswere not available, so panels were designed to fit into theniches of the side walls, as shown in Fig. 4. These reducedthe calculated reverberation times to about 1.7 seconds andthe signal to noise ratio to -6 to -7 dB, both satisfactory val-
Sound System Design 27
ues. This calculation confirmed the viability of the loud-speaker layout.
Intelligibility—Arrival timesMany have argued that not all the direct field sound
energy is good and not all the reverberant field energy is bad.This has led to intelligibility metrics that take the signalarrival times into account. In these metrics all sound arrivingbefore a given time, after the first sound, is good, and allsound arriving after that time is bad. Not infrequently thefirst arrival is not the loudest sound especially when there aremultiple sources: a talker on stage, a point source in the faceof the stage, a central cluster, and perhaps a delayed distrib-uted system plus reflections. Consequently some judgmentmust be exercised in selecting the cutoff time.
As we can see, there are at least two ways of parsing thesignal-to-noise: (1) by level, with the lower level contribu-tions having less influence, and (2) by time, with later arrivalscounted as noise. The second approach, using metrics thatintegrate (add up) the energy arriving at a receiver over time,requires a great deal more calculation than a static model. Itis not clear that the added information is worth the extra cal-culation. Thus I prefer the first method.
To summarize we have a choice of ways of controllingintelligibility. We can raise the direct signal level at a receiverby using high directivity loudspeakers or we can use manydistributed loudspeakers placed close to the audience. Wecan also decrease the reverberant field level by lowering thelevel produced by individual (distributed) loudspeakers or byusing directional loudspeakers that contribute lower levels ofsound power to the reverberant field. Finally we can addabsorption to the receiving space to decrease the reverberantfield as well as the reverberation time.
Perception of directionThe perception of direction is another important design
consideration. It is important to maintain the illusion that theamplified sound is coming from the original source. This isaccomplished by using the human reaction to the first arrivalsound, which determines the perceived direction, even whenthe later arriving sound is louder. The phenomenon isdependent on the relative level and time delay. Normal
design practice is to control the time of the second arrival sothat it occurs about 5 milliseconds after the first. This pre-serves the directional cue obtained from the first arrival.
In a cluster design we do this by locating the loudspeak-ers above the source, taking advantage of the fact that ourperception of direction is less sensitive in the vertical planethan in the horizontal plane. We can also add localizing loud-speakers near the sound source, and delay the signals fed tothe other loudspeakers. The illusion can be preserved eventhough the delayed loudspeakers may be contributing moreto the overall level at a given receiver.
In small rooms such as the chapel, the talker can be itsown localizing source. In larger rooms point sources must beadded in the face of the stage in auditoria or in the face ofsteps in worship spaces. They are relatively easy to disguise inthese locations. Localizing loudspeakers do not have toreproduce the full bandwidth of sound. Step mounted trans-ducers are limited to 6-inch diameter cones in a 7-inch-highstep face. Delays can be fixed by calculating the propagationtime and adding 5 milliseconds. After installation they can beadjusted by measurement or by ear. It is not difficult to setdelay times by ear simply by listening for changes in per-ceived source direction. In fact, differences of one or two mil-liseconds are quite perceptible.
Another important consideration in the design of delaysis to provide a smooth transition as the listener moves awayfrom the source. The loudspeakers covering a given areamust not only provide even level coverage but also consistentsource imaging. Often distributed overhead loudspeakers are
Table 1 Direct-to-Reverberant Sound Levels for SpeechIntelligibility in Rooms
Fig. 4. Elevation showing loudspeakers and wall panels.

28 Acoustics Today, January 2008
the best solution. If the loudspeaker heights are uniformand the loudspeaker type is the same, delays are increasedas the listener position moves farther from the source. Inthis way, loudspeakers covering an area in front of a listen-er can provide additional directional cues to the areabehind. This is an excellent approach in the case of largereverberant churches.
Another consideration in sound system design is that thesource origination point, whether speech or music, may varydepending on the source position. For example a talker locat-ed at an altar will provide a different source origination pointthan a choir. Using individually amplified distributed loud-speakers, different delays can be employed that depend onthe source origination point. In this way even coverage can bemaintained while the perceived source direction is changed.
At Mount Saint Mary’s Chapel the room was smallenough that the talker could be the localizing source. Foreach talker location, the delays were set for each distributedspeaker. Figure 5 shows a typical configuration. The design ismuch like dropping a pebble in a pond and watching the wavesmove outward from the origination point. By locating micro-phone plug boxes in the floor near the originating point, eachbox would uniquely define the associated delay pattern.
Feedback controlIn the design of every sound system we must address the
phenomenon of feedback. Figure 6 shows the geometry of asimple sound system having a talker, a microphone, and aloudspeaker. Feedback occurs when the direct sound levelfrom a loudspeaker exceeds the sound level from the talker atthe output of the microphone. Under these conditions a feed-back loop is created which produces a howl in the system. Toavoid this condition, the talker level must exceed the loud-speaker level by a certain margin of safety called the feedbackmargin of stability
(6)
From this we see the ways to control feedback:
1) Move the talker closer to the microphone so that thesystem gain can be reduced and thus the level at themicrophone from the loudspeaker;
2) Select a directional microphone that preferentiallyemphasizes sounds coming from the talker, relativeto the loudspeaker;
3) Design loudspeakers that deliver more sound to thelisteners than to the microphones, either by usingdirectional loudspeakers or a distributed system;
4) Use equalization, frequency shifting, compression,and other electronic techniques.
At Mount Saint Mary’s Chapel all of these techniqueswere utilized. The system was equalized for music with ahouse curve which rolled off 4 dB per octave above 3k Hz.Additional equalization was included in the speech path,tuned to the major feedback frequencies. Cardioid micro-phones were used at the fixed talker positions. Earset micro-phones were used for the wireless transmitters. A frequencyshift of 10 cents (1200 cents/octave) was also electronicallyintroduced as a safety measure.
Fig. 5. Floor plan with music delay zones.

Sound System Design 29
Sound system setupThe setup and adjustment of a sound system after instal-
lation is rarely discussed but is critically important. When theelectronics have been installed, it is usually necessary tospend at least several hours, and with a larger system, a cou-ple of days, to set up the system. In general, the followingsteps are recommended:
1) Excite each group of like-type loudspeakers inde-pendently with pink noise and adjust the thirdoctave equalizer assigned to that group to be flat(1 dB) from 100 Hz to 3 kHz. When there are sub-woofers the low frequency limit should extenddown to 80 Hz. Roll off the high frequencies about4 dB per octave above 3 kHz. For concert venues,season to taste;
2) Measure the spatial coverage throughout thereceiving space separately using pink noise in the500 Hz, 1 kHz, and 2 kHz octave bands. It shouldmatch the predicted coverage levels, usually nomore than 2 dB and preferably less. Adjust the levelfor each loudspeaker to achieve this balance. Notethat a distributed system requires a separate ampli-fier channel for each loudspeaker. While theorypredicts that the reverberant field will be uniformthroughout the space, this is seldom the case;
3) Set the delay times for each delay zone and eachsource position so that the sound appears to comefrom the origination point at every seat. This mustbe tested using a talker at each microphone posi-tion. A convenient way of testing this effect is tohave a talker walk toward a high quality fixedmicrophone while talking. As the person enters thefield of the microphone the source image shouldremain fixed on the talker. The test must be repeat-ed for each zone and again with all speaker zoneson;
4) Play a familiar piece of music through the system.The music should contain a good mix of high-,mid-, and low-frequency energy. I have usedJennifer Warnes’ recording of “Bird on a Wire,” and“Stay,” by Allison Krauss, but every engineer has his
or her own favorites. Make the final adjustments tothe music equalizers by ear;
5) Using a talker, increase the system gain at eachmicrophone position until the initiation of feed-back. Measure the frequency at which the ringingoccurs. Increase the equalizer notch depth at thatfrequency using a narrow band or parametric filterfor that microphone type and position. When suf-ficient gain before feedback has been achieved,review the equalizer settings to make sure they arenot too extreme and do not affect the naturalnessof the sound;
6) Add about 10 cents of frequency shift to the speechfeed as added feedback insurance;
7) Save all system settings on a computer disk andmake backup copies.
ConclusionsThere are a number of approaches to sound system
design. The recent trend has been to utilize large clusters,often line arrays to cover the audience area. Where very highsound pressure levels are not required, good source localiza-tion, excellent intelligibility, low feedback, and a discreteappearance can be maintained using a distributed overheadsystem.
Figure 7 shows a photograph of the completed installa-tion at the Mount Saint Mary’s College Chapel. The loud-speakers were positioned so that they complemented theexisting light fixtures. The approach also allowed us to limit
Fig. 7. Completed installation.
Fig. 6. Basic parameters for feedback control.

30 Acoustics Today, January 2008
Marshall Long received a BSEfrom Princeton University in1965, attended the Universityof Grenoble in France andthe University of Madrid inSpain in 1966, and receivedMS and Ph.D. degrees inengineering from Universityof California-Los Angeles(UCLA) in 1971. While still agraduate student, he foundedhis own consulting firm nowin its 37th year. MarshallLong/Acoustics specializes in architectural acoustics, audiovisu-al design, noise and vibration control, and other technical areasrelated to acoustics. He enjoys sailing, judo, soccer, reading, andwriting, and is living with his family in Sherman Oaks, CA.
the amount of absorption added to the room so the reverber-ation time remained long enough to provide a suitable envi-ronment for choral singing. Speech intelligibility and themusic environment were both quite satisfactory.AT
ReferencesBistafa, Sylvio R., and Bradley, John S. (2000). “Revisiting algo-
rithms for predicting the articulation loss of consonants ALcons,”J. Audio Eng. Soc. 48(6), Fig. 2, p. 537, and Fig. 4, p. 539.
Klepper, David L. (1999). “A different angle.” Sound & VideoContractor 17(1)
Long, Marshall (2006). Architectural Acoustics (Academic Press,),Table 18.3, p. 619.
Maxfield, J. P., and Albersheim, W. J. (1947). “An acoustic constantof enclosed spaces correlatable with their apparent liveness,” J.Acoust. Soc. Am. 19(1), 71-79.
Peutz, V. M. A. (1971). “Articulation loss of consonants as a criteri-on for speech transmission in a room,” J. Audio Eng. Soc. 19(11).
Publish Your Conference Proceedings with AIPDisseminate your conference results worldwide quickly and cost effectively
Discover why conference organizersreturn to AIP year after yearThe vast majority of organizers of regularlyrecurring conferences return to AIP to publishsubsequent proceedings. Here are some of thebenefits they’ve enjoyed:• Rapid publication, typically 10 to 12
weeks from the receipt of all themanuscripts
• Online availability virtually simultaneouswith the release of the print volume
• Proceedings published before the start ofconference for distribution at theconference
• Dedicated staff contact editors andproofread typeset pages at least twice
• A selection of manuscript submissionformats, from camera-ready on paper,electronically on disk, or by ftp
• Flexible publication formats: 8 1/2” x 11”or 6” x 9” (approximately A4 and A5,respectively) sizes, and hardcover or soft-cover bindings
• AIP’s ability to handle special requests,such as unique cover designs and four-color art
• The option of producing your proceedingson CD-ROM
• Worldwide distribution
A s a conference organizer, you want the key findings at your meeting toreach the largest possible audience as quickly and inexpensively as possi-ble. With more than 700 Conference Proceedings published, the American
Institute of Physics is uniquely positioned to maximize the impact of that lead-ing-edge research by ensuring fast, cost-effective dissemination to researchersworldwide. AIP Conference Proceedings also preserve the continuity of thepapers delivered at your meeting—something that’s lost when individual articlesare scattered among various journals.
AIP puts your proceedings onlineAIP mounts each new volume online almost simultaneously with the publication ofthe printed version. This ensures that researchers in your field will have promptaccess to the results of your conference. Links to your proceedings are accessiblefrom the Inspec database and from major search engines. Access is available topatrons at a growing number of libraries worldwide. You can also offer online accessto attendees of your conference.
Give your proceedings a special online SPINAbstracts of all conference papers automatically appear in AIP’s SPIN(Searchable Physics Information Notices) abstracts database. SPIN is widelyavailable in academic, corporate, and government research libraries aroundthe world. It is a rich resource with complete bibliographic records for morethan 100 of the world’s leading publications in the physical sciences.
For more information and proposals, contact:Maya Flikop, Tel: 516-576-2460; e-mail: [email protected]
Visit us on the web at http://proceedings.aip.org.