sound & observation: listening for clues how do scientists...
TRANSCRIPT
1
Sound & Observation: Listening for Clues How do scientists use sound to observe and monitor environments? Can acoustic monitoring provide a measure of biological monitoring?
Written By: Carlie Wiener, Hawai‘i Institute of Marine Biology
Background Scientists can use sound to monitor environments for many things including both biological (animals, weather and natural events) and anthropogenic (human activities) aspects. Monitoring the changing status of coral reef environments and their inhabitants is a critical management need and a considerable technological challenge, especially on reefs in remote locations, such as those in the Northwestern Hawaiian Islands. Understanding the interactions between species in coral reef communities requires long-term observation of relationships between species. However, while existing monitoring instruments are capable of measuring long-term physical environmental trends they currently lack the ability to observe most biological processes.The study of acoustics pertains to using the sense of hearing, or to use the science of sound. The use of acoustic tools to record biologically produced sounds in aquatic environments such as oceans is becoming a tool of choice for assessing and monitoring activity in remote habitat (NOAA/ NMFS). Activity at a Glance Students learn to associate sound with species identification through a listening activity, and develop their own sound graphs. Scientific inquiry and observation using sound are also understood. Key Concepts
• Observation through sound or listening can tell us about our surrounding environment.
• Acoustic study examines sounds to determine various biological and human patterns of presence and activity.
• Scientific inquiry can be used to develop an understanding of our ecosystem.
Assessment
• Students can explain: a) how sound is used in science and management; b) why it is important to listen and record sound in the environment; c) what sound can tell us.
• Students can spend time actively observing their environment through listening and recording sound.
• Students can produce their representation of sound through the associated sound graph outline and draw comparisons to other student’s sound graphs.
• Students can apply knowledge acquired to other current events (extension activity).
2
Time 1-2 class periods (35 – 75 minutes) Skills
• Observation • Using scientific vocabulary • Comparison • Applying knowledge to current events (extension activity)
Vocabulary Acoustics – the study of sound. Ambient sound – sound in the surrounding environment. Anthropogenic noise – noise produced by human activities (i.e.) noise produced by boat motors. Diel pattern – patterns occurring through a 24-hour period, or on a regular daily cycle, as part of the physiology or behavior of an organism. Ecological Acoustic Recorder (EAR) – a digital, low power acoustic recording system designed to systematically sample the underwater environment for sound. There are two types of devices: a deep water and a shallow water EAR. Materials Provided
• animal sound recordings (cd) • sound graph template • EAR Diagram • Discussion Article (extension activity)
Needed • writing utensils • computer to access animal sound recordings
Advanced Preparation
• photocopy sound graph template and discussion article (optional) for number of students/ participants
• read and familiarize material Teaching Suggestions
1. Review associated material with students. • Discuss where the Northwestern Hawaiian Islands are located, the
formation of the Papahānaumokuākea Marine National Monument, and the Hawai‘i Institute of Marine Biology Research Partnership (see Appendix).
3
• Ask students about sound. What does the ocean sound like? What sounds do they hear, etc?
2. Ask students to observe sound. • Have students stop and observe for a moment, what sounds to they hear? 3. Explain acoustic recording, the EAR and biological monitoring (see
background). • Ask students what sounds do they think would be important in this study? • Pass around EAR diagram or EAR model (if available) for students to
examine. • Ask students to interpret preliminary findings, why do they think Pearl and
Hermes Atoll is so noisy? Would the ocean sound different in different places in the world?
4. Listen to the underwater sounds (provided on cd) and draft individual sound graphs.
• Ask students to guess what they are listening to. What can this tell us? • Explain the use of sound graphs. • Ask students to listen again to the recordings, this time drawing a sound
graph based on what they hear. 5. Ask students to display graphs and compare with others in the class. • How do the graphs differ? How are they the same? 6. Extension Activity (optional): Have students read article and discuss
as a group. • Ask students what the issues are discussed in the article? How does the
EAR relate to ocean noise? Could this work be used to solve other problems?
References NOAA National Marine Fisheries Services (Coral Reef Ecosystem Division) http://www.pifsc.noaa.gov/cred/ear.php Hawai‘i Institute of Marine Biology Northwestern Hawaiian Islands Research Partnership Semi Annual Report (2007). Lammers/Au. Answers to Sound Graph Activity: 1) Snapping Shrimp 2) Parrot fish eating coral3) Spinner Dolphin 4) Humpback Whale
4
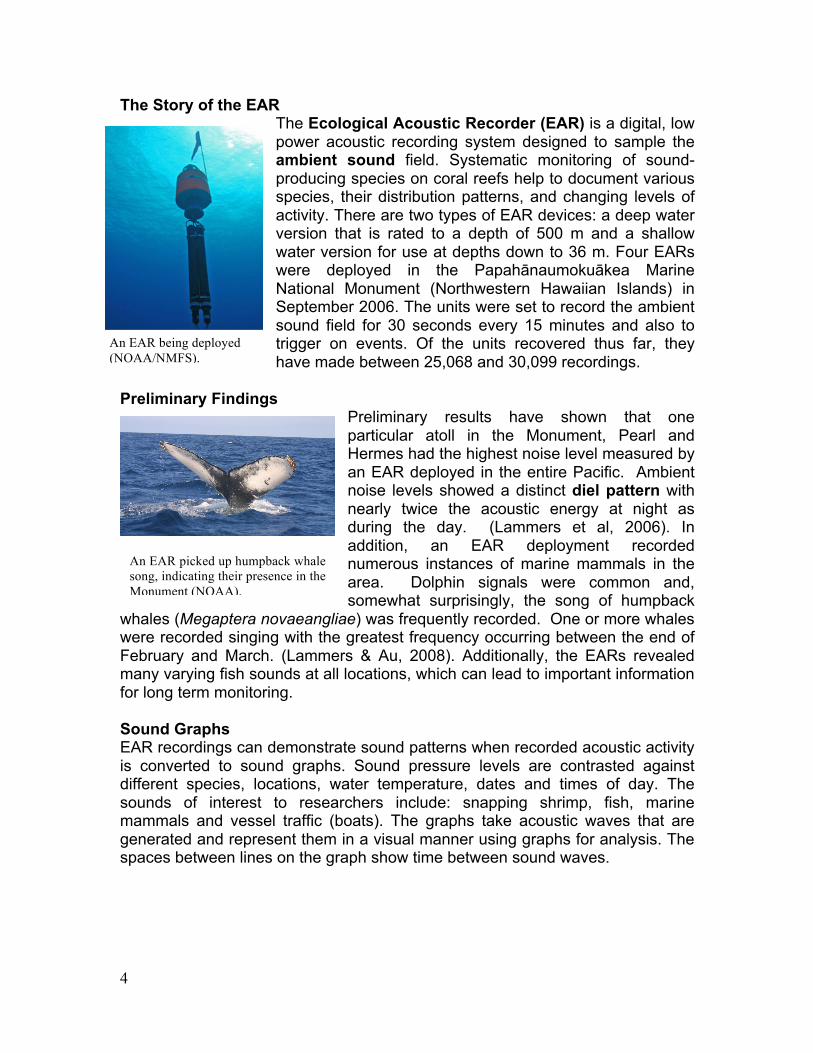
An EAR being deployed (NOAA/NMFS).
The Story of the EAR The Ecological Acoustic Recorder (EAR) is a digital, low power acoustic recording system designed to sample the ambient sound field. Systematic monitoring of sound-producing species on coral reefs help to document various species, their distribution patterns, and changing levels of activity. There are two types of EAR devices: a deep water version that is rated to a depth of 500 m and a shallow water version for use at depths down to 36 m. Four EARs were deployed in the Papahānaumokuākea Marine National Monument (Northwestern Hawaiian Islands) in September 2006. The units were set to record the ambient sound field for 30 seconds every 15 minutes and also to trigger on events. Of the units recovered thus far, they have made between 25,068 and 30,099 recordings.
Preliminary Findings
Preliminary results have shown that one particular atoll in the Monument, Pearl and Hermes had the highest noise level measured by an EAR deployed in the entire Pacific. Ambient noise levels showed a distinct diel pattern with nearly twice the acoustic energy at night as during the day. (Lammers et al, 2006). In addition, an EAR deployment recorded numerous instances of marine mammals in the area. Dolphin signals were common and, somewhat surprisingly, the song of humpback
whales (Megaptera novaeangliae) was frequently recorded. One or more whales were recorded singing with the greatest frequency occurring between the end of February and March. (Lammers & Au, 2008). Additionally, the EARs revealed many varying fish sounds at all locations, which can lead to important information for long term monitoring. Sound Graphs EAR recordings can demonstrate sound patterns when recorded acoustic activity is converted to sound graphs. Sound pressure levels are contrasted against different species, locations, water temperature, dates and times of day. The sounds of interest to researchers include: snapping shrimp, fish, marine mammals and vessel traffic (boats). The graphs take acoustic waves that are generated and represent them in a visual manner using graphs for analysis. The spaces between lines on the graph show time between sound waves.
An EAR picked up humpback whale song, indicating their presence in the Monument (NOAA).
5
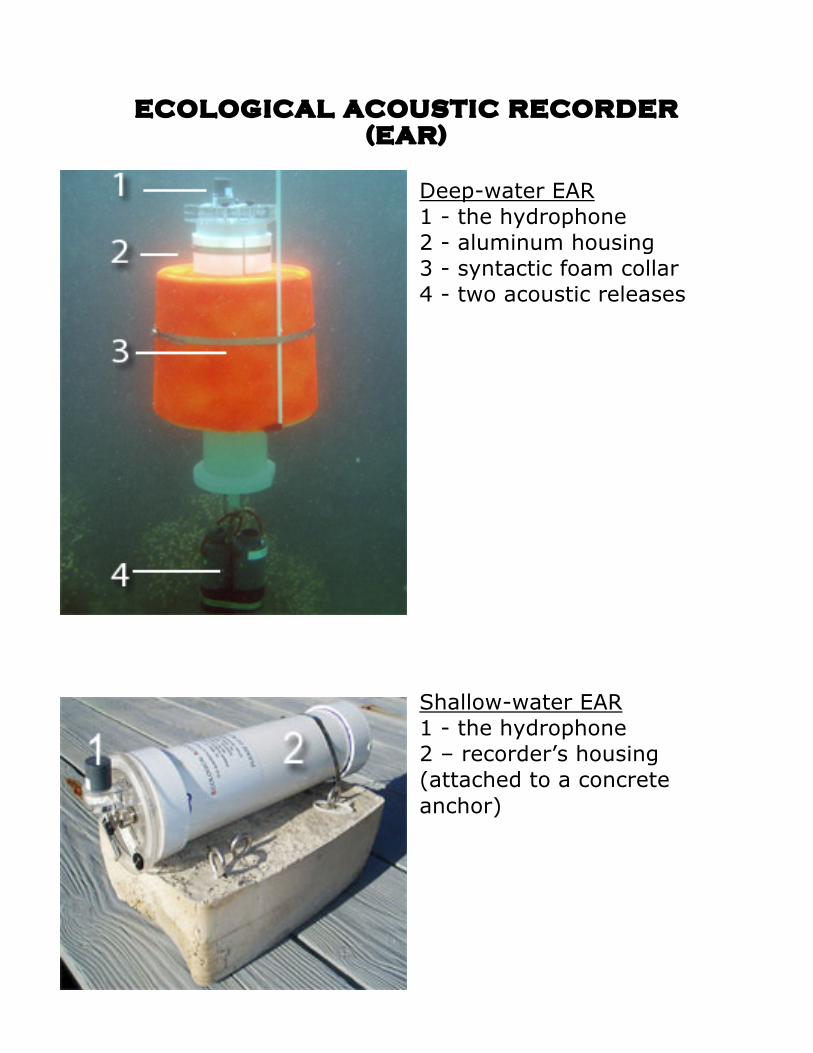
ECOLOGICAL ACOUSTIC RECORDER (EAR)
Deep-water EAR 1 - the hydrophone 2 - aluminum housing 3 - syntactic foam collar 4 - two acoustic releases
Shallow-water EAR 1 - the hydrophone 2 – recorder’s housing (attached to a concrete anchor)
6
Photos Courtesy of NOAA/NMFS.
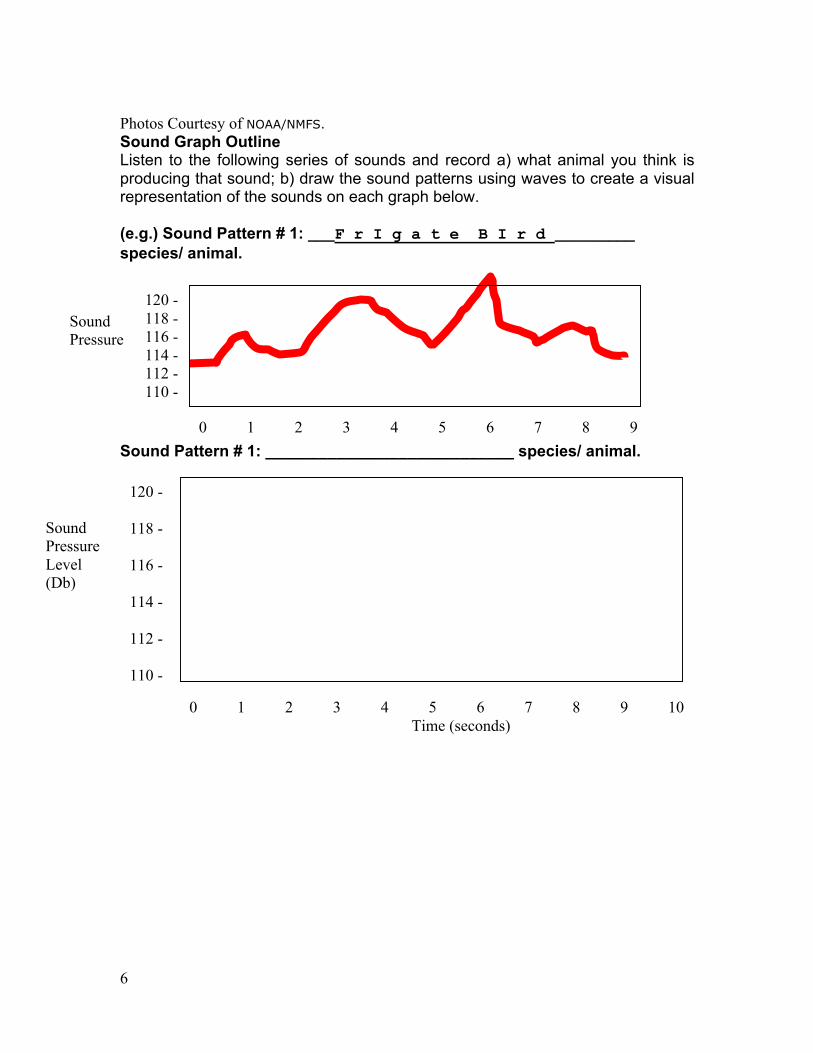
Sound Graph Outline Listen to the following series of sounds and record a) what animal you think is producing that sound; b) draw the sound patterns using waves to create a visual representation of the sounds on each graph below. (e.g.) Sound Pattern # 1: ___F r I g a t e B I r d _________ species/ animal.
Sound Pattern # 1: ____________________________ species/ animal.
Sound Pressure LevelLevel (db)
120 - 118 - 116 - 114 - 112 - 110 -
0 1 2 3 4 5 6 7 8 9 10
Time (seconds)
Sound Pressure Level (Db)
120 - 118 - 116 - 114 - 112 - 110 -
0 1 2 3 4 5 6 7 8 9 10 Time (seconds)
7
Sound Pressure Level (Db)
120 - 118 - 116 - 114 - 112 - 110 -
0 1 2 3 4 5 6 7 8 9 10 Time (seconds)
Sound Pressure Level (Db)
120 - 118 - 116 - 114 - 112 - 110 -
0 1 2 3 4 5 6 7 8 9 10 Time (seconds)
Sound Pattern # 2: ____________________________ species/ animal.
Sound Pattern # 3: ____________________________ species/ animal.
Sound Pattern # 4: ____________________________ species/ animal.
8
Sound Pressure Level (Db)
120 - 118 - 116 - 114 - 112 - 110 -
0 1 2 3 4 5 6 7 8 9 10 Time (seconds)