sound and hearing - usd
TRANSCRIPT
Sound and Hearing

Nature of the Sound Stimulus
“Sound” is the rhythmic compression and decompression of the air around us caused by a vibrating object.
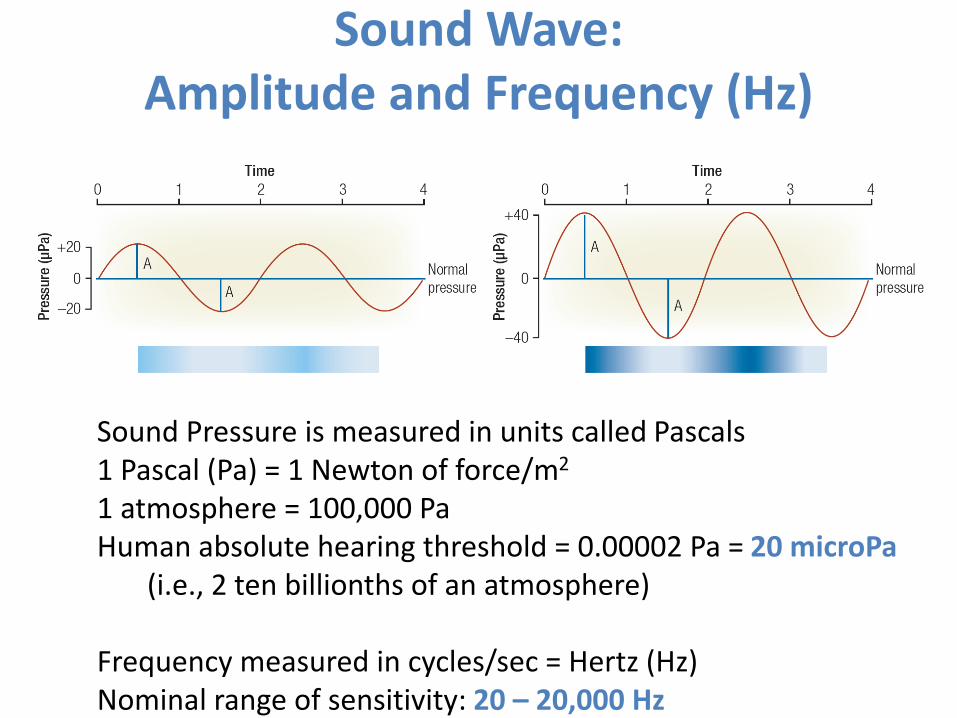
Sound Wave:Amplitude and Frequency (Hz)
Sound Pressure is measured in units called Pascals1 Pascal (Pa) = 1 Newton of force/m2
1 atmosphere = 100,000 PaHuman absolute hearing threshold = 0.00002 Pa = 20 microPa
(i.e., 2 ten billionths of an atmosphere)
Frequency measured in cycles/sec = Hertz (Hz)Nominal range of sensitivity: 20 – 20,000 Hz

The “decibel” (dB)
The decibel is a logarithmic unit used to describe a ratio (i.e., log (x/y))
In engineering analyses, it is used to normalize “power” measurements to a known reference and then compresses the resulting ratio using a log10 operation.
This format is convenient for engineering analyses involvingwide dynamic ranges (when very small and the very largemagnitudes must be considered simultaneously).
dB = 10 log(Observed Power / Reference)

Plotting Functions across a Wide Dynamic Range(An advantage of dB scales)
Semi-Log plot allows us to see the 20% modulation in BOTH functions despite the fact
that their average values differ by several orders of magnitude (i.e., 5 versus 5000)
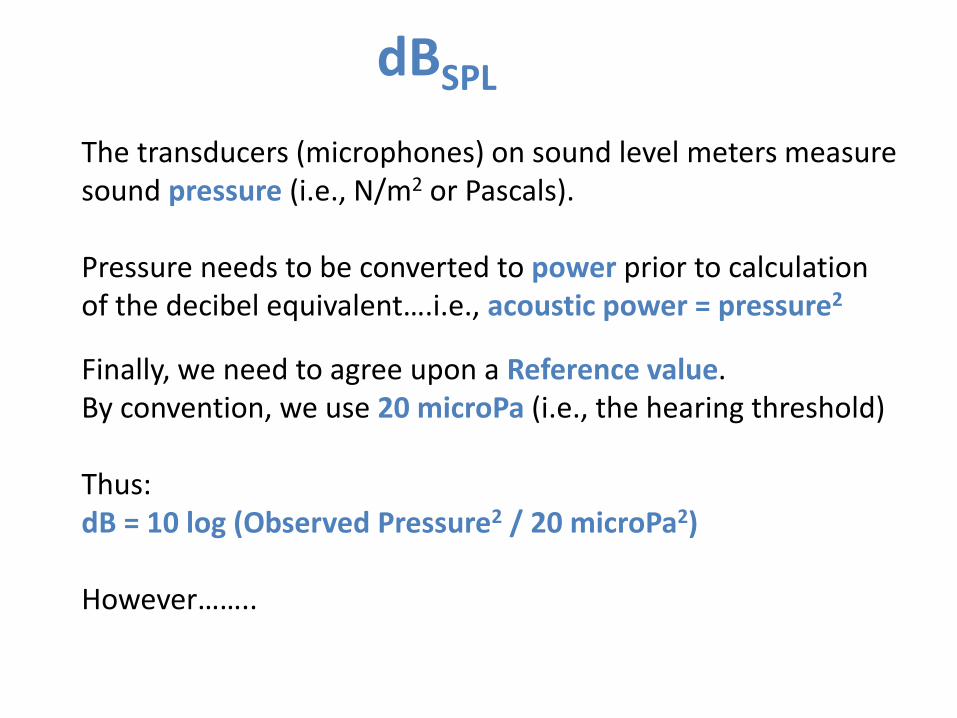
dBSPL
The transducers (microphones) on sound level meters measure sound pressure (i.e., N/m2 or Pascals).
Pressure needs to be converted to power prior to calculationof the decibel equivalent….i.e., acoustic power = pressure2
Finally, we need to agree upon a Reference value.By convention, we use 20 microPa (i.e., the hearing threshold)
Thus:dB = 10 log (Observed Pressure2 / 20 microPa2)
However……..
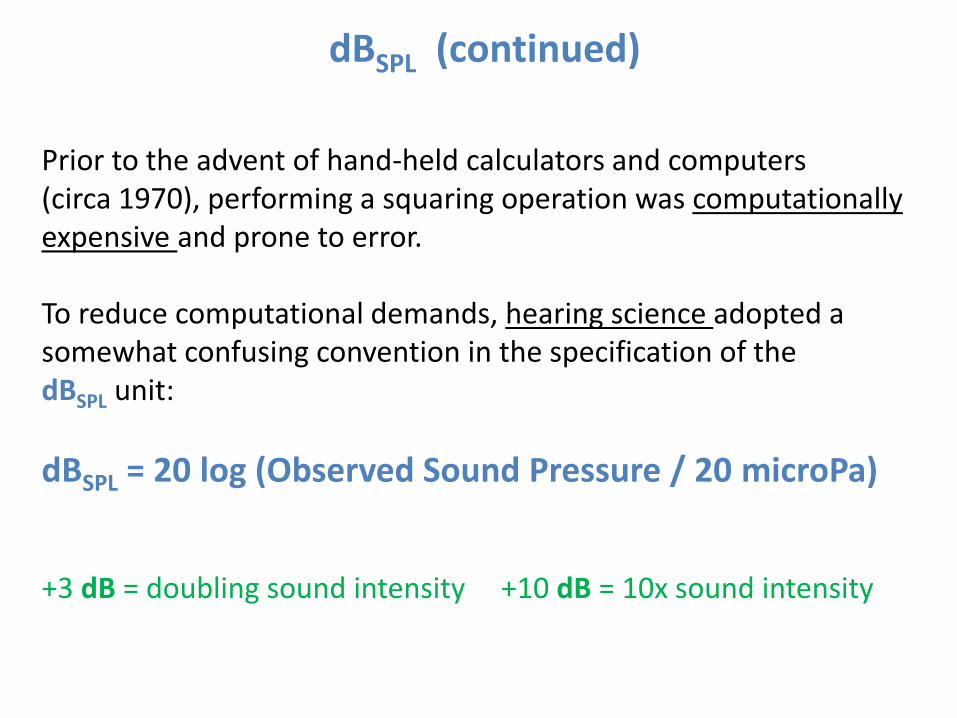
dBSPL (continued)
Prior to the advent of hand-held calculators and computers(circa 1970), performing a squaring operation was computationally expensive and prone to error.
To reduce computational demands, hearing science adopted a somewhat confusing convention in the specification of thedBSPL unit:
dBSPL = 20 log (Observed Sound Pressure / 20 microPa)
+3 dB = doubling sound intensity +10 dB = 10x sound intensity

Some Typical Sound Amplitude Values
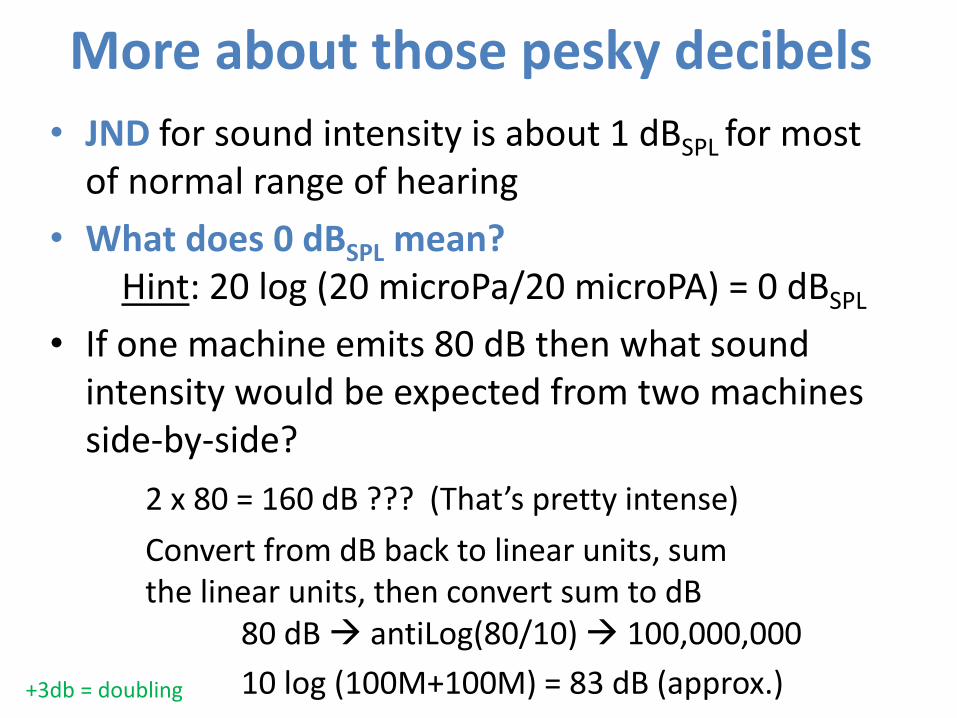
More about those pesky decibels
• JND for sound intensity is about 1 dBSPL for most of normal range of hearing
• What does 0 dBSPL mean?Hint: 20 log (20 microPa/20 microPA) = 0 dBSPL
• If one machine emits 80 dB then what sound intensity would be expected from two machines side-by-side?
2 x 80 = 160 dB ??? (That’s pretty intense)
Convert from dB back to linear units, sum the linear units, then convert sum to dB
80 dB → antiLog(80/10) → 100,000,000
10 log (100M+100M) = 83 dB (approx.)+3db = doubling

Inverse-Square Law
Area of sphere = 4πr2

A “Better” Sound Amplitude Table?(Always specify the measurement distance)
130 Loud hand clapping at 1 m distance110 Siren at 10 m distance95 Hand (circular) power saw at 1 m80 Very loud expressway traffic at 25 m 60 Lawn mower at 10 m50 Refrigerator at 1 m40 Talking; Talk radio level at 2 m35 Very quiet room fan at low speed at 1 m25 Normal breathing at 1 m0 Absolute threshold
dBSPL
Because of the inverse-square law

Most Sound Stimuli are Complex

Complex Sound = Sum of Sines(Fourier Theorem Revisited)
J.B.J. Fourier(1768-1830)
Fourier Sound Applet

Speed of Sound
Acoustic energy results from atraveling wave of rhythmic “compression” through a physical medium (e.g., air; water; steel).
It is the “compression” that travels not the medium, per se.
The characteristic speed of this travelling wave varies as a function of the medium (elasticity; density).
The speed of acoustic energy through the air (aka “sound”) is331 m/sec (or 742 MPH) at 0-deg C(Faster at higher temperatures).

Gross Anatomy of the Ear

Flow of Acoustic Energy(The “Impedance Problem”)

The “Impedance Problem”
99.9% of sound energy in the air is reflected at the air:water boundary (10 log(0.1/100)) = -30 dB loss) (1/1000x)
How does the ear compensate for this loss as sound energy is transmitted from the air to the fluid that filled the cochlea?
2 dB gain via ossicular leverage (1.6x)
25 dB gain via surface area condensation(eardrum → stapes) (316x)
~5 dB gain at mid-frequencies (3x) due to pinna and auditory canal resonance
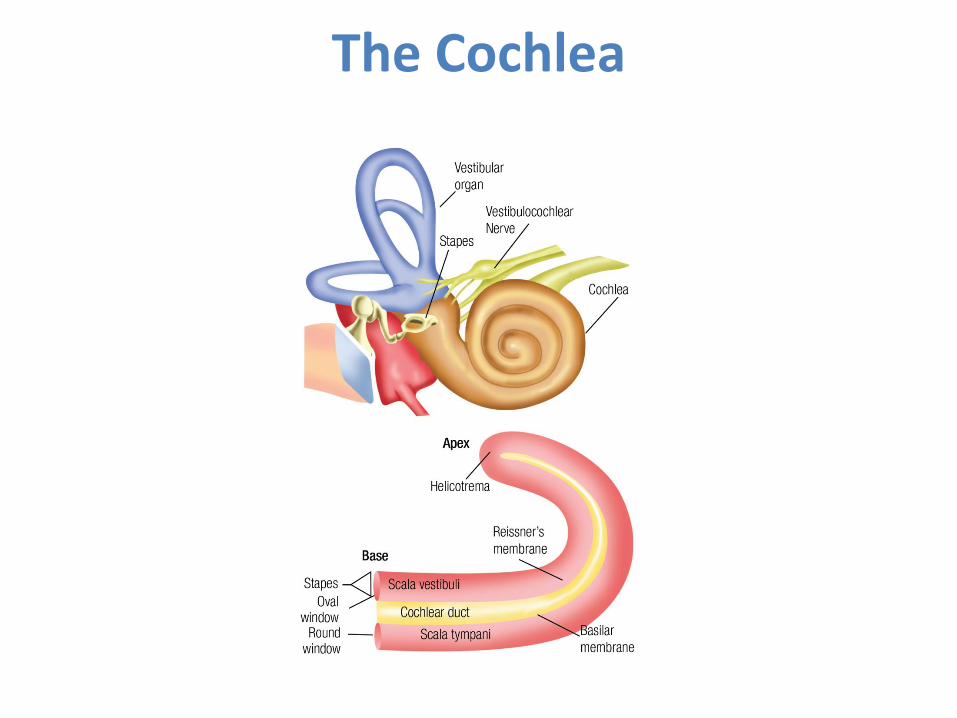
The Cochlea

The Organ of Corti
3000-3500 Inner Hair Cells (IHC)
12,000 Outer Hair Cells (OHC)

Photomicrograph: Sensory Hair Cells
Three rows ofOuter Hair Cells
One Row of Inner Hair Cells

Auditory Transduction

Basilar Membrane ModulationEffects upon Sensory Hair Cells
Note: K+ ion concentration gradient across sensory hair cells (see pink cavities)

IHC Stereocilia “Tip Links”
“tip link” connects gate to adjacent cilia.
Shearing motion forces gate to open.
Mechanical open-and-close ofgate modulates influx of potassium ions (much FASTER than slow chemical cascade in visual transduction).
K+ depolarization of IHC triggers release of glutamate at cochlear nerve fiber synapse.
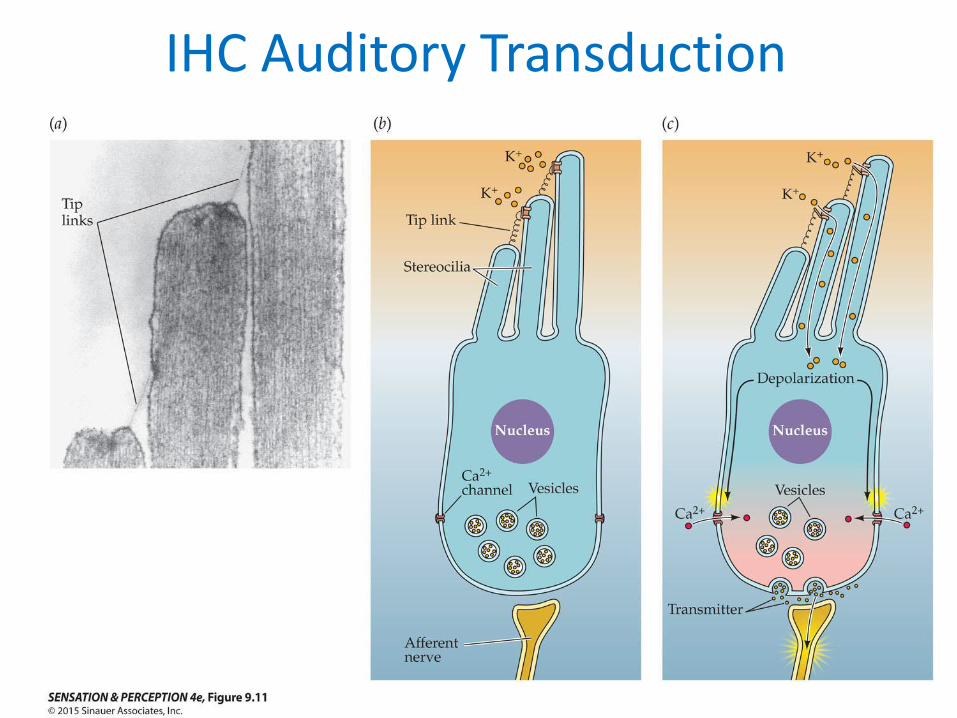
IHC Auditory Transduction

Innervation of 3000 IHCsversus 12,000 OHCs
30,000+ fibers in cochlear nerve. Nearly 10:1 fiber-to-IHC innervation ratio.
Sparse number of fibers carry info from OHC to brain.
Small number of fibers descend from brain to OHCs.
Role of OHC’s?Mechanical gainotoacoustic emission

Sound Amplitude Coding(“Divide and Conquer”)
Multiple nerve fibers for each IHC.
Each nerve fiber tuned to a different 40 dB “range” of stimulus intensity.
Intensity-level multiplexing
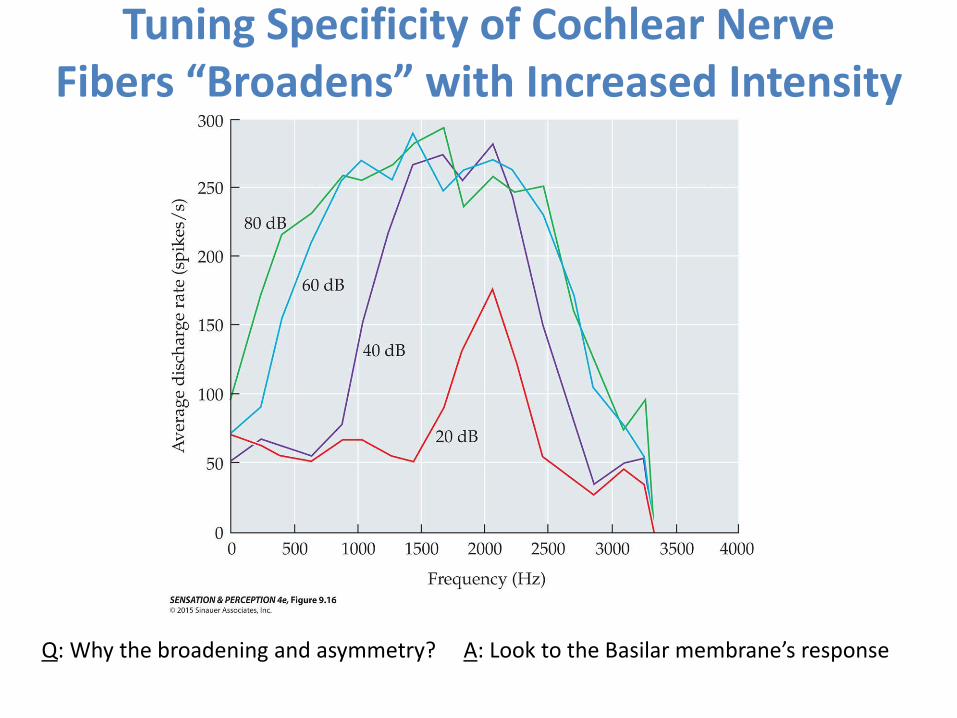
Tuning Specificity of Cochlear NerveFibers “Broadens” with Increased Intensity
Q: Why the broadening and asymmetry? A: Look to the Basilar membrane’s response

Ascending Pathways

Tonotopic Organizationof Primary Auditory Cortex (A1)
Also note:
Segregation of monaural versus binaural cells is maintained.
Binaural cells loosely organized according to spatial location of stimulus source.

Auditory Frequency Coding(What is the neural code for “pitch”?)

Temporal Mechanism versusPlace Mechanism
Georg von Békésy(1899-1972)
Ernest Rutherford(1871-1937)
Temporal Theory Place Theory
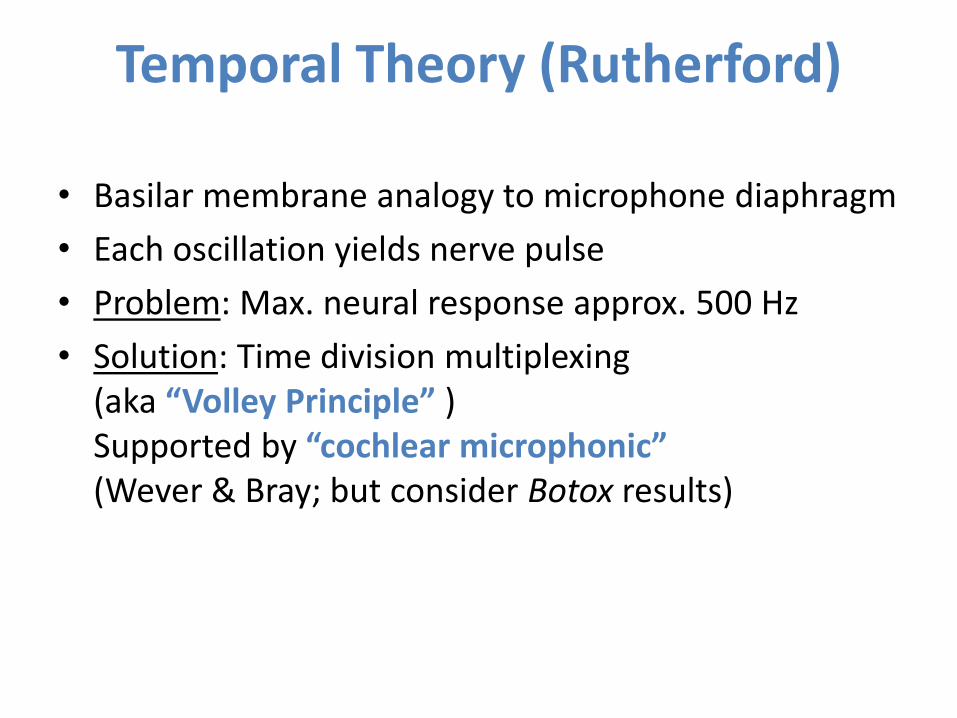
Temporal Theory (Rutherford)
• Basilar membrane analogy to microphone diaphragm
• Each oscillation yields nerve pulse
• Problem: Max. neural response approx. 500 Hz
• Solution: Time division multiplexing(aka “Volley Principle” )Supported by “cochlear microphonic” (Wever & Bray; but consider Botox results)

von Békésy Place Theory: Focus on Basilar Membrane Dynamics
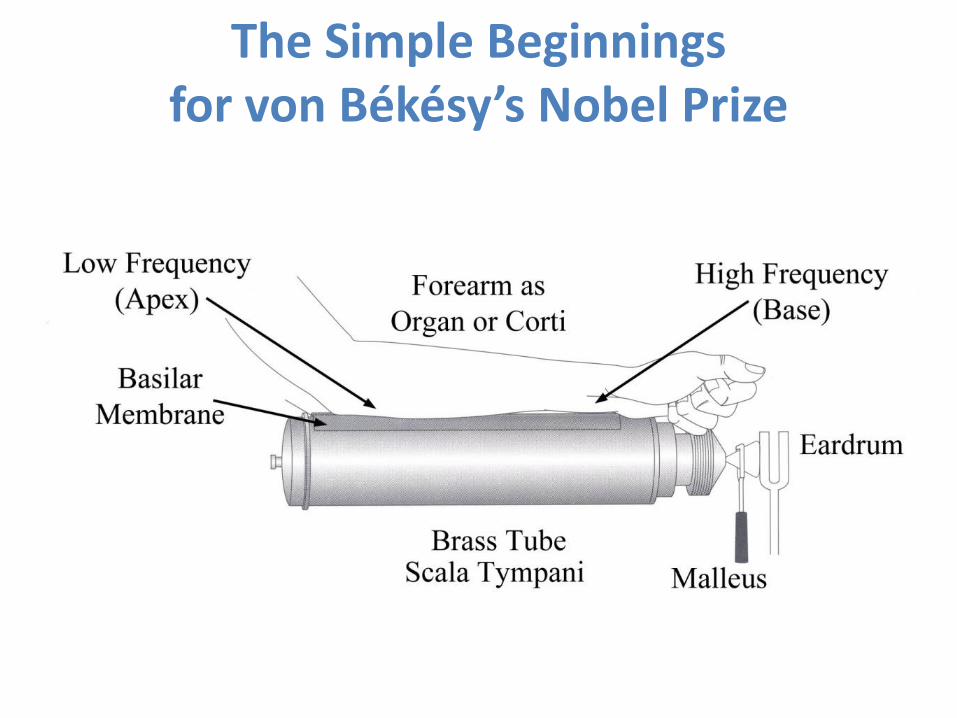
The Simple Beginningsfor von Békésy’s Nobel Prize

Basilar Membrane Responseto Pure Tone Stimulus
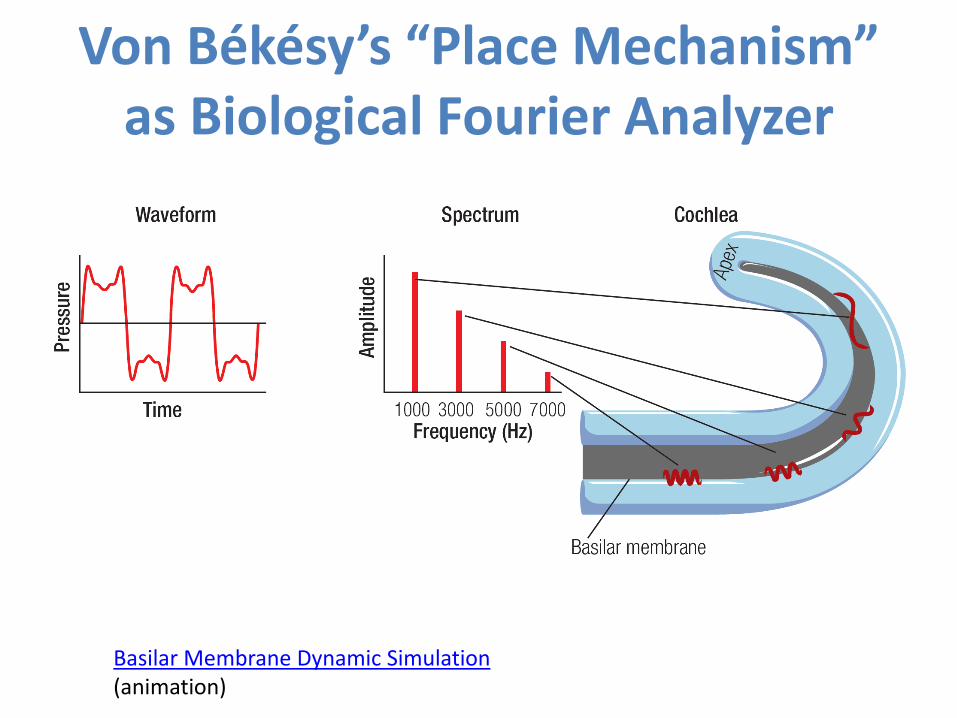
Von Békésy’s “Place Mechanism”as Biological Fourier Analyzer
Basilar Membrane Dynamic Simulation (animation)

Functional Aspectsof Hearing

Species-Specific Frequency Range

Human “Earscape”
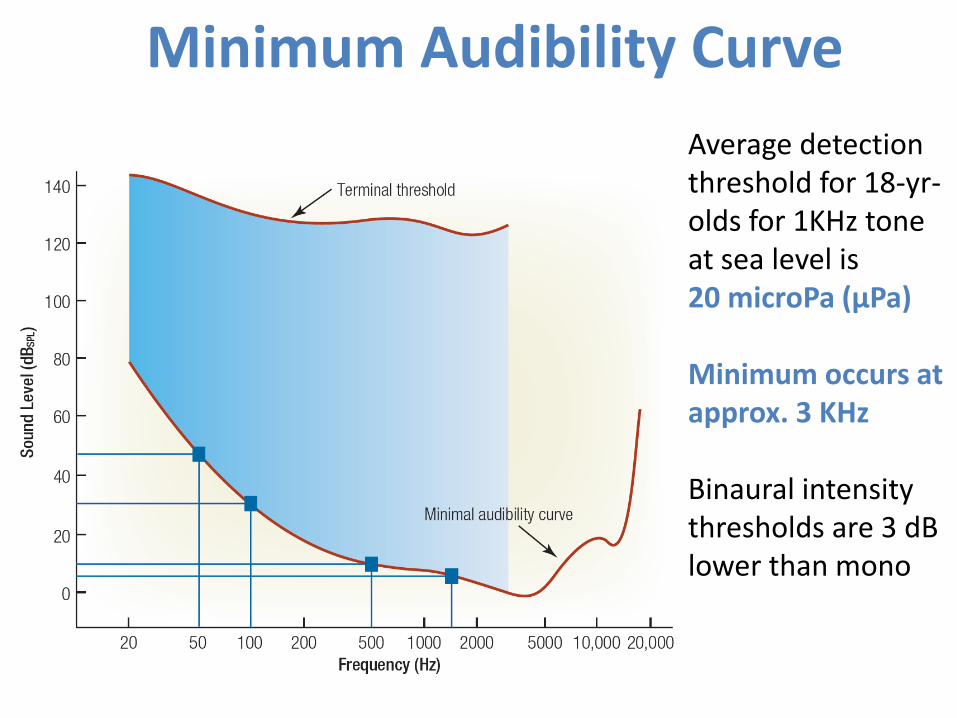
Minimum Audibility Curve
Average detection threshold for 18-yr-olds for 1KHz tone at sea level is20 microPa (μPa)
Minimum occurs at approx. 3 KHz
Binaural intensity thresholds are 3 dB lower than mono

Clinical Audiogram (dBHL)
dB-HL (Hearing Level) uses a different reference level for each test frequency.
That reference level represents the average threshold (18 yr-olds)demonstrated at that frequency.
Hence, a value of 0 dB-HL means “average” hearing level at the frequency under test.

Normal vs. Noise-Induced Hearing Loss
Source: http://mustelid.physiol.ox.ac.uk/drupal/?q=acoustics/clinical_audiograms
Note “notch”At 4 KHz.
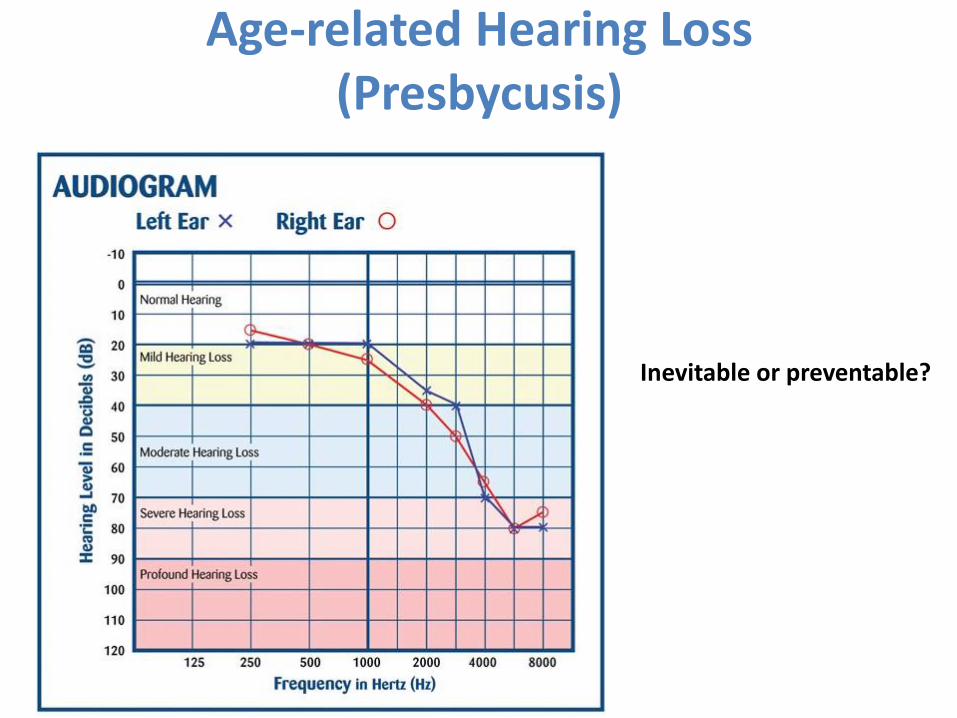
Age-related Hearing Loss(Presbycusis)
Inevitable or preventable?

Loudness
• Sound Intensity expresses the physical power of a sound stimulus and is usually measured in units of dBSPL
• LOUDNESS represents the subjective experience that varies as a function of sound intensity
• Capturing the nature of this psychophysical relationship is quite complex
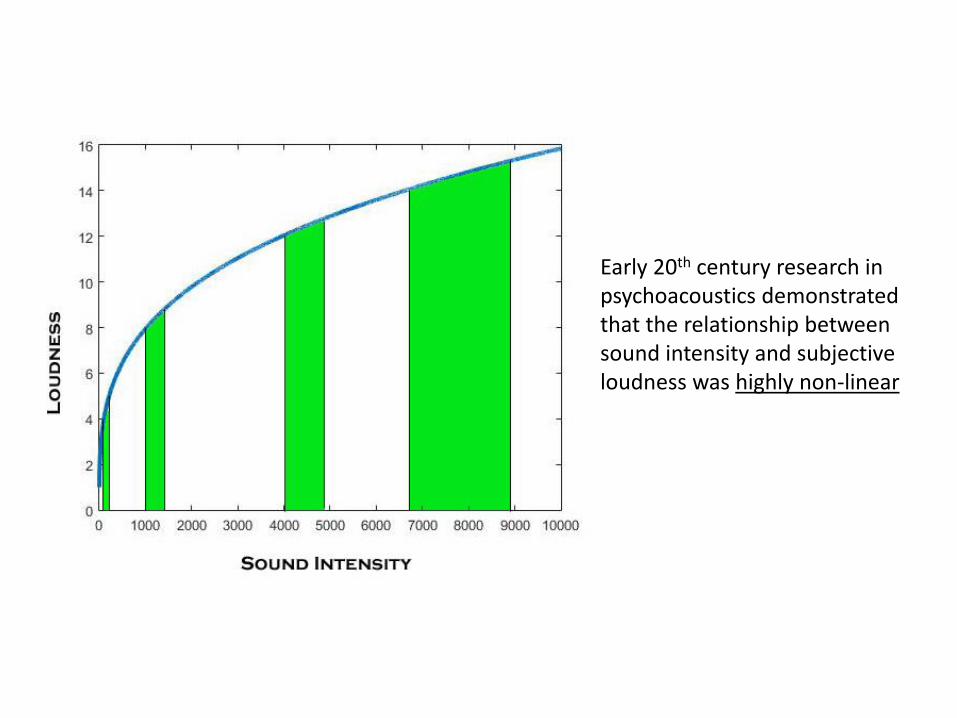
Early 20th century research in psychoacoustics demonstrated that the relationship between sound intensity and subjective loudness was highly non-linear
Stevens’ Law of Loudness
• S.S. Stevens used magnitude estimation techniques to quantify psychological loudness
• This work was based upon subjective comparisons of a range of sound intensities to an arbitrary reference standard:
viz.,40 phon = 1 KHz tone @ 40 dBSPL
1 sone = 40 phon• Phon scale represents the equivalent loudness of a 1 KHz
standard tone• Sone Scale models the relationship between phons and
psychological loudness on a ratio scale (according to Stevens)

Results of Magnitude Estimation Studies(Loudness of 1 sone = 40 phon reference)
Loudnesss (sones) = Intensity 0.3
Power function yields “straight” line in log-log space
slope ≈ exponent
L = I0.3
Stevens’ Law:
Quick ’n Dirty Computational Formula:
L (sones) = (phons/40)2.86
A tone with an equivalent loudness of 60 phons (1 KHz @ 60 dB) = 3.18 sones
(60/40) = 3.182.86

Stevens’ Sone Scale of Loudness
With some representative stimulus exemplars
In the linear range (40 dB+):You need to increase stimulus intensity by 10 dB to double perceived loudness…
There is a “fly in the ointment” when it comes tomodeling and measuring loudness.
Perceived loudness at a given dB level varies with frequency.
Q: How does one generalize from a model of loudness based upon a 1-KHz standard stimulus to sounds at other frequencies?
A: Apply the Iso-Loudness Contour functions
See next slide …

Equal Loudness Contours
Case study: Background “hum” in sound system = 70 dB @ 80 HzWhat is its loudness in Sones?(1)Find equivalent loudness in phons.(2) Convert phons to sones using Stevens’ Law
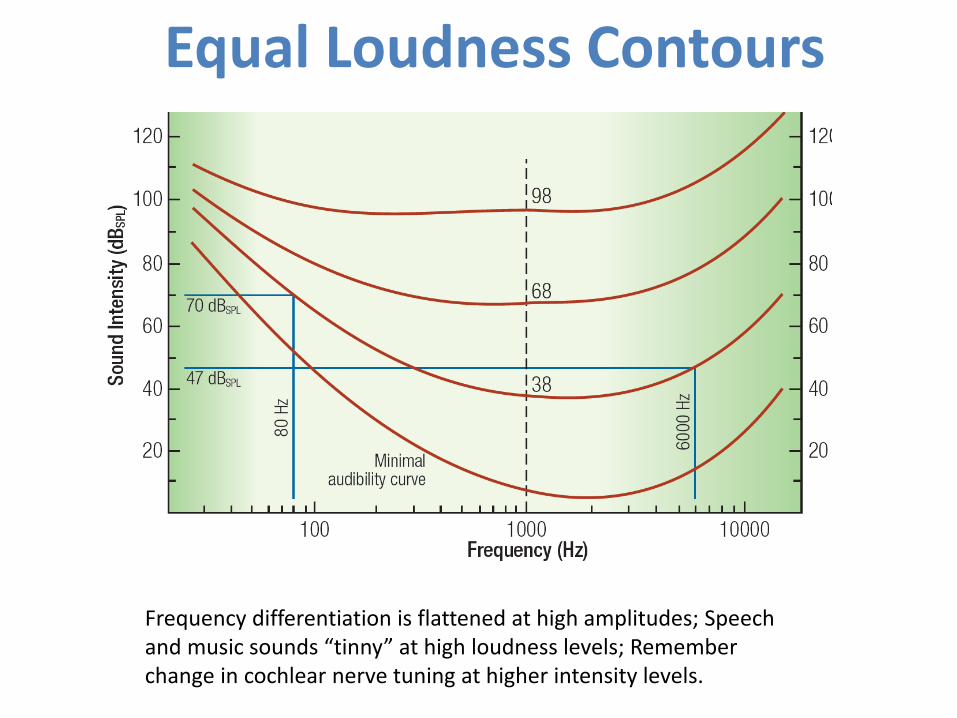
Equal Loudness Contours
Frequency differentiation is flattened at high amplitudes; Speech and music sounds “tinny” at high loudness levels; Remember change in cochlear nerve tuning at higher intensity levels.

Sone Scale Landmarks
Normal conversation 1-4
Automobile @ 10m 4-16
Vacuum cleaner 16
Major roadway @ 10 m 16-32
Long-term hearing damage dosage 32+
Jackhammer @ 1m 64
Brief-exposure hearing damage 256
Pain threshold 676
Sound Localization

Localization Accuracy vs. Frequency
Signature of a dual-mechanism process?

Localization Accuracy vs. Frequency:Low Freq – Interaural Time Difference
High Freq – Interaural Intensity Difference
ΔIΔT

Sound Shadowing(Interaural Intensity Difference –IID)
High-frequency sound waves are “blocked” by the human head and cast a “shadow” at the far ear(Strong IID cue)
Low-frequency sound waves wrap easily around the head and cast little or no sound shadow (Weak IID Cue)
ΔI

IID = f(Location, Frequency)
StraightAhead Right Ear
(Perpendicular)
StraightBehind
ΔI

ITD versus Location
StraightAhead Right Ear
(Perpendicular)
StraightBehind
ΔT

Delay Line Theory(How to Build a Cell tuned to delta-T Signals)
Delta-T = 200 microsec

“Active” Localization(Continuous Sound Sources)

Straight Ahead vs. Straight Behind
Relatively good localization performance despite same IID and ITD levels (i.e., zeros)
Differential sound distortion (“coloration”) introduced by interaction with pinna
Modifying shape of pinna causes immediate reduction in localization accuracy (Hoffman, et al., 1998)
Listening through the ears of another yields “ahead” vs. “behind” confusion (chance performance)

Modifying the Pinna Transfer Function(Hoffman, et al., 1998) Earprints?

Cross-Section of aHead-Related Transfer Function(Spectral Coloration by Head, Torso & Pinnae)
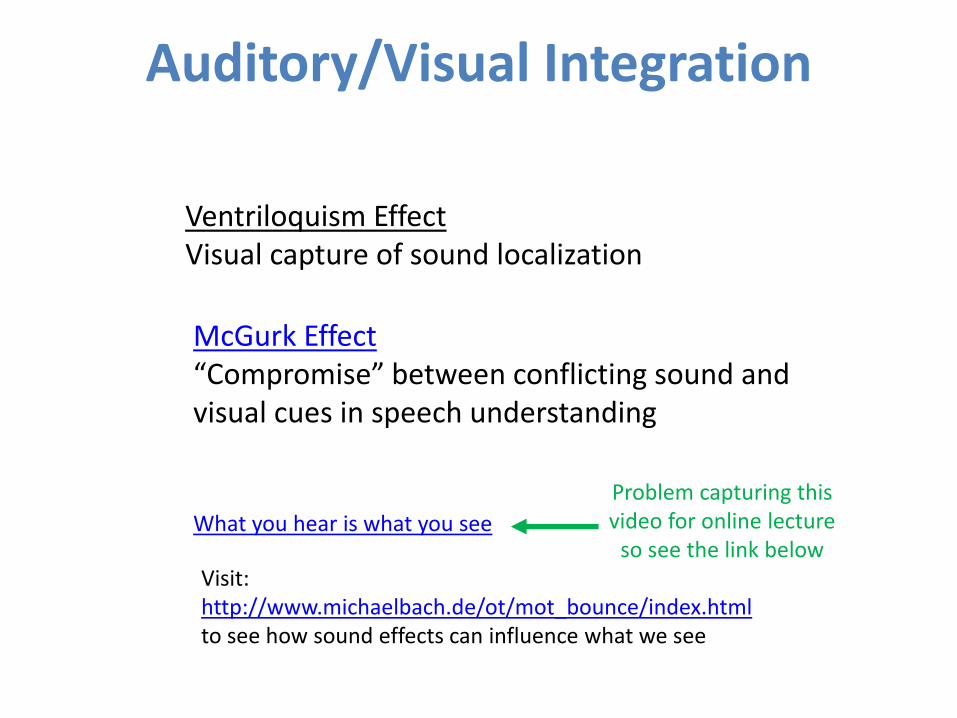
Auditory/Visual Integration
What you hear is what you see
Ventriloquism EffectVisual capture of sound localization
McGurk Effect“Compromise” between conflicting sound and visual cues in speech understanding
Visit: http://www.michaelbach.de/ot/mot_bounce/index.htmlto see how sound effects can influence what we see
Problem capturing this video for online lecture
so see the link below