sotmas geophysical survey at the medieval … geophysical survey at the medieval settlement,...
TRANSCRIPT

SOTMAS Geophysical Survey at the Medieval Settlement, Immediately West of Bentley Fields Farm, Hungry Bentley, Derbyshire
Aerial photograph of Hungry Bentley DMV looking SWW (approx) by kind permission of Mr. R Spencer.

Western field looking north east. The major hollowway can be seen running across the top of the picture. Other earth works are visible in the foreground.
Introduction
Hungry Bentley is a scheduled site and stated to be the finest example of a depopulated settlement village in Derbyshire. It lies about 5 miles north east of Uttoxeter, above and to the east of the valley of the Bentley Brook (National Grid Reference SK 1787 3866). It is unknown why the village lost its population but the poor agriculture, a move away from arable farming, a change in climate and the black death have all been considered as possible reasons. It is about half a mile from the line of the Roman road from Little Chester (Derby) to Rocester, called Long Lane. In the historical record it is linked with Bentley Hall (which lies on Long Lane) so it is difficult to know when references to a chapel are recorded, whether they refer to the two fields under study or perhaps a chapel associated with the hall. It is possible that the site was never completely abandoned because Bentley Fields Farm, immediately to the east of the scheduled area, is a working farm to this day.
The geology of the scheduled area is mainly, if not totally, Mercian Mudstone with bands of skerries. The easternmost portion of the survey may just fall into the adjoining Boulder Clay (till). The scheduled area is the whole of two fields: a small one to the east and a much larger one on the west. Both fields are used for grazing sheep.
Many of the features visible on the aerial photograph can be seen clearly from ground level. The hollowways are very visible, one running east to west which meets one running north to south. In addition some of the possible house platforms are easily seen. Certainly in the small field there appear to be house platforms on both sides of the

east to west hollowway. The house platforms are concentrated on the eastern side of the area; the western side is described as being a field system.
It was decided to perform magnetometry on as much of the smaller eastern field as possible (in the extreme east it had lots of stacked wood and a large animal pen, prohibiting any survey). In the larger western field only the eastern half was to be processed. After this point the land starts to fall away to the west and seems to have been purely fields without any obvious signs of buildings. We had only a limited time to do the survey and it was decided that the resistivity survey would be restricted to the more interesting parts of the smaller field.
Methods
Fig. 1: Showing scheduled area in red and area of the survey. Image reproduced with permission of Ordnance Survey and Ordnance Survey of Northern Ireland.
A grid was set up with pegs at 30 metre intervals. The hedgeline between the two fields runs approximately north to south (in fact the hedgeline, over the 90 metres used, is 2 degrees west of true north), and it was decided for convenience to set up the grid parallel to this hedge. The diagram shows where the grid was located to allow the survey to be related to the land. The hedge which divides the two fields is abnormally wide being, in effect, a double hedge with a ditch between the two hedges. This meant that there had to be a 6 metre gap in the survey corresponding to this hedge.


The magnetometer used was the FM36 gradiometer, on loan to SOTMAS from English Heritage, set to record to 0.1 nanotesla on a 30 by 30 grid, recording 4 readings per metre . We walked alternately south to north then north to south moving to the east one metre after each transfer. The results of the survey were downloaded using GEOPLOT and processed using this software initially, but further interpretation was performed using SNUFFLER. The images used in this document are from SNUFFLER set to use 97% of the data.
The resistivity meter used was an RM4 with the standard 2 probe configuration. The range was set to 2000 ohms with the switch set to RURAL. Again we traversed alternately south to north and north to south but here taking a single reading for each metre, and moving 1 metre east after each traverse. Our meter doesn’t have a data logger, the data being written on surveying sheets and then typed into a spread sheet.

Results Magnetometry:
Fig. 3: The magnetometry survey, together with an annotated copy highlighting the main anomalies.

Several features are very clear. The modern metalled tracks are very obvious, as are some of the older tracks. In addition there are vaguely rectangular areas labelled A, B, C and D which may indicate the location of buildings (certainly A, B and C are on elevated areas generally interpreted as house platforms). The area D, well separated from the other similar areas, wasn’t in an obviously elevated area in the field. An interesting circular feature in the extreme west of the survey area does appear as an earthwork on the field.
The major physical features, the hollowways, are not visible in the magnetometry survey.
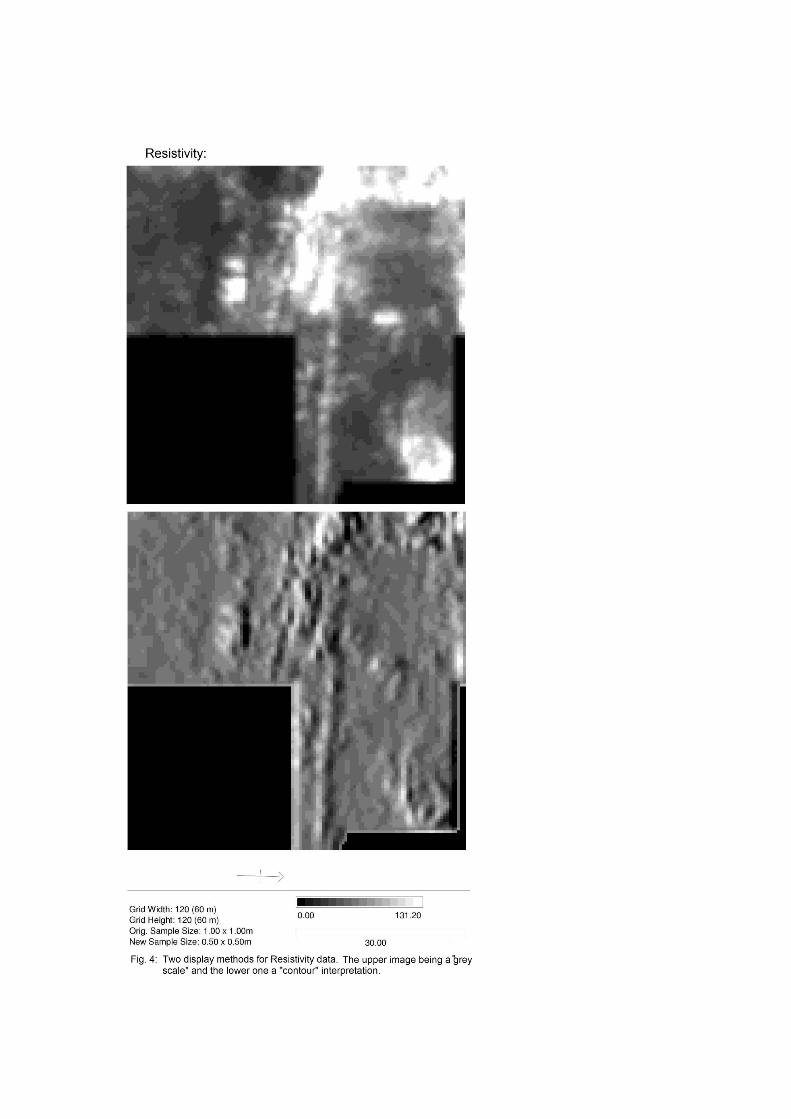

Fig. 5 : Fragment of the magnetometry survey from the smaller eastern field on the left. On the right the same area of the resistivity survey.
With the RM4 resistivity meter only 2700 square metres were surveyed in the form of 3 squares each 30 metres square.
The possible building sites seen in the magnetometry do not have such a large area of clearly defined anomaly. So, although sites A and B are visible, A has a very clear smaller rectangular feature, perhaps indicating brick or stone work. Site C has no clear anomaly in the resistivity. Some vague thin linear anomalies, running north to south, suggest lines of possible field drains or of ploughing.
Conclusions Most of the survey area is extremely busy. The hollowways cannot be seen on
the magnetometry survey. The two surveys combine to give complementary information on the layout of the village. The area D in the magnetometry could indicate a separate building, perhaps a barn or even the chapel mentioned in the historical references.
Acknowledgments Our thanks to Mr. R. Spencer for allowing us to conduct the survey and for his
great enthusiasm. We thank English Heritage for giving us permission to perform this survey. We
also thank them and Andy Payne in particular for the loan of the magnetometer and the training in its use.
Appendix


