sort and sift, think and shift: let the data be your guide
TRANSCRIPT

The Qualitative Report The Qualitative Report
Volume 26 Number 6 Special Section 20
6-22-2021
Sort and Sift, Think and Shift: Let the Data Be Your Guide An Sort and Sift, Think and Shift: Let the Data Be Your Guide An
Applied Approach to Working With, Learning From, and Privileging Applied Approach to Working With, Learning From, and Privileging
Qualitative Data Qualitative Data
Raymond Maietta ResearchTalk Inc.
Paul Mihas The Odum Institute for Research in Social Science, University of North Carolina, Chapel Hill
Kevin Swartout Georgia State University
Jeff Petruzzelli ResearchTalk Inc.
Alison B. Hamilton University of California Los Angeles, [email protected]
Follow this and additional works at: https://nsuworks.nova.edu/tqr
Part of the Quantitative, Qualitative, Comparative, and Historical Methodologies Commons, and the
Social Statistics Commons
Recommended APA Citation Recommended APA Citation Maietta, R., Mihas, P., Swartout, K., Petruzzelli, J., & Hamilton, A. B. (2021). Sort and Sift, Think and Shift: Let the Data Be Your Guide An Applied Approach to Working With, Learning From, and Privileging Qualitative Data. The Qualitative Report, 26(6), 2045-2060. https://doi.org/10.46743/2160-3715/2021.5013
This Special Section is brought to you for free and open access by the The Qualitative Report at NSUWorks. It has been accepted for inclusion in The Qualitative Report by an authorized administrator of NSUWorks. For more information, please contact [email protected].

Sort and Sift, Think and Shift: Let the Data Be Your Guide An Applied Approach to Sort and Sift, Think and Shift: Let the Data Be Your Guide An Applied Approach to Working With, Learning From, and Privileging Qualitative Data Working With, Learning From, and Privileging Qualitative Data
Abstract Abstract The Sort and Sift, Think and Shift qualitative data analysis approach is an iterative process where analysts dive into data to understand its content, dimensions, and properties, and then step back to assess what they have learned and to determine next steps. Researchers move from establishing an understanding of what is in the data (“Diving In”) to exploring their relationship to the data (“Stepping Back”). This process of “Diving In” and “Stepping Back” is repeated throughout analysis. To conclude, researchers arrive at an evidence-based meeting point that is a hybrid story of data content and researcher knowledge. To illustrate core tenets of Sort and Sift, Think and Shift, we analyzed three focus group transcripts from a study of postnatal care referral behavior by traditional birth attendants in Nigeria; these transcripts came from Syracuse University’s Qualitative Data Repository and were unfamiliar to the analytic team prior to this exercise. We focused on letting the data be our guide into not only the explicit purpose of the interviews, but also into the unexpected discoveries that arise when inquiring about people’s lived experiences. Situating our efforts within an Initial Learning Period, each member of the team closely read each transcript, and then identified powerful quotations that made us pause and take note. We documented what we learned from each transcript in an episode profile which contained diagrams and memos. Episode profiles were shared and discussed across the team to identify key points of interest, such as the role of faith in women’s decision-making processes related to their pregnancy and delivery preferences, and concepts of who bears what knowledge about reproductive health. Our engagement in this analytic exercise demonstrates the applicability of qualitative inquiry and Sort and Sift as flexible approaches for applied research.
Keywords Keywords Sort and Sift, Think and Shift, qualitative inquiry, applied research, Qualitative Data Repository
Creative Commons License Creative Commons License
This work is licensed under a Creative Commons Attribution-Noncommercial-Share Alike 4.0 International License.
Acknowledgements Acknowledgements The authors would like to thank Alexandra Bailey for her contributions to the analytic process. Dr. Hamilton was partially supported by the VA Quality Enhancement Research Initiative (QUERI; QUE 15-272, QUE 20-028), VA Health Services Research & Development (HSR&D; SDR 10-012), and NIH/National Heart, Lung, and Blood Institute (NHLBI; U01HL142109).
This special section is available in The Qualitative Report: https://nsuworks.nova.edu/tqr/vol26/iss6/20

The Qualitative Report 2021 Volume 26, Number 6, 2045-2060
https://doi.org/10.46743/2160-3715/2021.5013
Sort and Sift, Think and Shift: Let the Data Be Your Guide
An Applied Approach to Working With, Learning From, and
Privileging Qualitative Data
Raymond Maietta ResearchTalk Inc.
Cary, North Carolina, USA
Paul Mihas The Odum Institute for Research in Social Science
University of North Carolina, Chapel Hill, North Carolina, USA
Kevin Swartout Department of Psychology
Georgia State University, Atlanta, Georgia, USA
Jeff Petruzzelli ResearchTalk Inc.
Cary, North Carolina, USA
Alison B. Hamilton VA Center for the Study of Healthcare Innovation, Implementation & Policy
VA Greater Los Angeles Healthcare System
Department of Psychiatry and Biobehavioral Sciences
David Geffen School of Medicine
University of California Los Angeles, USA
The Sort and Sift, Think and Shift qualitative data analysis approach is an
iterative process where analysts dive into data to understand its content,
dimensions, and properties, and then step back to assess what they have learned
and to determine next steps. Researchers move from establishing an
understanding of what is in the data (“Diving In”) to exploring their relationship
to the data (“Stepping Back”). This process of “Diving In” and “Stepping Back”
is repeated throughout analysis. To conclude, researchers arrive at an evidence-
based meeting point that is a hybrid story of data content and researcher
knowledge. To illustrate core tenets of Sort and Sift, Think and Shift, we
analyzed three focus group transcripts from a study of postnatal care referral
behavior by traditional birth attendants in Nigeria; these transcripts came from
Syracuse University’s Qualitative Data Repository and were unfamiliar to the
analytic team prior to this exercise. We focused on letting the data be our guide
into not only the explicit purpose of the interviews, but also into the unexpected
discoveries that arise when inquiring about people’s lived experiences. Situating
our efforts within an Initial Learning Period, each member of the team closely
read each transcript, and then identified powerful quotations that made us pause
and take note. We documented what we learned from each transcript in an

2046 The Qualitative Report 2021
episode profile which contained diagrams and memos. Episode profiles were
shared and discussed across the team to identify key points of interest, such as
the role of faith in women’s decision-making processes related to their
pregnancy and delivery preferences, and concepts of who bears what knowledge
about reproductive health. Our engagement in this analytic exercise
demonstrates the applicability of qualitative inquiry and Sort and Sift as flexible
approaches for applied research.
Keywords: Sort and Sift, Think and Shift, qualitative inquiry, applied research,
Qualitative Data Repository
Developed and refined over the course of two decades, the Sort and Sift, Think and
Shift qualitative data analysis approach (referred to hereafter as Sort and Sift) is an iterative
process in which analysts dive into data to understand its content, dimensions, and properties,
and then step back to assess what they have learned in order to bridge findings with current
conversations in the field and to assess implications. Researchers, working individually or in
teams, move from establishing an understanding of what is in the data (“Diving In”) to
exploring their relationship to the data (“Stepping Back”). The “Diving In” and “Stepping
Back” phases are repeated throughout the analytic process (Maietta, 2006). To conclude,
researchers arrive at an evidence-based meeting point that is a hybrid story of data content and
researcher knowledge.
The Sort and Sift approach is defined by two key shifts the qualitative analyst or
analysts must make over the course of their work with data. Shift 1 occurs when analysts adjust
their analytic plans from being driven by what they knew and thought before they collected
and engaged with data, to letting the data guide their work, i.e., allowing content in individual
data documents to define analytic decision-making and directions. Shift 1 provides the raw
material for Shift 2, which occurs as analysts move from processing individual data documents
to working within and across data documents and giving careful thought and attention to what
they will present and how this material will be presented to audiences.
The Sort and Sift phases feature toolkits to facilitate analytic activities. These toolkits
are necessarily interdependent and synergistic. The “Diving In” toolkit features sorting and
sifting tools to use as analysts read, review, recognize, and record their observations during
data review:
• Quotation identification and data inventory: finding powerful quotations in the data
and creating an inventory of these data segments within and across data collection
episodes (e.g., individual interviews, focus groups, observations).
• Diagramming as an analysis tool: using visual diagrams to “suggest the content and
direction of the analysis as well as its forms” (Charmaz, 2006, p. 115), and to think
aloud about connections in data and synthesizing key ideas in the analysis.
• Memoing: using analytic notes for “catch[ing] your thoughts…” (Charmaz, 2006, p. 72)
and writing for discovery.
• Episode profiles: using diagrams and memos to create visual and written sketches of
data collection episodes and/or cases.
• Topic monitoring: creating and managing topics, themes, and attributes.
The “Stepping Back” toolkit features thinking and shifting tools to use as analysts
reflect, re-strategize, and re-orient after the “Diving In” phase of analysis:
Raymond Maietta, Paul Mihas, Kevin Swartout, Jeff Petruzzelli, and Alison Hamilton 2047
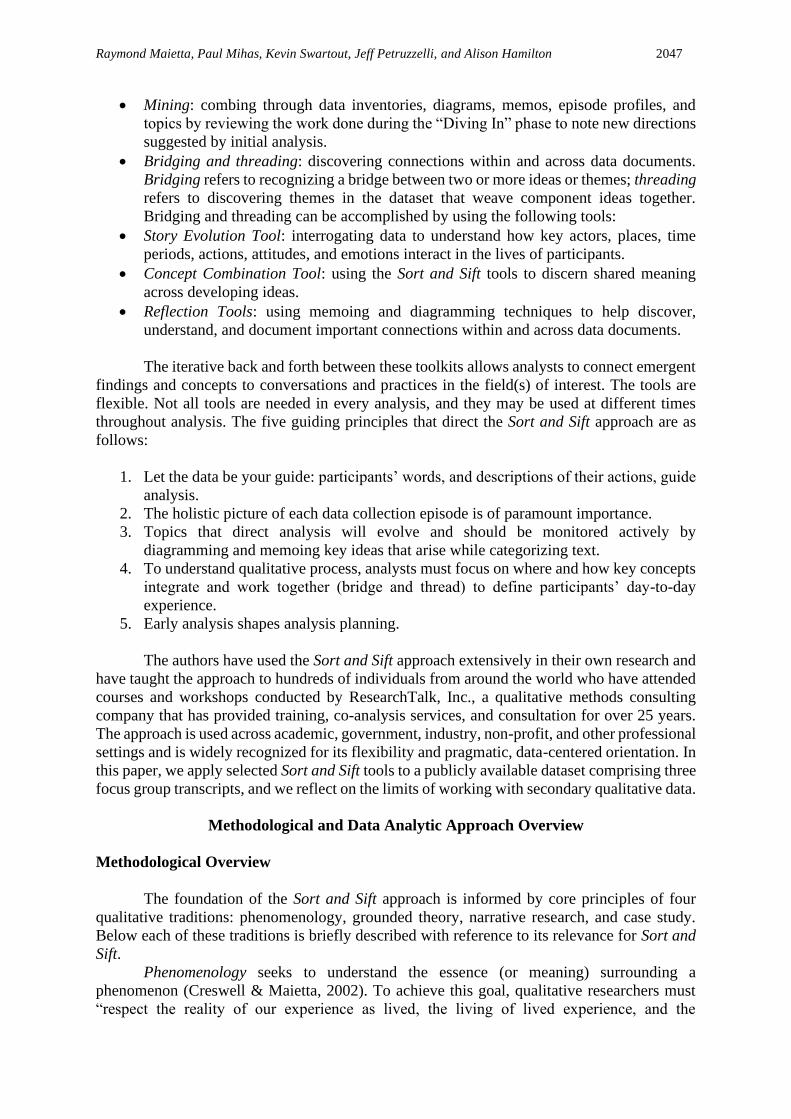
• Mining: combing through data inventories, diagrams, memos, episode profiles, and
topics by reviewing the work done during the “Diving In” phase to note new directions
suggested by initial analysis.
• Bridging and threading: discovering connections within and across data documents.
Bridging refers to recognizing a bridge between two or more ideas or themes; threading
refers to discovering themes in the dataset that weave component ideas together.
Bridging and threading can be accomplished by using the following tools:
• Story Evolution Tool: interrogating data to understand how key actors, places, time
periods, actions, attitudes, and emotions interact in the lives of participants.
• Concept Combination Tool: using the Sort and Sift tools to discern shared meaning
across developing ideas.
• Reflection Tools: using memoing and diagramming techniques to help discover,
understand, and document important connections within and across data documents.
The iterative back and forth between these toolkits allows analysts to connect emergent
findings and concepts to conversations and practices in the field(s) of interest. The tools are
flexible. Not all tools are needed in every analysis, and they may be used at different times
throughout analysis. The five guiding principles that direct the Sort and Sift approach are as
follows:
1. Let the data be your guide: participants’ words, and descriptions of their actions, guide
analysis.
2. The holistic picture of each data collection episode is of paramount importance.
3. Topics that direct analysis will evolve and should be monitored actively by
diagramming and memoing key ideas that arise while categorizing text.
4. To understand qualitative process, analysts must focus on where and how key concepts
integrate and work together (bridge and thread) to define participants’ day-to-day
experience.
5. Early analysis shapes analysis planning.
The authors have used the Sort and Sift approach extensively in their own research and
have taught the approach to hundreds of individuals from around the world who have attended
courses and workshops conducted by ResearchTalk, Inc., a qualitative methods consulting
company that has provided training, co-analysis services, and consultation for over 25 years.
The approach is used across academic, government, industry, non-profit, and other professional
settings and is widely recognized for its flexibility and pragmatic, data-centered orientation. In
this paper, we apply selected Sort and Sift tools to a publicly available dataset comprising three
focus group transcripts, and we reflect on the limits of working with secondary qualitative data.
Methodological and Data Analytic Approach Overview
Methodological Overview
The foundation of the Sort and Sift approach is informed by core principles of four
qualitative traditions: phenomenology, grounded theory, narrative research, and case study.
Below each of these traditions is briefly described with reference to its relevance for Sort and
Sift.
Phenomenology seeks to understand the essence (or meaning) surrounding a
phenomenon (Creswell & Maietta, 2002). To achieve this goal, qualitative researchers must
“respect the reality of our experience as lived, the living of lived experience, and the
2048 The Qualitative Report 2021
meaningfulness of our lives” (Van Manen, 2016, p. 12). In the words of phenomenologist Mark
Vagle: “Phenomenology is a way of living. It involves a deep and sincere commitment to, as
phenomenological philosopher Robert Sokolowski (Sokolowski, 2000) suggests, looking at
what we usually look through. It means trying to be profoundly present in our living--to leave
no stone unturned; to slow down in order to open up; to dwell with our surroundings amidst
the harried pace we may keep up; to remain open; to know that there is ’never nothing’ going
on and that we can never grasp all that is going on; and to know that our living is always a
never-ending work in progress” (Vagle, 2018, p. XII).
Consistent with phenomenology, an overarching goal of the Sort and Sift approach is
to provide strategies for qualitative data analysts to be “profoundly present” in order to discover
and discuss the lived experience of their participants. Immediately focusing on the text of
participant data by working with quotations helps to re-orient analysts from ideas they brought
to the project to the actual words and experiences of the participants. Building episode profiles
moves analysts to think contextually about what they are learning. Similarly, emphasizing
emergent topics and a focus on how component parts integrate in the flow of each person’s
daily life helps researchers “slow down in order to open up.”
Grounded theory “begins with inductive data, invokes iterative strategies of going back
and forth between data and analysis, uses comparative methods, and keeps the analyst
interacting and involved with the data and emerging analysis” (Charmaz, 2014, p. 3).
Movement between the “Diving In” and “Stepping Back” phases of the Sort and Sift approach
is intended to keep analysts actively engaged with data content in the iterative, inductive style
Charmaz describes. These activities are directive as they help analysts shape and evolve
analytic plans and steps. Grounded theory methods “consist of systematic yet flexible
guidelines for collecting and analyzing qualitative data to construct theories ‘grounded’ in the
data themselves” (Charmaz, 2014, p. 2). While analyzing data with the Sort and Sift approach,
analysts can design and refine templates for episode profiles to depict vertical stories used to
facilitate qualitative comparisons across cases. Analysts can also design horizontal approaches
to data as they assess how the topics they monitor cut across their project. Flexibility is
necessary as the core ideas that instruct analytic process cannot be known to researchers until
they dive into data to better understand its content. In this inductive, iterative fashion, analysts
acknowledge and reinforce that data are directive and answer the questions about what to do
when.
Narrative research aims to report the life experiences of individuals, often as
chronological stories of individual lives (Creswell & Maietta, 2002). Clandinin (2013)
emphasizes the importance of considering the “interconnected, nested stories in which we live”
(p. 22; e.g., cultural stories, institutional stories, personal stories) and “thinking about identities
relationally” (p. 21). Two specific activities of the Sort and Sift approach help align analysis
activities with these objectives. First, quotation identification and data inventory privilege the
words of participants and direct analysts’ focus to the detail and nuance of their day-to-day
activities. Second, designing and shaping episode profiles helps contextualize these activities
to understand better how component parts of participants’ days and identities interact.
Case study focuses on an in-depth description of a process, program, event, or activity
(Stake, 1995). Case study researchers work to “describe the cases in detail and to provide an
analysis of issues or themes that the case presents…In both description and issue development,
[they] situate the case within its context or setting” (Creswell & Maietta, 2002, p. 164). The
case study is the method of choice when the phenomenon under study is not easily
distinguishable from its context (Yin, 2011). The Sort and Sift approach facilitates researchers’
ability to depict the ways individuals and groups navigate their social world by emphasizing
and encouraging multidimensional analytic tools as the understanding of data continues to take
shape (see Brandau & Davis, 2018). Quotations alert researchers to issues pertinent to

Raymond Maietta, Paul Mihas, Kevin Swartout, Jeff Petruzzelli, and Alison Hamilton 2049
participants. These issues help to define lists of topics to pursue throughout the dataset.
Together, powerful quotations and core topics are used to shape case profiles that demonstrate
the dimensions of a case and situate actions, beliefs, and emotions in the context of everyday
processes.
Data Analytic Approach Overview
Many of the activities and techniques of the Sort and Sift approach are familiar activities
we employ on an almost daily basis:
• See it: Observe something by viewing, hearing, or reading it.
• Think about it: Contemplate (through memoing and diagramming) what it means, why
it is important, and how it might fit what you know and the purposes of your project.
• Organize it: While it is tempting to name a category that will hold your idea, hold off
on that. Initially, store quotations and data segments in a simple list. If data segments
go in a named category too quickly, they may not be recalled for new and more relevant
categories that arise later in analysis. The ideas expressed in these segments may then
be lost in that category. Do not let ideas present in your qualitative data fall on the
cutting room floor too soon. Instead, put the ideas somewhere so you can return to them.
• Compare it: Make your list of segments and topics dynamic by not simply portraying
them in a linear (list) fashion. Consider pasting them into shapes in PowerPoint and
sliding them near other like segments, or away from other segments that reflect different
ideas. This visual arrangement will make it easier to compare categories and invite
opportunities for consolidation, or elimination, of categories. Comparison is not limited
to categories alone. Memos, quotations, diagrams, cases, and episode profiles are all
tools that can be used for comparison.
• Say it: As researchers work more deeply with data segments, they contemplate how
different segments connect. Figuring out the ways different components of a dataset
integrate is a vital part of diagnosing qualitative process. Begin to “talk” about these
ideas by writing memos about them or portraying ideas in simple diagrams on
PowerPoint slides.
• Detail it: As analysis progresses, the depth of thoughts about the different pieces
engaged become clearer. Detail and nuance not only appear but gain deeper meaning.
Use memoing and diagramming to create a running conversation about details that
begin to shape the stories you see in your data.
Initial Learning Period
Critical analytic work occurs in the Initial Learning Period (ILP). We begin every data
analysis with an ILP, during which we review 3-5 data files (e.g., interview transcripts). Our
main goal for the ILP is to establish an understanding of the voices and experiences of our
participants and to document our respective voices as analysts going into the project. During
the ILP, we engage primarily with three analytic tools: quotation inventory, diagramming, and
memoing. As the ILP progresses, these early activities help to shape episode profiles and the
list of topics to be monitored (Figure 1). Though described below as components of the ILP,
these tools are used well beyond the ILP, as we will discuss.

2050 The Qualitative Report 2021
Figure 1
Sort and Sift LIP Phase
Quotation Inventory
The first read of each datafile is critical to the Sort and Sift approach. We work to ensure
that we are as present to the text of the file as possible. To accomplish this goal, we read the
file with little other activity. We suspend memoing and categorizing. Other than reading each
page of the file from beginning to end, we may highlight quotations that capture our attention,
and from those highlights, create a quotation inventory. Early in a project, quotation inventories
can serve as an index of powerful data segments. As projects progress, these inventories can
be used as a foundation to build episode profile memos and diagrams. They can also be used
to shape more specific tools that depict a holistic picture of a data collection episode and/or as
a tool to compare lived experiences across data documents. Gomez and colleagues (2019)
developed quotation inventories and then used them to develop “contraceptive maps” for
participants “in order to understand their contraceptive histories…” (p. 1370).
The quotations that researchers highlight can hold different degrees of depth. Power
quotations can depict data segments that lead you to pause and reflect (see Brandau & Davis,
2018; Stewart et al., 2020). Pulse quotations can depict rhythms in the data that drive
experience (see Black et al., 2020). “Turning point” quotations reflect uniquely powerful data
segments that literally ‘turn’ the way analysts see their data. These data segments open new
pathways for how researchers frame core conversations in their projects. In Maietta’s study of
same-sex friendship, a male participant told a story of supporting his friend as he discussed the
tenuous status of his wedding engagement (1997). This conversation fell outside the ways that
the gender and friendship literature depicted male-male friendship at the time and served as a
turning point quotation for the project. “Pack-and-go” quotations are valuable to applied
researchers. These quotations introduce findings that are intuitively of interest to researchers
and point to immediate, accessible, and actionable changes that can be made by practitioners.
In Hamilton et al.’s (2011) study of pathways to homelessness among women Veterans, the
quotation “trauma and homelessness go hand-in-hand” became a platform for work on how to
improve screening for homelessness vulnerability.
Diagramming
We build a visual inventory of quotations. This inventory might be in the form of a
limited list of powerful highlighted data segments (from each individual data document) or a

Raymond Maietta, Paul Mihas, Kevin Swartout, Jeff Petruzzelli, and Alison Hamilton 2051
PowerPoint slide that has each quotation in its own shape. Using Miles et al.’s (2018) technique
of “clustering,” we move segments into groups that cluster together. Rather than simply
clustering quotations that are alike, we group quotations that work together to build a core
theme conveyed in the document. The goal of both the list and the PowerPoint diagram is to
provide a convenient, contained (within one screen view), and holistic picture of the story told
by the quotations. Both the power quotation list and the PowerPoint diagram of quotations are
strategies that Miles et al. refer to as “displaying the data.”
Memoing
At this early stage of data engagement during the ILP, we utilize two memoing
strategies. First, we review our highlighted quotations, and for the ones we find most powerful
we answer the question, “Why did I highlight this quotation?” After this task, we review these
data segment memos to help us compose a document memo where we write about what we
learned from the individual data document that is important to the study. Exploring relationship
dynamics and pregnancy intentions, Arteaga and colleagues (2020) “created three extensive
analytic memos per couple to capture emergent themes” (p. 89).
Additionally, we compose two project memos. One of these memos is entitled, The
space I’m (or we’re) driving into. This memo outlines how we anticipate the ways our work
will fit with the work of past researchers and practitioners and those currently active in the
field. The second memo is entitled, What I know so far. The goal of this memo is to document
ideas that are in our minds as analysis begins. J. T. Maietta (2021) used the What I know so far
memo to “better understand what was occurring in the interview data and how it reflected,
extended, or conflicted with existing theory and ongoing conversations regarding chronic
illness and identity processes” (pp. 258-259). Chan (2020) engaged in memo-writing,
developing a series of What I know so far memos to document “(a) what was learned from
reading the text, and (b) why is it important to the field” (p. 107). Chan combined the memos
with the coding results to identify themes pertaining to what makes supportive housing feel
like “home” for individuals who were once homeless.
When we compose these early-stage memos, some of our ideas come from our
understanding of the literature and others come from our impressions after being in the field
collecting data. These memos are meant to be living, breathing documents. We treat the content
of these files as an ongoing conversation, and necessarily return to them as we continue to
analyze data. We continue writing in each of these memos as projects progress. We use our
discoveries from data review to add emergent content into the conversations we laid out in
these memos at the beginning of a project. This exercise puts our evolving understandings of
project content into writing.
Episode Profiles
Taken together, the quotation inventory, the top quotations list, and/or the cluster
diagram, plus the document memo, constitute the initial content for episode profiles. The goal
of an episode profile is to tell a holistic, vertical story of each interview, focus group, fieldnote,
or other type of qualitative data collection episode. Across a project, these accessible and
representative stories of each case serve as diagnostic and comparative tools that demonstrate
each individual’s lived experience or the essence of each episode. Pahwa and colleagues used
Sort and Sift for their analysis of interviews with individuals with serious mental illnesses
regarding safety concerns (Pahwa, Dougherty, et al., 2020) and concepts of community
integration (Pahwa, Smith, et al., 2020). Specifically, they used diagrams, memos, key
quotations, and episode profiles to develop their themes. In their study of Black student

2052 The Qualitative Report 2021
Veterans in engineering, Brawner and colleagues (2019) used episode profiles to “summarize
each student’s experiences holistically…highlighting key points and illustrative quotes” (pp.
4-5). Bush and colleagues (2020) used PowerPoint to “develop a visual depiction of each of
the reviewed transcripts (i.e., episode profiles)” (p. 336).
Topic Monitoring
Topic monitoring, a dynamic form of coding, is an active approach to discovering and
learning from topics that define, describe, and direct the lived experiences and perspectives of
participants. It is done in concert with the reflection contained within memos about each topic
and diagrams that display quotations assigned to each topic. There are three main goals for
monitoring topics within diagrams and memos. First, we monitor how topics provide detail for
components of lived experience, such as circumstances, behaviors, thoughts, and feelings.
Second, we monitor the ways topics interact with each other within and across participant
stories. Third, we monitor how the topics evolve over the course of analysis. Topic integration
takes priority over identification and summary of key ideas.
ILP Process Outcomes
As we move through the ILP, we audit the quality of data collection. Specifically,
consistent with grounded theory (Charmaz, 2014) and phenomenology (Vagle, 2018), we
check that the following goals are being accomplished in the field:
• Are we asking the right questions?
• Are we asking the right questions to the right people?
• Are we asking the right questions in the right way?
• Are we asking the right questions at the right time?
When possible, we start the ILP after the first three to five data files are available,
intentionally to pause data collection for this data quality check and make any necessary
adjustments. The time to ask these questions is not at the end of a project, when it is too late to
make adjustments that might have improved the quality of the data and the data collection
experience for the researchers and the participants.
Moving on from the ILP
The ILP is stage-setting for the remainder of a project. After it is complete, we step
back to mine our work. Each data analysis component we created during the ILP helps to
shape our growing understanding of how the data are informing and advancing our knowledge.
We work to design vertical episode profile templates that represent a holistic picture of each
data collection episode. Additionally, the mining of the content we produced helps us decide
on core topics we will monitor horizontally throughout the project. Together, these tools enable
systematic comparisons.
We always begin interaction with data documents by reading them and only
highlighting quotations. In the second round of “Diving In,” after the ILP, we continue our
quotation inventory of each document by assigning quotations to our topics and placing key
quotations within our episode profiles. Once we complete these tasks for the second set of files,
we step back to mine our episode profiles and topics (Figure 2). As we do this review, we work
to understand how ideas work together within and across episode profiles and across topics.
We also monitor for larger themes that may thread through the project. These threads typically

Raymond Maietta, Paul Mihas, Kevin Swartout, Jeff Petruzzelli, and Alison Hamilton 2053
are stronger driving forces that elucidate the lived experiences and perspectives of our
participants.
Figure 2
Post-ILP Sort and Sift Processes
Data Source
Data for this analysis were drawn from a study of postnatal care referral behavior by
Traditional Birth Attendants (TBAs) in Nigeria, including the perceived factors that may deter
or promote referrals to skilled health workers (Chukwuma et al., 2017a, 2017b). The study was
conducted in July 2016 in Ebonyi State, South-Eastern Nigeria, where about one in two
mothers does not receive postnatal care within the first two days of childbirth. As part of a
larger mixed methods study, the study team purposively selected and sampled from 128 wards
in Ebonyi State that had at least one primary healthcare facility with a healthcare provider
offering maternal postnatal care. The study team conducted three focus groups: one with female
health workers (n=8 participants), one with TBAs (n=10 participants), and one with TBA
delivery clients (n=10 participants). The interview guides for this study were developed in line
with the study’s conceptual framework, which drew on constructs in Ajzen and Fishbein’s
(1980) Theory of Reasoned Action. These data and study materials were obtained from
Syracuse University’s Qualitative Data Repository (QDR - http://qdr.syr.edu), a dedicated
archive for storing and sharing digital data (and accompanying documentation) generated or
collected through qualitative and multi-method research in the social sciences (Chukwuma et
al., 2017b).
Analytic Process
Working as a team, as we began the analysis, we familiarized ourselves with the project.
We reviewed literature regarding traditional birth attendants and maternal postnatal care in
Nigeria, and we briefly reviewed the theoretical framework for the study. What we learned
from this exercise formed the initial content of our What we know so far memo and helped us
shape our Space we’re driving into memo. This exercise gave us background knowledge of the

2054 The Qualitative Report 2021
factors motivating the study, clarified where contributions could be made to the literature, and
helped us identify the need for applied practice improvements in perinatal care in Nigeria.
Figure 3
One Analyst’s Episode Profile Memo: TBA Client Focus Group Episode Profile Memo
Following the initial writing of these two memos, we “dove into” each focus group.
Each team member independently read each transcript in full, highlighting segments that were
of interest to us, without commenting or further processing. Next, each analyst built an episode
profile diagram and/or memo. Two analysts worked together to paste the highlighted segments
into PowerPoint slides and began thinking about them, processing them, and clustering them
in diagrams. One analyst engaged in a similar process but in narrative form in an episode profile
memo in Word (Figure 3). Our memos were guided by the question: “What did I learn from
this data collection episode?”
Taken together, the episode profile quotation diagram and episode profile memo
constituted an overall episode profile for each focus group consisting of a quotation inventory
for each file in diagram form and an analyst reflection in memo form for each data file. Our
analysis meetings provided an opportunity for us to step back and mine the work we did with
each data file. We discussed our respective episode profiles to unearth topics within and across
the three focus groups.
After my first read of the TBA client focus group, these issues seemed worthy of
consideration across the project. For each issue I’ve listed, I’ve included a quotation that
brought the issue to my attention.
• Knowledge of requirement for immunizations seems high
• “…you take your child to the hospital for immunization so as to prevent the child
from contracting communicable diseases”
• Women’s experiences and what they’ve heard of other women’s experiences
influence their perceptions of the TBAs and the health centers (think about peer
influence)
• “…the TBAs do not give the women those unnecessary tears that the health
workers usually give the women in the hospital”
• $ and socioeconomic status play into utilization of health center
• “When the money is not there, and the person seems to be strong, they might
decide to wait for some time for the money to come…”
• Bringing care to remote communities seems appealing
• “I think you can help by building a health center in these remote parts of the
community where it will be close to the people…”
• TBAs have herbal meds, health centers have drugs
• “If you are pregnant, you can go for antenatal care in the health facility and also
take the herbal drugs from the TBAs, but you don’t have to take the drugs from
the health center on the day you take the herbal drugs.”
• Emotional support seems to be perceived to come more from TBAs
• “…the TBA will hold you and console you while in pain ‘til you delivery your
baby.”
• Hospital associated by some with death, emergencies, inappropriate care
• “…if the baby is weak after delivery, they will sprinkle water on the baby while
still attached to the placenta, so that baby will gain strength before they cut the
placenta, but the hospital will just cut off the placenta and the baby will die.”

Raymond Maietta, Paul Mihas, Kevin Swartout, Jeff Petruzzelli, and Alison Hamilton 2055
We found that the team-based process of identifying and characterizing common topics
was best facilitated by active use of diagramming (in PowerPoint) in real time during our
meetings. We were moving around quotations, drawing arrows between quotations, and
dynamically engaging with topics that we observed to be salient to the lived experiences of the
health workers, TBAs, and TBA clients. This process helped us identify powerful themes that
threaded across the dataset. One of the most powerful themes was the role TBAs and their
clients assigned to God throughout the women’s pregnancies, birth experiences, and post-
delivery recovery period. We used PowerPoint to create a diagram to demonstrate the content
and conviction contained in quotations where God was referenced (see Figure 4 in the example
findings section below). We also noted that God was not mentioned in the health worker focus
group.
During the course of our independent and group-based work with the data, we
consistently reflected on the data collection effort itself, noting in memos where we had
additional or alternative questions we might have asked (asking, e.g., “are these the right
questions?” and “are the right questions being asked in the right way?”), and considering what
more we might have wanted to know and/or do for the study. As noted above, this is a critical
component of the ILP, to critically evaluate the quality of data collection and if possible, make
any necessary adjustments. Although not possible with secondary data, we felt it was important
to maintain our lens on data quality, even if only hypothetical in the case of this secondary data.
As we continued to mine the work we had done, we began to consolidate our example
findings for the purpose of this exercise. Even if our preliminary findings did not necessarily
align with the stated purpose of the study, we discussed data that surprised us and that we felt
warranted further investigation. We chose this angle on the data to foreground the iterative,
serendipitous, and directive nature of qualitative inquiry and the Sort and Sift approach, with
an eye toward what we could not have known or anticipated before collecting qualitative data.
This speaks to one of the Sort and Sift themes of “because it was qualitative,” i.e., privileging
qualitative data for its unique ability to illuminate that which we did not and would not know
without talking to people and observing what they do and how they live and behave.
Example Findings
We focus here on example findings that we felt the data gave us “permission” to
describe. This was particularly important because our work with the data relied solely on the
available transcripts, not on the knowledge gained from designing the study and collecting the
data. We briefly reflect on three example findings and how Sort and Sift tools brought us to
these findings.
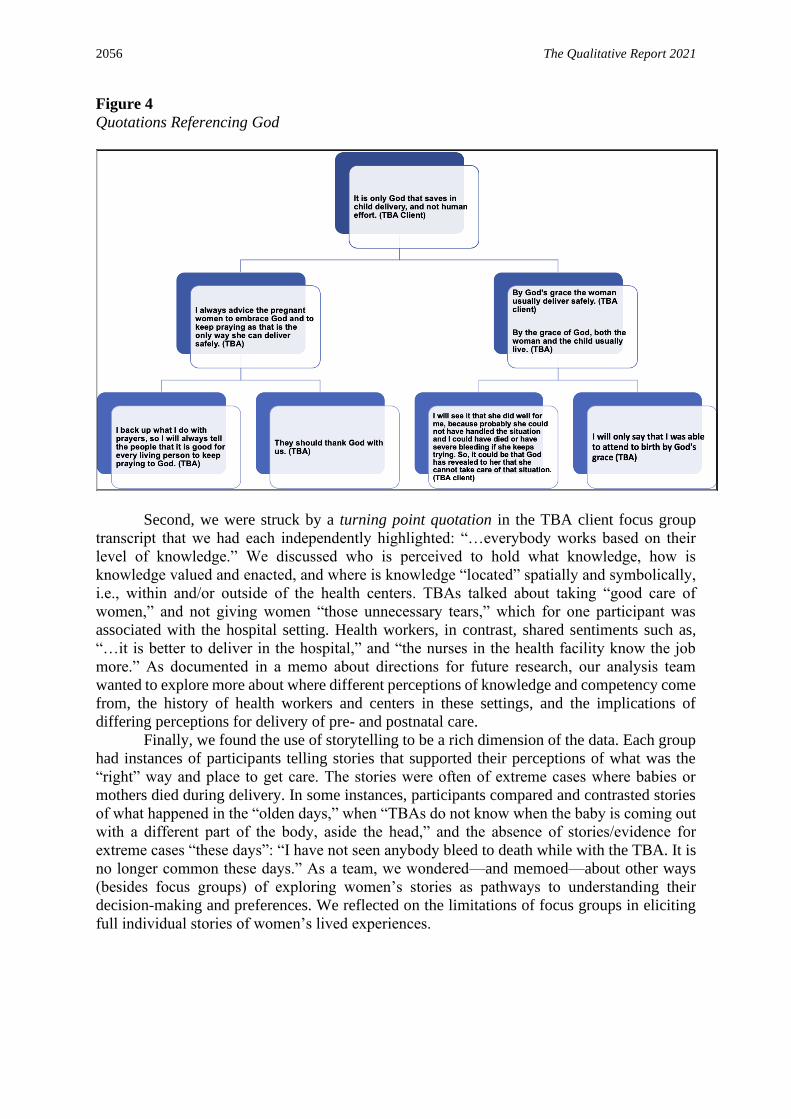
First, in our respective episode profiles and quotation inventories, we each identified
data that pertained to TBA clients’ references to God and God’s role in labor and delivery, and
in the work of the TBAs. The quotations in Figure 4 demonstrate the strength and conviction
in women’s references to God’s presence and God’s role in the childbirth experience. God is
conveyed as having absolute power in the situation: “It is only God that saves in child delivery,
and not human effort.” Both TBAs and their clients cite the “grace of God” as the driving force
to a safe delivery. TBAs stress the importance of prayer and thanking God. In both the TBA
client group and the TBA group, God is also cited as directing the TBA to attend the birth and
helping to make decisions during the labor and delivery.
2056 The Qualitative Report 2021
Figure 4
Quotations Referencing God
Second, we were struck by a turning point quotation in the TBA client focus group
transcript that we had each independently highlighted: “…everybody works based on their
level of knowledge.” We discussed who is perceived to hold what knowledge, how is
knowledge valued and enacted, and where is knowledge “located” spatially and symbolically,
i.e., within and/or outside of the health centers. TBAs talked about taking “good care of
women,” and not giving women “those unnecessary tears,” which for one participant was
associated with the hospital setting. Health workers, in contrast, shared sentiments such as,
“…it is better to deliver in the hospital,” and “the nurses in the health facility know the job
more.” As documented in a memo about directions for future research, our analysis team
wanted to explore more about where different perceptions of knowledge and competency come
from, the history of health workers and centers in these settings, and the implications of
differing perceptions for delivery of pre- and postnatal care.
Finally, we found the use of storytelling to be a rich dimension of the data. Each group
had instances of participants telling stories that supported their perceptions of what was the
“right” way and place to get care. The stories were often of extreme cases where babies or
mothers died during delivery. In some instances, participants compared and contrasted stories
of what happened in the “olden days,” when “TBAs do not know when the baby is coming out
with a different part of the body, aside the head,” and the absence of stories/evidence for
extreme cases “these days”: “I have not seen anybody bleed to death while with the TBA. It is
no longer common these days.” As a team, we wondered—and memoed—about other ways
(besides focus groups) of exploring women’s stories as pathways to understanding their
decision-making and preferences. We reflected on the limitations of focus groups in eliciting
full individual stories of women’s lived experiences.

Raymond Maietta, Paul Mihas, Kevin Swartout, Jeff Petruzzelli, and Alison Hamilton 2057
Applications for Applied Research Practices
The Sort and Sift, Think and Shift approach has a growing presence in the applied
qualitative research literature, with many instances of its application in diverse fields such as
nursing (Brandau & Davis, 2018; Campbell et al., 2020), health communication (Burgess et
al., 2019), pharmacy (Bush et al., 2020), reproductive health (Black et al., 2020; Gomez et al.,
2018, 2019, 2021), education (Oakes et al., 2020; Piggott et al., 2015), mental health (Pahwa,
Dougherty, et al., 2020), nutrition (Pankhurst et al., 2019), research engagement (Fryer et al.,
2016; Passmore et al., 2016), and public health and health promotion (Passmore et al., 2017).
With regard to the current exercise, from a practical perspective, our individual and
team-based analysis of these transcripts was relatively swift. We each spent two to three hours
reading and highlighting the transcripts, two to three hours working with the analytic tools
(e.g., quotation inventories, diagrams, memos), roughly five hours in meetings discussing our
work with the data, and two hours preparing the example findings. We opted for a mix of
individual and team-based work that allowed us to illustrate: (1) the flexible use of the Sort and
Sift tools to suit the unique content emerging from the data; (2) the ability to use more than one
tool to interrogate an emerging point; and, (3) the ability to choose tools according to individual
styles and preferences of each analyst (e.g., “I am a visual thinker” or “I write for discovery in
memos”).
As noted above, Sort and Sift draws on several traditions, offering a set of multifaceted
practical and applied tools that can be variably used depending on the unique nature of different
datasets, intended products and the background and skill of individual analysts. With applied
research, products often require rapid turn-around. We identified “pack-and-go” findings that
had applied implications, such as affordability and accessibility issues that factored into
women’s ability to use the health centers. As these findings emerged, we used quotation
inventories and memos to store them and reflect on their importance to the study. Placement
of findings in accessible visual displays and memos facilitates efficient movement from
evidence grounded in the data to practice, policy, theory, and/or future research.
Conclusions
We went into this exercise relatively naïve to the topic and the study. The information
that accompanied the data was basic and left us wanting to learn more about the background
that motivated the study. When working with secondary data it is rare to have access to the
principal investigators. In this scenario, the possibility of asking direct questions about the
history and context of the topic being studied is eliminated. When using secondary data,
researchers should critically assess the data to be engaged. Is the project topic compelling and
relevant? Do the sample design, data collection approaches and questions align with the project
topic, questions, and mission? Is the quality of data collection strong? Does the transcription
and translation quality seem accurate and high? Are there open questions not addressed by the
data that are available? If researchers have any hesitancy after answering these questions, they
should reconsider before they proceed with the project. Lastly, note that the quality of the
accompanying information for a secondary data project is as important as the quality of the
data.
When we work with data that is not our own, we use ResearchTalk’s co-analysis
approach. The co-analysis method requires shared decision-making between a research team
and a research methods consulting team. The research team (topical experts) typically ensures
that the deductive points of inquiry outlined in a project proposal are addressed, while the
consultants (technical experts) take responsibility for emergent discovery (see e.g., Fryer et al.,
2016; Smolen et al., 2019). The teams can work together on study design, ensuring shared
2058 The Qualitative Report 2021
agreement on data quality and integrity and shared decision-making on how analysis plans
develop and evolve.
Across project types, the data-driven processes of Sort and Sift allow us to be confident
that the data give us permission to make the claims we put forth in our work. The
multidimensionality of Sort and Sift provided us with a variety of ways in which to engage
efficiently with these focus group data. Our engagement in this analytic exercise demonstrates
the applicability of qualitative inquiry and Sort and Sift as flexible approaches for applied
research.
References
Ajzen, H., & Fishbein, M. (1980). Understanding attitudes and predicting social behavior.
Pearson.
Arteaga, S., Downey, M. M., Freihart, B., & Gómez, A. M. (2020). “We kind of met in‐
between”: A qualitative analysis of young couples’ relationship dynamics and
negotiations about pregnancy intentions. Perspectives on Sexual and Reproductive
Health, 52(2), 87-95.
Black, K. Z., Eng, E., Schaal, J. C., Johnson, L.-S., Nichols, H. B., Ellis, K. R., & Rowley, D.
L. (2020). The other side of through: Young breast cancer survivors’ spectrum of sexual
and reproductive health needs. Qualitative Health Research, 30(13), 2019-2032.
Brandau, M., & Davis, M. (2018). “I need someone: Adolescent victims’ reflections on
cyberbullying. Journal of Nursing and Health Care, 1, 1-6.
Brawner, C., Mobley, C., Main, J., Camacho, M., & Lord, S. (2019). The enactment of race
and veteran identities among black male student veterans in engineering. Paper
presented at the Collaborative Network for Engineering and Computing Diversity
(CoNECD) Conference.
Burgess, D. J., Bokhour, B. G., Cunningham, B. A., Do, T., Gordon, H. S., Jones, D. M., Pope,
C., Saha, S., & Gollust, S. E. (2019). Healthcare providers’ responses to narrative
communication about racial healthcare disparities. Health Communication, 34(2), 149-
161.
Bush, A. A., Amechi, M., & Persky, A. (2020). An exploration of pharmacy education
researchers’ perceptions and experiences conducting qualitative research. American
Journal of Pharmaceutical Education, 84(3). https://doi.org/10.5688/ajpe7129
Campbell, K. A., MacKinnon, K., Dobbins, M., Jack, S. M., & Project, B. C. H. C. (2020).
Nurse-family partnership and geography: An intersectional perspective. Global
Qualitative Nursing Research, 7. https://doi.org/10.1177/2333393619900888
Chan, D. V. (2020). Safe spaces, agency, and connections to “regular stuff”: What makes
permanent supportive housing feel like “home”. Rehabilitation Counseling Bulletin,
63(2), 102-114.
Charmaz, K. (2014). Constructing grounded theory. Sage.
Chukwuma, A., Mbachu, C. Cohen, J., McConnell, M., & Bossert, T. (2017a). A qualitative
study of perspectives on postnatal care referrals by traditional birth attendants in
Ebonyi State, Nigeria (QDR 10078) [Data set].
Chukwuma, A., Mbachu, C., Cohen, J., Bossert, T., & McConnell, M. (2017b). “Once the
delivery is done, they have finished”: A qualitative study of perspectives on postnatal
care referrals by traditional birth attendants in Ebonyi state, Nigeria. BMC Pregnancy
and Childbirth, 17(1), 1-10.
Clandinin, D. J. (2013). Engaging in narrative inquiry. Routledge.
Creswell, J., & Maietta, R. (2002). Qualitative research. In D. C. S. Miller & J. Neil (Ed.),
Handbook of research design & social measurement (6th ed., pp. 145-196). Sage.

Raymond Maietta, Paul Mihas, Kevin Swartout, Jeff Petruzzelli, and Alison Hamilton 2059
Fryer, C. S., Passmore, S. R., Maietta, R., Petruzzelli, J., Casper, E., Brown, N. A., Butler III,
F. J., Garza, M. A., Thomas, S. B, & Quinn, S. C. (2016). The symbolic value and
limitations of racial concordance in minority research engagement. Qualitative Health
Research, 26(6), 830-841.
Gomez, A. M., Arteaga, S., Aronson, N., Goodkind, M., Houston, L., & West, E. (2019). No
perfect method: Exploring how past contraceptive methods influence current attitudes
toward intrauterine devices. Archives of Sexual Behavior, 49(4), 1-12.
Gomez, A. M., Arteaga, S., & Freihart, B. (2021). Structural inequity and pregnancy desires in
emerging adulthood. Archives of Sexual Behavior, 1-12.
Gomez, A. M., Arteaga, S., Ingraham, N., Arcara, J., & Villaseñor, E. (2018). It's not planned,
but is it okay? The acceptability of unplanned pregnancy among young people.
Women's Health Issues, 28(5), 408-414.
Hamilton, A. B., Poza, I., & Washington, D. L. (2011). “Homelessness and trauma go hand-
in-hand”: Pathways to homelessness among women veterans. Women's Health
Issues, 21(4), S203-S209.
Maietta, J. T. (2021). Integrating illness management into identity verification processes.
Qualitative Health Research, 31(2), 254-270.
Maietta, R. (1997). Lost in the shuffle: In search of wayward friendship. [Doctoral dissertation,
State University of New York at Stony Brook].
Maietta, R. (2006). State of the art: Integrating software with qualitative analysis. In L. Curry,
R.R. Shield, & T.T. Wetle (Eds.), Aging and public health research: Qualitative and
mixed methods (pp. 117-139): American Public Health Association.
Miles, M. B., Huberman, A. M., & Saldaña, J. (2018). Qualitative data analysis: A methods
sourcebook. Sage.
Oakes, L. R., Hickerson, B., & Milroy, J. J. (2020). Let's talk about health: Engaging college
students with intellectual and/or developmental disabilities and support staff in
conversations about health and wellness needs. Journal of Inclusive Postsecondary
Education, 2(1).
Pahwa, R., Dougherty, R. J., Kelly, E., Davis, L., Smith, M. E., & Brekke, J. S. (2020). Is it
safe? Community integration for individuals with serious mental illnesses. Research on
Social Work Practice. https://doi.org/10.1177/1049731520951628
Pahwa, R., Smith, M. E., Kelly, E. L., Dougherty, R. J., Thorning, H., Brekke, J. S., &
Hamilton, A. (2020). Definitions of community for individuals with serious mental
illnesses: Implications for community integration and recovery. Administration and
Policy in Mental Health and Mental Health Services Research, 48, 143–154.
Pankhurst, M., Mehta, K., Matwiejczyk, L., Moores, C. J., Prichard, I., Mortimer, S., & Bell,
L. (2019). Treats are a tool of the trade: an exploration of food treats among
grandparents who provide informal childcare. Public Health Nutrition, 22(14), 2643-
2652.
Passmore, S., Fryer, C. S., Butler III, J., Garza, M. A., Thomas, S. B., & Quinn, S. C. (2016).
Building a “deep fund of good will”: Reframing research engagement. Journal of
Health Care for the Poor and Underserved, 27(2), 722.
Passmore, S., Williams-Parry, K. F., Casper, E., & Thomas, S. B. (2017). Message received:
African American women and breast cancer screening. Health Promotion Practice,
18(5), 726-733.
Piggott, T., Morris, C., & Lee-Poy, M. (2015). Preceptor engagement in distributed medical
school campuses. Canadian Medical Education Journal, 6(2), e20.
Smolen, J. R., Wang, J. J., & Anane, S. P. (2019). Challenges and strategies for hypertension
management: Qualitative analysis of small primary care practices with varying blood
pressure control. Family Practice, 36(5), 644-649.

2060 The Qualitative Report 2021
Sokolowski, R. (2000). Introduction to phenomenology. Cambridge University Press.
Stake, R. E. (1995). The art of case study research. Sage.
Stewart, T. J., Linder, C., Evans, M. E., Quaye, S. J., & Lange, A. C. (2020). “You hired me to
do this”: Power, identity, and student activist support. Journal of Student Affairs
Research and Practice, 1-15. https://doi.org/10.1080/19496591.2020.1778486
Vagle, M. D. (2018). Crafting phenomenological research. Routledge.
Van Manen, M. (2016). Phenomenology of practice: Meaning-giving methods in
phenomenological research and writing. Routledge.
Yin, R. K. (2011). Applications of case study research. Sage.
Author Note
Raymond Maietta, Ph.D., is President of ResearchTalk Inc., a qualitative research
consulting and professional development company he founded in 1996. More than 30 years of
consultation with qualitative researchers informs Dr. Maietta’s publications and his team’s
design of the Sort and Sift, Think and Shift qualitative inquiry approach.
Paul Mihas, M.A., is the Assistant Director of Qualitative Research at the Odum
Institute for Research in Social Science at UNC-Chapel Hill and a senior consultant with
ResearchTalk Inc. Recent (2019) publications include chapters in the Oxford Encyclopedia of
Qualitative Research Methods in Education and Research Design and Methods (SAGE).
Kevin Swartout, Ph.D., is a Professor of Psychology and Public Health at Georgia State
University (GSU) and a senior consultant with ResearchTalk Inc. He directs the Violence
Against Women Prevention Lab at GSU and conducts research on aggression, violence, and
victimization.
Jeff Petruzzelli, B.A., is a Qualitative Research Specialist at ResearchTalk Inc., a
qualitative research consulting company. 2021 marks his 20th year at ResearchTalk. He co-
teaches professional development workshops and works on a range of qualitative projects, and
is a co-designer of the Sort and Sift, Think and Shift qualitative inquiry approach.
Alison Hamilton, Ph.D., M.P.H., is a VA Health Services Research & Development
Research Career Scientist, a Professor-in-Residence in the UCLA Department of Psychiatry
and Biobehavioral Sciences, and a senior consultant with ResearchTalk Inc. Her work focuses
on improving quality and experiences of health care among underrepresented populations.
Please direct correspondence to [email protected].
Acknowledgements: The authors would like to thank Alexandra Bailey for her
contributions to the analytic process. Dr. Hamilton was partially supported by the VA Quality
Enhancement Research Initiative (QUERI; QUE 15-272, QUE 20-028), VA Health Services
Research & Development (HSR&D; SDR 10-012), and NIH/National Heart, Lung, and Blood
Institute (NHLBI; U01HL142109).
Copyright 2021: Raymond Maietta, Paul Mihas, Kevin Swartout, Jeff Petruzzelli,
Alison Hamilton, and Nova Southeastern University.
Article Citation
Maietta, R., Mihas, P., Swartout, K., Petruzzelli, J., & Hamilton, A. (2021). Sort and sift, think
and shift: Let the data be your guide – An applied approach to working with, learning
from, and privileging qualitative data. The Qualitative Report, 26(6), 2045-2060.
https://doi.org/10.46743/2160-3715/2021.5013