sonja c. krüger univeristy of cape town
TRANSCRIPT

Univeri
sty of
Cap
e Tow
n
An Investigation into the Decline of the Bearded Vulture
Gypaetus barbatus in Southern Africa
\\\\
Sonja C. Krüger
August 2014
Dissertation presented for the degree of Doctor of Philosophy Percy FitzPatrick Institute of African Ornithology
DST/NRF Centre of Excellence Department of Biological Sciences, Faculty of Science
University of Cape Town
Supervised by Dr. Arjun Amar and Dr. Robert E. Simmons

The copyright of this thesis vests in the author. No quotation from it or information derived from it is to be published without full acknowledgement of the source. The thesis is to be used for private study or non-commercial research purposes only.
Published by the University of Cape Town (UCT) in terms of the non-exclusive license granted to UCT by the author.
Univers
ity of
Cap
e Tow
n


i
The copyright of this thesis vests in the author. No quotation from it or information derived from it is to be published without full acknowledgement of the source. The thesis is to be used for private study or non-commercial research purposes only. Published by the University of Cape Town (UCT) in terms of the non-exclusive license granted to UCT by the author.
Recommended citation:
Krüger SC (2014) An Investigation into the Decline of the Bearded Vulture Gypaetus barbatus in Southern Africa. PhD Thesis, Percy FitzPatrick Institute, University of Cape Town, South Africa, pp 235.

ii

iii
Declaration
This dissertation reports original research that I conducted under the auspices of the Percy
FitzPatrick Institute, University of Cape Town. I declare that all of the work in the
dissertation, save for that which is properly acknowledged, is my own both in conception and
execution. The work was carried out in accordance with the requirements of the University's
Regulations and Code of Practice for Research Degree Programmes and with the approval
of the Animal Ethics Committee. This work has not been submitted in any form for a degree
at another university.
15/08/2014
………………………….. ………………………….. Signed: Sonja C. Krüger Date:
Signature Removed

iv

v
Table of Contents Abstract ................................................................................................................................. viii
Acknowledgements .................................................................................................................. x
Chapter 1: Introduction ....................................................................................................... 1
Chapter 2: Trends in territory occupancy, distribution and density of the Bearded Vulture Gypaetus barbatus in southern Africa ................................................................................... 35
Abstract ............................................................................................................................. 37
Introduction ........................................................................................................................ 37
Methods ............................................................................................................................. 41
Census of Former and Current Breeding Territories ..................................................... 41
Estimating Territory Occupancy and Population Size .................................................... 43
Estimating Breeding Distribution and Density ................................................................ 45
Estimating Encounter Rates .......................................................................................... 45
Core versus Peripheral Territories ................................................................................. 45
Statistical Analyses ........................................................................................................ 46
Results .............................................................................................................................. 46
Territory Occupancy and Population Size ..................................................................... 46
Current Population Estimate .......................................................................................... 50
Breeding Distribution and Density ................................................................................. 50
Core versus Peripheral Territories ................................................................................. 53
Discussion ......................................................................................................................... 55
Acknowledgements ........................................................................................................... 58
References ........................................................................................................................ 59
Appendices ........................................................................................................................ 66
Chapter 3: Anthropogenic activities influence the abandonment of Bearded Vulture Gypaetus barbatus territories in southern Africa ................................................................... 69
Abstract ............................................................................................................................. 71
Introduction ........................................................................................................................ 71
Methods ............................................................................................................................. 75
Study Area ..................................................................................................................... 75
Extraction of Covariates Surrounding Each Territory .................................................... 76
Statistical Analyses ........................................................................................................ 79
Results .............................................................................................................................. 80
Influence of Environmental Variables on Territorial Abandonment ................................ 81
Discussion ......................................................................................................................... 88
Acknowledgements ........................................................................................................... 92

vi
References ........................................................................................................................ 92
Appendices ...................................................................................................................... 101
Chapter 4: Differential range use and anthropogenic risk exposure between age classes of southern African Bearded Vultures Gypaetus barbatus ...................................................... 105
Abstract ........................................................................................................................... 107
Introduction ...................................................................................................................... 107
Methods ........................................................................................................................... 111
Capture and Marking ................................................................................................... 111
Ethics Statement .......................................................................................................... 114
Spatial and Temporal Analyses ................................................................................... 114
Home Range Size ........................................................................................................ 115
Home Range Use ........................................................................................................ 116
Estimating Exposure to Risks and Benefits between Age Classes ............................. 116
Results ............................................................................................................................ 119
Home Range Size ........................................................................................................ 119
Home Range Use ........................................................................................................ 125
Comparison of Exposure to Risks and Benefits between Age Classes ....................... 127
Discussion ....................................................................................................................... 128
Acknowledgements ......................................................................................................... 133
References ...................................................................................................................... 134
Appendices ...................................................................................................................... 144
Chapter 5: Genetic structure in the Bearded Vulture Gypaetus barbatus: reduced diversity in southern Africa ................................................................................................................ 147
Abstract ........................................................................................................................... 149
Introduction ...................................................................................................................... 149
Methods ........................................................................................................................... 151
Samples ....................................................................................................................... 151
DNA Isolation, Polymerase Chain Reaction (PCR) and Sequencing .......................... 151
Analyses ...................................................................................................................... 151
Results ............................................................................................................................ 152
Discussion ....................................................................................................................... 153
Acknowledgements ......................................................................................................... 157
References ...................................................................................................................... 157
Appendices ...................................................................................................................... 161
Chapter 6: Poisoning increases the extinction risk of the Bearded Vulture Gypaetus barbatus in southern Africa ................................................................................................. 163

vii
Abstract ........................................................................................................................... 165
Introduction ...................................................................................................................... 166
Methods ........................................................................................................................... 168
Age Structure ............................................................................................................... 170
Productivity .................................................................................................................. 171
Estimation of Survival Rates ........................................................................................ 173
Quantifying Causes of Mortality ................................................................................... 174
Population Modelling ................................................................................................... 175
Statistical Analyses ...................................................................................................... 176
Results ............................................................................................................................ 176
Age Structure ............................................................................................................... 176
Productivity .................................................................................................................. 177
Annual Survival Estimates and Causes of Mortality .................................................... 179
Population Growth Rate ............................................................................................... 181
Discussion ....................................................................................................................... 186
Acknowledgements ......................................................................................................... 191
References ...................................................................................................................... 192
Appendices ...................................................................................................................... 201
Chapter 7: Discussion .................................................................................................... 203
Conclusions ..................................................................................................................... 216

viii
Abstract
The Bearded Vulture Gypaetus barbatus is a Critically Endangered species in southern
Africa whose entire range in the Southern Hemisphere falls within the Maloti-Drakensberg
mountains of South Africa and Lesotho, which forms the area of focus for this research. In
this thesis I have attempted to synthesize 15 years of research on the Bearded Vulture
population of southern Africa using various approaches to quantify the decline in the
species, investigate the mechanisms of this decline and determine the most appropriate
management actions necessary to attain the short-term species’ conservation target of a
positive population growth rate.
Firstly I assessed the territory occupancy, distribution and density of the population
over two time periods to identify population trends. The number of occupied territories
decreased by between 32%-51%, the breeding range decreased by 27% and breeding
densities decreased by 20% over the past five decades. The birds occupy a breeding range
of 28,125 km2 with higher densities recorded in the core of the range than in the peripheral
areas. The population is estimated at between 368-408 individuals (109-221 breeding pairs).
Three hypotheses were then examined in an attempt to explain which factors were
associated with territories recorded as abandoned; those related to human impact, food
availability and climate change. Of the seven covariates examined within the home range of
an adult pair using a model selection process using Akaike’s Information Criterion, the
strongest support was for the human impact hypothesis, with abandonment more likely in
territories with higher densities of power lines and human settlements. These findings were
in accordance with the main causes of mortality.
The movements of all age classes were investigated using data from satellite
transmitters affixed to 18 birds to determine exposure to perceived benefits or anthropogenic
risks. The overall foraging range of the population was estimated to be 51,767 km2 and non-
adults were found to use 65% of this area whereas adults focussed their activities in an area

ix
of about 286 km2 around their nests. Non-adults increased the size of their range as they
aged, with birds aged between 4-6 years facing the greatest exposure to risk factors.
The genetic risk was examined by sampling two populations in sub-Saharan Africa to
ascertain genetic variation, evolutionary placement and connectivity using Mitochondrial
DNA fragment analyses. My results showed little to no differentiation between populations in
southern Africa and Ethiopia suggesting that translocations of individuals from Ethiopia could
be considered for introduction into the local population. The reduced haplotype diversity
found in southern Africa suggests that translocations may be necessary to improve genetic
diversity.
Lastly I used population viability analysis models to determine the future population
trend and identify the primary demographic and environmental constraints on the population.
The models predicted a negative growth rate for the population over the next 50 years
(λ=0.99) with a high probability (0.89) of extinction as a result of low survival estimates
(particularly for adults; 86%) and reduced productivity (55%). Human activities (69%) and
power line collisions (21%) were the primary reasons for the low survival rates with
poisoning alone accounting for 90% of the deaths. To achieve a positive growth rate,
mortality rates should be reduced by >50%, productivity increased by >25% and the
population should be supplemented by at least six individuals annually for the next 20 years.
Several recommendations are listed to address the primary threat of poisoning and
continued monitoring of the population is essential to evaluate the success of the
implementation of these recommendations. My research demonstrates the importance of
focussing on small populations, declining populations and populations at the periphery of the
species’ range and my results confirm that urgent intervention is required to improve the
status of the population. My findings also contribute to achieving vulture conservation
objectives regionally, continentally and internationally.

x
Acknowledgements
My involvement with Bearded Vultures began in 2000 following discussions with Peter
Chadwick, Peter Openshaw and Douglas van Zyl from Ezemvelo KwaZulu-Natal Wildlife
around the status of the species that was iconic to the Drakensberg Park. These discussions
grew into what eventually became the Maloti Drakensberg Vulture Project, a project which
has involved and inspired many individuals since its inception. It is impossible to thank all
those who have been involved between 2000-2014, but everyone’s contributions along the
way are hugely appreciated.
Steven Piper and Colleen Downs encouraged me to embark on the PhD journey and
Rob Simmons was instrumental in registering me with the Percy FitzPatrick Institute. Arjun
Amar took me on as his first student upon arriving in the country. I have benefitted
enormously from having Arjun as a supervisor and have enjoyed the experience of being a
student again. Thank you for the many hours of discussion, advice and assistance.
I am grateful to my parents for providing me with the opportunities in life that have led
to achieving this goal. They have supported and encouraged me along the way and also
accompanied me on many field trips and assisted with many related errands. My brother and
nieces also provided company during monitoring trips and vulture capture quests.
My employers, Ezemvelo KwaZulu-Natal Wildlife, and my supervisor Ian Rushworth
are thanked for recognizing the importance of this research and generously providing
resources to support my work throughout. I am also grateful to the Wildlands Conservation
Trust, the Maloti Drakensberg Transfrontier Programme, Sasol through the Endangered
Wildlife Trust and the South African National Park’s staff of Golden Gate Highlands National
Park for the funding and support received for the Maloti Drakensberg Vulture Project over
the years. André Botha from the Birds of Prey Working Group of the Endangered Wildlife
Trust and the Bearded Vulture Task Force members are thanked for their hard work since
2006 towards achieving the objectives of the species’ management plan. Mpiti Letsie,

xi
Makhubu Shobana and Samuel Zwakala have undertaken valuable monitoring and
advocacy work in Lesotho over the years. Joyce Loza was extremely helpful in the process
of getting the Biodiversity Management Plan for the Species approved.
I am grateful for the tireless efforts of many individuals during endless hours spent
trying to capture birds. Alfonso Godino, Allan Howell and Daniel Hegglin were involved in the
initial stages (2007 and 2008) and were instrumental in perfecting the capture technique and
teaching me to make and fit harnesses. Carmen Callero flew out from Spain several years in
a row to share long, cold hours in a hide or in the ‘Yeti suit’. Ben Hoffman and Rickert van
der Westhuizen assisted with captures for weeks on end and Rickert assisted with data
collation and dissemination for many years post capture. Thank you to Charl Brummer,
David Allan and Tim O’Connor who spent precarious moments dangling on ropes while
grappling with chicks or equipment in the nest. Many Ezemvelo KwaZulu-Natal Wildlife staff
of the Maloti Drakensberg Park World Heritage Site spent countless hours hiking to nests
with me in mid-winter or monitoring the sites in their respective sections. John Crowson is
thanked for his kidney jarring trips to monitor nesting success at sites in Lesotho best seen
from the air!
My thanks to Shannon Hoffman for being the custodian of ‘our’ captive bird and
playing such an important advocacy role. Hans Frey and Alex Llopis were also always
available to answer questions on Bearded Vultures in captivity. I enjoyed my trips to the
University of Johannesburg to work on the genetic aspect of the project- thanks to Bettine
Jansen van Vuuren for teaching me DNA extraction! I also appreciate the efforts of Phillip
Lennon from Coral Tree Films in telling the story of the Bearded Vulture following his many
trips to film our work in the field.
One of the highlights of registering to undertake my PhD through University of Cape
Town were the frequent trips to Cape Town and the opportunity to visit my good friends from
Pietermaritzburg University days who were always willing to host and make me feel
welcome. Thank you Shane Murray, Jean Tukker and Shan Silberbauer for sharing your

xii
families and homes with me over the years. Thanks also to my friends back home for their
patience over the years while I was working instead of socializing, especially to Shane Elliott
was always keen to accompany me when searching for a downed transmitter or when
monitoring trips promised great photo opportunities or 4x4 challenges. Many of the photos in
this thesis are the results of some memorable trips. I have him to ‘thank’ for getting me into
trail running which provided a pleasant break from the books in the final year of write-up.
Lastly the birds themselves that were very challenging to catch between 2007 and
2013 and have provided the most incredible data since: Daniel (the first bird caught after six
weeks of patient waiting) chewed off his transmitter after 10 months; Barbara’s fate remains
unknown after her transmitter stopped working 30 days later; Andalucia was killed and the
transmitter buried; the chicks Linong and Ikloba from Lesotho both found poisoned in the
same area in the Eastern Cape about a year apart; Connor’s fate is unknown after the
transmitter stopped within 10 days of fitting it in the nest; Wandervogel the last remaining
chick still flying after five years; Lehlwa (caught in the snow) and Inkozi caught as juveniles
five years ago- the longest lasting birds and transmitters so far!; Olivia died of poisoning in
Lesotho; Zakhumi (caught during the 2010 Soccer World Cup) and Aspen died of poisoning
in Free State; Bardbek was found poisoned after only one month; Blue-boy (Umcociathafa)
whose extensive movements fascinated all until he flew into a power line; adults Sphinx and
Lefuma both found poisoned a few kilometres from their nests in KwaZulu-Natal and Free
State respectively; adult Carmella chewed her transmitter off after two years; adults
Pharoah, Jeremia and Springbok (caught as a sub-adult and bred a year later) still flying;
and juveniles Mac, Mollie, Camo and Kloutjie (whose claw went through my finger) the last
juveniles to be caught and which are still at large. Finally our captive bird Leseli, confiscated
from a roadside chicken-coop, fulfilling her role admirably as the species’ ambassador.
Although these birds carry a 100 g burden, the cost to the individual is far outweighed
by the benefits obtained from the tracking devices for the conservation of the population as a
whole. My hope is that talks given to interest groups in future will be a lot less depressing!
1
Chapter 1: Introduction
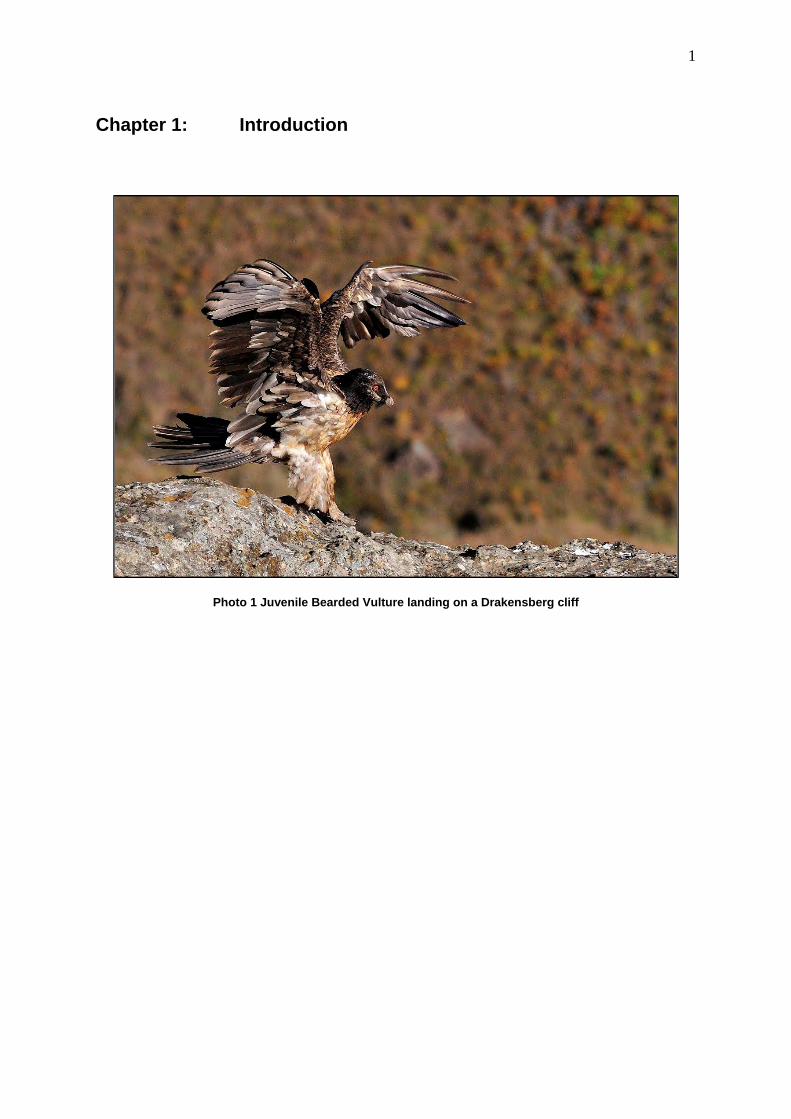
Photo 1 Juvenile Bearded Vulture landing on a Drakensberg cliff

2
The world’s biota are in catastrophic decline because anthropogenic activities are continually
altering the essential habitats and ecosystems on which species depend (Butchart et al.
2010, Hoffman et al. 2010). One-fifth of the world’s vertebrates are threatened with extinction
(Hoffman et al. 2010) and one in eight of the world’s bird species is deemed globally
threatened (BirdLife International 2013). Land use change, the most common cause of
habitat degradation, is expanding, and overharvesting, pollution, urbanisation and climate
change are increasing the rate of species loss (Sutherland et al. 2011) such that extinction
rates are exceeding the normal background rates by a few orders of magnitude (Pimm et al.
1995). These threats are intensifying as technology continues to improve and the human
population continues to increase (UN Environment Programme 2007). This wave of
anthropogenically driven biodiversity loss, aptly termed the “Anthropocene defaunation” by
Dirzo et al. (2014), has major consequences for the ecosystem functions and services on
which we depend as well as having evolutionary consequences (Naeem and Wright 2003,
Dirzo et al. 2014, Seddon et al. 2014, Vignieri 2014).
Global Scavenger declines
The scavenger guild is threatened around the globe (Hoffmann et al. 2010). Numerous
studies have shown that mammalian scavengers are facing persecution as a result of
human-wildlife conflict (Newmark et al. 1994, Woodroffe 2000, Kissui 2008, Watts and
Holekamp 2009). For example, hyaena are being poisoned by African pastoralists for killing
their livestock (Woodroffe 2000) and human persecution is the greatest threat to the
persistence of these scavengers (Woodroffe and Ginsberg 1998). Avian scavengers too are
facing human persecution and have the highest percentage of extinction-prone species
among avian functional groups (Sekercioglu et al. 2004). Vulture populations in particular are
one of the fastest declining groups of birds (Green et al. 2004, Oaks et al. 2004, Ogada
2014).

3
Both new world (Cathartidae) and old world (Accipitridae) vultures have experienced
large population declines worldwide from a variety of human related factors which have
resulted in the loss of suitable breeding and foraging habitat and poisoning (Mingozzi and
Estève 1997, Herremans and Herremans-Tonnoyer 2000, Green et al. 2004, Thiollay 2006,
Ogada et al. 2012). For example, the California Condor Gymnogyps californianus was
virtually extirpated in the wild (Ogden 1985) and the Oriental White-backed Vulture Gyps
bengalensis declined by >95% over two decades from the 1990s followed by declines of
other Gyps species in Asia (Green et al. 2004, Oaks et al. 2004), resulting in these species
being listed as Critically Endangered (BirdLife International 2001). The Asian vulture
declines were attributed to the toxic effects of the veterinary drug diclofenac, a non-steroidal
anti-inflammatory drug, from feeding on ungulates treated with the drug shortly before death
(Green et al. 2004). Once the cause of the decline had been established the conservation
measures that were successfully implemented included banning veterinary diclofenac in
2006 and promoting an alternative non-lethal veterinary drug (meloxicam), establishing
captive populations of all three affected Gyps species and supplementary feeding (Pain et al.
2008). The success of these conservation measures was evident a few years later in the
increased productivity of several populations of Indian vultures G. indicus (Jamshed et al.
2012).
Biodiversity loss is widely recognized as hindering ecosystem functioning worldwide
(Naeem and Wright 2003, Dirzo et al. 2014) and scavengers provide an important suite of
ecosystem services and key ecological functions such as waste removal, disease control
and nutrient recycling (Houston and Cooper 1975, DeVault et al. 2003). The loss of obligate
scavengers, such as vultures, can therefore have major ecological, social and economic
consequences. Ecologically the absence of vultures may affect the community composition
of scavengers at carcasses which could alter scavenging rates for individual species (Ogada
et al. 2012), and result in an increase of opportunistic species at carcasses such as feral
dogs (Pain et al. 2003). Socially, vultures are significant amongst the Parsi community where
they dispose of human corpses left in the open to be scavenged (Markandya et al. 2008).

4
Economically, the increased potential for disease transmission at carcasses will result in
increased costs to human health (Ogada et al. 2011).
The Asian Vulture Crisis and the consequences of the loss of these obligate
scavengers has generated considerable concern and subsequent interest in vulture research
in recent years, particularly in Africa (Koenig 2006, Ogada et al. 2011).
African Vulture Crisis
Recent research has shown that Africa too is experiencing the silent but rapid demise of its
vultures (Virani et al. 2011, Ogada et al. 2012), a wildlife crisis that is little-known, poorly
understood, and often-ignored. Vultures were once common and widespread across the
continent, but over the past 30 years declines of up to 97% have been detected for some
species in West Africa while declines of 50-60% have been recorded in the East and
southern African savannahs (Ogada et al. 2012). Africa is home to 11 of the 23 species of
vultures worldwide of which four species (36%) are currently listed as globally Endangered
and at risk of extinction, and three are listed as Vulnerable (BirdLife International 2014). The
indiscriminate use of poison is one of the major causes of the recent declines in vulture
populations across most of Africa (Virani et al. 2011, Roxburgh and McDoughall 2012,
Ogada 2014), although the rates of decline and causes of poisoning differ across the
continent. In East and southern Africa vultures die after eating carcasses that have been
intentionally poisoned to control feral dog populations and carnivores such as jackals and
hyaenas (Virani et al. 2011, Ogada et al. 2012). Vultures are targeted directly (through
poisoning or other means) for food (Thiollay 2006), for the traditional medicine trade (Mander
et al. 2007) or to prevent law enforcement agents being attracted to carcasses through the
conspicuous presence of vultures (Lipiya 2011, Roxburgh and McDougall 2012).
Vultures are protected species in most African countries but enforcement of the
legislation is poor. In order to address the potential “African Vulture Crisis”, the Vulture
Specialist Group of the IUCN Species Survival Commission was established in 2011 to

5
ensure the continued survival of vultures across the African continent. The Group aims to
assess the population status of all African vulture species, identify threats and implement
appropriate conservation actions that effectively address the key threats to African vultures.
Immediate action is essential because “without rapid and effective action, Africa will soon
lose these critical keystone species!” (J. Tavares pers. comm., Director of the Vulture
Conservation Foundation).
Given the consequences of these ongoing and severe declines of vulture populations
globally and in Africa, decisions on how to manage threatened species are central to
reducing the extinction risk and loss of biodiversity. Scientific information on threatened
species is essential to inform conservation management decisions and develop and
implement effective policies and actions to address the declines (Fleishman et al. 2011). To
maximize the value of scientific research to decision makers, the most pertinent research
questions must be addressed and recommendations for remedial action must be prioritised
to ensure the best use of limited resources for the management of threatened species
(Fleishman et al. 2011).
Single-Species Conservation
In recent years conservation research and management have often moved away from
focussing on single species toward entire ecosystems or ecological processes. The main
reason for this paradigm shift was the need for conservation to become more economically
efficient in an era of increasing conservation needs and decreasing budgets. A strategy
focussing on ecosystem/process management aimed to achieve this, with the notion that it
would effectively address all possible issues of species and habitat conservation (Meffe and
Carroll 1994, Simberloff 1997). However, there are some fundamental flaws in this
approach. For example, Tracy and Brussard (1994) showed that many ecosystem processes
can be preserved even though the component species normally responsible for them are

6
lost, which means that preventing species’ extinctions does not hold the same significance.
Thus, I would argue that there is still very much a place for single-species conservation
undertaken in tandem with the conservation of ecosystems and ecological processes.
Furthermore, single-species studies still provide invaluable information for that species, even
if they do not represent the ecological and conservation needs of other species (e.g.
Andelman and Fagan 2000, Lindenmayer et al. 2002, Roberge and Angelstam 2004,
Branton and Richardson 2010, Isasi-Catala 2011). Many questions can only be addressed at
the species level which may be useful if these species are ‘umbrella’ species. Umbrella
species are typically large, require a lot of habitat and generally share many living
requirements with other organisms in their range so that by protecting a larger area, other
species are protected as well (Shrader-Frechette and McCoy 1993).
Moreover, legislation is also often still species focussed and many species will
require specific and targeted interventions to persist in the face of the current threats of
habitat loss and climate change (McLachlan et al. 2007). The fact that many species-specific
long-term monitoring programmes are in place, makes it currently possible to monitor
species’ range shifts in relation to climate change (Thomas et al. 2004, Parmesan and Yohe
2003). Therefore if we want to maintain all the biological components of an intact ecosystem,
we need to undertake autecological research, focussed on the individual species and its
environment. When it comes to the management of threatened species, an understanding of
the causes of decline are essential to reduce the risk of extinction and further loss of
biodiversity (Norris 2004).
Small and Declining Populations
Effective species management requires an understanding of how a population has declined
and what the past, present and future causes of decline are in order to implement
management strategies to address the decline. This understanding is the basis of
Caughley’s (1994) declining-population paradigm. Caughley (1994) also identified the small-

7
population paradigm that attempts to understand the influence of population size on
population persistence. Both paradigms are important in saving threatened species from
extinction (Hedrick et al. 1996) and should not be considered in isolation. For example,
studies on inbreeding effects have shown the importance of the small-population paradigm
in understanding the population biology of wild populations (Madsen et al. 1999) and
population restoration (Keller and Waller 2002), and Green (1995, 2002) and Balmford
(1996) have shown the importance of the declining population paradigm in understanding
the anthropogenic effects on wild populations and designing management strategies for
these.
A population’s decline can be categorised into three phases within which
conservationists can intervene (Norris 2004). In Phase 1, conservationists quantify the
likelihood of a population declining in the future based on environmental conditions; in Phase
2 conservationists work with populations in the process of declining; and in Phase 3
conservationists work with populations that have stabilized at low abundance levels following
a decline. In phases 2 and 3 the conservation aims are to halt the decline and increase
abundance respectively, to improve population persistence. For most populations that
continue to decline to critically low levels of abundance, the urgency for action and a lack of
data often preclude a detailed analysis of the causes of decline (Norris 2004). In these
cases, maintaining the population through the bottleneck becomes the primary aim of
management in the short term but in the longer term the putative causes of the decline may
need to be established in order to restore populations in the wild. To assess how
management strategies might assist conservationists, Norris (2004) advocates the use of
ecological tools such as statistical models of habitat use, demographic models and
behaviour-based models which assess the causes of decline and then examine the
effectiveness of various strategies to address this decline.
In my thesis I detail research undertaken on the declining Bearded Vulture Gypaetus
barbatus population at the southern tip of Africa and try to unify the small and declining
population paradigms by using ecological tools to assess the causes of decline and identify

8
remedial action, as well as determining the genetic diversity and placement of the population
to add further value to conservation management strategies.
Study Species: The Bearded Vulture
The Bearded Vulture Gypaetus barbatus (Linnaeus 1758) (Figure 1.1) is a large accipitrid
raptor that inhabits mainly mountainous regions of Eurasia and Africa (Cramp and Simmons
1980) (Figure 1.2). It is a non-colonial, monogamous, sexually monomorphic cliff-nester and
pairs occupy a territory containing one or more nests on high cliffs generally above 1,800 m
above sea level (Heredia 1991, Bustamante 1996, Brown 1997, García et al. 2009). The
species occupies a unique avian trophic guild in that it is a scavenger whose diet consists
almost exclusively of bones from the carcasses of wild and domestic ungulates (Hiraldo et
al. 1979, Margalida et al. 2007). They forage along ridges and valleys in protected areas but
also over communal rangelands and commercial farming areas.
Figure 1.1 A juvenile (left) and an adult (right) Bearded Vulture Gypaetus barbatus (Linnaeus 1758).

9
Two sub-species are recognised based on plumage characteristics (Hiraldo et al. 1984,
Mundy et al. 1992). G. b. barbatus occurs north of the Tropic of Cancer while G. b.
meridionalis occurs south of the Tropic of Cancer. In sub-Saharan Africa the species occurs
in small geographically isolated populations in South Africa and Lesotho, East Africa and
Ethiopia.
Figure 1.2 Global distribution of the Bearded Vulture Gypaetus barbatus (source:www.planetofbirds.com).
Globally the species has been uplisted from Least Concern to Near Threatened (BirldLife
International 2014) because although it is recovering in Europe, it is declining globally as a
result of poisoning, disturbance and collisions with power lines. The global population
estimate is 1,300-6,700 mature individuals (BirdLife International 2014) of which <1,300 are
estimated to occur in sub-Saharan Africa. Poisoning, both direct and indirect as well as
habitat degradation, disturbance at breeding sites and collisions with power lines are
considered to be the main global threats (Ferguson-Lees and Christie 2001).

10
In southern Africa, there was a drastic decline in both the population number and the
range between 1700-1969 (Boshoff et al. 1978, Brooke 1984) resulting in the contraction of
the species’ range from the south-western Cape to a more restricted area in the highlands of
Lesotho and immediately adjacent Maloti-Drakensberg mountains (Brown 1990) (Figure
1.3). The reasons given for the large range contraction were persecution and displacement
by humans and livestock at lower altitudes and the degradation of many of its habitats which
resulted in the species being classed as “rare and threatened” by Siegfried et al. (1976).
Population numbers continued to decline during 1970-2000 resulting in the species being
uplisted to Endangered (Anderson 2000) with the main cause of mortality attributed to
poisoning (Brown 1991). This re-classification was attributed to the Bearded Vultures’ small
and declining population size, restricted range, range contraction, and the susceptibility to
several threats (e.g. persecution, poisoning, collisions with power lines) in Lesotho and
South Africa.
Study Area ‘Maloti-Drakensberg Mountain Region of Southern Africa’ and Methods
The Maloti-Drakensberg region of southern Africa spans the highlands and the Maloti
Mountains of Lesotho and the Drakensberg mountain range in South Africa which extends
from the north-eastern Free State province in the north, through the eastern boundary of
KwaZulu-Natal with Lesotho in the east, to the northern part of the Eastern Cape province in
the south (Figure 1.3).
There is great variation in the topography of the Maloti-Drakensberg mountains with
summit plateaux and peaks, vast basalt and sandstone cliffs, deep valleys and intervening
spurs with an average altitude of 2,200 m (1,280 m–3,500 m) (Sycholt 2002). The range in
topography has resulted in the establishment of diverse vegetation communities within which
are habitats with a remarkable richness of plant and animal species, many of which are
endemic and internationally recognised threatened species, such as the Bearded Vulture.
A large portion of the international boundary between KwaZulu-Natal and Lesotho
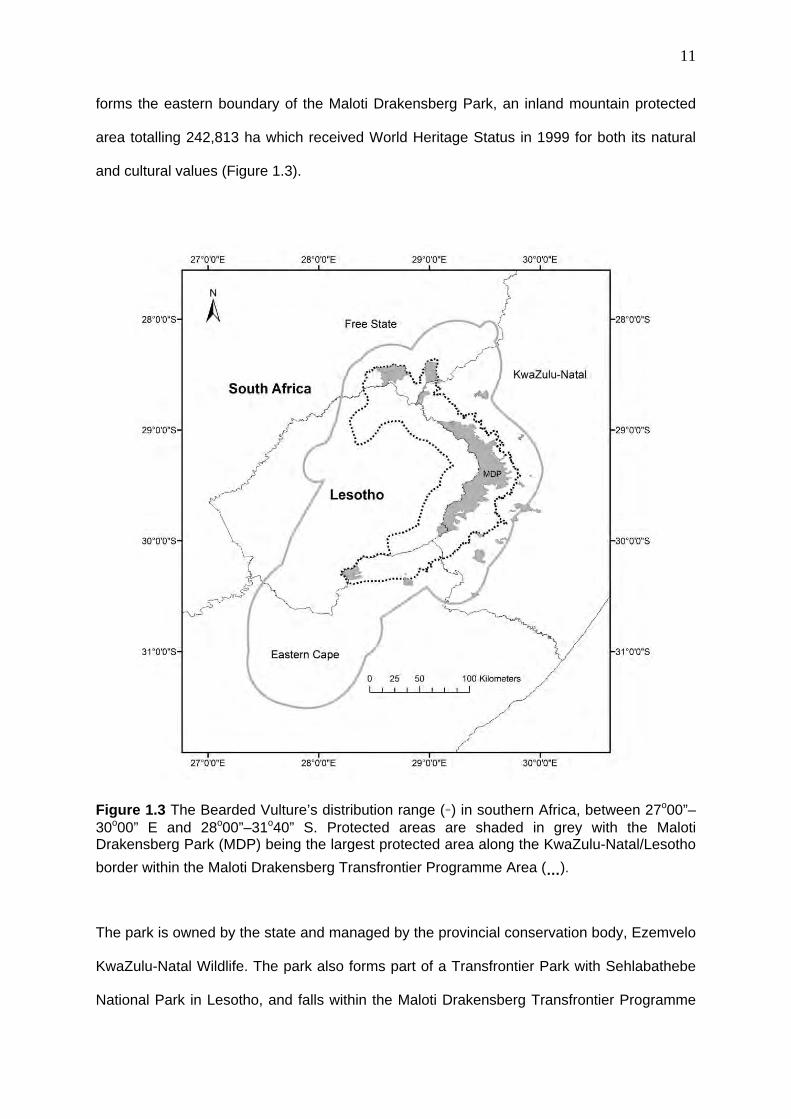
11
forms the eastern boundary of the Maloti Drakensberg Park, an inland mountain protected
area totalling 242,813 ha which received World Heritage Status in 1999 for both its natural
and cultural values (Figure 1.3).
Figure 1.3 The Bearded Vulture’s distribution range (-) in southern Africa, between 27o00”–30o00” E and 28o00”–31o40” S. Protected areas are shaded in grey with the Maloti Drakensberg Park (MDP) being the largest protected area along the KwaZulu-Natal/Lesotho
border within the Maloti Drakensberg Transfrontier Programme Area (…).
The park is owned by the state and managed by the provincial conservation body, Ezemvelo
KwaZulu-Natal Wildlife. The park also forms part of a Transfrontier Park with Sehlabathebe
National Park in Lesotho, and falls within the Maloti Drakensberg Transfrontier Programme

12
area. The purpose of the park is to contribute to the achievement of provincial and national
conservation targets through protecting endangered, rare and endemic species indigenous
to the area. One such species is the Bearded Vulture which nests along the escarpment
throughout the park. In order to develop conservation targets for this endangered species,
information on the current status of the population in the park was required. For this reason a
monitoring programme was implemented by Ezemvelo KwaZulu-Natal Wildlife in 2000 to
assess the population status of the Bearded Vulture, both within the Maloti Drakensberg
Park and also in the wider province of KwaZulu-Natal. Initial monitoring results (2000-2005)
indicated a continued decline in the population (Krüger 2006) which raised concern amongst
the conservation authorities. Similar declines were also recorded in Lesotho (Allan and
Jenkins 2005). Apart from the Endangered status of the species, it is also an emblematic
species, forming part the Maloti Drakensberg Park logo (Figure 1.4) and is an icon for the
Maloti Drakensberg Transfrontier Programme because it epitomises cross-boundary
collaboration and initiatives. For these reasons, Ezemvelo KwaZulu-Natal Wildlife, the
implementing agent of the Transfrontier Programme, identified the need for further action to
address the suspected continued decline in the species. As a result the Maloti Drakensberg
Vulture Project was established aimed at conserving the Bearded and Cape Vulture Gyps
coprotheres in the Maloti-Drakensberg region.
Figure 1.4 The Bearded Vulture forms the focal point of the Maloti Drakensberg Park’s logo.

13
Land use in the study area, beyond the protected area boundaries, comprises predominantly
livestock grazing on communal grazing lands in Lesotho or commercial livestock farms and
communal lands in South Africa. Wild ungulates are at low densities on communal and
commercial lands and are scavenged predominantly from protected areas, although
densities in these areas are naturally low.
Background to Bearded Vulture Conservation in Southern Africa
Detailed research was undertaken on the species by Christopher Brown during 1980-1983
which included the first in-depth study of the biology of the species in southern Africa (Brown
1988, Brown 1990), its distribution and status (Brown 1992), the demography (Brown 1997)
and the reasons for decline (Brown 1991). During his study period C. Brown was based in
the central portion of the Maloti Drakensberg Park where most of his research was
undertaken, with the occasional trip to other parts of the species’ range. Estimates of
breeding pairs, breeding density, demographic parameters and home-range were based on
his observations in the primary study area and from radio-tracked birds caught in this area.
Distribution and density estimates also included information from questionnaire surveys
conducted throughout the range. During his study period, efforts were made to educate
landowners/managers on the status of, and threats to, the species, with the aim of reducing
the threat of persecution. However, despite these efforts, it is clear from monitoring during
2000-2005 (Allan and Jenkins 2005, Krüger 2006) that there has been limited success in
addressing the species’ decline since the early 1980s and that the recommendations of
Brown (1991) have been largely ignored. Although several individuals undertook nest site
surveys (see Appendix 2.1, Chapter 2) or conducted desktop modelling exercises (Whitley
1998), no detailed research was undertaken on the species until the early 2000s when the
Maloti Drakensberg Vulture Project was established.

14
To address the lack of conservation action, a workshop was held in 2006 facilitated
by the Conservation Breeding Specialist Group who used a Population and Habitat Viability
Assessment process to undertake a risk assessment and develop a species’ management
strategy. The goals of the workshop were to i) set a conservation target for the southern
African population of Bearded Vulture and ii) determine the priority conservation
interventions required to achieve the target over a ten year period. To this end the key
issues facing the survival of the Bearded Vulture were identified and a list of prioritised
solutions and goals were developed including detailed action plans and steps that would
contribute to achieving these goals. The workshop results were detailed in a management
strategy for the species from 2006-2011 (Krüger et al. 2006). To ensure that the action plans
were implemented, the Bearded Vulture Task Force was established by the Birds of Prey
Programme of the Endangered Wildlife Trust. The task force comprises representatives from
conservation institutions and the scientific community as well as a number of volunteers from
both Lesotho and South Africa.
In 2011 the management strategy for the species was revised and a Biodiversity
Management Plan for the Species (BMP-S) (Krüger 2013) was prepared in its place to
provide a more formal mechanism to achieve the species’ conservation objectives. The plan
was developed using regulations of the National Environmental Management: Biodiversity
Act No. 10 of 2004 for Threatened or Protected Species developed by the national
Department of Environmental Affairs and Tourism of South Africa who recognised the need
for conservation action and developed the requisite legal framework catering for the
protection of important species. The BMP-S is a mandate obtained through an approval
process which provides a coordinated framework to ensure commitment from all role players
in implementing the actions required to benefit the species and its habitat. The development
of the BMP-S was an open and inclusive process including decision makers and researchers
who reported on progress on actions from the previous plan and developed further actions
required to achieve the species’ targets. Although the BMP-S follows the structure provided

15
for within the South African legal framework, the aims, objectives and operational goals were
developed for the entire population which ranges across both South Africa and Lesotho. The
aim of the BMP-S is to provide a mechanism to ensure the long term survival of the species
through halting the population decline and stabilizing the population at the current population
size (approximately 100 breeding pairs) over the next ten years and to start growing the
population to a realistic carrying capacity (150 breeding pairs) in the future.
This thesis details the research that has contributed directly to helping achieve the
goals of the 2006-2011 and the 2011-2016 management frameworks as well as the aims of
the Endangered Wildlife Trust’s Birds of Prey Programme and the IUCN’s Vulture Specialist
Group.
Current Conservation Context for the Species
The Bearded Vulture has a wide global distribution of which the southern African population
is at the periphery of the global range, and is the only functioning population in the Southern
Hemisphere. Together with its global status of Near Threatened (BirdLife International 2014),
this begs the question whether the small, declining and peripheral southern African
population warrants targeted research and conservation efforts.
The justification for the conservation of this population is three fold. Firstly the
species is regionally threatened and classified as Endangered (Anderson 2000) and the
entire population of southern Africa occurs within the study area. Secondly, two subspecies
(Mundy et al. 1992) and two lineages (Godoy et al. 2004) are recognised, therefore there is
additional merit in conserving the lineages represented in sub-Saharan Africa. Thirdly, there
is value in conserving peripheral populations. Populations at the periphery of the geographic
range of a species have generally been regarded as having little value in conserving
biodiversity because they are more vulnerable to extinction and have lower genetic diversity
than those in the core of the range (Channell 2004). Recent research, however, suggests

16
that peripheral populations may play an important role in conserving declining species
(Lomolino and Channell 1995, Lomolino and Perault 1998). Contrary to expectations, in
species that have undergone large range contractions, peripheral populations persist
significantly more often than do the central populations and genetic diversity may not
necessarily be lower which suggests that the distinction between central and peripheral
populations may not be an important distinction for conserving biodiversity and that
conservation plans should include peripheral populations (Channell 2004).
A number of authorities are mandated with biodiversity conservation within the
Bearded Vulture’s range. In Lesotho, the Ministry of Environment Tourism and Culture is
responsible for biodiversity conservation within the 10 districts that are part of the Bearded
Vulture’s range in that country. In South Africa, both national (Department of Environmental
Affairs and Tourism) and provincial authorities are responsible for biodiversity conservation
in the three provinces; Free State (South African National Parks; Free State Economic
Development, Tourism and Environmental Affairs), KwaZulu-Natal (Ezemvelo KwaZulu-
Natal Wildlife) and Eastern Cape (Eastern Cape Parks Board; Department of Economic
Development, Environmental Affairs and Tourism). Although there are differences in the
national and provincial legislation between the countries and provinces, the species is
specially protected at a national level in both countries. The conservation challenge,
however, is enforcing the legislation throughout the range and coordinating conservation
efforts between the various authorities within the realm of budget and manpower constraints.
Although the species has an important ecological role and is a transfrontier icon, the reality
of resource limitations makes the transition from management planning to conservation
action particularly challenging.
The Kingdom of Lesotho is a constitutional monarchy that is geographically entirely
surrounded by South Africa. Economic growth is slow with many developmental challenges,
institutional capacity is weak and poverty and inequality are recurring challenges with ca.
43% of the population living below US$1.25 per person per day (African Development Bank

17
Group 2013). High food insecurity levels together with a high HIV prevalence have
contributed to deteriorating social indicators, especially life expectancy. Although the
Bearded Vulture is a specially protected species in Lesotho, the conservation thereof is
competing with basic human welfare concerns. South Africa on the other hand is
experiencing steady economic growth with only 14% of the population living below US$1.25
per person per day even though levels of unemployment, poverty and inequality are also
high. Access to basic social services is relatively high and the country has a much better
institutional capacity than its neighbour (African Development Bank Group 2012). The
conservation challenge in South Africa is one of gaining support for a species that is not
geographically widespread or well-known, amidst a country-wide rhino poaching crisis which
is at the forefront of political, public and conservation agendas. These challenges highlight
the importance of this research in identifying the mechanisms of the decline of the
Endangered Bearded Vulture and using the results to recommend actions aimed at raising
the profile of the species and using limited resources in the most effective manner.
The Asian Vulture Crisis provides a good example of where scientific research was
core to the protection and boosting of the remaining vulture populations through identifying
the cause of the decline and disseminating information to government authorities to canvas
the necessary financial and legislative support (Ogada et al. 2012). The Asian example is,
however, also an indication of how in the absence of widespread bird population monitoring,
it proved difficult to measure the declines and identify when and where they began.
Bearded Vulture conservation efforts in Europe over the past 30+ years also provide
good examples of adaptive management where conservation actions, coupled with intensive
research and monitoring, have been successful in re-establishing populations or increasing
numbers in existing popultions (e.g. Heredia and Heredia 1999, Hirzel et al. 2004, Donázar
et al. 2009, Schaub et al. 2009, Cortez-Avazida et al. 2010).

18
Thesis Overview
My thesis aims to understand the limits to population growth, the reproductive success and
the movements of the Bearded Vulture in southern Africa to fill the knowledge gaps
necessary to implement the urgently required interventions. Both the small and declining
population paradigms, and the ecological tools required to explain them, form the basis of
this study in exploring and quantifying the decline of the Bearded Vulture population in
southern Africa. The thesis is presented as a series of chapters written as stand-alone
documents to facilitate publication. As such this has resulted in the use of the third person in
Chapters 2-6 and the repetition of some information in the introduction and methods sections
of these chapters.
Chapters 2-6 detail the results of data collected during 2000-2014. A schematic
representation of the chapters is given in Figure 1.4.
Figure 1.4 Schematic representation of the information provided in Chapters 1-7 indicating the flow of information between the chapters.

19
The first priority was to determine the current status and distribution of the population.
Although ad hoc surveys had been conducted across the species’ range, there had been no
attempt at a population estimate since Brown’s (1992) estimate of 608, extrapolated from his
findings in parts of the range. My study represents the first attempt at a comprehensive
survey of the entire breeding range of the species in southern Africa.
In Chapter 2, I investigate the breeding status, distribution and density of the
Bearded Vulture in southern Africa and determine whether there has been a significant
change in these parameters over the past 50 years. The chapter provides a recent
population estimate which is critical for modelling population growth (Chapter 6). The
information from annual surveys reported on in Chapter 2 provides the location and current
status of all territories to investigate the mechanisms that have resulted in some territories
being abandoned (Chapter 3). The bulk of Chapter 2 is published as a paper in Bird
Conservation International (Krüger et al. 2014a).
Chapter 2 identified that many (at least 33%) of territories had been abandoned and
were no longer occupied by breeding Bearded Vultures. I was therefore interested to know
what factors might lead to the abandonment of these sites whilst other territories remained
occupied. Thus, Chapter 3 explores whether the abandonment of territories was correlated
with any key environmental variables which could shed light on the overall cause of the
population’s decline, similar to the methods used by Carrete et al. (2007) and Mateo-Tomás
and Olea (2010) to investigate the causes of territory abandonment by the Endangered
Egyptian Vulture Neophron percnopterus. Those variables found to influence territorial
abandonment the most, need to be considered when formulating management
recommendations (Chapter 7), together with an indication of direct threats from the causes
of mortality (Chapter 6). The size of the area used to quantify environmental variables
around the nest site, was obtained from estimates of adult home range size provided in
Chapter 4.

20
In Chapter 4, I use data from GPS satellite tags fitted to birds of various age-classes
to determine whether there are spatial and temporal differences in home-range use that
places them at risk to certain anthropogenic factors, such as those driving the abandonment
of breeding territories. Data on ranging behaviour of the species is limited to studies
undertaken in Europe (Gil et al. 2010, Gil et al. in press, Margalida et al. 2013), or radio
telemetry studies (Brown 1988) and studies on an individual juvenile (Urios et al. 2010) in
southern Africa, which have limited application in determining age-specific home range size
and the potential for risk exposure, causes of mortality and survival estimates for this
population. In addition, data from this chapter has been used to inform wind turbine
placement in the study area (Reid et al. in review). The mortalities of tagged individuals
provided data on longevity, mortality rates and causes of mortality for modelling population
growth (Chapter 6). The captured birds also provided an opportunity to collect tissue
samples for genetic analyses (Chapter 5).
I investigate genetic risk in Chapter 5 as a potential threat to the population.
Knowledge of the genetic variability and evolutionary placement of the local population will
aid future management decisions on whether augmentation is required to increase genetic
diversity in the population and to identify the source population for this purpose. Negro and
Torres (1999) studied the genetic variability and placement of two populations of Bearded
Vulture in Europe to inform reintroduction programmes, and others have looked at genetic
variability in threatened (Poulakakis et al. 2008) and declining and fragmented populations
(Martínez-Cruz et al. 2004) to inform management strategies. Whether augmentation
(reintroductions) will assist population growth as well as improving diversity is investigated
as a possible management scenario in Chapter 6. Chapter 5 has been published in Ibis
(Krüger et al. 2014b).
Chapter 6 uses the current demographic information to i) model the population trend,
ii) identify the key demographic parameters driving this trend, and iii) examine key
interventions that can effectively influence this trend. Using this model I also tested whether I

21
could re-capitulate the observed history of the population trajectory from 1950 to 2000 based
on current population estimates, survival rates and reproductive rates. This allowed me to
explore whether changes in productivity or survival in isolation would have been sufficient to
have caused the observed decline. Similar approaches were used successfully by Sarrazin
et al. (2004) who explored the decline in vultures in South Asia and established that reduced
productivity alone was insufficient to have driven the decline of that population.
The final chapter discusses the research findings detailed in Chapters 2-6 from work
undertaken in southern Africa during 2000-2014, explores recommendations critical to the
conservation of the Bearded Vulture population and prioritizes these based on their
predicted impact. In so doing this study provides important information to fill many of the
gaps identified in the BMP-S and provides the necessary guidance to achieve the aims for
the regional population; that of a positive growth rate in the short term.
References
African Development Bank Group (2012) African Development Bank Republic of South
Africa Country Strategy Paper 2013-2017. Southern Africa Resource Centre (SARC)
Department, unpubl report.
African Development Bank Group (2013) African Development Bank Kingdom of Lesotho
Country Strategy Paper 2013-2017. Southern Africa Resource Centre (SARC)
Department, unpubl report.
Allan DG and Jenkins AR (2005) Preliminary report on a survey of breeding sites of Bearded
and Cape Vultures in Lesotho. Durban Natural Science Museum, Durban, unpubl
report.

22
Andelman SJ and Fagan WF (2000) Umbrellas and flagships: Efficient conservation
surrogates or expensive mistakes? Proc Nat Acad Sci USA 97(11): 5254-5259.
Anderson MD (2000) Bearded Vulture Gypaetus barbatus. In: Barnes KN (editor) The
Eskom Red Data book of birds of South Africa, Lesotho and Swaziland. BirdLife
South Africa, Johannesburg, pp. 39-41.
Balmford A (1996) Extinction filters and current resilience: the significance of past selection
pressures for conservation biology. Trends Ecol Evol 11: 193–196.
BirdLife International (2001) Threatened Birds of Asia: the BirdLife International Red Data
Book. BirdLife International, Cambridge.
BirdLife International (2013) Spotlight on threatened birds. Presented as part of the BirdLife
State of the world's birds website. Available from: http://www.birdlife.org/datazone.
BirdLife International (2014) IUCN Red List for birds. Downloaded from
http://www.birdlife.org on 05/08/2014.
Boshoff AF, Brooke RK and Crowe TM (1978) Computerized distribution mapping scheme
for vertebrates in southern Africa. S Afr J Wildl Res 8(4): 145-149.
Branton M and Richardson JS (2011) Assessing the Value of the Umbrella-Species Concept
for Conservation Planning with Meta-Analysis. Conserv Biol 25: 9–20.
doi:10.1111/j.1523-1739.2010.01606.x.
Brooke RK (1984) South African Red Data Book- Birds. S Afr Nat Sci Prog Rep 97. CSIR,
Pretoria.
Brown CJ (1988) A study of the Bearded Vulture Gypaetus barbatus in southern Africa.
Dissertation, University of Natal, Pietermaritzburg.
Brown CJ (1990) Breeding biology of the Bearded Vulture in southern Africa, Parts I – III.
Ostrich 61: 24-49.

23
Brown CJ (1991) An investigation into the decline of the Bearded Vulture Gypaetus barbatus
in southern Africa. Biol Conserv 57: 315-337
Brown CJ (1992) Distribution and status of the Bearded Vulture Gypaetus barbatus in
southern Africa. Ostrich 63: 1-9.
Brown CJ (1997) Population dynamics of the Bearded Vulture Gypaetus barbatus in
southern Africa. Afr J Ecol 35: 53-63
Bustamante J (1996) Population viability analysis of Captive and Released Bearded Vulture
Populations. Conserv Biol 10(3): 822-831.
Butchart SHM et al. (2010) Global Biodiversity: Indicators of Recent Declines. Science 328:
1164.
Carrete M, Grande JM, Tella JL, Sánchez-Zapata JA, Donázar JA, Díaz-Delgado R and
Romo A (2007) Habitat, human pressure, and social behavior: partialling out factors
affecting large-scale territory extinction in an endangered vulture. Biol Conserv
136(1): 143-154.
Caughley G (1994) Directions in Conservation Biology. J Anim Ecol 63: 215–244.
doi:102307/5542.
Channell R (2004) The Conservation Value of Peripheral Populations: the Supporting
Science. In: Hooper TD (editor) Proceedings of the Species at Risk 2004 Pathways
to Recovery Conference. 1 March 2–6, 2004, Victoria, B.C.
Cortez-Avazida A, Carrete M and Donázar JA (2010) Managing supplementary feeding for
avian scavengers: guidelines for optimal design using ecological criteria. Biol
Conserv 143: 1707-1715.
Cramp S and Simmons KEL (1980) Handbook of the Birds of Europe, the Middle East and
North Africa. Oxford University Press, Oxford.

24
DeVault TL., Brisbin IL and Rhodes OE (2004) Factors influencing the acquisition of rodent
carrion by vertebrate scavengers and decomposers. Can J of Zool 82: 502–509.
Dirzo R, Young HS, Galetti M, Ceballos, G Isaac NJB and Collen B (2014) Defaunation in
the Anthropocene. Science 345: 401. doi:10.1126/science.1251817.
Donázar JA, Margalida A, Carrete M and Sánchez-Zapata JA (2009) Too sanitary for
vultures. Science 326(5953): 664.
Ferguson-Lees J and Christie DA (2001) Raptors of the world. Christopher Helm, London.
Fleishman E et al. (2011) Top 40 Priorities for Science to Inform US Conservation and
Management Policy. Biosci 61(4): 290-300.
García CB, Insausti JA, Gil JA, de Frutos A, Alcántara M, González J, Cortés MR, Bonafonte
JI and Arruga MV (2009) Comparison of different procedures of DNA analysis for sex
identification in the endangered bearded vulture (Gypaetus barbatus). Eur J Wildl
Res 55(3): 309-312.
Gil JA, Díez O, Báguena G, Lorente L, Pérez C, Losada JA and Alcántara M (2010) Juvenile
dispersal of the bearded vulture (Gypaetus barbatus) in the Pyrenees (Spain-
France). Fundación para la Conservatión del Quebrantahuesos (FQC), Spain.
Gil JA, Báguena G, Sánchez-Castilla E, Antor RJ, Alcantara M and Lopéz-Lopéz P (in press)
Home-range and movements of non-breeding bearded vultures tracked by satellite
telemetry in the Pyrenees. Ardeola.
Godoy JA, Negro JJ, Hiraldo F and Donázar JA (2004) Phylogeography, genetic structure
and diversity in the endangered bearded vulture (Gypaetus barbatus, L.) as revealed
by mitochondrial DNA. Mol Ecol 13: 371-390.
Green RE (1995) Diagnosing the causes of bird population declines. Ibis 137: S47–S55.

25
Green RE (2002) Diagnosing causes of population declines and selecting remedial actions.
In: Norris K and Pain DJ (editors) Conserving Bird Biodiversity. Cambridge University
Press, Cambridge, UK, pp. 139–156.
Green RE, Newton I, Schultz S, Cunningham AA, Gilbert M, Pain DJ and Prakash V (2004)
Diclofenac poisoning as a cause of vulture population declines across the Indian
subcontinent. J Appl Ecol 41: 793–800.
Hedrick PW, Lacy RC, Allendorf FW and Soule ME (1996) Directions in conservation
biology: comments on Caughley. Conserv Biol 10: 1312–1320.
Heredia R (1991) Chapter 2 Biologia de la Reproduccion. In: Heredia R and Heredia B
(editors) El Quebrantahuesos (Gypaetus barbatus) en los Pirineos. ICONA, Madrid.
Heredia R and Heredia B (1999) El Quebrantahuesos Gypaetus barbatus en los Pirineos:
características ecológicas y bi ología de la conservación. The Bearded Vulture in the
Pyrenees: ecology and conservation biology. Colección Técnica. ICONA, Madrid.
Herremans M and Herremans-Tonnoyer D (2000) Land use and the conservation status of
raptors in Botswana. Biol Conserv 94: 31–41.
Hiraldo F, Delibes M and Calderon J (1979) El Quebrantahuesos: sistematica, taxonomia,
biologia, distrubucion y proteccion. Monografias 22, ICONA, Madrid.
Hiraldo F, Delibes M and Calderón J (1984) Comments on the taxonomy of the bearded
vulture Gypaetus barbatus (Linnaeus, 1758). Bonn Zool Beitr 35: 91-95.
Hirzel AH, Posse B, Oggier P, Crettenand Y, Glenz C and Arlettaz R (2004) Ecological
requirements of reintroduced species and the implications for release policy: the case
of the bearded vulture. J Appl Ecol 41: 1103–1116.
Hoffmann M et al. (2010) The impact of conservation on the status of the world’s
vertebrates. Science 330: 1503–1509.
26
Houston DC and Cooper JE (1975) The digestive tract of the Whiteback Griffon Vulture and
its role in disease transmission among wild ungulates. J Wildl Dis 11: 306–313.
Isasi-Catala E (2011) Indicator, umbrellas, flagships and key-stone species concepts: Use
and abuse in conservation ecology. Interciencia 36: 31-38.
Jamshed J, Chaudhry I, Ogada DL, Malik RN, Virani MZ and Giovanni MD (2012). First
evidence that populations of the critically endangered Long-billed Vulture Gyps
indicus in Pakistan have increased following the ban of the toxic veterinary drug
diclofenac in south Asia. Bird Conserv Int 22(4): 389-397. doi:10.1017/
S0959270912000445.
Keller LF and Waller DM (2002) Inbreeding effects in wild populations. Trends Ecol Evol 17:
230–241.
Kissui BM (2008) Livestock predation by lions, leopards and spotted hyaenas, and their
vulnerability to retaliatory killing in the Masai steppe, Tanzania. Anim Conserv 11:
422-432.
Koenig R (2006) Vulture Research Soars as the Scavengers’ Numbers Decline. Science
312: 1591-1592.
Krüger S (2006) The 2005 Bearded Vulture (Gypaetus barbatus meridionalis) Ground
Survey, South Africa. Ezemvelo KZN Wildlife, unpubl report.
Krüger S (editor) (2013) Biodiversity Management Plan for the Bearded Vulture (Gypaetus
barbatus meridionalis) for Southern Africa. Published 8 May 2014 Government
Gazette Notice No 37620.

27
Krüger S, Piper S, Rushworth I, Botha A, Daly B, Allan D, Jenkins A, Burden D and
Friedmann Y (editors) (2006) Bearded Vulture (Gypaetus barbatus meridionalis)
Population and Habitat Viability Assessment Workshop Report. Conservation
Breeding Specialist Group (SSC/IUCN)/CBSG Southern Africa, Endangered Wildlife
Trust, Johannesburg.
Krüger SC, Allan DG, Jenkins AR and Amar A (2014a) Trends in territory occupancy,
distribution and density of the Bearded Vulture Gypaetus barbatus meridionalis in
southern Africa. Bird Conserv Int 24: 162-177. doi:10.1017/S0959270913000440.
Krüger SC, Wesche PL and Jansen van Vuuren, B (2014b) Reduced genetic diversity in
Bearded Vultures Gypaetus barbatus in Southern Africa. doi: 10.1111/ibi.12200.
Lipiya A (2011) Status of Birds of Prey, with Special Emphasis on Vultures, in Kasungu
National Park. Department of National Parks and Wildlife, Lilongwe unpubl report,
5pp.
Lindenmayer DB, Manning AD, Smith PL, Possingham HP, Fischer J, Oliver I and McCarthy
MA (2002) The Focal-Species Approach and Landscape Restoration: a Critique.
Conserv Biol 16(2): 338–345.
Lomolino MV and Channell R (1995) Splendid isolation: patterns of range collapse in
endangered mammals. (special feature in biogeography). J Mammal 76: 335–347.
Lomolino MV and Perault DR (1998) Patterns of geographic range collapse in endangered
species. Society of Conservation Biololgy meeting unpubl report, Victoria, BC.
Madsen T, Shine R, Olsson M and Wittzell H (1999) Restoration of an inbred adder
population. Nature 402: 34–35.

28
Mander M, Diederichs N, Ntuli L, Khulile M, Williams V and McKean S (2007) Survey of the
Trade in Vultures for the Traditional Health Industry in South Africa. Futureworks,
unpubl report, 30pp
Margalida A, García D and Cortés–Avizanda A (2007) Factors influencing the breeding
density of Bearded Vultures, Egyptian Vultures and Eurasian Griffon Vultures in
Catalonia (NE Spain): management implications. Anim Biodiv Conserv 30(2): 189–
200.
Margalida A, Carrete M, Hegglin D, Serrano D, Arenas R and Donázar JA (2013) Uneven
Large-Scale Movement Patterns in Wild and Reintroduced Pre-Adult Bearded
Vultures: Conservation Implications. PLoS ONE 8(6): e65857.
doi:10.1371/journal.pone. 0065857.
Markandya A, Taylor T and Longo A (2008) Counting the cost of vulture decline—an
appraisal of the human health and other benefits of vultures in India. Ecol Econ 67:
194–204.
Martínez-Cruz B, Godoy JA and Negro JJ (2004) Population genetics after fragmentation:
the case of the endangered Spanish imperial eagle (Aquila adalberti). Mol Ecol 13:
2243–2255.
Mateo-Tomás P and Olea PP (2010) Diagnosing the causes of territory abandonment by the
Endangered Egyptian vulture Neophron percnopterus: the importance of traditional
pastoralism and regional conservation. Oryx 44: 424–433.
McLachlan JS, Hellmann JJ and Schwartz MW (2007) A framework for debate of assisted
migration in an era of climate change. Conserv Biol 21: 297–302.
Meffe GK and Carroll CR (1994) Principles of Conservation Biology. Sinauer, Sunderland,
MA.
29
Mingozzi T and Estève R (1997) Analysis of a historical extirpation of the Bearded vulture
Gypaetus barbatus (L) in the Western Alps (France-Italy): former distribution and
causes of extirpation. Biol Conserv 79: 155-171.
Mundy P, Butchart D, Ledger J and Piper S (1992) The Vultures of Africa. Russel Friedman
Books CC, Johannesburg, South Africa.
Naeem S and Wright JP (2003) Disentangling biodiversity effects on ecosystem functioning:
deriving solutions to a seemingly insurmountable problem. Ecol Lett 6: 567–579.
Negro JJ and Torres MJ (1999) Genetic variability and differentiation of two bearded vulture
Gypaetus barbatus populations and implications for reintroduction projects. Biol
Conserv 87: 249–254.
Newmark WD, Manyanza DN, Gamassa D-GM and Sariko HI (1994) The conflict between
wildlife and local people living adjacent to protected areas in Tanzania: human
density as a predictor. Conserv Biol 8: 249-255.
Norris K (2004) Managing threatened species: the ecological toolbox, evolutionary theory
and declining-population paradigm. J Appl Ecol 41: 413–426.
Oaks et al. (2004) Diclofenac residues as the cause of vulture population decline in
Pakistan. Nature 427: 630-633.
Ogada DL (2014) The power of poison: pesticide poisoning of Africa’s Wildlife. Ann NY Acad
Sci. doi:10.1111/nyas.12405.
Ogada DL, Torchin ME, Kinnaird MF and Ezenwa VO (2011) Effects of Vulture Declines on
Facultative Scavengers and Potential Implications for Mammalian Disease
Transmission. Conserv Biol 26(3): 453–460.
Ogada DL, Keesing F and Virani MZ (2012) Dropping dead: causes and consequences of
vulture population declines worldwide. Ann NY Acad Sci 1249: 57-71.

30
Ogden J (1985) The California Condor In: Silvestro RL (editor) Audubon wildlife report 1985
National Audobon Society, New York, pp. 389-99.
Pain DJ, Cunningham AA and Donald PF 2003. Causes and effects of temporospatial
declines of Gyps vultures in Asia. Conserv Biol 17: 661–671.
Pain DJ et al. (2008) The race to prevent the extinction of South Asian vultures. Bird
Conserv Int 18: S30–S48. doi: 10.1017/S0959270908000324.
Parmesan C and Yohe G (2003) A globally coherent fingerprint of climate change impacts
across natural systems. Nature 421: 37–42.
Poulakakis N, Antoniou A, Mantziou G, Parmakelis A, Skartsi T, Vasilakis D, Elorriaga J, de
la Puente J, Gavashelishvili A, Ghasabyan M, Katzner T, McGrady M, Batbayar N,
Fuller M and Natsagdorj T (2008) Population structure, diversity, and phylogeography
in the near-threatened Eurasian black vultures Aegypius monachus (Falconiformes;
Accipitridae) in Europe: insights from microsatellite and mitochondrial DNA variation.
Biol J Linn Soc 95: 859–872.
Pimm SL, Jones HL and Diamond J (1988) On the risk of extinction. Am Nat 132: 757-785.
Reid T, Krüger S, Whitfield P and Amar A (in review) Using spatial analyses of bearded
vulture movements in southern Africa to inform wind turbine placement.
Roberge J-M and Angelstam P (2004) Usefulness of the Umbrella Species Concept as a
Conservation Tool. Conserv Biol 18(1): 76–85.
Roxburgh L and McDoughall R (2012) Vulture poisoning incidents and the status of vultures
in Zambia and Malawi. Vulture News 62: 33-39.

31
Sarrazin F, Virani MZ, Gilbert M and Khan A (2004) Preliminary Population Viability
Analyses for Oriental White-Backed Vulture Gyps bengalensis in Punjab province,
Pakistan. In: Chancellor RD and Meyburg BU (editors) Raptors Worldwide. WWGBP
& MME Penti Kft, Budapest, pp. 257–262.
Schaub M, Zink R, Beissmann H, Sarrazin F and Arlettaz R (2009) When to end releases in
reintroduction programmes: demographic rates and population viability analysis of
bearded vultures in the Alps. J Appl Ecol 46: 92–100. doi: 10.1111/j.1365-2664.
2008.01585.x
Seddon PJ, Griffiths CJ, Soorae PS and Armstrong DP (2014) Reversing defaunation:
Restoring species in a changing world. Science 345(6195): 406-412.
Sekercioglu CH, Daily GC and Ehrlich PR (2004) Ecosystem consequences of bird declines.
Proc Nat Acad Sci 101: 18042–18047.
Shrader-Frechette KS and McCoy ED (1993) Method in Ecology. Strategies for
Conservation. Cambridge University Press, Cambridge.
Siegfried WR, Frost PGH, Cooper J and Kemp AC (1976) Rare and vulnerable birds in
South Africa. Biol Conserv 10: 83–93.
Simberloff D (1997) Invasion biology and Florida's numerous non-indigenous species. In:
Simberloff D, Schmitz DC and Brown TC (editors) Strangers in Paradise. Impact and
Management of Non-indigenous Species in Florida. Island Press, Washington DC,
pp. 3-17.
Sutherland WJ et al. (2011) Horizon scan of global conservation issues for 2011. Trends
Ecol Evol 26(1): 10-16.
Sycholt A (2002) A guide to the Drakensberg. Struik Publishers, Cape Town, South Africa.
Thiollay J-M (2006) The decline of raptors in West Africa: long-term assessment and the role
of protected areas Ibis 148: 240–254.

32
Thomas CD et al. (2004) Extinction risk from climate change. Nature 427: 145–148.
Tracy CR and Brussard PF (1994) Preserving biodiversity: species in landscapes. Ecol
App142: 205-207.
UN Environment Programme (2007) Global Environmental Outlook: Environment for
Development 4. United Nations Environment Programme, Valletta.
Urios V, López-López P, Limiñana R and Godino A (2010) Ranging behaviour of a juvenile
Bearded Vulture (Gypaetus barbatus meridionalis) in South Africa revealed by GPS
satellite telemetry. Ornis Fenn 87: 1-5.
Vignieri S (2014) Vanishing fauna. Science 354(6195): 392-395:
Virani MZ, Kendall C, Njoroge P and Thomsett S (2011) Major declines in the abundance of
vultures and other scavenging raptors in and around the Masai Mara ecosystem,
Kenya. Biol Conserv 144: 746-752.
Watts HE and Holekamp KE 2009. Ecological determinants of survival and reproduction in
the spotted hyaena. J Mammal. 90: 461-471.
Whitley A (1998) Modelling the distribution of vultures in KwaZulu-Natal, South Africa in
relation to environmental variables. Dissertation, University of Natal,
Pietermaritzburg.
Woodroffe R (2000) Predators and people: using human densities to interpret declines of
large carnivores Anim Conserv 3: 165–173.
Woodroffe R and Ginsberg JR (1998). Edge effects and the extinction of populations inside
protected areas. Science 280: 2126–2128.

33
Publications arising from this thesis
In all cases I have lead and conducted the field and laboratory work, data analysis and write-
up. Co-authors of the chapters assisted with data analyses (Chapters 2-6) and laboratory
work (Chapter 5). Co-authors (listed by chapter below) and my supervisors (Dr Arjun Amar
and Dr Rob Simmons) assisted with revisions to the manuscripts. All other assistance
received has been acknowledged either where relevant in each chapter or in the general
acknowledgements preceding the introduction.
Chapter 2 is published in Bird Conservation International:
Krüger SC, Allan DG, Jenkins AR and Amar A (2014) Trends in territory occupancy,
distribution and density of the Bearded Vulture Gypaetus barbatus meridionalis in
southern Africa. Bird Conserv Int 24: 162-177. doi:10.1017/S0959270913000440.
Chapter 3 has been accepted by The Condor and is in press:
Krüger SC, Simmons RE and Amar A (in review) Anthropogenic activities influence
the abandonment of Bearded Vulture Gypaetus barbatus territories in southern
Africa.
Chapter 4 has been accepted by PLoS ONE and is in press:
Krüger SC, Reid T and Amar A (in review) Differential range use between age classes
of southern African Bearded Vultures Gypaetus barbatus.
Chapter 5 is published online in Ibis:
Krüger SC, Wesche PL and Jansen van Vuuren, B (2014) Reduced genetic diversity
in Bearded Vultures Gypaetus barbatus in Southern Africa. doi: 10.1111/ibi.12200.

34
Chapter 6 will be submitted to Oryx.
Krüger SC and Amar A. Poisoning increases the extinction risk of the Bearded
Vulture Gypaetus barbatus in southern Africa.
Additional relevant publications arising from this research include the following:
Krüger SC (2007) Polyandrous trios in the southern African Bearded Vulture Gypaetus
barbatus meridionalis? Vulture News 57:60-61.
Krüger S (editor) (2013) Biodiversity Management Plan for the Bearded Vulture (Gypaetus
barbatus meridionalis) for Southern Africa. Published 8 May 2014 Government
Gazette Notice No 37620.
Krüger S (in press). Bearded Vulture. In: Taylor MR (editor) The Eskom Red Data Book of
Birds of South Africa, Lesotho and Swaziland. BirdLife South Africa, Johannesburg.
Krüger S, Piper S, Rushworth I, Botha A, Daly B, Allan D, Jenkins A, Burden D and
Friedmann Y (editors) (2006) Bearded Vulture (Gypaetus barbatus meridionalis)
Population and Habitat Viability Assessment Workshop Report. Conservation
Breeding Specialist Group (SSC/IUCN)/CBSG Southern Africa, Endangered Wildlife
Trust, Johannesburg.
Reid T, Krüger S, Whitfield P and Amar A (in review) Using spatial analyses of bearded
vulture movements in southern Africa to inform wind turbine placement (submitted to
J Appl Ecol).
Rushworth I and Krüger S (2014) Wind farms threaten southern Africa's cliff-nesting
vultures, Ostrich 85(1): 13-23. doi:10.2989/00306525.2014.913211.

35
Chapter 2: Trends in territory occupancy, distribution and
density of the Bearded Vulture Gypaetus barbatus
in southern Africa
Photo 2 Adult Bearded Vulture seen on a nest during a breeding territory survey

36
A modified form of this chapter is published in Bird Conservation International:
Krüger SC, Allan DG, Jenkins AR and Amar A (2014) Trends in territory occupancy, distribution and density of the Bearded Vulture Gypaetus barbatus meridionalis in southern Africa. Bird Conserv Int 24: 162-177. doi:10.1017/S0959270913000440.

37
Abstract
Territory occupancy, distribution and density of the isolated Bearded Vulture Gypaetus barbatus
population in the Maloti-Drakensberg mountains of southern Africa were assessed between two
time periods - former (1960-1999) and current (2000-2012) - to identify population trends.
Overall, 190 territories were recorded of which 109 are currently occupied. The number of
occupied breeding territories decreased by a minimum of 32% and a maximum of 51% over the
past five decades representing an unequivocal decline in this population at a rate of between
0.64-1.02% per year. The encounter rate of individuals during vehicle surveys also decreased
by 45% over a 30 year time period. Territories located on the periphery of the breeding range
were more likely to be abandoned than those in the core. The current population is estimated at
a minimum of 368 and a maximum of 408 individuals. The breeding range decreased by 27%,
restricting the birds to an estimated area of occupancy of 28,125 km2. Breeding densities also
decreased by 20%, declining from 4.9 to 3.9 pairs/1000 km2. In both periods, higher densities
were recorded in the core of the range. Nests were located about 9.0 km apart, a slight increase
from the 7.7 km recorded formerly. Inter-nest distances increased with distance from the core of
the range. Further studies are required to ascertain whether productivity or survival is limiting
population growth, and whether anthropogenic influences are resulting in the abandonment of
territories in the periphery of the range and the subsequent decline in numbers.
Introduction
Vulture populations are declining worldwide (BirdLife International 2014). In Africa, large
reductions in vulture numbers have occurred in recent decades in areas where these birds were
previously abundant, to the extent that some populations have either become locally extinct or
are found only in protected areas (Ogada et al. 2012). In keeping with these trends, Bearded
Vulture Gypaetus barbatus populations are declining throughout much of the species’ range
(Margalida et al. 2008a, BirdLife International 2014), and have been since as early as the mid-

38
19th century, with some populations nearing extinction by the mid-20th century (Mingozzi and
Estève 1997).
Two distinct subspecies of Bearded Vulture are recognized. The subspecies G. b.
barbatus occurs north of the Tropic of Cancer in Asia, Europe and North Africa, while G. b.
meridionalis occurs south of Tropic of Cancer in Ethiopia, East Africa and southern Africa
(Mundy et al. 1992). Globally, the species is classified as Near Threatened (BirdLife
International 2014). Although the global population size is small and seems to be decreasing,
the species has a very large range and the overall decrease in numbers is not rapid enough to
justify its classification as Vulnerable. However, a number of discrete sub-populations within
each of the two subspecies are threatened with extinction and our aim here is to quantify the
decline for the southern African subspecies.
In central Asia and the Himalayas, Bearded Vultures seem abundant (Terrasse 2001),
although significant declines have been noted recently in the Upper Mustang region of Nepal
(Acharya et al. 2010). Numbers have also decreased further west, with recent localised
extinctions in the Mediterranean, mainly attributed to human persecution and poisoning (Frey
1996, Xirouchakis et al. 2001). In Europe, the species has disappeared from many parts of its
historical distribution (Hiraldo et al. 1979, Del Hoyo et al. 1994, Frey 1996, Mingozzi and Estève
1997, Carrete et al. 2006, Margalida et al. 2008a), and it is now considered Endangered in the
European Union (Annex I, EU Wild Birds Directive 79/409/EEC, Appendix II of the Bern
Convention, Bonn Convention and CITES). The North African population of G. b. barbatus
remains small and isolated from other Mediterranean populations, with a high risk of extinction
in the medium-to-long term (Godino et al. 2005).
Within sub-Saharan Africa, knowledge of the species is poor. Earlier, crude estimates of
the numbers of pairs of G. b meridionalis in Ethiopia and East Africa were 1,430 and 50
respectively (Mundy et al. 1992), while the most recent published report puts the East African
population at only 20-30 pairs (Zimmerman et al. 1996). More recent, unpublished reports

39
suggest that the number of pairs in Ethiopia and East Africa is significantly lower than these
previous estimates, particularly in East Africa where apparently only about 10 pairs remain (S.
Thomsett pers. comm.). Other reports from Ethiopia also suggest a decrease (Ash and Atkins
2009), but basic data on population status is lacking from this country (Shimelis 2011).
In southern Africa, the population lost ca. 38% of its former distribution range during the
period 1700-1969 (Boshoff et al. 1978, 1983, Brooke 1984, Brown 1991) and was described as
“rare and threatened” in a review of the status of threatened South African birds in the 1970s
(Siegfried et al. 1976). The population continued to decline in the 1970s and 1980s although the
distribution remained constant (Brown 1991). The extent of the breeding range of the Bearded
Vulture in southern Africa was estimated to be about 35,000 km2 during 1980-1983, a reduction
of 21,000 km2 from the historic distribution which extended into the south-western Cape (Brown
1991), with the population largely restricted to the highlands of Lesotho and immediately
adjacent areas of the Maloti-Drakensberg mountains (Brown 1990). In the 1980s, the breeding
population was estimated at 204 pairs based on extrapolations from 61 known breeding
territories (Brown 1992). The breeding density ranged from 3.4-7.2 pairs/1000 km2 in the seven
geographical regions used by Brown (1992) to estimate density. In the 1990s, Colahan and
Esterhuizen (1997) observed no breeding pairs in the Free State, and Maphisa (1997) noted
that sightings in the lowlands of Lesotho were rare and that some breeding territories were
abandoned. In 2000, the Bearded Vulture was classified as Endangered in the red data book of
birds of South Africa, Lesotho and Swaziland (Anderson 2000a), as a result of its small and
continuously declining population size, restricted range, range contraction, and its susceptibility
to several known threats in Lesotho and South Africa.
A more recent review of the conservation status of the Bearded Vulture in southern
Africa (Krüger et al. 2006) indicated that numbers were continuing to decrease. However, the
review also identified the lack of sufficient knowledge and understanding of the basic
demography of the regional population as a major deficiency, and an urgent need to accurately

40
determine the number and distribution of breeding pairs and the causes of current trends in the
occupancy of breeding territories.
Bird population declines can show a number of patterns; for example, populations can
exhibit range contraction alone, range contraction and reduced densities in marginal and/or
optimal habitat, or no range contraction but reduced densities (Wilcove and Terborgh 1984).
Declining populations may abandon marginal habitats or peripheral areas and contract toward
the core of the species' range (Mayfield 1972, 1973a, 1973b, Rodríguez 2002), or they may
show reduced densities in the periphery of the range (Wilcove and Terborgh 1984).
Understanding the pattern of decline, may help to infer the causes of the decline which will aid
the development of appropriate monitoring and conservation measures.
In this chapter, we use data from 13 years of ground and aerial surveys of the Bearded
Vulture population in southern Africa to document the number and location of breeding
territories as a measure of population size, and thereby estimate the size of the species’
breeding range and its breeding density. We also compare our numbers with those derived from
a collation of historical survey data (1960-1999), to establish and explain the extent and pattern
of decline shown by the southern African Bearded Vulture population over recent decades. In
particular, we explore whether the southern African Bearded Vulture population has shown a
change in territory occupancy, distribution and density over the two survey periods, and then
examine whether this change has been more pronounced in the periphery of their breeding
range. This chapter aims to improve our understanding of the current dynamics of the region’s
Bearded Vulture population, and to help produce more accurate population projections in
Chapter 6 to guide in situ conservation decisions.

41
Methods
Census of Former and Current Breeding Territories
The location of former breeding territories (defined as cliffs that have a history of use by nesting
Bearded Vulture) was obtained from a variety of published records and unpublished reports
(Appendix 2.1). These documents included details of all known breeding territories occupied
since the 1960s- the earliest records of nest site locations within the breeding distribution range
in the Maloti-Drakensberg mountains (Brown 1992). A similar approach was used by Whitfield et
al. (2006) to classify all potential territories of Golden Eagles Aquila chrysaetos in Scotland.
We then attempted to determine the current occupancy status of these breeding
territories, and to identify any additional territories that may have remained undiscovered,
through extensive ground and aerial helicopter surveys conducted between 2000-2012.
Potential new territories were identified from topographical maps, by land managers from a
questionnaire survey conducted within the species’ range (Hiltunen 2008) and from individuals
who had carried out other field-based activities in specific localities of interest. We then
surveyed these potential territories to confirm their occupancy status. Our 13-year census
period with multiple visits to most sites (Appendix 2.2a: 77% of sites visited more than once)
gave us the confidence that observed trends were real and not a result of year-to-year
population fluctuations or survey and observer biases.
Full details of the census method followed between 2000-2012 are available in Brown
(1992) but are described briefly below. Surveys were undertaken during the breeding period
(nest building to fledging: May to December) because fidelity to nest sites is highest during this
period which increased the probability of seeing birds with territorial behaviour (i.e. nest-
building, nest defence) and determining the occupancy status of the territory. Ground surveys
were done on foot or by vehicle, and potential breeding territories were scanned using
binoculars and 20-60 X telescopes for an average of four hours (4.24 ± 0.18 hours, n=122,

42
range 0.5-11.5 hours) between first and last light, or until breeding was confirmed. Bearded
Vulture pairs are known to have a number of alternate nests on average 230 m apart (Brown
1988), therefore observations included all the cliff faces containing all potential alternate nests
of that territory. To ensure that the observation period was sufficient, surveys were
predominantly (69%, n=608) done during the nestling period when activity at the nest peaks,
with either an attendant adult or with food being provisioned several times a day (Brown 1990).
Since territories recorded by Brown (1990) were on average 7.2 km apart, observers were able
to distinguish between neighbouring territories.
Aerial surveys were done in helicopters, flown at approximately 100-500 m from the cliff
edge at an average flying speed of 70-80 km/h with a minimum of two observers looking out of
the port side of the aircraft. The census method followed between 1960-1999 included a variety
of protocols including those of Brown (1992) described above (Appendix 2.2b).
Territories were considered occupied if at least one adult was flushed off the cliff or seen
flying or roosting in the area, entering a pothole or overhang on the cliff; if a chick or fledgling
was seen; or if there was fresh whitewash and plant material (sticks) on the nest indicating
recent use attributed to this species based on the location of the white-wash and the type of
nest structure. Where nest structures were seen but no bird was seen in the area, the territory
was recorded as unoccupied. Nest structures can remain intact in potholes long after
abandonment, therefore nest structures alone do not serve as a useful indicator of occupancy.
Territories where nest structures were no longer evident or where birds had not been seen in a
number of years (at least four consecutive years of survey) were considered abandoned.
The location of all territories was entered into the geographic information system, ArcGIS
v.9.3 (ESRI, Redlands, USA). Since the GPS coordinates recorded were those of the aircraft or
the observer on the ground and not of the nest, the actual location of the nest site was
extrapolated to the cliff edge. Where a pair had alternate nest sites on the territorial cliff, the
location of the most frequently used site was taken as the location of the territory. As a means of

43
examining regional patterns of change, breeding territories were grouped and compared by
country and district (Lesotho) or province (South Africa) (Figure 2.1).
Figure 2.1 The location of the southern African distribution range of the Bearded Vulture within Lesotho and the three provinces of South Africa.
Estimating Territory Occupancy and Population Size
We compared current (territories occupied during 2000-2012) and former (territories occupied
during 1960-1999) territory occupancy using two scenarios. Firstly, we calculated population
change based on the current status of all territories recorded during 1960-1999. This scenario
excluded those territories recorded for the first time during 2000-2012 and therefore represents
the minimum population change. For this calculation, we took into account that a pair may have
moved their breeding activity to a nearby cliff between the former and current study period,
rather than abandoning their territory. Our decision to categorise whether a pair had abandoned
or potentially relocated their territory was based on the status of, and distance to, the
neighbouring breeding territory within that time period. We used Brown’s (1990) estimate of

44
maximum average inter-nest distance (7.2 km) as the deciding factor; where ‘abandoned’
former nests located <7.2 km from current nests were considered to be nest relocations within
the same territory, while those located >7.2 km from any current nests were considered to have
been abandoned. Territories where former occupied nests were located <7.2 km of each other
were considered abandoned rather than relocated if the neighbouring territory was still
occupied.
Secondly, we assumed that all territories located for the first time during the current
survey period (2000-2012) were occupied formerly (1960-1999) based on the knowledge that
pairs use alternate nests on the same cliff rather than moving to a different cliff (Brown 1990),
and many territories had large, well established nest structures suggesting many years of use.
All known territories were considered occupied at some point since 1960 and therefore
represented potential breeding territories. If all potential territories were occupied in any one
year this would represent the total overall potential former population size. However it is unlikely
that all territories would be occupied annually. Therefore, when examining population change
we are reporting on maximum population change, since all territories would not necessarily
have been occupied every year between 1960-1999 and 2000-2012.
Territory occupancy data were used to estimate the minimum and maximum number of
Bearded Vultures in southern Africa. The total number of currently occupied territories together
with the total number of known trios were used to calculate the number of breeding adults in the
population. Estimates of non-breeding adults are not available for the population and are difficult
to ascertain (Margalida et al. 2011). It was assumed that there were no non-breeding adults in
the population based on Brown (1997) and personal observations of slow replacement at
territories where an individual of a pair had disappeared. To estimate population size, we used
the age ratio (adults : non-adults) calculated from foot surveys done in the core breeding range
and vehicle surveys done throughout the range (see Chapter 6 for details).

45
Estimating Breeding Distribution and Density
The extent of the former and current breeding range was measured by Minimum Convex
Polygons using the Hawth's analysis tools (Beyer 2004) for ArcGIS. The area of occupancy of
the former and current population was measured using the distribution of occupied breeding
territories within quarter degree squares (QDSs), making it comparable with Brown’s (1992)
study. The number of occupied QDSs was multiplied by the size of a QDS (625 km2) to obtain
the area of occupancy.
Breeding density was examined using the number of breeding pairs per 1000 km2 based
on the area of occupancy. Inter-nest distances were measured as the distance to the nearest
nest of a neighbouring conspecific pair.
Estimating Encounter Rates
To examine the change in the relative abundance of adults and non-adults in the study area
over the past 30 years, data from vehicle surveys undertaken in 2012 across the range were
compared with data collected along the same routes in 1981 by Brown (1988, 1992). Vehicle
surveys were conducted following the method of Brown (1992) and the following were recorded;
bird numbers and ages, distance travelled and duration of survey. The average speed of travel
during vehicle surveys was 20 km/h. A total of 2,231 km of vehicle surveys were driven; 816 km
in July in the Lesotho highlands west of the Senqu River, 799 km in September in Lesotho east
of the Senqu River, and 616 km in December in the northern part of the Eastern Cape (see
Figure 6.1, Chapter 6).
Core versus Peripheral Territories
Territories were classified as either within the core breeding range or the peripheral breeding
range based on the number of surrounding QDSs that contained occupied breeding territories.

46
Territories were classified as ‘Peripheral’ if they were surrounded by four or less QDSs (giving
an index of between 0-4) that contained occupied breeding territories. ‘Core’ territories were
those surrounded by at least five occupied QDSs (giving an index of between 5-8).
Statistical Analyses
We used a Generalized Linear Model (GLiM) with a binomial distribution to examine territory
status in relation to country (South Africa or Lesotho), which was fitted as a categorical effect.
We used a General Linear Model (GLM) (i.e. with a normal distribution) to examine inter-nest
distances in relation to period (former or current) and location (core or periphery), which were
fitted as categorical effects. We tested whether the probability of a territory being occupied or
abandoned differed depending on the level of its periphery index. For this we used a GLiM
(binomial error structure and a logit link function) with occupancy status (1/0) as the response
variable and the periphery index as the continuous explanatory variable.
Results
Territory Occupancy and Population Size
We identified a total of 190 potential breeding territories in southern Africa through ground and
aerial surveys, and from published sources (Appendix 2.2a). These were territories which were
known to be used by Bearded Vultures at some point in the past 52 years. Since all potential
breeding cliffs throughout the distribution range were searched during the census period, this
was considered the total number of potential territories in southern Africa. Lesotho had 92
territories and South Africa had 98 (Table 2.1).
The total number of breeding territories occupied during the 2000-2012 census period
was 109, of which 55 were in Lesotho and 54 were in South Africa (Table 2.1). Of these 109

47
territories, the percentage of occupancy varied annually between 31% and 75% with an average
of 55% of the territories being occupied annually overall (Figure 2.2). Breeding territories were
fairly evenly distributed throughout the central and eastern highlands of Lesotho and along the
Drakensberg escarpment in KwaZulu-Natal and the Eastern Cape (Figure 2.3). Territories off
the main escarpment were located on cliffs along river courses, outlying mountain peaks and
sandstone and basalt rock formations above 1,800 m. The remaining 81 territories were
classified as either unoccupied (n=12) or abandoned (n=69) by 2012 (Appendix 2.3).
Table 2.1 A comparison of former and current breeding territory occupancy of the Bearded Vulture in southern Africa (known number of sites in each period).
Figure 2.2 Bearded Vulture territory occupancy in southern Africa between 2000 and 2012 where the annual number of occupied territories is depicted as a percentage of the total number of territories occupied between 2000 and 2012 (n=109) that were surveyed.
0
10
20
30
40
50
60
70
80
2000 2001 2002 2003 2004 2005 2006 2007 2008 2009 2010 2011 2012
Year
Pe
rce
nta
ge
Former (1960-1999) breeding territory occupancy
Current (2000-2012) breeding territory occupancy
Lesotho 92 (35) 55 (55)
South Africa 98 (80) 54 (54)
Totals 190 (115) 109 (109)

48
Of the total number of potential breeding territories (n=190), 115 were reported to be
occupied during 1960-1999 (Appendix 2.2b, Table 2.1). The status of the remaining 75 during
this time is unknown, because these territories were only located during the current census
period as a result of increased survey effort. The minimum population decline was explored
using a scenario which included only the territories known to be active in the past (n=115). A
resurvey of these known former territories classified 59 territories as abandoned, suggesting a
51% decline (Table 2.2). However, if we allow for the possibility that some apparently
abandoned former territories are actually still occupied, with nest sites relocated to new cliffs
<7.2 km from the former nest cliffs (n=22), then the more conservative overall decline is
estimated at 32% (Table 2.2). If we also allow for the unlikely possibility that sites only recorded
in 2000-2012 (n=75) were newly formed territories not occupied formerly, then the decline is
estimated at only 5%.
Figure 2.3 A comparison between territories currently (2000-2012) and formerly (1960-1999) occupied (●); territories only located during the current period (2000-2012) but likely to be occupied in the past (Θ); and abandoned territories (X), i.e. those only occupied formerly.

49
Table 2.2 A comparison of the percentage decrease in the number of occupied territories from the number of known and potentially occupied Bearded Vulture territories recorded in southern Africa during the former (1960-1999) and current (2000-2012) period.
Scenario n Percentage decrease
1: known number of 115 territories recorded 1960-1999
a) Minimum number of formerly know territories occupied currently 56 -51%
b) Maximum number of formerly know territories occupied currently 78 -32%
c) Number of currently occupied territories including new ones 109 -5%
2: potential number of 190 territories recorded 2000-2012
a) Minimum number of potential territories occupied currently 109 -43%
b) Maximum number of potential territories occupied currently 121 -36%
In the second scenario where all potential territories were assumed to be formerly active
(n=190), the maximum population decline is estimated at 43% (n=81) with just over half (57%,
n=109) the territories currently occupied (Table 2.2). Lesotho and South Africa experienced
similar (χ2=0.43, df=1, P=0.51) maximum declines of 40% and 45% respectively (Appendix 2.4).
There were 12 territories classified as unoccupied but which were only checked between one
and three times during this period, primarily through aerial surveys (Appendix 2.5). It is therefore
possible that we may have missed the presence of an adult and the territory may have been
occupied at some point during this period. Therefore, if we make the conservative assumption
that all these territories were actually occupied at some stage during the 2000-2012 period, then
the current population comprises a maximum of 121 occupied territories, and would give an
estimated minimum population decline of 36% (Table 2.2).
If the 5% decline in known territories is discounted as being unlikely, the maximum
decline in the known number of territories (51%) is higher than the maximum decline in potential
territories (43%). The minimum decline in known territories (32%) is slightly lower than the
minimum decline in potential territories (36%), and is probably a more accurate reflection of the
actual trend in breeding territory numbers. Either way these different approaches yielded very
50
similar results and suggest that the decline is real and lies between 32% and 51%. The rate of
decline therefore over the past 50 years is between 0.64-1.02% per annum.
All further analyses exploring change were based on the current (minimum) estimate of
109 known occupied territories and the assumption that newly found territories were previously
occupied, giving a total of 190 formerly occupied territories.
Current Population Estimate
Based on the current territory occupancy figures (n=109 minimum and n=121 maximum), the
known number of trios in the population (n=3), and the age structure of the population (from
Chapter 6; 1 adult : 0.67 non-adults), we estimate the southern African Bearded Vulture
population to comprise a minimum of 221 breeding adults and 147 non-adult birds and a
maximum of 245 breeding adults and 163 non-adult birds. The total current population estimate,
therefore, is between 368 and 408 individuals.
Breeding Distribution and Density
The extent of the current breeding range (33,883 km2), as calculated by Minimum Convex
Polygon, is 37% less than that of the former breeding range (53,817 km2) and depicts the total
study area (Figure 2.4).
The area currently occupied by breeding Bearded Vultures in southern Africa, based on
the number of QDSs with territories occupied during the survey period (n=109), is 28,125 km2,
with breeding recorded in 45 QDSs (Figure 2.4). In contrast, the area occupied by the former
breeding population, based on all territories known or assumed to have been occupied at least
once during 1960-1999 and 2000-2012 (n=190), was 38,750 km2, with breeding recorded
formerly in 62 QDSs (Figure 2.4). This estimate is slightly larger than an earlier estimate of
35,000 km2 (Brown 1992) because it incorporates additional QDSs with newly confirmed

51
breeding territories. If we assume these newly found sites were occupied previously, then the
area of occupancy, decreased by 27% over the past five decades. This decrease was greater in
South Africa (31%) than in Lesotho (19%) (Table 2.3).
Figure 2.4 A comparison between the current (solid filled: 2000-2012) and former (hashed filled:1960-1999) breeding distribution of the Bearded Vulture in southern Africa, mapped per Quarter Degree Square (625 km2), within the former (thin line) and current (bold line) extent of the breeding range, showing formerly (x) and currently (●) occupied territories.
Table 2.3 A comparison of the former and current breeding area of occupancy of the Bearded Vulture in southern Africa (where area = number of occupied quarter degree squares multiplied by the area of a quarter degree square).
Former (1960-1999) area of occupancy
Current (2000-2012) area of occupancy
Percentage decline in area of occupancy
Lesotho 23,125 km2 18,750 km2 -19%
South Africa 21,875 km2 15,000 km2 -31%
Southern Africa 38,750 km2 28,125 km2 -27%

52
Consistent with the observed changes in territory occupancy and breeding range, current
Bearded Vulture densities of 3.9 occupied territories/1000 km2, are 20% lower than the 4.9
occupied territories/1000 km2 recorded formerly, i.e. based on the assumption that all currently
know sites were previously occupied. Consequently, the average inter-nest distance of currently
occupied territories is higher (9.0 ± 0.8 km, n=109; range 1.3-55.5 km) than the average inter-
nest distance of formerly occupied territories (7.7 ± 0.6 km, n=190; range 1.0-52.9 km),
although this difference is not significant (F1,19=1.08, P=0.32). The difference in inter-nest
distances between the two periods is small because former peripheral territories with greater
inter-nest distances were abandoned, resulting in the remaining territories having lower inter-
nest distances than expected.
The encounter rate of Bearded Vultures during vehicle survey was 3.14 birds/10 hours in
2012 compared with 6.99/birds/10 hours in 1981, less than half (45%) the number of sightings
than in the past. In 2012 a total of 2231 km were driven over a period of 89.4 hours, compared
with 1779 km in 100 hours in 1981 (C. Brown pers. comm.). Adults were sighted more
frequently in 2012 than non-adults in the core areas of the range (Lesotho), whereas non-adults
were more commonly sighted in the peripheral areas (Eastern Cape) (Table 2.4). However, the
number of adults sighted overall was approximately half the number (51%) sighted in 1981. If all
individuals were aged during the survey, the encounter rate of adults may be higher than
shown, however the proportion of individuals not aged was higher in 2012 than during 1981.
Table 2.4 The number of individuals sighted per 10 hours along vehicle survey routes during 2012 in the Bearded Vulture’s range in southern Africa. The number of individuals sighted in 1981 (C. Brown pers. comm.) is given in parentheses for comparative purposes.
Survey Type Total/ 10 hours
Adults/ 0 hours
Non-adults/ 10 hours
Unknown/ 10 hours
Western Lesotho (core) July 2012
1.89 (7.33) 1.89 (4.33) 0.00 (2.70) 0.00 (0.33)
Eastern Lesotho (core) September 2012
5.95 (9.94) 3.35 (4.14) 2.23 (4.97) 0.37 (0.83)
North-eastern Cape (peripheral) December 2012
1.57 (3.70) 0.00 (1.74) 0.39 (1.96) 1.18 (0.00)
Overall average
3.14 (6.99) 1.75 (3.40) 0.87 (3.21) 0.52 (0.39)
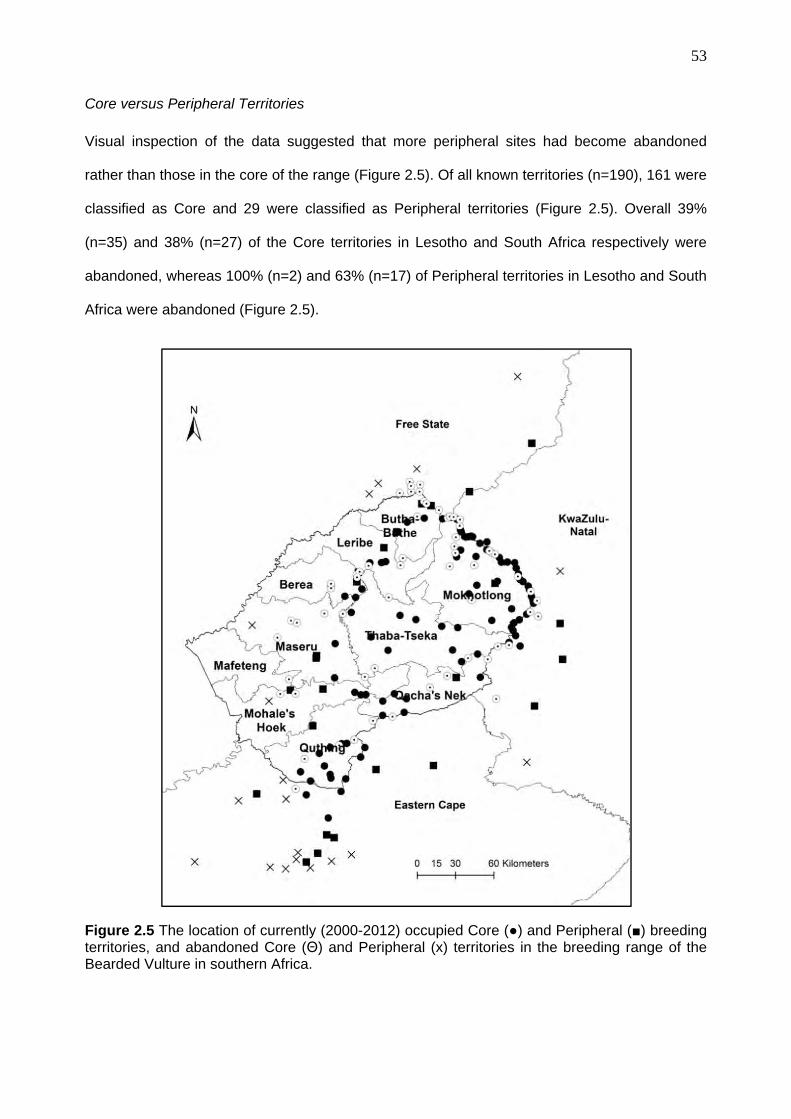
53
Core versus Peripheral Territories
Visual inspection of the data suggested that more peripheral sites had become abandoned
rather than those in the core of the range (Figure 2.5). Of all known territories (n=190), 161 were
classified as Core and 29 were classified as Peripheral territories (Figure 2.5). Overall 39%
(n=35) and 38% (n=27) of the Core territories in Lesotho and South Africa respectively were
abandoned, whereas 100% (n=2) and 63% (n=17) of Peripheral territories in Lesotho and South
Africa were abandoned (Figure 2.5).
Figure 2.5 The location of currently (2000-2012) occupied Core (●) and Peripheral (■) breeding territories, and abandoned Core (Θ) and Peripheral (x) territories in the breeding range of the Bearded Vulture in southern Africa.

The locat
probabilit
had a hig
periphery
5.4 ± 0.2;
(4.6 territ
territories
P<0.0001
(16.4 ± 2
Figure 2and ‘1’ isModel. This PeriphSquares
tion of a ter
ty of aband
gher probab
y index (i.e.
; occupied:
tories/1000
s/1000 km2
1) closer to
.7 km, n=25
.6 The relas occupied)he probabil
heral and ‘8which conta
rritory (in te
donment (χ2
bility of aban
. surrounde
6.2 ± 0.1) (
km2) is m
2). Unsurpr
ogether (6.7
5; range 1.7
tionship be) and regionity of occup
8’ is Core), ained breed
rms of a sit
2=9.33, df=1
ndonment, o
ed by less o
(Figure 2.6)
more than d
isingly, Co
7 ± 0.4 km,
7-55.5 km).
tween probn. The line pancy increa
which is bding Bearde
te’s periphe
189, P=0.00
or put anoth
occupied Q
). The curre
double the
re breeding
n=84; rang
bability of teis the fitted
ases with abased on thed Vultures.
ery index) ha
02). Territo
her way, ab
DS) than o
nt breeding
density in
g territories
ge 1.3-16.4
erritory occud line fromn increase
he number .
ad a signific
ries that we
bandoned te
occupied ter
density in t
the periph
s are signi
4 km) than
upancy (wha Binomia
in the peripof surround
cant influen
ere more p
erritories ha
rritories (ab
the core of
hery of the
ificantly (F
Peripheral
ere ‘0’ is abal Generalizhery index ding Quarte
54
nce on the
peripheral,
ad a lower
bandoned:
the range
range (2
1,109=0.08,
territories
bandoned zed Linear (where ‘0’ er Degree

55
Discussion
This study confirmed the decrease of the Bearded Vulture in southern Africa documented by
Krüger et al. (2006). This study quantified decreases in territory occupancy (by 32-51%),
breeding distribution (by about 27%) and density (by about 20%) over the last 52 years, and
verified that territory abandonment has been more frequent around the periphery of the species’
range. The rate of population decline was between 0.64-1.02 per annum. In addition, there was
a 45% reduction in the encounter rate of individuals within the range over a 30 year period. Our
results suggest that recommendations to address the already severe declines documented in
the 1980s (Brown 1991) have either not been implemented or have not been sufficient to
adequately arrest these negative trends.
The recent extensive and thorough census revealed a slightly larger former breeding
range, with new breeding territories that were not previously recorded by Brown (1992). Our
estimates of former breeding range (38,750 km2), breeding density (3.9 pairs/1000 km2) and
breeding population (190 pairs), are very similar to the estimates of 35,000 km2, 3.4-7.2
pairs/1000 km2 and 204 pairs respectively derived by Brown (1992), despite only 30% of the
territories being known at that time. Our estimate of the current number of breeding territories in
Lesotho (55) is at the lower end of a more recent, independent estimate of 55-70 breeding
territories (Kopij 2004).
Although there has been a reduction in breeding density, the density recorded during
this study (3.9 pairs/1000 km2) is within the range of densities recorded for various regions
within the Spanish Pyrenees (0.14-7.4 pairs/1000 km2), with the highest densities being
recorded in the core region (Margalida et al. 2003, Carrete et al. 2006, Margalida et al. 2007,
Gómez de Segura et al. 2012). Similarly the average nearest neighbour distance in our
population (9.0 km) was within the range of 2.1-28.0 km and 8.9-11.1 km recorded in the
Spanish Pyrenees (Donázar et al. 1993, Margalida et al. 2008b). Although the results allow for
interesting comparisons with wild populations elsewhere, the densities recorded in the Spanish
Pyrenees are those of a recovering population with an important network of supplementary

56
feeding sites which probably promotes territory shrinkage (Margalida et al. 2008b) and therefore
may not be a real reflection of natural densities.
Breeding densities were highest in the core of the range along the Maloti-Drakensberg
escarpment and in the Lesotho Highlands but many breeding territories off the main escarpment
in South Africa have been abandoned. Our study therefore, confirms the previously documented
abandonment of territories in the lowlands (Maphisa 1997) and peripheral areas of the range
(Colahan and Esterhuizen 1997). The population has exhibited a contraction in breeding range
as well as a contraction to the centre of the breeding range, evidenced by the greater chance of
abandonment in the peripheral areas and higher territory densities in the core areas than in the
peripheral areas. This observed decline supports the patterns identified by Mayfield (1972,
1973a, 1973b) and Wilcove and Terborgh (1984) who recorded reduced densities in marginal
and sub-optimal habitats and contraction toward the centre of the species' range as populations
decline. Our findings also show some support for the “melting range” analogy (Rodríguez 2002);
as a population declines in abundance, it becomes increasingly rare in peripheral areas and
experiences a range reduction, and remaining territories occupy the range where densities were
higher before the decline. Knowledge of the mechanisms of decline and the underlying local
densities is required to interpret the patterns in range contraction and density reduction for the
monitoring and conservation of the species to be more effective (Schonewald-Cox and
Buechner 1991). These mechanisms, such as food availability, climatic factors or human
density and associated infrastructure require further investigation.
The declines shown, and the potential threats discussed, in this study are reflected by a
number of studies on other sub-populations of Bearded Vulture (e.g. Frey 1996, Mingozzi and
Estève 1997, Del Hoyo et al. 1994, Carrete et al. 2006, Margalida et al. 2008a) and on other
vulture populations in Africa (Rondeau and Thiollay 2004, Thiollay 2007, Virani et al. 2011,
Ogada et al. 2012). Regionally, cliff-nesting Cape Vultures Gyps coprotheres have also declined
in range and numbers throughout the Maloti-Drakensberg mountains and adjacent areas (Piper
57
1997, Vernon and Boshoff 1997, Anderson 2000b, Allan and Jenkins 2006, Boshoff et al. 2009),
possibly as a result of a similar suite of driving forces.
Tall cliffs are ubiquitous throughout the Lesotho highlands and along the Drakensberg
escarpment, and this together with the fact that there were many unoccupied territories,
provides further support for Brown et al.’s (1988) previous conclusion that the availability of
suitable breeding territories is not a limiting factor in the size of the southern African breeding
Bearded Vulture population. The original range contraction and population decline that
restricted the species to its current range were attributed to persecution by humans (shooting,
poisoning and disturbance at nests) and a decrease in the availability of carrion (Siegfried et al.
1976), although studies in Spain have shown that food shortages affect this species to a lesser
degree (Margalida and Colomer 2012). More recently, decreasing numbers have been
attributed to poisoning (Brown 1991), displacement by humans and livestock at lower altitudes
and degradation of habitat (Mundy et al. 1992, Vernon and Boshoff 1997), and the deliberate
persecution of vultures for traditional medicine, food and ceremonial purposes (Maphisa 1997,
Ngwenya 2001, Mander et al. 2007). We also cannot exclude the possibility that climatic factors
have forced birds into higher and cooler sites and reduced the breeding population over this
time period (Simmons and Jenkins 2007) as predicted for other southern African birds
(Simmons et al. 2004).
The past few decades have seen a large increase in the size of the human population
and associated developments within the region (Statistics South Africa 2011). We hypothesize
that anthropogenic influences are driving the abandonment of Bearded Vulture territories,
particularly on the periphery of the breeding range, but the exact mechanics of this interaction
remain unknown and will be investigated further in Chapter 3. Non-natural mortalities attributed
to illegal poisoning have been the main mortality factor in other populations (Margalida 2012). In
Chapter 6, we examine whether poisoning, either direct (for traditional medicine purposes)
and/or indirect (through ingesting carcasses containing harmful veterinary drugs or poisoned
bait for predator control), is also still a major mortality factor for the population in southern

58
Africa. Information on nesting success and survival of different age classes will also be
investigated in Chapter 6 to determine whether either may be a contributing factor to the
species’ decline documented in this chapter.
Our findings have ensured a more accurate reassessment of the species’ conservation
status and served to substantiate the regional uplisting of the species to Critically Endangered
(Krüger in press). We show patterns of decline consistent with other studies that have
documented the collapse of several vulture populations throughout Africa in the past decade
(Rondeau and Thiollay 2004, Thiollay 2007, Virani et al. 2011, Ogada et al. 2012). Collectively,
these results are suggestive of an “African Vulture Crisis”, and motivate for an urgent, informed
and concerted conservation effort to ensure the continued survival of vultures across the African
continent. A number of conservation measures, such as supplementary feeding, have been
successfully implemented elsewhere to address food shortages, the effects of direct and indirect
poisoning and to improve breeding success (Piper et al. 1999, Margalida et al. 2003, Oro et al.
2008). These measures must be investigated for the potential effectiveness of their
implementation for this population.
Acknowledgements
We are grateful to Ezemvelo KwaZulu-Natal Wildlife, the Wildlands Conservation Trust, the
Maloti Drakensberg Transfrontier Programme, Sasol through the Endangered Wildlife Trust,
Free State Economic Development, Tourism and Environmental Affairs, the South African Air
Force and the Durban National Science Museum for their generous funding and assistance with
the various surveys during the census period. We thank the many dedicated volunteers and
individuals from various organisations who assisted with the surveys, in particular Ezemvelo
KwaZulu-Natal Wildlife staff (Douglas van Zyl, Peter Chadwick, Alan Howell, John Crowson,
Eduard Goosen and the Ecological Advice Staff, Field Rangers and Conservation Managers
throughout the Maloti Drakensberg Park World Heritage Site) and Richard Lechmere-Oertel.

59
The following individuals are thanked for making their unpublished information available: David
Ambrose, Robin Guy, Wigbert Vogeley, Brian Colahan and especially Christopher Brown. Rob
Simmons is thanked for commenting on an earlier draft of this manuscript.
References
Acharya R, Cuthbert R, Baral HS and Chaudhary A (2010) Rapid decline of the Bearded Vulture
Gypaetus barbatus in Upper Mustang, Nepal. Forktail 26: 117-120.
Allan DG and Jenkins AR (2006) Status Report and Monitoring Plan for the Bearded and Cape
Vultures in Lesotho. Part 1: Status of breeding sites of Bearded and Cape Vultures in
Lesotho based on a review and field surveys. Maloti Drakensberg Ecology Consultants
cc. unpubl report.
Anderson MD (2000a) Bearded Vulture Gypaetus barbatus. In: Barnes KN (editor) The Eskom
Red Data book of birds of South Africa, Lesotho and Swaziland. BirdLife South Africa,
Johannesburg, pp. 39-41.
Anderson MD (2000b) Cape Vulture Gyps coprotheres P In: Barnes KN (editor) The Eskom Red
Data book of birds of South Africa, Lesotho and Swaziland. BirdLife South Africa,
Johannesburg, pp. 39-41.
Ash J and Atkins J (2009) Birds of Ethiopia and Eritrea: an atlas of distribution. Christopher
Helm, London.
Beyer HL (2004) Hawth’s analysis tools for ArcGIS. Available at http://www.spatialecology.
com/htools.
BirdLife International (2014) IUCN Red List for birds. Downloaded from http://www.birdlife.org
on 05/08/2014.
Boshoff AF, Brooke RK and Crowe TM (1978) Computerized distribution mapping scheme for
vertebrates in southern Africa. S Afr J Wildl Res 8: 145-149.

60
Boshoff AF, Vernon CJ and Brooke RK (1983) Historical atlas of the diurnal raptors of the Cape
Province (Aves: Falconiformes). Ann Cape Prov Mus (Nat Hist Ser) 14: 173-297.
Boshoff A, Piper S and Michael M (2009) On the distribution and breeding status of the Cape
Griffon Gyps coprotheres in the Eastern Cape province, South Africa. Ostrich 80: 85–92.
Brooke RK (1984) South African Red Data Book- Birds. S Afr Nat Sci Prog Rep 97. CSIR,
Pretoria.
Brown CJ (1990) Breeding biology of the Bearded Vulture in southern Africa, Parts I – III.
Ostrich 61: 24-49.
Brown CJ (1991) An Investigation into the decline of the Bearded Vulture Gypaetus barbatus in
southern Africa. Biol Conserv 57: 315-337.
Brown CJ (1992) Distribution and status of the Bearded Vulture Gypaetus barbatus in southern
Africa. Ostrich. 63: 1-9.
Brown CJ (1997) Population dynamics of the Bearded Vulture Gypaetus barbatus in southern
Africa. Afr J Ecol 35: 53-63.
Brown CJ, Brown SE and Guy JJ (1988) Some physical parameters of Bearded Vulture
Gypaetus barbatus nest sites in southern Africa. Proceedings of the VI Pan-African
Ornithological Congress, pp. 139-152.
Carrete M, Donázar JA and Margalida A (2006) Density dependent productivity depression in
Pyrenean Bearded Vultures: Implications for conservation. Ecol Appl 16: 1674–1682.
Colahan BD and Esterhuizen JR (1997) The status and conservation of vultures in the Free
State Province, South Africa. In: Boshoff AF et al. (editors) Vultures in the 21st Century.
Proceedings of a Workshop on Vulture Research and Conservation in Southern Africa.
Vulture Study Group, Johannesburg, pp. 46-49.

61
Del Hoyo J, Elliott A and Sargatal J (1994) Handbook of the Birds of the World. Vol 2. Lynx
Edicions, Barcelona.
Donázar JA, Hiraldo F and Bustamante J (1993) Factors Influencing Nest Site Selection,
Breeding Density and Breeding Success in the Bearded Vulture (Gypaetus barbatus). J
Appl Ecol 30: 504-514.
Frey H (1996) The situation of the Bearded Vulture (Gypaetus barbatus) in the Mediterranean
countries. In: Muntaner J and Majol J (editors) Biología y Conservación de las Rapaces
Mediterráneas, 1994. Monografías 4, SEO, Madrid.
Godino A, Paz JL, Mouati N and Simón MA (2005) Three Years of Bearded Vultures´ Surveys in
Morocco. In: Frey H, Schaden G and Bijleveld van Lexmond M (editors) Bearded Vulture
Annual Report 2005. Foundation for the Conservation of the Bearded Vulture (FCBV),
Wassenaar, The Netherlands.
Gómez de Segura AG, Martínez JM and de la Fuente MA (2012) Population size of the
endangered vulture Gypaetus barbatus in Aragon (Spain): an approximation to the
Pyrenean population. Ardeola 59: 43-55.
Hiltunen TA (2008) Farmers and the Bearded Vulture Gypaetus barbatus meridionalis.
Dissertation, University of Pretoria.
Hiraldo F, Delibes M and Calderon J (1979) El Quebrantahuesos: sistemática, taxonomía,
biología, distribución y protección. Monografías 22, ICONA, Madrid.
Kopij G (2004) Status and conservation of the Bearded Vulture Gypaetus barbatus meridionalis
in Lesotho. In: Frey H, Schaden G and Bijleveld van Lexmond M (editors) Bearded
Vulture Annual Report 2004. Foundation for the Conservation of the Bearded Vulture
(FCBV), Wassenaar, The Netherlands.

62
Krüger S (in press) Bearded Vulture. In: Taylor MR (editor) The Eskom Red Data Book of Birds
of South Africa, Lesotho and Swaziland. BirdLife South Africa, Johannesburg.
Krüger S, Piper S, Rushworth I, Botha A, Daly B, Allan D, Jenkins A, Burden D and Friedmann
Y (editors) (2006) Bearded Vulture (Gypaetus barbatus meridionalis) Population and
Habitat Viability Assessment Workshop Report. Conservation Breeding Specialist Group
(SSC/IUCN)/CBSG Southern Africa. Endangered Wildlife Trust, Johannesburg.
Mander M, Diederichs N, Ntuli L, Khulile M, Williams V and McKean S (2007) Survey of the
Trade in Vultures for the Traditional Health Industry in South Africa. Futureworks, unpubl
report, 30pp.
Maphisa DH (1997) Vultures in Lesotho: past, present and future. In: Boshoff AF et al. (editors)
Vultures in the 21st Century. Proceedings of a Workshop on Vulture Research and
Conservation in Southern Africa. Vulture Study Group, Johannesburg, pp. 93-96.
Margalida, A (2012) Baits, budget cuts: a deadly mix. Science 338: 192.
Margalida A, García D, Bertran J and Heredia R (2003) Breeding biology and Success of the
Bearded Vulture Gypaetus barbatus in eastern Pyrenees. Ibis 145: 244-252.
Margalida A, García D and Cortés-Avizanda A (2007) Factors influencing the breeding density
of Bearded Vultures, Egyptian Vultures and Eurasion Griffon Vultures in Catalonia (NE
Spain): management implications. Anim Biodiv Conserv 30(2): 189-200.
Margalida A, Heredia R, Razin M and Hernandez M (2008a) Sources of variation in mortality of
the Bearded Vulture Gypaetus barbatus in Europe. Bird Conserv Int 18: 1-10.
Margalida A, Donázar JA, Bustamante J, Hernández FJ and Romero-Pujante M (2008b)
Application of a predictive model to detect long-term changes in nest-site selection in the
Bearded Vulture Gypaetus barbatus: conservation in relation to territory shrinkage. Ibis
150: 242-249.

63
Margalida A, Oro D, Cortés-Avizanda A, Heredia R and Donázar JA (2011) Misleading
population estimates: biases and consistency of visual surveys and matrix modelling in
the endangered Bearded Vulture. PLoS ONE 6: e26784.
Margalida A and Colomer MA (2012) Modelling the effects of sanitary policies on European
vulture conservation. Sci Rep 2: 753.
Mayfield HF (1972) Third decennial census of Kirtland's Warbler. Auk 89: 263-268.
Mayfield HF (1973a) Census of Kirtland's Warbler in 1972. Auk 90: 684-685.
Mayfield HF (1973b) Kirtland's Warbler Census, 1973. Am Birds 27: 950-952.
Mingozzi T and Estève R (1997) Analysis of a historical extirpation of the Bearded vulture
Gypaetus barbatus (L.) in the Western Alps (France-Italy): former distribution and
causes of extirpation. Biol Conserv 79: 155-171.
Mundy P, Butchart D, Ledger J and Piper S (1992) The Vultures of Africa. Russel Friedman
Books cc, Johannesburg, South Africa.
Ngwenya NP (2001) Implications of the medicinal animal trade for Nature Conservation in
KwaZulu-Natal. Ezemvelo KZN Wildlife unpubl report, 76pp.
Ogada DL, Keesing F and Virani MZ (2012) Dropping dead. Causes and consequences of
vulture population declines worldwide. Ann NY Acad Sci 1249: 57-71.
Oro D, Margalida A, Carrete M, Heredia R, Donázar JA (2008) Testing the Goodness of
Supplementary Feeding to Enhance Population Viability in an Endangered Vulture.
PLoS ONE 3: e4084.
Piper SE (1997) The status and distribution of vultures in the KwaZulu-Natal Province, South
Africa. In: Boshoff AF et al. (editors) Vultures in the 21st Century. Proceedings of a
Workshop on Vulture Research and Conservation in Southern Africa. Vulture Study
Group, Johannesburg, pp. 93-96.

64
Piper SE, Boshoff AF and Scott HA (1999) Modelling survival rates in the Cape Griffon Gyps
Coprotheres, with emphasis on the effects of supplementary feeding. Bird Study 46:
230-238.
Rodríguez JP (2002) Range contraction in declining North American bird populations. Ecol Appl
12: 238-248.
Rondeau G. and Thiollay JM (2004) West African vulture decline. Vulture News 51: 13-33.
Schonewald-Cox C and Buechner M (1991) Housing viable populations in protected habitats:
the value of coarse-grained geographic analysis of density patterns and available
habitat. In: Seitz A and Loeschcke V (editors) Species conservation: a population-
biological approach. Birkhauser, Basel, Switzerland.
Shimelis A (2011) The Status of Raptors in Ethiopia. Downloaded from http://www.
africanraptors.org/the-status-of-raptors-in-ethiopia-by-anteneh-shimelis on 13/05/2012.
Siegfried WR, Frost PGH, Cooper J and Kemp AC (1976) Rare and vulnerable birds in South
Africa. Biol Conserv 10: 83-93.
Simmons RE, Barnard P, Dean WRJ, Midgley GF, Thuiller W and Hughes G (2004) Climate
change and birds: perspectives and prospect from southern Africa. Ostrich 75: 295-308.
Simmons RE and Jenkins AR (2007) Is climatic change influencing the decline of Cape and
Bearded Vultures in southern Africa? Vulture News 56: 41-51.
Statistics South Africa (2011) Mid-year population estimates 2011. Statistical release, P0302,
Pretoria, South Africa.
Terrasse JF (2001) Le gypaéte barbu. Delachaux et Niestle´, Lusanne, Switzerland.
Thiollay JM (2007) Raptor population decline in West Africa. Ostrich 78: 405–413.

65
Vernon CJ and Boshoff AF (1997) A review of the status of vultures in the Eastern Cape
Province, South Africa. In: Boshoff AF et al. (editors) Vultures in the 21st Century.
Proceedings of a Workshop on Vulture Research and Conservation in Southern Africa.
Vulture Study Group, Johannesburg, pp. 50-56.
Virani MZ, Kendall C, Njoroge P and Thomsett S (2011) Major declines in the abundance of
vultures and other scavenging raptors in and around the Masai Mara ecosystem, Kenya.
Biol Conserv 144: 746-752.
Whitfield DP, Fielding AH, McLeod DRA, Haworth PF and Watson J (2006) A conservation
framework for the golden eagle in Scotland: Refining condition targets and assessment
of constraint influences. Biol Conserv 130: 465–480.
Wilcove DS and Terborgh JW (1984) Patterns of population decline in birds. Am Birds 38: 10-
13.
Xirouchakis S, Sakoulis A and Andreou G (2001) The decline of the Bearded Vulture Gypaetus
barbatus in Greece. Ardeola 48(2): 183-190.
Zimmerman DA, Turner DA and Pearson DJ (1996) Birds of Kenya and northern Tanzania.
Princeton University Press, Princeton, New Jersey.

66
Appendices
Appendix 2.1 Published records and unpublished reports from which the location of former breeding territories was obtained.
Allan DG (1996) Report on survey of birds downstream of Mohale Dam on the Senqunyane and Senqu rivers. ADU Res Rep 19: 1-71.
Allan DG (2001) The impact of the inundation of Katse Dam in the Lesotho highlands on the local avifauna, based on a comparison of information collected during a pre-inundation baseline survey (1991) and a post-inundation monitoring study (1996-2000) - LHDA Project 615 - Birds. Durban Natural Science Museum Bird Department Research Report 13: 1-351.
Allan DG, Barnes KN, Jenkins AR and Whittington P (1996) Baseline Biological Survey, Fauna and Flora, Lesotho Highlands Water Project Phase 1B Mohale Dam - Birds. ADU Res Rep 18: 1-126.
Ambrose D (2005) Lesotho annotated bibliography. Section 167. Birds including annotated species checklist. Second edition. House 9 Publications, Roma University of Lesotho, Roma, Lesotho.
Ambrose D and Maphisa DH (1999) Guide to the birds of the Roma Campus, National University of Lesotho. National University of Lesotho Publishing House, Roma, Lesotho.
British Schools Exploration Society (BSES) (2003) Lesotho 2003 – Ornithological File. BSES unpubl report.
Brown CJ (1990) Breeding biology of the Bearded Vulture in southern Africa, Parts I – III. Ostrich 61: 24 - 49.
Brown CJ (1991) An Investigation into the decline of the Bearded Vulture Gypaetus barbatus in southern Africa. Biol Conserv 57: 315-337.
Jacot-Guillarmod C (1963) Catalogue of the birds of Basutoland. S Afr Avi Ser 8: 1-111.
Kopij G (2002) The birds of Sehlabathebe National Park. Koedoe 45: 65-78.
Kopij G (2004) Status and conservation of the Bearded Vulture Gypaetus barbatus meridionalis in Lesotho. In: Frey H, Schaden G and Bijleveld van Lexmond M (editors) Bearded Vulture Annual Report 2004. Foundation for the Conservation of the Bearded Vulture (FCBV), Wassenaar, The Netherlands.
Maphisa DH (1997) Vultures in Lesotho: past, present and future. In: Boshoff AF et al. (editors) Vultures in the 21st Century. Proceedings of a Workshop on Vulture Research and Conservation in Southern Africa, Vulture Study Group, Johannesburg, pp. 93-96.
Maphisa DH (2001) British Schools Exploration Society’s (BSES) survey of vultures at selected sites in Lesotho – July to August 1998. Vulture News 45: 11-19.
Osborne PE and Tigar BJ (1990) The status and distribution of birds in Lesotho, unpubl report.
van Zyl D (2001) Vulture Survey- uKhahlamba Drakensberg Park 2001. Ezemvelo KZN Wildlife unpubl report, 13pp.
van Zyl D (2002) Preliminary results of a Vulture Survey in the uKhahlamba Drakensberg Park - July 2002. Ezemvelo KZN Wildlife unpubl report, 9pp.

67
Appendix 2.2a The number of breeding territories depicted by survey frequency and survey type during 2000-2012.
Appendix 2.2b The number of breeding territories depicted by survey frequency and survey type during 1960-1999.
* Information obtained from unpublished reports where the survey type was unknown
Appendix 2.3 The number of breeding territories depicted by survey frequency and territory status during 2000-2012.
Survey Type
Survey frequency Aerial Ground Combination Totals
Once 25 18 0 43 (23%)
2-3 times 20 10 31 61 (32%)
4-6 times 1 10 19 30 (16%)
7-13 times 0 5 51 56 (29%)
Totals 46 (24.2%) 43 (22.6%) 101 (53.2%) 190
Survey type
Survey frequency Aerial Ground Aerial and ground Other* Totals
Once 69 10 0 0 79 (69%)
2-6 times 0 17 5 5 27 (23%)
7-13 times 0 1 0 0 1 (0.9%)
Unknown 0 0 0 8 8 (7%)
Totals 69 (60%) 28 (24.3%) 5 (4.3%) 13 (11.3%) 115
Territory status
Survey Frequency Occupied Unoccupied Abandoned
Once 20 9 14
2-3 times 29 3 29
4-6 times 22 0 8
7-13 times 38 0 18
Totals 109 12 69

68
Appendix 2.4 A comparison of the former (1960-1999) and current (2000-2012) breeding territory occupancy of the Bearded Vulture in southern Africa, depicted by district in Lesotho and by province in South Africa.
Appendix 2.5 The number of breeding territories depicted by survey type and territory status during 2000-2012.
Territory status
Survey type Occupied Unoccupied Abandoned
Aerial 22 9 15
Ground 29 1 12
Combination 58 2 42
Total 109 12 69
Region Former breeding
territory occupancy
Current breeding
territory occupancy
Percent
loss
Lesotho: Butha Buthe 5 4 20
Lesotho: Leribe 8 4 50
Lesotho: Berea 11 5 55
Lesotho: Mokhotlong 16 10 38
Lesotho: Mohale’s Hoek 9 6 33
Lesotho Maseru 9 4 56
Lesotho: Mafeteng 1 0 50
Lesotho: Thaba Tseka 12 8 33
Lesotho: Quachas Nek 8 5 38
Lesotho: Quthing 13 9 39
Lesotho sub-total 92 55 40
South Africa: Free State Province 17 3 82
South Africa: KwaZulu-Natal Province 53 35 34
South Africa: Eastern Cape Province 28 16 43
South Africa sub-total 98 54 45
Totals 190 109 43

69
Chapter 3: Anthropogenic activities influence the abandonment
of Bearded Vulture Gypaetus barbatus territories in
southern Africa
Photo 3 Adult Bearded Vulture foraging amongst anthropogenic activities

70
A modified form of this chapter has been accepted by The Condor and is currently in press:
Krüger SC, Simmons RE and Amar A (in press) Anthropogenic activities influence the abandonment of Bearded Vulture Gypaetus barbatus territories in southern Africa.

71
Abstract
Developing an effective conservation strategy for a critically endangered species relies on
identifying the most pressing threats to the species. One approach to elucidate these threats is
to examine which factors are associated with territorial abandonment. The Bearded Vulture has
declined dramatically in southern Africa over the past few decades, with nearly 50% of known
territories being abandoned. In this study we examine the evidence for three hypotheses, that
territorial abandonment was associated with (1) human impact, (2) food availability or (3) climate
change, or a combination of these. Model selection was used to determine the importance of
seven covariates within the home range of an adult pair, an area of 10 km radius (314 km2)
around each territory. Our analyses provided strongest support for the human impact
hypothesis, with abandonment more likely in territories with more power lines and higher
densities of human settlements. Additionally, within Lesotho, there was some support for the
food shortage hypothesis, with territories more likely to have remained occupied where they had
a greater number of feeding sites within close proximity. Our data provided no support for the
hypothesis that climate change may be driving abandonment, with no associations between
abandonment and either altitude or aspect of the nest site. Our results are in accordance with
the main causes of mortality which were found to be poisoning and power line collisions, and
suggest that conservation measures should focus on limiting the development of further human
settlements and power lines within 10 km of occupied territories, applying mitigation measures
to existing power lines and increasing law enforcement and education in areas still occupied by
the species.
Introduction
Unprecedented numbers of animal and plant species face extinction as a result of
anthropogenic actions, climate change and/or invasive alien species (De Salle and Amato 2004,
Heller and Zavaleta 2009). Anthropogenic actions have been responsible for the loss of habitat

72
and the decline in individual populations of many species in the past few decades (Butchart et
al. 2010, Convention on Biological Diversity 2010) and global climate change is predicted to
cause species’ extinctions and distributional shifts (Midgley et al. 2001, Erasmus et al. 2002,
Thomas et al. 2004) as well as range contractions (Huntley and Barnard 2012) in the next few
decades.
The scavenger guild is threatened around the globe (Hoffmann et al. 2010), and avian
scavengers have the highest percentage of extinction-prone species among avian functional
groups (Sekercioglu et al. 2004). Vultures in particular have experienced large population
declines worldwide as a result of loss of suitable breeding and foraging habitat and poisoning
(Green et al. 2004, Oaks et al. 2004, Ogada et al. 2012). The Bearded Vulture Gypaetus
barbatus is also showing declines throughout much of its range (Mingozzi and Estève 1997,
Margalida et al. 2008, Birdlife International 2014). Within southern Africa, where the breeding
population has declined in both numbers (between 32-51%) and range (27%) over the past five
decades (Krüger et al. 2014, Chapter 2), the species was recently up-listed to Critically
Endangered (Krüger in press). The southern African population is restricted to the Maloti-
Drakensberg mountains of South Africa and Lesotho (Brown 1997, Krüger et al. 2014, Chapter
2) where pairs occupy a territory containing one or more nests on high cliffs generally >1,800 m
above sea level (Brown 1988, Heredia 1991).
There is an urgent need to identify the factors responsible for the decline of this
population. To do this we use Caughley’s (1994) declining population paradigm, postulating a
series of plausible hypotheses and then testing which factors associated with these hypotheses
were most closely linked to the abandonment of breeding territories. Similar approaches have
been successful in elucidating important factors constraining other bird populations (e.g. Lewis
et al. 2007, Buchanan et al. 2004, Amar et al. 2010). In this study we explore the evidence for
the following three a priori hypotheses: (1) Territorial abandonment has been caused by
anthropogenic activity, with abandonment occurring in areas with greater exposure to human
impact. (2) Territorial abandonment is the result of food shortages, with territories being

73
abandoned in areas with insufficient food. (3) Territorial abandonment is being driven by climate
change with abandonment occurring at locations which are being most affected by climate
change.
The theoretical basis for hypothesis (1) has considerable support. Global vulture
declines and declines in Bearded Vulture populations have largely been attributed to human
impacts, namely human persecution for traditional medicine, food, ceremonial and other
purposes (Maphisa 1997, Xirouchakis et al. 2001, Mander et al. 2007, Thiollay 2007), indirect
poisoning through poison baiting of carnivores (Brown 1991) and use of veterinary drugs (Green
et al. 2004, Oaks et al. 2004), collisions with power lines (Krüger et al. 2006), or a combination
of these factors (Margalida et al. 2008, Ogada et al. 2012). The historical declines of the
southern African Bearded Vulture population have also been attributed to anthropogenic factors
(Siegfried et al. 1976, Brown 1991, Mundy et al. 1992) but the mechanisms for the more recent
declines are not well understood. The past few decades have seen a large increase in the
human population and associated developments, such as energy infrastructure, within the
region (Kalipeni 1994, Energy Sector Policy of the AfDB group 2012) which may be driving the
abandonment of territories through the continued exposure of the Bearded Vulture population to
unnatural mortality factors. To explore this first hypothesis, we examine whether abandonment
was associated with three factors: (i) Density of human settlements surrounding territories, as
we predict that persecution levels might be highest in areas within relatively close proximity to
human settlements. (ii) Abundance of power lines, because of their documented impact on
other vulture and large raptor populations through collisions and electrocutions (Lehman et al.
2007, Smallie and Virani 2010, Boshoff et al. 2011). (iii) The amount of area surrounding a
territory that is under formal protection, since we would expect that territories in protected areas
would be insulated and shielded to a greater degree from all anthropogenic threats.
The alternative hypothesis (2) for abandonment, decreased food availability, caused by
habitat loss and change in land use, has been previously considered as a potential mechanism
for the wider historical decline of the species in southern Africa (Siegfried et al. 1976, Mundy et

74
al. 1992), although Brown (1991) did not believe it to be an important driving factor for the local
declines witnessed more recently. Food availability is known to affect nest site selection and
breeding success of Bearded Vulture populations in Europe (Donázar et al. 1993,
Gavashelishivili and McGrady 2006, Margalida et al. 2007). The Bearded Vulture is an obligate
scavenger requiring carrion of primarily medium sized ungulates (Hiraldo et al. 1979, Brown
1997). Livestock graze throughout the species’ foraging range and are scavenged from
communal grazing lands in Lesotho or commercial livestock farms in South Africa, whereas wild
ungulates are scavenged predominantly from protected areas. Related to our food shortage
hypothesis, we also investigate whether the presence of more predictable food resources, in the
form of supplementary feeding sites, influences territory occupancy, since many other vulture
populations have been found to be heavily reliant on supplementary feeding (Piper 2005,
Deygout et al. 2009, Cortés-Avizana et al. 2010, Phipps et al. 2013). We use livestock and
ungulate density as a surrogate for the availability of carrion, and predict that if food supply
influences territorial occupancy then it will be positively related to the number of ungulates and
the presence of supplementary feeding sites in the landscape.
Hypothesis (3) relates to climate change because Bearded Vultures live in cold, high-
altitude climates in a continent that is rapidly warming. The Bearded Vulture is considered
particularly vulnerable to the impacts of climate change being a long-lived, territorial species,
occurring at a low density with low reproductive rates within a restricted distribution range
(Simmons et al. 2004). Africa is considered the continent most as risk from climate change
(Hulme 1996, Kruger and Sekele 2012, IPCC 2014) and Lesotho in particular is showing rapid
warming (Mokotjomela et al. 2010). Huntley and Barnard (2012) and Huntley et al. (2012) have
modelled the relationships between species spatial abundance patterns and climate, and
predict a range contraction for the Bearded Vulture. Although climate change will occur across a
broad landscape scale, not all territories would be equally exposed to any negative effects.
Since the species is limited to higher altitudes it is vulnerable because it lacks escape options
(Thomas et al. 2004), and Colahan and Esterhuizen (1997) and Simmons and Jenkins (2007)

75
noted that many Bearded and Cape Vulture Gyps coprotheres nest sites in the lower altitude
regions were abandoned whereas higher altitude sites were still occupied. Nests are built in
potholes/small caves or on ledges with overhangs (Hiraldo et al. 1979) and nest entrances
generally face cooler aspects (e.g. south in southern Africa) which offer the best shelter against
sun, wind and precipitation (Brown 1988, Gavashelishivili and McGrady 2006). Nest site altitude
and aspect will therefore be considered as surrogates for temperature to investigate climate
change which may drive territorial abandonment since nest sites at lower altitudes and those
with entrances facing north and east would experience the highest temperatures.
In this chapter we explore the evidence for these three hypotheses by examining which
covariates (linked to the different hypotheses) are most closely associated with territorial
abandonment. Furthermore, we compare these results with known causes of mortality within the
study area (see Chapter 6) to examine whether any correlations might indicate causality.
Finally, we recommend conservation actions to reduce the impact of the main drivers of
territorial abandonment.
Methods
Study Area
The Bearded Vulture territories located in southern Africa during 2000-2012 (n=190) (see
Krüger et al. 2014, Chapter 2) formed the baseline of this study. Of these, 109 territories were
classified as occupied and 81 were classified as abandoned (Figure 3.1).
The location of the nest site within each territory was plotted using ArcGIS v.10.0 (ESRI,
Redlands, USA). Where a pair had alternative nest sites on the territorial cliff, the location of the
most frequently used site was plotted (see Krüger et al. 2014, Chapter 2). Around each nest site
we created a buffer with a 10 km radius (314 km2) (Figure 3.1). These circles were based on the
average 90% kernel density home range estimates for adults (286 km2, 9.5 km radius; see

76
Chapter 4) and aimed to encapsulate the overall home range of a territorial pair, which was
supported by the circles encompassing 92% (86–96%, n=6) of all GPS fixes obtained from
satellite tagged adults (see Chapter 4). Although many of these buffer circles overlapped, this is
realistic since foraging territories of the species are not exclusive with little intraspecific
competition (Brown 1990, Margalida et al. 2003). Information for our covariates relating to
human impact, food availability and climate change (detailed below) were quantified within
these circles.
Figure 3.1 The location of breeding territories of the Bearded Vulture in southern Africa with occupied territories (●) surrounded by shaded 10 km radius buffers and abandoned (x) territories surrounded by open 10 km radius buffers.
Extraction of Covariates Surrounding Each Territory
Seven covariates representing the three hypotheses were used to describe the environment
within a 10 km radius around each of 190 nest sites (Figure 3.2, Table 3.1). Information on

77
environmental variables was calculated in ArcGIS and the Geospatial Modelling Environment
(GME) (Beyer 2012).
Figure 3.2 Conceptual model of the seven variables representing three hypotheses proposed to influence the abandonment of a territory by Bearded Vulture in southern Africa. For a description of all variables see Table 3.1.
Table 3.1 Variables used to characterize the area within a 10 km radius around the nest site representing the territory of a Bearded Vulture in southern Africa.
1Directorate: Statistics and Economic Analysis of the Department of Agriculture, Forestry and Fisheries.
Variable Measure Data Source
Foo
d A
vaila
bilit
y
Feeding sites Proximity index calculated based on supplementary feeding sites within a 76 km radius from the nest; ∑(1/d2), where d = the distance to the feeding site in km
Endangered Wildlife Trust and Ezemvelo KwaZulu-Natal Wildlife Vulture Restaurant Database, 2013
Ungulate numbers
Total available biomass (number) of ungulates (livestock and wild ungulates)
Lehohla, 2002, Dzimba and Matooane 2005, 2012 Agricultural statistics1, Ezemvelo KwaZulu-Natal Wildlife, South African National Parks, Free State Economic Development, Tourism and Environmental Affairs
Hum
an I
mp
act
Power lines Total distance (km) of 11 kV, 22 kV and 132 kV power lines
South Africa: Eskom, 2012 Lesotho: Lesotho Electricity Corporation, 2013
Settlements Protected areas
Total number of buildings Total area (in km2) under formal protection
South Africa: Eskom, 2013 Lesotho: Maloti Drakensberg Transfrontier Project, 2006 Maloti Drakensberg Transfrontier Project Database
Clim
ate
Cha
nge
Nest altitude Altitude (m) of the nest cliff 1:50,000 topographical maps, GPS readings
Nest aspect
Aspect (four cardinal directions) of the nest entrance
Field survey data

78
Three covariates were used to examine the Human Impact hypothesis: (i) Settlements: This was
the density of human settlements measured as the total number of buildings surrounding each
territory. (ii) Power lines: This was the density of power lines measured as the total length (in
km) of low (11 kV), medium (22 kV) and high voltage (132 kV) power lines surrounding each
territory. (iii) Protected areas: This was the area in km2 under formal protection surrounding
each territory. If human impacts were influencing territorial abandonment we predict that
territories with higher human densities, more infrastructure and less protection, are more likely
to have been abandoned.
Two covariates were used to examine the Food Availability hypothesis: (i) Predictable
food resource (feeding sites): A proximity index was calculated based on the average maximum
distance an adult would fly to a supplementary feeding site (76 km, unpubl. data) and the sum
of reciprocals of the squared distance to each feeding site within a 76 km radius of the nest. We
predict that if food shortage is a driver for abandonment, then those territories with a higher
proximity index, i.e. those with more feeding sites closer to the nest, would be less likely to be
abandoned. (ii) Unpredictable food resource (ungulate numbers): Food availability was
estimated as the total number of ungulates surrounding each territory. These were calculated
based on the type of land use surrounding each nest and the density of ungulates predicted to
be in each habitat type. Numbers of ungulates were inferred from statistics available for
livestock densities per district in Lesotho (Lehohla 2002, Dzimba and Matooane 2005) and per
province in South Africa (2012 Agricultural statistics, Directorate: Statistics and Economic
Analysis of the Department of Agriculture, Forestry and Fisheries), and from game count data
available for wild ungulates in protected areas (Ezemvelo KwaZulu-Natal Wildlife; South African
National Parks; Free State Economic Development, Tourism and Environmental Affairs; unpubl.
data). Ungulate numbers were then calculated based on the proportion of open vegetation
(Global land cover data 2009) and protected areas in each district/province (Ezemvelo
KwaZulu-Natal Wildlife database) for livestock and wild ungulates respectively. To account for
the transhumance of livestock in Lesotho, numbers in the highland regions in Lesotho were

79
halved. A positive relationship between the numbers of ungulates and availability of carcasses
was assumed (i.e. more ungulates implies more carcasses available). If food shortages were
important in driving territorial abandonment we predict that territories with an overall higher
number of ungulates would be less likely to have been abandoned.
Two covariates were used to examine evidence that Climate Change may have
influenced territorial abandonment: (i) Aspect: The direction of the nest entrance recorded as
one of four cardinal directions based on field survey data. If climate change was an important
factor influencing territorial abandonment we predict that nests facing north and east (i.e. with
greatest exposure to the sun) will be most affected and therefore have a higher probability of
being abandoned. (ii) Altitude: The altitude of the nest cliff was determined from field survey
data or estimated from 1:50,000 topographical maps. We predict that if climate change is
influencing abandonment then territories at lower altitudes, where temperatures would be
higher, would be most likely to have been abandoned. Although ideally temperature change per
se would also have been considered as a covariate, detailed climate data were not available at
the nest site scale.
Statistical Analyses
We used Generalized Linear Models (GLiM) (binomial error structure and a logit link function) in
R v.3.0.1 (R Core Team 2013) to explore associations between the occupancy status
(occupied=1, abandoned=0) of each territory and the seven covariates. We ran models for all
breeding territories in southern Africa and then separately for breeding territories in Lesotho
(n=92) and South Africa (n=98).
We used model selection using Akaike’s information criterion (AIC) and multi-model
inference with the MuMIn v.1.9.13 package (Barton 2013) to determine which covariates were
associated with territorial abandonment. We ranked models using their corrected AICc values
and derived the Akaike weight of each model (wi) estimated according to Burnham and
Anderson (2002). Model suitability was assessed using AIC ranks and evidence ratios

80
(Whittingham et al. 2006, Lukacs et al. 2007) where the models with the highest weight and
lowest evidence ratios were more important relative to others. We determined the change in
AICc relative to the optimal model (∆i) and sub-setted all models with ∆i <2. This method
identifies the relative importance of different variables. Where there were competing models, the
parameter estimates of each variable were calculated using model averaging and their 95%
confidence limits obtained.
As a cross-validation of our models we computed the Receiver Operating Characteristic
(ROC) curve using the package pROC v.1.7.2 (Robin et al. 2011). This method assesses the
performance, and summarizes the overall appropriateness of the model (Nemes and Hartel
2010). The area under the curve (AUC) is a good numerical index (Hanley and McNeil 1982)
and was thus used to summarize the ROC curve and to measure the performance of the model.
Models with an AUC value >0.5 have information about the response variable and possess a
certain predictive power. Models with AUC values between 0.5 and 0.7 have low accuracy,
between 0.7 and 0.9 have moderate and over 0.9 have high accuracy (Streiner and Cairney
2007). Therefore the higher the AUC value, the better the fit of the model. Low AUC values,
however, do not necessarily indicate a poor model, rather they suggest that factors other than
the predictor variables may also be influencing the response variable (Nemes and Hartel 2010).
Results
Data on nest site aspect were only available for 71% of the territories (n=89 occupied and n=46
abandoned). An initial analysis with this smaller sample size revealed that aspect did not feature
in any of the top five models (∆i <2) and only featured within the top 14 (Appendix 3.1). Aspect
also had by far the lowest relative importance value (Appendix 3.2). We therefore excluded
aspect from further analyses thereby allowing a more comprehensive analysis using data from
all 190 territories which had complete information for the other covariates.

81
Influence of Environmental Variables on Territorial Abandonment
Our models found strong support for an influence of power lines and settlements on territorial
abandonment. All five of our best models (Table 3.2) included the influence of power lines and
three of the top four models included settlements. Power lines and settlements had the highest
relative importance score (1 and 0.72 respectively) and for power lines the confidence limits of
the model averaged parameter estimate did not overlap zero (Table 3.3) and there was only
very marginal overlap for settlements. Two other terms featured in our five top models, namely
the percentage of area protected within a territory and the proximity to feeding sites. However,
each variable only featured in one model within the best model subsets and their relative
importance values were low (Table 3.3). Furthermore, for one of these terms (protected areas)
the confidence limits of the model average parameter estimates overlapped zero.
Power line density and settlement density were more than twice as high surrounding
abandoned territories compared with occupied ones (Figure 3.3). The relationship between
territory occupancy and both power lines and settlements was negative, with the probability of
occupancy decreasing with an increase in the density of power lines (Figure 3.4a) and
settlements (Figure 3.4b). The model averaged parameter estimates from the best model
subsets predicted a 5.6% increase in the probability of abandonment for each additional 10 km
of power lines and an increase of 3.3% for each additional 500 settlements.
We found no support for altitude or ungulate numbers influencing occupancy with
neither of these variables featuring in any of our top models (Table 3.2) suggesting that these
variables did not differ greatly between abandoned and occupied territories (Figure 3.3).

82
Table 3.2 Results from the top 10 Generalized Linear Models testing for associations between territorial abandonment and altitude, density of human settlements and power lines, percentage of protected areas, feeding site proximity and the number of ungulates within a 10 km radius around the nest site (n=190 nests; 109 occupied and 81 abandoned). Headers for columns are: number of parameters (K), change in AICc relative to the optimal model (∆i), AICc weight (wi) and evidence ratio (ER). The top models (i.e. those with ∆i <2) are shown in bold. Intercept Altitude Ungulate
numbers
Feeding
sites
Protected
areas
Settlements
Power lines K ∆i
wi ER
0.8014 -0.000298 -0.024760 3 0.00* 0.24
0.724 -0.026190 2 0.75 0.16 1.50
0.8382 -0.000728 -0.000299 -0.025090 4 1.97 0.09 2.67
0.8172 -1.860000 -0.000291 -0.024570 4 1.98 0.09 2.67
0.8439 -8.255 e-09
-0.000299 -0.024510 4 2.06 0.09 2.67
0.814 -0.000005 -0.000299 -0.024790 4 2.09 0.08 3.00
0.752 -2.994000 -0.025770 3 2.52 0.07 3.43
0.761 -0.000732 -0.026500 3 2.69 0.06 4.00
0.7499 -5.053 e‐09 -0.026050 3 2.80 0.06 4.00
0.6814 0.000016 -0.026060 3 2.81 0.06 4.00
*The optimal model had an AICc value of 243.

Tabarouof th
Vari
Inter
Pow
Sett
Prot
Fee
Figu(powpercoccuimpawheungu(sett
le 3.3 Modeund the nesthe estimate
able
rcept
wer lines
tlements
tected areas
ding sites
ure 3.3 Comwer lines ancentage of aupied territoacts, highe
ereas there ulates withtlements x 0
el parametet site averagand the rela
Paes
0.
-0
-0
s -0
-1
mparison bnd settlemearea protectories indicar feeding swas little
hin the ter0.1; feeding
er estimatesged across ative import
arameter stimate
787514
.025183
.000297
.000728
.859512
etween thents), feedinted within aating that asite proximit
difference rritory. Valu sites x 10,0
s for each vthe top four
tance of eac
Confide
2.5%
0.0039
-0.0394
-0.0006
-0.0049
-0.1333
e average (mg site proxi
a 10 km radiabandoned ty index anin the altit
ues have 000; altitude
variable mear models, wch term with
ence limits
9
270
433
668
947
396
mean ± SEmity, altitudius around sites had
nd lower petude of nebeen adju
e x 0.1; ung
asured withwith the 95%hin those mo
97.5%
1.182326
-0.010933
0.000074
0.003492
-9.620571
E) density ode, number nest sites oa higher d
ercentage osts sites o
usted for dulate numb
in a 10 km % confidence
odels.
Relatiimpor
1.00
0.72
0.15
0.15
of human imof ungulate
of abandonedensity of hof area proor the numbdisplay purbers x 0.001
83
radius e limits
ve rtance
mpacts es and ed and human otected ber of rposes ).

Figuabanfroman in
Figuabanfroman in
ure 3.4a Thndoned and
m a Binomiancrease in t
ure 3.4b Thndoned and
m a Binomiancrease in t
he relationshd ‘1’ is occual Generalizethe total dist
he relationshd ‘1’ is occual Generalizethe total num
hip betweenupied) and ted Linear Mtance of pow
hip betweenupied) and ted Linear Mmber of buil
n the probabthe density Model. The pwer lines wi
n the probathe density Model. The p
dings within
bility of terrof power linprobability oithin the 10
bility of terrof settlemeprobability on the 10 km
itory occupanes. The linof occupanckm radius a
itory occupants. The linof occupanc radius arou
ancy (wheree is the fitte
cy decreasearound nest
ancy (wheree is the fitte
cy decreaseund nest site
84
e ‘0’ is ed line es with t sites.
e ‘0’ is ed line es with es.

85
Analyzing Lesotho and South African territories separately, our models suggested that
the variables associated with abandonment in each country were similar to those in the
two countries combined. South Africa showed a similar result to the overall models with
the most support for power lines and settlements; power lines were present in all five top
models and settlements in all but one (Table 3.4). Both variables had high relative
importance scores of 1 and 0.84 respectively (Appendix 3.3). In Lesotho there were
many more plausible models (nine models with ∆i <2), however, once again power lines
and settlements received the most support, featuring in seven and six of the top nine
models respectively (Table 3.5); additionally feeding sites also featured in six of the top
nine models. For Lesotho, all three of these factors had similar relative importance
scores (between 0.70 and 0.78) (Appendix 3.4). As before, power line and settlement
density were negatively related to occupancy, whereas feeding sites were positively
related with a higher feeding site proximity index at occupied sites.
Our overall model had an AUC value of 0.69, and the models for South Africa
and Lesotho had AUC values of 0.70 and 0.68 respectively. The models were all of
similar accuracy, and were classified as a poor to moderate fit or of low to medium
accuracy (Streiner and Cairney 2007). The performance of our models suggests that
there are other factors over and above the hypotheses we tested contributing to
territorial abandonment.

86
Table 3.4 Results from the top 10 Generalized Linear Models testing for associations between territorial abandonment and altitude, density of human settlements and power lines, percentage of protected areas, feeding site proximity and the number of ungulates within a 10 km radius of nest sites in South Africa (n=98 nests, 44 occupied and 54 abandoned). Headers for columns are: number of parameters (K), change in AICc relative to the optimal model (∆i), AICc weight (wi) and evidence ratio (ER). The top models (i.e. those with ∆i <2) are shown in bold. Intercept Altitude Ungulate
numbers
Feeding
sites
Protected
areas
Settlements
Power lines K ∆i
wi ER
0.943200 -0.00034 -0.02447 3 0.00* 0.15
1.347000 -0.00356 -0.00040 -0.0287 4 0.60 0.11 1.36
0.521100 1.39 e-07 -0.00042 -0.02926 4 0.62 0.11 1.36
0.762800 -0.0257 2 1.16 0.09 1.67
1.044000 -6.939 -0.00033 -0.02383 4 1.22 0.08 1.88
0.284100 0.000231 -0.00033 -0.02179 4 2.06 0.06 2.50
0.872800 -7.319 -0.02479 3 2.13 0.05 3.00
0.648300 1.23 e-07 -5.256 -0.00041 -0.02815 5 2.31 0.05 3.00
1.374000 -5.054 -0.00313 -0.00039 -0.02773 5 2.32 0.05 3.00
-0.840200 0.000457 1.57 e-07 -0.00041 -0.02446 5 2.44 0.05 3.00
*The optimal model had an AICc value of 124.6

87
Table 3.5 Results from the top 10 Generalized Linear Models testing for associations between territorial abandonment and altitude, density of human settlements and power lines, percentage of protected areas, feeding site proximity and the number of ungulates within a 10 km radius of each nest site in Lesotho (n=92 nests, 37 occupied and 55 abandoned). Headers for columns are: number of parameters (K), change in AICc relative to the optimal model (∆i), AICc weight (wi) and evidence ratio (ER). The top models (i.e. those with ∆i <2) are shown in bold. Intercept Altitude Ungulate
numbers
Feeding
sites
Protected
areas
Settlements
Power lines K ∆i
wi ER
1.027000 91.22 -0.011880 -0.022510 4 0.00* 0.12
0.729100 126.50 -0.012400 3 0.45 0.09 1.33
1.377000 -0.011960 -0.028940 3 0.71 0.08 1.50
0.313100 106.70 -0.022330 3 0.79 0.08 1.50
2.654000 -0.000557 86.71 -0.014910 -0.024290 5 1.24 0.06 2.00
3.455000 -0.000714 -0.016160 -0.030690 4 1.33 0.06 2.00
-0.038890 147.60 2 1.74 0.05 2.40
0.702400 -0.02893 2 1.76 0.05 2.40
0.966200 85.06 0.009202 -0.011020 -0.02333 5 1.98 0.04 3.00
1.870000 0.000401 126.50 -0.01458 4 2.05 0.04 3.00
*The optimal model had an AICc value of 120.7
88
Discussion
Our analyses represent an attempt to empirically assess the evidence for drivers of territorial
abandonment of the Bearded Vulture in southern Africa by using variables related to three
different hypotheses. Our models provide strongest support for the hypothesis that
anthropogenic activities may be driving territorial abandonment, with a small degree of support
for the hypothesis that food shortages were important and no support at all for the hypothesis
that abandonment has been driven by climate change. The performance of our overall model
was similar to the accuracy of the models at a home range scale for Egyptian Vultures
Neophron percnopterus (0.71-0.74) fitted by Mateo-Tomás and Olea (2010).
Across all analyses there was considerable support for an association between nest
abandonment and (i) power line density and (ii) human settlements; territories that were
abandoned had over twice the density of power lines and human settlements surrounding them
than territories that remained occupied. The fact that many of the supported models included
both these terms suggests that the association between these variables was not simply due to a
correlation between these variables, but that both variables were independently associated with
abandonment. These patterns were also present from the country-specific analyses, with
support for these variables present in both the South African and the Lesotho analyses. This
result further suggests that these associations were not simply the result of an association in
only one location, but appeared to be a more general pattern occurring across regions.
Although our results are correlational, support for our anthropogenic activity hypothesis
also comes from other lines of evidence. For example, causes of mortality of Bearded Vulture
carcasses collected in the study area over a similar time period indicated that death was almost
entirely as a result of anthropogenic factors with more than half being attributed to indirect and
accidental poisoning and persecution, and almost a quarter to power line collisions (see
Chapter 6). Similarly non-natural mortalities attributed to illegal poisoning were the main
mortality factors in other Bearded Vulture populations (Margalida et al. 2008) and other large

89
raptor populations (Whitfield et al. 2004, Smart et al. 2010, Virani et al. 2010), and collisions
with power lines are known to threaten other vulture species in Africa (Smallie and Virani 2010,
Boshoff et al. 2011). Impacts related to human disturbance were also found to limit the
distribution patterns of Bearded Vulture and other large raptor populations in terms of their
breeding ranges and densities (Brown 1988, Donázar et al. 2002, Margalida et al. 2007) and
their foraging areas (Herremans and Herremans-Tonnoyer 2000, Bautista et al. 2004,
Gavashelishivili and McGrady 2006).
There was only very limited support for our hypothesis that food shortages could have
driven territorial abandonment. In mountainous regions with extensive stock rearing, the
livestock death rate is high due to the high incidents of accidents, theft, predation and poor
veterinary care (Newton 1979). This is particularly true for the communal rangelands in Lesotho,
therefore food shortages would not be expected in this country. Food shortages would also not
be expected in South Africa because of a number of regularly provisioned supplementary
feeding sites in this country. In Lesotho our country-specific model suggested that feeding sites
may play an important role in maintaining territorial occupancy. However, this result might be
questionable, since there are only two feeding sites in Lesotho and these are provisioned on an
irregular basis. Thus, our findings may simply be a result of the location of occupied territories in
the mountainous areas close to the South African border where birds have better access to
feeding sites. Abandoned territories appear more frequent in western Lesotho which is more
developed as a result of the accessible terrain and therefore may experience higher human
impacts, but is further away from the feeding sites in South Africa. Although territories in
Lesotho could benefit from the establishment of supplementary feeding sites which are regularly
provisioned, this action does not seem to be a priority considering our overall results which
suggest that territorial abandonment is unlikely to be driven by food shortages. These results do
not, however, demonstrate whether food shortages are influencing productivity or recruitment
through non-adult survival and these aspects still merit further research on their role in the
decline of the population.

90
Our models provide no support for the previously proposed hypothesis that territorial
abandonment might be driven by climate change– specifically increases in temperatures
(Colahan and Esterhuizen 1997, Simmons and Jenkins 2007). Territories that were at lower
altitudes and therefore more likely to experience higher temperatures were not significantly
more likely to be abandoned, nor were territories with hotter nest site aspects (i.e. sites facing
east and north). Therefore these results do not suggest that global warming has directly lead to
territorial abandonment, although this does not necessarily mean that these changes aren’t
influencing other aspects of the species’ demography such as productivity or survival, and
timing of breeding.
Information provided in this chapter raises the question of whether the continued decline
of the species is in response to unnatural mortality factors as suggested by our models, or low
breeding success/recruitment or a combination of these. Several studies have found human
activities to influence breeding success (Donázar et al. 1993, Margalida et al. 2003) and
breeding pairs are known to prefer more isolated areas with low levels of human activity (Brown
1988). Brown (1990) found the breeding success of this population to be high (0.89 young per
pair per year) but current evidence (see Chapter 6) suggests that productivity may have
decreased by about 40% since Brown’s (1990) study. We recommend that further studies focus
on establishing whether breeding success and low recruitment are limiting factors for this
population. With the expansion of human activities into core breeding areas, we can expect
lowered breeding success and ultimately nest abandonment. In addition, there may be a lack of
adaptation to the conditions found in the periphery of the range, as shown for harriers (García
and Arroyo 2001), which may affect breeding success.
With few non-breeding adults in the population (Krüger et al. 2014, Chapter 2), a small
proportion of sub-adults that face a high risk of exposure to human impacts (see Chapter 4),
and high mortality rates (see Chapter 6), vacant territories are unlikely to become occupied. As
a result, the population may be shrinking back to their preferred habitat with sub-optimal
territories being abandoned as suggested in Chapter 2. Results from Chapter 2 also show that
91
territories in the periphery of the range were more likely to be abandoned. We intentionally did
not include territory location (i.e. periphery score) as a covariate in our models because we
expected this variable would be correlated with many of our covariates and we were potentially
interested in the mechanism involved and not merely the pattern. However, in a post-hoc
analysis we found that the territory location variable was not amongst the top models (those with
∆i <2). This suggests therefore that our relationships were not simply the result of a shrinkage of
the population back to the core of the range and actually further strengthens our human impact
hypothesis.
Based on the identified threats and mechanisms of abandonment, we recommend
conservation management to focus on actions that will limit increased human densities and
associated developments and influence the attitudes of people living within the territories of
breeding pairs. We recommend that mitigation of existing power lines, stricter scrutiny of
development proposals and proactive engagement with developers to influence the placement
of structures is essential within the home range of a territorial pair.
For management to be effective however, both the breeding range (as discussed here)
and foraging range of the population must be taken into account (Donázar et al. 1993, Carrete
and Donázar 2005). We recommend that the potential threats posed by power lines and human
settlements identified in this study, be investigated within the foraging range of non-adults to
ensure a more holistic approach to the management of the species, since non-adults form a
large proportion of the population (Newton 1979, Brown et al. 1982) and conservation measures
designed to protect breeding birds only may not be sufficient to safeguard the population as a
whole (Penteriani et al. 2005, Gonzalez et al. 2006).
Our use of multiple models to investigate a number of alternate hypotheses has provided
insight into the mechanisms of decline and those variables affecting territory occupancy.
Investigating these mechanisms at a regional level also provides the necessary information to
target actions appropriately. Our study approach and findings are likely to be of considerable

92
interest to those studying vulture declines, which is increasingly being recognised as one of the
most pressing issues in avian conservation globally and particularly in Africa.
Acknowledgements
Nick Liebenberg, University of Cape Town, is thanked for his assistance in quantifying the
environmental variables within the 190 territories in ArcGIS. The Lesotho Electricity Corporation
provided power line distribution data and Eskom provided power line and settlement data.
Bimall Naidoo, Ezemvelo KwaZulu-Natal Wildlife, is thanked for her assistance in obtaining the
Eskom data.
References
Amar A, Redpath S, Sim I and Buchanan G (2010) Spatial and temporal associations between
recovering populations of common raven Corvus corax and British upland wader
populations. J Appl Ecol 47: 253-262.
Barton K (2013) MuMIn: Multi-model inference R package version 1.9.13. http://CRANR-
projectorg/package=MuMIn.
Bautista LM, García JT, Calmaestra MG, Palacín C, Martin CA, Morales MB, Bonal R and
Viñuela J (2004) Effect of weekend road traffic on the use of space by raptors. Conserv
Biol 18: 726-732.
Beyer HL (2012) Geospatial Modelling Environment (Version 0720) (software). URL:
http://wwwspatialecologycom/gme.
BirdLife International (2014) IUCN Red List for birds. Downloaded from http://www.birdlife.org
on 05/08/2014.

93
Boshoff A, Minnie JC, Tambling CJ and Michael MD (2011) The impact of power line-related
mortality on the Cape Vulture Gyps coprotheres in a part of its range, with an emphasis
on electrocution. Bird Cons Int 21:311-327.
Brown CJ (1988) A study of the Bearded Vulture Gypaetus barbatus in southern Africa.
Dissertation, University of Natal, Pietermaritzburg.
Brown CJ (1990) Breeding biology of the Bearded Vulture in southern Africa, Parts I – III.
Ostrich 61: 24-49
Brown CJ (1991) An investigation into the decline of the Bearded Vulture Gypaetus barbatus in
southern Africa. Biol Conserv 57: 315-337.
Brown CJ (1997) Population dynamics of the Bearded Vulture Gypaetus barbatus in southern
Africa. Afr J Ecol 35: 53-63.
Brown LH, Urban E and Newman K (1982) Birds of Africa Vol 1. Academic Press, Orlando,
Florida.
Buchanan GM, Pearce-Higgins JW, Wotton SR, Grant MC and Whitfield DP (2003) Correlates
of the change in Ring Ouzel Turdus torquatus abundance in Scotland from 1988–91 to
1999. Bird Study 50: 97–105.
Burnham KP and Anderson DR (2002) Model selection and multimodel inference: a practical
information-theoretic approach, 2nd edn. Springer, New York.
Butchart SHM et al. (2010) Global Biodiversity: Indicators of Recent Declines. Science 328:
1164.
Carrete M and Donázar JA (2005) Application of central-place foraging theory shows the
importance of Mediterranean dehesas for the conservation of the Cinereous Vulture,
Aegypius monachus. Biol Conserv 126: 582–590.

94
Caughley G (1994) Directions in Conservation Biology. J Anim Ecol 63: 15–244.
doi:102307/5542.
Colahan BD and Esterhuizen JR (1997) The status and conservation of vultures in the Free
State Province, South Africa. In: Boshoff AF et al. (editors). Vultures in the 21st Century:
Proceedings of a Workshop on Vulture Research and Conservation in Southern Africa.
Vulture Study Group, Johannesburg, pp. 46-49.
Convention on Biological Diversity, Montréal (2010) Secretariat of the Convention on Biological
Diversity 2010. Global Biodiversity Outlook 3.
Cortez-Avazida A, Carrete M and Donázar JA (2010) Managing supplementary feeding for
avian scavengers: guidelines for optimal design using ecological criteria. Biol Conserv
143: 1707-1715.
DeSalle R and Amato G (2004) The expansion of conservation genetics. Nat Rev Genet 5:
702–712.
Deygout C, Gault A, Sarrazin F and Bessa-Gomes C (2009) Modelling the impact of feeding
stations on vulture scavenging service efficiency. Ecol Modell 220: 1826-1835.
Donázar JA, Hiraldo F and Bustamante J (1993) Factors Influencing Nest Site Selection,
Breeding Density and Breeding Success in the Bearded Vulture (Gypaetus barbatus). J
Appl Ecol 30: 504-514.
Donázar JA, Blanco G, Hiraldo F, Soto-Largo E and Oria J (2002) Effects of forestry and other
land use practices on the conservation of Cinerous Vultures. Ecol Appl 12: 1145-1456.
Dzimba J and Matooane M (2005) Stock theft as a threat to human security in Lesotho. In: Kariri
JN and Mistry D (editors) Stock Theft and Human Security A Case Study of Lesotho.
Lesotho Institute of Public Administration and Management (LIPAM), unpubl report, 89 pp.

95
Energy Sector Policy of the AfDB Group (2012) African Development Bank Operational
Resources and Policies Department (ORPC).
Erasmus BFN, van Jaarsveld A, Chown SL, Kshatriya M and Wessels KJ (2002) Vulnerability of
South Africa animal taxa to climate change. Glob Change Biol 8:679–693.
García JT and Arroyo BE (2001) Effect of abiotic factors on reproduction in the centre and
periphery of breeding ranges: a comparative analysis in sympatric harriers. Ecography
24: 393-402.
Gavashelishivili A and McGrady MJ (2006) Breeding site selection by bearded vulture
(Gypaetus barbatus) and Eurasian Griffon (Gyps fulvus) in the Caucasus. Anim Conserv
9: 159-170.
González LM, Arroyo BE, Margalida A, Sanchez R and Oria J (2006) Effect of human activities
on the behaviour of breeding Spanish Imperial Eagles (Aquila adalbertz): management
implications for the conservation of a threatened species. Anim Conserv 9: 85-93.
Green RE, Newton I, Schultz S, Cunningham AA, Gilbert M, Pain DJ and Prakash V (2004)
Diclofenac poisoning as a cause of vulture population declines across the Indian
subcontinent. J Appl Ecol 41: 793–800.
Hanley JA and McNeil BJ (1982) The meaning and use of the area under a receiver operating
characteristic (ROC) curve. Radiology 142: 29-36.
Heller NE and Zavaleta ES (2009) Biodiversity management in the face of climate change: a
review of 22 years of recommendations. Biol Conserv 142: 14–32.
Heredia R (1991) Chapter 2 Biologia de la Reproduccion. In: Heredia R, Heredia B (editors) El
Quebrantahuesos (Gypaetus barbatus) en los Pirineos. ICONA, Madrid.
Herremans M and Herremans-Tonnoyer D (2000) Land use and the conservation status of
raptors in Botswana. Biol Conserv 94: 31–41.
96
Hiraldo F, Delibes M and Calderon J (1979) El Quebrantahuesos: sistematica, taxonomia,
biologia, distrubucion y proteccion. Monografias 22, ICONA, Madrid.
Hoffmann M et al. (2010) The impact of conservation on the status of the world’s vertebrates.
Science 330: 1503–1509.
Hulme M (1996) Recent climatic change in the world's drylands. Geophys Res Lett 23: 61-64.
Huntley B and Barnard P (2012) Potential impacts of climatic change on southern African birds
of fynbos and grassland biodiversity hotspots. Divers Distrib 18(8): 769-781.
Huntley B, Altwegg R, Barnard P, Collingham YC and Hole DG (2012) Modelling relationships
between species spatial abundance patterns and climate. Glob Ecol Biogeogr 21(6):
668-681.
IPCC (2014) Climate Change 2014: Impacts, Adaptation, and Vulnerability. Part B: Regional
Aspects. Contribution of Working Group II to the Fifth Assessment Report of the
Intergovernmental Panel on Climate Change. Barros et al. (editors). Cambridge
University Press, Cambridge, United Kingdom and New York.
Kalipeni E (editor) (1994) Population Growth and Environmental Degradation in Africa, 236 pp.
Kruger AC and Sekele SS (2012) Trends in extreme temperature indices in South Africa: 1962–
2009. Int J Climatol 33: 661-673. doi:10.1002/joc.3455.
Krüger S (in press) Bearded Vulture. In Taylor MR (editor) The Eskom Red Data Book of Birds
of South Africa, Lesotho and Swaziland. BirdLife South Africa, Johannesburg.
Krüger S, Piper S, Rushworth I, Botha A, Daly B, Allan D, Jenkins A, Burden D and Friedmann
Y (editors) (2006) Bearded Vulture (Gypaetus barbatus meridionalis) Population and
Habitat Viability Assessment Workshop Report. Conservation Breeding Specialist Group
(SSC/IUCN)/CBSG Southern Africa, Endangered Wildlife Trust, Johannesburg.

97
Krüger SC, Allan DG, Jenkins AR and Amar A (2014) Trends in territory occupancy, distribution
and density of the Bearded Vulture Gypaetus barbatus meridionalis in southern Africa.
Bird Cons Int 24: 162-177. doi:101017/S0959270913000440.
Lehman RN, Kennedy PL and Savidge JA (2007) The state of the art in raptor electrocution
research: a global review. Biol Conserv 126: 159-174.
Lehohla P (2002) Report on the survey of large and small scale agriculture Statistics, South
Africa. Pretoria, South Africa, unpubl report, 115 pp.
Lewis AJG, Amar A, Cordi-Piec D and Thewlis RMT (2007) Factors influencing Willow Tit
Poecile montanus site occupancy: a comparison of abandoned and occupied woods. Ibis
149: 205-213.
Lukacs PM, Thompson WL, Kendall WL, Gould WR, Doherty PF, Nurnham KP and Anderson,
DR (2007) Concerns regarding a call for pluralism of information theory and hypothesis
testing. J Appl Ecol 44: 456–460.
Maphisa DH (1997) Vultures in Lesotho: past, present and future In: Boshoff AF et al. (editors)
Vultures in the 21st Century: Proceedings of a Workshop on Vulture Research and
Conservation in Southern Africa. Vulture Study Group, Johannesburg, South Africa, pp.
93-96.
Mander M, Diederichs N, Ntuli L, Khulile M, Williams V and McKean S (2007) Survey of the
Trade in Vultures for the Traditional Health Industry in South Africa. Futureworks, unpubl
report, 30pp.
Margalida A, Canut J and García D (2003) Territory change and Nest-site switching in the
Bearded Vulture (Gypaetus barbatus). J Raptor Res 37(4): 333-337.

98
Margalida A, García D and Cortés–Avizanda A (2007) Factors influencing the breeding density
of Bearded Vultures, Egyptian Vultures and Eurasian Griffon Vultures in Catalonia (NE
Spain): management implications. Anim Biodiv Conserv 30(2): 189–200.
Margalida A, Heredia R, Razin M and Hernandez M (2008) Sources of variation in mortality of
the Bearded Vulture Gypaetus barbatus in Europe. Bird Cons Int 18: 1-10.
Mateo-Tomás P and Olea PP (2010) Diagnosing the causes of territory abandonment by the
Endangered Egyptian vulture Neophron percnopterus: the importance of traditional
pastoralism and regional conservation. Oryx 44: 424–433.
Midgley G, Rutherford M and Bond W (2001) The heat is on: impacts of climate change on plant
diversity in South Africa. National Botanic Institute, Cape Town, South Africa.
Mingozzi T and Estève R (1997) Analysis of a historical extirpation of the Bearded vulture
Gypaetus barbatus (L) in the Western Alps (France-Italy): former distribution and causes
of extirpation. Biol Conserv 79: 155-171.
Mokotjomela T, Schwaibold U and Pillay N (2010) Population surveys of the ice rat Otomys
sloggetti robertsi in the Lesotho Drakensberg. Afr Zool 45:225–232.
Mundy P, Butchart D, Ledger J and Piper S (1992) The Vultures of Africa. Russel Friedman
Books CC, Johannesburg, South Africa.
Nemes S and Hartel T (2010) Summary measures for binary classification systems in animal
ecology. North West J Zool 6: 323-330.
Newton I (1979) Population Ecology of Raptors. T and AD Poyser, Berkhamsted.
Oaks et al. (2004) Diclofenac residues as the cause of vulture population decline in Pakistan.
Nature 427: 630-633.

99
Ogada DL, Keesing F and Virani MZ (2012) Dropping dead: causes and consequences of
vulture population declines worldwide. Ann NY Acad Sci 1249: 57-71.
Penteriani V, Otalora F, Sergio F and Ferrer M (2005) Environmental stochasticity in dispersal
areas can explain the 'mysterious' disappearance of breeding populations. Proc R Soc B
272: 1265-1269. doi:101098/rspb20053075.
Phipps WL, Willis SG, Wolter K and Naidoo V (2013) Foraging Ranges of Immature African
White-Backed Vultures (Gyps africanus) and Their Use of Protected Areas in Southern
Africa. PLoS ONE 8: e52813. doi:101371/journalpone0052813.
Piper SE (2005) Supplementary feeding programmes: how necessary are they for the
maintenance of numerous and healthy vulture populations? In: Houston DC and Piper
SE (editors) Conservation and Management of Vulture Populations. Thessaloniki,
Greece, pp. 41-50.
R Core Team (2013) R: A language and environment for statistical computing. R Foundation for
Statistical Computing, Vienna, Austria URL http://www.R-project.org.
Robin X, Turck N, Hainard A, Tiberti N, Lisacek F, Sanchez J-C and Müller M (2011) pROC: an
open-source package for R and S+ to analyze and compare ROC curves. BMC
Bioinform 12: 77. doi:101186/1471-2105-12-77 http://www.biomedcentral.com/1471-
2105/12/77.
Sekercioglu CH, Daily GC and Ehrlich PR (2004) Ecosystem consequences of bird declines.
Proc Nat Acad Sci 101: 18042–18047.
Siegfried WR, Frost PGH, Cooper J and Kemp AC (1976) South African Red Data Book- Aves.
South African National Science Programme Report No 7.
Simmons RE, Barnard P, Dean WRJ, Midgley GF, Thuiller W and Hughes G (2004) Climate
change and birds: perspectives and prospect from southern Africa. Ostrich 75: 295-308.

100
Simmons, RE and Jenkins AR (2007) Is climate change influencing the decline of Cape and
Bearded Vultures in southern Africa? Vulture News 56: 41-51.
Smallie J and Virani MZ (2010) A preliminary assessment of the potential risks from electrical
infrastructure to large birds in Kenya. Scopus 30: 32–39.
Smart J, Amar A, Sim IMW, Etheridge B, Cameron D and Christie G (2010) Illegal killing slows
population recovery of a re-introduced raptor of high conservation concern – The red kite
Milvus milvus. Biol Conserv 143: 1278–1286.
Streiner DL and Cairney J (2007): What’s under the ROC? An introduction to Receiver
Operating Characteristic Curves. Can J Psychiatr 52:121-128
Thiollay J-M (2007) The decline of raptors in west Africa: long-term assessment and the role of
protected areas. Ibis 148:240–254.
Thomas CD, Cameron, A, Green RE, Bakkenes M, Beaumont LJ, Collingham YC, Erasmus
BFM, de Siqueira MF, Grainger A, Hannah L, Hughes L, Huntley B, Midgley, GF and
Williams SE (2004) Extinction risk from climate change. Nature 427: 145-148.
Virani MZ, Kendall C, Njoroge P and Thomsett S (2010) Major declines in the abundance of
vultures and other scavenging raptors in and around the Masai Mara ecosystem, Kenya.
Biol Conserv 144: 746–752.
Whitfield DP, Fielding AH, Mcleod DRA and Haworth PF (2004) Modelling the effects of
persecution on the population dynamics of golden eagles in Scotland. Biol Conserv 119:
319–333.
Whittingham MJ, Stephens PA, Bradbury RB and Freckleton RP (2006) Why do we still use
stepwise modelling in ecology and behaviour? J Anim Ecol 75: 1182-1189.
Xirouchakis S, Sakoulis A and Andreou G (2001) The decline of the Bearded Vulture Gypaetus
barbatus in Greece. Ardeola 48(2): 183-190.
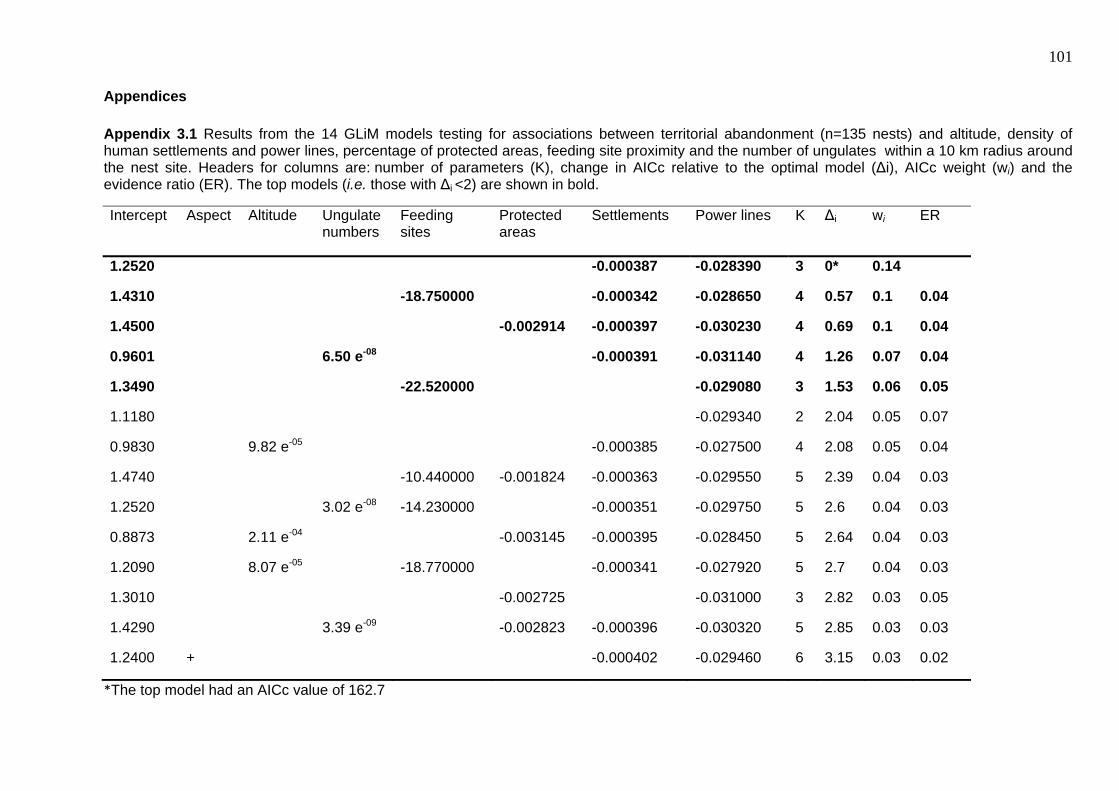
101
Appendices
Appendix 3.1 Results from the 14 GLiM models testing for associations between territorial abandonment (n=135 nests) and altitude, density of human settlements and power lines, percentage of protected areas, feeding site proximity and the number of ungulates within a 10 km radius around the nest site. Headers for columns are: number of parameters (K), change in AICc relative to the optimal model (∆i), AICc weight (wi) and the evidence ratio (ER). The top models (i.e. those with ∆i <2) are shown in bold.
Intercept Aspect Altitude Ungulate numbers
Feeding sites
Protected areas
Settlements Power lines K ∆i wi ER
1.2520 -0.000387 -0.028390 3 0* 0.14
1.4310 -18.750000 -0.000342 -0.028650 4 0.57 0.1 0.04
1.4500 -0.002914 -0.000397 -0.030230 4 0.69 0.1 0.04
0.9601 6.50 e-08 -0.000391 -0.031140 4 1.26 0.07 0.04
1.3490 -22.520000 -0.029080 3 1.53 0.06 0.05
1.1180 -0.029340 2 2.04 0.05 0.07
0.9830 9.82 e-05 -0.000385 -0.027500 4 2.08 0.05 0.04
1.4740 -10.440000 -0.001824 -0.000363 -0.029550 5 2.39 0.04 0.03
1.2520 3.02 e-08 -14.230000 -0.000351 -0.029750 5 2.6 0.04 0.03
0.8873 2.11 e-04 -0.003145 -0.000395 -0.028450 5 2.64 0.04 0.03
1.2090 8.07 e-05 -18.770000 -0.000341 -0.027920 5 2.7 0.04 0.03
1.3010 -0.002725 -0.031000 3 2.82 0.03 0.05
1.4290 3.39 e-09 -0.002823 -0.000396 -0.030320 5 2.85 0.03 0.03
1.2400 + -0.000402 -0.029460 6 3.15 0.03 0.02
*The top model had an AICc value of 162.7

102
Appendix 3.2 Model parameter estimates for each variable measured within a 10 km radius around the nest averaged across the top nine models, with the 95% confidence limits of the estimate and the relative importance of each term within those models.
Variable Parameter estimate
Confidence limits Relative importance 2.5% 97.5%
Intercept 1.238000 -0.094608 2.570009
Power lines -0.029380 -0.049071 -0.009692 1.00
Settlements -0.000379 -0.000782 0.000025 0.76
Feeding sites -18.600000 -60.416470 23.222620 0.38
Protected areas -0.002658 -0.008307 0.002991 0.29
Ungulate numbers 0.000000 0.000000 0.000000 0.22
Altitude 0.000132 -0.000762 0.001025 0.17
Aspect N 0.018070 -1.172902 1.209051 0.08
Aspect S 0.092600 -1.066834 1.252040 0.08
Aspect W -2.049000 -4.617562 0.519971 0.08
Appendix 3.3 Model parameter estimates for each variable measured within a 10 km radius around each nest in South Africa (n=98) averaged across the top five models, with the 95% confidence limits of the estimate and the relative importance of each term within those models.
Variable Parameter estimate
Confidence limits Relative importance
2.5% 97.5%
Intercept 0.927500 0.021339 1.833587
Power lines -0.026420 -0.045174 -0.007673 1.00
Settlements -0.000372 -0.000786 0.000043 0.84
Protected areas -0.003561 -0.009271 0.002148 0.21
Ungulate numbers 0.00000014 -0.000000086 0.00000037 0.20
Feeding sites -6.939000 -0.232973 9.418740 0.15

103
Appendix 3.4 Model parameter estimates for each variable measured within a 10 km radius around each nest site in Lesotho (n=92) averaged across the top six models, with the 95% confidence limits of the estimate and the relative importance of each term within those models.
Variable Parameter estimate
Confidence limits Relative importance
2.5% 97.5%
Intercept 1.21900 -1.42006 3.85849
Power lines -0.02548 -0.05552 0.00456 0.78
Settlements -0.01289 -0.02748 0.00169 0.72
Feeding sites 106.40000 -53.31684 266.02830 0.70
Altitude -0.00063 -0.00182 0.00055 0.19
Protected areas 0.00920 -0.02934 0.04774 0.07

104

105
Chapter 4: Differential range use and anthropogenic risk
exposure between age classes of southern African
Bearded Vultures Gypaetus barbatus
Photo 4 Adult Bearded Vulture with a solar-powered GPS satellite transmitter

106
A modified form of this chapter has been accepted by PLoS ONE and is currently in press:
Krüger SC, Reid T and Amar A (in press) Differential range use between age classes of southern African Bearded Vultures Gypaetus barbatus.
107
Abstract
Bearded Vulture Gypaetus barbatus movements were investigated in southern Africa to
determine whether an individual’s age, sex or breeding status influenced its exposure to
perceived benefits (e.g. supplementary feeding sites or protected areas) or anthropogenic
risks (e.g. power lines, settlements or roads). Data from satellite transmitters fitted to 18
individuals of four age classes were used to determine range size and use. Because of the
nature of the species’ movements, these data could be used to determine the overall
foraging range of the population, which was estimated to be 51,767 km2. Although juvenile,
immature and sub-adult birds used different parts of the overall range, their combined
foraging range was 65% (33,636 km2) of the overall range. Average adult home ranges (286
km2) were approximately 1% the size of the average foraging ranges of non-adults (10,540
km2–25,985 km2), with those of breeding adults being even smaller (95 km2). Home ranges
of breeding adults did not vary in size between seasons but adults utilized their home range
more intensively whilst breeding, moving greater distances during the incubation and chick
hatching period. Range size and use increased as non-adults aged. Immatures and sub-
adults had larger range sizes during winter, but range use of non-adults did not vary
seasonally. Range size and use did not differ between the sexes in any of the age classes.
Analyses of anthropogenic influences suggest that non-adults aged between 4-6 years face
the greatest exposure to risk factors as a result of their larger range size and use, but also
benefit by having better access to more feeding sites. Information on home range size and
use and our approach to assessing age specific impacts of anthropogenic influences should
enable more targeted management planning, education and conservation action in specific
areas within the species’ range.
Introduction
As human populations increase and service provision expands into previously undeveloped
areas, many species which were previously shielded from anthropogenic influences are
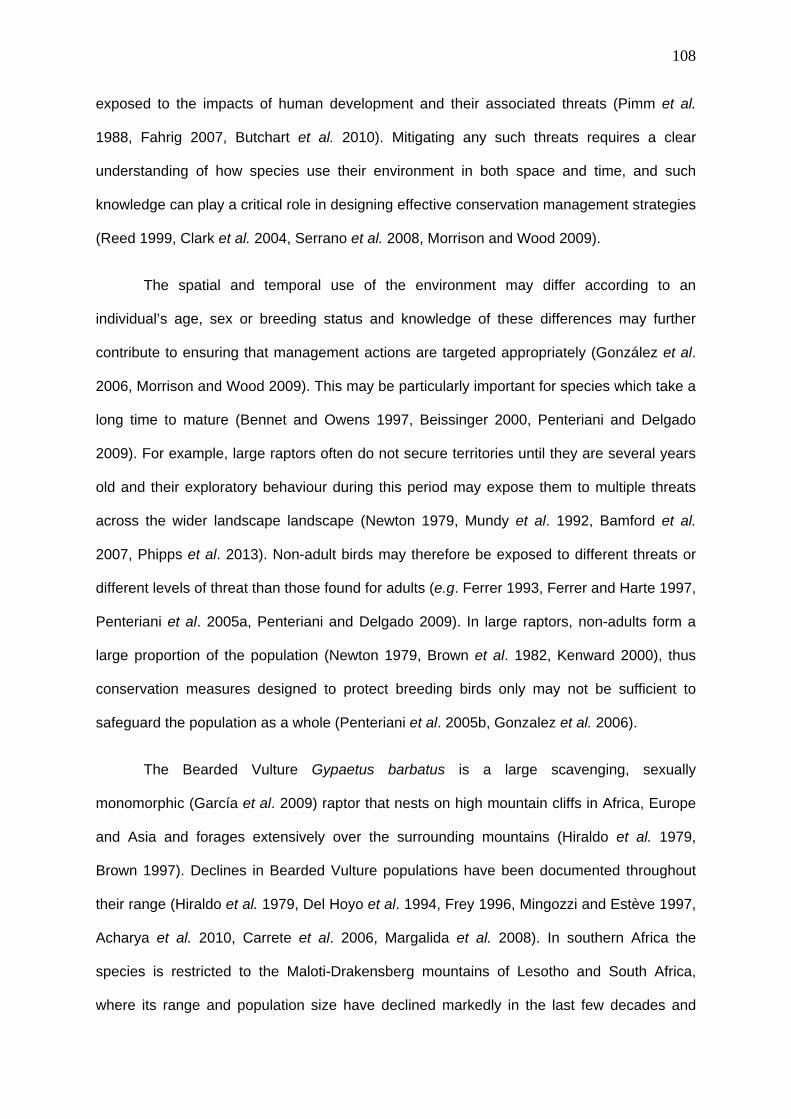
108
exposed to the impacts of human development and their associated threats (Pimm et al.
1988, Fahrig 2007, Butchart et al. 2010). Mitigating any such threats requires a clear
understanding of how species use their environment in both space and time, and such
knowledge can play a critical role in designing effective conservation management strategies
(Reed 1999, Clark et al. 2004, Serrano et al. 2008, Morrison and Wood 2009).
The spatial and temporal use of the environment may differ according to an
individual’s age, sex or breeding status and knowledge of these differences may further
contribute to ensuring that management actions are targeted appropriately (González et al.
2006, Morrison and Wood 2009). This may be particularly important for species which take a
long time to mature (Bennet and Owens 1997, Beissinger 2000, Penteriani and Delgado
2009). For example, large raptors often do not secure territories until they are several years
old and their exploratory behaviour during this period may expose them to multiple threats
across the wider landscape landscape (Newton 1979, Mundy et al. 1992, Bamford et al.
2007, Phipps et al. 2013). Non-adult birds may therefore be exposed to different threats or
different levels of threat than those found for adults (e.g. Ferrer 1993, Ferrer and Harte 1997,
Penteriani et al. 2005a, Penteriani and Delgado 2009). In large raptors, non-adults form a
large proportion of the population (Newton 1979, Brown et al. 1982, Kenward 2000), thus
conservation measures designed to protect breeding birds only may not be sufficient to
safeguard the population as a whole (Penteriani et al. 2005b, Gonzalez et al. 2006).
The Bearded Vulture Gypaetus barbatus is a large scavenging, sexually
monomorphic (García et al. 2009) raptor that nests on high mountain cliffs in Africa, Europe
and Asia and forages extensively over the surrounding mountains (Hiraldo et al. 1979,
Brown 1997). Declines in Bearded Vulture populations have been documented throughout
their range (Hiraldo et al. 1979, Del Hoyo et al. 1994, Frey 1996, Mingozzi and Estève 1997,
Acharya et al. 2010, Carrete et al. 2006, Margalida et al. 2008). In southern Africa the
species is restricted to the Maloti-Drakensberg mountains of Lesotho and South Africa,
where its range and population size have declined markedly in the last few decades and

109
there are now approximately 109 currently occupied territories territories (Brown 1991,
Krüger et al. 2014, Chapter 2). This population is classified regionally as Critically
Endangered as a result of these declines and the on-going threats faced by the population
throughout its foraging range (Krüger in press).
A South African Biodiversity Management Plan, ratified by government, has been
developed for the species (Krüger 2013). The primary objective of this plan is to halt the
population decline in the short term. For the successful implementation of this plan, it is
recognized that improved knowledge is required on how the species uses its environment.
The size of the species’ range in southern Africa and the political boundaries it encompasses
make the planning, resourcing, coordinating, implementing and monitoring of conservation
actions challenging. Therefore, detailed information on the spatial and temporal movements
of Bearded Vulture, and knowledge of the risks/benefits associated with human activities
within their range, will enable the prioritization of specific age classes or areas for focused
action and the recommendation of suitable mitigatory measures for proposed developments.
The persistence of a threatened species relies on its breeding population and the
protection of their breeding territories (Newton 1979, Bell and Merton 2002). In order to
prioritize the breeding segment of the population for protection, information on breeding
territory size is required. Previous studies have shown that breeding Bearded Vultures
defend a territory around their nest site and that the size of their foraging range varies
throughout the year (Brown 1988, Margalida and Bertran 2000, Bertran and Margalida 2002,
Margalida and Bertran 2005). However, the core home range size for the southern African
population remains unknown. Non-breeding birds on the other hand do not defend a territory
and lead a nomadic lifestyle prior to breeding (Donázar 1993, Bertran and Margalida 2002,
Urios et al. 2010). They are thought to inhabit more marginal areas within the species’ range
and therefore, in theory, may be exposed to a higher number and a wider range of threats
which may negatively affect their survival prospects (Brown 1988).

110
Information on the ranging behaviour of Bearded Vulture in southern Africa is limited
to five individuals tracked using conventional VHF radio-telemetry in the 1980s (Brown 1988)
and a single juvenile tracked for less than 10 months using GPS satellite telemetry (Urios et
al. 2010). This study therefore aims to provide a comprehensive understanding of the
ranging behaviour of this population using a larger sample size across all age classes
tracked with highly accurate GPS satellite technology which provides frequent and accurate
locational data.
In addition to defining age-specific range size and use, understanding the extent of
the exposure to risks or benefits within the foraging range can be useful in determining
whether certain age classes are more vulnerable and therefore need to be targeted for
conservation action. A number of risk assessment studies have focused on the vulnerability
of raptor species to human-induced pressures such as recreation activities and
developments (e.g. Kendall et al. 1996, Kenward 2006, Bamford et al. 2007, Carrete et al.
2012), although these have not necessarily discussed age specific threats.
Globally vultures are declining due to multiple threats including habitat loss, reduced
food availability, poisoning, direct persecution, and fatal collisions with energy infrastructure
(Virani et al. 2011, Ogada et al. 2012). The primary risks to the local population of Bearded
Vultures are the use of poisons and the risk of collisions with energy structures (e.g. power
lines and wind turbines) (Brown 1991, Mundy et al. 1992, Reid et al. in review, Rushworth
and Krüger 2014). The abundance of these risk factors has increased over time due to rapid
human population growth and development and their associated impacts (Statistics South
Africa 2011, Virani et al. 2011, Ogada et al. 2012). In this chapter we consider the density of
settlements, roads and power lines as a measure of negative human influence (i.e. types of
risk). These factors result in habitat loss, land use change and the potential for persecution
and poisoning. We considered feeding sites a positive human influence (i.e. type of benefit)
which elevates the threat of food shortages and because numerous studies have shown
supplementary feeding to benefit vulture populations (Bustamante 1996, Heredia and

111
Heredia 1999, Piper et al. 1999, Donázar et al. 2009, Cortés-Avizana et al. 2010), but see
also Carrete et al. (2006), Oro et al. (2008) and Margalida (2010). We included the
proportion of the foraging range that is formally protected as another beneficial human
influence in our study because the benefits of protected areas in conserving species are well
documented and numerous studies have found vulture populations to rely heavily on
protected areas (e.g. Herremans and Herremans-Tonnoyer 2000, Thiollay 2006, Virani et al.
2011, Ogada et al. 2012). In addition, risks such as mass poisoning, persecution and
collisions with electrical infrastructure are more prevalent in areas that are not formally
protected (Mundy et al.1992, Ogada et al. 2012).
We studied the movements of 18 Bearded Vultures in southern Africa between 2007
and 2014 and describe where (i.e. home range size), and how far (i.e. distances moved
between points) individuals range and whether these parameters differ with age, sex and
season/breeding status. Based on our findings on how Bearded Vultures utilize their
environment, we delineate areas for the implementation of actions in the Biodiversity
Management Plan for the species to guide conservation agencies in the effective use of
resources. Additionally in this chapter we describe and compare exposure to potential risks
and benefits to determine whether any particular age class is more exposed to
anthropogenic influences as a result of their ranging behaviour and discuss the conservation
implications of our findings. This approach may serve as a useful model for assessing
exposure to risks for other endangered vulture species in Africa.
Methods
Capture and Marking
Eighteen Bearded Vultures were fitted with satellite Platform Transmitter Terminals (PTTs)
between September 2007 and September 2012 in the Maloti-Drakensberg region of Lesotho
and South Africa (Figure 4.1). Birds were caught at supplementary feeding sites (vulture

restaura
70 g s
individu
years),
Juvenile
determi
Africa)
from the
Figure souther
light
ants) using
solar-power
uals were a
immature
es, immatu
ination was
using nucle
e tip of the f
4.1 The lorn Africa, wgrey= 1,600
a noose ca
red GPS-P
aged accor
(2-4 years
ures and
s performed
eic acid amp
feather sha
ocation of twhere the da0-2,000 m a
arpet with p
PTT-100s (M
rding to crit
s), sub-adu
sub-adults
d by Molecu
plification p
ft.
the capturearker shadeand white
pieces of m
Microwave
teria in Bro
ult (4-6 yea
s are all
ular Diagno
rocedures w
e sites (+) es indicate
= <1,600 m
meat, fat and
Telemetry
own (1989)
ars) and a
classed a
ostic Servic
with blood t
within the higher altitu
m.
d bone as b
Inc., Mar
); juvenile
dult (>6 ye
as non-adu
es (Pty Ltd
taken from t
Maloti-Drakudes; dar
bait, and fit
ryland, USA
(post-fledgi
ears) (Figu
ults. Gene
d., Westville
the brachia
kensberg rerk grey= >2
112
tted with
A). The
ng to 2
ure 4.2).
etic sex
e, South
l vein or
egion in 2,000 m;

113
Figure 4.2 The four age classes of Bearded Vulture from Brown (1989); juvenile (post-fledging to 2 years), immature (2-4 years), sub-adult (4-6 years) and adult (>6 years).
In all cases, PTTs were attached using a pelvic harness attachment (Hegglin et al. 2004).
The harnesses were constructed using a 2 mm silicon cord inserted into 0.25” tubular
Teflon® which for added strength was then inserted into 0.33” tubular Teflon Ribbon® (Bally
Ribbon Mills, Bally, Pennsylvania). The harnesses were constructed using a weak link sewn
with dental floss initially (n=15), but after these proved too durable they were replaced by
cotton thread (n=6) to allow birds to lose the harness after the end of the PTT’s life cycle
(Fuller 1987), predicted to be between five to eight years. The PTTs recorded one GPS
position per hour from 05h00 to 20h00 hours (local time) daily as well as speed, date and
time.

114
Ethics Statement
Vulture capture and marking procedures were approved by the Animal Ethics Committee of
the Science Faculty of the University of Cape Town (reference: 2001\V14\SK), South African
National Parks and Ezemvelo KwaZulu-Natal Wildlife (Research Project Registration number
W/2057/01). Capture and handling of vultures and the fitting of tracking units were executed
under the Endangered Wildlife Trust’s Threatened or Protected Species registration
certificate granted by the Gauteng Provincial Department of Agriculture, Conservation and
Environment, South Africa (permit: 07046).
Spatial and Temporal Analyses
For all spatial analyses the GPS fixes were projected to the UTM coordinate system (WGS
1984 UTM Zone 35S) for use in R v.3.0.2 (R Core Development Team 2013), ArcGIS v.10.0
(ESRI, Redlands, USA) and the Geospatial Modelling Environment (GME) (Beyer 2012). For
all temporal analyses we compared two seasons. For the non-adult age classes, our
‘season’ variable was either summer (1 October-31 March) or winter (1 April-30 September)
whereas for adults, ‘season’ was either breeding (1 May-31 December) or non-breeding (1
January-30 April). We defined the breeding season as the period between courtship and
nest building until fledging, and the non-breeding season as the post fledging period until
natal dispersal upon initiation of nest building the following year (Brown 1990, unpubl. data).
For all spatial analyses involving either monthly or seasonal comparisons, we used only data
from individuals that were tracked for at least an entire month or an entire season
respectively. Means are presented as mean ± standard deviation throughout.

115
Home Range Size
The home range, utilization distribution, of each individual, was estimated by means of a
kernel density approach (Kenward et al. 2001, Worton 1989, 1995). Total and monthly home
range sizes were calculated in R using the package adehabitatHR v.0.4.10 (Calenge 2006)
with the package rgdal v.0.8-16 (Bivand et al. 2013) to process the spatial data.
Home range estimates were derived by drawing contour lines (i.e. isopleths) based
on the volume of the curve under the utilization distribution which defined home range
polygons whose areas were then calculated. Fixed 90% and 50% kernel density contours
were calculated to estimate the majority of the home range areas (90%), and the core
(intensive use) areas (50%) (Fieberg 2007). A bivariate normal kernel was used which
supposes that the utilization distribution is bivariate normal. Consequently the smoothing
parameter was computed with the ad hoc method. The utilization distribution was estimated
over a grid of a smaller size for adults (100 spatial pixels) than for non-adults (450 spatial
pixels) because adult GPS fixes were concentrated in a much smaller area.
Additionally we merged the 50%, 75% and 90% kernel ranges of the three non-adult
age classes to determine the geographical and administrative areas that were overlapped by
each of these kernels for management planning purposes, i.e. the intensively used area
(50% kernel) represents the minimum area for the implementation of conservation action.
We also calculated the overall foraging range of each individual as the Minimum
Convex Polygon (MCP) encompassing all GPS fixes obtained for that individual (Worton
1989). Although MCPs have a tendency to overestimate the actual area occupied by the
individual, they provide an indication of the overall foraging area and allow comparisons with
historical studies.

116
Home Range Use
To quantify the extent of vulture movements, we determined the distance between hourly
fixes for individuals across all age classes. Using GME, hourly flight distances were
calculated as the straight-line distance between consecutive fixes that were separated by
one hour within the same day, providing a minimum hourly distance travelled. For the
analyses we used mean hourly distances per month for each individual.
Estimating Exposure to Risks and Benefits between Age Classes
The exposure to anthropogenic risks or benefits was described within each individual’s 90%
kernel home range using ArcGIS with shapefiles of the home ranges created in R using the
maptools package (Bivand and Lewin-Koh 2013).
The following human influences (i.e. risk factors), which we thought to have a
potential negative influence on age-specific survival, were considered: density of human
settlements (number of houses per km2); density of power lines (sum of the lengths of 11, 22
and 132 kV lines in km per km2) and the density of roads (km of road per km2). These factors
were considered risks since roads are the primary means of human access which influence
patterns of settlement, create the potential for more poisoning and persecution activities, and
result in land-use change which increases the likelihood of collisions with structures such as
power lines. Collisions with power lines and poisoning are both known to have caused recent
fatalities for the species (Smallie et al. 2009, Ogada 2014, Chapter 6). Other variables were
considered as potential positive human influences (i.e. benefits) and were also compared
between age classes; these included the percentage of formally protected land within a
home range and the density of supplementary feeding sites (number per km2), plus the total
number of supplementary feeding sites within a home range. Vulture populations have been
found to rely heavily on protected areas (e.g. Herremans and Herremans-Tonnoyer 2000,
Thiollay 2006, Virani et al. 2011, Ogada et al. 2012) and individuals are likely to be shielded

117
to a degree from threats in protected areas. Vultures have also been found to rely heavily on
supplementary feeding (Bustamante 1996, Heredia and Heredia 1999, Donázar et al. 2009,
Cortés-Avizana et al. 2010) and we consider these sites as beneficial in supplementing the
food resource.
Statistical Analyses
See Appendix 4.1 for a summary of the analyses described below. We used the lme4 v.1.0-6
package (Bates et al. 2012) within R to perform Linear Mixed Models (LMM) with Wald chi-
square tests to explore the relationships between age and i) home range size, and ii) hourly
flight distances (i.e. home range use).
We calculated total range sizes and mean hourly distances travelled per month for
each age class as described above. We then compared these between age classes and
sexes by fitting age, sex and the interaction between them as fixed factors in the model
(Appendix 4.1: I and II). The interaction between sex and age explored whether any
difference in home range size or use between the sexes was consistent for each age class.
Because duration of tracking may influence the accuracy of home range size, we included
the log of the number of months each bird was tracked as a weighting term in the analyses
comparing range size between age classes. In doing so we therefore attempted to account
for the variable length of time for which we tracked different birds. Month and year were
included as fixed factors in the home range use model to control for the effect of month or
year on distances moved, because data were not fully balanced between these variables for
each individual. Individual identity was included as a random term in these LMMs to account
for the lack of independence between individuals in the different age classes because some
birds crossed age classes as they aged. Pairwise comparisons between age classes and
between the interaction terms were made using the lsmeans v.1.10-4 package (Lenth 2013)
with P values adjusted using the Tukey method.

118
We then compared adult home range size and use between the breeding and non-
breeding season using the home range size/use per breeding individual for each season as
the response variable and fitting season and year as fixed factors in the model. Individual
identity was again included as a random term because we had multiple years of data from
some individuals. Some adults failed to breed (n=2) and the breeding season data from
these non-breeding individuals were excluded for seasonal and monthly (see below)
comparisons. We used this same model structure to examine temporal patterns of range
size and use for non-adults (juveniles, immatures and sub-adults), but comparing the
‘summer’ and ‘winter’ seasons. For these seasonal analyses we grouped age classes where
appropriate (see results).
To investigate temporal patterns of home range size and use by breeding adults
throughout the year at a finer scale, we repeated these same models but with month, sex
and year as fixed factors and monthly home range size per individual as the response
variable. Although the sexes did not differ in total home range size (see results), we included
sex as a factor in our monthly and seasonal comparisons, and the interaction between sex
and month, and sex and season to explore whether breeding male and female home range
sizes differed between months and seasons.
Risks and benefits within home ranges were compared across age classes using
Generalized LMMs with age as a fixed factor and individual as a random term (Appendix 4.1:
III). We analyzed the density of these variables by including their count (settlements or
supplementary feeding sites) or length (roads or power lines) as the response variable and
including the log of each individual’s home range size as an offset in the model. These
models were fitted with a Poisson distribution and log link function. For comparing access to
supplementary feeding sites between ages, we analyzed the data using the total number of
feeding sites in each individual’s range with no offset. For examining the differences in the
percentage of formally protected land in the range of each age class we analyzed the data
using Arcsine square-root transformed percentages.

119
Results
Home Range Size
We obtained satellite tracking data from 18 Bearded Vultures tracked for 392 bird-months
(146,607 GPS fixes) between September 2007 and April 2014; 85 months of juvenile
movements (22%), 113 months of immature movements (29%), 31 months of sub-adult
movements (8%) and 163 months of adult movements (41%). For full details of each
individual tracked see Appendix 4.2.
The total area of use of all age classes was 51,767 km2 based on the 90% kernels of
all individuals combined, and can be considered the species’ foraging range. The foraging
areas of non-breeding birds covered most of this area (Figures 4.3a-d) whereas adult home
range areas were focused around their specific breeding territories with some overlap
between territories (Figures 4.4a-d). The merged 50%, 75% and 90% kernels of non-adults,
covered an area of 10,982 km2, 21,454 km2 and 33,636 km2 respectively, of which the 90%
kernel covered 65% of the population’s foraging range (Figure 4.3d).
There was a significant difference in overall range size between age classes
(χ2(3)=63.99, P<0.01) with pairwise comparisons showing that the ranges of all age classes
differed significantly in size (P<0.01) apart from immature and sub-adult ranges (P=0.16)
(Figure 4.5). Non-adult range sizes increased as birds aged, prior to becoming adults but the
home range size of adults, particularly breeding adults, was significantly smaller than those
of all other age class (Table 4.1, Appendix 4.3). There was no significant difference in overall
range size between sexes (χ2(1)=0.19, P=0.66), although the interaction between age and
sex was significant (χ2(3)=17.88, P<0.01). Range sizes of males and females did not differ
significantly within each age class but the difference in immature male (17,254 ± 2,155 km2)
and female (26,802 ± 2,184 km2) range sizes was close to significant (P=0.06) and resulted
in the significance of the interaction term. Home ranges estimated by MCPs showed a

120
similar trend of increasing range size with age, although they were much larger overall
(Figures 4.3a-d, Table 4.1).
Figures 4.3 a&b. Bearded Vulture MCP and 50%, 75% and 90% kernel home ranges in southern Africa showing the total range collectively for a) juveniles (n=10) and b) immatures (n=7).

121
Figures 4.3 c&d. Bearded Vulture MCP and 50%, 75% and 90% kernel home ranges in southern Africa showing the total range collectively for c) sub-adults (n=3) and d) the merged ranges of non-adults (n=20) shown in relation to the overall range for the population indicating the geographic area in which to focus conservation action outside of protected areas.

122
Figures 4.4 a&b Bearded Vulture 50%, 75% and 90% kernel home ranges in southern Africa showing individual ranges for a) breeding adults (n=6) and b) all adults (n=6) including those they did not breed for a season (n=2), indicating some overlap of home ranges.
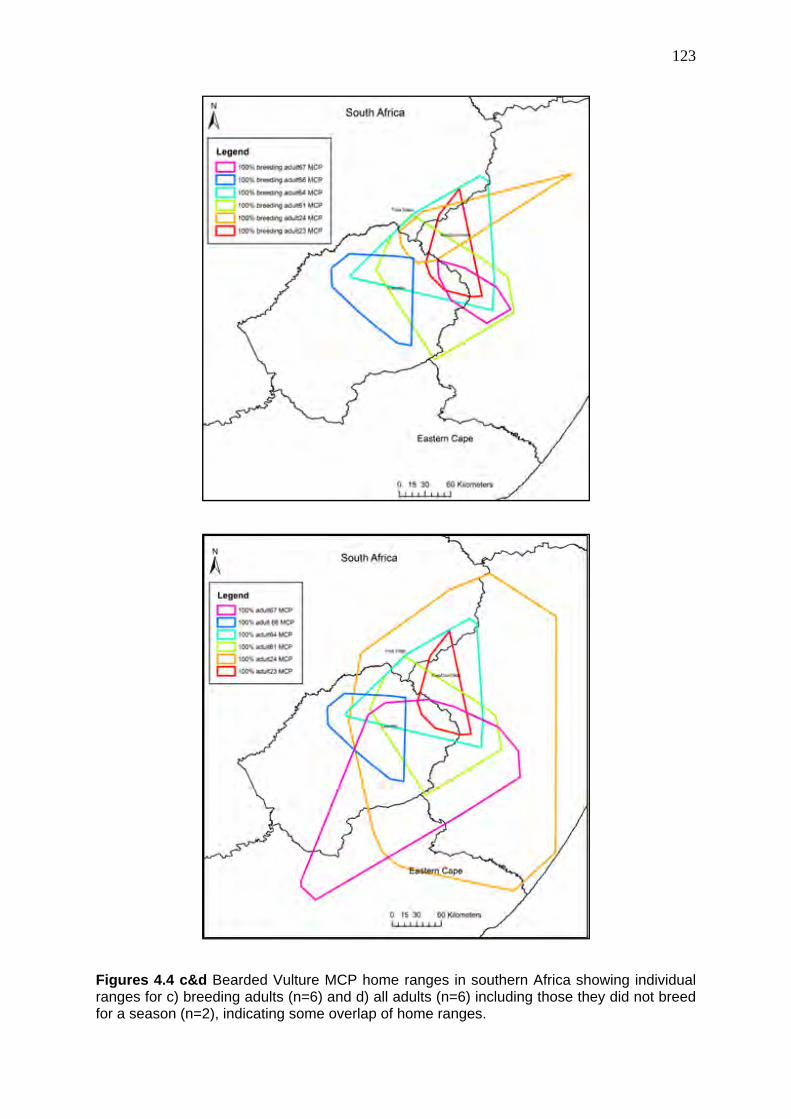
123
Figures 4.4 c&d Bearded Vulture MCP home ranges in southern Africa showing individual ranges for c) breeding adults (n=6) and d) all adults (n=6) including those they did not breed for a season (n=2), indicating some overlap of home ranges.

Table 4(mean estimat
Age cla
Juvenile
Immatu
Sub-ad
Adult (to
Adult (b
Figure differensignificaclasses
Adult ho
breedin
4.1 A comp± standard
es for differ
ass
e
ure
ult
otal)
breeding)
4.5 The avnt ages clasantly smalles (P<0.001)
ome ranges
ng (105 ± 1
arison of thd deviationrent age cla
Total 90% kernel rangsize in km2
10,540 ± 7
21,880 ± 8
25,985 ± 7
286 ± 361
95 ± 19
verage (measses showier home ranexcept betw
s did not dif
08 km2) se
he total and n) and theasses of Bea
ge 2
Totarangkm2
7,306 21,1
8,187 34,1
7,077 40,9
18,7
5,22
an ± standaing an incrnge size foween imma
ffer significa
asons (χ2(1)
seasonal 9e Minimum arded Vultu
al MCP ge size in
151 ± 9,888
188 ± 11,08
961 ± 9,274
751 ± 23,38
20 ± 3,850
ard deviatiorease in raor adults. Hoatures and s
antly betwe
)=3.21, P=0
90% kernel Convex P
ure in southe
Season
Non-breSumme
9,504 ±
1 13,167
27,272
5 n/a
105 ± 6
on) 90% kernge size wome range sub-adults (
en the bree
0.07), nor d
home rangPolygon (Mern Africa.
nal 90% ker
eeding/ er
± 5,038
± 13,999
± 11,005
62
rnel range swith age for
size differeP=0.16).
eding (148 ±
id they diffe
ge estimateMCP) home
rnel range in
BreedingWinter
10,640 ±
29,836 ±
33,573 ±
n/a
148 ± 10
size (in kmr non-adultsed between
± 62 km2) a
er between
124
s in km2
e range
n km2
g/
5,082
8,362
8,497
8
2) of the s and a
n all age
and non-
months

125
(χ2(1)=0.67, P=0.41). There were also no differences in monthly home range size between
sexes (χ2(1)=0.01, P=0.94). Since the total foraging ranges of immatures and sub-adults were
similar (see above), these data were combined for seasonal analyses. Juvenile foraging
ranges did not differ significantly seasonally (χ2(1)=2.84, P=0.09) but foraging ranges of
immature and sub-adults were on average significantly larger (χ2(2)=15.37, P=<0.01) during
winter than in summer.
Home Range Use
Monthly mean hourly distances travelled varied significantly between age classes
(χ2(3)=11.81, P<0.01) but not between sexes within each age class (χ2
(1)=0.26, P=0.61).
There was also no significant difference in the interaction between age and sex (χ2(3)=5.87,
P=0.12). Pairwise tests showed that the adults travelled significantly shorter distances than
immatures (P=0.03) and sub-adults (P=0.04) but travelled similar distances to juveniles
(P=0.07). Non-adult age classes did not differ significantly from each other in the mean
distances travelled per month (P>0.05 in all cases) (Table 4.2), therefore these data were
combined for further analyses. Range use reflected the general patterns of range size, with
adults travelling the shortest distances and distances increasing in non-adults as they aged
(Table 4.2, Appendix 4.3).
The movements of breeding adults varied significantly according to season
(χ2(1)=34.89, P<0.001) and month (χ2
(11)=58.06, P<0.001), with birds moving further between
hourly fixes during the breeding season than the non-breeding season (Table 4.2)
particularly during incubation and chick hatching (Figure 4.6). Sexes, however, did not differ
in their movements either between seasons (χ2(1)=3.32, P=0.07) or months (χ2
(1)=0.02,
P=0.89) and there were also no significant interactions between sexes and seasons
(χ2(1)=1.61, P=0.20) and sexes and months (χ 2
(1)=7.98, P=0.71). There were no significant
seasonal differences in the movements of non-adults (χ 2(1)=1.98, P=0.16) (Table 4.2).

126
Table 4.2 A comparison of the average hourly distances (in km) between fixes (mean ± standard deviation) of the different age classes of Bearded Vulture; sample sizes and ranges are also displayed. Pairwise comparisons of average distances indicated significant differences only between adults and immatures (P=0.03), and adults and sub-adults (P=0.04). Adult movements differed significantly between seasons (P<0.001) whereas non-adults did not (P=0.16).
Age class Average hourly distance travelled Non-breeding/ Summer
Breeding/ Winter
Juvenile 5.2 ± 1.2 km (n= 7: 0-51 km) 5.0 ± 1.2 km 5.5 ± 1.2 km
Immature 6.8 ± 1.6 km (n= 10: 0-123 km) 6.7 ± 1.8 km 7.0 ± 1.3 km
Sub-adult 7.8 ± 1.8 km (n= 3: 0-109 km) 7.6 ± 1.8 km 8.1 ± 1.9 km
Adult 4.1 ± 1.4 km (n= 6: 0-184 km) 3.2 ± 0.8 km 4.4 ± 1.5 km
Figure 4.6 The mean (mean ± standard deviation) monthly distances (in km) per hour between fixes of breeding adults, showing an increase in distances moved at the start of the breeding season in May, a peak during the incubation and hatching period and a decrease during the fledging period at the end of the breeding season (December) and during the post fledging period. The average (mean ± standard deviation) monthly distances per hour (in km) of non-adults are shown for winter and summer.

Compa
There w
lines (χ2
(Figure
(P<0.01
with on
Adults h
adults w
power l
Figure lines, roBearderisks tha
Age cla
benefits
range c
differ si
rison of Exp
were signifi
2(3)=18,16.97
4.7a). Pairw
1), power li
nly adults a
had the low
were the m
ines and ro
4.7a A comoads and sd Vulture san juveniles
asses did no
s; namely t
covered by
ignificantly
posure to R
icant differe
7, P<0.01) a
wise compa
ine (P<0.01
and juvenile
west exposu
most expos
oads in their
mparison ofsettlements howing thas and adults
ot differ sign
he density
protected a
between ag
Risks and Be
ences in th
and settlem
arisons sho
1) and sett
es having s
ure to these
ed to these
r range (Fig
f the densityper km2 w
t immaturess.
nificantly in
of feeding
areas (χ2(3)=
ges (χ2(3)=6
enefits betw
he density o
ments (χ2(3)=
owed that al
tlement (P<
similar settle
e risk factor
e risks, ha
ure 4.7a).
y (mean ± swithin the fos and suba
their expos
sites (χ2(3)=
1.76, P=0.6
68.31, P<0.0
ween Age C
of roads (χ
66,746.89,
l age classe
<0.05) dens
ement dens
s within the
ving the hi
standard deoraging rangdults are ex
sure to two
=0.30, P=0
62). Howeve
01). Pairwis
Classes
2(3)=1,528.1
P<0.01) be
es differed s
sity within t
sities in the
eir home ran
ghest dens
eviation) of ge of differexposed to a
of the varia
.96) and pe
er, access t
se comparis
19, P<0.01)
etween age
significantly
their home
eir range (P
nge, where
sity of settl
risk factorsrent age claa greater de
ables we de
ercentage o
to feeding s
sons indica
127
), power
classes
y in road
ranges,
P=0.09).
as, sub-
ements,
s; power asses of ensity of
efined as
of home
sites, did
ated that
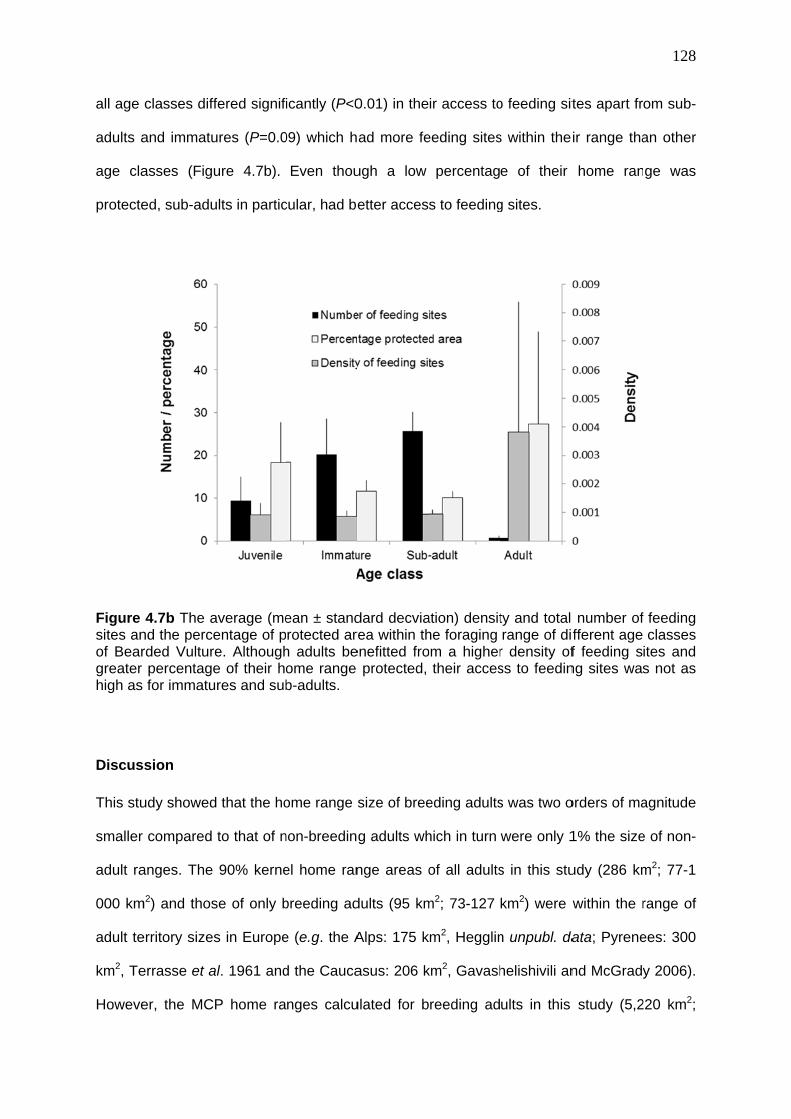
all age
adults a
age cla
protecte
Figure sites anof Beargreater high as
Discus
This stu
smaller
adult ra
000 km
adult te
km2, Te
Howeve
classes diff
and immatu
asses (Figu
ed, sub-adu
4.7b The and the percerded Vulturpercentage
for immatu
ssion
udy showed
r compared
anges. The
m2) and thos
erritory sizes
errasse et a
er, the MC
fered signif
ures (P=0.0
ure 4.7b).
ults in partic
average (meentage of pe. Althoughe of their h
ures and sub
d that the ho
to that of n
90% kerne
se of only b
s in Europe
al. 1961 and
P home ra
icantly (P<0
09) which h
Even thou
cular, had be
ean ± standrotected are
h adults beome range b-adults.
ome range s
non-breedin
el home ran
breeding ad
e (e.g. the A
d the Cauca
nges calcu
0.01) in the
ad more fe
ugh a low
etter acces
dard decviarea within thenefitted fro
protected,
size of bree
g adults wh
nge areas o
dults (95 km
Alps: 175 k
asus: 206 k
ulated for b
ir access to
eeding sites
percentag
s to feeding
ation) densithe foraging om a higher
their acces
eding adults
hich in turn
of all adults
m2; 73-127
m2, Hegglin
km2, Gavash
reeding ad
o feeding sit
s within the
e of their
g sites.
ty and total range of difr density ofss to feedin
s was two o
were only 1
s in this stu
km2) were w
n unpubl. da
helishivili an
ults in this
tes apart fr
ir range tha
home ran
number offferent age f feeding s
ng sites was
orders of ma
1% the size
udy (286 km
within the r
data; Pyrene
nd McGrady
study (5,2
128
om sub-
an other
ge was
f feeding classes
ites and s not as
agnitude
e of non-
m2; 77-1
range of
ees: 300
y 2006).
220 km2;

129
2,726–12,343 km2) were 10 times larger than those estimated by Brown (1988) for the same
population using radio telemetry (418 km2; 302-743 km2) and those home range areas
calculated from inter-nest distances (625 km2; Brown et al. 1982) most probably because of
the use of improved tracking technology. The average MCP home range area of juveniles in
this study (21,151 km2, n=12) was twice the size of reintroduced juveniles in the Alps
(11,224 km2, n=7) (Hegglin unpubl. data) and almost 10 times larger than those of juveniles
in the Pyrenees (2,225 km2, n=3) (Gil et al. in press). Our MCP calculations for non-adults
(21,151-40,961 km2) were nearly identical to earlier findings of (Gil et al. 2010) for non-adults
(23,683 km2-40,932 km2) within a similar sized distributional range in the Spanish-French
Pyrenees but were larger than more recent estimates from the Pyrenees (945–19,008 km2)
(Gil et al. in press). Again our estimates were much larger than the immatures tracked
through conventional VHF radio telemetry by Brown (1988) which were described as having
three areas of use, averaging 608 km2 each (i.e. a total area of 1,825 km2). Our findings of
increased range size and use with age in non-adults support the findings of Gil et al. (2010)
and Margalida et al. (2013) who suggest that range size and use increases with age as the
individuals explore their territory.
Although adults maintained the same home range size throughout the year, in
contrast to the findings of Brown (1988) and Gil et al. (2010), their use of home range (based
on minimum distances moved) was higher during the incubation and hatching/early chick
rearing stages of the breeding cycle. Our findings suggest that breeding adults need to
increase their search distances and intensity whilst breeding and spend less time on non-
foraging related activities because of the need to return to the nest frequently. Incubation
and chick rearing duties are shared by the sexes (Brown 1990), therefore the energy
demand of both birds may be high after long periods of inactivity whilst incubating or
guarding the chick. Winter is also a period of food shortage in the region because livestock
are moved to lower altitudes and ungulate deaths are low at the beginning of the season
thus birds may be required to fly further in search of food. Our theory of increased search

130
distances and intensity during incubating and chick hatching is supported by the tracking
data, which on subsequent inspection showed that during these periods the birds spent only
22% of their time moving distances of less than 1 km per hour compared with 35% of the
time in other months. In addition the frequency of movements greater than 10 km between
fixes doubled during winter (13%) which is indicative of more extensive searching when food
resources are scarce. The increased use of their home range during the breeding season
makes breeding adults more vulnerable to risk factors during this period. Clearly the death of
any adult through human influences during the breeding season would impact significantly
on subsequent breeding performance.
Non-adults on the other hand increased the size of their range in winter but not the
use of their range. The idea that the increased foraging range of immatures and sub-adults
during winter may also be in response to food scarcity, is supported by the findings of
Donázar (1993) who showed that variation in ranging behavior of non-adults was indicative
of a spatially unpredictable or highly dispersed food resource. The movements may also be
a response to interactions with conspecifics, territory exploration with age (immatures) and
searching for a partner (sub-adults) (Bertran and Margalida 2002, Urios et al. 2010). The
larger range sizes in winter and the greater distances moved by non-adults overall, makes
them most vulnerable to risk factors such as illegal human activities and collisions with
power lines throughout the year.
We found no differences between the sexes in either range size or use. This result is
to be expected for a sexually monomorphic species (García et al. 2009) where parental
duties are shared by adults (Brown 1990). Similarly Margalida et al. (2013) also found no
dispersal differences between sexes in pre-adults and causes of mortality did not vary
between sexes (Margalida et al. 2008).
The average home range size of adults in this study can help guide the size of the
area (10 km radius) required to be conserved around each of the 109 breeding territories

131
identified in Chapter 2 for protection to safe-guard the breeding portion of the population.
The radius of the core area (50% kernel) of use (4 km radius) represents the absolute
minimum area for protection. The protection of the breeding territories will also benefit
fledglings for the first few months before they disperse from their natal area. Similarly, the
core area of the combined non-adult range (10,982 km2) also represents the minimum area
to be conserved. However, since non-adult birds spread their activity over such large areas,
the 75% (21,454 km2) and ideally the 90% kernels (33,636 km2) depict the areas in which
resources for the implementation of actions need to be focused to effectively address the
risks faced by non-adult birds. Preferred roost sites in these areas could form focal areas for
conservation efforts and power lines and cables could be targeted for mitigation to reduce
collision risks.
Our attempt at assessing the impacts of anthropogenic influences by age class
provides useful information to identify the primary management actions required to reduce
risks and maximize benefits in the priority areas. Apart from the protection of breeding
territories, conservation management should also focus on the non-adult foraging range
outside of protected areas. Since non-adult vultures range widely and do not necessarily
benefit from protected areas (Phipps et al. 2013), our results suggest that efforts should
concentrate on conservation actions within the wider range rather than the proclamation of
additional protected areas, given the very small proportion of their foraging range that this
would likely protect.
Sub-adults had larger ranges, moved greater distances and had a higher density of
risk factors in their range than other age classes thus increasing their exposure to potentially
lethal risk factors such as poisoning and power line collisions. Although we considered
feeding sites beneficial through supplementation in times of food scarcity, they may also
pose a risk, particularly to immatures and sub-adults that had better access to more feeding
sites. Unintentional indirect poisoning through the use of veterinary drugs (Naidoo et al.
2009) or predator control measures (Krüger et al. 2006, Brown 1991, Virani et al. 2011,

132
Ogada et al. 2012), indirect persecution through traps placed at feeding sites for predator
control (personal observation) and direct poisoning for the traditional medicine trade (Mander
et al. 2007) are more likely to occur at feeding sites where scavengers are known to
congregate frequently.
Further inspection of the tracking data suggests that non-adults do not rely heavily on
supplementary feeding in contrast to the findings of Bustamante (1996), Heredia and
Heredia (1999), Donázar et al. (2009) and Cortés-Avizana et al. (2010) and may not
necessarily benefit from having access to more feeding sites. Less than 1% (0.62%; 0.03-
1.49%) of the GPS fixes of immatures and sub-adults were within 1 km of a feeding site.
Adults on the other hand used feeding sites significantly (χ2(2)=40.63, P<0.001) more often
(1.42%, 0-4.64%) with more than half (69%) of these fixes recorded during the breeding
season. Breeding adults may therefore benefit from the provision of a consistent and regular
supply of food close to their nest sites to reduce the need to range more extensively in the
breeding season thus reducing risk and increasing breeding success. However, the potential
negative impacts of feeding sites located in core breeding areas, such as a density-
dependent decrease in productivity and changes in mating behaviour (Carrete et al. 2006,
Oro et al. 2008, Margalida 2010), must be considered.
Furthermore, all age classes would benefit from improved management of existing
sites since poisoning and persecution account for more than half the mortalities of the
population (Chapter 6). The availability of supplementary food may influence recruitment by
improving the survival rate of non-adult birds and should be investigated further. Additional
actions to address poison use and persecution in the priority (core areas) include identifying
alternative predator control methods and increasing awareness among commercial farmers
and herders in communal areas. Emphasis must be on mitigation efforts during the breeding
season to ensure breeding success is not compromised by human activities. In order to
address the other risk factors, we recommend the mitigation or removal of unsafe energy
structures and opposing or mitigating proposed infrastructural developments that will

133
encourage settlement in undeveloped areas and result in further habitat loss and land use
change.
The larger sample size and the use of modern technology in this study have provided
explicit information on the spatial and temporal movements of Bearded Vulture in southern
Africa. This information should greatly aid conservation management planning for this
species and should enable key requirements of the Biodiversity Management Plan for the
species (Krüger 2013) to be addressed through assessing age specific exposure to
anthropogenic influences. This is particularly important for the conservation of a species
inhabiting an area spanning both international and regional boundaries in a landscape where
human activities place vulture populations at risk in the long term. Although other raptor
studies have looked at human influences, space use and conservation implications (e.g.
Donázar et al. 2002, Bamford et al. 2007, Boshoff and Minnie 2011, García-Ripollés et al.
2011, Margalida et al. 2013, Boggie and Mannan 2014), these have often been limited
because of their sample sizes or have they been focused on specific age classes, thus
limiting the recommendations that can be made at the scale of the populations’ foraging
range.
We demonstrate that combining home range size and use estimates with simple
indicators of the differential exposure to risk between age classes facilitates a more
comprehensive understanding of how and where to address current and future threats to
optimize conservation management strategies for a critically endangered population. This
approach may be useful to assess risk exposure for other endangered vulture species in
Africa that forage over extensive areas.
Acknowledgements
We are grateful to the capture team for their patience and tireless efforts; in particular
Alfonso Godino, Allan Howell and Daniel Hegglin who were involved in the initial stages

134
(2007 and 2008), and Carmen Callero, Rickert van der Westhuizen and Ben Hoffman who
assisted with the bulk of the captures from 2009 onwards.
We thank the following land owners/managers for their support and assistance with
the monitoring, capture and marking activities; Peter Dommett, Henry Hibbett, Daryn
Hiltunen, Brett Moller, Witsieshoek Mountain Resort staff, Ezemvelo KwaZulu-Natal Wildlife
staff of the Maloti Drakensberg Park World Heritage Site and the South African National
Parks staff of Golden Gate Highlands National Park.
The following institutions are thanks for providing data: The Lesotho Electricity
Corporation, Eskom, South African Department of Transport, Maloti Drakensberg
Transfrontier Programme and Ezemvelo KwaZulu-Natal Wildlife.
References
Acharya R, Cuthbert R, Baral HS and Chaudhary A (2010) Rapid decline of the Bearded
Vulture Gypaetus barbatus in Upper Mustang, Nepal. Forktail 26: 117-120.
Bamford AJ, Diekman M, Monadjem A and Mendelsohn J (2007) Ranging behaviour of
Cape Vultures Gyps coprotheres from an endangered population in Namibia. Bird
Conserv Int 17: 331-339.
Bates DM, Maechler M and Bolker B (2012) lme4: Linear mixed-effects models using S4
classes. R package version 0.999999-0.
Beissinger SR (2000) Ecological mechanisms of extinction. Proc Natl Acad Sci USA 97:
11688–11689.

135
Bell BD and Merton DV (2002) Critically endangered bird populations and their
management. In: Norris K. and Pain DJ (editors) Conserving bird diversity. General
principles and their application. Cambridge University Press, Cambridge, pp. 105-
138.
Bennet PM and Owens IPF (1997) Variation in extinction risk among birds: chance or
evolutionary predisposition? Proc R Soc Lond B 264: 401–408.
Bertran J and Margalida A (2002) Territorial behaviour in Bearded Vultures in response to
Griffon vultures. J Field Ornith 73: 86-90.
Beyer HL (2012) Geospatial Modelling Environment (Version 0.7.2.0). (software). URL:
http://www.spatialecology.com/gme.
Bivand R, Keitt T and Rowlingson B (2013) rgdal: Bindings for the Geospatial Data
Abstraction Library. R package version 0.8-10. http://CRAN.R-project.org/
package=rgdal.
Bivand R and Lewin-Koh N (2013) maptools: Tools for reading and handling spatial objects.
R package version 0.8-24.
Boggie MA and Mannan RW (2014) Examining seasonal patterns of space use to gauge
how an accipiter responds to urbanization. Landsc Urban Plan 124: 34–42.
Boshoff A and Minnie J (2011) On the role of the shape and size of foraging area, and
colony size, in selecting critical areas for Cape Griffon Gyps coprotheres
conservation action. Vulture News 61: 4-15.
Brown CJ (1988) A study of the Bearded Vulture Gypaetus barbatus in southern Africa.
Dissertation, University of Natal, Pietermaritzburg.
Brown CJ (1989) Plumages and measurements of the bearded vulture in southern Africa.
Ostrich 60: 165-171.

136
Brown CJ (1990) Breeding biology of the Bearded Vulture in southern Africa, Parts I – III.
Ostrich 61: 24-49.
Brown CJ (1991) An investigation into the decline of the Bearded Vulture Gypaetus barbatus
in southern Africa. Biol Conserv 57(3): 315-337.
Brown CJ (1997) Population dynamics of the Bearded Vulture Gypaetus barbatus in
southern Africa. Afr J Ecol 35(1): 53-63.
Brown LH, Urban E and Newman K (1982) Birds of Africa Vol 1.:Academic Press, Orlando,
Florida.
Bustamante J (1996) Population viability analysis of Captive and Released Bearded Vulture
Populations. Conserv Biol 10(3): 822-831.
Butchart SHM et al. (2010) Global Biodiversity: Indicators of Recent Declines. Science
328(5982): 1164-1168. doi:10.1126/science.1187512.
Calenge C (2006) The package adehabitat for the R software: a tool for the analysis of
space and habitat use by animals. Ecol Modell 197: 516-519.
Carrete M, Donázar JA and Margalida A (2006) Density-dependent Productivity Depression
in Pyrenean Bearded Vultures: Implications for Conservation. Ecol Applic 16(5):
1674–1682.
Carrete M, Sánchez-Zapata JA, Benítez, JR, Lobón M, Montoya F and Donázar JA (2012)
Mortality at wind-farms is positively related to large-scale distribution and aggregation
in griffon vultures. Biol Conserv 145: 102–108.
Clark RG, Hobson KA, Nichols JD and Bearhop S (2004) Avian Dispersal and Demography
Scaling up to the Landscape and Beyond: Condor 106(4): 717-719.
137
Cortez-Avazida A, Carrete M and Donázar JA (2010) Managing supplementary feeding for
avian scavengers: guidelines for optimal design using ecological criteria. Biol
Conserv 143: 1707-1715.
Del Hoyo J, Elliott A and Sargatal J (1994) Handbook of the Birds of the World. Vol 2. Lynx
Edicions, Barcelona.
Donázar JA (1993) Los buitres ibéricos. Biología y conservación. J.M. Reyero, Madrid,
Spain.
Donázar JA, Blanco G, Hiraldo F, Soto-Largo E and Oria J (2002) Effects of forestry and
other land use practices on the conservation of Cinerous Vultures. Ecol Appl 12:
1145-1456.
Donázar JA, Margalida A, Carrete M and Sánchez-Zapata JA (2009) Too sanitary for
vultures. Science 326(5953): 664.
Fahrig L (2007) Non-optimal animal movement in human-altered landscapes. Funct Ecol 21:
1003–1015.
Ferrer M (1993) Juvenile dispersal behaviour and natal philopatry of a long-lived raptor, the
Spanish Imperial Eagle Aquila adalberti. Ibis 135: 132–138.
Ferrer M and Harte M (1997) Habitat selection by immature Spanish Imperial Eagles during
the dispersal period. J Appl Ecol 34: 1359–1364.
Fieberg J (2007) Kernel density estimators of home-range: smoothing and the
autocorrelation red herring. Ecol 88(4): 1059–1066.
Frey H (1996) The situation of the Bearded Vulture (Gypaetus barbatus) in the
Mediterranean countries. In: Muntaner J and Majol J (editors) Biología y
Conservación de las Rapaces Mediterráneas, 1994. Monografías 4, SEO, Madrid.

138
Fuller MR (1987) Application and considerations for wildlife telemetry. J Raptor Res 21: 126–
128.
García CB, Insausti JA, Gil JA, de Frutos A, Alcántara M, González J, Cortés MR, Bonafonte
JI and Arruga MV (2009) Comparison of different procedures of DNA analysis for sex
identification in the endangered bearded vulture (Gypaetus barbatus). Eur J Wildl
Res 55(3): 309
García-Ripollés C, López-López P and Urios V (2011) Ranging behaviour of non-breeding
Eurasian Griffon Vultures Gyps fulvus: a GPS-telemetry study. Acta Ornithol 46(2):
127-134.
Gavashelishivili A and McGrady MJ (2006) Breeding site selection by bearded vulture
(Gypaetus barbatus) and Eurasian Griffon (Gyps fulvus) in the Caucasus. Anim
Conserv 9: 159-170.
Gil JA, Díez O, Báguena G, Lorente L, Pérez C, Losada JA and Alcántara M (2010) Juvenile
dispersal of the bearded vulture (Gypaetus barbatus) in the Pyrenees (Spain-
France). Fundación para la Conservatión del Quebrantahuesos (FQC), Spain.
Gil JA, Báguena G, Sánchez-Castilla E, Antor RJ, Alcantara M and Lopéz-Lopéz P (in press)
Home-range and movements of non-breeding bearded vultures tracked by satellite
telemetry in the Pyrenees.
González LM, Arroyo BE, Margalida A, Sanchez R and Oria J (2006) Effect of human
activities on the behaviour of breeding Spanish Imperial Eagles (Aquila adalbertz):
management implications for the conservation of a threatened species. Anim
Conserv 9: 85-93.
Hegglin D, Wehrle M and Aebischer A (2004) Satellite tracking of Bearded Vultures - the
project “Bearded Vultures on the Move”. Annual Report of the Foundation for the
conservation of the Bearded Vultures, pp. 52-55.

139
Heredia R and Heredia B (1999) El Quebrantahuesos Gypaetus barbatus en los Pirineos:
características ecológicas y bi ología de la conservación. The Bearded Vulture in the
Pyrenees: ecology and conservation biology. Colección Técnica. ICONA, Madrid.
Herremans M and Herremans-Tonnoyer D (2000) Land use and the conservation status of
raptors in Botswana. Biol Conserv 94: 31–41.
Hiraldo F, Delibes M and Calderon J (1979) El Quebrantahuesos: sistematica, taxonomia,
biología, distrubucion y protección. Monografias 22, ICONA, Madrid.
Kendall et al. (1996) An ecological risk assessment of lead shot exposure in non-waterfowl
avian species: upland game birds and raptors. Environ Toxicol Chem 15(1): 4–20.
Kenward R (2006) The goshawk. T. and A.D. Poyser, Ltd, London.
Kenward RE, Walls SS, Hodder KH, Pahkala M, Freeman SN and Simpson VR (2000) The
prevalence of non-breeders in raptor populations: evidence from rings, radio tags and
transect surveys. Oikos 91: 271-279.
Kenward RE, Clarke RT, Hodder KH and Walls SS (2001) Density and linkage estimators of
home-range: nearest-neighbor clustering defines multi-nuclear cores. Ecol 82: 1905–
1920.
Krüger S (editor) (2013) Biodiversity Management Plan for the Bearded Vulture (Gypaetus
barbatus meridionalis) for Southern Africa. Published 8 May 2014 Government
Gazette Notice No 37620.
Krüger S (in press) Bearded Vulture. In: Taylor MR (editor) The Eskom Red Data Book of
Birds of South Africa, Lesotho and Swaziland. BirdLife, Johannesburg, South Africa.

140
Krüger S, Piper S, Rushworth I, Botha A, Daly B, Allan D, Jenkins A, Burden D and
Friedmann Y (editors) (2006) Bearded Vulture (Gypaetus barbatus meridionalis)
Population and Habitat Viability Assessment Workshop Report. Conservation
Breeding Specialist Group (SSC/IUCN)/CBSG Southern Africa, Endangered Wildlife
Trust, Johannesburg.
Krüger SC, Allan DG, Jenkins AR and Amar A (2014) Trends in territory occupancy,
distribution and density of the Bearded Vulture Gypaetus barbatus meridionalis in
southern Africa. Bird Conserv Int 24: 162-177. doi:10.1017/S0959270913000440.
Lenth RV (2013) Using the lsmeans Package. The University of Iowa. Updated with lsmeans
Version 1.10—July 4, 2013.
Mander M, Diederichs N, Ntuli L, Khulile M, Williams V and McKean S (2007) Survey of the
Trade in Vultures for the Traditional Health Industry in South Africa. Futureworks,
unpubl report, 30 pp.
Margalida A and Bertran J (2000) Breeding behaviour of the Bearded Vulture Gypaetus
barbatus: minimal difference in parental activities. Ibis 142: 225-234
Margalida A and Bertran J (2005) Territorial defence and agnostic behaviour of breeding
bearded vultures Gypaetus barbatus towards conspecifics and heterospecifics. Ethol
Ecol Evol 17: 51-63.
Margalida A, Heredia R, Razin M and Hernandez M (2008) Sources of variation in mortality
of the Bearded Vulture Gypaetus barbatus in Europe. Bird Conserv Int 18: 1-10.
Margalida A (2010) Supplementary feeding during the chick-rearing period is ineffective in
increasing the breeding success in the bearded vulture (Gypaetus barbatus). Eur J
Wildl Res 56: 673–678.

141
Margalida A, Carrete M, Hegglin D, Serrano D, Arenas R and Donázar JA (2013) Uneven
Large-Scale Movement Patterns in Wild and Reintroduced Pre-Adult Bearded
Vultures: Conservation Implications. PLoS ONE 8(6): e65857. doi:10.1371/ journal.
pone. 0065857.
Mingozzi T and Estève R (1997) Analysis of a historical extirpation of the Bearded vulture
Gypaetus barbatus (L.) in the Western Alps (France-Italy): former distribution and
causes of extirpation. Biol Conserv 79: 155-171.
Morrison JL and Wood PB (2009) Broadening our approaches to studying dispersal in
raptors. J Raptor Res 43(2): 81-89.
Mundy P, Butchart D, Ledger J and Piper S (1992) The Vultures of Africa. Russel Friedman
Books cc, Johannesburg, South Africa.
Naidoo V, Wolter K, Cuthbert R and Duncan N (2009) Veterinary diclofenac threatens
Africa’s endangered vulture species. Reg Toxicol Pharmacol 53: 205–208.
Newton I (1979) Population ecology of raptors. T and AD Poyser, Berkhamsted.
Ogada DL (2014) The power of poison: pesticide poisoning of Africa’s Wildlife. Ann NY Acad
Sci. doi: 10.1111/nyas.12405.
Ogada DL, Keesing F and Virani MZ (2012) Dropping dead: causes and consequences of
vulture population declines worldwide. Ann NY Acad Sci 1249: 57-71.
Oro D, Margalida A, Carrete M, Heredia R and Donázar JA (2008) Testing the Goodness of
Supplementary Feeding to Enhance Population Viability in an Endangered Vulture.
PLos ONE 3919: e4084. doi:10.1371/journal.pone.0004084.
Penteriani V and Delgado MM (2009) Thoughts on Natal Dispersal J Raptor Res 43(2): 90-
98.

142
Penteriani V, Otalor F and Ferrer M (2005) Floater survival affects population persistence.
The role of prey availability and environmental stochasticity. Oikos 108: 523-534.
Penteriani V, Otalora F, Sergio F and Ferrer M (2005) Environmental stochasticity in
dispersal areas can explain the 'mysterious' disappearance of breeding populations.
Proc R Soc B 272: 1265-1269. doi:10.1098/rspb.2005.3075.
Phipps WL, Willis SG, Wolter K and Naidoo V (2013) Foraging Ranges of Immature African
White-Backed Vultures (Gyps africanus) and Their Use of Protected Areas in
Southern Africa. PLoS ONE 8(1): e52813. doi:10.1371/journal.pone.0052813.
Pimm SL, Jones HL and Diamond J (1988) On the risk of extinction. Am Nat 132: 757-785.
Piper SE, Boshoff AF and Scott HA (1999) Modelling survival rates in the Cape Griffon Gyps
coprotheres, with emphasis on the effects of supplementary feeding. Bird Study 46:
230–238.
R Core Team (2013) R: A language and environment for statistical computing. R Foundation
for Statistical Computing, Vienna, Austria. URL http://www.R-project.org.
Reed JM (1999) The role of behavior in recent avian extinctions and endangerments.
Conserv Biol 13: 232-241.
Reid T, Krüger S, Whitfield P and Amar A (in review) Spatial analyses of Bearded Vulture
movements in southern Africa to inform wind turbine placement.
Rushworth I and Krüger S (2014) Wind farms threaten southern Africa's cliff-nesting
vultures. Ostrich 85(1): 13-23. doi:10.2989/00306525.2014.913211.
Serrano D, Carrete M and Tella J (2008) Describing dispersal under habitat constraints: a
randomization approach in Lesser Kestrels. Basic Appl Ecol 9: 771-778.

143
Smallie J, Diamond M and Jenkins A (2009) Lighting up the African continent – what does it
mean for our birds? In: Harebottle DM, Craig AJFK, Anderson MD, Rakotomanana H
and Muchai (editors) Proc 12th Pan-Afr Ornithol Cong, 2008. ADU Cape Town, pp.
38–43.
Statistics South Africa (2011) Mid-year population estimates 2011. Pretoria, South Africa:
Statistical release, P0302.
Terrasse JF, Terrasse M and Boudoint Y (1961) Observations sur la reproductions du
vautour fauve, du percnoptère et du gypaete barbu dans les Basses-Pyrénées.
Alauda 29: 1-24.
Thiollay J (2006) Severe decline of large birds in the Northern Sahel of West Africa: a long-
term assessment. Bird Conserv Int 16: 353–365.
Virani MZ, Kendall C, Njoroge P and Thomsett S (2011) Major declines in the abundance of
vultures and other scavenging raptors in and around the Masai Mara ecosystem,
Kenya. Biol Conserv 144: 746-752.
Urios V, López-López P, Limiñana R and Godino A (2010) Ranging behaviour of a juvenile
Bearded Vulture (Gypaetus barbatus meridionalis) in South Africa revealed by GPS
satellite telemetry. Ornis Fenn 87: 1-5.
Worton BJ (1989) Kernel methods for estimating the utilization distribution in home-range
studies. Ecol 70: 164-168.
Worton BJ (1995) Using Monte Carlo simulation to evaluate kernel-based home-range
estimators. J Wildl Manage 59: 794-800.
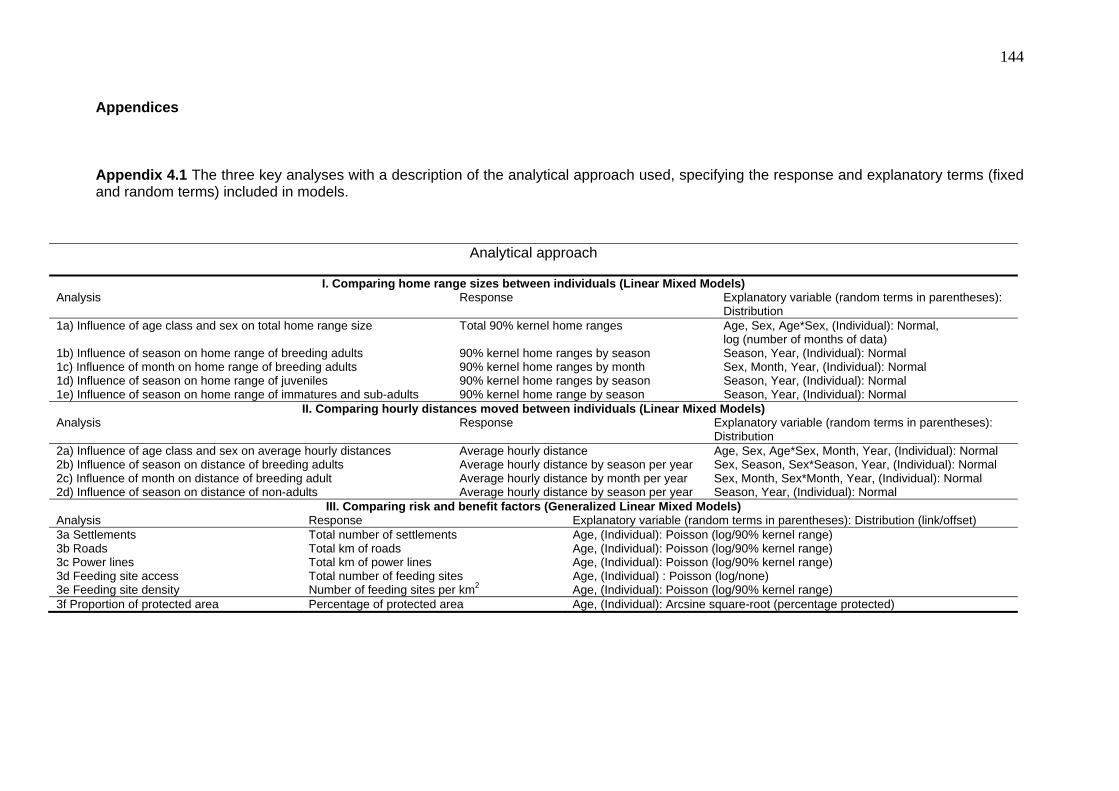
144
Appendices
Appendix 4.1 The three key analyses with a description of the analytical approach used, specifying the response and explanatory terms (fixed and random terms) included in models.
Analytical approach
I. Comparing home range sizes between individuals (Linear Mixed Models)Analysis Response Explanatory variable (random terms in parentheses):
Distribution 1a) Influence of age class and sex on total home range size Total 90% kernel home ranges Age, Sex, Age*Sex, (Individual): Normal,
log (number of months of data) 1b) Influence of season on home range of breeding adults 90% kernel home ranges by season Season, Year, (Individual): Normal 1c) Influence of month on home range of breeding adults 90% kernel home ranges by month Sex, Month, Year, (Individual): Normal 1d) Influence of season on home range of juveniles 90% kernel home ranges by season Season, Year, (Individual): Normal 1e) Influence of season on home range of immatures and sub-adults 90% kernel home range by season Season, Year, (Individual): Normal
II. Comparing hourly distances moved between individuals (Linear Mixed Models)Analysis Response Explanatory variable (random terms in parentheses):
Distribution 2a) Influence of age class and sex on average hourly distances Average hourly distance Age, Sex, Age*Sex, Month, Year, (Individual): Normal 2b) Influence of season on distance of breeding adults Average hourly distance by season per year Sex, Season, Sex*Season, Year, (Individual): Normal 2c) Influence of month on distance of breeding adult Average hourly distance by month per year Sex, Month, Sex*Month, Year, (Individual): Normal 2d) Influence of season on distance of non-adults Average hourly distance by season per year Season, Year, (Individual): Normal
III. Comparing risk and benefit factors (Generalized Linear Mixed Models)Analysis Response Explanatory variable (random terms in parentheses): Distribution (link/offset) 3a Settlements Total number of settlements Age, (Individual): Poisson (log/90% kernel range) 3b Roads Total km of roads Age, (Individual): Poisson (log/90% kernel range) 3c Power lines Total km of power lines Age, (Individual): Poisson (log/90% kernel range) 3d Feeding site access Total number of feeding sites Age, (Individual) : Poisson (log/none) 3e Feeding site density Number of feeding sites per km2 Age, (Individual): Poisson (log/90% kernel range) 3f Proportion of protected area Percentage of protected area Age, (Individual): Arcsine square-root (percentage protected)
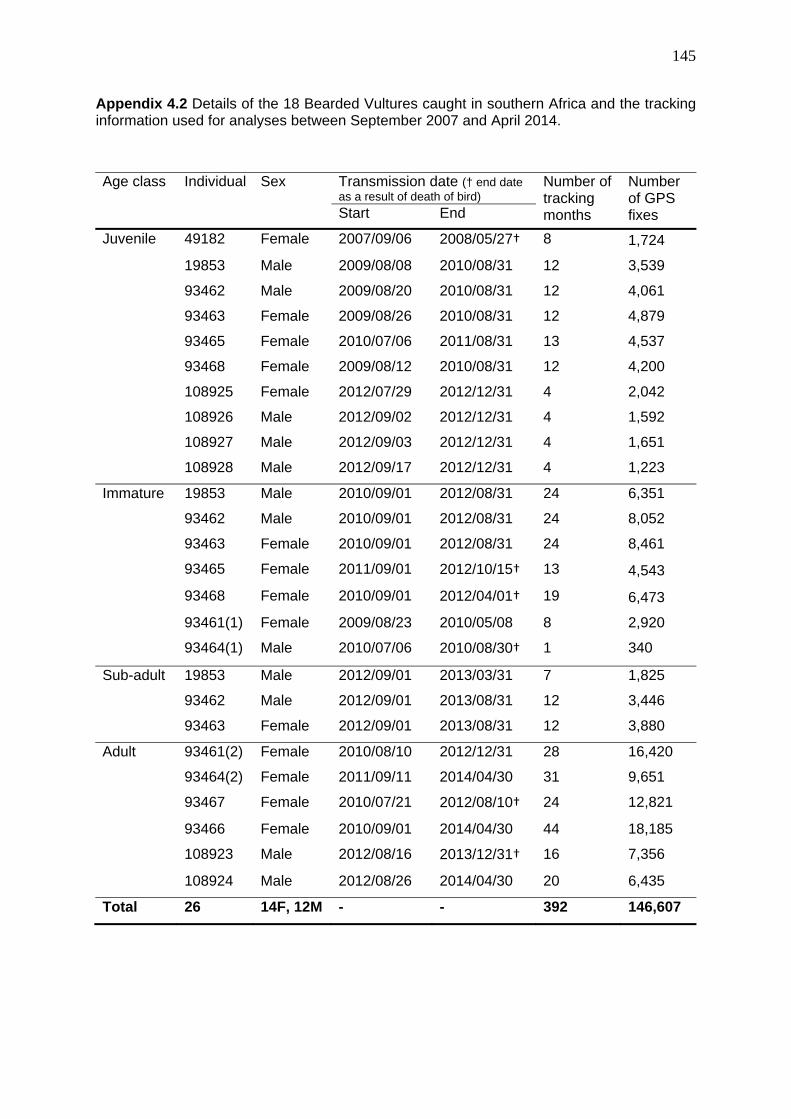
145
Appendix 4.2 Details of the 18 Bearded Vultures caught in southern Africa and the tracking information used for analyses between September 2007 and April 2014.
Age class Individual
Sex Transmission date († end date as a result of death of bird)
Number of tracking months
Number of GPS fixes Start End
Juvenile 49182 Female 2007/09/06 2008/05/27† 8 1,724
19853 Male 2009/08/08 2010/08/31 12 3,539
93462 Male 2009/08/20 2010/08/31 12 4,061
93463 Female 2009/08/26 2010/08/31 12 4,879
93465 Female 2010/07/06 2011/08/31 13 4,537
93468 Female 2009/08/12 2010/08/31 12 4,200
108925 Female 2012/07/29 2012/12/31 4 2,042
108926 Male 2012/09/02 2012/12/31 4 1,592
108927 Male 2012/09/03 2012/12/31 4 1,651
108928 Male 2012/09/17 2012/12/31 4 1,223
Immature 19853 Male 2010/09/01 2012/08/31 24 6,351
93462 Male 2010/09/01 2012/08/31 24 8,052
93463 Female 2010/09/01 2012/08/31 24 8,461
93465 Female 2011/09/01 2012/10/15† 13 4,543
93468 Female 2010/09/01 2012/04/01† 19 6,473
93461(1) Female 2009/08/23 2010/05/08 8 2,920
93464(1) Male 2010/07/06 2010/08/30† 1 340
Sub-adult 19853 Male 2012/09/01 2013/03/31 7 1,825
93462 Male 2012/09/01 2013/08/31 12 3,446
93463 Female 2012/09/01 2013/08/31 12 3,880
Adult 93461(2) Female 2010/08/10 2012/12/31 28 16,420
93464(2) Female 2011/09/11 2014/04/30 31 9,651
93467 Female 2010/07/21 2012/08/10† 24 12,821
93466 Female 2010/09/01 2014/04/30 44 18,185
108923 Male 2012/08/16 2013/12/31† 16 7,356
108924 Male 2012/08/26 2014/04/30 20 6,435
Total 26 14F, 12M - - 392 146,607

146
Appendix 4.3 Bearded Vulture ranging information showing average hourly flight distances and kernel and MCP home range sizes in km2 depicted by individual separated by age class.
Age
Individual Sex Average hourly flight distance (mean ± standard deviation)
Kernel home-range MCP home-range 90% 50%
Juvenile 49182 female 6.5 ± 1.8 (0-43.1) 27,288 6,006 33,504
19853 male 5.6 ± 0.9 (0-42.2) 9,021 2,759 17,564
93462 male 5.9 ± 0.8 (0-42.8) 15,386 3,814 31,205
93463 female 4.3 ± 0.9 (0-41.6) 6,142 1,420 18,529
93465 female 5.0 ± 0.9 (0-51.1) 16,739 4,015 32,606
93468 female 5.3 ± 1.1 (0-47.1) 9,222 2,514 16,166
108925 female 4.8 ± 0.5 (0-38.5) 6,862 1,687 13,654
108926 male 4.9 ± 0.6 (0-40.4) 6,895 1,766 17,462
108927 male 3.7 ± 0.7 (0-47.1) 3,515 1,121 5,565
108928 male 4.3 ± 0.9 (0-38.7) 4,334 1,394 7,755
Immature 19853 male 6.3 ± 1.4 (0-52.1) 25,145 7,028 48,013
93461(1) female 9.4 ± 1.7 (0-52) 36,204 11,660 47,818
93462 male 6.9 ± 1.2 (0-60.5) 23,793 6,166 46,278
93463 female 6.6 ± 1.7 (0-123) 10,789 2,542 26,368
93464(1) male 8.5 ± - (0-42.8) 18,808 5,090 20,263
93465 female 7.2 ± 1.0 (0-61.7) 23,449 6,689 35,546
93468 female 6.2 ± 1.4 (0-85.4) 14,971 3,210 34,570
Sub-adult 19853 male 7.8 ± 1.8 (0-49.2) 22,690 6,086 34,741
93462 male 8.5 ± 1.9 (0-109) 34,109 10,088 51,620
93463 female 7.0 ± 1.6 (0-56.8) 21,157 6,785 36,521
Adult 93461(2) female 4.4 ± 1.8 (0-62.8) 127 29 12,343
93464(2) female 4.5 ± 1.4 (0-81.5) 99 15 1,948
93466 female 3.3 ± 0.9 (0- 24.3) 77 11 5,680
93467 female 3.8 ± 0.9 (0-56.7) 315 63 27,245
108923 male 3.7 ± 5.3 (0-89.9) 95 14 2,798
108924 male 4.0 ± 0.8 (0-183.8) 1,000 149 62,494

147
Chapter 5: Genetic structure in the Bearded Vulture Gypaetus
barbatus: reduced diversity in southern Africa
Photo 5 Adult Bearded Vulture from the sub-species G. barbatus meridionalis (left) lacking the black ear tuft that distinguishes it from G. barbatus barbatus (right)

148
A modified form of this chapter is published in Ibis:
Krüger SC, Wesche PL and Jansen van Vuuren, B (2014) Reduced genetic diversity in Bearded Vultures Gypaetus barbatus in Southern Africa. doi: 10.1111/ibi.12200.

149
Abstract
The Bearded Vulture Gypaetus barbatus occurs globally as small and dwindling population
fragments with limited genetic differentiation amongst populations, suggesting that the
species might globally be managed as a single entity. Given that the numbers of East and
southern African Bearded Vultures included in previous studies were small, our aim here is
to determine the genetic variation within, evolutionary placement of, and connectivity
amongst sub-Saharan African populations. Mitochondrial DNA fragment analyses detected
little to no differentiation between populations in Ethiopia and southern Africa, with reduced
haplotype diversity in southern Africa compared with populations in the Northern
Hemisphere. Our results directly inform conservation management of this species globally
and locally, and provide guidelines for translocations should populations continue to decline.
Introduction
Many natural populations are becoming increasingly fragmented as a result of anthropogenic
influences. Fragmentation negatively affects population viability through loss of genetic
diversity, inbreeding, and ultimately population growth and adaptability (see e.g. Lowe et al.
2005 and references therein). A case in point concerns the Bearded Vulture Gypaetus
barbatus, a large scavenging raptor inhabiting mountainous areas across an extensive
range. In the past, the species was widely distributed throughout much of Asia, Europe and
Africa, however, its current distribution is severely fragmented. Although the species never
occurred in high numbers, trends of recent decline throughout much of its range have been
documented (Margalida et al. 2008, Birdlife International 2014, Krüger et al. 2014, Chapter
2).
Two distinct subspecies were recognized based on plumage characteristics (Hiraldo
et al. 1984, Mundy et al. 1992). G. b. barbatus occurs north of the Tropic of Cancer while G.
b. meridionalis was described from south of the Tropic of Cancer. The sub-Saharan African

150
(G. b. meridionalis) birds have similar phenotypes in that they lack a black ‘ear’ tuft and
breast collar and are smaller in size compared with their northern counterparts. Whilst a
genetic study by Godoy et al. (2004) confirmed the presence of two lineages, these had little
geographic correspondence to the described subspecies. The first lineage occurs mainly in
Western Europe while the second is found predominantly in Africa, Eastern Europe and
Central Asia. These findings led to the suggestion by Godoy and co-workers that the species
should be managed as a single population. Only a few sub-Saharan African, and specifically
southern African, samples were included in the Godoy et al. (2004) study. For this reason,
the evolutionary position of the southern (and to a lesser extent East) African populations,
and the level of connectivity (migrant exchange) between them, remains unclear.
Following recent assessments, African Bearded Vulture populations are in decline or
presumed to be declining. Ash and Atkins (2009) suspected that the Ethiopian population
was much smaller than the crude estimate by Mundy et al. (1992) of 1,430 pairs.
Populations in Kenya, Tanzania and Uganda are estimated at only 10 pairs (S. Thomsett
pers. comm.) whilst the southern African population is estimated at 109 pairs (Krüger et al.
2014, Chapter 2). The latter also suffered a significant range contraction (Boshoff et al.
1983, Krüger et al. 2014, Chapter 2).
For the long-term persistence of the Bearded Vulture in southern Africa it is essential
to maintain an adequate population size and high levels of genetic diversity. If there is some
exchange of individuals between sub-Saharan populations, genetic diversity in populations
could benefit. We therefore aim to extend the Godoy et al. (2004) study through increasing
the southern and East African (specifically Ethiopian) sample sizes. Knowledge regarding
the exact evolutionary placement of southern and East African populations, and suggestions
regarding connectivity among populations, will contribute information towards the
management of Bearded Vultures locally as well as globally.

151
Methods
Samples
Blood, tissue or feather samples for DNA analyses were collected from 40 individuals
between 2000-2012 (details provided in Appendix 5.1). Only one feather was collected at
each site to avoid possible duplication of samples from a single specimen.
DNA Isolation, Polymerase Chain Reaction (PCR) and Sequencing
DNA was extracted using a commercial DNA extraction kit (DNeasy Blood and Tissue kit;
Qiagen, Hilden, Germany). As our study follows on from the work of Godoy and co-workers,
we followed their laboratory protocols, including PCR parameters, to ensure comparable
data. Amplification was performed using the control region primers QHD-2F and Fbox-2R.
Eleven individuals (Appendix 5.1), including representatives of each haplotype identified by
the control region data were, subsequently sequenced for cytochrome b using primers
L14841 (Kocher et al. 1989) and H15915 (Irwin et al. 1991). Sequencing was performed with
BigDye® Terminator 3.1 mix (Applied Biosystems, Warrington, United Kingdom). Purified
sequencing products were run on an Applied Biosystems 3130 xl Genetic Analyzer.
Sequences were edited using Genious R6 (Biomatters, available from www.geneious.com).
Analyses
Data generated in this study were aligned with those published by Godoy et al. (2004) using
ClustalW (Larkin et al. 2007) within MEGA 6 (Tamura et al. 2013). Analyses were based on
40 samples comprising 216 base pairs. The Oriental White-backed Vulture Gyps
bengalensis was included as an outgroup (GenBank accession number EU752279, Johnson
et al. 2008).

152
As is appropriate for closely related haplotypes, we constructed a haplotype network
in TCS (Clement et al. 2000). We had to introduce a two base pair indel to ensure optimal
alignment, and followed Joly et al. (2007) in handling missing data. To support the network
analyses, we constructed phylogenetic trees in MEGA 6 under a maximum likelihood
approach. The evolutionary model that best fitted our data (the Kimura 2- parameter model,
gamma distributed with invariant sites) was determined on the basis of the Bayesian
Information Criterion (BIC) using MEGA 6. Nodal support was determined through 10,000
bootstrap replicates. To determine whether genetic diversity in the southern African/
Ethiopian samples is geographically structured, an Analysis of Molecular Variance (AMOVA)
was performed in Arlequin 3.5 (Excoffier et al. 2005). For this, we performed two analyses;
one in which we specified all populations as a single group and a second in which we
considered the Ethiopian samples separate from the southern African samples.
To assess genetic variation within the southern African region, we selected samples
from Godoy et al. (2004) as a reference group. We specifically looked for an area with
similar geographic coverage and positioning (edge of the range) and high sampling density.
The Iberian Peninsula (n=61 specimens) matched these selection criteria. We then sub-
sampled Godoy et al.’s (2004) Iberian haplotypes through 100,000 bootstrap iterations to
compare with the number of haplotypes recovered from the 37 southern African samples.
Results
Three polymorphic sites were identified in the southern African birds which defined four
haplotypes (A-D: GenBank accession numbers KM203404-7, Appendix 5.1) based on the
control region sequences. One of these, haplotype A, was identical to a published sequence
for birds collected from North Africa, Ethiopia and South Africa (haplotype 30, GenBank
accession number AJ566879, Godoy et al. 2004). The three Ethiopian Bearded Vultures all
had a single haplotype (A). Cytochrome b sequences (813 base pairs) generated for 11
specimens representative of the four control region haplotypes had an identical haplotype

153
(GenBank accession number KM203403), therefore no further analyses were conducted on
the cytochrome b data.
AMOVA indicated no significant partitioning of genetic variation when the populations
from sub-Saharan Africa were considered as a single group with 89% of the variation
accounted for by the within-population component (ΦST=0.11, P=0.11). When the Ethiopian
samples were grouped separate from the southern African samples, the largest portion of
variation remained within population (84%) with no significant variation between Ethiopia and
southern Africa (ΦCT=0.07, P=0.28).
For the bootstrap analysis, sampling 37 individuals from southern Africa should have
recovered an average of 7.86 different haplotypes if diversity in southern Africa was the
same as on the Iberian Peninsula. Our finding of only four control region haplotypes (A-D)
suggests a significant deficit in haplotype diversity in southern Africa (P=0.0025).
The haplotype network is presented in Figure 5.1. Our four haplotypes were closely
related with three mutational steps separating the two most divergent haplotypes (D and B).
The haplotypes retrieved in the current study group closely with haplotypes from birds
sampled in North Africa, southern Africa and Ethiopia (AJ566879, haplotype 30, Godoy et al.
2004, our haplotype A) and Ethiopia (AJ566878, haplotype 29, Godoy et al. 2004). The
haplotype network corresponded well with the maximum likelihood topology in Appendix 5.2.
Discussion
The evidence presented here suggests that apart from the known environmental threats to
Bearded Vultures in southern Africa (Krüger et al. 2006, Chapter 6), genetic diversity is
already considerably reduced. Uncertainties also exist regarding the number of subspecies
or Evolutionarily Significant Units that should be recognized and the connectivity amongst
regional populations, an important consideration in the management of the species.

154
Figure 5.1 Haplotype network demonstrating the relationships between haplotypes generated by Godoy et al. (2004) and the present study. Haplotypes generated in the present study are indicated in grey shading. Haplotypes generated by Godoy et al. (2004) are shaded by sampling location and all have the prefix ‘AJ566’. For details on haplotypes A to D refer to Appendix 5.1.
A
BC
D
African
Asian
EuropeanIDIDID
ID Multiregional
Legend
885
852 891884
888 896
860887865
883
882
876
850
870
890
886
874
873
851
892
889
878
866
861
868
871
898
869863
880
867 858 894 881
877
875 857
895
897853862
893855
859
856
899872 864

155
Our samples from Ethiopia and southern Africa group with samples from Africa, Europe,
Asia and the Middle East. This clustering resolves the uncertainties of the Godoy et al.
(2004) study, and strengthens their suggestion that Bearded Vultures should be managed as
a single panmictic population due to the absence of significant differences in life history
traits, morphology, habitat, behaviour or genetics across geographic regions. Although it
may be difficult to conceive of high levels of connectivity between populations in Africa south
of the Sahara Desert and Europe/Asia, these results, based on a mitochondrial marker, are
unambiguous. The haplotype network suggests that the African haplotypes, particularly type
A, are major links within the network and may well link the two clades identified by Godoy et
al. (2004). This diversity pattern hints at Africa being the ancestral population, with the
possibility that the movement of birds took place across the Horn of Africa (Somali
Peninsula) rather than directly across the desert.
The southern African population is subject to a range of threats that are resulting in a
continued decline (Krüger et al. 2006, Krüger et al. 2014, Chapters 2, 3 and 4). The low
diversity at the mitochondrial level suggests these threats have had a real impact on the
genetics of this critically endangered population. Similar levels of low genetic variability
(haplotype diversity) have been found in other endangered raptors such as the Bonelli’s
Eagle Hieraaetus fasciatus (Cadahía et al. 2007), the Spanish Imperial Eagle Aquila
adalberti (Martínez-Cruz et al. 2004), and the Black Harrier Circus maurus (Fuchs et al.
2014) and more specifically in other vultures; the Eurasian Black Vulture Aegypius
monachus (Poulakakis et al. 2008), Egyptian Vulture Neophron percnopterus (Kretzmann et
al. 2003) and Old World vultures (Lerner and Mindell 2005). These low levels of diversity
have been ascribed to recent demographic declines mainly as a result of human pressure or
population fragmentation. Other factors that may explain the low diversity in a population
include small population size, drastic population size fluctuations over time, limited time
since it diverged from its closest relative for genetic variation to appear, long term isolation
from the East African population, repeated bottlenecks and a selective sweep (Roques and
Negro 2005, Fuchs et al. 2014). The most likely explanation for the low diversity in the
156
southern African population is the drastic range reduction experienced by the population
over the past three centuries attributed to anthropogenic factors resulting in a low effective
population size (see Chapters 3 and 4). As such, significant concerns exist regarding the
long-term viability and management of this isolated population.
Reduced diversity may decrease the population’s fitness or limit the long term
capacity of the population to respond to environmental challenges or chance environmental
or demographic events in the short term and thus affecting survival and reproduction
(Alexandre et al. 2007) in the long term. Therefore, for the long term persistence of the
Bearded Vulture in southern Africa it is essential to maintain an adequate population size
and high levels of genetic diversity.
Although translocations are not currently part of the management of this population,
the possibility of augmenting the southern African population has been considered. From
previous translocations in Europe, it is clear that this could be an effective management
strategy (see Hirzel et al. 2004, Schaub et al. 2009). Given that the Ethiopian population
appears to be large (Mundy et al. 1992) and shares an otherwise unique haplotype with
southern Africa, individuals from Ethiopia may be used to supplement the southern African
population in areas where the habitat is suitable.
Major changes to the management strategy of a species threatened with extinction
should be carefully deliberated based on several lines of evidence. Although the
mitochondrial DNA shows that birds from southern Africa and Ethiopia share haplotypes, it is
imperative to add nuclear markers which will further inform questions such as whether
connectivity between East and southern Africa is ongoing (gene flow), whether populations
are inbred, as well as whether nuclear diversity is similarly low.
The information presented here is vital in guiding management decisions on the
future of Bearded Vultures in southern Africa, and the consideration of exchange of
individuals with other countries to ensure that sufficient genetic variability is maintained.

157
Further management options of increasing population size by maximizing the reproductive
rate through improving the environment and protecting the population from environmental
changes, disease and persecution must also be considered.
Acknowledgements
Rina Groenewald and the Central Analytical Facility at Stellenbosch University are thanked
for assistance with the laboratory work. This work was financially and logistically supported
by stipends from the DST-NRF Centre of Excellence for Invasion Biology and Ezemvelo
KwaZulu-Natal Wildlife. Paulette Bloomer is thanked for providing primers. Arjun Amar,
Rebecca Kimball, Rauri Bowie and an anonymous reviewer are thanked for their comments
on the manuscript.
References
Alexandre R, Couvet D and Sarrazin F (2007) Integration of demography and genetics in
population restorations. Ecoscience 14: 463–471. doi:10.2980/1195-6860(2007)14
[463: IODAGI]2.0.CO;2.
Ash J and Atkins J (2009) Birds of Ethiopia and Eritrea: An Atlas of Distribution. Christopher
Helm, London.
Birdlife International. (2014) IUCN Red List for birds. Downloaded from
http://www.birdlife.org on 05/08/2014.
Boshoff AF, Vernon CJ and Brooke RK (1983) Historical atlas of the diurnal raptors of the
Cape Province (Aves: Falconiformes). Ann Cape Prov Mus (Nat Hist Ser) 14: 173-
297.

158
Cadahía L, Negro LL and Urios V (2007) Low mitochondrial DNA diversity in the endangered
Bonelli’s Eagle (Hieraaetus fasciatus) from SW Europe (Iberia) and NW Africa. J
Ornithol 148: 99–104.
Clement M, Posada D and Crandall KA (2000) TCS: a computer program to estimate gene
genealogies. Mol Ecol 9: 1657-1659.
Excoffier L, Laval G and Schneider S (2005) Arlequin ver. 3.0: An integrated software
package for population genetics data analysis. Evol Bioinform Online 1: 47-50.
Fuchs J, Simmons RE, Mindell DP, Bowie RCK and Oatley G (2014) Lack of mtDNA genetic
diversity in the Black Harrier Circus maurus, a Southern African endemic. Ibis 156:
227–230.
Godoy JA, Negro JJ, Hiraldo F and Donázar JA (2004) Phylogeography, genetic structure
and diversity in the endangered bearded vulture (Gypaetus barbatus, L.) as revealed
by mitochondrial DNA. Mol Ecol 13: 371-390.
Hiraldo F, Delibes M and Calderón J (1984) Comments on the taxonomy of the bearded
vulture Gypaetus barbatus (Linnaeus, 1758). Bonn Zool Beitr 35: 91-95.
Hirzel AH, Posse B, Oggier P-A, Crettenand Y, Glenz C and Arlettaz R (2004) Ecological
requirements of reintroduced species and the implications for release policy: the case
of the bearded vulture. J Appl Ecol 41: 1103-1116.
Irwin DM, Kocher TD and Wilson AC (1991) Evolution of the Cytochrome b Gene of
Mammals. J Mol Evol 32: 128-144.
Johnson JA, Gilbert M, Virani MZ, Asim M and Mindell DP (2008) Temporal genetic analysis
of the critically endangered oriental white-backed vulture in Pakistan. Biol Conserv
141: 2403-2409.
Joly S, Stevens MI and Jansen van Vuuren B (2007) Haplotype networks can be misleading
in the presence of missing data. Syst Biol 56: 857-862.

159
Kocher TD, Thomas WK, Meyer A, Edwards SV, Paabo S, Villablanca FX and Wilson AC
(1989) Dynamics of mitochondrial DNA evolution in animals: amplification and
sequencing with conserved primers. Proc Natl Acad Sci USA 86: 6196-6200.
Kretzmann MB, Capote N, Gautschi B, Godoy JA, Donázar JA and Negro JJ (2003)
Genetically distinct island populations of the Egyptian vulture (Neophron
percnopterus). Conserv Gen 4: 697–706.
Krüger S (in press) Bearded Vulture. In: Taylor MR (editor) The Eskom Red Data Book of
Birds of South Africa, Lesotho and Swaziland. BirdLife South Africa, Johannesburg.
Krüger S, Piper S, Rushworth I, Botha A, Daly B, Allan D, Jenkins A, Burden D and
Friedmann Y (editors) (2006) Bearded Vulture (Gypaetus barbatus meridionalis)
Population and Habitat Viability Assessment Workshop Report. Conservation
Breeding Specialist Group (SSC/IUCN)/CBSG Southern Africa, Endangered Wildlife
Trust, Johannesburg.
Krüger SC, Allan DG, Jenkins AR and Amar A (2014) Trends in territory occupancy,
distribution and density of the Bearded Vulture Gypaetus barbatus meridionalis in
southern Africa. Bird Conserv Int 24: 162-177. doi:10.1017/S0959270913000440.
Larkin MA, Blackshields G, Brown NP, Chenna R, McGettigan PA, McWilliam H, Valentin F,
Wallace IM, Wilm A, Lopez R, Thompson JD, Gibson TJ and Higgins DG (2007)
Clustal W and Clustal X version 2.0. Bioinformatics 23: 2947-2948.
Lerner HRL and Mindell DP (2005) Phylogeny of eagles, Old World vultures, and other
Accipitridae based on nuclear and mitochondrial DNA. Mol Phyl Evol 37: 327–346.
Lowe AJ, Boshier D, Ward M, Bacles CFE and Navarro C (2005) Genetic resource impacts
of habitat loss and degradation; reconciling empirical evidence and predicted theory
for neotropical trees. Heredity 95: 255-273.

160
Margalida A, Heredia R, Razin M and Hernandez M (2008) Sources of variation in mortality
of the Bearded Vulture Gypaetus barbatus in Europe. Bird Conserv Int 18: 1-10.
Martínez-Cruz B, Godoy JA and Negro JJ ( 2004) Population genetics after fragmentation:
the case of the endangered Spanish imperial eagle (Aquila adalberti). Mol Ecol 13:
2243–2255.
Mundy P, Butchart D, Ledger J and Piper S (1992) The Vultures of Africa. Russel Friedman
Books cc, Johannesburg.
Poulakakis N, Antoniou A, Mantziou G, Parmakelis A, Skartsi T, Vasilakis D, Elorriaga J, de
la Puente J, Gavashelishvili A, Ghasabyan M, Katzner T, McGrady M, Batbayar N,
Fuller M and Natsagdorj T (2008) Population structure, diversity, and phylogeography
in the near-threatened Eurasian black vultures Aegypius monachus (Falconiformes;
Accipitridae) in Europe: insights from microsatellite and mitochondrial DNA variation.
Biol J Linn Soc 95: 859–872.
Roques S and Negro JJ (2005) MtDNA genetic diversity and population history of a
dwindling raptorial bird, the red kite (Milvus milvus). Biol Conserv 126: 41–50.
Schaub M, Zink R, Beissmann H, Sarrazin F and Arlettaz R (2009) When to end releases in
reintroduction programmes: demographic rates and population viability analysis of
bearded vultures in the Alps. J Appl Ecol 46: 92-100.
Tamura K, Stecher G, Peterson D, Filipski A and Kumar S (2013) MEGA6: Molecular
Evolutionary Genetics Analysis Version 6.0. Mol Biol Evol 30: 2725-2729.

161
Appendices
Appendix 5.1 Summary list of samples used in this study. The southern African samples were collected by S.C. Krüger in the KwaZulu-Natal (KZN), Free State and Eastern Cape provinces of South Africa and the Maseru, Thaba-Tseka and Mokhotlong Districts of Lesotho. Ethiopian samples were provided by the Peregrine Fund.
Sample ID Locality Country Year Tissue Haplotype*
BV001 Southern Drakensberg, KZN South Africa 2006 blood B BV002† Southern Drakensberg, KZN South Africa 2007 blood B BV003 Southern Drakensberg, KZN South Africa 2007 blood A BV004† Southern Drakensberg, KZN South Africa 2009 blood D BV005† Southern Drakensberg, KZN South Africa 2010 blood B BV006† Southern Drakensberg, KZN South Africa 2009 blood B BV007† Maseru District Lesotho 2012 blood B BV008 Southern Drakensberg, KZN South Africa 2009 blood D BV009† Northern Drakensberg, KZN South Africa 2011 blood C BV010 Northern Drakensberg, KZN South Africa 2010 blood A BV011 Free State Province South Africa 2004 feather C BV012 Central Drakensberg, KZN South Africa 2002 muscle B BV013† Thaba-Tseka District Lesotho 2008 muscle D BV014 Central Drakensberg, KZN South Africa 2009 muscle D BV015† Southern Drakensberg, KZN South Africa 2011 blood B BV016† Southern Drakensberg, KZN South Africa 2009 blood A BV017 Mokhotlong District Lesotho 2008 blood B BV018 Southern Drakensberg, KZN South Africa 2009 blood A BV019 Southern Drakensberg, KZN South Africa 2003 feather B BV020 Mokhotlong District Lesotho 2007 feather B BV021 Northern Drakensberg, KZN South Africa 2011 feather A BV022 Central Drakensberg, KZN South Africa 2008 feather B BV023 Northern Drakensberg, KZN South Africa 2009 feather D BV024 Southern Drakensberg, KZN South Africa 2010 feather B BV025 Southern Drakensberg, KZN South Africa 2000 feather B BV026 Southern Drakensberg, KZN South Africa 2007 feather B BV027 Southern Drakensberg, KZN South Africa 2010 feather A BV028 Southern Drakensberg, KZN South Africa 2010 feather A BV029 Northern Drakensberg, KZN South Africa 2010 feather C BV030 Southern Drakensberg, KZN South Africa 2009 feather B BV031 Ethiopia Ethiopia 2001 blood A BV032 Ethiopia Ethiopia 2001 blood A BV033 Ethiopia Ethiopia 2001 blood A BV034 Central Drakensberg, KZN South Africa 2012 feather A BV035 Eastern Cape Province South Africa 2012 muscle B BV036 Northern Drakensberg, KZN South Africa 2012 blood A BV037† Central Drakensberg, KZN South Africa 2012 blood D BV038 Northern Drakensberg, KZN South Africa 2012 blood A BV039 Central Drakensberg, KZN South Africa 2012 blood A BV040† Central Drakensberg, KZN South Africa 2012 blood C
*Haplotype A was identical to Haplotype 30, GenBank accession number AJ566879, Godoy et al. (2004). †Sub-sample of individuals for which Cytochrome b sequences (813 base pairs) were generated.

162
Appendix 5.2 Maximum likelihood topology generated under the evolutionary model that best fitted the data. Haplotypes A to D represent those detected in the present study while GenBank accession numbers are given for haplotypes generated by Godoy et al. (2004). Nodes that are supported by more than 70% bootstrap support (derived from 10,000 replicates) are indicated by *.
AJ566880 31 Sardinia AlpsYemen
AJ566867 18 Spain
AJ566881 32 Alps
AJ566894 45 Greece
AJ566877 28 Crete
AJ566875 26 Crete
AJ566858 9 Crete
AJ566865 16 East
AJ566857 8 East
AJ566888 39 Asia
AJ566879 30 NorthSouthAfricaEthiopia
AJ566878 29 Ethiopia
AJ566868 19 East
AJ566861 12 Asia
AJ566871 22 East
AJ566869 20 Greece
AJ566898 49 Asia
AJ566863 14 East
AJ566860 11 East
AJ566887 38 Asia
AJ566896 47 Caucasus
AJ566854 5 East
AJ566866 17 East
AJ566872 23 Asia
AJ566862 13 Asia
AJ566859 10 SpainEast
AJ566853 4 Asia
AJ566855 6 East
AJ566899 50 Caucasus
AJ566856 7 East
AJ566895 46 Greece
AJ566893 44 Greece
AJ566897 48 Asia
AJ566864 15 East
AJ566892 43 AlpsNorthAfrica
AJ566889 40 Alps
AJ566870 21 East
AJ566850 1 AlpsSpainSardinia
AJ566876 27 SpainAlpsCaucasusNorthAfrica
AJ566886 37 Crete
AJ566874 25 SpainGreece
AJ566883 34 SpainAlpsCaucasus
AJ566852 3 Spain
AJ566890 41 Sardinia
AJ566891 42 Sardinia
AJ566882 33 SardiniaAlpsAsia
AJ566885 36 SpainAlpsCaucasus
AJ566884 35 SpainAlpsCaucasus
AJ566873 24 SpainAlps
AJ566851 2 Spain
0.01
*
*
**
BA
CD
Clade I
Clade II

163
Chapter 6: Poisoning increases the extinction risk of the
Bearded Vulture Gypaetus barbatus in southern
Africa
Photo 6 A selection of Bearded Vultures found dead from poisoning (left) and power line collisions (right)

164
Chapter 5 will be submitted to Oryx.
Krüger SC and Amar A. Poisoning increases the extinction risk of the Bearded Vulture Gypaetus barbatus in southern Africa.
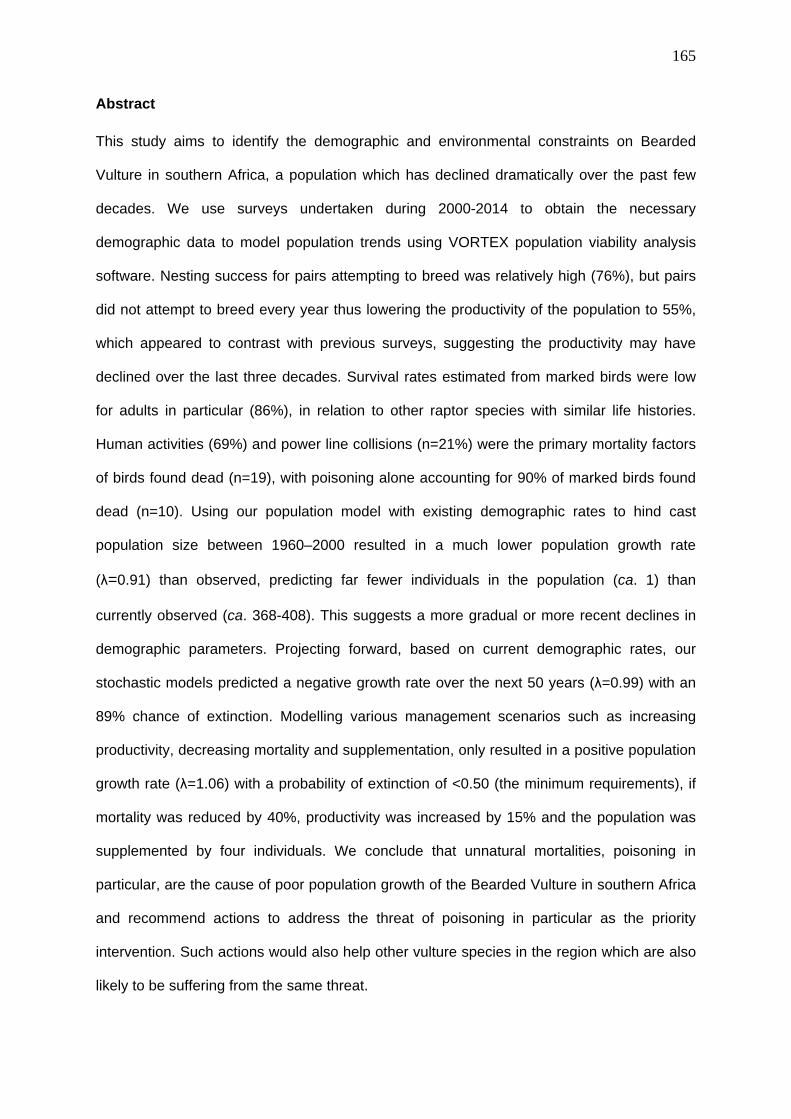
165
Abstract
This study aims to identify the demographic and environmental constraints on Bearded
Vulture in southern Africa, a population which has declined dramatically over the past few
decades. We use surveys undertaken during 2000-2014 to obtain the necessary
demographic data to model population trends using VORTEX population viability analysis
software. Nesting success for pairs attempting to breed was relatively high (76%), but pairs
did not attempt to breed every year thus lowering the productivity of the population to 55%,
which appeared to contrast with previous surveys, suggesting the productivity may have
declined over the last three decades. Survival rates estimated from marked birds were low
for adults in particular (86%), in relation to other raptor species with similar life histories.
Human activities (69%) and power line collisions (n=21%) were the primary mortality factors
of birds found dead (n=19), with poisoning alone accounting for 90% of marked birds found
dead (n=10). Using our population model with existing demographic rates to hind cast
population size between 1960–2000 resulted in a much lower population growth rate
(λ=0.91) than observed, predicting far fewer individuals in the population (ca. 1) than
currently observed (ca. 368-408). This suggests a more gradual or more recent declines in
demographic parameters. Projecting forward, based on current demographic rates, our
stochastic models predicted a negative growth rate over the next 50 years (λ=0.99) with an
89% chance of extinction. Modelling various management scenarios such as increasing
productivity, decreasing mortality and supplementation, only resulted in a positive population
growth rate (λ=1.06) with a probability of extinction of <0.50 (the minimum requirements), if
mortality was reduced by 40%, productivity was increased by 15% and the population was
supplemented by four individuals. We conclude that unnatural mortalities, poisoning in
particular, are the cause of poor population growth of the Bearded Vulture in southern Africa
and recommend actions to address the threat of poisoning in particular as the priority
intervention. Such actions would also help other vulture species in the region which are also
likely to be suffering from the same threat.

166
Introduction
Populations that are small and geographically isolated have a heightened extinction risk
(Gaston 1994). Population size has been shown to be the major determinant of persistence
in populations of a variety of animal species (Brown 1971, Jones and Diamond 1976,
Diamond et al. 1987, Pimm et al. 1993, Soulè et al. 1988, Rosenzweig 1995, Foufopoulos
and Ives, 1999). Small populations are more vulnerable to demographic stochasticity, local
catastrophes, slow rates of adaptation and inbreeding (Brown 1995, Lande 1999). In
addition species with low reproductive rates are less able to compensate for increased
mortality with increased fecundity, making them more vulnerable to population extinction
(MacArthur and Wilson 1967, Saether and Bakke 2000).
Populations of large raptors in particular are sensitive to reductions in demographic
rates, notably survival rates (Smart et al. 2010), particularly when their populations are small.
Vultures are among the most endangered raptors, partly due to their extremely low
reproductive rates (Newton 1998, Ogada et al. 2012). The Bearded Vulture population in
southern Africa is a geographically isolated population restricted to the Maloti-Drakensberg
mountains. The population has declined in distribution, density and territorial occupancy in
the past few decades (Krüger et al. 2014a, Chapter 2). As a result the species has been
uplisted to Critically Endangered in South Africa and Lesotho (Krüger in press) indicating
that it faces an extremely high risk of extinction in the wild as a result of a reduction in
population size and geographic range and the continuing threats to the species (IUCN
2001). In this chapter, we examine the demographic parameters of this population including
age structure, nesting success and survival rates and use these parameters to quantify the
extinction risk of the population, identify the mechanisms responsible and set conservation
priorities to address the decline.
Population viability analysis (PVA) provides a quantitative means for predicting the
probability of extinction and prioritizing conservation needs by determining which
demographic parameters are most influential in population persistence (Shaffer 1981, Gilpin

167
and Soulè 1986, Beissinger and McCullough 2002). A simple PVA was undertaken for the
southern African Bearded Vulture in 2006 (Krüger et al. 2006). However the lack of reliable
and current data made it difficult to produce accurate population projections. This study aims
to address these previous gaps in knowledge enabling us to improve on the original
modelling exercise and calculate a more realistic population growth rate and explore which
conservation interventions might successfully reverse this declining trend.
Population growth rates are primarily influenced by natality and mortality. In long
lived raptor species population growth is usually most sensitive to mortality rates. Therefore
in this study we explore the primary causes of mortality. An investigation into the decline of
the Bearded Vulture in the 1980s determined that poisoning was the primary mortality factor
as well as gin traps and direct persecution (Brown 1991). More recent reports suggest that
poisoning still affects vultures (Boshoff et al. 1998). This poisoning is linked to traditional
medicine (Ngwenya 2001, Mander et al. 2007), scavenger control (Brown 1991) and the
assumed threat of vultures to livestock in Lesotho (S. Zwakala pers. comm.). Collisions with
power lines were found to be a minor cause of mortality in the past, accounting for less than
10% of deaths in southern Africa (Brown 1991) and 18% of deaths in Europe (Margalida et
al. 2008). Mortality rates from power line collisions are likely to be higher than recorded
because of the expanding transmission and distribution networks (Kalipeni 1994, Energy
Sector Policy of the AfDB group 2012) and the fact that collision carcasses are often not
found because of the inaccessible terrain and the carcasses landing some distance away
from the lines or being scavenged. We investigate the current mortality factors by assessing
the fate of GPS tracked individuals. Although the proportion of tracked individuals in the
population is low, the sample size does provide an indication of the causes and rates of
mortality. These data combined with age distribution data from feeding sites, also provide an
indication of age specific survivorship rates.
In this chapter we also explore nesting success which is an important component of
natality. Krüger et al. (2014a, Chapter 2) suggested that anthropogenic influences were

168
driving the abandonment of Bearded Vulture territories, particularly on the periphery of the
breeding range. In Chapter 3 we investigated the mechanisms of territorial abandonment
and found strong support for anthropogenic factors, particularly the density of power lines
and settlements driving the decline. Neither study, however, investigated the productivity of
the population although both recognized that lower recruitment could in theory be the
mechanism of these findings, with the population shrinking back to their core range with sub-
optimal territories being abandoned. Understanding levels of productivity, particularly in
relation to historic rates, could usefully illuminate how relevant this demographic parameter
is to the overall population decline. Historical breeding records of the southern African
Bearded Vulture population indicate that several monitored pairs bred annually (Penzhorn
1969). Subsequent records indicate that all monitored pairs attempted to breed annually with
a relatively high nesting success rate (0.89 young/pair/year) (Brown 1997). In other parts of
their global range, however, the species does not breed every year and has an average
nesting success rate of 0.60 young/pair/year (Brown 1977, Brown et al. 1982, Heredia 1991,
Terasse 1991, Margalida et al. 2003).
In this study we aim to establish several key demographic parameter estimates and
then combine these in a PVA. We aim to improve our current estimates for 1) age structure
2) age specific survival rates, 3) nesting success (and whether this has changed from
historical records), and 4) causes of mortality. We estimate the likely future population
growth rate with these current demographic rates, and lastly we identify the most plausible
conservation interventions required to achieve the minimum conservation objectives stated
in the Biodiversity Management Plan for the species (Krüger 2013), specifically to stabilise
the population in the short term.
Methods
We monitored the Bearded Vulture population in southern Africa from 2000-2014 throughout
its range with the emphasis on detecting territorial pairs through aerial and foot surveys of

169
breeding sites (Kruger et al. 2014a), determining the age class structure of the population
through foot and vehicle surveys, and recording mortalities of marked birds. In order to
obtain a more representative sample of territory status and age structure, surveys were
conducted in both the core and periphery of the species’ range. The core range (Figure 6.1)
focussed on the breeding portion of the population and was defined as the area containing
territories occupied by Bearded Vulture (n=109 from Krüger et al. 2014a, Chapter 2) that
were surrounded by at least five quarter degree squares that contained occupied Bearded
Vulture territories.
Figure 6.1 The location of road survey routes (꞊꞊) and foot survey routes (●▐) in relation to the core breeding range (--) within the Maloti Drakensberg mountains of Lesotho and South Arica.

170
Age Structure
The percentage of non-adults in the population was required to more accurately estimate the
current population size and was calculated from foot surveys undertaken in the core
breeding range and vehicle surveys performed throughout the range (Figure 6.1). Each
Bearded Vulture recorded during the two survey methods was classed as either a non-adult
(post-fledging to <6 years) or an adult (≥6 years), based on plumage characteristics; with
non-adults primarily dark in colour and adults easily identified by their orange coloured chest
and white head (Figure 4.2). Since the habitat and topography were similar in all regions, it
was assumed that ‘visibility’ of the birds was similar throughout.
Foot surveys (n=169 observation hours) were conducted in 2012 following the
method of Brown (1992) and Krüger et al. (2014a, Chapter 2) with the number of individuals
and their ages recorded along with the duration of the survey. Vehicle surveys were also
conducted in 2012 following the method of Brown (1992) with the number of individuals and
their ages recorded along with the distance and the duration of each vehicle survey. The
average speed of travel during vehicle surveys was 20 km/h. A total of 2,231 km of vehicle
surveys were driven; 816 km in July in the Lesotho highlands west of the Senqu River, 799
km in September in Lesotho east of the Senqu River, and 616 km in December in the
northern part of the Eastern Cape (Figure 6.1). These surveys were conducted by S. Krüger
who was accompanied by the original historical surveyor (C. Brown) for the first survey
which further ensured consistencies between the two survey periods.
Although surveys were also conducted at supplementary feeding sites (n=108
observation days), we chose to exclude these data from our calculations because Margalida
et al. (2011) found that surveys at supplementary feeding sites did not reflect the age
structure of the Bearded Vulture population and significantly over-estimated the proportion of
juveniles and under-estimated the numbers of sub-adults and adults.
Although the survey methods to obtain age structure were similar to those of Brown
(1997), we were not able to infer the proportion of young birds in the population based on

171
inter-nest distances as per his method because our data showed that the proportion of non-
adults in an area was not inversely related to the density of adult birds. We therefore
calculated the age structure using a weighted average percentage of non-adults sighted
during foot and vehicle counts. We expected our foot count data to bias the results by only
being conducted in the core range where the proportion of adults is likely to be over-
estimated. Since the core range constituted over half (56%) of the total range and since the
survey effort/total number of birds sighted in the core range was twice that of the vehicle
counts, we used a weighting of 1(foot counts): 4 (vehicle counts) when calculating the
average percentage of non-adults.
Productivity
We calculated the productivity of the population using data collected on breeding activity
between 2000-2014 at the 109 territories occupied by Bearded Vulture in southern Africa.
The criteria used to classify the breeding activity described below are summarized in Table
6.1. In any one year, we defined an occupied territory as one where at least one adult was
flushed off the cliff or seen flying or roosting in the area, entering a pothole or overhang on
the cliff; if a chick or fledgling was seen; or if there was fresh whitewash and plant material
(sticks) on the nest indicating recent use attributed to this species based on the location of
the whitewash and the type of nest structure (see also Krüger et al. 2014a, Chapter 2).
Territories where no activity had been recorded for at least four consecutive years were
considered abandoned (see also Krüger et al. 2014a, Chapter 2) and were not included in
the calculation of laying rate and nesting success (as described below).
We measured productivity at the population level as the mean number of fledglings
raised per territorial pair (occupied territory), including breeding failures and taking into
account that no more than one nestling could be reared per breeding attempt (Ferrer et al.
2014). For this long-lived raptor that maintains the same territory throughout the year and
does not necessarily breed every year (see Chapter 4), there can be a large difference

172
between nesting success per territorial pair and nesting success per laying pair. For this
reason, our productivity calculations took into account; i) laying rate- defined as the number
of years with egg laying per number of monitored years per occupied territory (as defined by
Ferrer et al. 2014), and ii) nesting success- defined as the proportion of laying pairs that
raise young to the age of fledging (Steenhof and Newton 2007).
Table 6.1 Classification criteria for determining Bearded Vulture productivity in southern Africa. Criteria are based on the definitions provided by Steenhof and Newton (2007) and methods used by Krüger et al. (2014a, Chapter 2) and Ferrar et al. (2014) to determine the fecundity of Bearded Vulture in the Spanish Pyrenees.
Classification Criteria
Occupied territory Presence of at least one adult flying or roosting in the area or
entering a pothole; or a chick/fledgling; or fresh whitewash and plant
material (sticks) on the nest
Abandoned territory A territory where no activity was recorded for at least four
consecutive years
Territorial pair Two adult birds present in an occupied territory
Laying pair Two adults in an occupied territory that appeared to be paired or
one or more adults engaged in territorial defence, nest affinity, or
other reproductive-related activity
Laying rate Number of years with egg laying per number of monitored years
Nesting success Proportion of laying pairs that raise young to the age of fledging
Productivity Mean number of fledglings raised per territorial pair, including
breeding failures and taking into account that no more than one
nestling could be reared per breeding attempt (= % laying rate x %
nesting success/100)
Data on productivity was obtained from both ground and aerial helicopter surveys. Ground
surveys were undertaken primarily on foot, and by road, using 20-60 X telescopes at
between 200–1,000 m. Breeding territories were observed between first and last light for an
average of four hours or until the type of breeding activity was confirmed. Aerial helicopter
surveys were undertaken at approximately 100-500 m from the cliff edge at an average

173
flying speed of 70-80 km/h with a minimum of two observers looking out of the port side of
the aircraft.
Year-to-year fluctuations in nesting success and productivity are common in raptors
(Steenhof and Newton 2007) therefore in order to reduce ‘measurement error’ (the
misclassification of the status of a particular pair or breeding territory as a result of field
situation, weather or observer inexperience) we used only occupied territories that had been
surveyed at least seven times during the 14 survey years (i.e. ≥50%, n=41). Territories were
surveyed in both the core and periphery of the breeding range to reduce sampling error
which may occur when the pairs observed are not representative of the entire population.
Laying activity was confirmed if an occupied territory contained two birds that
appeared to be paired or one or more adults engaged in territorial defence, nest affinity, or
other reproductive-related activity. To calculate nesting success we used only data from
occupied territories known to have laying pairs that were visited more than once during the
breeding season (n=35) to avoid the danger of distorting the conclusions by using
incomplete records. Nest checks had to be during the pre-laying or incubation stage and at
the late-nestling or fledging stage to examine final nesting success measures.
Estimation of Survival Rates
We estimated age specific survival rates using data from birds marked with tracking devices.
In total, twenty four birds were fitted with satellite Platform Transmitter Terminals (PTTs)
between September 2007 and September 2012 in the Maloti-Drakensberg region of Lesotho
and South Africa (see also Chapter 4). Four nestlings were fitted with 45 g solar-powered
GPS-PTTs (North Star Science and Technology, LLC, Virginia, USA) prior to fledging and 20
individuals were caught at supplementary feeding sites and fitted with 70 g solar-powered
GPS-PTT-100s (Microwave Telemetry Inc., Maryland, USA).
174
We chose months as our sampling unit to calculate survival rates because of the
small sample size of marked individuals. We classified whether an individual was alive in a
given month from date of marking based on GPS fixes received during that month up to and
including July 2014. Only months that had data for the entire month were used. Our survival
models included seven age classes. We calculated annual percentage survival per age class
using: (ϕa7 = d/m)*12*100; where ϕ is survival rate, a7 is age in seven age classes (0->6
years), d is the number of mortalities per age class and m is the number of months an
individual was alive summed per age class which was multiplied by 12 to obtain an annual
survival estimate and multiplied by 100 to convert this from a proportion into a percentage.
We used 200 bootstrap replicates to generate standard deviations for age specific survival
rates because of the small sample size of marked birds.
Quantifying Causes of Mortality
We collated all available information on the causes of mortality of Bearded Vultures found
dead during the study period (2000-2014) including mortalities of both marked and
unmarked birds. Using causes of mortality from marked birds alone is the best way to obtain
unbiased data, although as a result sample size is usually compromised (González et al.
2007). We therefore included additional mortality records from databases of Ezemvelo
KwaZulu-Natal Wildlife and the Wildlife Conflict Mitigation and Wildlife and Energy
Programmes of the Endangered Wildlife Trust as well as information from questionnaire
surveys undertaken in South Africa (Hiltunen 2008, Mander et al. 2007) and Lesotho (S.
Piper, M. Shobana and S. Zwakala pers. comm.). Although estimating mortality causes from
numbers of dead animals can be biased (Schaub and Pradel 2004), these data together with
data from marked birds will provide the best possible indication of causes of mortality.
Where possible cause of death was established or confirmed by an autopsy which
included X-Rays and toxicology, pathology, histology and mineral analysis tests. Individuals
found dead were tested for pesticides/poisons as well as lead (Pb) levels in the bone. Bone

175
lead levels represent repeated and chronic exposure to lead, as bones are long-term
repositories of lead (Pain et al. 1993, Gangoso et al. 2009). Vultures with lead levels of 10-
20 μg/g have had abnormal or excessive exposure and absorption of lead, and those with
levels of >20 μg/g have had chronic exposure (Gangoso et al. 2009), such as those that
have died of lead poisoning (Pain et al. 2007).
Population Modelling
We modelled the population growth rates and the resulting population size of the southern
African Bearded Vulture using VORTEX population viability analysis software (Lacy et al.
2005).
In a similar approach to Smart et al. (2010) and Evans et al. (2009), we used our
model to firstly test whether we could re-capitulate the observed history of the population
trajectory from 1960 to 2000 based on population estimates from Krüger et al. (2014a,
Chapter 2) for the time periods 1960-1999 and 2000-2012, by using the current demographic
estimates (productivity and age specific mortality) obtained in this study. Secondly we used
current data on the status and demography of the population to compare hypothetical
population trajectories over 50 years from 2000 to explore the likely future population trends
and to test the effects of interventions aimed at increasing the population growth rate. These
scenarios constituted; i) current population size and current demographic rates, ii) revised
survival estimates for each age class removing the additive effect of unnatural mortalities, iii)
increased productivity estimates, and iv) supplementation to explore the impact of captive
breeding with subsequent introductions. For each scenario, we performed 1000 replicates
during the simulated 50-year period. The parameter values used in the baseline models are
detailed in Appendix 6.1.

176
Statistical Analyses
We tested whether there was a relationship between the location of the territory i.e. in the
core or periphery of the range and the laying rate using a General Linear Model in R v.3.0.2.
(R Core Team 2013) with an Arcsine square-root transformation of the percentage laying
rate. We also tested whether there was a relationship between the location of the territory
and nesting success. For this we used a Generalized Linear Model (binomial error structure
and a logit link function) with the probability of success (1/0) as the response variable and
location as the explanatory variable. The nest site was included as a random term as we had
repeated measures for the same nest site over a number of years.
Results
Age Structure
A total of 169 hours were spent on foot surveys which was twice the number of hours spent
on vehicle surveys (84 hours) (see Appendix 6.2 for vehicle survey details). On average,
non-adults were encountered 14% of the time in the core breeding areas during foot
surveys, whereas they were sighted on average 47% of the time during vehicle surveys, with
a low percentage of sightings in the core range and a high percentage in the peripheral
areas (Figure 6.2, Table 6.2). Based on the two survey methods, and weighting the foot
survey data by survey effort and survey area respectively (i.e. essentially four orders of
magnitude less than the vehicle surveys), we estimate that the population as a whole
consists of, on average, 59.6% adults and 40.4% non-adults. This age structure was used to
update the population estimate of 352-390 (Krüger et al. 2014a, Chapter 2) to 368-408
individuals.

Figure surveys
Table 6foot andand pertotal nu
Survey
Foot su
Road su
Road su
Road su
Product
Laying
During
to 35 si
was 52
birds on
6.2 The ps in the core
6.2 Age strud road survriphery of thmber of pos
type and lo
urvey (core)
urvey (Wes
urvey (East
urvey (East
tivity
Rate
2000-2013
tes in the c
% overall, 4
nly breed ev
percentage e and periph
ucture summveys (numbhe range. Psitive age c
ocation
stern Lesoth
tern Lesotho
tern Cape p
Roa
, 437 visits
core range a
49% in core
very second
of adults hery of the r
mary of theber of indiviPercentagesclassification
ho, core ran
o, core rang
peripheral ra
ad survey av
were unde
and 48 visit
e and 68%
d year and
and non-arange of the
e Bearded Viduals sight
s are displayns.
Ad
2.
nge) 1.
ge) 3.
ange) 0
verage 53
ertaken to 4
ts to six site
in the perip
pairs at per
dults obsee Bearded V
Vulture in soted per 10 yed in pare
dult
55 (86%)
89 (100%)
35 (60%)
(0%)
3%
1 individual
es in the per
pheral areas
ripheral site
rved duringVulture in so
outhern Afrhours) conntheses an
Non-adu
0.42 (14
0 (0%)
2.23 (40
0.39 (10
47%
l territories
ripheral ran
s. These da
es attempt to
g foot and outhern Afr
rica calculatnducted in td are based
ult Unkn
4%) 0.71
0
0%) 0.37
00%) 1.18
-
involving 3
nge. The lay
ata suggest
o breed mo
177
vehicle rica.
ted from the core d on the
nown
89 visits
ying rate
that the
ore often

178
than in the core areas although this difference was marginally non-significant (F1,39=3.20,
P=0.08).
To further refine our data and ensure that the low rate of laying was not simply a
function of observer inexperience, we sub-sampled eight sites that were surveyed by S.
Krüger annually between 2008-2013. From these eight sites, three were in the core area in
Lesotho and South Africa respectively and one was in the peripheral part of the range in
each country. Results indicated that birds in occupied territories only attempted to lay 72%
(n=33) of the time.
Nesting Success
A total of 76 laying pairs were monitored to determine nesting success. 35 different pairs
were monitored in total; nineteen pairs were monitored for one year only, seven pairs for two
years, three pairs for three years, four pairs for four years and one pair for seven and 11
years respectively.
The overall nesting success recorded in this study was 76% (Table 6.3). Two
breeding failures were attributed to mate loss and the effects of fire respectively. Sites visited
in the core of the range (62 nest visits to 30 different sites) had a higher nesting success
(79%) than sites visited in the periphery (64%) of the range (14 nest visits to 4 different
sites), although the relationship between nest location and nesting success was not
significant (χ2= 0.81, df=1, P=0.37).
Combining the laying rate (72%) from the sub-sample of eight sites monitored by S.
Krüger together with the nesting success of laying pairs (76%), the productivity of the
population was estimated at 0.55 young/pair/year (0.59 in the core and 0.40 in the periphery
of the range). By comparison, combining the laying rate of the original sample of 41 sites
(52%) with the nesting success of laying pairs (76%) resulted in a much lower productivity of
0.40 young/pair/year.
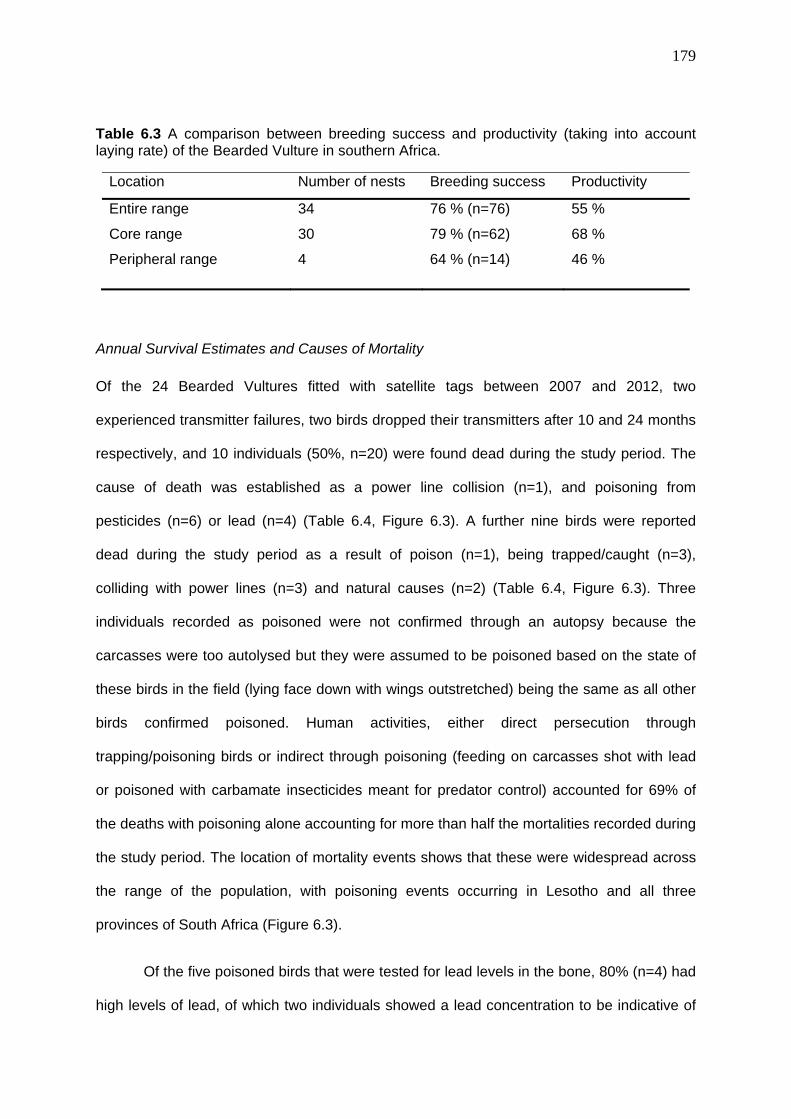
179
Table 6.3 A comparison between breeding success and productivity (taking into account laying rate) of the Bearded Vulture in southern Africa.
Location Number of nests Breeding success Productivity
Entire range 34 76 % (n=76) 55 %
Core range 30 79 % (n=62) 68 %
Peripheral range 4 64 % (n=14) 46 %
Annual Survival Estimates and Causes of Mortality
Of the 24 Bearded Vultures fitted with satellite tags between 2007 and 2012, two
experienced transmitter failures, two birds dropped their transmitters after 10 and 24 months
respectively, and 10 individuals (50%, n=20) were found dead during the study period. The
cause of death was established as a power line collision (n=1), and poisoning from
pesticides (n=6) or lead (n=4) (Table 6.4, Figure 6.3). A further nine birds were reported
dead during the study period as a result of poison (n=1), being trapped/caught (n=3),
colliding with power lines (n=3) and natural causes (n=2) (Table 6.4, Figure 6.3). Three
individuals recorded as poisoned were not confirmed through an autopsy because the
carcasses were too autolysed but they were assumed to be poisoned based on the state of
these birds in the field (lying face down with wings outstretched) being the same as all other
birds confirmed poisoned. Human activities, either direct persecution through
trapping/poisoning birds or indirect through poisoning (feeding on carcasses shot with lead
or poisoned with carbamate insecticides meant for predator control) accounted for 69% of
the deaths with poisoning alone accounting for more than half the mortalities recorded during
the study period. The location of mortality events shows that these were widespread across
the range of the population, with poisoning events occurring in Lesotho and all three
provinces of South Africa (Figure 6.3).
Of the five poisoned birds that were tested for lead levels in the bone, 80% (n=4) had
high levels of lead, of which two individuals showed a lead concentration to be indicative of

180
abnormal or excessive exposure and absorption of lead (10-20 μg/g) and two showed
concentrations indicative of chronic exposure (>20 μg/g).
Table 6.4. The number of Bearded Vulture found dead during 2000-2014 where cause of death was either through i) being deliberately or accidentally poisoned, ii) colliding with power lines, iii) deliberately or accidentally trapped, or iv) natural causes.
Age Class Cause of death Total
Poisoned Power line Trapped Natural
Fledgling (0-1 year) 1* 0 1 0 2 (11%)
Juvenile (1-2 years) 1 2 2 1 6 (32%)
Immature (2-3 years) 2* (1 lead) 1 0 0 3 (16%)
Immature (3-4 years) 2 (1 lead) 0 0 0 2 (11%)
Sub-adult (4-5 years) 1 (1 lead) 0 0 0 1 (5%)
Sub-adult (5-6 years) 0 0 0 1 1 (5%)
Adult (>6 years) 3* (1 lead) 1 0 0 4 (21%)
Total 10 (53%) 4 (21%) 3 (16%) 2(11%) 19
*Poisoning assumed (see text for details)
Figure 6.3 The location of mortality events depicted by cause of death showing the distribution of mortalities across the population’s range.

181
Age specific survival estimates were based on 49.83 years data from the 22 marked
individuals of seven age classes. Because of the small sample size there was considerable
uncertainty in the confidence of the estimates (Table 6.5). Fledglings (0-1 years) had the
lowest survival estimates (57.14%) followed by 3-5 year old birds with survival estimates of
between 57.89%-61.29% (Table 6.5).
Table 6.5. Age specific survival rates (mean ± standard deviation) expressed as percentages for the Bearded Vulture in southern Africa.
Age Class Years of data Survival rate
Fledgling (0-1 year) 2.33 57.14% ± 38.18%
Juvenile (1-2 years) 11.75 91.49% ± 37.48%
Immature (2-3 years) 12.00 75.00% ± 42.14%
Immature (3-4 years) 4.75 57.89% ± 47.05%
Sub-adult (4-5 years) 2.75 61.29% ± 41.57%
Sub-adult (5-6 years) 1.83 100.00% ± n/a
Adult (6-7 & >7 years) 14.58 86.29% ± 30.70%
Population Growth Rate
Our initial population model (using current survival and productivity estimates) failed to
recapitulate the observed population trajectory between 1960 and 2000. Our model
predicted a greater decline over those 40 years than was observed, with a predicted current
population size of only 1.3 ± 0.4 rather than the 368-408 currently present (Figure 6.4).
However, had the population instead consistently experienced the productivity and survival
rates estimated by Brown in the late 1980s (Brown 1997), the population would be predicted
to be far larger (848 ± 6) than we currently find. The failure of our model to recapitulate the
observed population trajectory may also be as a result of the accuracy of Brown’s (1997)
survival estimates which were based his population estimate of 204 pairs, the breeding
success rate of 0.89 young/pair/year, and the numbers of young and sub-adult birds in the
population, assuming that the adult population was stable and that recruitment from the

immatu
that the
period.
or incre
(Figure
populat
product
(590 ±
than su
be fully
Figure and 20individuhistoricaand cuestimat1000 si
re populatio
ere has bee
Two alterna
eased mort
6.4). Mod
tion size o
tivity and hi
9) after 40
ufficient to h
responsible
6.4 Graph00 compar
uals i) expeal survival rrent produes (=). Linemulations r
on equalled
en a gradua
ative scena
tality could
delling hist
f 10 ± 3 a
storical sur
years. The
have driven
e for the tre
ical output ring observeeriencing cuand produc
uctivity estimes show therun for each
d the annua
al decline i
arios were m
independe
toric produ
after 40 ye
rvival estima
se results s
the decline
ends observ
for the VOed and mourrent survivctivity estimmates (--), e mean po
h model ove
al adult mor
n productiv
modelled to
ently accou
uctivity with
ears. By co
ates resulte
suggest tha
e and that a
ved (Figure
ORTEX simodelled trajeval and pro
mates from and iv) his
opulation sizer a 40 year
rtality. Our m
vity and/or s
o determine
unt for the
h current s
ontrast, the
ed in a muc
at the curren
a decline in
6.4).
ulated popuectories basoductivity eBrown (199storical proze (mean ±r period.
models, how
survival dur
whether re
historic (1
survival res
e scenario
ch larger me
nt survival e
productivity
ulation chansed on the stimates fro97) (…), iii)
oductivity an± SE) at five
wever, still
ring the 196
educed pro
1960-2000)
sulted in a
based on
ean populat
estimates a
y only is un
nge betweee populationom the sta) historical nd current e year inte
182
suggest
60-2000
ductivity
decline
a mean
current
tion size
are more
nlikely to
en 1960 n of 633 art (-), ii)
survival survival
rvals for

Trajecto
estimat
mean f
probabi
This pr
decline
over th
abando
estimat
twice th
estimat
resulted
for futur
matche
survival
Figure and 205projectiat five y
ories over a
e (n=408),
uture popu
ility of extin
rojection su
to only 14
he last 10
oned nests d
e that the p
hat predicte
es were too
d in large c
re scenario
ed the know
l estimates
6.5 Graph50 showingon with adj
year interva
a 50 year p
and produc
lation size
nction and a
uggests tha
43 ± 8. How
years, this
during this
population s
ed by this
o low; and
confidence l
modelling
wn decline th
(increasing
ical output g the originausted morta
als for 1000
period from
ctivity and d
of only 2 ±
a mean tim
at even afte
wever, base
decline is
time (2000-
should have
model). Th
the small s
imits aroun
we adjusted
hat had occ
g them by 40
for the VOal projectionality rates (-simulations
2000-2050
demography
± 1 individu
me to extinc
er only 10
ed on the k
s unrealistic
-2010) is 1
e totalled ca
he most lik
ample size
nd these es
d our surviv
curred over
0%- see Ap
ORTEX projn (- - -) bas-). The meas run over a
0, using the
y estimates
als with a
ction of 12.
years, the
known level
cally high.
1 (S. Krüge
a. 372 indiv
kely reason
used for th
timates rein
val rates so
the last 10
ppendix 6.1)
jected popused on currean populatioa 50 year pe
e maximum
s from this s
growth rate
24 ± 0.29 y
mean pop
l of decline
For examp
er unpubl. d
viduals in 20
n for this is
he calculatio
nforcing this
o that our m
years. Thu
)
ulation chanent demogron size (meeriod.
current po
study, resu
e of λ=0.91
years (Figu
pulation size
e that has o
ple, the nu
data) and w
010 (i.e. mo
s that our
on of surviv
s notion. Th
models more
us, we adjus
nge betweeraphic data ean ± SE) is
183
opulation
lted in a
, a 0.99
ure 6.5).
e would
occurred
mber of
we would
ore than
survival
val rates
herefore
e closely
sted our
en 2000 and the
s shown

184
Based on the maximum population number and the adjusted mortality rates and current
productivity, trajectories over 50 years from 2000 resulted in a mean population size of 46 ±
6 individuals in 2050 with a λ=0.99 and a 0.89 probability of extinction and a mean time to
extinction of 18.74 ± 0.41 years (Figure 6.5).
Several management interventions were modelled to determine which actions would
increase growth rate and reduce the probability of extinction into the future (Tables 6.6 a&b).
These interventions included increasing the productivity in 5% intervals and reducing
mortality in 10% intervals across all ages (Table 6.6a). We then included the scenario of
supplementation of four first year birds (two males and two females) annually for 20 years
which we considered practical given the limited resources available currently (Table 6.6b).
We considered the minimum management target to be a positive growth rate (i.e. λ≥1) with a
probability of extinction of <0.50 (i.e. <50% chance of the population going extinct). The best
result (i.e positive growth rate λ=1.09 and lowest probability of extinction PE=0.30) was
achieved if productivity was increased by 20% and mortality was reduced by 50% with the
supplementation of four individuals. Although supplementation did not change the growth
rate in any scenario, it did lower the population’s probability of extinction in all cases and
therefore is a worthwhile management scenario to consider. Scenarios where productivity
was increased without a change in mortality rates, still resulted in high probabilities of
extinction (PE=0.88) whereas scenarios of reduced mortality without a change in productivity
resulted in lower extinction probabilities (PE=0.46). The minimum management action based
on the projected growth rate, was a 15% increase in productivity, a 40% reduction of
mortality and supplementation with four first year birds.
Unsurprisingly given the life history strategy of the species, reducing mortality thus
has a more significant impact on population growth than increasing productivity and, in order
to be an effective strategy, mortality must be reduced across all ages by at least 40% in
combination with other management options. This reduction in mortality rate represents
about a 10% increase in survival rate which we consider to be achievable.

185
Table 6.6a Projected population growth rate(λ) and the probability of extinction (PE) between 2000 and 2050 based on the implementation of various management scenarios, of increasing productivity (5% increments) and reducing mortality (10% increments). Scenarios with a positive growth rate and PE <0.50 are highlighted in red.
Table 6.6b Projected population growth rate(λ) and the probability of extinction (PE) between 2000 and 2050 based on the implementation of various management scenarios, of increasing productivity (5% increments) and reducing mortality (10% increments) with supplementation of the population by two males and females annually for 20 years throughout. Scenarios with a positive growth rate and PE <0.50 are highlighted in red.
Baseline Increased productivity
Bas
elin
e
5% 10% 15% 20% 25%
λ=0.99,
PE=0.88
λ=1.00
PE=0.88
λ=1.008
PE=0.90
λ=1.01
PE=0.88
λ=1.02
PE=0.89
λ=1.03
PE=0.88
Red
uced
mor
talit
y
10% λ=1.01
PE=0.88
λ=1.02
PE=0.85
λ=1.02
PE=0.82
λ=1.03
PE=0.80
λ=1.03
PE=0.83
λ=1.04
PE=0.82
20% λ=1.02
PE=0.77
λ=1.03
PE=0.76
λ=1.04
PE=0.78
λ=1.04
PE=0.77
λ=1.05
PE=0.79
λ=1.05
PE=0.75
30% λ=1.04
PE=0.69
λ=1.04
PE=0.66
λ=1.05
PE=0.68
λ=1.06
PE=0.70
λ=1.06
PE=0.69
λ=1.07
PE=0.67
40% λ=1.05
PE=0.57
λ=1.05
PE=0.60
λ=1.06
PE=0.59
λ=1.07
PE=0.60
λ=1.07
PE=0.59
λ=1.08
PE=0.61
50% λ=1.06
PE=0.46
λ=1.07
PE=0.49
λ=1.08
PE=0.47
λ=1.08
PE=0.48
λ=1.09
PE=0.47
λ=1.10
PE=0.48
Baseline Increased productivity
Bas
elin
e
5% 10% 15% 20% 25%
λ=0.99
PE=0.76
λ=1.00
PE=0.77
λ=1.01
PE=0.78
λ=1.01
PE=0.78
λ=1.01
PE=0.77
λ=1.03
PE=0.73
Red
uced
mor
talit
y
10% λ=1.01
PE=0.74
λ=1.02
PE=0.67
λ=1.02
PE=0.69
λ=1.03
PE=0.69
λ=1.03
PE=0.67
λ=1.04
PE=0.72
20% λ=1.02
PE=0.61
λ=1.03
PE=0.63
λ=1.04
PE=0.62
λ=1.04
PE=0.61
λ=1.05
PE=0.61
λ=1.05
PE=0.59
30% λ=1.04
PE=0.52
λ=1.04
PE=0.54
λ=1.05
PE=0.54
λ=1.06
PE=0.54
λ=1.06
PE=0.54
λ=1.07
PE=0.53
40% λ=1.05
PE=0.45
λ=1.05
PE=0.47
λ=1.06
PE=0.46
λ=1.07
PE=0.43
λ=1.07
PE=0.45
λ=1.08
PE=0.45
50% λ=1.06
PE=0.36
λ=1.07
PE=0.34
λ=1.08
PE=0.31
λ=1.08
PE=0.34
λ=1.09
PE=0.30
λ=1.10
PE=0.33

186
Discussion
The main conclusions of this study are four fold. Firstly, the current overall age structure
appears to be similar to that found during the early 1980s (Brown 1997), with around a 60/40
split between adults and non-adults. Secondly, productivity in terms of the number of young
fledged in occupied territories is relative low and appears to have declined since the early
1980s. Thirdly, survival rates of adults and non-adults appear to be relatively low, with main
cause of mortality being due to poisoning, both by pesticides (carbamate insecticides) and
lead. Lastly, combining current productivity and survival rates into a population model
predicted a continued population decline with a probability of extinction over the next 50
years of 99%. The projected growth rate indicates that the population will not be able to cope
with stochastic fluctuations and that immediate action is necessary to mitigate the threats
and improve the long-term situation for the species.
Our models showed that reduced productivity alone was insufficient to explain the
overall levels of decline witnessed over recent decades, and suggest that this reduction
combined with a decrease in survival rate must be responsible. Similar analyses carried out
on the vulture population declines in South Asia also highlighted a reduction in productivity
alone was insufficient to account for the catastrophic decline of the Gyps vulture populations
in Pakistan (Sarrazin et al. 2004). Adult survival rate is the primary demographic factor
influencing the rate of population increase in large raptors (Newton 1979, Lebreton and
Clobert 1991). Our study showed unusually high adult mortality rates from marked birds
(14%), and a high overall percentage of adults found dead during the study period (21%),
relative to those of other large raptors that have mortality rates of between 3-9 % (Sherrod et
al. 1977, Watson 1990, Whitfield et al. 2004, Evans et al. 2009, Schaub et al. 2009). We
have shown that adult mortality has doubled since Brown’s (1997) estimates in the 1980s
but the population age structure has not changed much over time. This therefore suggests
that mortality rates may have increased in all age classes equally with a negative effect on
the population growth.

187
In order to meet the objectives in the Biodiversity Management Plan for the species
in southern Africa (Krüger 2013), conservation measures to halt the projected decline and
ensure a positive growth rate must be implemented. Although reducing adult mortality should
be the primary focus of any management intervention, we recognise that interventions are
unlikely to target age-specific segments of the population, and there is a need to reduce
mortality across all age classes. Our models have shown that a positive population growth
rate with an acceptable probability of extinction can be achieved by reducing mortality by
40% rate across all age groups in combination with increasing productivity by 15% and
supplementing the population. The causes of mortality identified in this study suggest that
poisoning is still the primary mortality factor affecting this population with power line
collisions contributing to more mortalities than originally thought. A power line mitigation
strategy is in place through a partnership between Eskom (the electricity utility in South
Africa) and the Endangered Wildlife Trust (van Rooyen and Smallie 2006). This partnership
is also engaging with the Electricity Corporation in Lesotho (LEC) to reduce bird collisions
and electrocutions. The strategy, however, is a reactive one and as such there is an
opportunity for the implementation of a project to identify power lines in high use areas and
prioritise these for mitigation. This project could follow the methods of Reid et al.’s (in review)
spatial analyses of Bearded Vulture movements in southern Africa to inform wind turbine
placement. Since poisoning is the primary mortality factor we suggest that interventions
should focus on a reduction in poisoning and to a lesser extent on mitigating power line
collisions. A multi-pronged strategy is required to address the impacts of poisoning
throughout the species’ range by directing attention to the causes of poisoning. In Lesotho,
conservation efforts need to focus on addressing the direct poisoning of vultures for the
traditional medicine trade (Beilis and Esterhuizen 2005) and by herders that believe vultures
are a threat to livestock (S. Zwakala unpubl. data). Suggested conservation measures
include using District Environmental Officers to engage with traditional healers and herders
and educating scholars and range management associations on the importance of vultures
and engaging with law enforcement officials to prosecute those killing vultures and illegally

188
trading in vulture parts. In South Africa, vultures are the indirect targets of predator poison
baits (Brown 1991, Krüger et al. 2006) and conservation efforts must focus on i) exploring
alternative, effective and legal predator control measures (such as the use of guard
animals), ii) regulating the import, manufacture and use of agricultural chemicals and
pharmaceutical products known to be lethal to vultures and iii) stringent law enforcement
measures to prosecute and impose harsh penalties on perpetrators of poisoning.
Our study has also demonstrated a new threat to the population in the form of lead
accumulation in bones, suggesting that the birds are ingesting carcasses containing lead
shot or bullet fragments (Mateo et al. 1999, Clark and Scheuhammer 2003) or ingesting lead
in other ways such as through preening feathers after bathing in soil contaminated with lead
(A. Llopis pers. comm.). Lead is a highly toxic heavy metal and lead poisoning is the most
common type of heavy metal poisoning in raptors (Franson 1996, Pain et al. 2005), and
even at concentrations below those known to cause acute death, individuals experience
increased susceptibility to diseases and accidents (Clark and Scheuhammer 2003, Pain et
al. 2007). Long lived species in particular are very susceptible to the bioaccumulation of lead
in bone tissue (Gangoso et al. 2009) and the long term effects of lead poisoning have been
relevant in the decline of threatened populations such as the California Condor (Gymnogyps
californianus) (Cade 2007, Hall et al. 2007, Green et al. 2008) and other long lived raptors
worldwide (Kenntner et al. 2001, Clark and Scheuhammer 2003, Pain et al. 2005,
Hernández and Margalida 2009). We advocate the banning of hunting and culling with lead
ammunition in the distribution range of the species as suggested by Hernández and
Margalida (2009), an approach which has been shown by Cade (2007) and Ancora et al.
(2008) to be successful in reducing the prevalence of lead exposure. Management strategies
must be put in place to enforce this ban; e.g. provision of lead-free ammunition and raising
awareness amongst hunters and farmers on the effects of lead on both human and wildlife
populations. The primary source of lead from ammunition is assumed to be from animals
shot and placed at feeding sites since hunting and culling of wild ungulates in protected
areas occur at a low intensity throughout the species’ range.
189
Although high mortality rates have been recorded for this population relative to other
raptors, lowered productivity is likely to be a contributing factor to the decline documented for
this population. The nesting success of the Bearded Vulture in southern Africa, although not
as high as recorded by Brown (1997), is still higher than recorded in most other studies of
the species. However, the birds do not attempt to breed as frequently as recorded in the past
thereby lowering the overall productivity of the population. The productivity recorded for the
southern African population (0.55 y/pr/yr) is within the range of nesting success rates
recorded globally for the species; 0.55 y/pr/yr recorded for East Africa (Brown 1977) and
Ethiopia (Brown et al 1982); 0.66 y/pr/yr for the French Pyrenees (Terasse 1991) and
between 0.43 and 0.65 y/pr/yr in the Spanish Pyrenees (Heredia 1991; Margalida et al
2003). Our results are also comparable with those of other large raptors (for example; Brown
and Hopcroft 1973; Gargett 1977; Mundy 1982; Vernon, Piper and Schultz 1983; Tarboton
and Allan 1984; Watson 1990).
Our study found no differences in productivity between nests located in the core or
the periphery of the range. Results from Chapter 3 show that the densities of power lines
and settlements had the greatest influence on territory occupancy regardless of their location
in the range. In Chapter 3, settlement density was used as a surrogate for poisoning, and in
this chapter we found poisoning and power line collisions to be the primary causes of
mortality. Our models showed that efforts to increase productivity alone will not have the
desired effect on population growth but coupled with a reduction in mortality rates and
supplementation, a positive growth rate could be achieved. Apart from reducing the levels of
disturbance (such as mountaineering or flying) near nest sites, measures to improve the
laying rate in adults and first year bird survival need to be identified and implemented. Food
availability is a major factor influencing egg laying for many raptors (Steenhof et al. 1997,
Newton 2002) therefore we speculate that supplementary feeding may increase the laying
rate. To be effective feeding must be implemented before the egg laying period since
Margalida (2010) found supplementary feeding during the chick rearing period in the
Spanish Pyrenees to be ineffective in increasing nesting success or individual breeding

190
performance of territories. Feeding sites must also be appropriately sited since Carrete et al.
(2006) found supplementary feeding to be one of the main causes of productivity decline,
due to an aggregation of non-breeding birds leading to agonistic encounters and
interference with the breeding pairs. Feeding sites must also be well managed to reduce
incidences of indirect poisoning from lead or harmful veterinary drugs (Anderson, Piper and
Swan 2005). Further research is required on factors influencing laying rate and nesting
success in order to implement measures to improve the population’s productivity.
The release of fledglings as part of a reintroduction or population supplementation
programme has been a successful strategy executed for raptor populations in Europe (see
for example Green et al. 1996, Evans et al. 2009) and to re-establish Bearded Vulture
populations within their former range (Hirzel et al. 2004; Schaub et al. 2009). Since
reintroduction programmes are costly and time intensive, it is important to establish whether
they are feasible and necessary and for this reason we included this scenario in our models.
Our models suggest that this management strategy will reduce the probability of population
extinction if combined with reduced mortality and increased productivity. We therefore
recommend captive breeding (or second egg removal) as a precaution to ensure the long-
term survival of this threatened species and to provide a stock of birds for future
reintroduction programmes. Supplementation through reintroductions from another
population may assist by increasing the genetic diversity of the population.
Declining populations often exhibit a loss of genetic diversity, particularly if exchange
with other populations is minimal (Richards 2000). Reduced diversity may decrease fitness
or limit the long term capacity of the population to respond to environmental challenges or
chance environmental or demographic events in the short term and thus affecting survival
and reproduction (Alexandre et al. 2007). A recent genetic study using Mitochondrial control
region analyses detected reduced haplotype diversity in southern Africa (Krüger et al. 2014b,
Chapter 5) therefore apart from the known environmental threats to Bearded Vultures in
southern Africa, genetic diversity is already considerably reduced. Sustained declines are

191
the main reason for loss of genetic diversity therefore for the long term persistence of the
Bearded Vulture in southern Africa it is essential to maintain an adequate population size
and high levels of genetic diversity. The management option of introducing individuals from
Ethiopia which are genetically closely related to the southern African population (Krüger et
al. 2014b, Chapter 5) or using these individuals in a captive breeding programme should be
considered.
Recent information on the population dynamics of the southern Africa Bearded
Vulture has allowed us to model the population trends more accurately which together with
the knowledge of the primary causes of mortality provide the necessary details to target
management actions more effectively through the interventions suggested above. The threat
of poisoning has not been addressed over the past few decades and if this trend continues,
the population faces the risk of extinction within the next few decades. Many scavenger
populations are facing the same threats and we urge authorities to unite in the fight against
the illegal use of poison on a continent wide scale as the best use of limited resources. Our
results may form an important baseline for future studies in the area or elsewhere in Africa
where vultures are undergoing rapid declines.
Acknowledgements
Numerous Ezemvelo KwaZulu-Natal Wildlife Staff and Bearded Vulture Task Force
members assisted with breeding territory surveys in South Africa and Lesotho. Shane Elliott,
Chris Brown, John Crowson and Rickert van der Westhuizen are thanked for their
assistance with vehicle surveys. Ian Rushworth assisted with the baseline model for the
PVA. A number of individuals are thanked for the recovery of marked birds, often under
challenging circumstances, in particular; Makhubu Shobana, Tanya Smith, Henry Hlela and
Rickert van der Westhuizen. Dr. Voster from Vet Diagnostix is thanked for his voluntary
assistance with post mortems.

192
References
Alexandre R, Couvet D and Sarrazin F (2007) Integration of demography and genetics in
population restorations. Ecoscience 14: 463–471. doi:10.2980/1195-6860(2007)14
[463: IODAGI]2.0.CO;2.
Ancora S, Bianchi N, Leonzio C and Renzoni A. (2008) Heavy metals in flamingos
(Phoenicopterus ruber) from Italian wetlands: The problem of ingestion of lead shot.
Environ Res 107(2): 229-236.
Anderson MD, Piper SE and Swan GE (2005) Non-steroidal anti-inflammatory drug use in
South Africa and possible effects on vultures. S Afr J Sci 101: 1-3.
Beilis N and Esterhuizen J (2005) The potential impact on Cape Griffon Gyps coprotheres
populations due to the trade in traditional medicine in Maseru, Lesotho. Vulture News
53: 15-19.
Beissinger S and McCullough D (editors) (2002) Population Viability Analysis. University of
Chicago Press, Chicago.
Boshoff AF, Anderson MD and Borello W (editors) (1998) Vultures in the 21st century.
Vulture Study Group, Johannesburg.
Brown LH (1977) The status, population structure, and breeding dates of the African
lammergeier Gypaetus barbatus meridionalis. Raptor Res 11: 49-58.
Brown CJ (1991) An investigation into the decline of the Bearded Vulture Gypaetus barbatus
in southern Africa. Biol Conserv 57(3): 315-337.
Brown CJ (1992) Distribution and status of the bearded vulture Gypaetus barbatus in
southern Africa. Ostrich 63(1): 1-9.
Brown CJ (1997) Population dynamics of the Bearded Vulture Gypaetus barbatus in
southern Africa. Afri J Ecol 35(1): 53-63.

193
Brown JH (1971) Mammals on mountaintops: nonequilibrium insular biogeography. Am Nat
105: 467–478.
Brown JH (1995) Macroecology. Chicago University Press, Chicago.
Brown LH, Urban EK and Newman K (1982) Birds of Africa. Vol. 1. Academic Press,
Orlando, Florida.
Brown LH and Hopcroft JBD (1973) Population structure and dynamics of the African fish
eagle Haliaeetus vocifer (Daudin) at Lake Naivasha, Kenya. E Afr Wildl J 11: 255-
269.
Cade TJ (2007) Exposure of California Condors to lead from spent ammunition. J Wildl
Manage 71(7): 2125-2133.
Carrete M, Donázar JA and Margalida A (2006) Density-dependent Productivity Depression
in Pyrenean Bearded Vultures: Implications for Conservation. Ecol Appl 16(5): 1674–
1682.
Clark AJ and Scheuhammer AM (2003) Lead poisoning in upland-foraging birds of prey in
Canada. Ecotoxicology 12: 23–30.
Diamond JM, Bishop KD and van Balen S (1987) Bird survival in an isolated Javan
woodland: Island or mirror? Conserv Biol 2: 132–142.
Energy Sector Policy of the AfDB Group (2012) African Development Bank Operational
Resources and Policies Department (ORPC).
Evans RJ, Wilson JD, Amar A., Douse A., Maclennan A, Ratcliffe N and Whitfield DP (2009)
Growth and Demography of a re-introduced population of White-tailed Eagles
Haliaeetus albicilla. Ibis 151: 244-254
Ferrer M, Newton I, Muriel R, Báguena G, Bustamante J, Martini M and Morandini V (2014)
Using manipulation of density-dependent fecundity to recover an endangered

194
species: the bearded vulture Gypaetus barbatus as an example. J Appl Ecol July
2014. doi: 10.1111/1365-2664.12308
Foufopoulos J and Ives AR (1999) Reptile extinctions on land-bridge islands: life-history
attributes and vulnerability to extinction. Am Nat 153: 1–25.
Franson JC (1996) Interpretation of tissue lead residues in birds other than waterfowl. In:
Beyer WN, Heinz GH and Redmon-Norwood AW (editors) Environmental
Contaminants in Wildlife: Interpreting Tissue Concentrations. SETAC, CRC Lewis
Publishers, Boca Raton, FL, pp. 265–279.
Gangoso L, lvarez-Lloret PA, Rodríguez-Navarro AAB, Mateo R, Hiraldo F and Donázar JA
(2009) Long-term effects of lead poisoning on bone mineralization in vultures
exposed to ammunition sources. Environ Pollut 157: 569–574.
Gargett V (1977) A 13 year population study of the black eagles in the Matopos, Rhodesia,
1964-1976. Ostrich 48: 17-27.
Gaston KJ (1994) Rarity. Chapman and Hall, London.
Gilpin ME and Soulè ME (1986) Minimum viable population: proceses of species extinctions.
In: Soulè ME (editor) Conservation Biology: the Science of Scarcity and Diversity.
Sinauer, Sunderland, Massachusetts, pp. 19-34.
González LM, Margalida A, Mañosa S, Sánchez R, Oria J, Molina JI, Caldera J, Aranda A
and Prada L (2007) Causes and spatio-temporal variations of non-natural mortality in
the Vulnerable Spanish imperial eagle Aquila adalberti during a recovery period. Oryx
41: 495–502.
Green RE, Pienkowski MW and Love JA (1996) Long-term viability of the re-introduced
population of the White-tailed Eagle Haliaeetus albicilla in Scotland. J Appl Ecol 33:
357–368.

195
Green RE, Hunt WG, Parish CN and Newton I (2008) Effectiveness of action to reduce
exposure of free-ranging California condors in Arizona and Utah to lead from spent
ammunition. PLoS ONE 3(12): e4022.
Hall M, Grantham J, Posey R and Mee A (2007). Lead exposure among reintroduced
California Condors in southern California. California Condors in the 21st Century,
139-162.
Hernández M and Margalida A (2009) Assessing the risk of lead exposure for the
conservation of the endangered Pyrenean bearded vulture (Gypaetus barbatus)
population. Environ Res 109: 837–842.
Heredia R (1991) Chapter 2. Biologia de la Reproduccion. In: Heredia R and Heredia B
(editors). El Quebrantahuesos (Gypaetus barbatus) en los Pirineos. ICONA, Madrid.
Hiltunen TA (2008) Farmers and the Bearded Vulture Gypaetus barbatus meridionalis.
Dissertation, University of Pretoria.
Hirzel AH, Posse B, Oggier P, Crettenand Y, Glenz C and Arlettaz R (2004) Ecological
requirements of reintroduced species and the implications for release policy: the case
of the bearded vulture. J Appl Ecol 41: 1103–1116.
IUCN (2001) IUCN Red List Categories and Criteria: version 3.1. IUCN Species Survival
Commission. IUCN, Gland, Switzerland and Cambridge, UK. ii + 30pp.
Jones HL and Diamond JM (1976) Short-time base studies of turnover in breeding birds of
the California Channel Islands. Condor 76: 526–549.
Kalipeni E (editor) (1994) Population Growth and Environmental Degradation in Africa, 236
pp.

196
Kenntner N, Tataruch F and Krone O (2001) Heavy metals in soft tissue of white- tailed
eagles found dead or moribund in Germany and Austria from 1993 to 2000. Environ
Toxicol Chem 20: 1831–1837.
Krüger S (editor) (2013) Biodiversity Management Plan for the Bearded Vulture (Gypaetus
barbatus meridionalis) for Southern Africa, unpubl report.
Krüger S (in press) Bearded Vulture. In: Taylor MR (editor) The Eskom Red Data Book of
Birds of South Africa, Lesotho and Swaziland. BirdLife South Africa, Johannesburg.
Krüger S, Piper S, Rushworth I, Botha A, Daly B, Allan D, Jenkins A, Burden D and
Friedmann Y (editors.) (2006) Bearded Vulture (Gypaetus barbatus meridionalis)
Population and Habitat Viability Assessment Workshop Report. Conservation
Breeding Specialist Group (SSC/IUCN)/CBSG Southern Africa. Endangered Wildlife
Trust, Johannesburg.
Krüger SC, Allan DG, Jenkins AR and Amar A (2014a) Trends in territory occupancy,
distribution and density of the Bearded Vulture Gypaetus barbatus meridionalis in
southern Africa. Bird Conserv Int 24: 162-177. doi:10.1017/ S0959270913000440.
Krüger SC, Wesche PL and Jansen van Vuuren, B (2014b) Reduced genetic diversity in
Bearded Vultures Gypaetus barbatus in Southern Africa. doi: 10.1111/ibi.12200.
Lacy RC, Borbat M and Pollak JP (2005) VORTEX: A Stochastic Simulation of the Extinction
Process. Version 9.50. Brookfield, IL: Chicago Zoological Society.
Lande R (1999) Extinction risks from anthropogenic, ecological and genetic factors. In:
Landweber F and Dobson AP (editors.) Genetics and the extinction of species.
Princeton University Press, pp. 1-22.
Lebreton J-D and Clobert J (1991) Bird population dynamics, management, and
conservation: the role of mathematical modelling. In: Perrins CM, Lebreton J-D and

197
Hirons GJM (editors) Bird population studies: relevance to conservation and
management. Oxford University Press, Oxford, pp. 105-125.
MacArthur RH and Wilson EO (1967) The equilibrium theory of island biogeography.
Princeton University Press, Princeton.
Mander M, Diederichs N, Ntuli L, Khulile M, Williams V and McKean S (2007) Survey of the
Trade in Vultures for the Traditional Health Industry in South Africa. Futureworks,
unpubl report, 30pp.
Margalida A (2010) Supplementary feeding during the chick-rearing period is ineffective in
increasing the breeding success in the bearded vulture (Gypaetus barbatus). Eur J
Wildl Res 56: 673–678.
Margalida A, Canut J and García D (2003) Territory change and Nest-site switching in the
Bearded Vulture (Gypaetus barbatus). J Raptor Res 37(4): 333-337.
Margalida A, Heredia R, Razin M and Hernandez M (2008) Sources of variation in mortality
of the Bearded Vulture Gypaetus barbatus in Europe. Bird Conserv Int 18: 1-10.
Margalida A, Oro D, Cortés-Avizanda A, Heredia R, Donázar JA (2011) Misleading
Population Estimates: Biases and Consistency of Visual Surveys and Matrix
Modelling in the Endangered Bearded Vulture. PLoS ONE 6(10): e26784.
doi:10.1371/journal.pone.0026784
Mateo R, Estrada J, Paquet JY, Riera X, Domínguez L, Guitart R and Martínez-Vilalta A
(1999) Lead ingestion by marsh harriers Circus aeruginosus from the Ebro Delta,
Spain. Environ Pollut 104: 435–440.
Mateo-Tomás P and Olea PP (2010) Diagnosing the causes of territory abandonment by the
Endangered Egyptian vulture Neophron percnopterus: the importance of traditional
pastoralism and regional conservation. Oryx 44: 424–433.

198
Mundy PJ (1982) The Comparative Biology of Southern African Vultures. Vulture Study
Group, Johannesburg.
Newton I (1979) Population Ecology of Raptors. T and AD Poyser, Berkhamsted.
Newton I (1998) Population Limitation in Birds. Academic Press, London.
Newton I (2002) Population limitation in Holarctic owls. In: Newton I, Kavanagh R, Olsen J
and Taylor I (editors) Ecology and conservation of owls. CSIRO Publishing,
Collingwood, Victoria, Australia, pp 3–29.
Ngwenya NP (2001) Implications of the medicinal animal trade for Nature Conservation in
KwaZulu-Natal. Ezemvelo KZN Wildlife unpubl report, 76pp.
Ogada DL, Keesing F and Virani MZ (2012) Dropping dead. Causes and consequences of
vulture population declines worldwide. Ann NY Acad Sci 1249: 57-71.
Pain DJ, Metayer C and Amiard JC (1993) Lead determination in avian blood: application to
a study of lead contamination in raptors from France. J Environ Anal Chem 53: 29–
35.
Pain DJ, Meharg AA, Ferrer M, Taggart M and Penteriani V (2005) Lead concentration in
bones and feathers of the globally threatened Spanish imperial eagle. Biol Conserv
121: 603–619.
Pain DJ, Carter I, Sainsbury AW, Shore RF, Eden P, Taggart MA, Konstantinos S, Walker
LA, Meharg AA and Raab A (2007) Lead contamination and associated disease in
captive and reintroduced red kites Milvus milvus in England. Sci Tot Environ 376:
116–127.
Penzhorn BL (1969) Golden Gate se Lammergeiers. Afr Wildl 23: 289-298.
Pimm SL, Diamond J, Reed TM, Russell GJ and Verner J (1993) Times to extinction for
small populations of large birds. Proc Nat Acad Sci USA 90: 10871–10875.

199
R Core Team. (2013) R: A language and environment for statistical computing. R
Foundation for Statistical Computing, Vienna, Austria. URL http://www.R-project.org.
Reid T, Krüger S, Whitfield P and Amar A (in review). Spatial analyses of Bearded Vulture
movements in southern Africa to inform wind turbine placement.
Richards CM (2000). Inbreeding depression and genetic rescue in a plant metapopulation.
Am Nat 155: 625-640.
Rosenzweig ML (1995) Species Diversity in Space and Time. Cambridge University Press,
Cambridge.
Saether B and Bakke Ø (2000) Avian life history variation and contribution of demographic
traits to the population growth rate. Ecology 81: 642–653.
Sarrazin F, Virani MZ, Gilbert M and Khan A (2004) Preliminary Population Viability
Analyses for Oriental White-Backed Vulture Gyps bengalensis in Punjab province,
Pakistan. In: Chancellor RD and Meyburg BU (editors) Raptors Worldwide. WWGBP
& MME Penti Kft, Budapest, pp. 257–262.
Schaub M and Pradel R (2004) Assessing the relative importance of different sources of
mortality from recoveries of marked animals. Ecology 85(4): 930-938.
Schaub M, Zink R, Beissmann H, Sarrazin F and Arlettaz R (2009) When to end releases in
reintroduction programmes: demographic rates and population viability analysis of
bearded vultures in the Alps. J Appl Ecol 46: 92–100. doi: 10.1111/j.1365-2664.
2008.01585.x
Shaffer ML (1981) Minimum population sizes for species conservation. Biosci 31: 131-4.
Sherrod SK, White CM and Williamson FSL (1977) Biology of the bald eagle (Haliaeetus
leucocephalus alascanus) on Amchitka Island, Alaska. Living Bird 15: 143–182.

200
Soulè ME, Bolger DT, Alberts AC, Wright J, Sorice M and Hill S (1988) Reconstructed
dynamics of rapid extinctions of chaparral-requiring birds in urban habitat islands.
Conserv Biol 2: 75–92.
Smart J, Amar A, Sim IMW, Etheridge B, Cameron D and Christie G (2010) Illegal killing
slows population recovery of a re-introduced raptor of high conservation concern –
The red kite Milvus milvus. Biol Conserv 143: 1278–1286.
Steenhof K, Kochert MN and Mcdonald TL (1997) Interactive effects of prey and weather on
golden eagle reproduction. J Anim Ecol 66(3): 350-362.
Steenhof K and Newton I (2007) Assessing nesting success and productivity. In: Bird DM
and Bildstein KL (editors) Raptor research and management techniques. Hancock
House Publishers, Surrey, British Columbia, Canada, pp. 181–192.
Tarboton WR and Allan DG (1984) The Status and Conservation of Birds of Prey in the
Transvaal. Transvaal Mus Monogr 3, Transvaal Museum, Pretoria.
Terasse JF (1991) Chapter 11. Le Gypaete Barbu dans les Pyrenees Francaises. In:
Heredia R and Heredia B (editors) El Quebrantahuesos (Gypaetus barbatus) en los
Pirineos. ICONA, Madrid.
van Rooyen CS and Smallie J (2006) The Eskom – Endangered Wildlife Trust Strategic
Partnership in South Africa: A brief summary. Nature and Faune 21(1): 25.
Vernon CJ, Piper SE and Schultz DM (1983) The Cape vulture at Colleywobbles, Transkei in
1982. Vulture news 9/10: 11-13.
Watson RT (1990) Population dynamics of the bateleur in the Kruger National Park. Ostrich
61: 5-12.
Whitfield DP, Fielding AH, Mcleod DRA and Haworth PF (2004) Modelling the effects of
persecution on the population dynamics of golden eagles in Scotland. Biol Conserv
119: 319–333.

201
Appendices
Appendix 6.1 Summary of baseline parameter values used in Vortex for the simulations of the observed population trajectory for the past 40 years (based on data from Brown (1997) and data from this chapter) and future trajectories modelled over the next 50 years (based on data from this chapter and Krüger et al. (2014a, Chapter 2).
Parameter Value
Past 1960-2000 Future 2000-2050
Number of iterations 1000 1000 Number of years 50 50 Extinction definition One sex remains One sex remains Number of populations One One Initial population size (N) 633 408 Carrying capacity (K) 1000 ± 10 1000 ± 10 Age distribution Stable Stable Inbreeding depression No No Density dependent reproduction No No EV concordance of reproduction and survival Yes Yes Mating system Long-term
monogamy Long-term monogamy
Age of first breeding 7 7 Maximum age of reproduction 32 32 Maximum number of broods per year 1 1 Maximum progeny per brood 1 1 Sex ratio at birth 50% 50% Percent adult females breeding 100% ± 10% 72% ± 20% Fecundity rate 0.89 0.76 Number of offspring per female per brood 1 ± 0 1 ± 0 Percentage adult males in the breeding pool 100% 98% Mortality Rates (percentage) years 0-1 30 ± 10 25.80 ± 38.18
1-2 20 ± 10 05.40 ± 37.48 2-3 19 ± 10 15.00 ± 42.14 3-4 18 ± 10 25.20 ± 47.05 4-5 6 ± 10 22.80 ± 41.57 5-6 6 ± 10 0 6-7 6 ± 10 08.40 ± 30.70 >7 6 ± 10 08.40 ± 30.70
Number of catastrophes None None Harvest No No Supplementation No No

202
Appendix 6.2 The details of the vehicle survey routes undertaken in the Bearded Vulture’s range in southern Africa during 2012.
Parameters
Day, month and year of survey
(1) 4-6,18&19
July 2012
(2) 13&14,29&30
September 2012
(3) 18-20,29&30
December 2012
Total distance (km) 816.00 799.00 616.00
Total time (hours) 37.10 26.90 25.40
Total Bearded Vultures per 100 km 0.86 2.00 0.65
Adult Bearded Vultures per 100 km 0.86 1.13 0.00
Non adult Bearded Vultures per 100 km 0.00 0.75 1.64
unknown Bearded Vultures per 100 km 0.00 0.13 4.92
Total Bearded Vultures per 10 hours 1.89 5.95 1.57
Adult Bearded Vultures per 10 hours 1.89 3.35 0.00
Non Adult Bearded Vultures per 10 hours 0.00 2.23 0.39
unknown Bearded Vultures per 10 hours 0.00 0.37 1.18
Total Cape Vultures per 100 km 1.10 2.63 6.17
Total Cape Vultures per 10 hours 2.43 7.81 14.96
Total Ravens per 100 km 4.90 12.89 0.49
Total Ravens per 10 hours 10.80 38.29 1.18
(1) Western Lesotho routes: between bottom of Sani Pass and Roma via Thaba-Tseka (2) Eastern Lesotho: between top of Sani Pass and Butha Buthe via Mokhotlong (3) North-eastern Cape: between Mt Fletcher and Karingmelkspruit via Ongeluksnek, Maclear, Naudes
Nek, Rhodes, Dangershoek, Balloch, Barkly East, Elliott, Bottlenek Pass and Mosheshe's Ford

203
Chapter 7: Discussion
Photo 7 Juvenile Bearded Vulture on a Drakensberg cliff

204
In this thesis I have attempted to synthesize 15 years of research on the Bearded Vulture
population of southern Africa to document the current status and distribution and to achieve
a better understanding of the factors which may be limiting population growth, their
movement ecology and the genetic diversity of the population (Figure 7.1). Results from this
thesis have confirmed the urgency for intervention and provided the necessary information to
enable conservation action to be focussed most effectively to improve the status of the
species. This research is timely in that it can add value to the international strategy for the
management of the Bearded Vulture, the African Vulture strategy and the Biodiversity
Management Plan for the species locally.
The first task when investigating the decline of a population is to establish baseline
information on the population’s size and distribution range. This information was lacking for
the Bearded Vulture in southern Africa and as such we had no knowledge on how the
population had fared over recent years. Therefore it was important to firstly establish the
current population size and the extent of its distribution. Chapter 2 achieves this through
multiple surveys of breeding territories which confirm the declining trend in the Bearded
Vulture population in southern Africa recorded by Brown (1991), Allan and Jenkins (2005),
Krüger (2006) and Krüger et al. (2006). There was some uncertainty around the exact rate of
decline because the historical status of newly discovered territories was unknown and pairs
may have moved territories rather than abandoning them. However, Chapter 2 estimated
that the breeding population had declined in number (32-51%), range (27%) and density
(20%) over the past fifty years, with territories on the edge of the range being more likely to
be abandoned than those in the core where breeding densities were higher. Surveys to
determine the relative abundance and age structure of the population, confirmed the
declining trends based on very low encounter rates (3.14 birds/10 hours) of both adults and
non-adults throughout the range, which were 45% lower than recorded 30 years previously.
However, although numbers were small, these surveys suggested that there was little
change in age structure over the same time period. The extensive surveys conducted across
the entire species’ range over a period of more than 12 years, resulted in many new

205
Figure 7.1 Infographic of the main findings, conclusions and management recommendations of the study.

206
territories being identified, including those that had been unoccupied (considered
abandoned) for many years. The southern African population was estimated at 352-390
(Krüger et al. 2014a, Chapter 2) based on Brown’s (1997) age ratios for the population (1
adult : 0.60 non-adults). The current age ratios established for the population in Chapter 6 (1
adult : 0.67 non-adults) enabled a more accurate estimate of the population to be calculated;
that of 368 – 408 individuals.
As a result of the work reported on in Chapter 2, the regional status of the species
was uplisted from Endangered (Anderson 2000) to Critically Endangered (Krüger in press) in
a recent reassessment of the red data bird species of South Africa, Lesotho and Swaziland
(Taylor in press). This was based on the reduction in population size and geographic range,
and the threats to the species not being addressed. These data also contributed to the
recent global uplisting of the species from Least Concern to Near Threatened based on a
declining trend in many parts of their range attributed to poisoning, disturbance and
collisions with power lines (BirdLife International 2014).
Given that many of the identified territories had now become abandoned, and that
ultimately it is this abandonment that had resulted in a decline in the population, I was
interested in ascertaining what factors might have been driving this abandonment. Such an
approach has proven useful in other studies for example Carrete et al. (2007) and Mateo-
Tomás and Olea (2010). Chapter 2 identified that territories on the periphery of the range
were more likely to be abandoned than those in the core range where breeding densities
were higher. This finding was thought to possibly result from higher anthropogenic pressures
operating at the periphery of the range. I investigated this interaction further in Chapter 3
where I considered three hypotheses proposed as drivers of territorial abandonment;
anthropogenic impact, climate change and food availability. These hypotheses were
investigated through the use of covariates within the area representing the home-ranges of
adults surrounding each territory. Data from Chapter 4 (see below) provided the average
home range size of breeding adults – which allowed me to delimit a suitable area over which

207
to obtain these covariates. Findings from this chapter showed that anthropogenic activities
were indeed the most influential factors associated with the abandonment of territories.
Further investigations showed that this pattern was not simply the result of the population
shrinking back to the core of the range, since territories with higher densities of power lines
and settlements were more likely to be abandoned regardless of their location within the
range. The results of this chapter hinted at the overall cause of population’s decline being as
the result of human impacts. Further support for this conclusion was provided by the causes
of mortality identified in Chapter 6. The primary mortality factors were poisoning (53% of
cause of death) and collisions with power lines (21%) with both causes likely to be under-
reported because of the difficulty in finding carcasses in the rugged mountainous terrain and
the reluctance of landowners to report carcasses on their properties.
Equipped with the knowledge that human impacts were the probable causes of the
population decline, I was then interested to explore which age classes were most at risk of
encountering these threats and whether their use of the landscape made them more
vulnerable to risk factors. Data from 24 individuals of differing age classes fitted with satellite
tags between 2007-2013 provided the necessary information to compare home range size,
use and exposure to risks (e.g. settlements and power lines) between age classes in
Chapter 4. Although adults are a conservation priority (Newton 1979, Bell and Merton 2002),
this chapter revealed that immature and sub-adult age classes experience the highest risk of
collisions with power lines and interactions with humans as a result of their larger range
sizes and the greater distances they move in relation to the other age classes. The results
highlight the importance of focussing conservation efforts on these age classes as well as on
adults. Examining the geographical areas used by non-adults provides conservation
authorities with three options in terms of the size of the area (50%, 75% and 90% kernel
areas) in which to focus conservation activities targeting these age classes, depending on
the availability of resources. The core area of use by non-adults (10,982 km2) represents the
minimum sized area in which to implement the recommendations listed below. Since adults
focus their activities within a relatively small area around their nest sites (ca. 10 km radius)

208
and move almost exclusively in this area (92% of all fixes), breeding territories should form
the minimum area of focus for conservation actions (e.g. power line mitigations and
educational activities). Adult home range areas (including breeding and non-breeding birds)
in southern Africa were similar to those recorded in Europe but the home range of birds
which were breeding was only a third of the size. Non-adults ranged over much larger areas
than recorded elsewhere, in fact they used 65% of the area occupied by the species, thus
presenting a challenge for the implementation of conservation actions across regional and
international boundaries.
The capture of 24 individuals (Chapter 4) provided me with an opportunity to collect
tissue samples for genetic analyses. I was interested to know how genetically similar the
southern African population was to the Ethiopian population and other populations globally.
Previous research had shown that there was no distinction between the populations globally
(Godoy et al. 2004), but the small number of samples from sub-Saharan Africa made me
cautious of these findings. Knowing the population’s diversity and evolutionary placement
will aid decisions on whether introductions are necessary to increase numbers and diversity
and where best to source individuals from. The genetic variation in the population discussed
in Chapter 5 showed that apart from the anthropogenic risks identified in Chapters 3 and 4,
the population is also faced with genetic risks as a result of its reduced haplotype diversity
(Krüger et al. 2014b). It is essential to maintain high levels of genetic diversity for the long-
term persistence of the population in southern Africa. A significant loss in genetic diversity
may decrease fitness or limit the long term capacity of the population to respond to
environmental challenges or chance environmental or demographic events in the short term
thus affecting survival and reproduction in the long term (Alexandre et al. 2007). The low
diversity at the mitochondrial level suggests the threats that the population has, and is, being
subjected to have had a real impact on the genetics of this population and that management
measures must be considered to increase the long-term viability of the population. The dire
population trajectory revealed by the population models in Chapter 6 suggests that a
programme of supplementation might be a useful strategy to reduce the probability of

209
extinction in this population, if coupled with improved survival rates and productivity. This
programme could include the collection of second eggs or captive breeding with a founder
population from elsewhere in the species’ range. East and southern African populations
share the same haplotypes, therefore the apparently large Ethiopian population could be
considered as a source population for captive breeding/introductions to improve diversity.
However, other populations globally need not be ruled out because although there may be
morphological differences, Chapter 5 has confirmed previous findings that there is not
enough genetic variation within the species to warrant the classification into sub-species.
Chapters 2-4 attribute the population decline to anthropogenic activities. However, to
gain a more comprehensive understanding of the dynamics, I also attempted to understand
the productivity of the population and the survival rates of different age classes. Chapter 6
confirmed that low recruitment and low survival were both likely to be contributing to the low
population growth rate. Specifically, Chapter 6 confirmed that nesting success rates had
apparently declined over the last 30 years with only 0.55 y/pr/yr now being produced
compared to the previously recorded productivity which was 0.89 y/pr/yr. Although it should
be noted that these changes may be biased due to the limited extent and location of the
study area (in the core of the range) in the past. Despite this apparent reduction, however,
our productivity is still within the range recorded for other Bearded Vulture populations
(0.43–0.65 y/pr/yr) (Brown 1977, Brown et al. 1982, Heredia 1991, Terasse 1991, Margalida
et al. 2003) although it is at the lower end of the scale (0.55 y/pr/yr). The main reason for
these lower levels is because, unlike in the past and unlike many other populations, pairs
currently seem to attempt to breed only every second year. Since nesting success is
comparatively high (76%), measures that encourage the birds to breed annually should be
urgently considered (see below). In addition, training is required to enable observers to
better interpret their observations at nest sites to reduce observer bias and increase
confidence in these results, enabling a larger sample size to be used for similar analyses in
future.

210
Data on demographic parameters collected during 2000-2014 provided the
necessary information to calculate age-specific survival rates to more accurately model
growth rates for the population. Half (n=10) the birds tagged during the study period died,
which provided a means to calculate survival estimates which, even though the sample size
was small, provided some indication of survival. The population growth rate projected in
Chapter 6 for the next 50 years was negative (λ=0.99) with a high probability of extinction
(0.89) during this period. These extremely dire results point to the need for urgent
intervention to ensure a positive population growth rate. All possible resources need to be
mobilized to 1) improve the survival of all age classes 2) improve the proportion of breeding
birds, and 3) establish a captive breeding programme to supplement the population. A
number of recommendations are detailed below for implementation across the species’
range aimed at achieving the three points above, all of which need to be implemented
simultaneously in a multi-pronged strategy to effect a positive population growth. The
strategy must include education and law enforcement aimed at reducing poisoning incidents
and testing whether supplementary feeding will reduce risk exposure and increase
productivity.
Recommendations for Future Management
Many of the recommendations that I feel are critical to the conservation of the southern
African Bearded Vulture population were made in Chapters 2-5. In Chapter 6, I explore
which of these recommendations might have the best chance of achieving the desired
impact of stabilising the population growth rate in the short term. Of the hypothetic
population trajectories that I compared over the next 50 years, a 40% reduction in mortality
together with a 15% increase in productivity and the supplementation of four individuals was
predicted to result in a positive growth rate (λ=1.07) with a low (0.43) probability of
extinction. The results from Chapters 3, 4 and 6 discussed above suggest that unnatural
mortality factors are limiting the population. Therefore the threats of poisoning and power

211
line collisions need to be mitigated sufficiently to reduce mortality rates by 40% across all
age classes. Measures aimed at improving productivity by 15% include reducing human
activities, such as helicopter flights and mountaineering, close to nest sites at the beginning
of the breeding season and placing supplementary food close to nest sites early in the
breeding season. Supplementary food provision near nest sites will ensure that ‘safe’ food is
provided to adults during the breeding season reducing the need to forage wider and be
exposed to threats of poisoning. Although food shortage was not found to be a major factor
driving the abandonment of territories in Chapter 3, developing additional supplementary
feeding sites may benefit the population by improving productivity and reducing the risk of
exposure to human persecution and poisoning incidents, particularly for immatures and sub-
adults, the high risk age classes. Whether this action would achieve the stated aims, would
need to be monitored as part of an adaptive management framework. This action should
also be implemented with caution based on the negative impacts of supplementray feeding
sites on breeding adults shown by Oro et al. 2008.
Paramount to the survival of this population, however, is a reduction of poisoning
incidents. Recommendations to address the threat of poisoning have been discussed at a
number of meetings/workshops recently (e.g. International workshop on poisoning and
vultures in Spain, April 2014; Workshop on poisoning at the Birds of Prey programme annual
symposium in Namibia, May 2014) and are as follows: Regulate the import, manufacture and
use of poisons including agricultural chemicals and pharmaceutical products known to be
lethal to vultures. Legislate and enforce stringent measures to prosecute and impose harsh
penalties on perpetrators of poisoning and those illegally trading in vulture parts. Explore
alternative, effective and legal predator control measures. Focus outreach programmes on
educating the collectors and users of vulture parts, herders that believe vultures kill stock,
and farmers using poisons illegally. These recommendations should be focussed in the
priority areas that were identified for adults and non-adults in Chapter 4 and discussed
above. In addition the use of lead ammunition, as a source of poisoning, needs to be
addressed by informing the hunting fraternity, farmers and protected area managers

212
involved in culling of the threat of lead and focussing on efforts to make alternative lead-free
ammunition readily available in the short term. However, it is essential that lobbying takes
place at a national level aimed at banning lead ammunition, as has been done in North
America and many European countries.
To address the threat of continuous development and encroachment into the core
range of the species, proposals for infrastructural development (e.g. houses, power lines,
wind farms) and activities (e.g. helicopter flights, cable-way developments) must either be; i)
rejected if the impacts cannot be adequately mitigated, ii) sited in the most appropriate
location to avoid or minimize negative impacts (e.g. Reid et al. in review), and iii) constructed
with acceptable (raptor friendly) mitigation measures. Existing unsafe infrastructure must be
identified proactively and modified/mitigated accordingly. A valuable partnership already
exists with Eskom and the Endangered Wildlife Trust (van Rooyen and Smallie 2006) which
must be strengthened and expanded to include the Lesotho Electricity Corporation. Priority
areas to be targeted for mitigation can be identified using the habitat use model developed
by Reid et al. (in review) which predicts important areas of Bearded Vulture use that may
conflict with wind turbines. This model can be adapted for other energy infrastructure.
Augmentation of the southern African population is a management option which
could be an effective strategy (see Hirzel et al. 2004, Schaub et al. 2009) and deserves
consideration. Since there is little genetic differentiation between populations globally, a
broad source population could be considered for this purpose. Augmentation to increase the
population growth rate and maintain sufficient genetic variability should be considered as a
future management objective and requires further investigation. Based on the high
probability of extinction in the short term in the event of no management intervention, the
implementation of a captive breeding programme and/or the removal and rearing of the
second egg should also be considered a priority in an effort to conserve a representative
sample of the population.

213
Increasing public awareness at all levels of society (from schools to politicians)
around the threats to vultures will enlist their support in addressing these threats and
obtaining the necessary economic resources to protect the species. An example of this is
International Vulture Awareness Day which is held annually across the globe.
The BMP for the species must be used as a tool to ensure the collaboration between
Lesotho and the three provinces of South Africa to achieve the goals and objectives of the
plan. It is essential that the BMP follows a similar legal approval and adoption process in
Lesotho to ensure commitment to implement the plan at government level. The combined
efforts of both countries in the implementation of the BMP should be maintained through the
Beareded Vulture Task Force.
Flagship Species as a Conservation Strategy
Conservation actions are dependent on economic, political, and social support to provide the
necessary funding required to achieve species’ conservation targets (Fleishman et al. 2011).
Economically, species that provide tangible benefits receive priority, i.e. “if it pays it stays”.
Legally, conservation relies on policies that address species conservation. Politically and
socially, conservation relies on societal values, aesthetic and commercial standards that
determine which species deserve conservation (Small 2011). Therefore as much as humans
are the primary cause of species’ extinctions, it is societal values regarding natural
resources that can be used to influence the extinction process. Once public support has
been obtained, political and economic support should follow.
The ‘flagship species’ approach is a worthwhile approach to gain public support to
conserve a species and its habitat. This approach involves using charismatic species to win
public favour for specific conservation efforts (Mittermeier 1986). The flagship species
approach is similar to the ‘umbrella species’ where the focus is on typically large animals,
requiring a lot of habitat and generally sharing a lot of living requirements with other
organisms in their range so that by protecting a larger area, other species are protected as
well (Shrader-Frechette and McCoy 1993). Umbrella species are often easily observed or

214
sampled, they have large home ranges, a long lifespan and their biology is well known.
These species are not necessarily the ones facing the biggest threat, however, in the case of
the Bearded Vulture conservation efforts focussed on this charismatic (Figure 7.2) and
Critically Endangered species will raise the profile of the species and its plight as well as
benefitting mountain habitats and the other scavengers and raptors within them. For
example the globally endangered Cape Vulture Gyps coprotheres is a colonial cliff nesting
vulture which also occurs in the Maloti-Drakensberg mountains. This species is exposed to
similar threats to those identified in this thesis for Bearded Vulture (e.g. Mundy et al. 1992,
Boshoff et al. 2011), therefore any conservation actions aimed at the Bearded Vulture will
also benefit the Cape Vulture.
Figure 7.2 The charismatic Bearded Vulture Gypaetus barbatus.
Simberloff (1998) suggested using keystone species as a slightly different approach to gain
support for single-species management. In many ecosystems, certain species have impacts
on many others, therefore such an approach may unite the best features of single species
and ecosystem management. The Bearded Vulture may not necessarily fit the criteria of a

215
keystone species, species whose presence and role within an ecosystem has a
disproportionate effect on other organisms within the system, but they could be used as a
flagship or umbrella species in a similar way. The Bearded Vulture being undoubtedly the
most charismatic of all vulture species could be used to epitomise vultures generally in
efforts to address the “African Vulture Crisis”.
Recommendations for further study
A summary of the recommendations for future research is as follows:
Since laying rate was calculated based on a small sub-sample of sites, a larger
sample size of reliable data from trained observers is required to monitor the effect of
management actions on productivity.
Further research should be undertaken on determining whether the factors affecting
survival are also affecting productivity, i.e. is productivity low as a result of adult
mortality rather than disturbance at the nest site or lack of food.
Although food shortage was found not to be associated with territorial abandonment,
its role in influencing productivity or recruitment through non-adult survival deserves
further investigation.
There was also no evidence to suggest that global warming is driving the
abandonment of territories, but the influence on other aspects of the species’
demography such as productivity or survival is warranted.
Continued tracking of the population will provide better survival estimates over time
which is essential for modelling population growth. In Chapter 6, age-specific survival
estimates were heavily influenced by the death of one or two individuals. Continued
tracking will also provide further information on mortality causes as well as data on
avoidance rates of new infrastructure such as wind farms, several of which are
proposed (and one approved) for development in the species’ range.
A research project dedicated to exploring lead levels in Bearded and Cape Vulture is
required to identify the sources of lead contamination in the environment, as many

216
birds in this study showed high levels of lead exposure. The research should focus
on spatial and temporal differences in lead exposure as well as examining other
aspects apart from lead levels in blood and bone, such as lead deposits in egg
shells.
Nuclear markers should be explored to further inform questions on the genetics of
the southern African population; such as whether the population is inbred and
whether nuclear diversity is as low as mitochondrial diversity was found to be.
Continued monitoring of the status and demography of the population is essential to
evaluate the success of the implementation of the management actions that have
been recommended above. Monitoring results should be used in the 5-year review
cycle of the BMP-S to inform future actions as part of an adaptive management
approach.
Conclusions
This work has demonstrated the importance of focussing on small populations, declining
populations and populations at the periphery of a species’ range. The African haplotypes are
possibly the major links within the global Bearded Vulture genetic network and the diversity
pattern hints at Africa being the ancestral population which provides support for managing
this peripheral population. My investigation into the decline of the Bearded Vulture in
southern Africa has demonstrated the value of single-species research and the use of a
number of different approaches to identify the mechanisms of decline and predict population
trends. Recommendations to address the species demise have been made, including the
use of the umbrella/flagship species approach to gain support for its conservation amongst a
host of other priority species or economic and development challenges.
This study has provided the necessary information to enable conservationists to
focus their interventions on specific issues and locations that will have the highest impact. In
so doing this study has also provided the evidence-base to justify the management

217
recommendations. As such this study contributes to achieving the objectives of the IUCN’s
Vulture Specialist Group and the Endangered Wildlife Trust’s Biodiversity Management Plan
for the Species (Krüger 2013) which will add value to Bearded Vulture conservation
strategies locally and internationally, and vulture conservation strategies in Africa. My
research is timely in an era where the decline in vulture populations is increasingly being
recognised as one of the most pressing issues in avian conservation globally and in Africa in
particular.
References
Alexandre R, Couvet, D and Sarrazin F (2007) Integration of demography and genetics in
population restorations. Ecosci 14: 463–471.
Allan DG and Jenkins AR (2005) Preliminary report on a survey of breeding sites of Bearded
and Cape Vultures in Lesotho. Durban Natural Science Museum, Durban, unpubl
report.
Anderson MD (2000) Bearded Vulture Gypaetus barbatus. In: Barnes KN (editor) The
Eskom Red Data book of birds of South Africa, Lesotho and Swaziland. Birdlife
South Africa, Johannesburg, pp. 39-41.
Bell BD and Merton DV (2002) Critically endangered bird populations and their
management. In: Norris K, Pain DJ (editors) Conserving Bird Biodiversity. General
principles and their application. Cambridge University Press, Cambridge UK.
Boshoff AF, Minnie JC, Tambling CJ and Michael M (2011) The impact of power line-related
mortality on the Cape Vulture Gyps coprotheres in a part of its range, with an
emphasis on electrocution. Bird Conserv Int 21: 311–327.
BirdLife International (2014) IUCN Red List for birds. Downloaded from
http://www.birdlife.org on 05/08/2014.

218
Brown LH (1977) The status, population structure, and breeding dates of the African
lammergeier Gypaetus barbatus meridionalis. Raptor Res 11: 49-58.
Brown CJ (1991) An investigation into the decline of the Bearded Vulture Gypaetus barbatus
in southern Africa. Biol Conserv 57: 315-337.
Brown CJ (1997) Population dynamics of the Bearded Vulture Gypaetus barbatus in
southern Africa. Afr J Ecol 35(1): 53-63.
Brown LH, Urban EK and Newman K (1982) The birds of Africa, Vol. 1. Academic Press,
New York.
Carrete M, Grande JM, Tella JL, Sánchez-Zapata JA, Donázar JA, Díaz-Delgado R and
Romo A (2007) Habitat, human pressure, and social behavior: partialling out factors
affecting large-scale territory extinction in an endangered vulture. Biol Conserv
136(1): 143-154.
Fleishman E et al. (2011) Top 40 Priorities for Science to Inform US Conservation and
Management Policy. Biosci 61(4): 290-300.
Heredia R (1991) Chapter 2 Biologia de la Reproduccion. In: Heredia R and Heredia B
(editors) El Quebrantahuesos (Gypaetus barbatus) en los Pirineos. ICONA, Madrid.
Green RE, Newton I, Schultz S, Cunningham AA, Gilbert M, Pain DJ, Prakash V (2004)
Diclofenac poisoning as a cause of vulture population declines across the Indian
subcontinent. J Appl Ecol 41: 793–800.
Hirzel AH, Posse B, Oggier P-A, Crettenand Y, Glenz C and Arlettaz R (2004) Ecological
requirements of reintroduced species and the implications for release policy: the case
of the bearded vulture. J Appl Ecol 41: 1103-1116.
Krüger S (2006) The 2005 Bearded Vulture (Gypaetus barbatus meridionalis) Ground
Survey, South Africa. Ezemvelo KZN Wildlife, unpubl report.

219
Krüger S (editor) (2013) Biodiversity Management Plan for the Bearded Vulture (Gypaetus
barbatus meridionalis) for Southern Africa. Published 8 May 2014 Government
Gazette Notice No 37620.
Krüger S (in press) Bearded Vulture. In Taylor MR (editor) The Eskom Red Data Book of
Birds of South Africa, Lesotho and Swaziland. BirdLife South Africa, Johannesburg.
Krüger S, Piper S, Rushworth I, Botha A, Daly B, Allan D, Jenkins A, Burden D, Friedmann Y
(editors) (2006) Bearded Vulture (Gypaetus barbatus meridionalis) Population and
Habitat Viability Assessment Workshop Report. Conservation Breeding Specialist
Group (SSC/IUCN)/CBSG Southern Africa, Endangered Wildlife Trust,
Johannesburg.
Krüger SC, Allan DG, Jenkins AR and Amar A (2014a) Trends in territory occupancy,
distribution and density of the Bearded Vulture Gypaetus barbatus meridionalis in
southern Africa. Bird Conserv Int 24: 162-177. doi:101017/S0959270913000440.
Krüger SC, Wesche PL and Jansen van Vuuren, B (2014b) Reduced genetic diversity in
Bearded Vultures Gypaetus barbatus in Southern Africa. doi: 10.1111/ibi.12200.
Margalida A, García D, Bertran J and Heredia R (2003) Breeding Biology and success of the
Bearded Vulture Gypaetus barbatus in eastern Pyrenees. Ibis 145: 244-252.
Mittermeier RA (1986) Primate conservation priorities in the Neotropical region. In:
Benirschke K (editor) Primates: the Road to Self-sustaining Populations, Springer-
Verlag, New York, pp. 221–240.
Mundy P, Butchart D, Ledger J and Piper S (1992) The Vultures of Africa. Russel Friedman
Books CC, Johannesburg, South Africa.
Newton I (1979) Population ecology of raptors. T and AD Poyser, Berkhamsted.

220
Schaub M, Zink R, Beissmann H, Sarrazin F and Arlettaz R (2009) When to end releases in
reintroduction programmes: demographic rates and population viability analysis of
bearded vultures in the Alps. J Appl Ecol 46: 92-100.
Shrader-Frechette KS and McCoy ED (1993) Method in Ecology. Strategies for
Conservation. Cambridge University Press, Cambridge.
Simberloff D (1998) Flagships, umbrella and keystones: is single-species management
passé in the landscape era? Biol Conserv 83(3): 247-257.
Small E (2011) The new Noah's Ark: beautiful and useful species only. Part 1. Biodiversity
conservation issues and priorities. Biodiversity 12(4): 232-247.
Taylor MR (editor) (in press) The Eskom Red Data Book of Birds of South Africa, Lesotho
and Swaziland. BirdLife South Africa, Johannesburg.
Terrasse JF (1991) Chapter 11. Le Gypaete Barbu dans les Pyrenees Francaises. In:
Heredia R and Heredia B (editors) El Quebrantahuesos (Gypaetus barbatus) en los
Pirineos. ICONA, Madrid.
van Rooyen CS and Smallie J (2006) The Eskom – Endangered Wildlife Trust Strategic
Watson 1990, Partnership in South Africa: A brief summary. Nature and Faune 21(1):
25.

221
Photo 8 Juvenile Bearded Vulture taking off from a Drakensberg cliff