some pharmacokinetic data and dosage …ibic.lib.ku.ac.th/e-bulletin/ibbu201702009.pdf · pigs and...
TRANSCRIPT

Buffalo Bulletin (April-June 2017) Vol.36 No.2
335
ABSTRACT
Danofloxacin is a fluoroquinolone antibiotic which is extensively used against a variety of bacterial infection in animals worldwide except in Pakistan. The optimal dosage regimen of danofloxacin was necessary in order to use this drug therapeutically and to minimize the emergence of bacterial resistance in local buffaloe breeds in Pakistan. For this, the present study aimed to investigate the pharmacokinetics behavior and optimal dosage regimen of danofloxacin in 16 adult healthy buffaloes, 8 each of Nili-Ravi and Kundhi breed following single intravenous administration at the dose of 2.5 mg/kg body weight. Blood samples (5 ml) were drawn from jugular vein in heparinized plastic centrifuge tubes at zero and 0.083, 0.167, 0.25, 0.5, 0.75, 1, 1.5, 2, 4, 6, 8, 10, 12, 24 h after injection and drug concentrations in plasma were measured by HPLC method. The distribution of drug was rapid whereas elimination was low in both breeds. Volume of distribution at steady state (Vss) was significantly (P<0.05) higher in Kundhi buffaloes indicating the extensive
distribution of danofloxacin in Kundhi than Nili-Ravi buffaloes. However, the total body area covered by drug was remarkably lower in Kundhi than Nili-Ravi buffaloes as indicated by lower values of area under concentration time curve (AUC) in Kundhi than Nili-Ravi buffaloes. Total body clearance (ClB) was significantly (P<0.05) faster in Kundhi buffaloes than Nili-Ravi buffaloes. The mean residence time (MRT) was noted to be (Mean±SD) 4.78±0.52 and 4.44±0.37 h in Nili-Ravi and Kundhi buffaloes respectively. On the basis of pharmacokinetic parameters, suitable intravenous dosage regimens for danofloxacin in Nili-Ravi and Kundhi buffaloes would be 6.5 and 8.3 mg/kg to be repeated after 12 h intervals. The present study is the foremost pharmacokinetics study of danofloxacin in the local species which would provide the valuable contribution in the local manufacturing of danofloxacin in Pakistan in future.
Keywords: buffaloes, Bubalus bubalis, pharmacokinetics, danofloxacin, dosage regimen, plasma protein binding
SOME PHARMACOKINETIC DATA AND DOSAGE REGIMEN OF DANOFLOXACIN AFTER INTRAVENOUS ADMINISTRATION IN NILI-RAVI AND KUNDHI BUFFALOES
Zahid Manzoor1,*, Shaukat Hussain Munawar2, Zahid Iqbal2 and Muhammad Abdullah Abid3
1Department of Biosciences, Faculty of Veterinary Sciences, Bahauddin Zakariya University, Multan, Pakistan, *E-mail: [email protected] of Pharmacology, Al-Nafees Medical College, Isra University, Islamabad, Pakistan3Department of Physiology and Pharmacology, Faculty of Veterinary Science, University of Agriculture, Faisalabad, Pakistan
Original Article

Buffalo Bulletin (April-June 2017) Vol.36 No.2
336
INTRODUCTION
Danofloxacin (DNF) is a synthetic antibacterial agent of fluoroquinolone group, developed specifically for veterinary use. DNF possesses great potential against a variety of microorganisms by concentration-dependent killing mechanisms (Sarasola et al., 2002). In field experiments, DNF was found to be highly effective in the treatment of bovine respiratory diseases associated with Pasteurella and Mannheimias species (Giles, 1996). Pasteurella multocida is the primary cause of Haemorrhagic septicemia (HS), which is a common disease of buffaloes and cattle causing high mortality in many countries of Asia, Middle East and sub-Saharan Africa (Verma and Jaiswal, 1998). Moreover, DNF displayed great potential against respiratory as well as many other infections caused by Mycoplasma species in cattle, pigs and poultry (Cooper et al., 1993).
For the successful therapy, optimal dose of any drug should be strictly followed during the treatment. Wiuff et al. (2003) suggested the suboptimal dosage regimens of fluoroquinolones to be an important risk factor for the emergence of resistance in experimental studies. One clinical approach to prevent the resistance is to adjust the antibiotic dosage regimens upwards to the mutant prevention concentrations. Thus, the pharmacokinetic study of a drug is required in the species in which the drug is going to be used clinically for the selection of optimal dosing schedule.
Many drugs at the same dose rate showed variable pharmacological effects due to the diverse pharmacokinetics behavior among several species. Sidhu (2001) have determined such differences in fluoroquinolones. In addition, many studies revealed that the pharmacokinetics behavior,
optimal dosage, renal clearance and urinary excretion of the investigated drugs were different under indigenous conditions when compared with the values given in the literature or in the product inserts supplied by the manufacturers (Muhammad, 1997). The change in the genetic makeup has an influence on the biodisposition and fate of drugs in a population (Muhammad et al., 2003). Such geonetical influences have been reported for blood and urine pH, blood proteins, drug metabolism and kidney function in buffaloes, cows, sheep and goats (Nawaz et al., 1988). In veterinary field, DNF is being used successfully in many parts of the world except in Pakistan. The pharmacokinetics of danofloxacin has been studied in cattle, sheep and goats (McKellar et al., 1998; Aliabadi and Lees, 2001; Sarasola et al., 2002). Recently, Sappal et al. (2009) examined the kinetic behavior of DNF in buffalo calves, but no study exists describing the pharmacokinetics of DNF in adult buffaloes. Therefore, the present project has been planned to determine the pharmacokinetics and optimal dosage regimen of DNF following intravenous administration in adult local buffaloes of two breeds (Nili-Ravi and Kundhi) and to explore the interspecies variation between them. In Pakistan, this is the first study regarding the pharmacokinetics behavior of DNF in local buffaloes. The study will facilitate the pharmaceutical companies/manufacturers in the local manufacturing of DNF in Pakistan.
MATERIAlS AND METHODS
Experimental animalsThe study was performed in sixteen healthy
adult female buffaloes, eight each of Nili-Ravi and Kundhi breed, weighting between 350 to 430 kg

Buffalo Bulletin (April-June 2017) Vol.36 No.2
337
and 310 to 370 kg respectively. The animals were 2 to 3 years of age of both breeds. The animals were kept at Livestock Experimental Farm, Institute of Nutrition and Feed Technology, University of Agriculture, Faisalabad and examined for any apparent clinical condition for 2 weeks prior start of the experiment. All the buffaloes were housed in a separate pen provided by wire mesh barriers to maintain social contact. The animals were fed on seasonal green fodder and water was provided ad libitum. The research protocol was critically reviewed and approved by the Institutional Animal Ethics Committee (IAEC). The animals were cared for according to the national animal welfare guidelines and technical supervision was provided at all the times.
MethodologyThe animals were weighted individually
and restrained in standing position before the start of each experiment. One of the jugular veins of each animal was cannulated under strict aseptic conditions with plastic cannula No. 90 (Protex Ltd., England) for the collection of blood samples. A commercial preparation of danofloxacin mesylate (CAS 119478-55-6) in powdered form was procured from Hanqzou Thick Chemical Co. Ltd. China. An injectable preparation of danofloxacin (10%) was prepared and injected intravenously in the jugular vein at dose rate of 2.5 mg/kg body weight to each animal.
The blood samples (5 ml) were drawn from jugular vein in heparinized plastic centrifuge tubes at zero and 0.083, 0.167, 0.25, 0.5, 0.75, 1, 1.5, 2, 4, 6, 8, 10, 12, 24 h post administration of drug. The plasma was separated and stored at -20ºC until analysis.
Analytical procedureDanofloxacin concentrations in plasma
were determined by High Performance Liquid Chromatographic (HPLC) method as described by Soback et al. (1994) with certain modifications.
ChemicalsAll the chemicals used were analytical
grade. Danofloxacin standard (Danofloxacin mesylate, 99%) was used as external standard, while the paracetamol (Paracetamol 99.7%) was used as internal standard (IS); these standards were requested from the Ferozssons Pvt. Ltd., Pakistan. Methanol and acetonitrile (Fisher Scientific Limited, UK) and phosphoric acid (Merk, Germany) were used.
Instrumentation and chromatographic conditions
The HPLC system contained quarternary solvent delivery module, a UV- and visual-light variable-wavelength detector (Sykam, S-3210) and an integrator (HP 1050; Hewlett-Packard, Waldbron, Germany). A reversed-phase base deactivated column packed with YMC pack A-312 (Thermo Hypersil-Keystone, BDS-C18 with 250 × 4.6 mm dimensions and 5 µm particle size) was used. The column was protected with a pre-column (Guard-PakTM) filled with a µBondapakTM C18 cartidge (Thermo Hypersil, England). The mobile phase consisted of a mixture of 800 ml of 14 ml/L phosphoric acid (Merk, Germany) and 200 ml of acetonitrile (Fisher Scientific Limited, UK) per liter at pH 6.0. The flow rate was set at 1 ml/min. The detector wavelength was adjusted to 275 nm. The lower limit of detection (LOD) was 0.005 µg/ml while the limit of quantitation (LOQ) was 0.25 µg/ml. The output of the detector was monitored with computer software (Peak Simple Chromatography
Buffalo Bulletin (April-June 2017) Vol.36 No.2
338
Data System, Buck Scientific Inc., East Norwalk). Separation of danofloxacin was achieved at 37oC, using an isocratic mode.
Stock solutions and standardsDanofloxacin and paracetamol (IS) were
made up as 1 g/L stock solutions in methanol and distilled water (1: 10, by volume). Danofloxacin was diluted with distilled water to make additional working stocks of 10 mg/L for the plasma assay. Paracetamol was diluted with mobile phase to make a single working IS stock solution of 1 mg/ml. Plasma calibrators (0.5 to 32 µg/ml) for the calibration curve were prepared in drug-free control plasma. The working solutions were used to supplement the drug free matrics.
Sample preparationIn a centrifuge tube, 2 ml of acetonitrile
was added to 1 ml of plasma or plasma calibrator. The mixture was vortexed for one minute and centrifuged for 30 minutes at 4000 rpm. The supernatant was transferred into a glass tube and evaporated to dryness in a water bath. The residue was then reconstituted in 10 µl of IS and 1 ml of 14 ml/L phosphoric acid. The final solution was again vortexed for 30 seconds; filtered through cellulose acetate membrane filter (Sartorius AG, Germany, 13 mm diameter) and 0.2 µl was injected into the HPLC system.
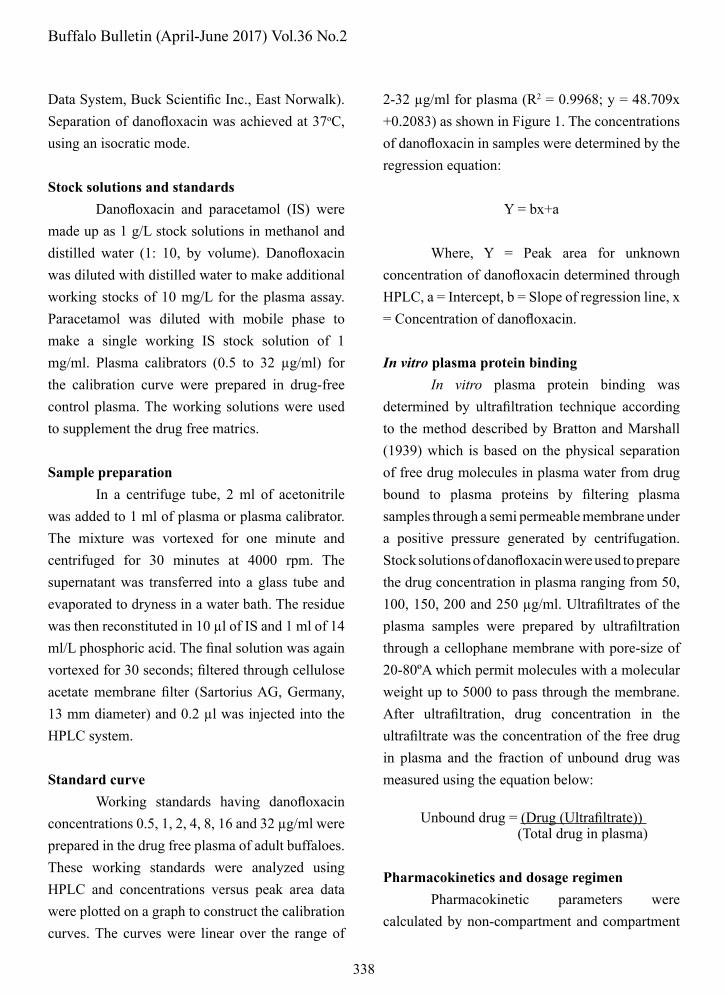
Standard curveWorking standards having danofloxacin
concentrations 0.5, 1, 2, 4, 8, 16 and 32 µg/ml were prepared in the drug free plasma of adult buffaloes. These working standards were analyzed using HPLC and concentrations versus peak area data were plotted on a graph to construct the calibration curves. The curves were linear over the range of
2-32 µg/ml for plasma (R2 = 0.9968; y = 48.709x +0.2083) as shown in Figure 1. The concentrations of danofloxacin in samples were determined by the regression equation:
Y = bx+a
Where, Y = Peak area for unknown concentration of danofloxacin determined through HPLC, a = Intercept, b = Slope of regression line, x = Concentration of danofloxacin.
In vitro plasma protein bindingIn vitro plasma protein binding was
determined by ultrafiltration technique according to the method described by Bratton and Marshall (1939) which is based on the physical separation of free drug molecules in plasma water from drug bound to plasma proteins by filtering plasma samples through a semi permeable membrane under a positive pressure generated by centrifugation. Stock solutions of danofloxacin were used to prepare the drug concentration in plasma ranging from 50, 100, 150, 200 and 250 µg/ml. Ultrafiltrates of the plasma samples were prepared by ultrafiltration through a cellophane membrane with pore-size of 20-80ºA which permit molecules with a molecular weight up to 5000 to pass through the membrane. After ultrafiltration, drug concentration in the ultrafiltrate was the concentration of the free drug in plasma and the fraction of unbound drug was measured using the equation below:
Unbound drug = (Drug (Ultrafiltrate))
(Total drug in plasma)
Pharmacokinetics and dosage regimenPharmacokinetic parameters were
calculated by non-compartment and compartment

Buffalo Bulletin (April-June 2017) Vol.36 No.2
339
analyses with non linear least square regression method using a computerized program WinNonlin (Pharsight Corporation, Mountain View, version 6.3, CA, USA). For comparing the pharmacokinetic parameters obtained by two methods, Mininmum Akaike Information Criteria Estimates (MAICE) in different models were applied to determine the best fit of model for each animal (Yamaoka et al., 1978).
The maintenance dose (D) was based on the minimum effective concentration (CºP (min))/peak desired concentration of the drug in plasma which is sufficient to eradicate the bacterial population in the body. The equation was given by:
D = CºP (min). Vd (eβt-1)
Where, CºP represents the minimum effective concentration/peak desired plasma
drug concentration, Vd denotes the volume of distribution, e =exponantional term, β = over all elimination rate constant, t = time at which dose was calculated.
The priming dose was obtained by omitting “-1” from the above equation.
STATISTICAl ANAlYSIS
Mean with standard deviation values for each parameter was calculated by Microsoft Excel version 2007. Two tailed Student’s T test was used to compare the pharmacokinetic parameters in Nilli-Ravi and Kundhi buffaloes. P<0.05 was considered as significant.
Figure 1. Standard curve of danofloxacin in plasma of buffaloes.

Buffalo Bulletin (April-June 2017) Vol.36 No.2
340
RESUlTS AND DISCUSSION
The chromatogram of danofloxacin standard in the plasma of buffaloes is presented in Figure 2. The Mean±SD plasma levels of danofloxacin versus different time intervals as a function of time following intravenous administration in Nili-Ravi and Kundhi buffaloes
are described as a semi-logarithmic plot (Figure 3). The pharmacokinetic parameters obtained are depicted in Table 1.
Data were best fitted by a two-compartment model with no lag time in all the buffaloes.
C(t) = Ae-αt + Be-βt
Figure 2. Chromatogram of 32 µg/ml danofloxacin standard in the plasma of buffalo.
Figure 3. Semilogarithmic plot of danofloxacin concentrations (mean±SD) in plasma following (i.v.) administration at dose rate of 2.5 mg/kg in Nili-Ravi and Kundhi buffaloes.

Buffalo Bulletin (April-June 2017) Vol.36 No.2
341
Where C(t) is the plasma concentration of danofloxacin; t is the time after drug administration; A and α are the intercepts and slope of the distribution phase; B and β are the intercepts and slope of the elimination phase; and e is the base of natural logarithm.
The Mean±SD plasma concentration of danofloxacin was significantly (P<0.05) lower (3.00±0.17 µg/ml) in Kundhi buffaloes than Nili-Ravi buffaloes (3.30±0.19 µg/ml) obtained at 5 minutes after injection. The plasma concentration
declined in two phases, i.e. a rapid decline to 1.16±0.22 µg/ml and 0.90±0.20 µg/ml at 2 h, followed by a slow decline to 0.056±0.028 µg/ml and 0.03±0.015 µg/ml at 24 h in Nili-Ravi and Kundhi buffaloes respectively. The maximum concentration (Cpº) achieved after danofloxacin administration at zero time was considerably (P<0.05) lower (3.32±0.25 µg/ml) in Kundhi buffaloes as compared to Nili-Ravi buffaloes (3.66±0.74 µg/ml). In the current study, danofloxacin was detected up to 24 h in plasma
Table 1. Pharmacokinetic parameters of danofloxacin after IV administration in 16 buffaloes (Mean ± SD) using two compartment model.
Parameter/variable Nili-Ravi buffaloes Kundhi buffaloesA (µg mL-1) 1.72±0.11 1.86±0.32B (µg mL-1) 1.94±0.21 1.46±0.46*Cpº (µg mL-1) 3.66±0.14 3.32±0.25*t1/2α (hr) 0.25±0.09 0.31±0.10t1/2β (hr) 3.26±0.43 3.49±0.87k12 (L.hr-1) 1.11±0.28 1.02±0.31k21 (L.hr-1) 1.63±0.31 1.64±0.32AUC (µg. h. mL.-1) 9.80±2.14 7.74±0.98*ClB (Lkg-1 h-1) 0.49±0.21 0.32±0.04*Kel (L.hr-1) 0.38±0.06 0.43±0.05α (hr) 2.92±0.59 2.48±0.78β (hr) 0.21±0.02 0.20±0.04Vdarea (L.kg-1) 2.28±0.86 1.67±0.54Vss (L.kg-1) 1.14±0.12 1.47±0.37*Vc (L.kg-1) 0.68±0.02 0.75±0.05*
A,B = Y-axis intercept terms for distribution and elimination phases, Cpº = Plasma drug concentration at the time of drug administration, t1/2α=Distribution half life, t1/2β = Elimination half-life, AUC = Area under concentration, ClB = Total body clearance, Kel = Elimination rate constant, α and β = Distribution and Elimination rate constants, Vdarea = Volume of distribution at terminal phase of elimination, Vss = Volume of distribution at steady state, Vc = Volume of central compartment. *Significant at (P< 0.05).

Buffalo Bulletin (April-June 2017) Vol.36 No.2
342
after higher doses (2.5 mg/kg) in both breeds of buffaloes. Apley and Upson (1993) also reported the similar findings in cow calves. Similarly, some other investigators (Shem-Tov et al., 1998; McKellar et al., 1999; Shojaee Aliabadi and Lees, 2003) documented the DNF detection up to 24 h in various biological fluids. Hence, the results of present study are consistent with the results described by Apley and Upson (1993); Shem-Tov et al. (1998); McKellar et al. (1999); Shojaee Aliabadi and Lees (2003). On the other hand, DNF was quantified up to 4 h in goats and 12 h in cattle (Giles et al., 1991; Atef et al., 2001).
The distribution half-life (t1/2α) was 0.25±0.09 and 0.31±0.10 h, whereas, elimination half-life (t1/2β) for DNF was 3.26±0.43 and 3.49±0.87 h in Nili-Ravi and Kundhi buffaloes respectively with no significant difference between them (Table 1). Sappal et al. (2009) determined this value to be 0.16±0.07 hours in buffalo calves. Similarly, rapid distribution of danofloxacin was also observed in cows, ewes and goats (Atef et al., 2001; Shem-Tov et al., 1997, 1998).
The higher volume of distribution at steady state (Vss) suggests the good tissue penetration of DNF in adult local buffaloes. However, the value of Vss was remarkably lower in Nili-Ravi buffaloes (1.14±0.12 L/kg) than Kundhi buffaloes (1.47±0.37 L/kg) indicating the best tissue penetration of DNF in Kundhi buffaloes than Nili-Ravi buffaloes, but at terminal phase (Vdarea), these values were insignificant between them. However, the values of Vdarea in both breeds were lower than value of (Vdarea = 4.35±2.02 L/kg) articulated by Sappal et al. (2009) in buffalo calves. The volume of the central compartment (Vc) was also lower in Nili-Ravi buffaloes (0.68±0.02 L/kg) than Kundhi buffaloes (0.75±0.05 L/kg).
Area under the plasma concentration time
curve (AUC) was lower (7.74±0.98 µg.h.mL-1) in Kundhi buffaloes as compared to Nili-Ravi buffaloes (9.80±2.14 µg.h.mL-1) suggesting the large body area covered by DNF in Nili-Ravi than Kundhi buffaloes. Sappal et al. (2009), on the other hand, determined the lower value of AUC (1.79±0.028 µg.hr/ml) than the current values (9.80±2.14 and 7.74±0.98 µg.hr/ml) at lower doses (1.25 mg/kg) in buffalo calves. Kundhi buffaloes exhibited faster clearance (0.30±0.05 L.kg-1h-1) than Nili-Ravi buffaloes (0.23±0.05 L.kg-1h-1) in non compartment analysis (Table 2). The elimination half life (t1/2β) was comparable (P>0.05) in both breeds of adult buffaloes in the current study, but shorter than (t1/2β = 4.24±1.78 h) in buffalo calves at lower doses (Sappal et al., 2009). Aliabadi et al. (2003) determined this value to be 3.39 h following intravenous administration of DNF at dose rate of 1.25 mg/kg in sheep. The values of total body clearance (ClB = 0.23±0.05 and 0.30±0.05 L.kg-
1h-1), suggested the low elimination of DNF in both breeds. To classify the drug clearance, Toutain and Bousquet-Melou (2004) determined the breakpoint clearance values as high (28 ml/kg/min), medium (12 ml/kg/min) or low (5.8 ml/kg/min), based on extraction ratios of 0.35, 0.15 and 0.05 respectively. DNF clearance (3.83 ml/kg/min) in Nili-Ravi and (5 ml/kg/min) in Kundhi buffaloes may be classified as low clearance in the current study. The mean residence time (4.78±0.52 and 4.44±0.37 h) values obtained by non-compartmental analysis were also in close agreement of low clearance as indicated by ClB values in Nili-Ravi and Kundhi buffaloes.
At plasma concentrations of 50 to 250 µg/ml, the extent of plasma protein binding of DNF ranged from 23.6% to 30.4% with an overall mean of 27±2.83% in current study (Table 3). In general, the plasma protein binding of fluoroquinolones is

Buffalo Bulletin (April-June 2017) Vol.36 No.2
343
Table 2. Pharmacokinetic parameters of danofloxacin after IV administration in 16 buffaloes (Mean ± SD) using non-compartment model.
Parameter Nili-Ravi buffaloes Kundhi buffaloesAUC0-last (µg. h. mL-1) 10.3±2.0 8.07±1.21*AUC0-∞ (µg. h. mL-1) 10.96±2.3 8.31±1.39*AUMC0-∞ (µg. h2. mL-1) 74.0±30.6 44.9±15.2*MRT0-last (hr) 4.78±0.52 4.44±0.37λz (L.hr-1) 0.11±0.05 0.14±0.043Cmax (µg.mL-1) 3.30±0.19 3.00±0.17*Vss (L.kg-1) 1.50±0.34 1.59±0.22ClB (L.kg-1 h-1) 0.23±0.05 0.30±0.05*
AUC0-∞ = Area under plasma concentration-time curve, AUMC0-∞ = Area under the first moment curve, MRT0-last = Mean residence time to last sampling time, λz = Exponential constant for the terminal phase, Cmax = Maximum plasma concentration, Vss = Volume of distribution at steady state, ClB = Total body clearance. *Significant at (P<0.05).
Table 3. Mean±SD in vitro danofloxacin binding to plasma proteins of adult buffaloes (Each data point is average of 3 determinants).
Total drug(µg/ml)
Drug concentration (µg/ml) Percent drugFree Bound Free Bound
50 34.8±1.65 15.2±1.07 69.6±1.58 30.4±1.47100 71.4±0.98 28.6±1.85 71.4±2.41 28.6±2.04150 108.2±1.84 41.8±1.07 72.1±0.97 27.8±1.06200 150.8±0.67 49.2±0.86 75.4±1.19 24.6±0.97250 190.9±1.04 59.1±2.14 76.3±2.87 23.6±1.43
Overall mean ± SD = 27.0±2.83
low and it directly affects the kinetic behavior and therapeutic efficacy of the drug. Sappal et al. (2009) determined relatively higher (36%) plasma protein binding for DNF in buffalo calves as compared to the current value (27%) in adult buffaloes. The low plasma protein binding along with other physicochemical properties of DNF may allow
its widespread penetration into intracellular and extra vascular sites, which was further supported by high values of Vss (1.14±0.12 and 1.47±0.37 L/kg) obtained in both breeds. The plasma protein binding of fluoroquinolones differ largely amongst species. Kaartinen et al. (1995) reported 36 to 45% protein binding for enrofloxacin in lactating

Buffalo Bulletin (April-June 2017) Vol.36 No.2
344
cows, whereas, 70% binding of ciprofloxacin was observed in calves (Nouws et al., 1988).
The optimal dosage regimens of DNF based upon the pharmacokinetic parameters were calculated in both breeds of buffaloes (Table 4). The calculations of priming and maintenance doses of DNF following intravenous administration were based upon the minimum effective concentration CºP (min) or minimum inhibitory concentration (MIC) of DNF in blood. The minimum effective concentrations of DNF CºP (min) 0.02, 0.03, 0.05, 0.1, 0.2, 0.3, 0.4, 0.5, 0.75 and 1 µg/ml have been used in the calculations for each time interval. The priming and maintenance doses of DNF in Nili-Ravi buffaloes at MIC=0.5 µg/ml were 7.08 and 6.51 mg/kg, and in Kundhi buffaloes 9.14 and 8.31 respectively; to be repeated after 12 h interval.
In vitro, DNF has great potential against a variety of microorganisms. Rowan et al. (2004) reported the MIC90 of 0.25 and 0.06 μg/ml for DNF against Mannheimia haemolytica and Pasteurella multocida, respectively. Various pharmacokinetic/pharmacodynamic (PK/PD) indices have been proposed to predict the effectiveness of an antibiotic (Aliabadi and Lees, 2000). Three PK/PD indices are commonly used. These include T > MIC when the antibiotic is time
dependent, AUIC (AUC/MIC) and Cmax/MIC when antibiotic is concentration dependent Pickerill et al. (2000) proposed that AUIC (AUC:MIC) is a better interpreter of antibacterial activity of fluoroquinolones as compared to the time during which plasma concentration exceeds the MIC level. The Cmax/MIC ratio has no meaning in terms of PK/PD index in this study being the intravenous administration. Brown (1996) suggested the AUIC value of 125 h for DNF against Mannheimia haemolytica (MIC90=0.25 μg/ml) for obtaining optimal efficacy. In order to calculate the AUIC in this study, the MIC50 value of 0.06 μg/ml value has been used for DNF against Pasteurella multocida. The determined value of AUIC was 163 and 129 h for a dosage of 2.5 mg/kg in Nili-Ravi and Khundhi buffaloes respectively. Thus, the current dose of 2.5 mg/kg/24 h of DNF is adequate against the Pasteurella multocida with (MIC50=0.06 μg/ml) in both breeds. But the optimal dose is the amount of drug that rapidly kills as well as inhibits the re-growth of bacteria without the support of host defense mechanisms (Toutain et al., 2002). By incorporating the (MIC90=0.25 μg/ml) of DNF against Pasteurella multocida, the determined values of AUIC were 39.2 h in Nili-Ravi and 30.9 h in Kundhi buffaloes. The values of the surrogate
Table 4. Intravenous dosage regimen of danofloxacin (mg/kg) to be repeated after 12 h for different dosing intervals and minimum effective concentrations in adult buffaloes.
Breed
Minimum Effective
Concentration (µg/ml)
0.02 0.03 0.05 0.1 0.2 0.3 0.4 0.5 0.75 1
Nili-Ravi
Priming dose 0.28 0.43 0.71 1.41 2.83 4.25 5.66 7.08 10.6 14.16Maintenance dose 0.26 0.39 0.65 1.30 2.60 3.90 5.21 6.51 9.7 13.02
KundhiPriming dose 0.36 0.54 0.91 1.82 3.66 5.49 7.31 9.14 13.7 18.3
Maintenance dose 0.33 0.49 0.83 1.66 3.32 4.99 6.65 8.31 12.4 16.6

Buffalo Bulletin (April-June 2017) Vol.36 No.2
345
marker obtained by PK-PD integration in the present study fall below of suggestive values (AUIC=125 h). Hence, it is supposed that the current dose of 2.5 mg/kg will promote the resistant mutants in the adult local buffaloes.
The optimal dosage regimen of DNF by means of pharmacokinetic parameters obtained in this study for the treatment of diseases caused by susceptible bacteria with MIC90 of≤0.50 μg/ml computed after intravenous administration at 12 h time interval are 6.5 mg/kg and 8.31 mg/kg body weight in Nili-Ravi and Kundhi buffaloes respectively. It is speculated that these dosage regimens might achieve the desired value of AUIC=125 h; predictor of antibacterial activity. Further, the plasma concentrations will remain in mutant prevention window as a minimum for 75% of dosage time interval which is essential for fluoroquinolones to ensure the bacteriological eradication and emergence of resistance explained by Drlica (2003). In another study, the optimal dose of DNF was supposed to be 6 mg/kg on the basis of clinical reports. Brown (1996) demonstrated that the administration of DNF at dose rate of 6 mg/kg in European cattle achieved an AUIC of 126 h and successful therapeutic efficacy of this dose was seen against natural outbreaks of calf respiratory disease.
This is the first study regarding the pharmacokinetics behavior of DNF in local adult buffaloes in Pakistan. The study will aid in the local manufacturing of DNF in the light of its pharmacokinetic profile in these species. However, further detailed pharmacodynamic studies of DNF in adult local buffaloes are required to identify an actual as opposed to an assumed MIC90 for confirming the dose by generating sufficient data from field isolates in future studies before issuing final recommendations.
CONClUSION
The pharmacokinetics behavior of danofloxacin displayed some inter and intra species variations due to the difference in the environment and genetic makeup among species. The current dose of 2.5 mg/kg body weight may promote the bacterial resistance in Nilli-Ravi and Kundhi buffaloes. Hence, the suggested doses of 6.5 and 8.31 mg/kg/12 h calculated on the basis of PK/PD integration in the current study may be optimum doses for successful therapeutic outcome and prevention of mutant selection pressure. The computed dosage regimens will help in the local manufacturing of the drug and can be used to establish disposition kinetics of danofloxacin following extra vascular administration in buffalo species. However, there is further need to conduct detailed pharmacodynamic studies of danofloxacin against respiratory disease causing organisms in buffalo species in order to establish PK-PD inter-relationships.
ACKNOWlEDGMENTS
The study was funded by Higher Education Commission, Pakistan. The authors thank to the Chairman, HEC, Pakistan for providing the enough funds for the study and special thanks to Dr. Nathan Teuscher, Founder and President, PK/PD Associates, Pvt. Ltd., USA for his technical assistance throughout the experiment.
REFERENCES
Aliabadi, F.S. and P. Lees 2000. Antibiotic treatment for animals: effect on bacterial population

Buffalo Bulletin (April-June 2017) Vol.36 No.2
346
and dosage regimen optimisation. Int. J. Antimicrob. Ag., 14: 307-313.
Aliabadi, F.S. and P. Lees. 2001. Pharmacokinetics and pharmacodynamics of danofloxacin in serum and tissue fluids of goats following intravenous and intramuscular administration. Am. J. Vet. Res., 62: 1979-1989.
Aliabadi, F.S., M.F. Landoni and P. Lees. 2003. Pharmacokinetics (PK), pharmacodynamics (PD), and PK-PD integration of danofloxacin in sheep biological fluids. Antimicrob. Agents Chemother., 47: 626-635.
Apley, M.D. and D.W. Upson. 1993. Lung tissue concentrations and plasma pharmacokinetics of danofloxacin in calves with acute pneumonia. Am. J. Vet. Res., 54: 937-943.
Atef, M., A.Y. El-Gendi, M.M.A. Amer and A.M. El-Aty. 2001. Some pharmacokinetic data for danofloxacin in healthy goats. Vet. Res. Commun., 25: 367-377.
Bratton, A.C. and E.K. Marshall. 1939. A new coupling component for sulfanilamide determination. J. Biol. Chem., 128: 537-550.
Brown, S.A. 1996. Fluoroquinolones in animal health. J. Vet. Pharmacol. Ther., 19: 1-4.
Cooper, A.C., J.R. Fuller, M.K. Fuller, P. Whittlestone and D.R. Wise. 1993. In vitro activity of danofloxacin, tylosin and oxytetracycline against mycoplasmas of veterinary importance. Res. Vet. Sci., 54: 329-334.
Drlica, K. 2003. The mutant selection window and antimicrobial resistance. J. Antimicrob. Chemoth., 52: 11-17.
Giles, C.J., R.A. Magonigle, W.T.R. Grimshaw, A.C. Tanner, J.E. Risk, M.J. Lynch and J.R.
Rice. 1991. Clinical pharmacokinetics of parenterally administered danofloxacin in cattle. J. Vet. Pharmacol. Ther., 14: 400-410.
Giles, C.J. 1996. Discovery and development of danofloxacin for treatment of respiratory disease in cattle. In Proceedings of the Pfizer Scientific Symposium, Edinburgh, Scotland, UK.
Kaartinen, L., M. Salonen, Alli and S. Pyorala. 1995. Pharmacokenetics of enrofloxacin after single intravenous, intramuscular and subcutaneous injections in lactating cows. J. Vet. Pharmacol. Ther., 18: 357-362.
Mckellar, Q.A., I.F. Gibson and R.Z. McCormack. 1998. Pharmacokinetics and tissue disposition of danofloxacin in sheep. Biopharm. Drug Dispos., 19: 123-129.
Mckellar, Q.A., I. Gibson, A. Monteiro and M. Bregante. 1999. Pharmacokinetics of enrofloxacin and danofloxacin in plasma, inflammatory exudate, and bronchial secretions of calves following subcutaneous administration. Antimicrob. Agents Chemother., 43: 1988-1992.
Muhammad, F. 1997. Disposition kinetics, renal clearance and urinary excretion of kanamycin in mule. MSc. Thesis, Department of Physiology and Pharmacology, University of Agriculture, Faisalabad, Pakistan.
Muhammad, F., F. Hussain, M. Nawaz and I. Javed. 2003. Disposition kinetics of kanamycin in mules. Veterinarski Archiv., 73(4): 221-226.
Nawaz, M., T. Iqbal and R. Nawaz. 1988. Geonetical considerations in disposition kinetics evaluation of chemotherapeutic agents. Veterinary pharmacology toxicology and therapy in food producing animals, Vol.

Buffalo Bulletin (April-June 2017) Vol.36 No.2
347
2, 260p. In Proceeding 4th Congress of the European Association for Veterinary Pharmacology and Toxicology, Budapest, Hungary.
Nouws, J.F.M., D.J. Mevius, T.B. Vree, A.M. Baars and J. Leurensen. 1988. Pharmacokinetics, renal clearance and metabolism of ciprofloxacin following intravenous and oral administration to calves and pigs. Vet. Quart., 10: 156-163.
Pickerill, K.E., J.A. Paladino and J.J. Schentag. 2000. Comparison of the fluoroquinolones based on pharmacokinetic and pharmacodynamic parameters. Pharmacother, 204: 417-428.
Rowan, T.G., P. Sarasola, S.J. Sunderland, C.J. Giles and D.G. Smith. 2004. Efficacy of danofloxacin in the treatment of respiratory disease in European cattle. Vet. Rec., 154(19): 585-589.
Sappal, R., R.K. Chaudhary, H.S. Sandhu and P.K. Sidhu. 2009. Pharmacokinetics, urinary excretion and plasma protein binding of danofloxacin following intravenous administration in buffalo calves (Bubalus bubalis). Vet. Res. Commun., 33: 659-667.
Sarasola, P., P. Lees, F.S. AliAbadi, Q.A. McKellar, W. Donachie, K.A. Marr, S.J. Sunderland and T.G. Rowan. 2002. Pharmacokinetic and pharmacodynamic profiles of danofloxacin administered by two dosing regimens in calves infected with Mannheimia (Pasteurella) haemolytica. Antimicrob. Agents Chemother., 46(9): 3013-3019.
Aliabadi, F.S. and P. Lees. 2003. Pharmacokinetic-pharmacodynamic integration of danofloxacin in the calf. Res. Vet. Sci., 74(3): 247-259.
Shem-Tov, M., G. Ziv, A. Glickman and A. Saran. 1997. Pharmacokinetics and penetration of
danofloxacin from the blood into the milk of ewes. Vet. Res., 28: 571-579.
ShemTov, M., O. Rav-Hon, G. Ziv, E. Lavi, A. Glickman and A. Saran. 1998. Pharmacokinetics and penetration of danofloxacin from the blood into the milk of cows. J. Vet. Pharmacol. Ther., 21: 209-213.
Soback, S., M. Gips, M. Bialer and A. Bor. 1994. Effect of lactation on single-dose pharmacokinetics of norfloxacin nicotinate in ewes. Antimicrob. Agents Chemother., 38: 2336-2339.
Sidhu, P.K. 2001. Pharmacokinetics and pharmacodynamics of marbofloxacin and tolfenamic acid in ruminant species. Ph. D. Thesis, University of London, United Kingdom.
Toutain, P.L., J.R. Del Castillo and A. Bousquet-Melou. 2002. The pharmacokinetic- pharmacodynamic approach to a rational dosage regimen for antibiotics. Res. Vet. Sci., 73(2): 105-114.
Toutain, P.L. and A. Bousquet-Melou. 2004. Plasma clearance. J. Vet. Pharmacol. Ther., 27: 415-425.
Verma, R. and T.N. Jaiswal. 1998. Haemorrhagic septicaemia vaccines. Vaccine, 16(11-12): 1184-1192.
Wiuff, C., J. Lykkesfeldt, O. Svendsen and F.M. Aarestrup. 2003. The effects of oral and intramuscular administration and dose escalation of enrofloxacin on the selection of quinolone resistance among Salmonella and coliforms in pigs. Res. Vet. Sci., 75(3): 185-193.
Yamaoka, K., T. Nakagawa and T. Uno. 1978. Statistical moment in pharmacokinetics. J. Pharmacokin. Biopharm., 6: 547-558.