some, novel analytical atom cells and detectors for …
TRANSCRIPT
SOME, NOVEL ANALYTICAL ATOM CELLS AND DETECTORS FOR
ATOMIC SP7CTROSCOPI AT LOW 1:A7E=GTHS
by
Michael James Adams, Grad. R.I.C.
A Thesis submitted for the Degree of
DOCTOR OF PHILOSOPHY
of the University of London
September 1975
Chemistry Department,
Imperial College of Science and Technology,
London, S.4T.7.
ABSTRACT
The construction and operation of small, graphite tube and
rod atomisers for AAS at wavelengths below 200nm is described.
The use of these electrothermal furnaces for the direct
determination of iodine and sulphur using their vacuum ultra-
violet resonance lines is described also.
The molecular absorption spectra of
some commonly occurring inorganic salts vaporised in non-flame
cells are presented and shown to be similar to the spectra
observed with cool-flame cells.
The temperature-time profiles of a
commercial graphite furnace and the atomic vapour produced in
this cell are discussed.
Finally, a preliminary evaluation is
undertaken of the use of photoionisation chambers as detectors
for non-dispersive atomic spectrometry in the vacuum ultraviolet.
AC K NOWLED EdENTS
The work presented in this thesis was undertaken in
the Chemistry Department at Imperial College of Science and
Technology between October 1972 and September 1975. Except
where due reference is made it is entirely original, and no
part has been submitted for any other degree.
I would like to thank my supervisors,
Dr. G.F.Kirkbright and Prof.T.S.West, for their advice and
encouragement throughout the course of this work. I would
also like to thank my fellow researchers in the Analytical
Department for many useful discussions and suggestions.
I am indebted to the Science Research
Council and the British Steel Corporation for their support
of this work under the C.A.P.S. scheme, and the Paul Instrument
Fund Committee for much of the apparatus employed in the research.
Finally, I wish to thank my wife Janet
for her invaluable assistance in the preparation of this
thesis — completed despite the attempted 'aid' of 'Merlin'.

CONTENTS
Pa e
Abstract 1
Acknowledgements 2
Contents
3
CHAPTER ONE, INTRODUCTION
6
1.1 The Discovery Of The Vacuum Ultraviolet
7
Region Of The Spectrum.
1.2 Emission Sources For The Far Ultraviolet. 11
1.3 Window Materials And Spectral Filters. 23
1.4 Dispersion Elements. 27
1.5 Radiation Detectors. 28
1.6 Low Wavelength Analytical Spectrometry. 35
CHAPTER TWO,NON-FLAI'E ELECTROTHERMAL ATOMI=S 42
FOR AAS IN TiE FAR U.V.
2.1 Introduction. 43
2.2 Furnace Atomisers. 47
2.3 Filament Atomisers. 53
2.4 Miscellaneous Atomisers. 54
CHAPTER THREE, THE DIRECT Dr:TERMINATION OF
58 IODINE.
3.1 Introduction 59
3.2 Apparatus-D.C. Measurement Techniques. 6o
3.3 Iodine AAS Results. 70
3.4 Apparatus-Mechanical Modulation And A.C. 75 Measurement Techniques.
3.5 Iodine AAS Results. 80
3.6 The Effect Of Foreign Ions. 84
3
CHAPTER FOUR, THE DIRECT DETERMINATION OF
88 SULPHUR.
4.1 Introduction. 89
4.2 Apparatus-Electronic Modulation And A.C. 91 Measurement Techniques.
4.3 Sulphur AAS Results. 99
4.4 Discussion-Faults With The Simple Graphite 103 Tube Atomiser.
CHAPTER FIVE, THE DIRECT DETERMINATION OF IODINE 104 AND SULPHUR USING A NEW GRAPHITE
TUBE FURNACE AD A 1RAPHITE ROD.
5.1 Introduction.
5.2 The Design And Construction Of A New Graphite
Tube Atomiser.
5.3 A Mini-I"Iassmann Rod Atomiser.
5.4 A Demountable Hollow Cathode Lamp.
5.5 Iodine AAS.
5.6 Sulphur AAS.
5.7 Conclusion.
CHAPTER SIX, IODINE AAS AT 206.1nm AND NON-SPECIFIC
MOLECULAR ABSORPTION IN NON-FLAME:
ATOMISERS BY SIMPLE INORGANIC SALTS.
6.1 Introduction
6.2 Apparatus.
6.3 The Nature Of The Iodine Absorption Signals
Observed In The HGA 2000 At The 206.1nm Iodine Line.
105
105
114
116
118
126
148
151
152
152
154
6.4 Absorption By Other Common Salts In The HGA 2000. 158
6.5 Absorption Spectra Of Common Inorganic Salts In 162 The Small Graphite Furnace Atomiser.
6.6 Conclusion 166
4

CHAPIZR SEVEN, TEMPERATUR71-TI1E PROF= IN TEE; 168
HGA 2000 g:LAPHIT: =ACE AT O!
AND THE ATOMIC VAPOUR PRODUCED IN
THIS CELL.
7.1 Introduction. 169
7.2 Terminal Temperatures Attained By The 169
HGA 2000 Graphite Furnace.
7.3 Temperature-Time Profiles Of The HGA 2000. 171
7.4 Measurement Of Electronic Excitation Temperatures 174
Of Atomic Species By A Two-Line AAS Method.
7.5 The Electronic Excitation Temperature Of The 180
Atomic Vapour Of Ga And In In The HGA 2000.
7.6 Temperature-Time Profiles Of An Atomic Vapour 186
In The HGA 2000.
7.7 Discussion And Conclusion. 190
CHAPTER EIGHT, PHOTOIONISATION DETECTORS. 193
8.1 Introduction 194
8.2 Theory Of Photoionisation Detectors. 196
8.3 Construction Of A Photoionisation Detector. 206
8.4 Vacuum Ultraviolet Line Emission Sources. 208
8.5 Selecting The Filling Gas For A PID. 219
8.6 Filling The Photoionisation Detector. 223
8.7 The Spectral Response Characteristics Of 223
The Ethylamine PID.
8:8 The Effect Of Ethylamine Vapour Pressure And 228
Applied Voltage On The Response Of The PID.
8.9 Quantitative Analysis With The Ethylamine PID. 230
8.10 The Xylene PID 233
8.11 The N1:1-di-ethyl-p-toluidine PID. 233
8.12 Conclusions. 235
CHAPTER :TI1T:, CO:LLUSIOIIS. 237
9.1 Conclusion 238
9.2 Suggestions For Further ':ork. 243
5

ONE

1.1 The Discovery Of The Vacuum Ultraviolet Region Of The Spectrum.
The origin of modern spectroscopy may be attributed to
the work of Fraunhofer who, in the early part of the nineteenth
century, was the first to observe and appreciate the importance
of the dark lines, now bearing his name, contained in the sun's
spectrum (1). In 1860 Bunsen and Kirchoff (2) discovered that
many elements, when introduced into a flame, emitted radiation
characteristic of the element and were able to relate this emission
to the absorption lines reported by Fraunhofer.
Before Bunsen et al., however, the electromagnetic
spectrum was known to extend beyond the visible regions from
the research by Herschel (3) and Ritter (4) who had detected
infra—red and ultraviolet radiation respectively. Ritter, in
1801, had studied with the aid of a spectroscope, radiation of
wavelengths shorter than 400nm and was able to demonstrate a
chemical action caused by some energy form in this region; the
ultraviolet region. He discovered that silver chloride blackened
and was decomposed more rapidly by radiation in this region than
that in the visible part of the spectrum.
The study of spectroscopy progressed rapidly during
the nineteenth century and it was realised that the atoms of
many more elements could be made to emit by excitation in an
electrical discharge than in a flame. Using a spark source,
quartz optics and the recently discovered technique of photo-
graphic recording of spectra, Stokes (in 1862) was able to extend
the limit of the known ultraviolet region to 183.0nm, (5). The
next major advance into the far u.v. was by Schumann (6) who,
between 1885 and 1903, made three major discoveries. He was
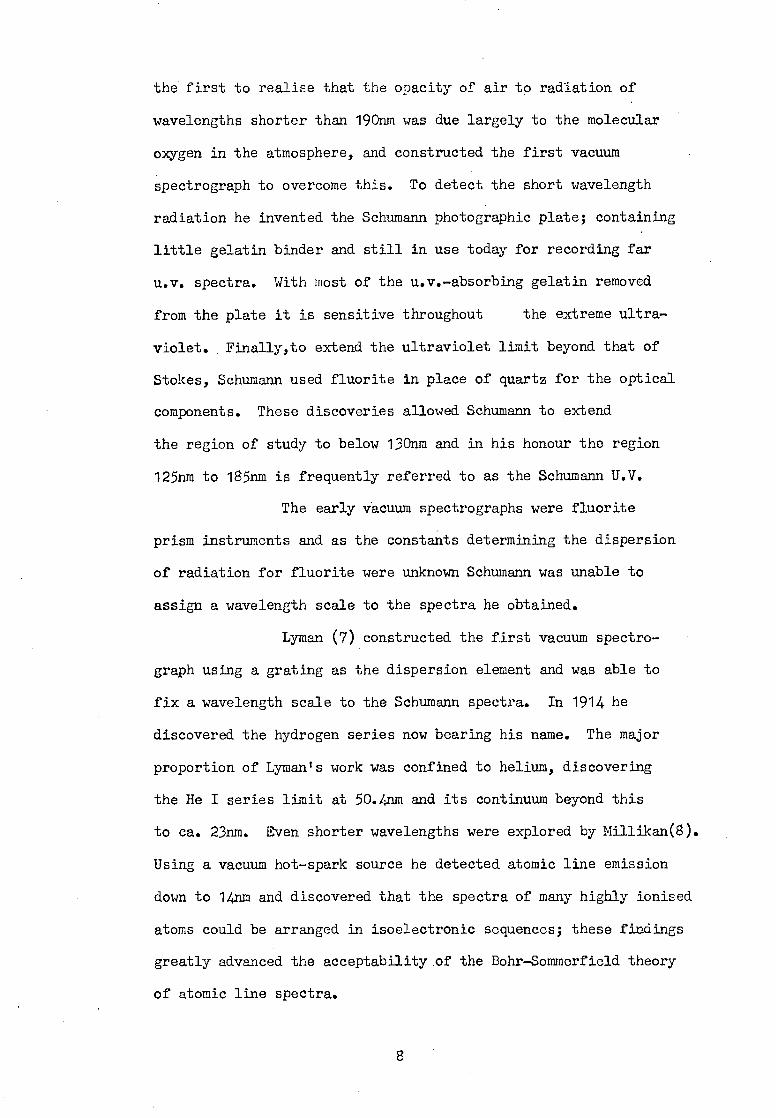
the first to realise that the opacity of air to radiation of
wavelengths shorter than 190nm was due largely to the molecular
oxygen in the atmosphere, and constructed the first vacuum
spectrograph to overcome this. To detect the short wavelength
radiation he invented the Schumann photographic plate; containing
little gelatin binder and still in use today for recording far
u.v. spectra. With most of the u.v.-absorbing gelatin removed
from the plate it is sensitive throughout the extreme ultra-
violet. Finally,to extend the ultraviolet limit beyond that of
Stokes, Schumann used fluorite in place of quartz for the optical
components. These discoveries allowed Schumann to extend
the region of study to below 130nm and in his honour the region
125nm to 185nm is frequently referred to as the Schumann U.V.
The early vacuum spectrographs were fluorite
prism instruments and as the constants determining the dispersion
of radiation for fluorite were unknown Schumann was unable to
assign a wavelength scale to the spectra he obtained.
Lyman (7) constructed the first vacuum spectro-
graph using a grating as the dispersion element and was able to
fix a wavelength scale to the Schumann spectra. In 1914 he
discovered the hydrogen series now bearing his name. The major
proportion of Lyman's work was confined to helium, discovering
the He I series limit at 50.Lnm and its continuum beyond this
to ca. 23nm. Even shorter wavelengths were explored by Millikan(8).
Using a vacuum hot-spark source he detected atomic line emission
down to 14mm and discovered that the spectra of many highly ionised
atoms could be arranged in isoelectronic sequences; these findings
greatly advanced the acceptability of the Bohr-Sommerfield theory
of atomic line spectra.
8

The remaining gap between X-rays and extreme u.v. radiation
was finally closed in 1927 when Osgood (9) photographed atomic
emission lines down to 4.4nm and Dauvillier extended the X-ray
limit to 12.1nm. From 1925 to 1941 the study of atomic and mol-
ecular spectroscopy underwent rapid expansion; the optical
properties of the materials used in the vacuum u.v. were well
known and the importance of the photoelectric effect in monitoring
radiation was realised. This period of fundamental discoveries
in spectroscopy has been reviewed in detail by Boyce(10). Interest
in the extreme u.v. advanced further after 1945 with the development
of the new technologies of space astronomy, rocketry, high
temperature plasmas and solid-state phenomena.
The fundamental fact that the infra-red, visible, ultra-
violet and X-rays were all of the same basic nature had been
established. Because of the nature of the physical and chemical
effects they each produce, and because of the special techniques
required for their production, detection and measurement, it is
convenient to separate these forms of radiation into distinct
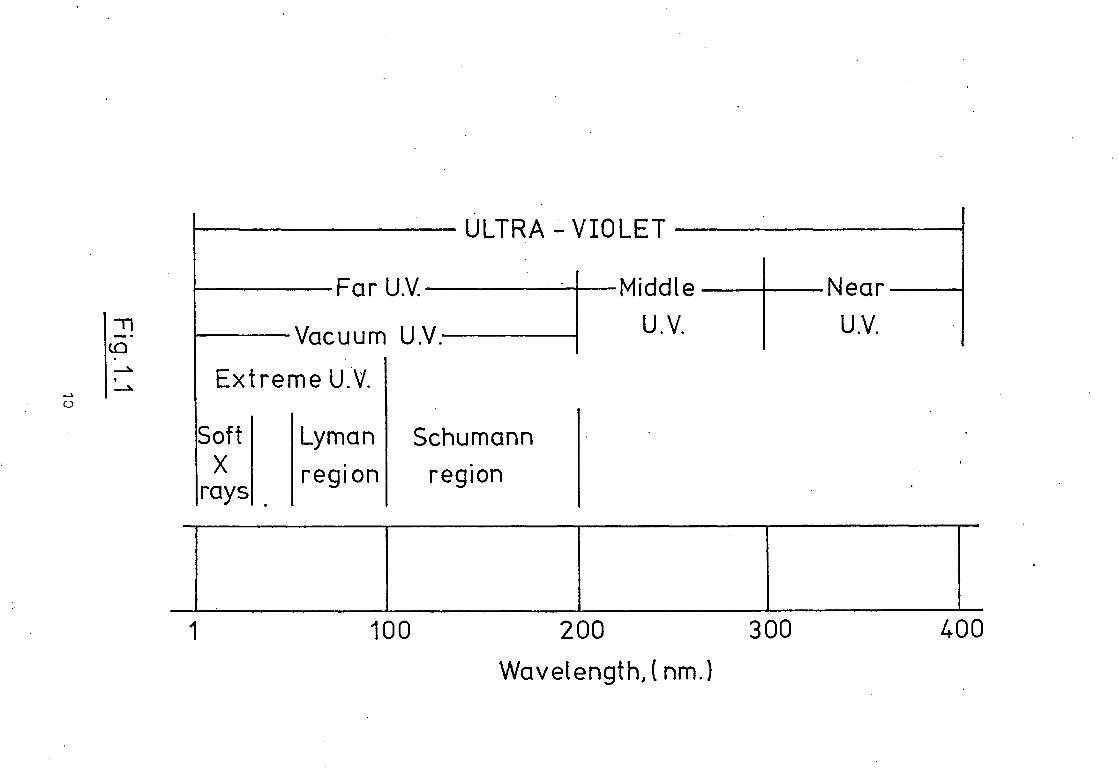
groups. Fig. 1.1 presents the more common classification in use
today for the ultraviolet. The division between middle and far
ultraviolet arises from the absorption of radiation of shorter
wavelengths than 200nm by the molecular oxygen and water vapour
in the atmosphere. Since the work of Schumann, lithium fluoride
(not a naturally occurring material) has been found to be trans-
parent down to 105nm. Below this limit no solid material, with
the exception of very thin films, has been discovered allowing
the transmission of radiation and the region is usually termed
the extreme ultraviolet. Studies in this region employ window-
less systems and special experimental techniques are required.
Near
U.V.
Middle
U.V.
Far U.V.
Vacuum U.V.
100 200
Wavelength, ( nm.)
1 400 300
ULTRA - VIOLET
Extreme U.V.
Soft X
rays
Lyman
region
Schumann
region

1.2 Emission Sources For The Far Ultraviolet.
At the beginning of this century the most popular
source for vacuum ultraviolet radiation emission was the spark
source. Indeed, Lyman, in the second edition of his now classic
monograph on vacuum spectroscopy (11), provides the atomic emission
wavelengths obtained with this source for over thirty elements.
Because of the variety of the sources available today it is
necessary to classify them, by considering the spectral region
to which the source is best adapted, the method used for exciting
the radiation or the type of spectrum emitted. In examilj.ing
some of the emission sources used in vacuum u.v. studies three
kinds of emission spectra may be differentiated; continuum, band
and line spectra.
a) Continuum and Band Emission.
Continuum emission spectra are produced by incan-
descent solids or liquids and, under special conditions, from
individual atoms or molecules. Band emission spectra are produced,
in general, by an electrical discharge through a polyatomic gas
or vapour. Examination under high resolution of band spectra
shows that they consist of a series of lines, so closely spaced
as to give the appearance of bands.
A classical example of continuum emission is the
radiation produced on heating a blackbody; a substance which
absorbs all incident radiant energy and whose emission spectrum
is due to its temperature. The spectral intensity curve from a
blackbody emitter from the low energy side gradually rises to a
maximum and falls sharply toward shorter wavelength. The position
11
of this maximum emission intensity is given by Wien's law,
2.898 x 10⁶ Xmax.(nm) T
where T is the temperature in degrees Kelvin.
The total radiant energy may be calculated by means
of the Stefan-Boltzmann law,
W (watts.cm-2) = d.T4
... 1.2
d (Stefan-Boltzmann Constant) = 5.672 x 10 12watts.cm-2.deg 4
and the wavelength distribution of this emitted radiation is
provided by Planck's distribution law:
EA.dA = c2 AT - $ e
... 1.3
= spectral radiant intensity over the spectral bandpass dA(cm).
A = area of emitting surface
c1,c2 = first and second radiation constants.
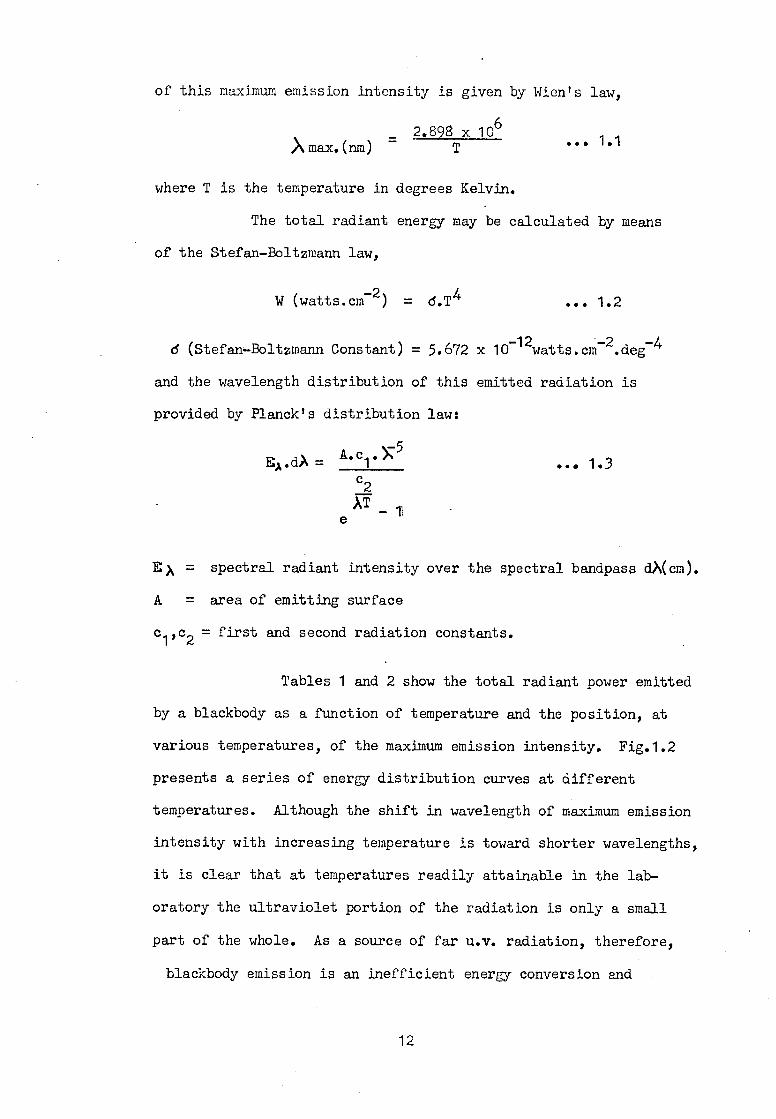
Tables 1 and 2 show the total radiant power emitted
by a blackbody as a function of temperature and the position, at
various temperatures, of the maximum emission intensity. Fig.1.2
presents a series of energy distribution curves at different
temperatures. Although the shift in wavelength of maximum emission
intensity with increasing temperature is toward shorter wavelengths,
it is clear that at temperatures readily attainable in the lab-
oratory the ultraviolet portion of the radiation is only a small
part of the whole. As a source of far u.v. radiation, therefore,
blackbody emission is an inefficient energy conversion and
12

Fig.1.2
4000K
3000X
2000K
1000K
-o
.Lt E
E 108—
10 >N 7
L C 6 W 10 - a) 0 105 :-- — 0
Energy Distribution For A Black—Body At
Various Temperatures.
I I I 0 1 2 3 4 5
Wavelengt h (p)
Table 1.1 Total Energy Radiated per Unit Area
Of Radiating Surface At Various Temperatures
Temperature (K)
Watts.cm-2
1000
5.74
1500
29.
2000
92
2500
224
3000
464
Table 1.2 Wavelength Of Maximum Radiant Emission.
Temperature (K) 1000 1500 2000 2500 3000
Wavelength (a) 2.898 1.94 1.45 1.16 0.967
13
rarely used for studies at wavelengths shorter than 300nm.
One of the few sources (if not the only source)
capable of providing continuum emission from the visible to the
extreme u.v. is the Lyman discharge source (12). The emission
is obtained by discharging a capacitor through a gas, at low
pressure, contained within a glass capillary (typically 1mm internal
diameter). An external spark-gap is used to trigger the discharge.
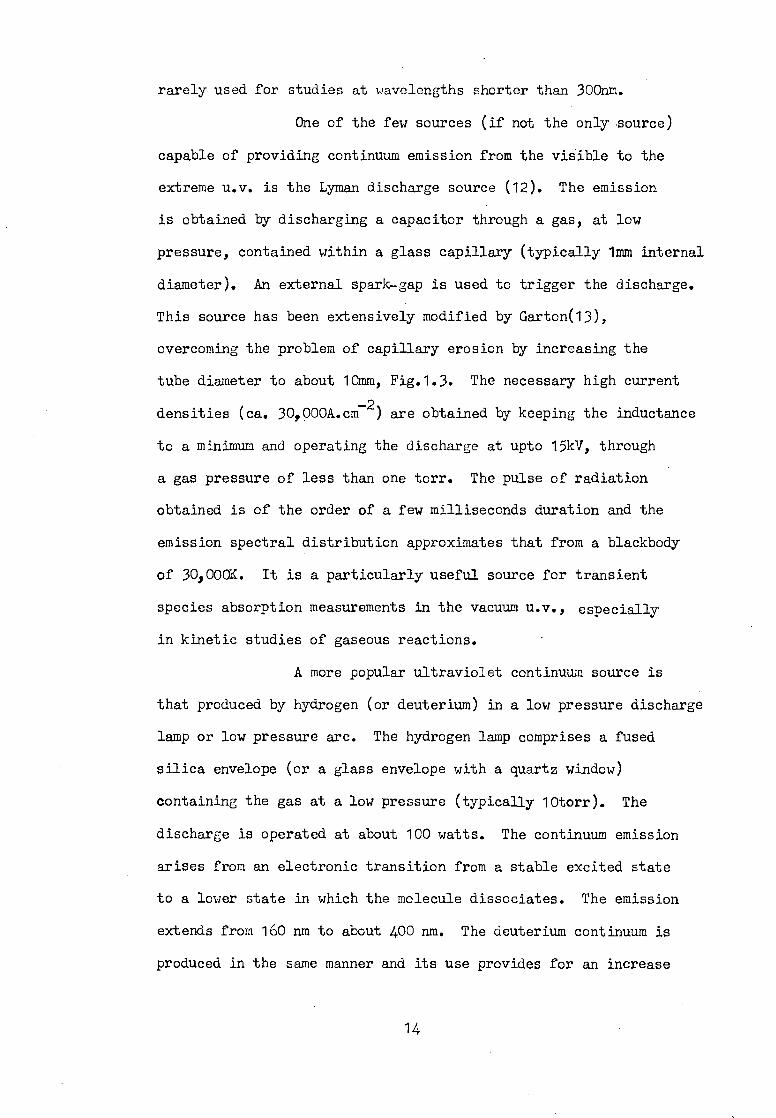
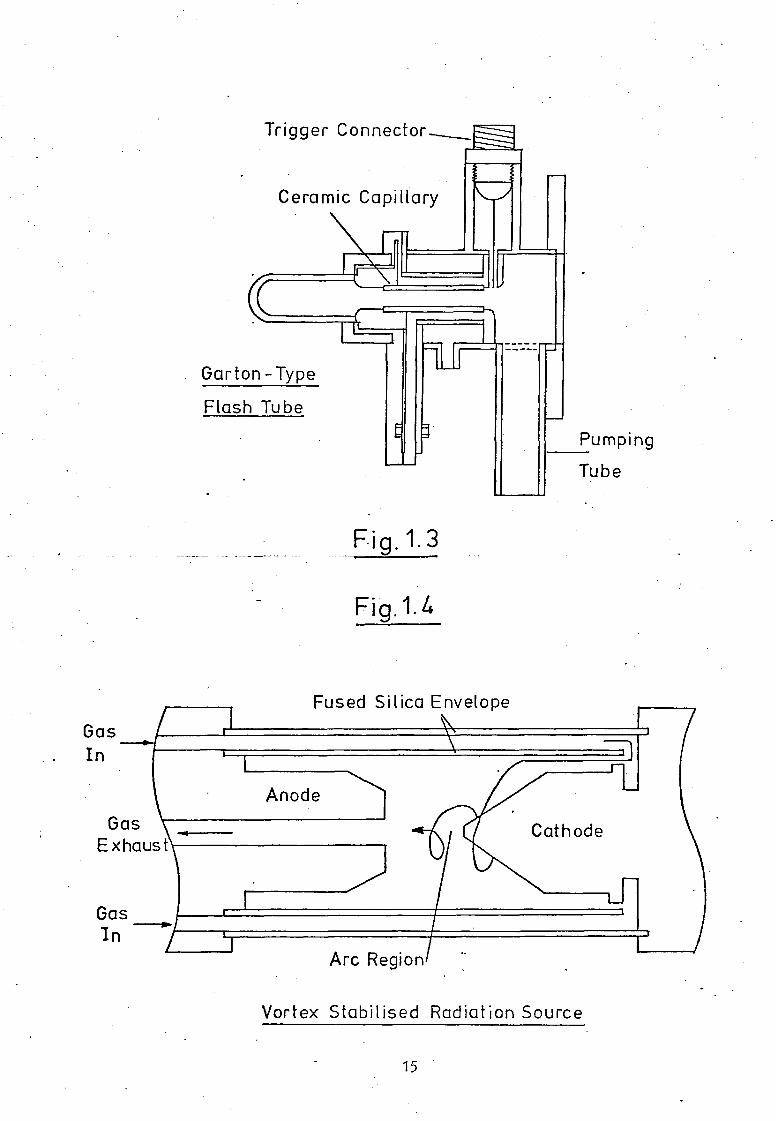
This source has been extensively modified by Garton(13),
overcoming the problem of capillary erosion by increasing the
tube diameter to about 10mm, Fig.1.3. The necessary high current
densities (ca. 30,000A.cm2) are obtained by keeping the inductance
to a minimum and operating the discharge at upto 15kV, through
a gas pressure of less than one torr. The pulse of radiation
obtained is of the order of a few milliseconds duration and the
emission spectral distribution approximates that from a blackbody
of 30,000K. It is a particularly useful source for transient
species absorption measurements in the vacuum u.v., especially
in kinetic studies of gaseous reactions.
A more popular ultraviolet continuum source is
that produced by hydrogen (or deuterium) in a low pressure discharge
lamp or low pressure arc. The hydrogen lamp comprises a fused
silica envelope (or a glass envelope with a quartz window)
containing the gas at a low pressure (typically 10torr). The
discharge is operated at about 100 watts. The continuum emission
arises from an electronic transition from a stable excited state
to a lower state in which the molecule dissociates. The emission
extends from 160 nm to about 400 nm. The deuterium continuum is
produced in the same manner and its use provides for an increase
14
Trigger Connector
Ceramic Capillary
P
Garton-Type
Flash Tube
Pumping
Tube
Fig.1.3
Cathode Gas Exhaust
Gas In
Fused Silica Envelope
Gas In
Anode
Arc Region'
Vortex Stabilised Radiation Source
15

in intensity of two to three times that obtained in hydrogen.
Other u.v. arc-sources include the short-arc lamps and those of
carbon, argon and mercury (14,15). The argon arcs, and those
in other rare gases, are in wide use and have been extensively
described by Golman and others, (16,17). The arc is struck between
a tungsten rod cathode and copper plate anode; operating currents
of 400amps are common. Very high temperatures are obtained and
Dickerman et al. were able to obtain emission from a variety of
materials by introducing suitable powders into the gas feeding
the arc, (18). A commercially available system based on this is
the vortex-stabilised radiation source (V.S.R.S.), shown in Fig.1.4.
In general, as the gas pressure in a lamp is increased the emission
tends to a continuum. This is clearly demonstrated by mercury
arc lamps. In addition to mercury the lamp usually contains a
rare gas to assist in starting the lamp. Initiation of the discharge
causes mercury, contained in a reservoir, to evaporate and the arc
to strike. The mercury vapour pressure rises during the lamp
warm-up period and its continuum emission efficiency correspondingly
increases.
The rare gas continua are often excited by repetitive
capacitor discharges (typically 10kV pulses at a frequency ranging
from 100 to 1600 pulses.sec 1). Wilkinson et al. (19) used
microwave excitation, 125watts at 2450MHz, to obtain these continua.
The gas,at approximately 200torr, is contained within a quartz
tube fitted with a LiF window and held in a i-wave resonant cavity.
The addition of a gettering side-arm to the tube served to remove
most of the impurities from the discharge.
The useful spectral ranges of emission continua produced
16

by the rare gases and hydrogen are shown in Fig. 1.5. The continuum
emission produced by the noble gases is considered to be produced
by electronic transitions from the repulsive ground states of
diatomic rare gas molecules.
Continuum radiation also may be produced by the acceleration
(synchrotron radiation) or deceleration (bremsstrahlung radiation)
of free electrons. A review of such sources is included in the
vacuum u.v. spectroscopy text by Samson, (17).
b) Line Emission.
Line radiation is produced by transitions between
the electronic energy levels of neutral atoms, ions and molecules.
Although called line emission the lines do have a finite width
depending on the lifetime of the excited state involved in the
transition (natural broadening) and external conditions such as
temperature and pressure and the presence of electric and magnetic
fields. Typical line widths range between 10-2 and 10-4hm. The
problems of producing radiation of a given wavelength are concerned
with creating the appropriate conditions for exciting atoms or
ions. In general, the shorter wavelength radiation is produced
by the more highly ionised species. Milliken (8) was the first
to study the spectra of metals in the extreme ultraviolet using
a vacuum spark source. When high potentials were applied between
two electrodes less than a millimetre apart in a high vacuum
(10-5 to 106torr), a brilliant spark occurred. Using this spark
as a line source Milliken was able to extend the extreme ultraviolet
down to 14nm.
The most popular line emission sources, especially
in atomic absorption studies, are those produced by a glow discharge.
The cold cathode discharge tubes are operated by increasing the
17

Xe
" lD Kr
Ul
Ar
Ne
SOnm 100nm 150nm
VacuumU.v. Rare Gas Continua
I Aston dark space space
cathode glow
Fig.1.6
~ve
glow
space +ve
column
I anode dark space
anode glow
Emission Characteristics of a Glow Discharge
18
200n

voltage across the tube, containing gas at low pressure (ca. ltorr),
until the discharge strikes. This striking voltage is greatly
in excess of the potential required to maintain the discharge,
usually about 600V at between 100 and 500mA. Such a discharge
consists of a series of alternate light and dark regions as shown
in Fig.1.6. The presence of all these features depends on the
nature of the gas, its pressure and the operating conditions.
The cathode features, however, tend to be more permanent and
reproducible as they are involved in the maintenance of the discharge.
If the discharge is confined to a capillary (typically 100-200mm
long, 3-5mm i.d.) the positive column fills the entire capillary
and may be used as a line source. Fig. 1.7 shows such a lamp,
consisting of a water-cooled glass or quartz capillary sealed into
a hollow cathode and anode by 0-rings, (17). This type of source
was used by Hunter to obtain an intense hydrogen line spectrum
in the range 80nm to 170nm. (20).
A more common line emission source is the hollow
cathode lamp (sometimes referred to as a Schiller lamp) which emits
intense, narrow lines of selected elements. The emission is from
the negative glow of the discharge which, at certain gas pressures
and operating conditions, fills the entire cavity of the hollow
cathode. During the discharge the cathode becomes hot and some
vaporisation of the cathode material is to be expected; however,
ion-bombardment by the filler rare gas ions is the primary mechanism
for the cathode material entering the discharge. By constructing
the cathodes of different materials it is possible to excite lines
of many species and commercial hollow cathode lamps are available
for more than fifty elements. Paschen and Scffiler (21) were the
19
first to use this source which was later redesigned by Sullivan
and Walsh (22) who obtained an increase in intensity of two orders
of magnitude over the conventional source, without increasing the
line-width. A typical hollow cathode lamp source is shown
schematically in Fig. 1.8. The use of this type of source for
far ultraviolet studies is determined largely by the window
transmitting characteristics. However, because the elements
whose principal emission lines lie in the vacuum ultraviolet are
mainly the non-metals of high volatility, no commercial hollow
cathode lamps exist for this region. To overcome this problem
a demountable hollow cathode lamp may be constructed, allowing
a variety of cathode materials and windows to be used. A variety
of these systems have been proposed and used for emission studies
in the vacuum ultraviolet region. Milazzo (23) and Newburgh et al.
(24,25) have used a graphite cathode lamp to excite atomic emission
lines below 150nm. Milazzo has also studied graphite and aluminium
cathode lamps for the emission by aluminium, carbon and iodine (26,
27). A demountable, flow-through, water-cooled hollow cathode
lamp has recently been described by Kirkbright et al. as a line
emission source for atomic sulphur, phosphorus and iodine, (28).
Electrodeless discharge lamp (EDL) sources are also
a popular line emission source in the ultraviolet. The high
frequency DL source was discovered by Hittorf in 1884 (29) but
gained little attention in analytical spectrometry until the 1960's
when work by Winefordner (30) and West (31) led to their general
acceptance as suitable line emission sources for atomic absorption
and atomic fluorescence spectrometry. The excitation of this
type of source is achieved using radiowave or microwave frequency
20

:r: 0 --0 ~
. (")
0 /
~ ...... , ::r ,
I 0 I a. J co I
0 Ul n ::r 0 .,
Ul
water ou.t
water in
Positive Column Source
Fig.1.7
Fig. 1.8
r"---"'. r-------, I I I I I I I I
I I I I
0 I I 0 I
I ...... I ::r I 0 1 a. I co I
21
~~gas
In
electromagnetic fields in conjunction with wave-guide cavities,
coils or antennae. Although the excitation frequency may range
from 30-3000MHz the most common is 2450MHz because of the avail-
ability of comparatively inexpensive diathermy units which operate
at this frequency. Many reports have been published on the optimum
design, construction and operating conditions of EDL sources, (30,
32). In general, the lamp consists of a cylindrical bulb, ca.
30mm long, formed at the end of a 8mm i.d., 1mm wall thickness,
silica tube. This bulb contains the element, or its halide, of
interest along with about 5torr of inert gas, usually argon.
Such an arrangement only allows for the study of emission of
greater wavelengths than the cut-off limit of the quartz envelope
(ca. 170nm). For the transmission of shorter wavelength radiation
a more elaborate construction is required. Braun and Davies (33)
obtained intense atomic emission lines from O,N,S,C, and the
halogens using a flow-through EDL; helium, with a trace of the
species to be examined, was passed continuously through a quartz
tube fitted with a LiF window and supported in a 71,-wave Eveson type
cavity. The gas pressure was about ltorr and applied microwave
power typically 50watts. Various other vacuum ultraviolet EDL
sources are referred to in the literature (34,35) and the emission
is characteristically narrow spectral line emission of high .
intensity. They are used especially in photochemical studies,
laboratory aeronomy, Raman spectroscopy and, increasingly, anal-
ytical atomic spectrometry.
Other, less common, line emission sources such as the
hot filament arc discharge and duaplasmatron are discussed in the
reviews on vacuum ultraviolet sources by Samson, (17,35).
22
1.3 Window Materials and Spectral Filters.
Compared with the other regions of the electromagnetic
spectrum the choice of window materials and filters for use in
the far ultraviolet is limited. The more important crystalline
window materials are listed in Table 1.3 with their short wavelength
cut-off limits. This limit is taken here as corresponding to that
wavelength at which the transmission of the material reaches a
value of 1C% for a thickness of 1mm, at room temperature. The
short wavelength limit is not the only criterion which determines
the choice of a window material for a particular application; the
slope of the transmission curve with decreasing wavelength is
equally important. The transmittance of all these materials is
temperature dependant and, in general, as the temperature increases
over the range 77K to 650K the transmission limit shifts to longer
wavelengths at the rate of 0.025 to 0.03nm.deg-1. At room temperature
the hydrogen Lyman-Kline at 121.6nm is totally absorbed by a
1mm calcium fluoride window,whereas at 77K the cut-off is shifted
to 117nm and the radiation is transmitted, (37). Purity of the
crystal and differing methods of manufacture may alter the trans-
mission characteristics of a window considerably. Smaller thicknesses
obviously extend the cut-off limit to shorter wavelengths. Thin
films of silica (ca. 10mg.cm 2), for example, will transmit 80%
of the radiation of wavelengths longer than 100nm (38) but these
are very fragile and have little practical value in normal use.
The means by which the window may be sealed to
a lamp or optical system also needs to be considered. Quartz
and sapphire have the advantage of being capable of providing
graded seals to glass which are resistant to thermal and mechanical
shock. The other materials such as CaF2, SrF2, BaF2, - MoF2' etc.
23

cannot be sealed in this manner and less permanent; and often
less satisfactory, means of making a seal are necessary. Lithium
fluoride is an exception and a graded seal to glass may be made
by means of silver chloride-silver-silver chloride discs between
the window and glass (38). The assembly, if constructed carefully,
is stable to thermal shock and will withstand temperatures as high
as 700K. Many of the materials listed in Table 1.3 are rarely used
because of their solubility in water. Attack by water vapour in
the atmosphere may cause a loss in transmission, especially at
the lower wavelengths approaching the transmission limit.
Below the lithium fluoride transmission cut-off
(105nm) windowless, differential pumping systems are necessary
as no crystalline window material is available capable of transmitting
this short wavelength radiation. Very thin films of aluminium
and plastics are transparent below 100nm but their fragile nature
prevents their common use.
Many gases and gas mixtures, because of their
discreet absorption band systems in the vacuum ultraviolet, may
be used as spectral filters in this region and Table 1.4 (39,40)
lists several examples. All the constituent gases of the atmosphere,
with the exception of helium and neon, exhibit wide spectral
regions of strong band or continuum absorption between 50nm and
200nm. The principal absorber, as previously stated, is molecular
oxygen. The Schumann-Runge oxygen absorption bands, commencing
at ca.195nm, show intense absorption by 185nm and converge with
a strongly absorbing dissociation continuum at 175nm. Maximum
absorption is observed at 142.5nm. A localised "window" exists
between 120nm and 135nm and Garton has utilised this region of
24

Table 1.3 Crystalline Window Materials.
Material
Limit (nm) Remarks
Window glass 300 Impurities effect transmission
Pyrex 270 PY
Vitreosil 180
Synthetic fused quartz 160
Cultured crystal quartz 145
Sapphire 142
Barium fluoride 135 Sol. 0.12g.100m1-1
Strontium fluoride 128 ,, 0.011, ,,
Calcium fluoride 123 „ 0.002
Magnesium fluoride 112 „ 0.008
Lithium fluoride 105 yp 0.270
Table 1.4 Gaseous Spectral Filters.
Gas Filter Thickness
At NTP (cm)
Regions Of Relative Transmission
(um)
02 6.0 110 —111, 121.6,>180
CH3Cl 0.1 142— 146, >185
CH3Br 0.05 152 —157, >180
H2S 0.1 160 —170, , 230
CH4
0.025 7140
CC14
0.0025 116 —120, 7155
C2H4
0.025 7185
(CH3)3CH 0.1 >106
25
6.1:6!.d
light
Photovoltaic Cell
Fig.1.10
Absorption Coef. (cm-1
o = Ni Ni
0
..-.1. --a. 0 1C:) 1
IN
1 .-a
transparent film
selenium co
__.a. (A) — CD
C:)
( WL.
1 ) q
;Bue
lano
m
(J1 — CD
0
0
.__ CO — 0
1..) 0 - 0
Photocell
Fig.1.11

relatively high transparency in monitoring the emission from
hydrogen at 121.6nm, (41). At wavelengths shorter than 120nm the
absorption continuum and intense absorption bands recommence. The.
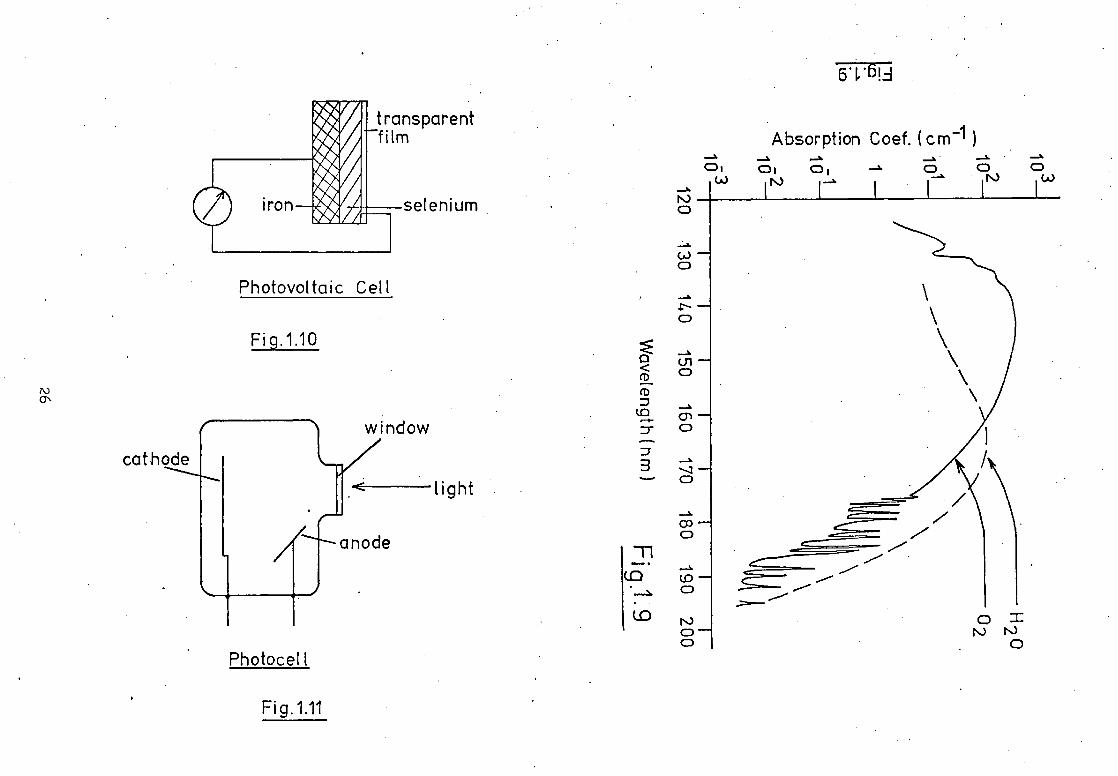
absorption of vacuum ultraviolet radiation by water vapour is
frequently as serious in analytical spectrometry as that due to
oxygen. The water vapour absorption continuum occurs between
183nm and 150nm, where a relatively transparent region exists
down to 138nm. Below this wavelength strong, diffuse absorption
bands occur, (42) Fig.1.9.
Most other common gases are relatively transparent
in the Schumann ultraviolet region of the spectrum. The band
absorption spectrum of nitrogen commences at 145nm but is weak
until 110nm and carbon dioxide is a stronger absorber in the 115nm
to 140nm region. Hydrogen band absorption does not commence until
110nm and becomes a continuum only at wavelengths shorter than
85nm. The absorption characteristics of many polyatomic gases
and vapours are given in the review by Sponer and Teller, (43)
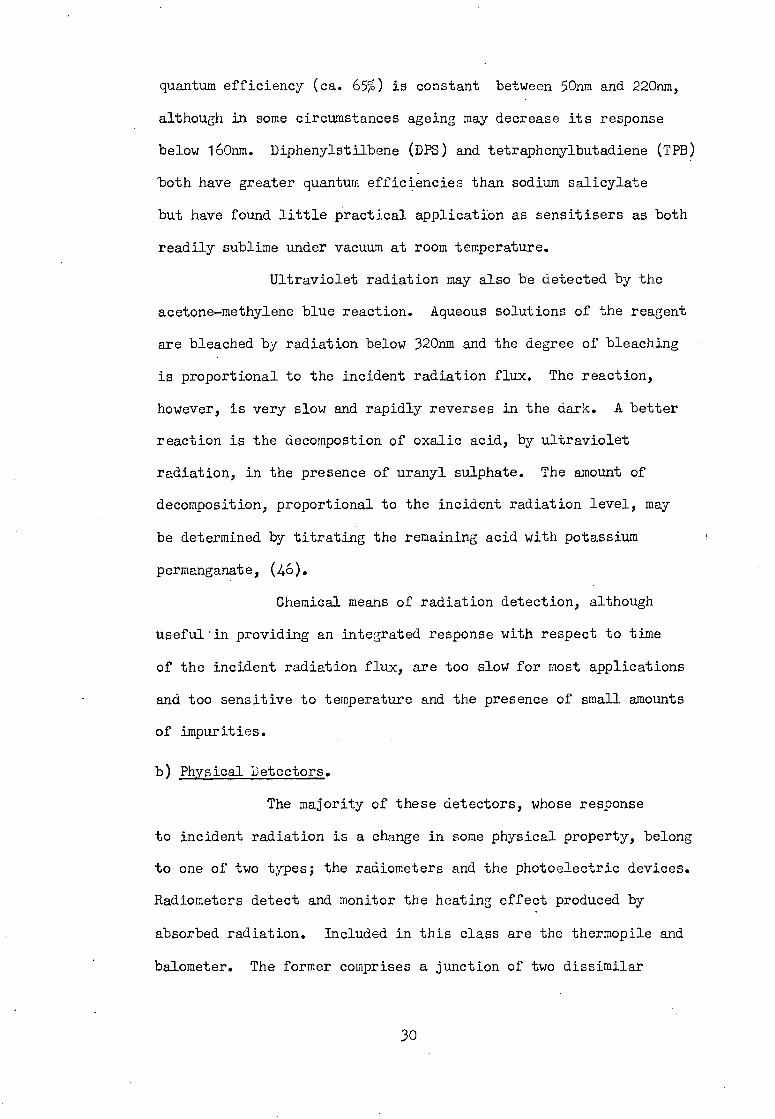
1.4 Dispersion Elements.
The dispersion device is a major element in any
spectrochemical technique as it provides the means by which the
radiation emitted by a source may be separated into its differing
wavelength, or energy, components. Two types of dispersion element
are in common use; prisms and gratings. Their efficiency and use
in the ultraviolet has been the subject of several reviews,(17,36).
The prism serves as a dispersion device because
of the phenomenon of refraction. The linear dispersion of a prism,
D, depends on the prism angle, 20C, the focal length of the
spectrographlf, the wavelength of the incident radiation and
27
constants of the prism material.
2 1 D = ()-K
1 )2 (1-sin 002 ...1.4
2K2
f sin oC
i.e. D depends upon the square of the wavelength of the incident
radiation; making for difficulties in assigning precise wavelengths
to an emission or absorption spectrum.
The concave diffraction grating was first described
by Rowland (51) in 1882. He showed that the linear dispersion
depended only on the radius of curvature of the grating, the angle
of emergent radiation p and the groove separation on the grating
surface,d,
D = n Rc x 109 ...1.5
d cos
i.e. the linear dispersion is uniform over the whole wavelength
range.
Because of the necessity of constructing prisms
from LiF or CaF2 for use in the Schumann ultraviolet, and the loss
in transmission of incident radiation of shorter wavelengths by
absorption with these materials, the diffraction grating is the
most commonly used dispersion element in use today for studies in
this region.
1.5 Radiation Detectors.
The results of the interaction of ultraviolet
radiation with matter provides for a variety of detector types;
classified according to whether the reaction is basically a chemical
or physical process.
28
a) Chemical Detectors.
The oldest and most common of the chemical detectors
is the photographic plate. This serves as a detector according to
the effect of the radiation on silver salts held on a glass plate
with a gelatin binder. The degree of blackening of the emulsion
is a measure of the incident radiation intensity. Unfortunately,
the gelatin base of this emulsion absorbs radiation of wavelengths
shorter than 280nm and is opaque below 200nm. This may be overcome
by removing most of the gelatin (the Schumann plate), but this
renders the plate very fragile and sensitive to abrasion. A more
satisfactory process is to coat the normal plate with a substance
capable of absorbing the incident far ultraviolet radiation and
re-emitting radiation of longer wavelengths than 280nm; fluorescence
sensitisation. This technique was first examined and reported by
Ducleaux and Jealet (45) who coated a photographic plate with
light machine oil which fluoresced under exposure to vacuum ultra-
violet radiation. Since their work a variety of sensitisers have
been examined including the dihydrocollidine ethyl carboxylic
ester, manganese activated willemite phosphor (sensitive to radiation
above 145nm), sodium chloride (sensitive below 30nm) and sodium
salicylate (17,46). Sodium salicylate is by far the most common
in use today. It is a finely crystalline powder readily soluble
in methanol. A plate is sensitised by spraying it with a saturated solution
in methanol. A hot-air blower continually playing over the surface
assists in the evaporation of the solvent. In this manner a thin
layer of sodium salicylate is produced which may be built on until
the required thickness is obtained (1 to 2 mg.cm-2). Its fluorescence
spectrum has a maximum intensity at around 420nm and its absolute
29
quantum efficiency (ca. 65%) is constant between 50nm and 220nm,
although in some circumstances ageing may decrease its response
below 160nm. Diphenylstilbene (DPS) and tetraphenylbutadiene (TPB)
both have greater quantum efficiencies than sodium salicylate
but have found little practical application as sensitisers as both
readily sublime under vacuum at room temperature.
Ultraviolet radiation may also be detected by the
acetone-methylene blue reaction. Aqueous solutions of the reagent
are bleached by radiation below 320nm and the degree of bleaching
is proportional to the incident radiation flux. The reaction,
however, is very slow and rapidly reverses in the dark. A better
reaction is the decornpostion of oxalic acid, by ultraviolet
radiation, in the presence of uranyl sulphate. The amount of
decomposition, proportional to the incident radiation level, may
be determined by titrating the remaining acid with potassium
permanganate, (46).
Chemical means of radiation detection, although
useful in providing an integrated response with respect to time
of the incident radiation flux, are too slow for most applications
and too sensitive to temperature and the presence of small amounts
of impurities.
b) Physical Detectors.
The majority of these detectors, whose response
to incident radiation is a change in some physical property, belong
to one of two types; the radiometers and the photoelectric devices.
Radiometers detect and monitor the heating effect produced by
absorbed radiation. Included in this class are the thermopile and
balometer. The former comprises a junction of two dissimilar
30

metals which, when heated by absorbing radiation, generates an
emf. This emf is proportional to the energy of the incident
radiation rather than the radiation flux. The balometer is a
delicate Wheatstone-bridge arrangement, one arm being heated by
the radiation of interest; the change in resistance upon irradiation
being the measured quantity. Semiconducting balometers (thermistors)
are commercially available and are more sensitive than the older,
metal-arm systems. The Golay cell (47) is also a heat sensitive
detector and is basically a differential gas thermometer. The
expansion of gas causes movement in a deflecting membrane; the
degree of deflection is measured by its defocussing effect on a
light beam falling onto a photocell. Radiometers are probably the
only detectors having constant response throughout the infra-red,
visible and ultraviolet regions and they are frequently used as
laboratory standards. Practical difficulties, however, prevent
their widespread use for routine determinations.
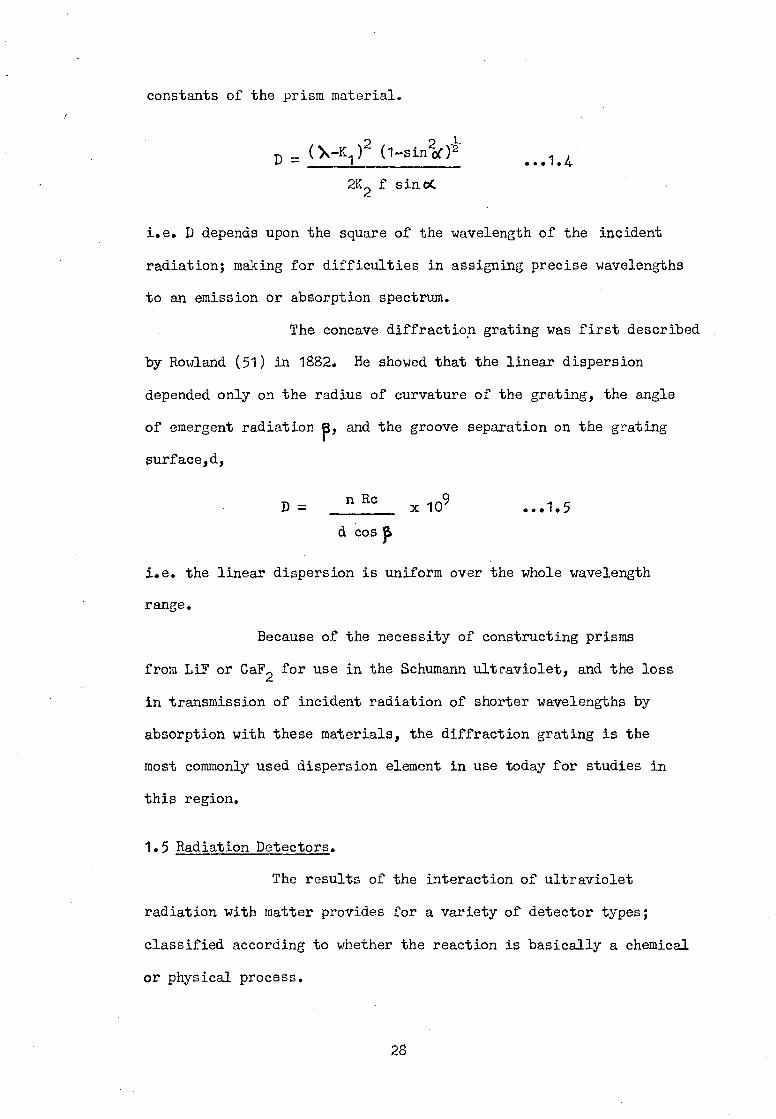
The second type of physical detectors (photoelectric
devices) are the most commonly used detectors today. Photovoltaic
cells, resistance cells, photodiodes and phototubes all have found
application in detecting and monitoring ultraviolet radiation.
The construction of a typical photovoltaic cell is shown schematically
in Fig. 1.10. Radiation incident on the surface of the cell
causes a flow of electrons from the semiconductor to the metal
and a current to flow in the external circuit from the iron to
the selenium. The magnitude of this current is proportional to
the intensity of the incident radiation; although below 27Cnm
the spectral response of this type of detector is very poor.
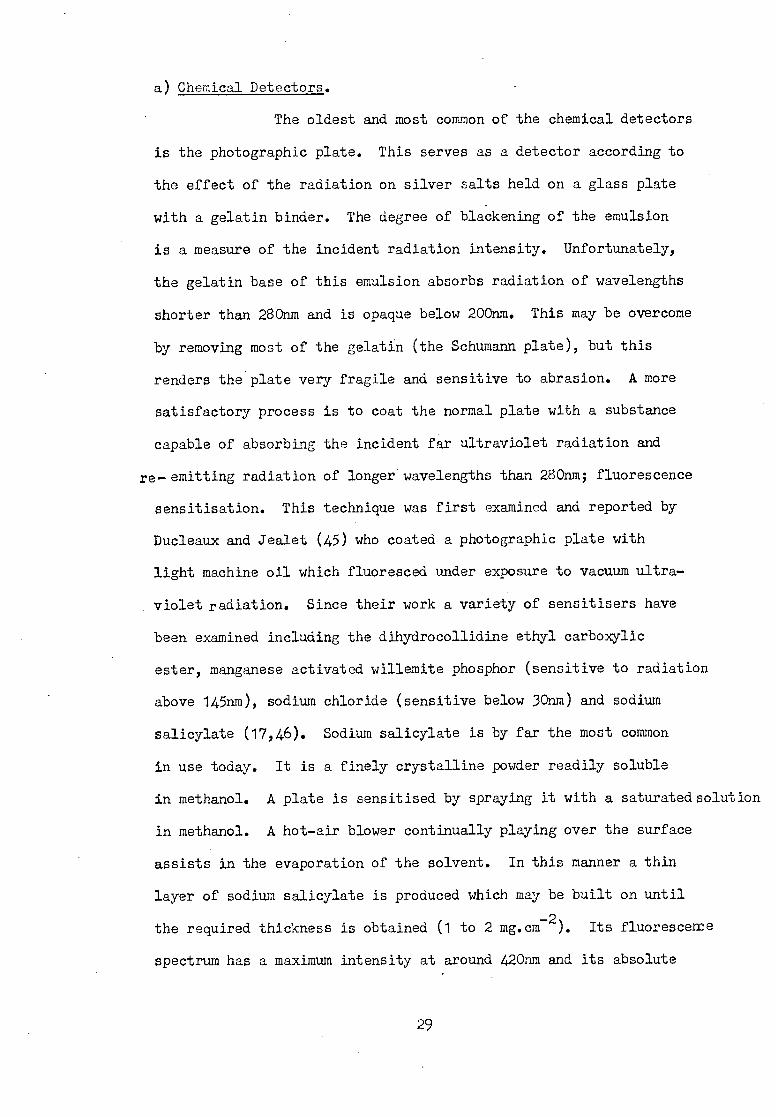
The most important detector for ultraviolet radiation
31
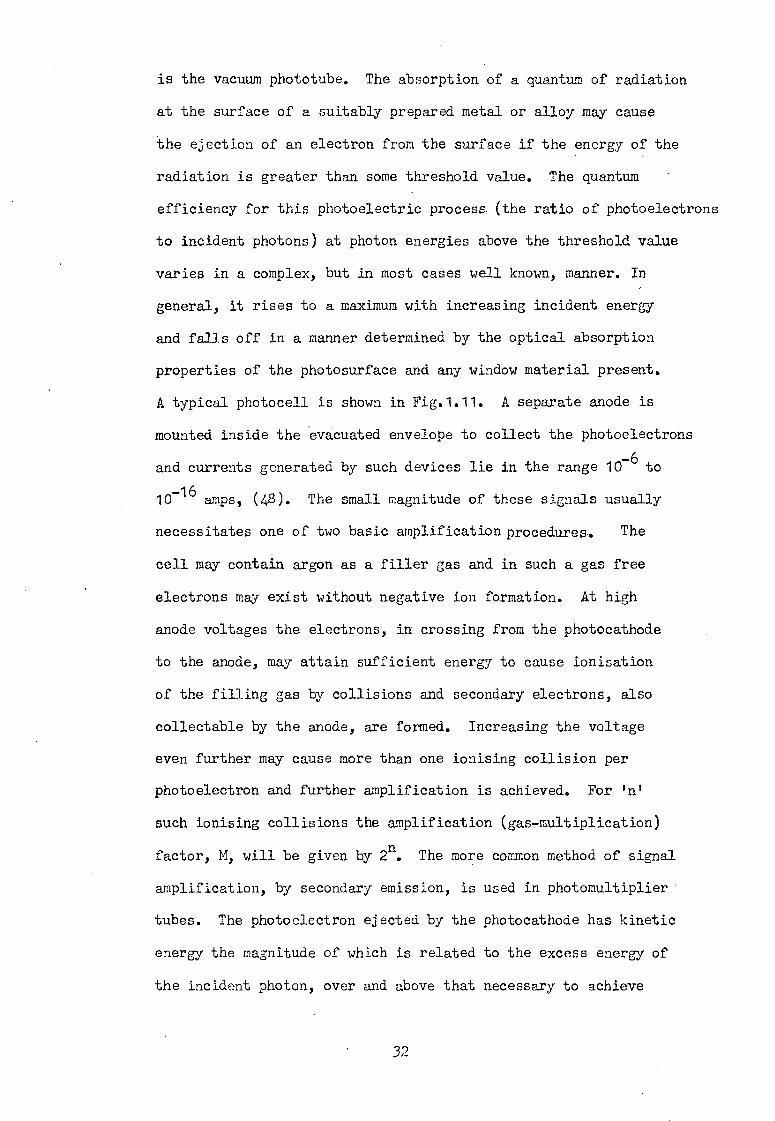
is the vacuum phototube. The absorption of a quantum of radiation
at the surface of a suitably prepared metal or alloy may cause
the ejection of an electron from the surface if the energy of the
radiation is greater than some threshold value. The quantum
efficiency for this photoelectric process. (the ratio of photoelectrons
to incident photons) at photon energies above the threshold value
varies in a complex, but in most cases well known, manner. In
general, it rises to a maximum with increasing incident energy
and falls off in a manner determined by the optical absorption
properties of the photosurface and any window material present.
A typical photocell is shown in Fig.1.11. A separate anode is
mounted inside the evacuated envelope to collect the photoelectrons
and currents generated by such devices lie in the range 10-6 to
- 10 16 amps, (48). The small magnitude of these signals usually
necessitates one of two basic amplification procedures. The
cell may contain argon as a filler gas and in such a gas free
electrons may exist without negative ion formation. At high
anode voltages the electrons, in crossing from the photocathode
to the anode, may attain sufficient energy to cause ionisation
of the filling gas by collisions and secondary electrons, also
collectable by the anode, are formed. Increasing the voltage
even further may cause more than one ionising collision per
photoelectron and further amplification is achieved. For 'nt
such ionising collisions the amplification (gas-multiplication)
factor, /I, will be given by 2n. The more common method of signal
amplification, by secondary emission, is used in photomultiplier
tubes. The photoelectron ejected by the photocathode has kinetic
energy the magnitude of which is related to the excess energy of
the incident photon, over and above that necessary to achieve
32
the threshold limit of the cathode, and the potential gradient
between the cathode and anode. The photoelectron incident on
the collecting anode surface passes the excess energy to electrons'
bound to the solid-vacuum interface and a few of these may approach
the interface with sufficient energy to overcome the potential
barrier and emerge as secondary electrons. These secondary electrons
may pass to a new anode for collection or for them to emit, in a
similar manner, further electrons. By increasing the number of
these secondary emitting surfaces (dynodes), each at a potential
higher than the previous one, amplification is achieved. If the
number of secondary electrons produced per incident electron is Ix'
and the number of dynodes or stages is 'n', then the total gain
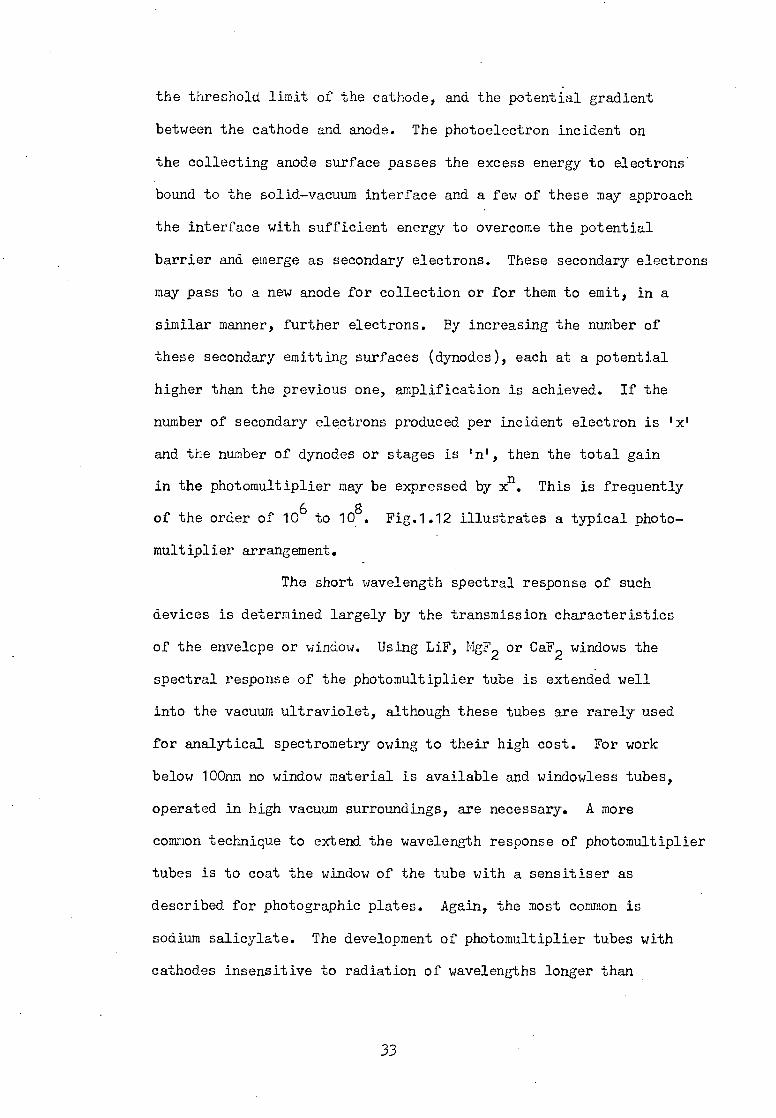
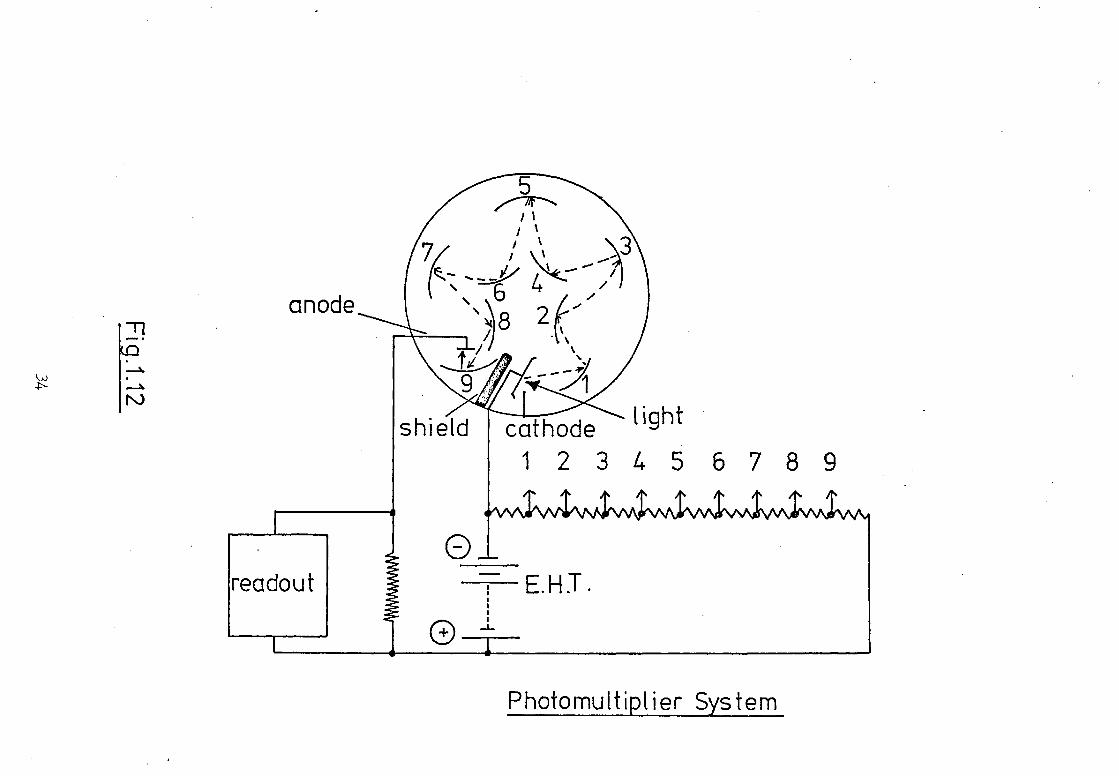
in the photomultiplier may be expressed by xn. This is frequently
of the order of 106 to 108. Fig.1.12 illustrates a typical photo-
multiplier arrangement.
The short wavelength spectral response of such
devices is determined largely by the transmission characteristics
of the envelope or window. Using LiF, MgF2 or CaF2 windows the
spectral response of the photomultiplier tube is extended well
into the vacuum ultraviolet, although these tubes are rarely used
for analytical spectrometry owing to their high cost. For work
below 100nm no window material is available and windowless tubes,
operated in high vacuum surroundings, are necessary. A more
common technique to extend the wavelength response of photomultiplier
tubes is to coat the window of the tube with a sensitiser as
described for photographic plates. Again, the most common is
sodium salicylate. The development of photomultiplier tubes with
cathodes insensitive to radiation of wavelengths longer than
33
E.HT.
anode
cathode light 1 2 3 4 5 6 7 8 9
shield
readout 0
-1-
Photomultiplier System

ca. 300nm (solar-blind tubes) has been the subject of much research
and these devices are discussed in the review by Dunkelman (49).
With decreasing wavelength the energy associated
with radiation increases, and in the vacuum ultraviolet this
energy is sufficient to ionise many molecular species. This
ionising ability forms the basis of the photoionisation techniques
of detecting ultraviolet radiation. The photoionisation detector
comprises a gas or vapour contained within a chamber between two
electrodes, across which a potential difference is applied. The
spectral response of such a detector is determined on the low
energy (long wavelength) side by the ionisation characteristics
of the filling gas and on the high energy (short wavelength) side
by the transmission characteristics of the window material present
on the chamber. The use of these detectors in monitoring far
ultraviolet radiation is discussed in more detail in Chapter Eight.
1.6 Low Wavelength Analytical Spectrometry.
Spectrochemical analysis may be both qualitative
and quantitative. If the concentration of the analyte remains
constant and the wavelengths of emission or absorption are scanned
the spectrum obtained is characteristic of the species being
examined. Selecting a suitable wavelength and varying the analyte
concentration provides quantitative information regarding the
sample.
Both qualitative and quantitative, molecular and
atomic, spectrochemical analysis is possible in the vacuum u.v.
a) i,',olecular Spectra.
Despite the high absorptivities and characteristic
35

spectra of many gases in the far ultraviolet; relatively little
analytical molecular absorption analysis has been reported.
The main reasons for this are the absorption by the atmosphere
of radiation below 200nm and the limited transmission of most
spectrophotometers in this region. Kaye (50) modified Beckman
DK-1 and DK-2 spectrophotometers for use at wavelengths down to
170nm. This was accomplished using high quality silica for the
prisms and optical components and a hydrogen continuum lamp, with
a thin quartz window as the source. The attenuation of the
continuum radiation by the atmosphere was eliminated by purging
the optical path with nitrogen. Using a 1mm cell the absorption
spectrum of CS2 (0.2torr) between 170nm and 220nm was recorded.
Absorption of vacuum u.v. radiation by molecules occurs through
electronic transitions and any fine structure observed is due to
vibrational transitions. The overlapping of vibrational and
electronic states is evident from the far ultraviolet spectruM
of CS2. In a similar manner the spectra of methyl iodide vapour,
iodine vapour and ammonia were obtained (51). The possibility
of quantitatively analysing for ammonia in nitrogen and air was
examined by Gunther (52) and using the absorption bandhead at
204.3nm he was able to detect as little as 7ppm NH3. Ammonia
also has a bandhead at 193.6nm and this would provide for even
lower detection limits but the presence of oxygen could not be
tolerated.
The absorption spectra of liquids and solids in the
far ultraviolet are not so discreet as electronically excited
states are readily perturbed by neighbouring molecules. Vibrational
fine structure, therefore, is almost always absent on going from
vapour to solution spectrometry. Two solvents of widely varying
36

polarity, water and n-heptane, are among the most transparent
liquids at wavelengths above 172nm. A library of reference absorption
spectra in the far ultraviolet of organic and inorganic compounds
is presented in the reviews by Kaye (51) and Sponer (43).
Molecular emission is rarely of analytical use in
the far ultraviolet as the conditions necessary to attain a
significant excited population of a species frequently cause
decomposition of the molecule. Most of the molecules whose emission
spectra have been recorded are strongly bonded diatomic systems
eg. H2,N2,02,S2,CO3etc. (10).
b) Atomic Spectra.
The greatest amount of observed and recorded data
obtained in the far ultraviolet is concerned with atomic spectra.
Although all the elements show some characteristics in this region,
analytically the far ultraviolet is mainly concerned with the non-
metals. Table 1.5 lists those elements whose resonance transitions
occur in the Schumann ultraviolet.
Analytical atomic emission in the vacuum u.v.
is normally achieved using a vacuum spark source. The anode of
copper or carbon is set approximately 2mm above the sample, the
cathode, and the spectrum obtained using an overdamped discharge.
Spark sources have been used for the determination of carbon,
phosphorus, sulphur, selenium and arsenic in iron, steel and a
variety of alloys, (53,54).
Several workers have described the use of the
hollow cathode lamp as a source for quantitative atomic emission
analysis. Konovalov and Frisch (55) were able to detect nitrogen
and argon to a few thousand ppm and McNally et al. (56) developed
37
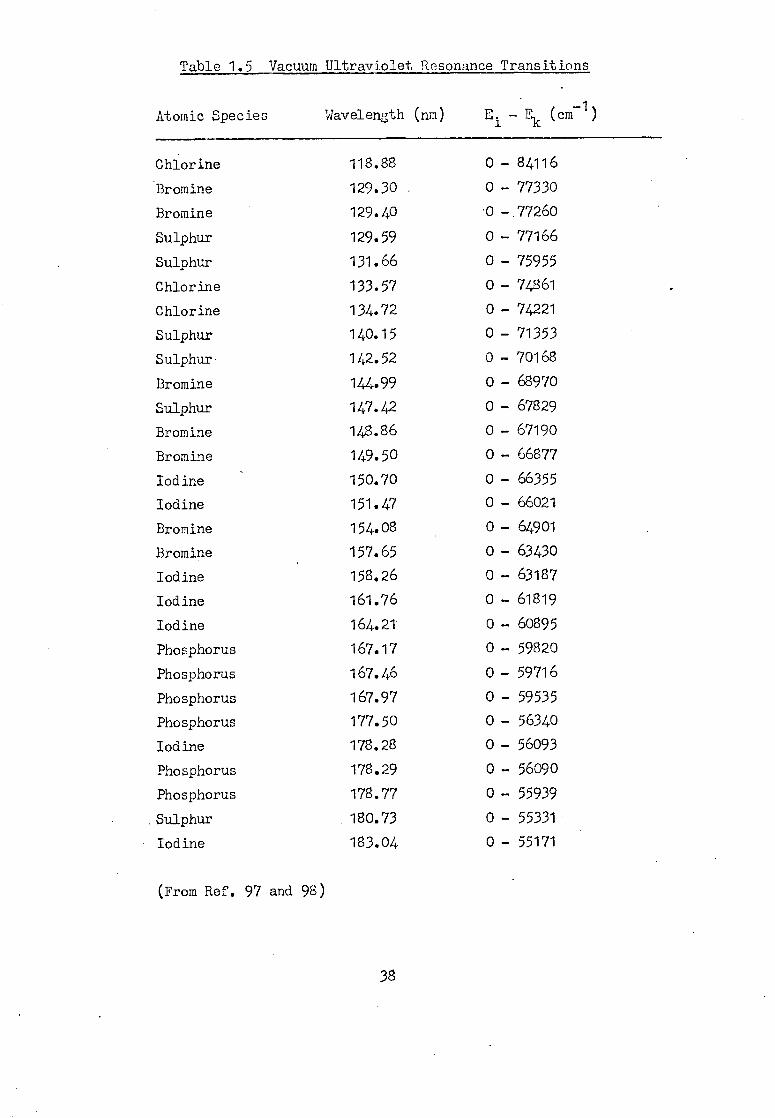
Table 1.5 Vacuum Ultraviolet Resonance Transitions
Atomic Species Wavelength (nm) E. - F (cm 1)
Chlorine 118.88 0 - 84116
Bromine 129.30 0 - 77330
Bromine 129.40 '0 -.77260
Sulphur 129.59 0 - 77166
Sulphur 131.66 0 - 75955
Chlorine 133.57 0 - 74861
Chlorine 134.72 0 - 74221
Sulphur 140.15 0 - 71353
Sulphur 142.52 0 - 70168
Bromine 144.99 0 - 68970
Sulphur 147.42 0 - 67829
Bromine 148.86 0 - 67190
Bromine 149.50 0 - 66877
Iodine 150.70 0 - 66355
Iodine 151.47 0 - 66021
Bromine 154.08 0 - 64901
Bromine 157.65 0 - 63430
Iodine 158.26 0 - 63187
Iodine 161.76 0 - 61819
Iodine 164.21 0 - 60895
Phosphorus 167.17 0 - 59820
Phosphorus 167.46 0 - 59716
Phosphorus 167.97 0 - 59535
Phosphorus 177.50 0 - 56340
Iodine 178.28 0 - 56093
Phosphorus 178.29 0 - 56090
Phosphorus 178.77 0 - 55939
Sulphur 180.73 0 - 55331
Iodine 183.04 0 - 55171
(From Ref. 97 and 98)
38

a spectroscopic method of analysis for fluorine, chlorine and
• sulphur at the ppm level using such a source. More recently
Milazzo (23,27) has described a hollow cathode source capable
of determining iodine at the nanogram level in a matrix of KC1.
Using a cathode sputtering cell, Kirkbright and Wilson have also
determined iodine, down to 0.02pg by atomic emission at 183.0nm(57).
The radiofrequencypinduction-coupled plasma has
been demonstrated to be an excellent excitation source for non-
metal emission analysis. Using such a plasma Ward was able to
detect iodine, sulphur, phosphorus and carbon at the ppm level,
(58 59). Dreher and Frank have described an induction-coupled
plasma powered from a 270W R.F. generator at 27.5MHz used for
the emission spectrometry of small samples of arsenic (at 189.0nm)
and iodine (at 183.0nm). The detection limit was 1pg for both
elements.
Atomic absorption spectrometry (AAS), as a sensitive
and quantitative analytical technique, developed from the work
by Walsh (60). If the shape of the atomic absorption profile
is due entirely to Doppler broadening, the absorption coefficient
(ky) at the line centre measured with a line emission source having
a negligable half-width is given by,
ky 2 (11.1 1r 2_. ire
---G) C 454T • " 1 ' 6
i.e. the absorption coefficient is dependant on the number of
atoms (N) capable of absorbing the incident radiation. Atomic
absorption follows an exponential law for the intensity of
transmitted radiation (I) against absorbing volume length and
39
absorption coefficient,
I = Io e-k
... 1.7
Where Io is the intensity of the incident radiation. In practice
the absorbance (A) is measured, defined as,
A = log (I0A) ... 1.8
and, from Eq. 1.8,
A = kyl/2.303 ... 1.9
i.e the absorbance is directly proportional to the absorption
coefficient.
The most common atom cells in analytical AAS are flames.
At wavelengths shorter than 200nm, however, few flames have
sufficient transparency to allow atomic absorption measurements
to be undertaken. Kirkbright et al. (61,62,63) have demonstrated
that the nitrogen-separated nitrous oxide-acetylene flame permits
radiation above 175nm to be transmitted and have used this flame
as the atomiser for the direct determination of mercury at 184.9nm,
iodine at 183.0nm, sulphur at 180.7nm and phosphorus at 177.5nm,
178.2nm and 178.8nm. A typical instrumental arrangement employed
is shown in Fig.1.13.
The use of non-flame atomisers for AAS in the vacuum
ultraviolet is described in more detail in Chapter 2.
40

N20 -C2H2 burner
vacuum monochrom.
.... ..."
(0 EDL ._. .__ 0.) p.m.t
/ modulator
amp.+ p.s. E.H.T.
readout
VacuumU.V. Flame AAS System

TWO

2.1 Introduction
Atomic absorption spectrometry (AAS) has developed
rapidly into a powerful analytical technique, complementing the
older practice of atomic emission spectrometric analysis (AgS).
Because of its development from AFS it is not surprising that
flames, the original excitation cells for emission analysis,
became the most common and widely accepted atom cells for AAS.
As the atom cell is responsible for the production, from the
analyte, of the atoms on which qualitative and quantitative meas-
urements are made the cell must be capable of desolvating the
sample, dissociating the molecular species present and, for AAS,
producing ground-state atoms. These conditions usually necessitate
high temperatures and a chemically reducing atmosphere. The atomisation
process should be independAnt of the nature of the sample, i.e.
no matrix effects, and be adaptable to a variety of techniques
(AAS,AES and AFS). There should be no spectral interference from the cell
itself, and, finally, the atoms once formed should have sufficiently
long enough residence time in the optical path for analytical
measurements to be made. Although no atom cell fulfills all of
these criteria, flames provide most of the requirements necessary
for practical AAS as well as simplicity of operation, ease of
sample introduction and a variety of available types. Because
of this progression from emission to absorption and the use of
the readily available flame systems little research was undertaken
on non-flame cells until the late 1960's. Today many such cells
are available commercially and their application is becoming
rapidly routine in many analytical laboratories. This expanding
field of non-flame AAS has prompted several reviews of these

systems, (64,65). It is necessary here only to mention the
relative merits of flame and non-flame cells and discuss the
more common non-flame atomisers; especially those having been
employed for the detection and determination of the non-metals
and those capable of possible far u.v. AAS.
The more important advantages of using electro-
thermal atom cells over flames for AAS may be summarised as follows.
1) Non-flame cells provide for greater sensitivity than flames.
Winefordner (66) has shown that the atomic concentration in
electrothermal devices is greater than in flames; no gas expansion
as occurs with flames takes place with non-flame cells.
2) Much smaller samples (typically 0.5 to 10911) are capable of
being analysed using electrothermal cells. The sensitivity
of the technique may be increased by applying larger volumes
to the atom cell-each sample being dried usually before a
second is applied.
3) The reactions of analyte atoms with hot gas molecules in flames
often leads to complex and thermally stable species being formed
eg. monoxides, monohydroxides,etc. As non-flame cells use
inert-gas purging,oxide formation is a much less serious problem;
although. reactions with the cell material eg. graphite may
cause a loss in sensitivity due to stable compound formation
eg. carbides.
4) Compared with many flame systems the background emission from an
electrically heated cell is negligible in the wavelength region
most commonly employed for AAS; below 400nm. Any interfering
emission that is present may be overcome with little difficulty
by limited-field viewing or source-emission modulation.

5) The use of potentially explosive gas mixtures as employed
with flames makes their use unsuitable for many applications.
6) Solid samples may be analysed directly in non-flame cells in
a number of applications. Solid sample nebulisation into
flames is a notoriously unreliable technique.
7) For the AAS study of non-metals, whose resonance lines occur
at wavelengths shorter than 185nm, all flames suffer the
disadvantage of absorbing much of the incident radiation. The
nitrogen-separated nitrous oxide-acetylene flame has proved
to be the most suitable for the AAS determination of the non-
metals at wavelengths above 175nm, (470,G2,63). The inert
gas separation of this flame increases its reducing nature
and decreases the partial pressure of oxygen, the principal
absorbing species of radiation below 200nm. Wilson investigated
the transparency of the nitrogen-separated nitrous oxide-acetylene
flame and a variety of other flames at the iodine 183.0nm
resonance line and the results are summarised in Table 2.1.
Non-flame cells do not suffer from this loss in
transmission below 200nm as the inert gas purging employed
with such devices serves to remove the atmospheric oxygen,
water vapour, etc. from the cell. However, at these shorter
wavelengths background absorption and scatter of incident
radiation by vaporised and particulate matter from the furnace
may present similar problems as those observed with flames.
The major disadvantages of non-flame cells are due
to the transient nature of the signals produced by these devices.
Such signals are typically 0.1 to 10sec in duration depending on
the cell geometry, and sophisticated electronic processing systems
45
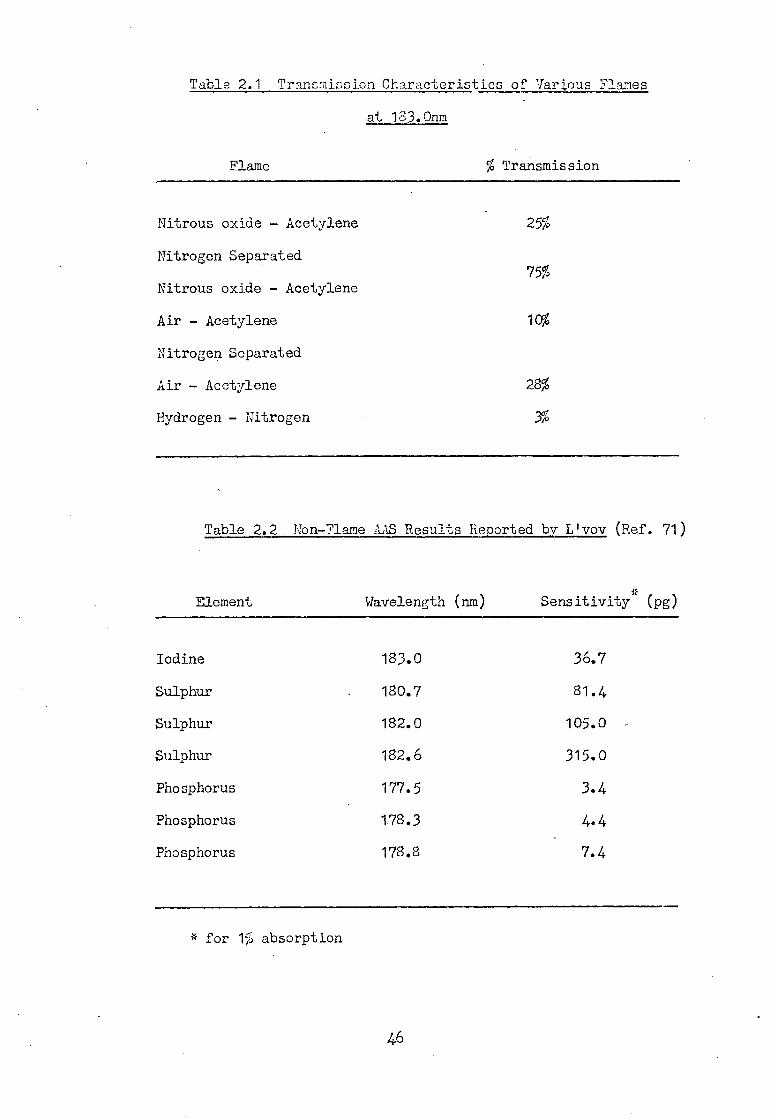
Table 2.1 Transmission Characteristics of Various Flames
at 183.0nm
Flame % Transmission
Nitrous oxide — Acetylene 25%
Nitrogen Separated 75%
Nitrous oxide — Acetylene
Air — Acetylene 10%
Nitrogen Separated
Air — Acetylene 28%
Hydrogen — Nitrogen 3%
Table 2.2 Non—'lame AAS Results Reported by Lvov (Ref. 71)
Element Wavelength (nm) Sensitivity (pg)
Iodine 183.0 36.7
Sulphur 180.7 81.4
Sulphur 182.0 105.0 -
Sulphur 182.6 315.0
Phosphorus 177.5 3.4
Phosphorus 178.3 4.4
Phosphorus 178.8 7.4
for 1% absorption
46
are often required especially with 0.1 to 0.5sec signals. Because
of the shorter residence time of the analyte sample in the heating
zone of non-flame atomisers interference effects caused by non-
specific absorption from thermally stable inorganic salts are
encountered frequently. This molecular absorption interference
tends to be far more severe with electrothermal cells than with
flames and background correction techniques are widely employed
to counter these effects. As mentioned previously, some elements
may react with the material from which the cell is made, forming
stable species and lowering the sensitivity of the technique.
2.2 Furnace Atomisers
The King Furnace. The majority of non-flame atomisers in use
today for AAS are constructed of graphite and resistively heated
by low voltage, high current power supplies. The original cell
on which most are based was due to King in 1908, (67).
The King furnace comprised a graphite
tube, 150 to 200mm long, 16mm o.d., of wall thickness 0.5mm except
at the ends which were thicker to take the metal supports serving
as electrodes. It was heated from a 25V, 200A a.c. supply and was
surrounded by a water jacket. The hydrogen purging employed
prevented the oxidation of the graphite. Using this apparatus
King observed the emission and absorption spectra produced by a
variety of metals (Na, Ca, Cu, Cs, etc.) under carefully controlled
conditions. The sample, usually as the metal or its halide, to
be investigated was placed inside the furnace in a small porcelain
boat. Working temperatures of 2900K were obtained and the spectra,
after dispersion with a spectrograph, recorded on photographic plates.
47

A similar but much larger furnace has been constructed
by Collins et al. (GS). The graphite tube was resistively heated
by a 42.5V, 5000A power supply and maintained for over 100 hours
at 2200K without signs of decomposition.
The L'vov Furnace. The first furnace reported to be employed
successfully for analytical purposes was developed in Russia by
L'vov. A topical L'vov furnace is shown in Fig.2.1. He was
one of the first to examine the effect of the size of the furnace
on the analytical signals obtained and tubes 20 to 50mm long and
1 to 6mm i.d. have been reported, (6q,7o). The tube is resistively
heated by an a.c. current at 10V from a 4kW transformer. The
temperature attained by the furnace is regulated by the voltage
supply to the primary circuit of the transformer. The sample
is placed on the tip of an auxilliary 6mm diameter graphite rod
electrode and dried; the tip of this rod is shaped to fit the
orifice in the tube wall. Five or six electrodes with samples
are positioned below the tube in an evacuated chamber. Argon is
introduced into the chamber until the desired pressure, upto 8
or 9 atm., is achieved. The tube is heated for 20 to 30sec until
the required temperature is attained and the auxilliary electrode
moved into the orifice in the tube wall. This electrode is then
heated by a separate a.c. current from the secondary windings
of a 1kW step-down transformer (220/15V). The sample on the rod
is vaporised and the atomic absorption signal recorded. With
an argon pressure of 1.2atm, the tube at 1900K and using LiF
windows and lenses, a vacuum monochromator and electrodeless
discharge lamp line emission sources L'vov determined iodine,
48

4cm.
crucible
graphite electrode with sam•le contacts
L'vov Furnace. Fig. 2.1
300mm
[7- Furnace
Sample Electrode
Woodriff Furnace Fig.2 2
49
sulphur and phosphorus by AAS at their vacuum ultraviolet resonance
lines, (71). The sensitivities achieved are shown in Table 2.2.
The Woodriff Furnace. Independently of L'vov's work a similar
furnace atomiser arrangement was developed by Woodriff, (65,/2„).
The Woodriff furnace (Fig.2.2) consists of an insulated graphite
tube containing an inert gas, usually argon, at atmospheric pressure.
The sample port has a constriction near the atomisation tube
making a seal with the rim of the sample containing crucible.
Unlike L'vov's system the temperattmof this crucible is raised
by heat transfer from the furnace. The rate of heating, therefore,
depends on the heat capacity of the crucible, the rate of insertion
of the crucible into the furnace and the rate of heat transfer
from the tube to the crucible. No vacuum ultraviolet AAS studies
have been reported using this system; because of its complex
design and large physical size relatively few applications for
metal element AAS by workers other than Woodriff have been reported.
However, the use of a large furnace does assist in eliminating
sample matrix effects and this system may be of value in future
non-metal AAS studies. As with the L'vov furnace the fact that
the sample in the Woodriff system is completely enclosed inside
the tube, except for the tube ends, increases the atomic residence
time in the optical path providing for increased sensitivity.
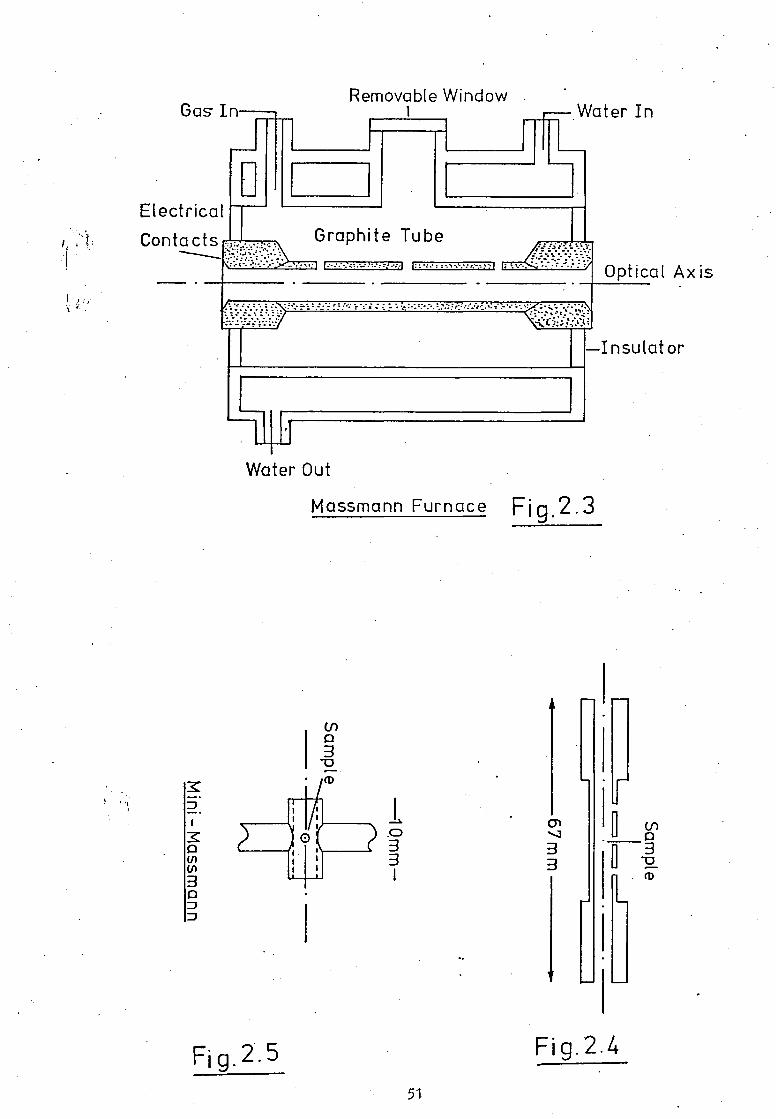
The Massmann Furnace. A more popular graphite furnace has been
described by Massmann (73) and is available commercially (74);
the HGA 2000 (Perkin-Elmer Corptn., U.S.A.). This is shown in
Fig.2.3. The graphite tube is 53mm long, 6.5mm i.d., has a wail
thickness of approximately 1.5mm and two purge gas holes and a
central sample introduction orifice in the wall. The furnace is
50
UU
DW
SS
DIA
J -
NIN
Electrical
Removable Window . Gas- In
Water In
■••■••••
Graphite Tube
Optical Axis
—Insulator
Water Out
Massmann Furnace Fig.2.3
sp 3 3
rn
3 3 II
(r)
3 -o fp
Fig.2.5
Fig.2.4
51.
held between conical graphite end-pieces in water-cooled metal
electrodes inside an inert-gas purged chamber, open to the atmosphere
at the tube ends. The sample solution (typically 5 to 20q41) is
placed in the cold tube via the central hole using a micropipette.
The tube is heated gently to dry the sample and remove the solvent
from the furnace and then heated more strongly, with a current of
upto 400A, to atomise the sample. If an organic matrix is to
be analysed an ashing stage may be introduced between the drying
and atomising steps to decompose the matrix and prevent smoke
formation during atomisation. At full power (12V at 400A) the
tube may attain a temperature of upto 3000K within a few seconds.
The water-cooled supporting electrodes allow for rapid cooling
of the furnace and reduce the dead-time between samples. This
arrangement also makes for a thermal gradient along the length of
the tube when it is heated and because of the cooler tube ends
this system occasionally suffers from severe background absorption
and molecular absorption from the sample matrix. Wilson (is)
modified a Perkin-Elmer 305B double beam atomic absorption spectro-
photometer with HGA2000 furnace and background correction
facilities to enable the determination of iodine at 183.Onm using
an iodine EDL as the line emission source.
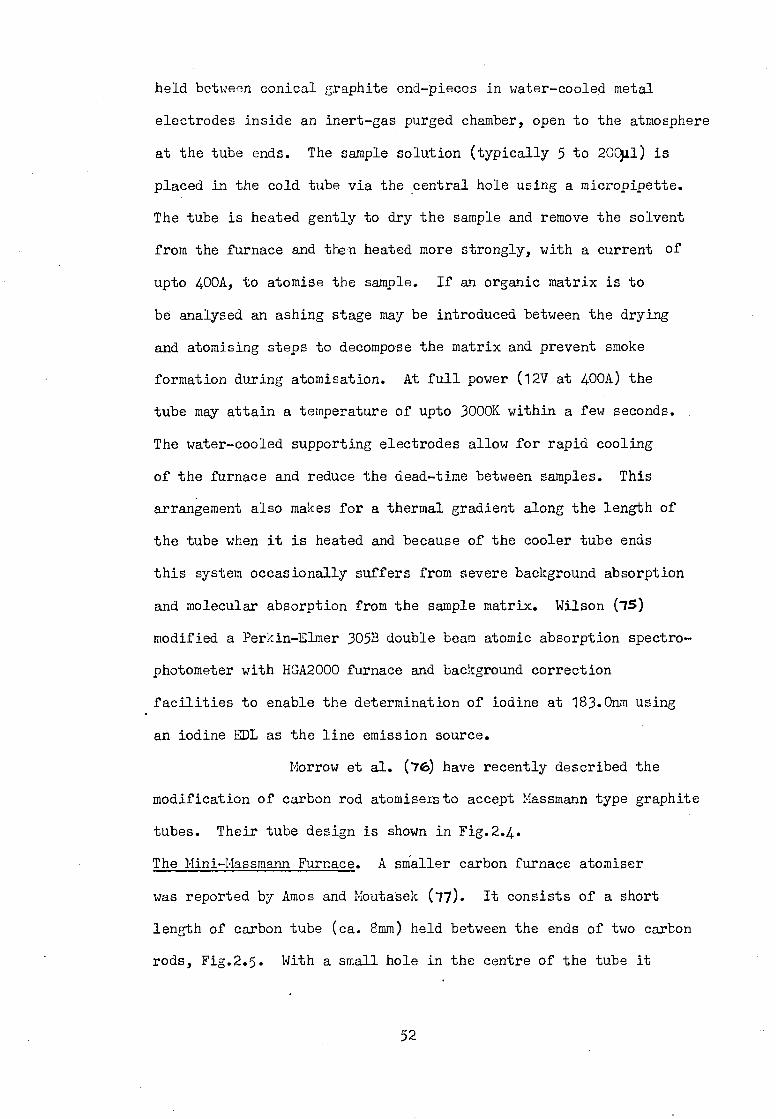
Morrow et al. (76) have recently described the
modification of carbon rod atomisers to accept Massmann type graphite
tubes. Their tube design is shown in Fig.2.4.
The Mini-Ilassrnann Furnace. A smaller carbon furnace atomiser
was reported by Amos and Moutasek (/7). It consists of a short
length of carbon tube (ca. 8mm) held between the ends of two carbon
rods, Fig.2.5. With a small hole in the centre of the tube it
52

may be used in a similar manner to that described for the Massmann
furnace. This carbon rod atomiser, often referred to as a mini-
Massmarn, is also available commercially (Varian Inst. Pty. Aust.).
In general this small tube has lower background absorption and
greater sensitivity than the larger furnaces but shows the most
severe matrix effects.
Becker-Ross and Falk (-78) have recently
described the direct determination of bromine by AAS using a bromine
resonance line in the vacuum u. v.; 148.86nm. Their atom cell
was a carbon tube oven fitted at the ends with LiF lenses. A
hollow cathode lamp was employed as the source and non-specific
absorption corrected for by utilising the nearby nitrogen 149.26nm
line.
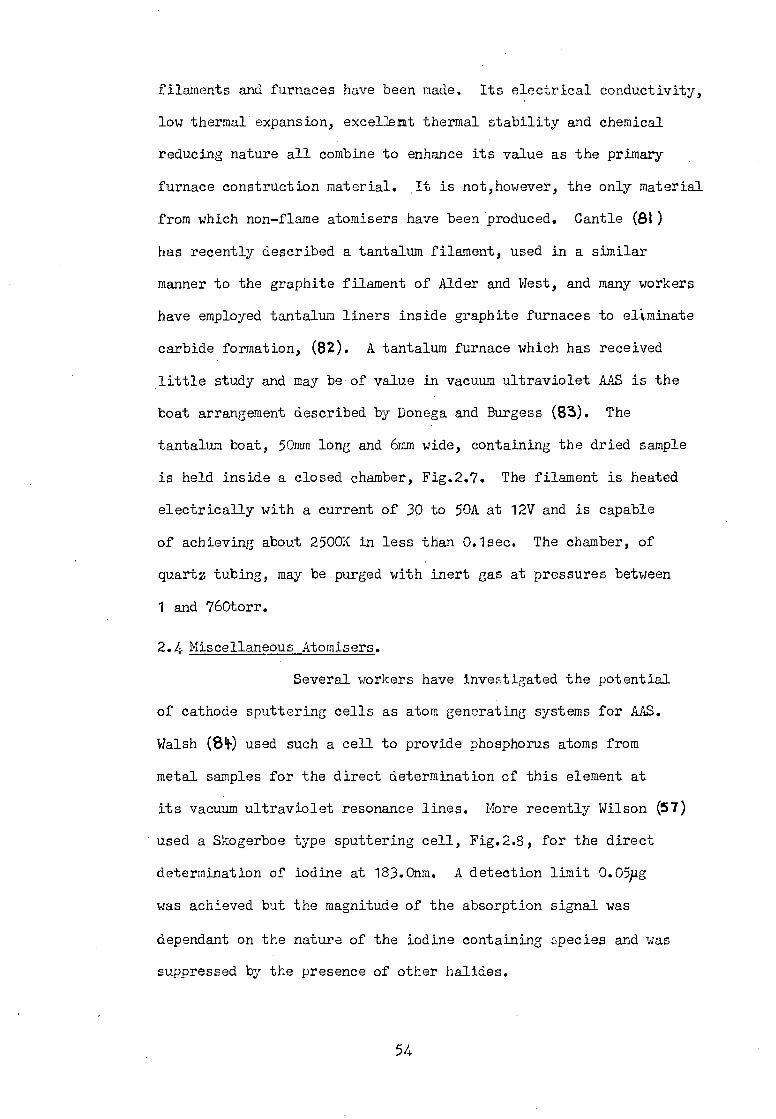
2.3 Filament Atomisers.
In addition to the graphite tube atom cells,
graphite filament atomisers have been employed extensively for
the determination of trace quantities of metals by AAS. These
filaments are based generally on the system designed by Alder and
West (19) and comprise a short carbon rod (ca. 25mm long and 2mm
diameter) clamped between two water-cooled supporting pillars,Fig.2.6.
Power is transferred to the rod via the usual Variac and trans-
former arrangement. Because of the open nature of this type of
cell volatile elements and those species requiring a long residence
time at elevated temperatures are unsuitable for AAS analysis
with this system. Marshall (80) examined such a cell for the
direct determination of sulphur but was unable to detect any
atomic sulphur signal from elemental sulphur or its compounds.
Graphite is the most common material from which
53
filaments and furnaces have been made. Its electrical conductivity,
low thermal expansion, excellent thermal stability and chemical
reducing nature all combine to enhance its value as the primary
furnace construction material. It is not,however, the only material
from which non-flame atomisers have been produced. Cantle (81)
has recently described a tantalum filament, used in a similar
manner to the graphite filament of Alder and West, and many workers
have employed tantalum liners inside graphite furnaces to eliminate
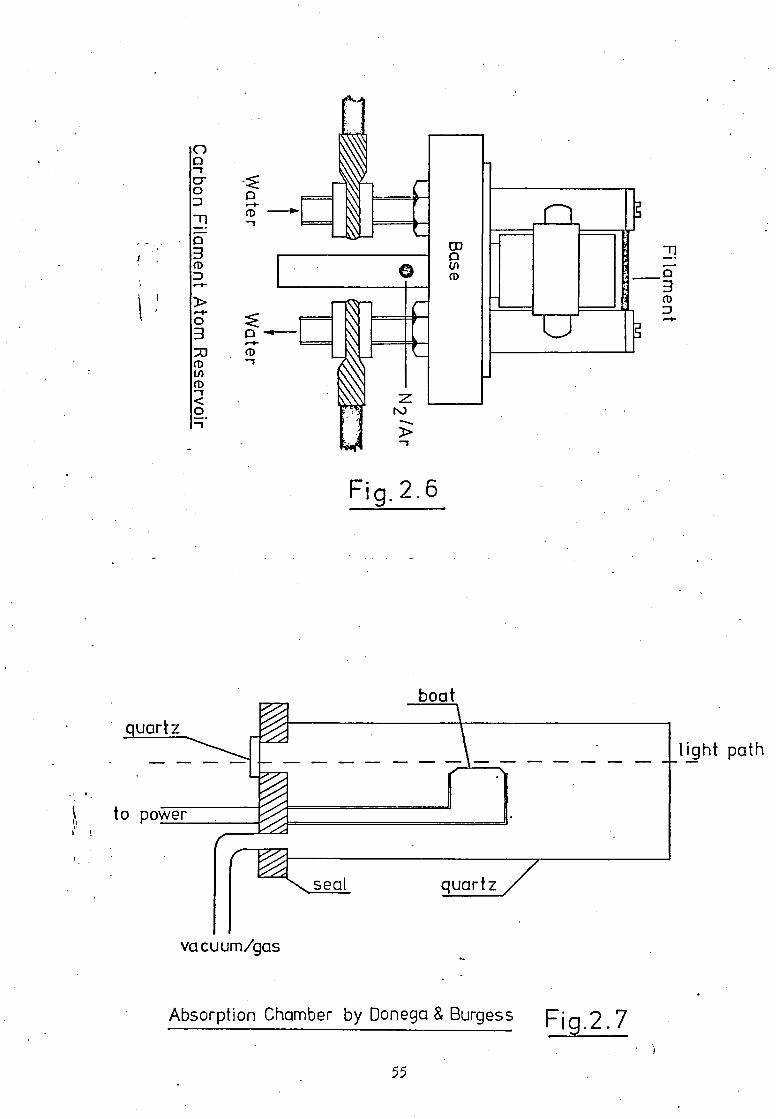
carbide formation, (82). A tantalum furnace which has received
little study and may be of value in vacuum ultraviolet AAS is the
boat arrangement described by Donega and Burgess (83). The
tantalum boat, 50mm long and 6mm wide, containing the dried sample
is held inside a closed chamber, Fig.2.7. The filament is heated
electrically with a current of 30 to 50A at 12V and is capable
of achieving about 2500K in less than 0.1sec. The chamber, of
quartz tubing, may be purged with inert gas at pressures between
1 and 760torr.
2.4 Miscellaneous Atomisers.
Several workers have investigated the potential
of cathode sputtering cells as atom generating systems for AAS.
Walsh (810 used such a cell to provide phosphorus atoms from
metal samples for the direct determination of this element at
its vacuum ultraviolet resonance lines. More recently Wilson (57)
used a Skogerboe type sputtering cell, Fig.2.2, for the direct
determination of iodine at 183.0nm. A detection limit 0.05pg
was achieved but the magnitude of the absorption signal was
dependant on the nature of the iodine containing species and was
suppressed by the presence of other halides.
54
JI0A
-leSei
WO
4V
41J
aWD
]ld
UOCI
JIDO
m fl
CD
Fig. 2.6
boat
quartz
light path
vacuum/gas
Absorption Chamber by Donega & Burgess Fig.2. 7
55

Fig.2.9
Trigger —01 Unit —o
Pyrolysis Flash Tube
L1
-100yF
Cap.
Garton Flash Cell
Trigger
Unit
Background Flash Tube
10pF Cap.
10 kV supply
56
slit
1 00 mm O
Gas In. To Vacuum
raphite
Teflon
Rubber
O
Skogerboe Sputtering Cell Fig. 2.8
Photolytic dissociation and atomisation has been
used successfully for atomic absorption studies in the far ultra-
violet. Garton (35) investigated the absorption spectra of flash-
vaporised solids by placing the finely divided solid sample inside
a special flash tube fired by ca. 4000J from a capacitor bank,Fig.2.9.
The radiant fluxes obtained were as high as 60kW.cm 2 causing
flash-evaporation of the sample. A second flash, delayed by 0.3m.sec,
provides the emission source against which the absorption spectrum
is measured. Using this apparatus Garton was able to monitor the
absorption spectrum of tungsten in a wavelength range extending
well into the Schumann region. Nelson and Keubler (EIG) used a
similar technique to measure the absorption spectra from many
flash-vaporised metals. Although no direct quantitative analyses
were made sensitivities in the low ppm range were anticipated.
The radio frequency induction-coupled argon plasma
and the microwave argon plasma have both been reported as being
used as atom cells for absorption studies (BI;BS) and could be
useful for vacuum ultraviolet studies. However, the high temp-
eratures and high excitation conditions present in such systems
makes them better as atomic emission devices.
The vacuum ultraviolet AAS studies reported in
this work were conducted using two types of graphite electrothermal
atomiser. The first was a small tube furnace similar to the
Massmann furnace and the second a mini-Massmann rod system.
57

THREE
58
3.1 Introduction.
Iodine is a biologically important element,
occurring in trace quantities in all body tissues as inorganic
iodide and protein-bound iodine. Typical protein-bound levels
in serum range from 0.005 to 0.04tg.m1 iodine, depending on
the functioning of the thyroid glands, (8q).
The AAS determination of iodine is accomplished
normally via an indirect determination. Thus, the ion-association
complex formed between tris (1,10-phenanthroline) Cd II and iodide
may be extracted into nitrobenzene and the cadmium determined
by AAS at its 228.8nm resonance line using an air-acetylene flame,
(90,91). In a second procedure iodide reduces Cr VI to Cr III
in acid medium, the excess Cr VI may be extracted into MIBK and
the absorbance by chromium in the aqueous layer then increases
in a linear manner with increasing iodide concentration, (n).
Alternatively, Se IV may be reduced by iodide to elemental selenium,
the solution may be filtered and the decrease in absorbance of
the selenium in the filtrate is proportional to the iodide ion
concentration in the sample solution, (92.). In acid solutions
iodate will oxidise Fell to Fe III which will extract into diethyl
ether from the acid medium and the absorbance by iron in either
solution may be determined as a measure of the iodate concentration.
Indirect determinations are often unsatisfactory
as the chemical pretreatment before AAS is affected often by the
sample matrix, eg. the solution pH, interfering ions, etc. These
methods require a detailed knowledge of the sample before analysis,
and are frequently laborious techniques.
Below 200nm iodine is the first non-metal element
59

to have a resonance line, at 183.0nm, in the Schumann ultraviolet.
An extensive survey of the spectrum of iodine has led Kiess and
Corliss (15) to list over nine-hundred lines emitted by neutral
iodine atoms in the wavelength region 119.5nm to 230.7nm. The
Grotrian diagram for iodine is illustrated in Fig.3.1 and the
transition probabilities of the more important transitions in
Table 3.1, (94.).
This chapter describes a method for the direct determination
of iodine by non-flame AAS using its resonance lines in the far
ultraviolet; 183.0nm and 173.2nm.
3.2 Apparatus-D.C. Measurement Techniques.
The instrumental arrangement employed is shown
in Fig.3.2. An iodine electrodeless discharge lamp (ELL) was
used as the line emission source. This was made from silica
tubing (i.d. 8mm, 1mm wall thickness) to form a bulb 200mm in
length containing a few milligrams of iodine and approximately
5torr of argon. The EDI, was supported in a 4-wave resonant cavity
(Model 210L, Electromedical Supplies Ltd., Wantage, U.K.) by
means of a metal holder which allowed reproducible positioning
of the lamp. The base of the cavity was sealed and a 25mm diameter
Pyrex tube fitted over the viewing port to allow efficient purging
of the cavity and optical path. Most EDL sources used for AAS
studies have bulbs typically 30 to 50mm long, enabling the whole
of the bulb to be contained within the cavity and thus achieving
thermal equilibrium over the length of the lamp. The highly
volatile nature of iodine, however, prevents such small bulbs
being used with this element. The heat generated by the discharge
causes a high vapour pressure of iodine to rapidly form inside
60

Fig. 3.1 Partial Grotrian Dia,7ram For Iodine.
1 0 -
8
6-
0)
-
179.909
184.445
187.641 178.276 206.163
183.038
2
Table 3.1 Iodine Resonance and Non-Resonance Lines.
Wavelength (nm) Transition Prob. (seC1 ) xl09
E. 1
Eic (cm 1 )
178.276 2.71 0 56093
179.909 2.11 7600 63187
183.038 0.16 0 55171
184.445 0.07 • 7600 61819
187.641 0.03 • 7600 60895
206.163 0.03 7600 56093
61
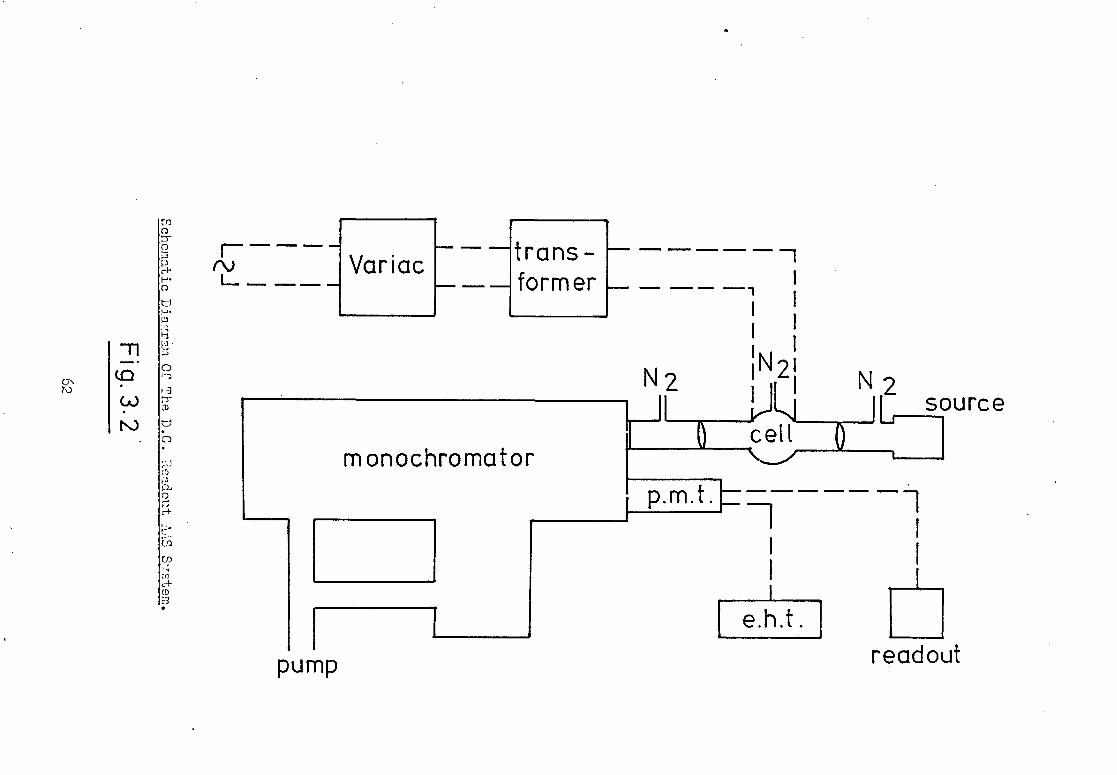
pump
IN) Variac trans- former
N21 2
source cell
m onochromator •■■•■•• .11■■•
e.h.t. readout
rn C)
FA)
O
1.3
CD
•
C') I)
O
Cf3
CD
7D
:71 •
the bulb causing an unstable condensed discharge. The source
was powered by a 2450MHz Microtron Mk III microwave generator
(EMS Ltd., U.K.), using a reflected-power meter (EDT Research
Ltd., London W.4.) connected in series between the generator and
cavity to allow the lamp and cavity assembly to be tuned to minimum
reflected power. The discharge was initiated with a Testa coil
and the optimum applied power found to be 15watts; with a reflected
power reading of near zero. At higher applied powers the cavity
and lamp became appreciably warmer and the iodine inside the lamp
was seen to condense onto the wall of the silica tubing not contained
in the cavity. At powers of 60 to 70watts the discharge became
visibly unstable and the iodine line emission intensity much
reduced.
Radiation from the source was focussed into the graphite
tube atomiser by a biconvex silica lens (25mm diameter, 80mm focal
length). The radiation emerging from the atomiser was brought
then to a focus on the entrance slit of the monochromator by a
similar silica lens. The optical path was formed from glass
tubing (25mm i.d.) placed between the source and graphite atomiser
and between atomiser and monochromator entrance slit; this path
was maintained under a slightly positive pressure of oxygen-free
nitrogen to remove atmospheric oxygen, water vapour, etc. Each
lens was positioned inside the glass tubing using polythene holders
and the complete optical path, including the source and atomiser,
was mounted onto a one-metre optical bar to provide normal incidence
at the monochromator entrance slit.
A one-metre, normal incidence, concave grating, vacuum
monochromator (type E760, Rank Precision Instruments Ltd., U.K.)
63

was used for these studies, Fig.3.3. The groove separation of
the concave grating used was 1.67)1m and provided a working range
of 30 to 500nm in the first order, a dispersion rate (plate factor)
of 1.6nm.mm-1 and theoretical resolving power of approximately
30,000. Its effective numerical aperture ratio was f/12. The
monochromator was operated in conjunction with a rotary roughing
and backing pump and an oil diffusion pump, Fig.3.4. Pressures
of less than 10 5torr were possible using this arrangement, although
for those studies at wavelengths greater than 175nm an operating
pressure of ca. 0.ltorr was sufficient to provide good transmission
of radiation. The positions of both exit and entrance slits were
fixed, and wavelength scanning was controlled either manually or
by a motor driving through a gear box. A nine-speed gearbox was
fitted providing nominal forward and reverse scanning speeds of
0.05, 0.1, 0.2, 0.5, 1.0, 2.0, 5.0, 10.0 and 50.0nm.sec-1. A
25mm diameter, 3mm thick, calcium fluoride window was mounted
across the entrance slit of the monochromator to retain the low
pressure. A vacuum tight flange was constructed from aluminium
alloy and fitted to the monochromator exit slit. The photomultiplier
tube housing was bolted to this flange, holding the pmt such that
its window provided a vacuum-tight seal against a rubber 0-ring
recessed into the flange. The photomultiplier tube employed was
a Model 6256B, 50mm diameter silica end-window tube, with an
effective cathode diameter of 10mm, (EMI Electronics Ltd., U.K.).
This was a 13-stage venetian blind system of very high gain, ca.
10g. The photomultiplier tube was operated with a Brandenburg,
Model 475R, EHT unit at the voltage which gave the best signal to
noise ratio with. the radiation levels available; about 1600V.
64


P gauge
••■••■■••
monochromator valve
P gauge
valve
backing pump
diff. pump
air valve
Pumping System
Fig. 3. 4
66
The graphite tube atom cell employed is shown in
Fig.3.5 and Fig3.6 and is similar to that described by Dagnall,
Johnson and West, (15). A high purity graphite tube of 6mm o.d.,
4mm i.d. and 20mm in length was machined from graphite rod (Grade
RW003, Ringsdorf Company Ltd.). A sample introduction port was
provided by a 2mm diameter hole drilled through the wall of the
tube. The graphite tube was supported by a graphite split-ring
at each end and the assembly was then retained by two stainless-
steel L-shaped holders. One holder was secured to a stainless-
steel support column and the second rested on a second column
and was earthed via a length of copper braiding attached to the
base of the unit. One holder was thus allowed to 'float' to
simplify the alignment procedure and prevent fractures in the
graphite tube owing to its expansion on heating. Both support
columns were water cooled.
The graphite tube was heated electrically; power
was supplied via a Variac transformer (20A Claude Lyons Ltd, U.K.)
and a large power transformer (rating 10kW, Foster Transformers Ltd.,
U.K.) to provide 1CV and over 500A across the furnace. The entire
cell was maintained under a constant flow of oxygen-free nitrogen
or argon by means of a glass housing fitted with a removable cover
to allow the sample to be transferred to the tube, and silica
windows (1mm thickness) to permit transmission of the source
radiation. The atom cell was inert -gas purged by a supply separate
from that used for the optical system, so that the flow-rate
could be adjusted without affecting the transmission of the optical
path.
The output signal from the photomultiplier tube
67

steel electrod
support
graphite tube
split
ring .--2 0 mm---■
graphite tube
g electrode
I I 1: base
water 20mm
water
0
0
I ; 44. : ;
4... 1 j I I
.9mm- --6m m•— • shield gas
15mm
Fig. 3.5 Fig. 3.6

was led to either a potentiometric chart recorder (RE511, Servoscribe
Ltd., U.K.) if spectra were being recorded or to a storage type
oscilloscope (DM64, Telequipment Ltd., U.K.) if transient absorption
signals were being monitored.
All real signals carry an unwanted component
termed noise. This serves to produce variations in the measured
analytical signal and it is necessary to extract the signal from
this noise as efficiently as possible. For a d.c. signal, such
as the EDL emission used in these studies, the major noise component
is produced by a time variation in the emission intensity and the
noise inherent in the photomultiplier tube radiation measuring
system, (96,97,98). The d.c. signal may be smoothed by using a
long readout time-constant or by shunting a capacitor across the
voltage output terminals of the detector. This capacitance smoothing
technique serves to filter from the required signal all frequencies
higher than that of the zero frequency of the d.c. signal. This
procedure necessitates a compromise between noise reduction and
the effective time-constant of the measuring system. Thus, an
increase in capacitance increases the efficiency of filtering
and hence the signal-to-noise ratio but increases the instrumental
time-constant, i.e. the time required for a signal to be measured.
The use of non-flame atomisers for AAS implies relatively short
atomic residence times (typically 0.1 to 5.Osec) in the optical
path and this limits the capacitance which may be applied to smooth
the signal. The iodine AAS studies described here were conducted
with a 0.41F capacitor across the signal input terminals of the
oscilloscope having an impedance of 114 ; providing for a time-
constant of 200m.sec. This capacitance value was determined by
69
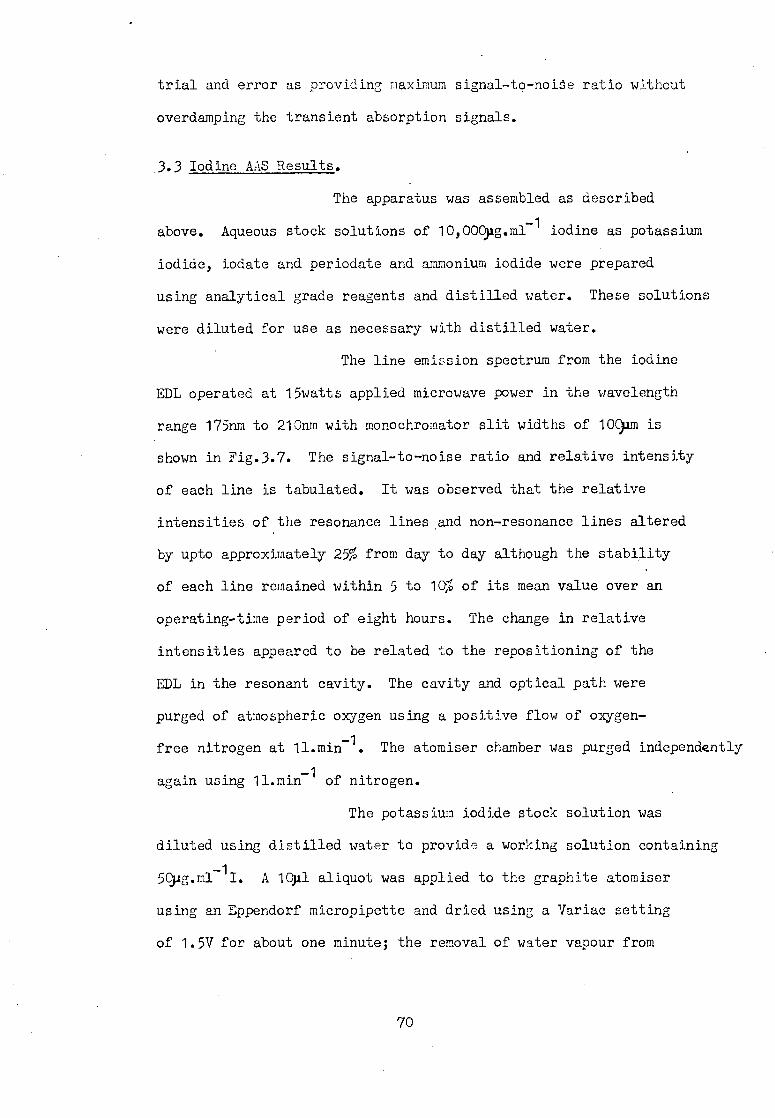
trial and error as providing maximum signal-to-noise ratio without
overdamping the transient absorption signals.
3.3 Iodine AAS Results.
The apparatus was assembled as described
- . above. Aqueous stock solutions of 10,000pg.m1 1 Iodine as potassium
iodide, iodate and periodate and ammonium iodide were prepared
using analytical grade reagents and distilled water. These solutions
were diluted for use as necessary with distilled water.
The line emission spectrum from the iodine
EDL operated at 15watts applied microwave power in the wavelength
range 175nm to 210nm with monochromator slit widths of 1091m is
shown in Fig.3.7. The signal-to-noise ratio and relative intensity
of each line is tabulated. It was observed that the relative
intensities of the resonance lines and non-resonance lines altered
by upto approximately 25% from day to day although the stability
of each line remained within 5 to 10% of its mean value over an
operating-time period of eight hours. The change in relative
intensities appeared to be related to the repositioning of the
EDL in the resonant cavity. The cavity and optical path were
purged of atmospheric oxygen using a positive flow of oxygen-
free nitrogen at 11.min 1. The atomiser chamber was purged independently
again using 11.min-1 of nitrogen.
The potassium iodide stock solution was
diluted using distilled water to provide a working solution containing
50.11g.m1-1I. A icAl aliquot was applied to the graphite atomiser
using an Eppendorf micropipette and dried using a Variac setting
of 1.5V for about one minute; the removal of water vapour from
70
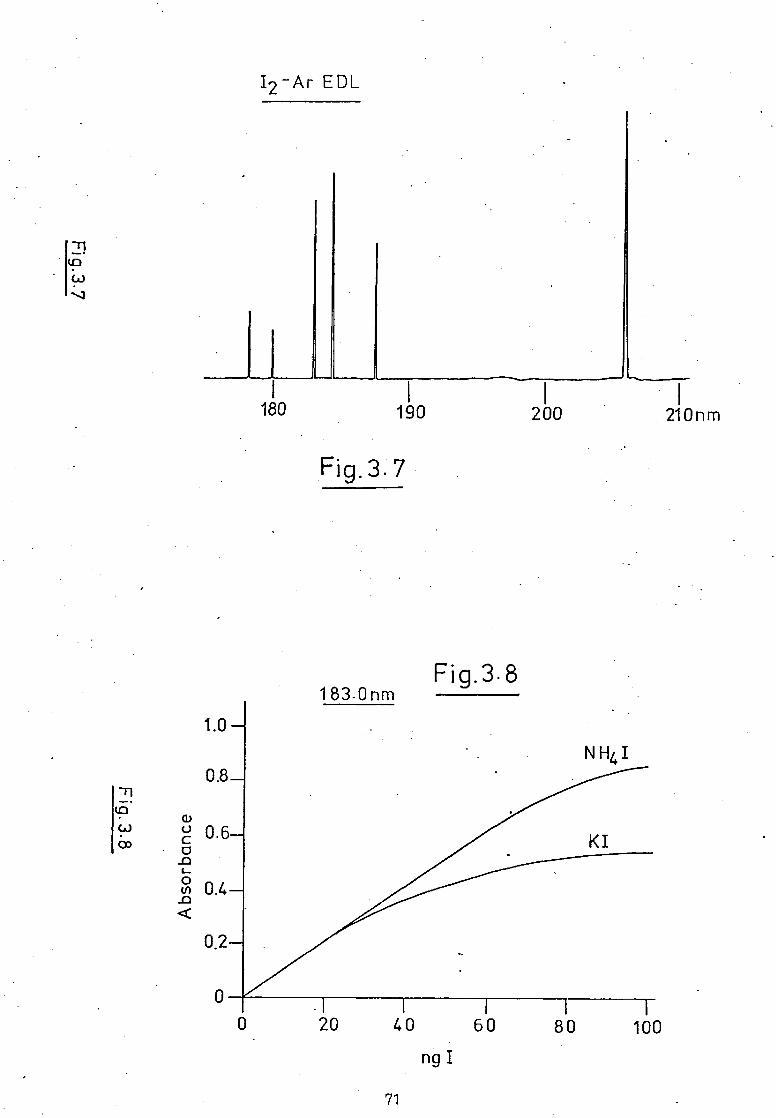
I2 -Ar EDL
Ig.3.7
183-Onm Fig.3.8
cn
Abso
rban
ce
I I I 20 40 60
ng I
71,
0 80 100
1.0—
0.8—
0.6—
0.4—
0.2—
N H4 I
KI
-n

the cell could be monitored as an increase in the transmission
of the source radiation as observed on the storage oscilloscope
screen. The power to the furnace was switched off and the Variac
set at 8V, the sample was atomised at 8V for 3 to 4sec. This
procedure was conducted at each line between 175nm and 200nm and
absorption was only observed at the two iodine resonance lines;
50% and 75% absorption at the 183.Onm and 178.2nm lines respectively.
This served to indicate that atomic absorption by iodine atoms
produced in the furnace was occurring. Using 10sl aliquots of
— 1 to 19.1g.m1
1 iodine as aqueous potassium iodide the system was
optimised for peak atomic absorption measurements at the iodine
resonance line at 183.Onm. An absorbance vs iodine concentration
calibration graph plot was constructed, Fig.3.8. The absorbance
varied with iodine concentration but deviated from linearity at
approximately 0.2 absorbance unit. The linear working range was
limited by this curving—off towards the concentration axis and
a means of raising this point of deviation to higher absorbance
values was sought.
The factors responsible for bending of analytical
curves may be classified into two groups. The first concerns
faults in the apparatus employed. The second group includes
factors related to the spectral line itself, eg. hyperfine structure,
the ratio of the absorption and emission line profiles and resonance
broadening and line shift in the absorbing medium. The instrumental
arrangement employed was examined and possible optical or apparatus
faults investigated.
It was observed that the voltages applied
across the furnace to achieve atomisation of the iodide sample
72
caused emission from the hot tube to register at the photomultiplier
tube. The variation of this furnace emission intensity at 183.0nm
with applied voltage is shown in Fig.3.9, and its wavelength
dependence in Fig.3.10. As discussed in Chapter One the proportion
of radiation emitted in the far ultraviolet by a blackbody is very
small for temperatures below 5000K. That the radiation detected
by the PT was not of wavelengths shorter than 200nm was demonstrated
by the emission intensity being independent of whether the optical
path between the furnace and the monochromator was nitrogen
purged or not. The radiation incident at the FMT was attributed
to scattered light inside the monochromator. The emission was
not detectable on the 183.Onm line over the EDL emission, its
presence was shown by stopping the radiation from the DL or
changing wavelength. The emission signal was not observed until
approximately 1.5sec after the atomisation power (7 to 9V) was
applied. The bending of the iodine analytical curve was imputed
to the high temperatures necessary to volatilise and decompose
KI (B.Pt. 1493K) and possible interference from the hot tube emission
causing a depression of the atomic iodine absorption peak heights.
Ammonium iodide has a sublimation temperature of 824K and was not
expected to suffer from this high temperature interference.
Working solutions of 1 to 10pg.m1 1 I as ammonium iodide were
prepared and the absorbance vs iodine concentration calibration
curve plotted using the same instrumental parameters as for KI.
The analytical curve obtained using ammonium iodide solutions is
compared with that from KI solutions in Fig.3.8. The two calibration
curves were identical at low concentrations but the ammonium
iodide plot had a much longer linear range; linearity was observed
73

Optimisation For Iodine AAJ D.C. System.
10—
4- o tn (r) 2- .E
0 I I I I 7.0 7.5 8.0 8.5 9.0. 9.5
Voltage across tube
Fig. 3.9--
10—
8 _
6 — c 0 4— En
2—
0 200 300
Wavelength, nm
400
Fig. 3.10
74
to approximately 0.7 absorbance unit, covering a working range
of about orders of magnitude (0.3 to 6.04g.m1-1). The
sensitivity for 1% absorption was 0.04g.m1-1I (4 1x10 °gI).
Two methods of eliminating the effects of the
emission from the hot furnace were considered. Johnson et al.
used the technique of limited-field viewingin which a small aperture
was placed across the exit of the tube. This prevented the radiation
from the atomiser reaching the monochromator but limited the
aperture of the optical path and caused a slight reduction in
source emission intensity, i.e. worsening the signal-to-noise
ratio and, hence, the detection limit of the technique. The
second method examined was modulation of the ;DL emission and the
apparatus was modified to achieve this.
3.4 Apparatus - Mechanical Modulation and A.C. Measurement Techniques.
The smoothing technique mentioned previously
for increasing the signal-to-noise ratio is a simple and useful
signal treatment procedure. However, most noise has a strong
1/f component (flicker noise), in which the power of the noise
is proportional to the reciprocal of the frequency, and is common
in almost all instrumental systems. Therefore, it is usually
advantageous to locate the desired signal away from zero frequency,
i.e. d.c., where 1/f noise is greatest. This is achieved by
imposing the signal informatioh on an a.c. wave at a desired
frequency, (110). This process is called modulation.
The 3L emission intensity may be modulated
by a radiation chopper at a frequency fo and the signal be detected
at this frequency. This not only minimises the 1/f noise but
increases the filtering efficiency as less noise is included in
75
the filter bandwidth. To serve as the filter and eliminate frequency
drift a lock-in or phase-sensitive amplifier is employed. Phase-
sensitive detection, occasionally referred to as synchronous
rectification, is a method of demodulating an a.c. signal such
that only signals in phase with a reference signal are extracted
from the modulated signal. The majority of p.s.d. systems operate
on the principle of the synchronous switch. With reference to
Fig.3.11(a), the signal is periodically switched into the load
resistor at a frequency and phase determined by the reference
voltage. If the signal and reference voltages have the same frequency
and phase the voltage across the load resistor will have the form
shown in Fig. 3.12(a). The switch acts as a half-wave rectifier
for signals of the same frequency and phase as the reference.
In practice a double-switching arrangement is employed, Fig.3.11(b);
this balanced two-way switch provides full-wave rectification,
Fig.3.13, improving the signal to noise ratio.
If the signal is out-of-phase with the reference
the waveform will be of the form shown in Fig.3.12(b), and
rectification will not occur. The response of the system to
noise on the signal depends on the time constant (T = RC) of the
d.c. measuring circuits, and the effective bandpass (ilf) of the
p.s.d. is given by,
ilf = _1- = 1
... 3.1 4RC 41-
To enhance the signal-to-noise ratio and
eliminate the d.c. emission signal from the heated atomiser the
emission from the EDL was modulated. Because of the transient
nature of the atomic absorption signal, as high a chopping frequency
76
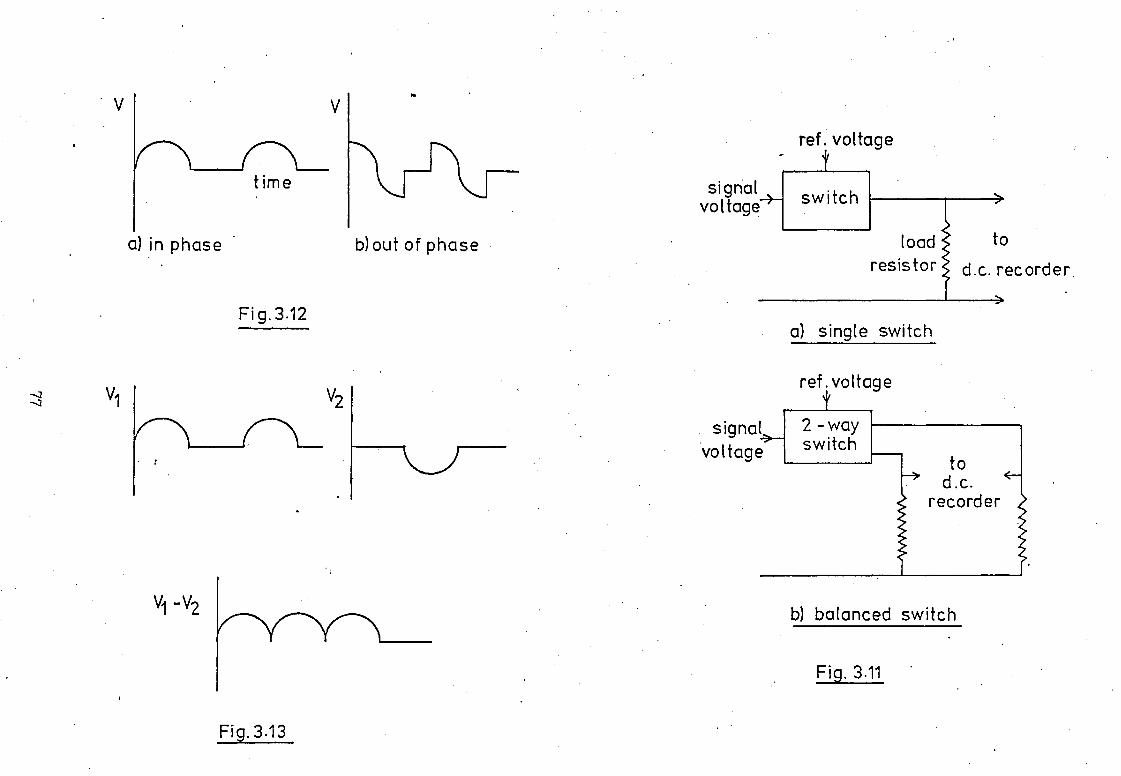
V2
V
ref.voltage
signal voltage
V1
Vi -V2 b) balanced switch
Fig. 3.11
Fig. 3.13
Fig. 3.12
ref. voltage
signal voltage
load to
resistor d.c. recorder
a) single switch
time
a) in phase b) out of phase
as possible was used. The best available was a 285Hz Techtron
chopper (Techtron Prod. Pty., Aust.), modified to match the phase-
sensitive detector used. The modified apparatus is shown in
Fig.3.14. The mechanical chopper was placed between the resonant
cavity and the first lens. To achieve optimum signal-to-noise
ratio of the EDL emission the radiation should have been focussed
at the chopper blades to obtain as sharp a modulation cut as
possible; the radiation then focussed again into the graphite
atomiser. This arrangement would have necessitated a lens between
the EDL and the chopper, increasing the optical path length. The
purging efficiency was found to decrease with increasing path
length due to entrained oxygen along the optical path, and the
signal-to-noise ratio made worse. The chopped radiation was
unfocussed therefore. The reference signal was provided by a
12V lamp irradiating a phototransistor, through the rotating
chopper blades. The 285Hz a.c. reference signal from the photo-
transistor was led to the reference channel input of the Model
411 phase-sensitive detector (Brookdeal Electronics Ltd.,U.K.).
The EDL emission was focussed, after the rotating sector, into
the graphite atomiser and then again onto the entrance slit of
the monochromator using 3mm thick calcium fluoride lenses, of
focal length 50mm, shortening the optical path still further.
From the PMT the signal was led to a Model 450 low-noise amplifier
(Brookdeal Electronics) where it was amplified to provide an
output of 1V r.m.s.„ in the frequency range 100 to 1000Hz. This
signal was passed to the p.s.d. which selected the component in-
phase and of the same frequency as the reference signal, and
amplified the rectified signal obtained to produce an output of
78
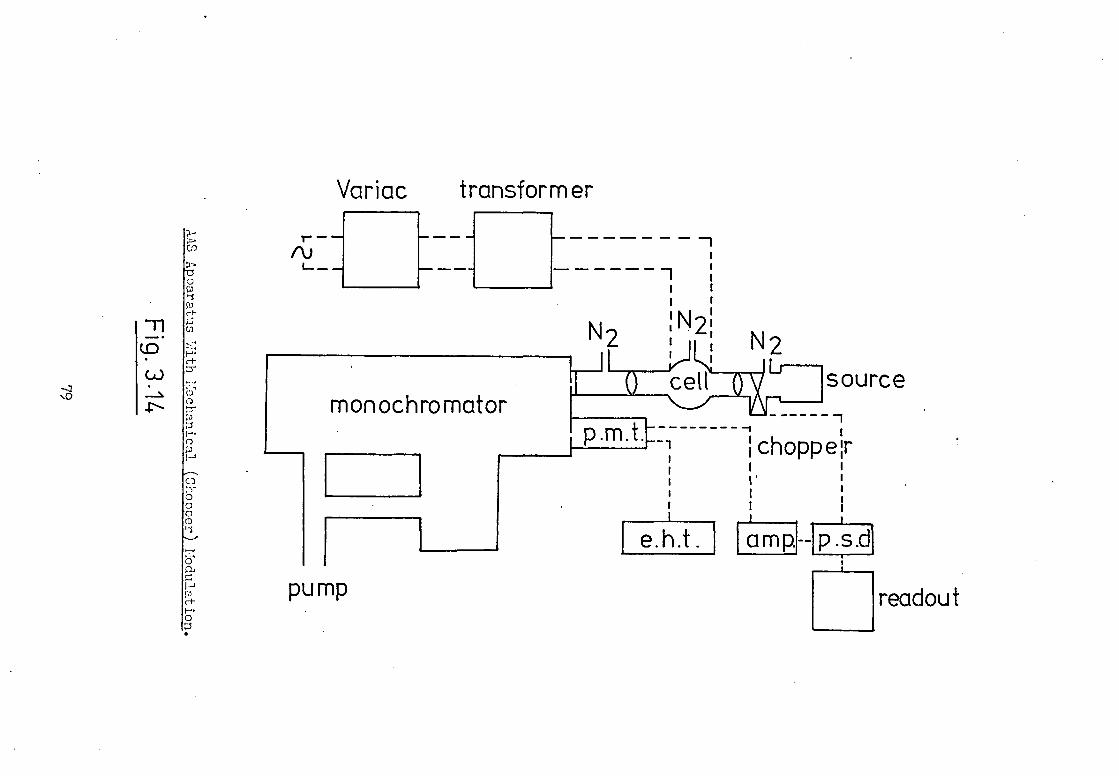
Variac transformer
amp. e.h.t
mon ochromator source
choppe r
p.s.di
(readout pump
Cn
cf-
tn
b"
Cl :3" 0
CD i-s
18.
approximately 10V d.c. The d.c. signal was led to the storage
oscilloscope as before.
3.5 Iodine AAS Results.
The optimum operating conditions for the
determination of iodine with the graphite furnace and instrumental
assembly described were established via atomisation and measurement
of the peak absorption obtained at 183.Onm with 1011p1 aliquots
of aqueous potassium iodide solution. Fig.3.15(a) shows the
variation in absorbance at 183.Onm for 2pg.m1-1 of iodine with
variation in voltage applied across the graphite furnace. All
measurements were made with an applied voltage of 8.5V. Fig.3.15(b)
shows the variation in absorbance at 183.Onm with flow-rate of
nitrogen in the furnace chamber. A nitrogen flow-rate as high
as 1.51.min 1 could be used before any decrease in absorbance
was detected in the atomisation of 1qpi1 of 2yg.m1 1 iodine solution.
Above this flow-rate, cooling and dilution effects were observed
and the peak absorbance decreased and became less reproducible.
-1 When a nitrogen flow-rate of less than 0.51.min was used the
purging time required between samples and between the drying and
atomisation steps was lengthened considerably. A flow-rate of
11.min 1 was maintained in all further work.
The exit and entrance slits of the mono-
chromator were set at 30pm (spectral bandpass 0.05nm) and a PMT
voltage of 1620V was employed. These settings were found to give
optimum signal-to-noise and signal-to-background intensity ratios.
The photomultiplier output was led to the amplifier; adjusted to
produce a signal for the phase-sensitive detector such that its
d.c. output voltage was 10V at 100% transmission. The variable
80
time-constant of the phase-sensitive detector was optimised to
produce the best signal to noise ratio without distortion of the
analytical signal by overdamping. The value of the time-constant
used was 300msec.
With the optimum operating conditions established,
calibration graphs for iodine atomic absorption at 123.0nm were
constructed, Fig.3.16; the samples being introduced as aqueous
solutions of potassium iodide, ammonium iodide, potassium iodate
and potassium periodate. Calibration, graphs of identical slope
and linear range were obtained in each case; 10111 samples produced
calibration graphs linear up to 4,tg.m1-1 and the sensitivity
(for 1% absorption) was 0.041g.m1-1 iodine, i.e. 4 x 10 1°g I.
For the 178.2nm iodine resonance line the sensitivity (for 1%
absorption) was found to be better by a factor of two,i.e. 0.02yz.m1
in a 1Cyl sample; an absolub detection limit of 2 x 10 1°g I. -
Although higher sensitivity was obtained at 178.2nm the recorded
emission intensity from the source was lower at this line than
at 183.0nm; the precision of the measurement was thus lower and
a similar practical detection limit of 2 x 10 9g I was observed.
The absorption signals recorded were wholly atomic in nature; no
non-specific absorption from aqueous sample solutions was observed
at the 179.9nm, 184.4nm and 187.6nm iodine non-resonance lines
-1 from the source when 10p1 aliquots of 241g.m1 iodide solutions
were atomised.
A typical drying, purging and atomisation cycle
at 183.Onm for an iodine containing sample is illustrated in
Fig.3.17. This trace was recorded using the potentiometric chart
recorder. The operation may be summarised as follows.
81
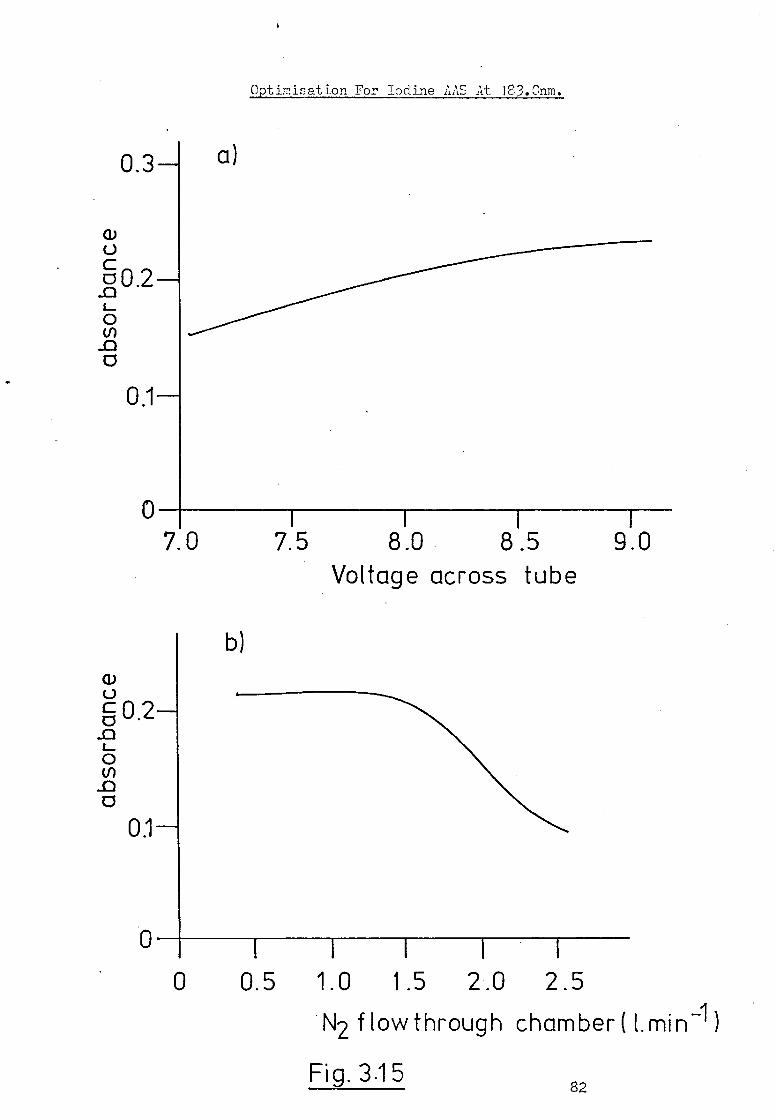
0.3—
0
a)
Optimisation For Iodine AAS At 183.0nm.
7.0 7.5 8.0 8.5 Voltage across tube
9.0
b) a) U 0C 0.2— -o C5 (n _o
0.1
0 0.5 1.0 1.5 2.0 2.5
N2 f low through chamber ( 1.min1)
Fig. 3.15 82

83
0 1 2 3 time (min)
60 80 100
sample introduced 100%
absorption
atomisation
4 5
Fig. 3.17 Analysis Cycle For Iodine At 183.0nm.
A bs
orba
nce
Fig.3.16 Iodine A.S.
178.2nm 183.0nm
m CD (A)

1) t = Osec, the lid of the atomisation.chamijer was romovd
and a lop' sample introduced into the furnace. 2) t = 10sec, with a voltage of 1 to2V across the tube, the •
sample was dried.
3) t = 9Osec, the power to the furnace was switched off and
the chamber lid replaced. Purging of the
chamber continued until the known 100% trans-
mission level was achieved.
4) t = ca. 180sec, the voltage across the tube was set to 8.5V
and the sample atomised at this voltage for
2 to 3 sec.
5) t = 183sec, the furnace was allowed to cool to ambient
temperature.
6) t = ca. 250 a second sample was examined.
to 300sec,
3.6 The Effect of Foreign Ions.
In many sample types in which the determination
of traces of iodide is of interest the predominating inorganic
species present from the matrix are the salts of the alkali metal
and alkaline earth ions. Thus, for example, in biological and
botanical samples, foodstuffs and water, large excesses of sodium
and potassium (and frequently calcium and magnesium) are present.
After sample pretreatment to destroy organic matter by wet oxidation,
these ions may be present in conjunction with one or more common
anions such as chloride, sulphate, nitrate or phosphate. The effect
on the iodine determination of different weights of several common
inorganic salts likely to be present after sample pretreatment was
investigated.
84

Table 3.2 TJ:ffect of Common Inorganic Salts On Iodine Absorption.
Salt Concentration 183.0nm
Studied ratio, Change in Increase in Absorbance
MX MX:iodide absorbance,% absorbance at 184.4nm
NaC1
KC1
Na2SO4
1:1 0 0 0
10:1 +25 0.05 0.05
100:1 +100 0.22 0.22
1000:1 100% absorption of radiation
1:1 0 0 0
10:1 0 0 0
100:1 +40 0.10 0.10
1000:1 1005 absorption of radiation
1:1 0 0
10:1 0 0
0
100:1 +40 0.10 0.10
1000:1 1005 absorption of radiation
NaNO3
1:1 0 0 0
10:1 0 0 0
100:1 +15 0.03 0.03
1000:1 +200 0.40 0.40
Na2HPO4 1:1 0 0 0
10:1 +25 0.05 0.05
100:1 +75 0.15 0.15
1000:1 1005 absorption of radiation
85

The following compounds were examined at weight ratios
of 1:1, 10:1, 100:1 and 1000:1 with 2pg.m1 1 iodine as aqueous
potassium iodide; potassium chloride, sodium chloride, sodium
nitrate, sodium mono-hydrogen phosphate and sodium sulphate.
The effects on the recorded iodine absorbance values at 183.0nm
are shown in Table 3.2 and may be summarised as follows.
a) At 1:1 no species was observed to interfere.
b) At 10:1, potassium chloride, sodium nitrate and sodium sulphate
had no effect. Sodium chloride and sodium phosphate gave the
same enhancement; +25% of the absorbance signal.
c) At 100:1 all salts showed an enhancement of the absorbance
signal and the relative effect was:
NaNO3, Na2SO4,KCl, Na2HP04111aC1
Increasing enhancement
d) At 1000:1, all salts absorbed 100% of the incident radiation,
with the exception of sodium nitrate which increased the absorbance
value by 200%.
The positive interference effects caused by these
foreign ions were attributed wholly to non-specific absorption
at the 183.0nm line by molecular species. This was demonstrated
by measurement of the absorption at the nearby 184.4nm iodine
non-resonance line for similar sample solutions. In each case
the same absorbance was obtained at this line as that at the
183.0nm line for blank solutions containing only the salt investigated,
and this was the same as the increase in absorbance recorded at
this wavelength for iodide solutions when the foreign salt was
added. It was possible, therefore, to correct for the non-specific
86

absorption interference observed in the presence of moderate
concentrations of the salts investigated, by subtraction of the
absorbance obtained at 184.4nm from that at 183.0nm. In the
presence of 1C00-fold weight excesses of most of the salts studied,
however, virtually complete absorption of incident radiation at
both lines was obtained and such a correction could not be made.
The exception to this was sodium nitrate. Conversion of alkali
metal salts into the nitrates before atomisation would thus be
preferable in methods developed for examination of biological
and botanical samples.
A more detailed discussion as to the nature
of the observed non-specific background absorption observed with
simple inorganic salts in non-flame AAS is presented in Chapter
Six.
87

FOUR
88
4.1 Introduction.
Sulphur , like iodine, is determined frequently
by indirect AAS procedures. Following oxidation of the sample,
converting all sulphur present to sulphate, barium chloride is
added. The precipitate of barium sulphate may be dissolved in
EDTA solution and the concentration of barium determined by AAS
at 553.5nm in air-acetylene flame. Alternatively, a known excess
of Ba2+ may be added to the oxidised sample solution and the remaining
2+ . Ba in solution determined by AAS. These methods have been used
to determine sulphur in urine and other biological tissues, after
oxidation, (101,102). An inhibition titration method for sulphate
determination has been developed by Looyenga et al. (103). The
sulphate solution is titrated, at a constant delivery rate, with
magnesium chloride solution. The titrated solution is simultaneously
nebulised into an air-hydrogen flame. The atomic absorption of
Mg is inhibited by its precipitation as the sulphate until the
end-point of the titration is reached, when the Mg absorbance
rises rapidly. Concentrations as low as 14g.ml-1 sulphate may
be determined by this technique. Alkali metals and commonly
occuring anions do not interfere at the 0.1M level although many
other metals, phosphate and silicate must be removed. Sulphur
dioxide may be determined in a similar manner; it is oxidised by
hydrogen peroxide to the sulphate which may be determined by the
addition of a known excess of barium or magnesium ions as discussed
above, or lead nitrate and the unprecipitated lead determined
by AAS at 283.3nm, (10*). Sulphite may be determined by adding
the sulphite sample to a suspension of mercury (II) oxide leading
to the formation of the soluble Hg(S03)22 complex, (10S). The
89
amount of oxide dissolved may be monitored at the 253.7nm Hg
resonance line and is proportional to the sulphite concentration.
Salet (tob), in 1869, observed that an aerosol
of a sulphur compound when injected into a low temperature, fuel-
rich hydrogen flame produced an intense blue emission if a cold
object was placed near the cone of the flame. This blue emission
is due to molecular S2, excited by chemiluminescent reactions in
cool flames. Veillon et al. (107) have reviewed the history of
this phenomenon as an analytical technique for the determination
of sulphur. Using a cold glass sheath around an air-hydrogen
flame Veillon has monitored the S2 emission spectrum in the wavelength
range 320 to I1Cnm, and used the emission maximum at 384nm to
determine sulphur, at the ppm level, in oils. Dagnall et al. (10B)
have used a similar technique for determining sulphur in organic
and aqueous matrices by employing a simple filter photometer.
Everett (OM) has described the use of a carbon filament reservoir
resistively heated in a hydrogen-nitrogen diffusion flame for
the determination of sulphur via this emission. ly1 of the sulphur
containing solution was applied to the filament and dried by
heating the filament at a low voltage. The flame was lit and
the sample evaporated into the cool flame; the S2 emission was
recorded at 394nm. Townshend et al. (!10) have examined S2 emission
by the technique of molecular emission cavity analysis (MECA).
The sample is contained, within a small cavity positioned in an
air-hydrogen flame and the emission from excited S2 molecules
again monitored in the wavelength. range 310nm to 430nm.
This chapter is concerned with the direct determination
of sulphur by non-flame AAS using its resonance and near-resonance
90
transitions in the Schumann ultraviolet. The graphite tube atom
cell described in Chapter Three was used for these studies. The
Grotrian diagram for sulphur and data relating to the analytically.
useful lines is presented in Fig.4.1.
4.2 Apparatus - Electronic Modulation and A.C. Measurement Techniques.
The apparatus employed for the direct determination
of sulphur by AAS is shown schematically in Fig.4.2.
The source used was a sulphur containing al.
Dagnall et al. (111 ) have described the preparation and use of EDL
tubes containing organo-sulphur and phosphorus compounds for the
qualitative identification of these elements in organic matrices.
Marshall (1M), for the determination of sulphur by AAS in a nitrogen-
separated nitrous oxide-acetylene flame at 180.7nm, used an EDL
source containing ca. 1mg of sublimed sulphur and 3torr of argon
in a 60mm fused silica bulb. For the studies described here a
variety of sulphur-containing compounds were examined in EDL
tubes as possible line emission sources for sulphur AAS. Sulphur
dioxide and hydrogen sulphide were investigated at ratios of
1:10 and 1:1 with 3torr of argon in EDL tubes of 25mm to 30mm
length. A lamp containing a few milligrams of sublimed elemental
sulphur with about 5torr argon, similar to that used by Marshall,
was also examined. All the tubes were prepared in the normal
manner. They were operated in the 1-wave resonant cavity and all
emitted the analytically useful lines between 180nm and 183nm.
To evaluate the performance of each lamp and determine the lamp
having the best signal-to-noise and signal-to-background ratios these
sources were electronically modulated.
91

Fig. 4.1 Partial Grotrian Dia:ram For Sulphur.
10-
6- 178.225
4- 180.731
182.037
182.625
2
0
Wavelength (run)
178.225
180.731
• 182.037
182.625
190.03
Transition Prob. (sec 1 ) s log
S. Ek
1 .50 22181 78290
4.10 0 55331
2.20 397 55331
0.73 574 55331
0.00 o 52624
92
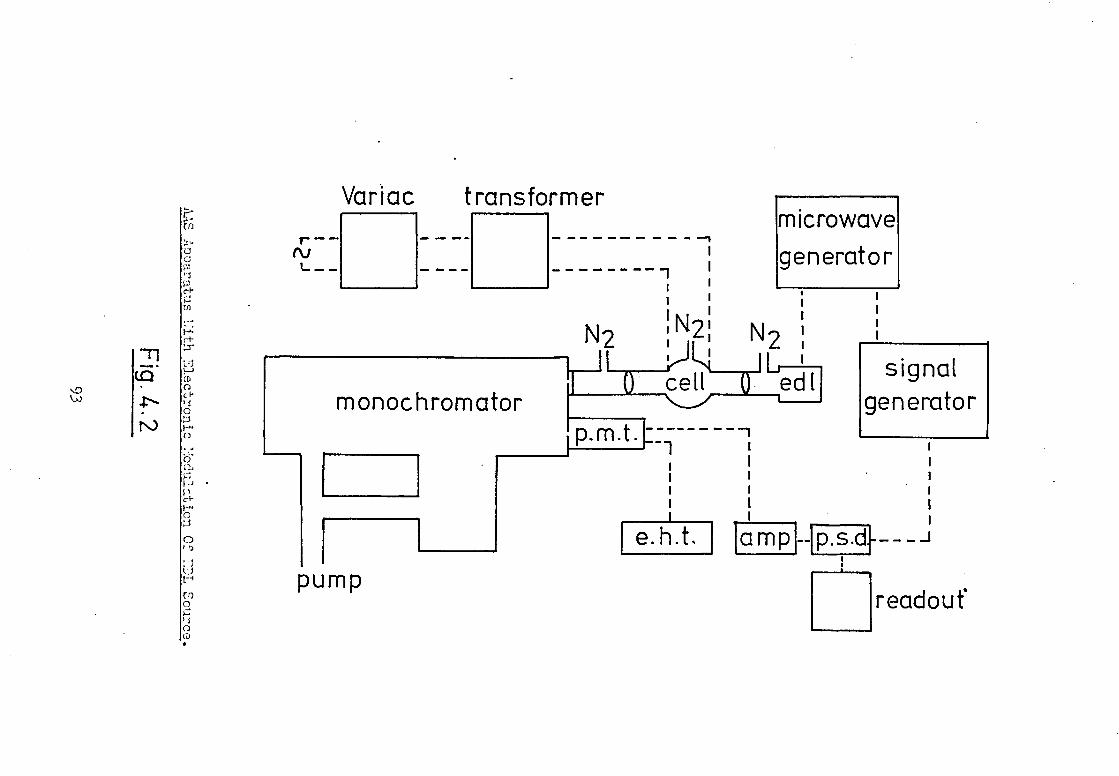
signal generator
p.s.d amp e.h.t.
Variac transformer microwave generator
r--
monochromator
pump readout'
rf:J
Fl
CF RI C
c-+
CD 0 c+ 0
ci
0
C)
r o.)
(_)
to 0
C)
t-1
•

In Chapter Three a mechanically modulated-emission
source AAS instrumental arrangement was described. Whilst mechanical
modulation provides the required a.c. source emission intensity,
several disadvantages exist with chopping radiation. The presence
of a rotating sector in the optical path between source and atomiser
cell may limit the aperture of the instrument, decreasing the
signal-to-noise ratio. Most mechanical choppers are difficult
to purge of atmospheric oxygen and for non-metal AAS, at wavelengths
below 200nm, this increases the noise of the system. Mechanical
modulation is confined to a single frequency usually, characteristic
of the motor employed to drive the rotating sector; variable
speed choppers are usually bulky and very expensive. Thus,
optimisation of modulation frequency, to operate away from mains
frequency or other interfering signals, is not possible.
Electronic modulation, with a tuned a.c. detecting
system, does not suffer these disadvantages and greatly simplifies
the instrumental arrangement. Phillips (it3) has described the
electronic modulation of flow-through microwave plasmas for photo-
chemical kinetic studies. He obtained 10C% modulation of the
Lyman-ochydrogen line at frequencies upto 150kHz and modulated
iodine in argon plasmas and mercury in helium plasmas at upto
110kHz. Source emission intensity modulation for AAS or AFS is
at much lower frequencies. Browner and Dagnall 0110 examined
the effects of electronic modulation on EDL sources for the AAS
of a variety of metals. The power output to the lamps from the
microwave generator was controlled by varying the anode voltage
of the magnetron valve. When the generator used by Dagnall et al.
(Microtron 200, E.M.S. Ltd.) was operated in the modulated mode,
94
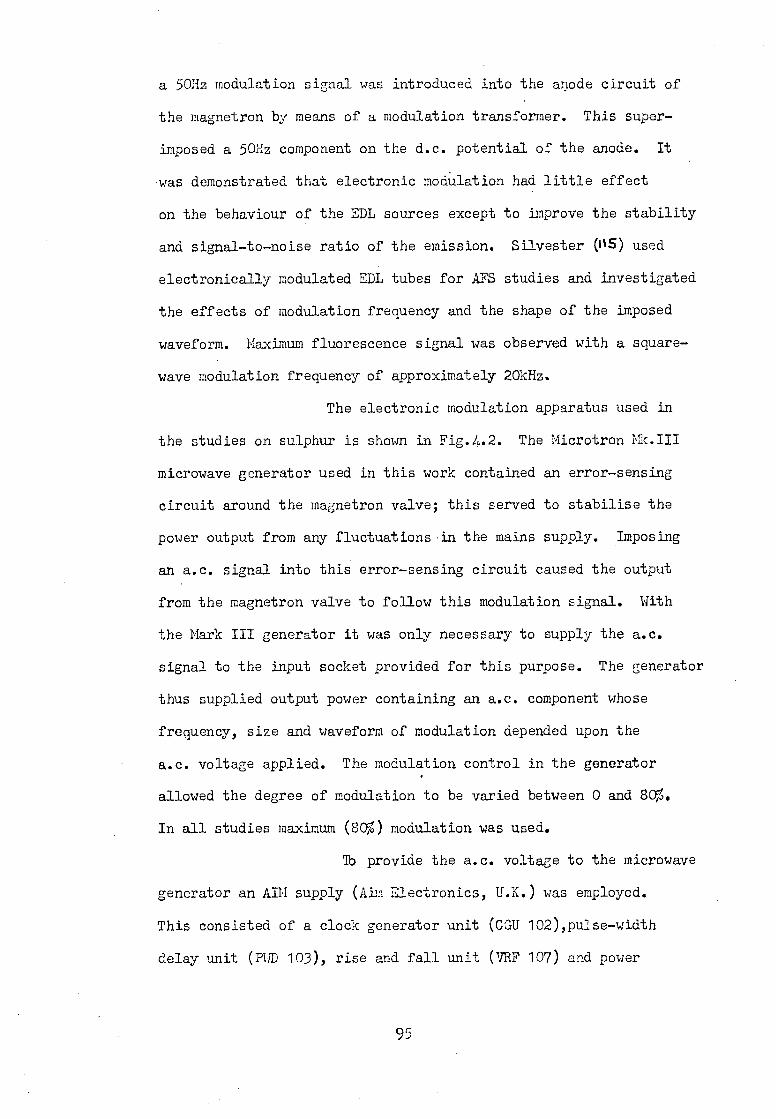
a 50Hz modulation signal was introduced into the anode circuit of
the magnetron by means of a modulation transformer. This super-
imposed a 50Hz component on the d.c. potential of the anode. It
was demonstrated that electronic modulation had little effect
on the behaviour of the EDL sources except to improve the stability
and signal-to-noise ratio of the emission. Silvester (0%5) used
electronically modulated EDL tubes for AFS studies and investigated
the effects of modulation frequency and the shape of the imposed
waveform. Maximum fluorescence signal was observed with a square-
wave modulation frequency of approximately 20kHz.
The electronic modulation apparatus used in
the studies on sulphur is shown in Fig.4.2. The Microtron
microwave generator used in this work contained an error-sensing
circuit around the magnetron valve; this served to stabilise the
power output from any fluctuations in the mains supply. Imposing
an a.c. signal into this error-sensing circuit caused the output
from the magnetron valve to follow this modulation signal. With
the Mark III generator it was only necessary to supply the a.c.
signal to the input socket provided for this purpose. The generator
thus supplied output power containing an a.c. component whose
frequency, size and waveform of modulation depended upon the
a.c. voltage applied. The modulation control in the generator
allowed the degree of modulation to be varied between 0 and 80.
In all studies maximum (80) modulation was used.
MD provide the a.c. voltage to the microwave
generator an AIN supply (Aim Electronics, U.K.) was employed.
This consisted of a clock generator unit (CGU 102),pulse-width
delay unit (PU]) 103), rise and fall unit (VHF 107) and power
05
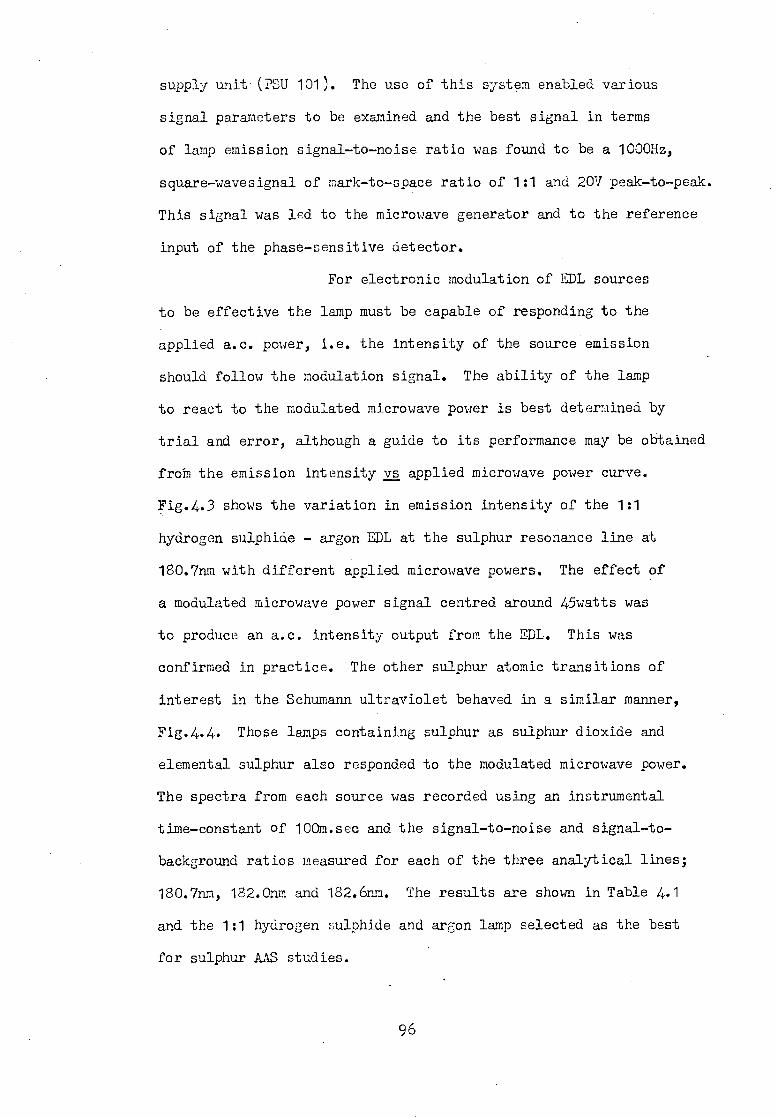
supply unit (PSU 101). The use of this system enabled various
signal parameters to be examined and the best signal in terms
of lamp emission signal-to-noise ratio was found to be a 1000Hz,
square-wavesignal of mark-to-space ratio of 1:1 and 20V peak-to-peak.
This signal was led to the microwave generator and to the reference
input of the phase-sensitive detector.
For electronic modulation of EDL sources
to be effective the lamp must be capable of responding to the
applied a.c. power, i.e. the intensity of the source emission
should follow the modulation signal. The ability of the lamp
to react to the modulated microwave power is best determined by
trial and error, although a guide to its performance may be obtained
froM the emission intensity vs applied microwave power curve.
Fig.4.3 shows the variation in emission intensity of the 1:1
hydrogen sulphide - argon EDL at the sulphur resonance line at
180.7nm with different applied microwave powers. The effect of
a modulated microwave power signal centred around 45watts was
to produce an a.c. intensity output from the EDL. This was
confirmed in practice. The other sulphur atomic transitions of
interest in the Schumann ultraviolet behaved in a similar manner,
Fig.4.4. Those lamps containing sulphur as sulphur dioxide and
elemental sulphur also responded to the modulated microwave power.
The spectra from each source was recorded using an instrumental
time-constant of 100m.sec and the signal-to-noise and signal-to-
background ratios measured for each of the three analytical lines;
180.7nm, 182.0nm and 182.6nm. The results are shown in Table 4.1
and the 1:1 hydrogen sulphide and argon lamp selected as the best
for sulphur AAS studies.
96
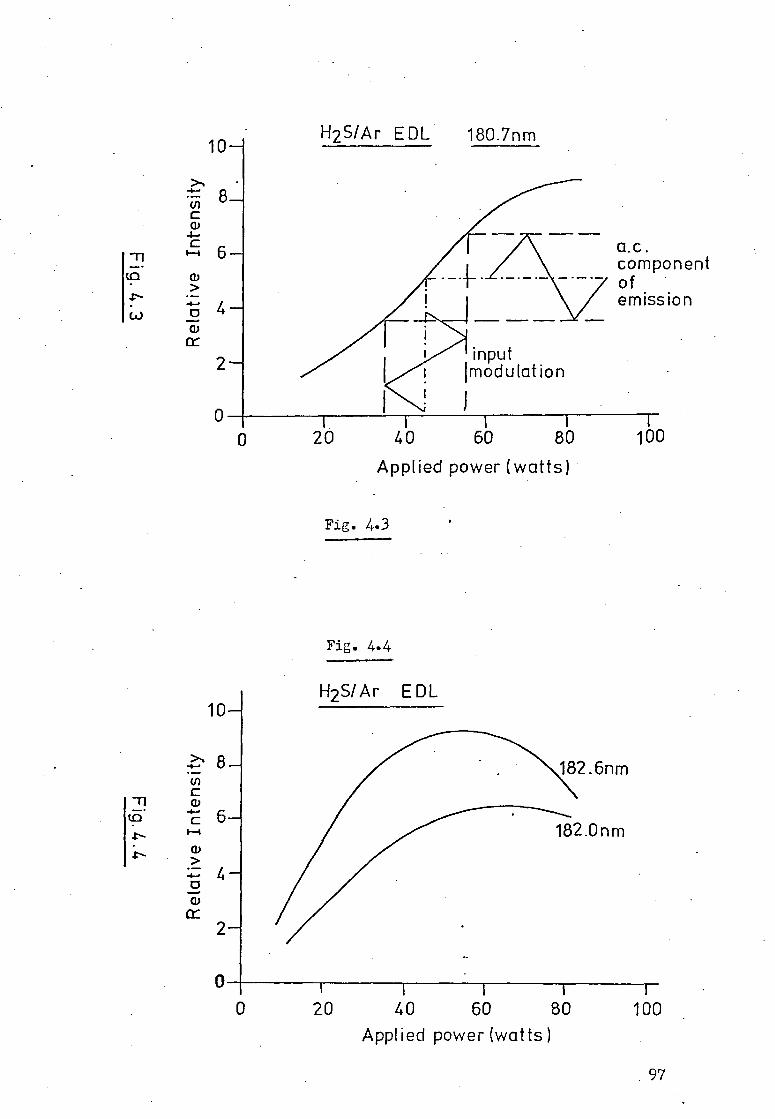
10— H2S/Ar EDL 180.7nm
C a) 4-
6- co Xs
LAO 0 4- Ti)
input 'modulation
I I I I 20 40 60 80
Applied power (watts)
2—
0
0
CI.0 . component of emission
100
Fig. 4.3
Fig. 4.4
H2S/Ar EDL 10—
8- U) c -71 W
UD 6—
4 — 0
cr 2—
182.6nm
182.0nm
I I I 0 2.0 40 60 80 100
Applied power (watts
97
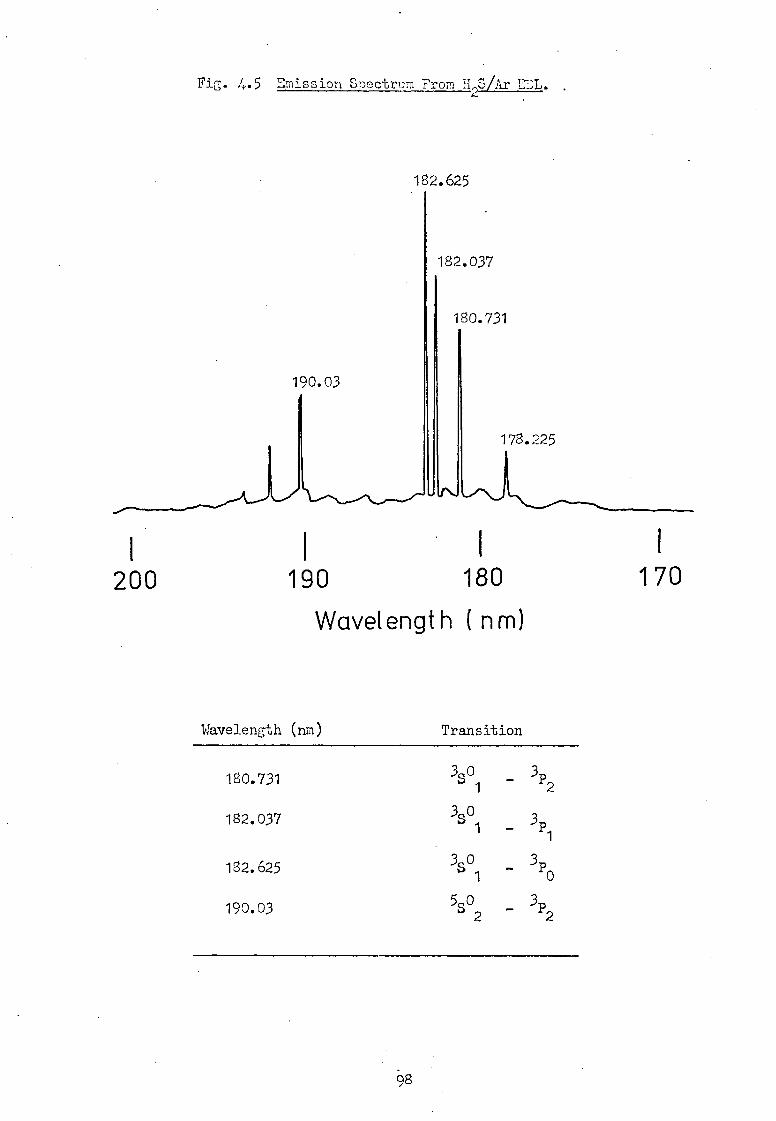
Fig. J.5 Emission Spectrum From H S.Ar 2
182.625
182.037
180.731
190.03
178.225
I I I i 200 190 180 170
Wavelength ( nm)
Wavelength (nm) Transition
180.731 3501 - 3P2
182.037 3501 - 3P1
182.625 350
- 3P0 0
190.03 5502 - 3P2
98
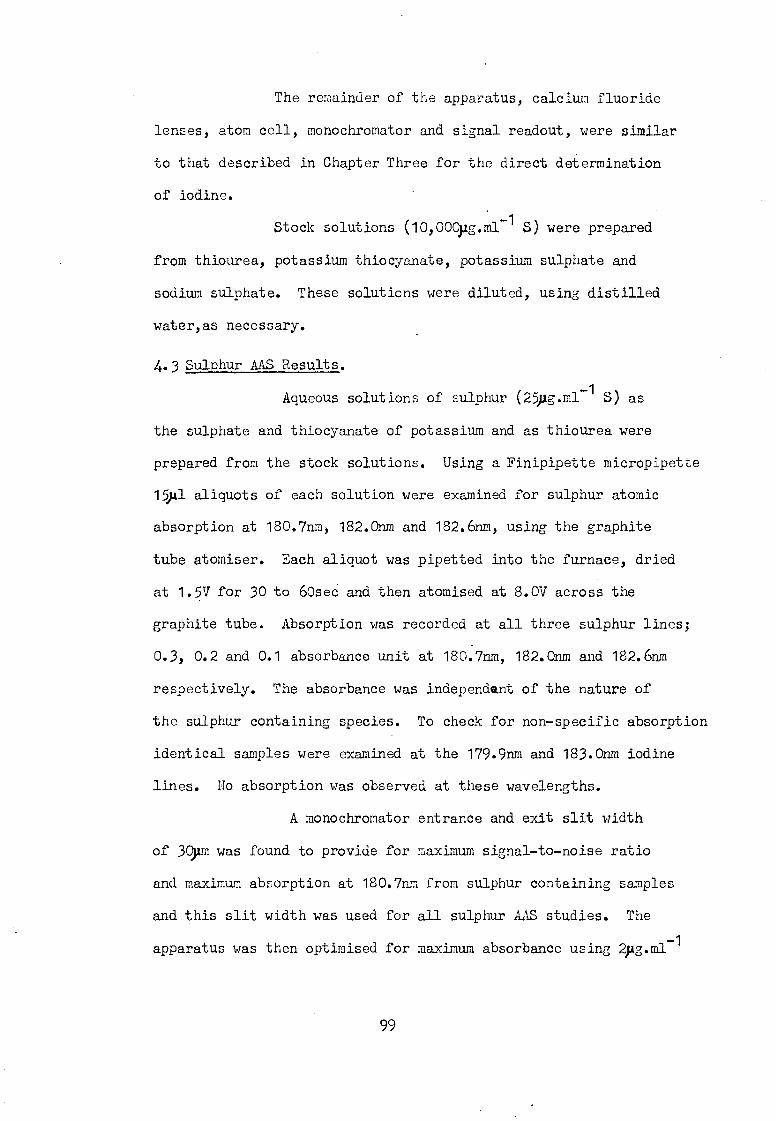
The remainder of the apparatus, calcium fluoride
lenses, atom cell, monochromator and signal readout, were similar
to that described in Chapter Three for the direct determination
of iodine.
Stock solutions (10,000pg.m1-1 S) were prepared
from thiourea, potassium thiocyanate, potassium sulphate and
sodium sulphate. These soluticns were diluted, using distilled
water,as necessary.
4.3 Sulphur AAS Results.
Aqueous solutions of sulphur (25pg.m1-1 S) as
the sulphate and thiocyanate of potassium and as thiourea were
prepared from the stock solutions. Using a Finipipette micropipette
1.11 aliquots of each solution were examined for sulphur atomic
absorption at 180.7nm, 182.0nm and 182.6nm, using the graphite
tube atomiser. Each aliquot was pipetted into the furnace, dried
at 1.5V for 30 to 60sec and then atomised at 8.0V across the
graphite tube. Absorption was recorded at all three sulphur lines;
0.3, 0.2 and 0.1 absorbance unit at 180.7nm, 182.0nm and 182.6nm
respectively. The absorbance was independent of the nature of
the sulphur containing species. To check for non-specific absorption
identical samples were examined at the 179.9nm and 183.0nm iodine
lines. No absorption was observed at these wavelengths.
A monochromator entrance and'exit slit width
of 30ym was found to provide for maximum signal-to-noise ratio
and maximum absorption at 180.7nm from sulphur containing samples
and this slit width was used for all sulphur AAS studies. The
apparatus was then optimised for maximum absorbance using 2pg.m1 1
99

sulphur as K2SO4
at 180.7nm. The effect of nitrogen flow-rate
through the furnace chamber is shown in Fig.4.6 and the effect
of applied voltage across the graphite tube in Fig.4.7. All
further studies were undertaken with a chamber nitrogen flow-
rate rate of 11.min and furnace applied voltage of 9.5V. It was
observed that at this applied voltage a background absorption
signal from the graphite furnace was present occasionally and
was often as great as 20, absorption with some tubes. Because
of distortion of the L-shaped tube holders it was found necessary
to replace these more often for sulphur determinations than with
the iodine studies. This was attributed to the higher voltages
necessary to form atomic sulphur in the graphite furnace. Calibration
curves of absorbance vs sulphur concentration at 180.7nm, 182.Onm
and 182.6nm were determined, however, and are presented in Fig.4.8.
These results are summarised in Table 4.2.
The calibration curves obtained at 180.7nm
and 182.0nm bend towards the concentration axis at absorbance
values of approximately 0.25. This was shown not to be due to
emission interference from the heated tube, and decreasing the
time constant to 30m.sec had no effect on increasing the linear
range of the analytical curves, although the signal-to-noise
ratio was severely decreased. Sulphur AAS at 182.6nm was less
reproducible than at the other two lines examined and at sulphur
concentrations above 15Ong S evidence of non-specific absorption
was observed by checking at the 183.0nm iodine line.
Although only 180.7nm is a resonance line
for sulphur, the observation of sulphur atomic absorption at
182.0nm and 182.6nm may be explained by the low energy of the
100
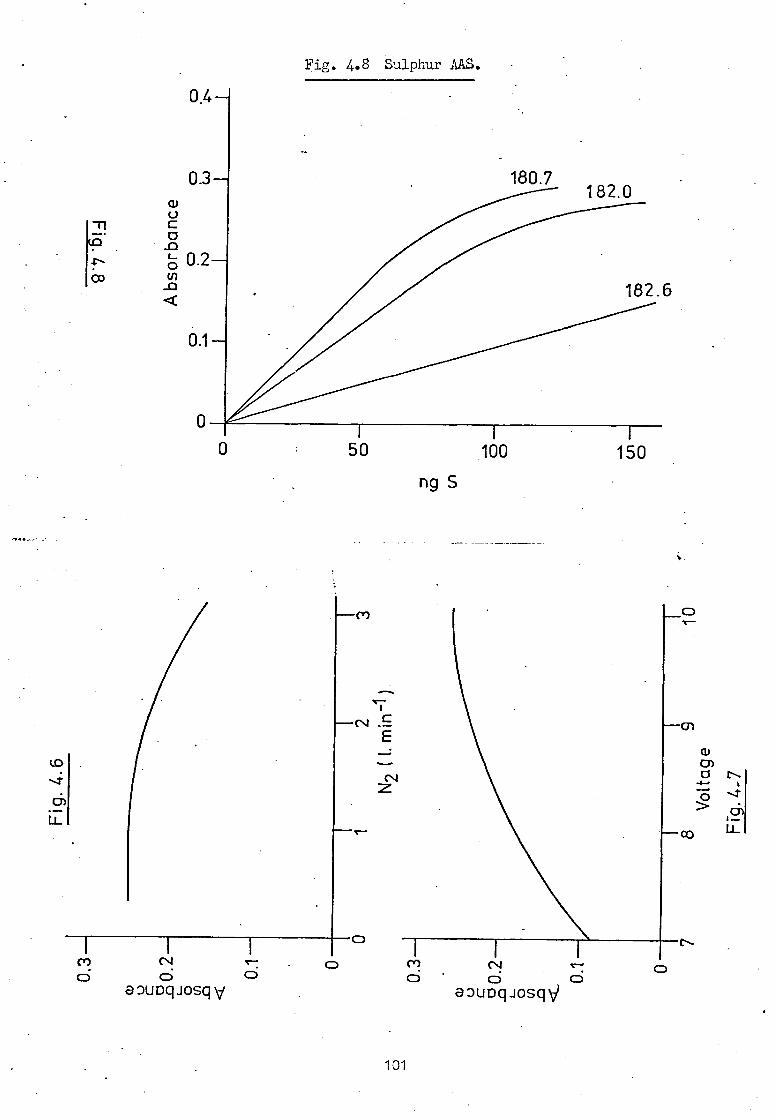
OSI. OOL S
S 6u
9.Z21,
(net. L.081,
I- 0 1.
Absorbance N
Absorbance EL.)
I O
3 5- Ni- 1
•••■■■■•
GJ-
-n O
r
O
(0-
-n (r)
O
angdIn 8'47 *ZTA
co

Table 4.1 Characteristics of Sulphur 172)L Sources.
S (element)
S:N S:B
Wavelength (nm)
S:N
H2S . . .
S:B : . S:N
SO2
S:B
. . . • : .
180.7 40:1 100:1 : 28:1 100:1 : 30:1 100:1 •
182.0 60:1 100:1 : 45:1. 100:1 : 50:1 100:1
182.6 100:1 100:1 : 60:1 100:1 : 90:1 100:1
S:N Signal-to-noise ratio
S:B Signal-to-background ratio
Table 4.2 Sulphur AAS Results With The Graphite Tube Furnace.
Wavelength (nm) Sensitivity (ng) Det. Limit(ng) Linear Range (ng)
180.7
182.0
182.6
1.2
1.8
4.8
6.0
6.0
5.0
to 75
to 90
to ca. 150
* for 1% absorption
102
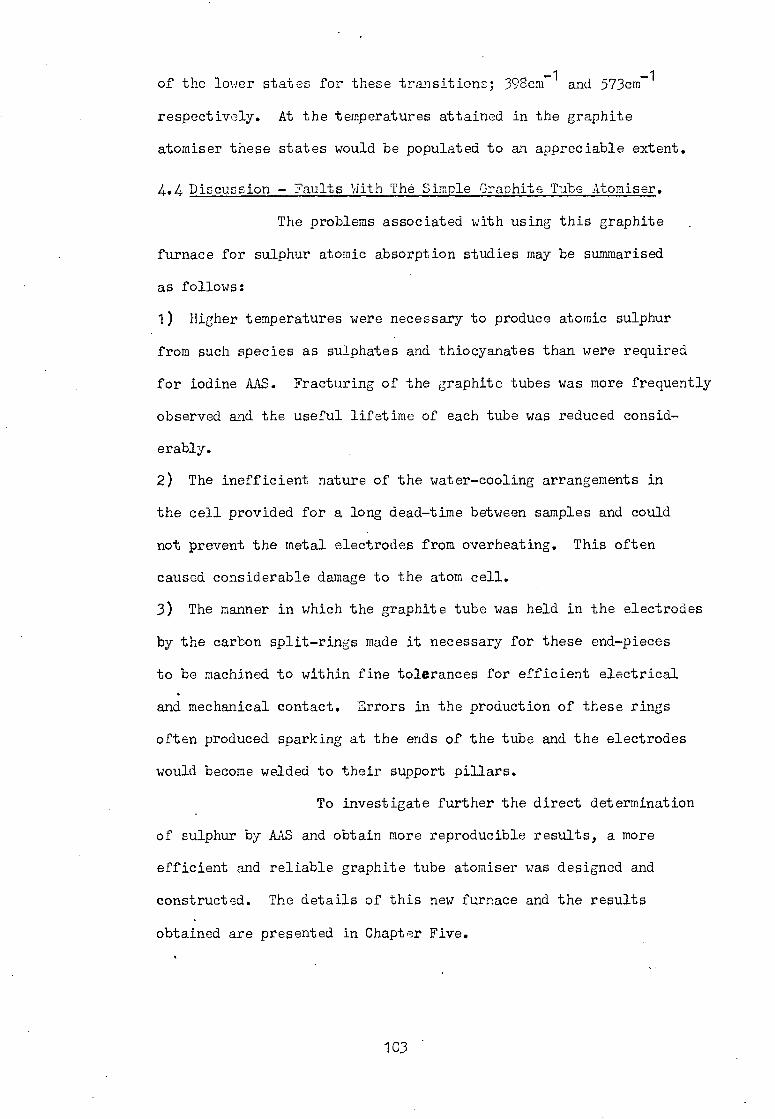
of the lower states for these transitions; 398cm-1 and 573cm-1
respectively. At the temperatures attained in the graphite
atomiser these states would be populated to an appreciable extent.
4.4 Discussion - Faults With The Simple Graphite Tube Atomiser.
The problems associated with using this graphite
furnace for sulphur atomic absorption studies may be summarised
as follows:
1) Higher temperatures were necessary to produce atomic sulphur
from such species as sulphates and thiocyanates than were required
for iodine AAS. Fracturing of the graphite tubes was more frequently
observed and the useful lifetime of each tube was reduced consid-
erably.
2) The inefficient nature of the water-cooling arrangements in
the cell provided for a long dead-time between samples and could
not prevent the metal electrodes from overheating. This often
caused considerable damage to the atom cell.
3) The manner in which the graphite tube was held in the electrodes
by the carbon split-rings made it necessary for these end-pieces
to be machined to within fine tolerances for efficient electrical
and mechanical contact. 3rrors in the production of these rings
often produced sparking at the ends of the tube and the electrodes
would become welded to their support pillars.
To investigate further the direct determination
of sulphur by AAS and obtain more reproducible results, a more
efficient and reliable graphite tube atomiser was designed and
constructed. The details of this new furnace and the results
obtained are presented in Chapter Five.
103

FIVE
104
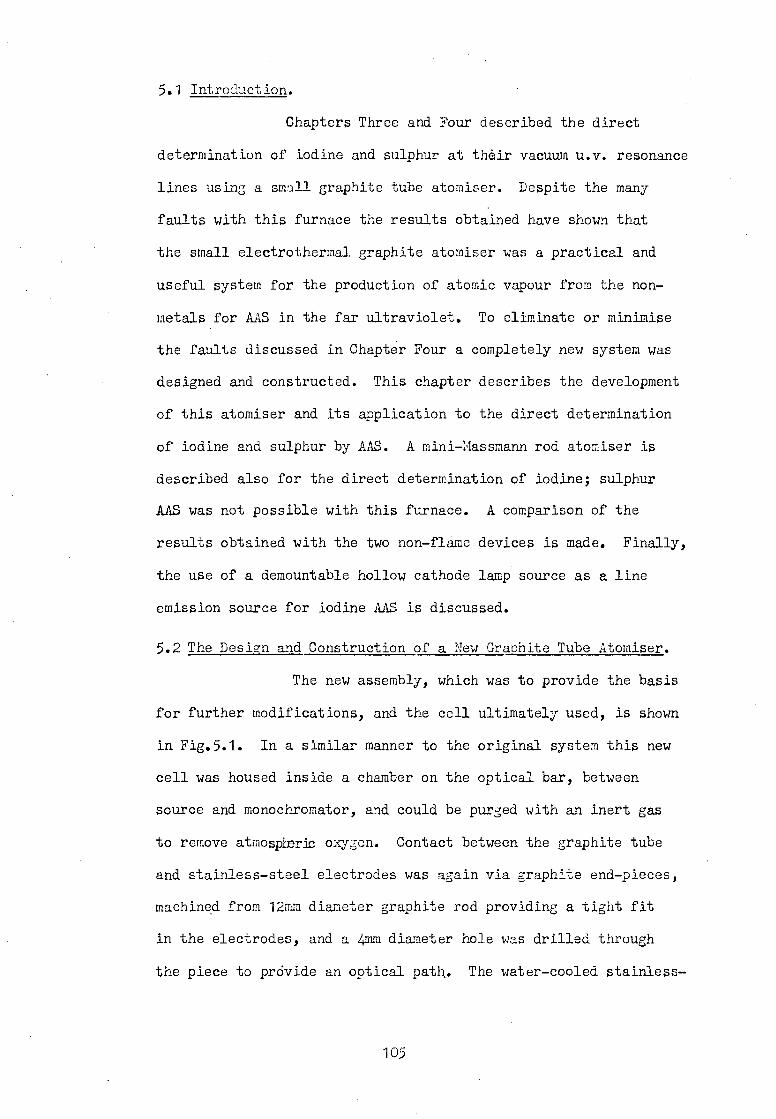
5.1 Introduction.
Chapters Three and Four described the direct
determination of iodine and sulphur at their vacuum u.v. resonance
lines using a small graphite tube atomiser. Despite the many
faults with this furnace the results obtained have shown that
the small electrothermal graphite atomiser was a practical and
useful system for the production of atomic vapour from the non-
metals for AAS in the far ultraviolet. To eliminate or minimise
the faults discussed in Chapter Four a completely new system was
designed and constructed. This chapter describes the development
of this atomiser and its application to the direct determination
of iodine and sulphur by AAS. A mini-Massmann rod atomiser is
described also for the direct determination of iodine; sulphur
AAS was not possible with this furnace. A comparison of the
results obtained with the two non-flame devices is made. Finally,
the use of a demountable hollow cathode lamp source as a line
emission source for iodine AAS is discussed.
5.2 The Design and Construction of a New Graphite Tube Atomiser.
The new assembly, which was to provide the basis
for further modifications, and the cell ultimately used, is shown
in Fig.5.1. In a similar manner to the original system this new
cell was housed inside a chamber on the optical bar, between
source and monochromator, and could be purged with an inert gas
to remove atmospheric oxygen. Contact between the graphite tube
and stainless-steel electrodes was again via graphite end-pieces,
machined from 12mm diameter graphite rod providing a tight fit
in the electrodes, and a 4mm diameter hole was drilled through
the piece to provide an optical path. The water-cooled stainless-
105

(a)
/ steel
electrode -l. \ 0 0"
( b)
Fig.5.2
tube
graphite contact
power -+--~::--T--t-~~ term ina 1 s
baseplate
inert gas
Fig.S.1 .
steel electrodes were mounted on a spring-loaded carriage mechanism,
allowing for any expansion by the furnace during heating and
enabling tubes of various lengths to be examined. The normal
graphite tube length was 20mm and, as before, was machined from
a rod of high purity Ringsdorff graphite to provide a tube of
6mm diameter and 1mm wall thickness. The electrical power transfer
to the tube and water cooling efficiency of the metal electrodes
was far superior to that obtained with the original system. The
power to the furnace was supplied by the Variac and transformer
arrangement previously reported.
Using the H2S-Ar EDL source the performance
of this cell was examined. A background absorption signal of
approximately 0.2 absorbance unit was always present when more
than 75% power was used to heat the furnace, although no sample
(even a blank) was present in the cell. Firing the-tube at peak
voltage more than twenty times had no effect in removing this
non-specific absorption which was present at all wavelengths
below 200nm. Various experiments were undertaken to discover
and eliminate the cause of this interference. Oxygen-free nitrogen
was the usual purging gas employed and the possibility of CN being the
absorbing species was considered. Changing to argon as the purging
gas, however, did not decrease the observed absorption. Furthermore,
no effect was observed on the signal when the purge gas flow-rate
was changed, except at very high flow-rates (in excess of 2 to
3 1.min-1 ) when cooling of the tube by the gas occurred.
L'vov (1W) has described a technique of cutting
slits into tube furnaces to provide an alternative exit from the
tube other than the ends of the tube for species capable of molecular
107

absorption, i.e. condensation or recombination reactions were
encouraged to occur out of line with the optical axis. A similar
arrangement was investigated with this furnace. A slit, 1mm wide,
was cut into the tuba to a depth of 2 to 3mm on each side of the
sample introduction port. This did succeed in reducing the non-
specific absorption to 0.10 to 0.15 absorbance unit. To reduce
this signal further, attempts were made to line the furnace with
tantalum foil, a technique used by other workers when faced with
problems such as carbide formation, (117). Using thin (ca. 0.1mm)
tantalum foil, the inside of the graphite tube was lined and the
furnace and foil positioned between the graphite end-pieces and
metal electrodes. The results obtained with this were not reproducible.
On some occasions no background absorption signal was observed
and at other times the signal was unaffected. Even when no back-
ground signal was detected neither iodine nor sulphur AAS was
possible. The liner served to cool the furnace and decreased
the heating rate of the sample, so allowing for volatilisation
and escape from the tube without decomposition to the atomic state.
The next series of experiments was directed
towards the geometry of the system and size of the graphite tube.
Several of the commercially available EGA 74 Perkin-Elmer tubes
(28mm long, 9mm o.d. and 1.5mm wall thickness) were examined but
a similar absorption signal was observed at wavelengths below
195nm. An identical wavelength dependence was observed with
these tubes as with the lab. made tubes. Varying the length of
the tubes had no effect on this signal either.
The graphite-graphite and graphite-steel
108

contacts at the ends of the tube were examined and.modifications
to the stainless-steel supports undertaken. Two new electrode
designs were examined, Fig.5.2, and the main characteristics may •
be summarised as:
a) The carbon-steel contact surface area was much increased so
reducing heat dissipation at these points.
b) The carbon end-pieces were much smaller in thickness and the
ends of the tube projected beyond the external face of the piece,
i.e. the carbon-carbon interfaces were no longer directly in the
optical path.
Studies with both systems revealed the background
absorption signal to be a function of the carbon-carbon contact
and the assembly shown in Fig.5.2 (b) eliminated this signal.
Sulphur AAS using the redesigned furnace was now
examined. 1941 aliquots of pure (distilled) water were placed
in the furnace using an Eppendorf micropipette, the tube was
heated at 1 to 27 until all signs of water vapour had disappeared
and finally the furnace was fired at 8 to 97 for 2 to 3sec. A
large and irregular absorption peak was observed, Fig.5.3; water
vapour was condensing along the optical path during the drying
stage and vaporising during atomisation. Although sulphur AAS
could be observed over this non-specific molecular absorption,
Fig.5.3 (b), without background-correction facilities no analytically
useful results could be obtained.
The only purge gas entry into the atomisation
chamber was directly below the centre of the tube, nitrogen (or
argon) flow through the furnace was only a slow diffusion process
1C9
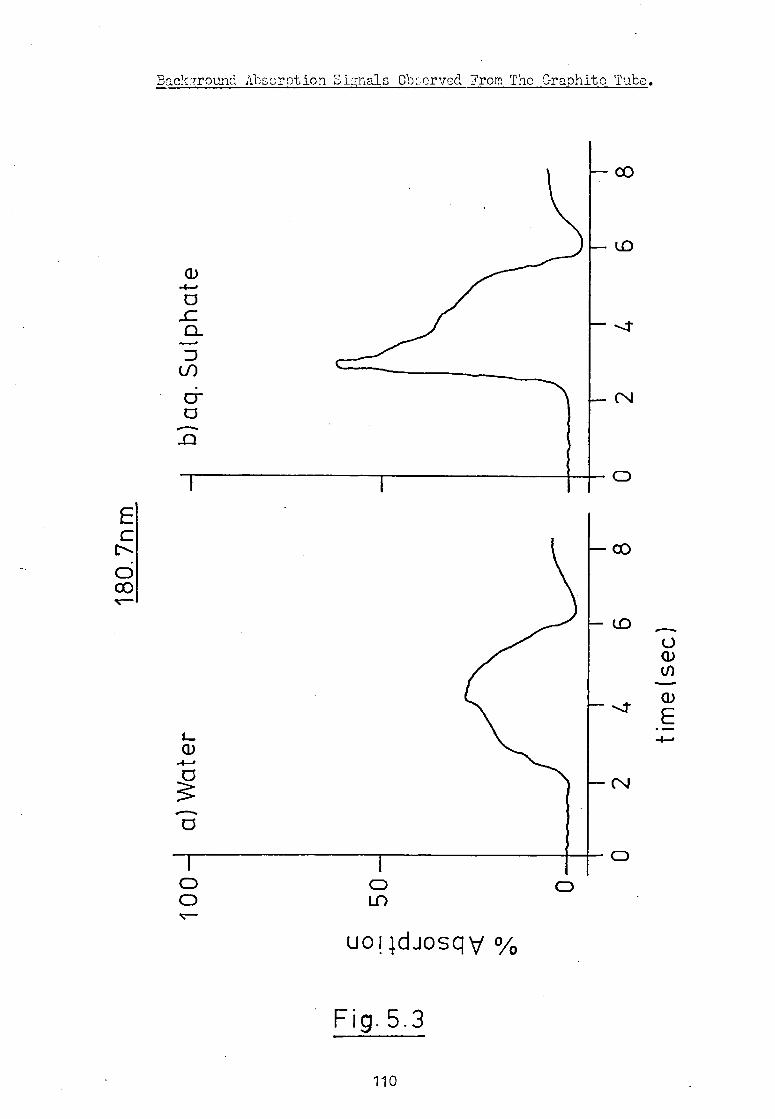
C 5 bid
% Absorption
0-1 0
0 0
a
3 CD
(f) CD 0
OH-
• ogn,i, og.Tticr—Tro, ow, ti10.1!' pana.o:;q0 uoT. q.ciaescix pimaizyto-ca-
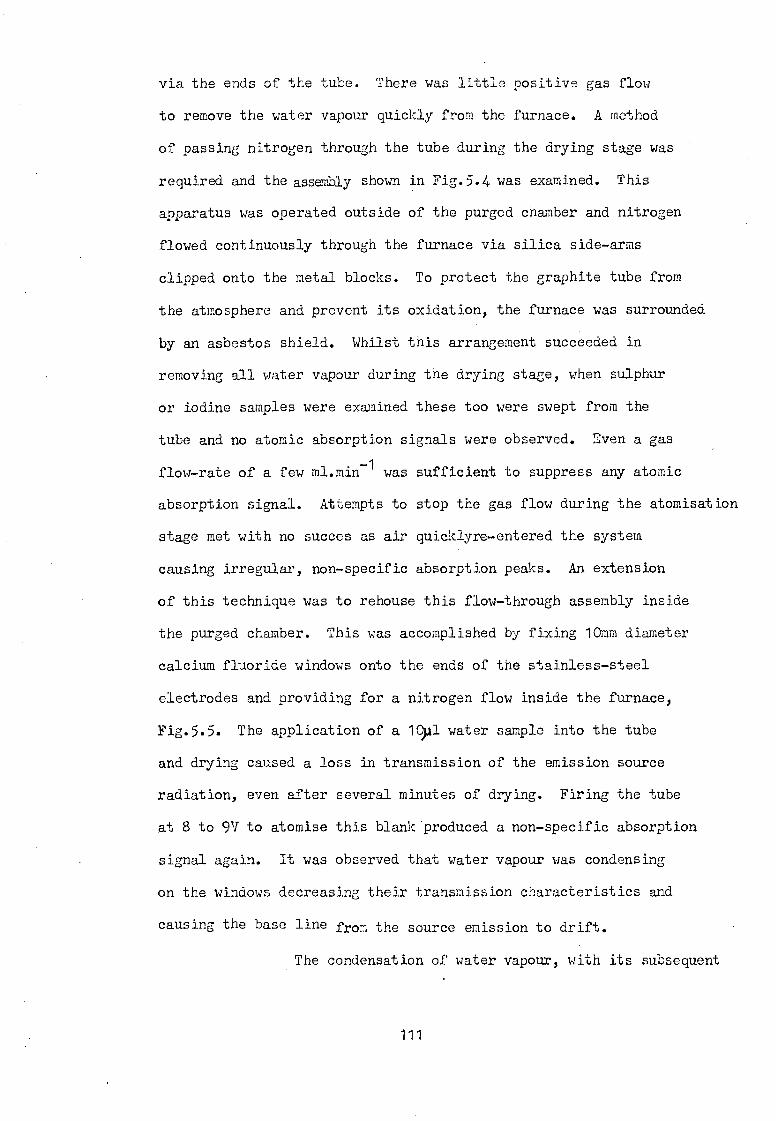
via the ends of the tube. There was little positive gas flow
to remove the water vapour quickly from the furnace. A method
of passing nitrogen through the tube during the drying stage was
required and the assembly shown in Fig.5.4 was examined. This
apparatus was operated outside of the purged chamber and nitrogen
flowed continuously through the furnace via silica side-arms
clipped onto the metal blocks. To protect the graphite tube from
the atmosphere and prevent its oxidation, the furnace was surrounded
by an asbestos shield. Whilst this arrangement succeeded in
removing all water vapour during the drying stage, when sulphur
or iodine samples were examined these too were swept from the
tube and no atomic absorption signals were observed. Even a gas
1 flow-rate of a few ml.min was sufficient to suppress any atomic
absorption signal. Attempts to stop the gas flow during the atomisation
stage met with no succes as air quicklyre-entered the system
causing irregular, non-specific absorption peaks. An extension
of this technique was to rehouse this flow-through assembly inside
the purged chamber. This was accomplished by fixing 10mm diameter
calcium fluoride windows onto the ends of the stainless-steel
electrodes and providing for a nitrogen flow inside the furnace,
Fig.5.5. The application of a 1911 water sample into the tube
and drying caused a loss in transmission of the emission source
radiation, even after several minutes of drying. Firing the tube
at 8 to 9V to atomise this blank produced a non-specific absorption
signal again. It was observed that water vapour was condensing
on the windows decreasing their transmission characteristics and
causing the base line from the source emission to drift.
The condensation of water vapour, with its subsequent
111
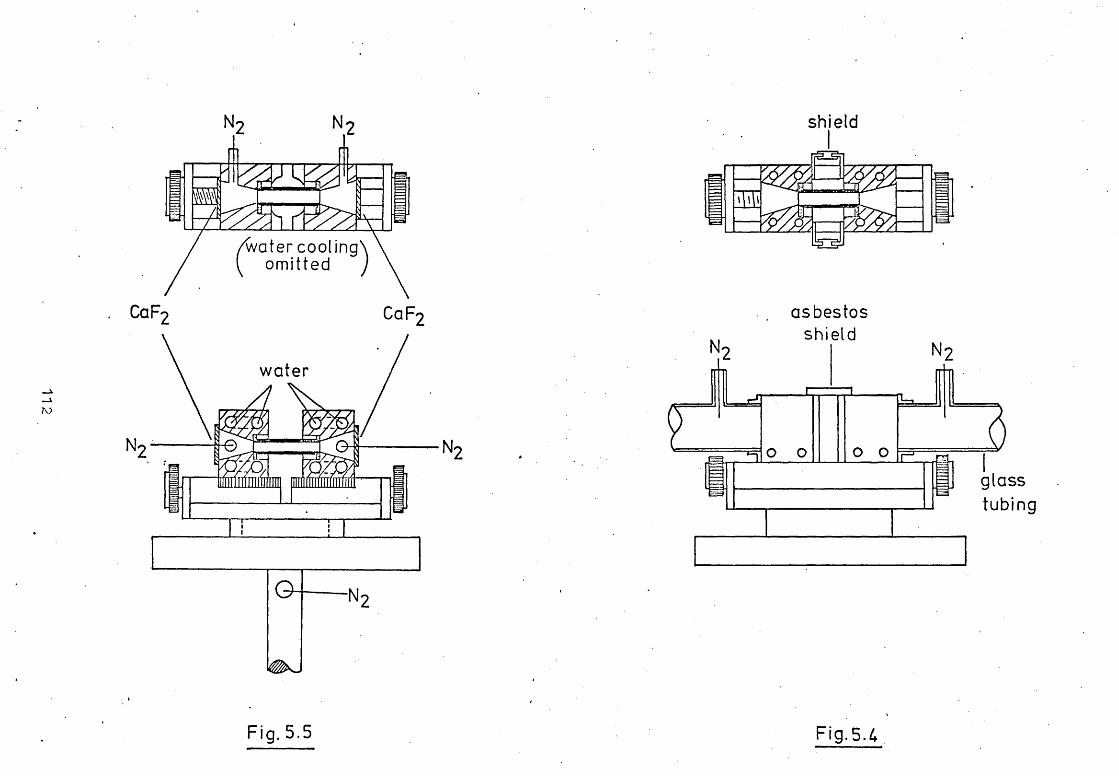
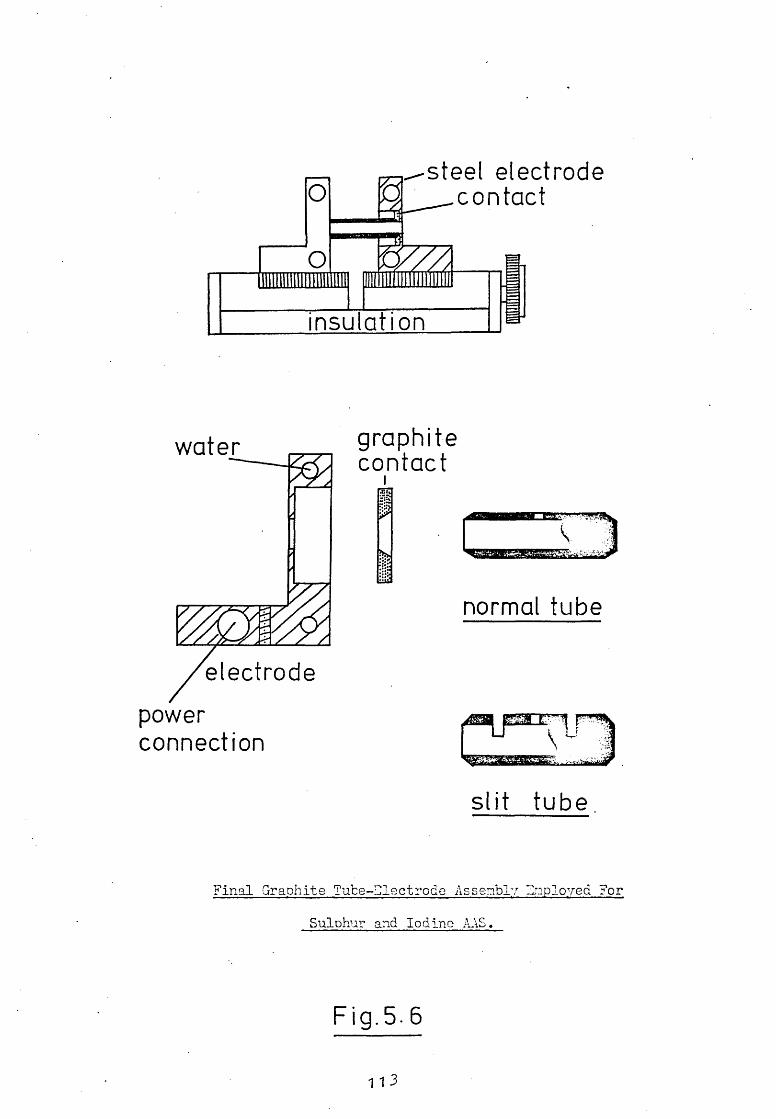
water
power connection
~steel electrode o contact
o
insu lat ion
graphite contac t
I
normal tube
slit tube
Fin9.l Graohi te Tuce-:lectrode !l.ss8:.lbl"r =::-.1ploved ?or
Sulohur and lad inc A4\S.
Fig.5.6

evaporation and absorption of radiation during the.atomisation
stage in heating the furnace, was a serious problem because the
evaporation occurred in the optical path. The relatively large
mass of cooled stainless-steel encouraged the condensation and
it was necessary to reduce this whilst maintaining efficiently
cooled electrodes. This was carried out to provide the final,
successful, electrothermal graphite cell for the atomisation of
non-metallic species, Fig.5.6. The electrodes are similar to
the original system (Fig.3.5) but are larger and individually
water-cooled.
5.3 A Mini-Massmann Rod Atomiser.
As referred to earlier,the 20mm graphite
tube furnace was not the only non-flame absorption cell examined
for vacuum ultraviolet AAS. The second graphite furnace, a mini-
Massmann rod atomiser, is shown in Fig.5.7. As can be seen, it
was much smaller than the tube furnace but fitted into the same
metal electrodes via its carbon end-pieces and was used with the
assembly turned through 900; typical of the graphite-filament
type cells. The rod was made from the same 6mm diameter, high
purity graphite rod as used for the tube furnaces. Because of
its smaller size, the rod atomiser was purged more easily of
oxygen and water vapour, and smaller samples (typically 1 to 5.p1)
could be employed. However, to prevent radiation reaching the
detector without first passing through the atom cell it was necessary
to employ limited-field viewing. This was achieved by small-bore
collimating tubes, made from brass, fixed in the optical path
so stopping-down the incident radiation from the source.
114
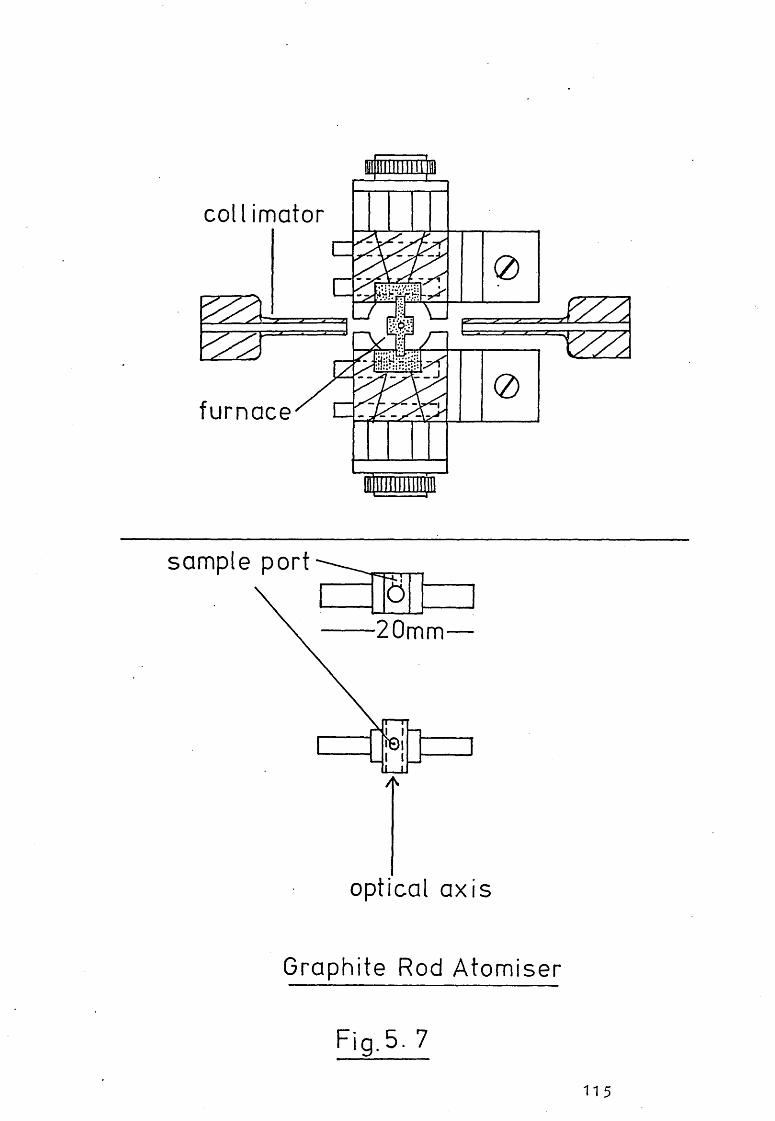
coll imator
~> .. ~ (2)
furnace
sample port? . c=flOll
--20mm-
optical ax is
Graphite Rod Atomiser
Fig.5.7
11 5
5.4 A Demountable Hollow Cathode Lamp.
The iodine and sulphur AAS experiments referred
to in Chapters Three and Four were undertaken using 1-11)L sources
as commercial hollow cathode lamps were not available for these
elements. A limiting factor with the use. of EDL sources, however,
is that being prepared from silica tubing, radiation of shorter
wavelengths than ca. 175nm is absorbed to a great extent by the
quartz bulb. A second possible source is the demountable hollow
cathode lamp. The lamp examined here was a commercially available
device (IMiniglowt, Spectral Products Inc, New Haven, Conn., U.S.A.)
and consisted of a replaceable hollow cathode retained within
a water-cooled brass support inside a brass body. Argon, at
pressures between 2 and 20torr, was passed continuously across
the face of the cathode, through the body of the lamp, and a
calcium fluoride window (3mm thickness, 25mm diameter) was fitted
to allow transmission of radiation of wavelengths down to ca. 125 to
130nm. The lamp is shown in Fig.5.8. The continuous flow of
inert gas through the lamp was expected to reduce the self-absorption
of the emitted resonance radiation and the water-cooling of the
cathode lowered the operating temperature of the lamp so providing
sharper line emission.
A variety of salts were examined as cathode
materials and spectra obtained from chlorides, bromides, iodides,
sulphur and phosphorus. The chlorine and bromine emissions are
discussed in more detail in Chapter sight.
The power to the lamp was supplied via
a commercial Techtron hollow cathode lamp source unit and to
compare its performance with ?DL sources for iodine AAB, the
116

water-cooled brass block
window r
gas in brass cathode
holder
- L I
\\\1\IP- water
cathode
anode vac. pump
MINIGLOW Hollow Cathode Lamp
supply to the lamp was electronically modulated. This was achieved
in a similar manner to that described for the electronic modulation
of the sulphur EDL in Chapter Four, i.e. a 1000Hz, 20V peak-
to-peak, square-wave a.c. modulating signal was led to the trigger
unit of the hollow cathode lamp supply unit and the same signal
was passed to the phase-sensitive detector as a reference signal.
The hollow cathode line emission was observed to follow well this
modulating signal.
5.5 Iodine AAS1(a) The Graphite Tube Atomiser.
Using the new electrothermal graphite tube
atomiser, the direct determination of iodine by AAS was again
examined. In Chapter Three a mechanically modulated a.c. system
was described. The iodine EDL employed for these studies did
not respond to electronic modulation. The emission intensity
vs applied microwave power curve for this r_LA, at 183.Onm is shown
in Fig.5.9, and as can be seen a variation in the applied power
about the optimum 15watts produced negligible modulated emission.
Decreasing the applied power to about ca. 10watts and modulating
to produce an on-off signal caused the lamp emission intensity
to be unstable. To achieve electronic modulation of the source
for iodine AAS, and the inherent advantages of this technique,
a new iodine containing EDL was necessary. A variety of metal
iodide lamps were examined and the best in terms of signal-to-
noise ratio and signal-to-background ratio for the iodine 183.Onm
resonance line was an EDL containing a few milligrams of mercuric
iodide and ca. 4torr of argon. The 183.Onm line emission intensity
vs applied microwave power curve for this lamp is shown in Fig.5.10,
and it responded well to the modulation signal used for the sulphur
studies, i.e. 1000Hz, square-wave, mark-to-space ratio of 1:1.
118

Performance Of Iodine LDL Sources.
HgI2-Ar 183.0nm
10—
I I I I I 0 20 40 60 80
100
Applied power (watts)
Fig. 5.10
Fig. 5.9
I2-Ar EDL 183.0nm
10—
O.C. component
— of emission
tr) C C)
a)
cc
input [modulation
0 0 10 20 30 40 50
Applied power (watts)
119

The chamber nitrogen flow-rate was optimised
at 11.min 1, the slits at 301.1m and the atomisation voltage at
8.0V across the graphite tube. With an instrumental time-constant.
Of 300m.sec iodine calibration plots were determined at 178.2nm
and 183.0nm for *1 aliquots of iodine as aqueous potassium iodide,
iodate and periodate. The absorption signals observed at the
iodine resonance lines were independent of the nature of the
iodine bearing species and furnace purging gas, (nitrogen or
argon). The analytical curves of absorbance vs concentration
were both linear upto an absorbance value of approximately 0.6,
as found previously with the simple graphite tube apparatus.
The sensitivities (for 1% absorption) were improved, however, by
ca. 50%, providing a linear working range at 178.2nm of 1.5 to
15.Ong I and at 183.0nm of 2.0 to 5Ong I. This improvement in
sensitivity was attributed to the more efficient heating rates
obtained with the new graphite furnace, and the mercuric iodide
EDL source suffering less pressure broadening than the iodine
EDL source due to the lower volatility of mercuric iodide and,
hence, its lower vapour pressure in the lamp. The improved detection
limits were due to the better signal-to-noitB ratios obtained for
the electronically modulated source as compared with the mechanical,
rotating sector technique.
The relative effects of simple foreign
ions were identical to those described in Chapter Four, with one
exception. Using this new tube atomiser, phosphate, as di-sodium
hydrogen phosphate, did not cause such a large enhancement of the
absorption signal at 183.0nm. No interference was observed from
a 10-fold excess of phosphate on a 5)11 sample aliquot containing
120

1Ong I. A 100-fold excess enhanced the 183.0nm absorption signal
by 30%, and, again, a 1000-fold weight excess caused 100% absorption
of the incident radiation. The effect of the 100-fold weight
excess of phosphate could be monitored at the 124.4nm line, as
before, i.e. the 184.4nm line could be employed to correct for
non-specific background absorption. No explanation could be found
to explain the different effects of the phosphate in the two
furnace atomisers.
The Demountable Hollow Cathode Lamp Source.
The iodine AAS calibration graphs were repeated
using the demountable hollow cathode lamp source. Before any
AAS measurements were conducted a study was made of the emission
characteristics of a variety of cathode materials; carbon, stainless-
steel, copper, brass and aluminium. The spectra, recorded between
170nm and 200nm with an argon flow pressure of 2torr and lamp
power of 15mA, are shown in Fig.5.11. For all further studies,
aluminium blank cathodes were employed because of its spectral
purity in the wavelength region of interest. The cathode for
the atomic emission of iodine was prepared as follows. A few
grams of mercuric iodide were mixed with an equal weight of powdered
tungsten, and the mixture was compressed into a blank aluminium
cathode. The mixture was then drilled out of the cathode, using
a N° 33 drill, leaving a thin layer, ca. 1mm thick, around the
inner wall of the cathode. The cathode was then pushed into its
water-cooled brass holder and the assembly operated as referred
to previously. An emission spectrum from the HgI2/W/A1 hollow
cathode source was recorded and Table 5.1 compares the results
with the emission from the ii=7I2 EDL.
121
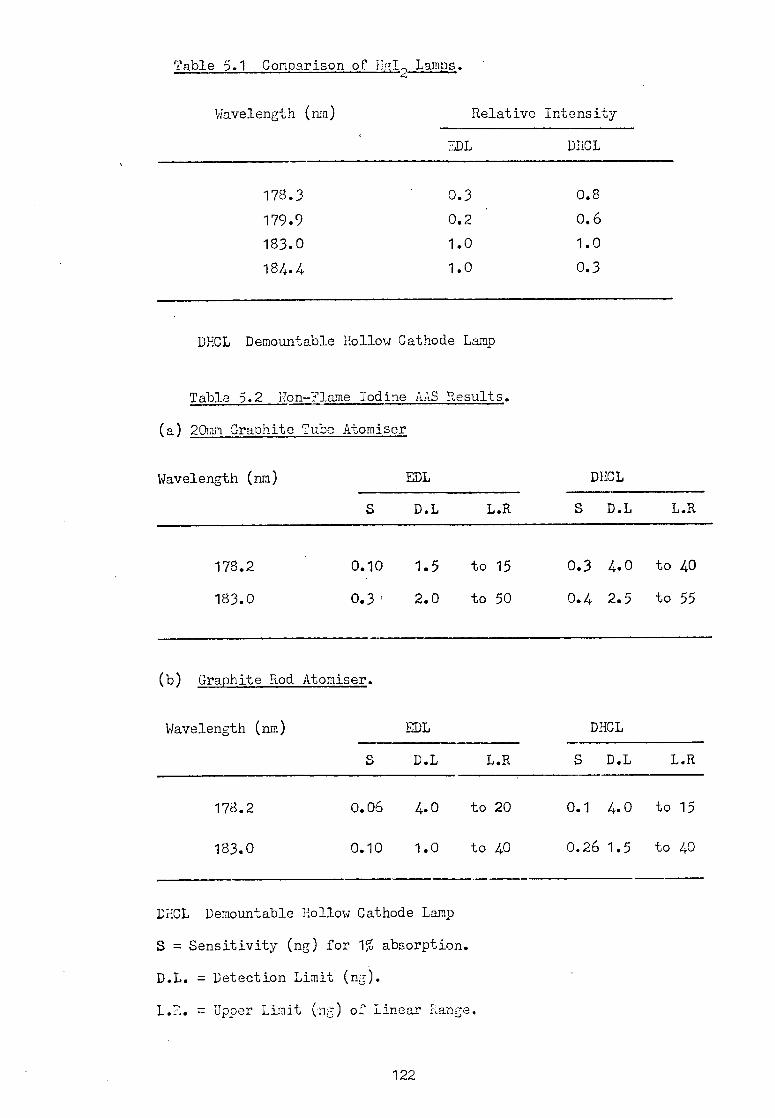
Table 5.1 Comparison of ilia, Lamps.
Wavelength (nm) Relative Intensity
2DL DHCL
178.3 0.3 0.8
179.9 0.2 • 0.6
183.0 1.0 1.0
184.4 1.0 0.3
DHCL Demountable Hollow Cathode Lamp
Table 5.2 Ron-Flame Iodine AAS Results.
(a) 20mm Graphite Tube Atomiser
Wavelength (nm) EDL DHCL
S D.L L.R S D.L L.R
178.2 0.1.0 1.5 to 15 0.3 4.0 to 40
183.0 0.3 . 2.0 to 50 0.4 2.5 to 55
(b) Graphite Rod Atomiser.
Wavelength (nm) EDL DHCL
S D.L L.R S D.L L.R
178.2 0.06 4.0 to 20 0.1 4.0 to 15
183.0 0.10 1.0 to 40 0.26 1.5 to 40
DHCL Demountable Hollow Cathode Lamp
S = Sensitivity (ng) for 1% absorption.
D.L. = Detection Limit (ng).
L.R. = Upper Limit (
of Linear Range.
122

0.2—
U C
.n0.1-
stainless-steel
1 70
8.0 9.0
copper Voltage across rod
jk.■■••■•■■■■■
w0.2— C L.)
0" .2 0.1—
brass
aluminium "A-
200 190 180 170 A inm
Fig. 5.11
2.0 1.0
N2 flow through. chamber
Fig. 5.12

Calibration plots of iodine concentration vs
absorbance were determined using the 20mm graphite tube atomiser
and the demountable hollow cathode lamp source at 183.0nm and
178.2nm. The purge flow-rates, monochromator spectral bandpass
and furnace atomising voltage were as for. the EDL source studies.
The sensitivity (for 1% absorption) at 183.0nm was 0.4ng I and
at 178.2nm 0.3ng I; the linear working ranges were 2.5 to 55ng I
and 4 to Ong I at the 183.0nm and 178.2nm resonance lines
respectively.
5.5 Iodine AAS, (b) The Mini-Massmann Rod Atomiser.
The mini-Massmann rod atomiser was arranged
as described in Section 5.3. The source emission, EDL or hollow
cathode lamp, was focussed by means of the calcium fluoride lens
into the furnace through the collimator to reduce stray radiation
reaching the detector. As a further precaution, a second collimator
was employed between the furnace and monochromator. With standard
solutions of iodine as potassium iodide, iodate and periodate
the usual optimisation of purge flow-rate, spectral bandpass and
atomising voltage were undertaken. Fig.5.12 shows the effect
of varying the nitrogen flow-rate and applied voltage on the
absorbance by iodine at 183.0nm using the rod atomiser. For
further studies the nitrogen flow-rate through the chamber was
maintained at 0.51.min 1 and an atomisation voltage of 9.07 employed.
Because of the much smaller volume of the rod furnace compared
with the tube, it was necessary to use an instrumental time-constant
of 100m.sec to prevent damping of the signals.
Fig.5.13 shows the analytical curves obtained
at 183.0nm using the mini-Massmann rod with the mercuric iodide
124

0.8 EDL
(a)
DHCL
(b)
(a)rr •=100m.sec
( b) T =300 m.sec
20 ng I
125
10 30 40 50
Iodine Calibration Curves With The Rod Atomiser.
178.2nm Minimassmann rod
0.8— DHCL
cD
CTI
EDL
0.4- L O tr)
0 0
10 15 20
25
n g I
Fig. 5.14
Fig. 5.13
183.Onm Minimassmann rod

demountable hollow cathode lamp source. Fig.5.13 also shows
the effect of the instrumental time-constant (') on the calibration
curves. The curves were independent of the nature of the iodine
sample and independent of the nature of the purge gas employed;
nitrogen and argon.
Fig.5.14 shows the calibration curves at the
178.2nm iodine resonance line. The sharp curvature of the analytical
curve using the EDL source was due to the spectral bandpass of
the monochromator being at 0.16nm compared with the 0.05 nm band-
pass employed with the hollow cathode lamp at 178.2nm and with
both sources at 183.0nm. The increased slit width for the EDL
source studies at 178.2nm was necessary because of the poor signal-
to-noise ratio at this line from the EDL with this small atomiser.
The results obtained for the iodine AAS studies
at 178.2nm and 183.0nm, using the 20mm graphite tube atomiser
and the mini-Massmann rod furnace are summarised in Table 5.2.
The Effect Of Foreign Ions With The Rod Atomiser.
As in Chapter Three the effects of 10:1, 100:1,
and 1000:1 weight excesses of sodium chloride, potassium chloride,
sodium sulphate, sodium nitrate and di-sodium hydrogen phosphate
on 1Ong iodine (5p1 aliquot of 2pg.m1-1 iodide) at 183.Onm were
investigated. The results are summarised in Table 5.3. As before,
corrections could be made for the non-specific molecular absorption
by employing the 179.9nm and 184.4nm iodine non-resonance lines.
5.6 Sulphur AAS, (a) The New Graphite Tube Atomiser.
Using the new electrothermal graphite tube
atomiser, the direct determination of sulphur by AAS using its
126

Table 5.3 effect Of Common Salts On Iodine Absorption Usine.
The Graphite oc Atomiser.
1S3.0nm Salt Concentration Chan
At ge Increase Absorption
Studied ratio in in at
MX MX; iodide absorbance,% absorbance 184.4nm
NaC1 10:1 0 0 0
100:1 +100% 0.1 0.1
1000:1 100% absorption of radiation
KC1
Na2HP04
NaNO3
Na2SO4
10:1 0 0
100:1 0 0
0
1000:1. +1705 0.17
0.17
10:1 0 0
0
100:1 +601, 0.06
0.06
1000:1 +100% 0.1
0.1
10:1 0 0 0
100:1 +100% 0.1 0.1
1000:1 +120% 0.12 0.12
10:1 0 0 0
100:1 0 0 0
1000:1 +2005 0.2 0.2
127

0
0 U) 0 — Z 0 c,-
0
(r)
o 01
Absorbance
0
0
01 CD
Absorbance
U, 0
CY)
51.'5'2
91-'5 • 2T3
CO -
t.0 —
cl)
3 •
S 6u 09 07
0Z
0 I
U 0 Z 1.
w u L 0 9 I.
• STV anticiln5
far ultraviolet resonance and near-resonance lines was undertaken.
The remainder of the apparatus was as described in Chapter Four,
i.e. an iI2S/Ar EDL, electronically modulated; was used. The
optimum slit width was found to be 30pm (0.05nm bandpass) and
the sulphur atomic absorption results were optimised for nitrogen
flow-rate through the chamber and applied voltage across the
furnace, Fig.5.15 (a) and (b) respectively. Employing a nitrogen
1 flow-rate of 0.751.min and an applied voltage of 97, calibration
curves for sulphur as potassium and sodium sulphate, potassium
thiocyanate and thiourea were constructed at 180.7nm, 182.Onm
and 182.6nm, Fig.5.16. The results are summarised in Table 5.4.
The sensitivities obtained with the new graphite
tube atomiser were a factor of 2 to 3 times greater than with
the older system.
As can be seen in Fig.5.16„ the calibration
plots of absorbance vs concentration of sulphur all deviate from
linearity towards the concentration axis at low absobance values
(ca. 0.3). Identical curvature of calibration curves was obtained
whether the sulphur EDL was made from H2S/Ar, S02/Ar or elemental
sulphur/Ar. This may have resulted from a variety of causes,
as mentioned in Chapter Three; these will be discussed in more
detail here.
5.6 (b) The Bending Of Analytical Curves In AAS.
(i) Apparatus Faults.
In their discussion concerning the bending
of analytical curves in AAS, Rubeska et al. (11g) classify the
causes of bending into two groups; apparatus faults and properties
of the spectral line itself. The first includes such factors
129

as a fraction of the source radiation falling on the detector
without passing through the absorbing medium. Some lamps emit
a continuum with the line spectra or, perhaps, a non-absorbed
line that is not resolved from the resonance line. In quantitative
AAS analysis, a direct proportionality is assumed to exist between
concentration and absorbance, the absorbance (A) is given by,
A = log Io/I ... 5.1
as discussed in Chapter One.
With the above apparatus and optical
faults the effect is to add an intensity term to both the numerator
and denominator, so that the measured absorbance may be represented
by,
' " A = log I + I ... 5.2
Where Io and I" are the signals due to the resonance line and
the non-resonance line radiation, respectively, when blank solutions
are atomised, and It and I" are the readings due to the resonance
and non-absorbed radiation, respectively, when a sample is atomised.
The effect is to introduce a non-linearity into the absorbance vs
concentration curve.
The optical arrangement employed for the
sulphur AAS studies was identical to that used for iodine AAS.
Deviations from linearity at low absorbance values were not observed
with iodine, therefore, the possibility of radiation reaching
the detector in sulphur AAS without passing through the furnace
was small. As a check, however, the sulphur calibrations were
130

re-examined using collimators, of the type shown in Fig.5.7, to
limit the field of observation. Apart from worsening the signal-
to-noise ratio of the source emission, identical results were
observed with or without the collimators present.
Decreasing the width of the entrance and exit
slits to less than 3C-nn did not increase the linear range of the
analytical curve. The presence of any continuum emission passing
through the atom cell could be disregarded therefore as the sensitivity
of AAS using a continuum source is dependent on the slit width
of the monochromator. The possibility of an impurity having an
emission line so close to the sulphur lines and being present
in the EDL could be ignored also.
Emission from the heated atomiser served to
dampen absorption signals, as discussed in Chapter Three. Employing
modulation techniques, however, eliminated the effect of this
interference and no emission signal was observed using the a.c.
detection apparatus.
(ii) Bending Due To The Nature Of The Spectral Line.
The second group of causes of bending of analytical
curves, those due to the spectral line, are more difficult to
deal with. Included are hyperfine structure of the line, the
ratio of the absorption and emission line widths and the resonance
line broadening and line shift in the atom cell.
Hyperfine Splitting.
The hyperfine line structure is determined
by the interaction between the spin of the nucleus and the resultant
spin of the electron shell. According to these spin moments a
magnetic interaction is set up between the nucleus and electron
131
splitting the electron energy levels and consequently the spectral
line. A nucleus with an even number of protons and an even number
of neutrons has a moment of zero and there is no hyperfine splitting
of the line. Elemental sulphur is 95.1% 32S, comprising 16 neutrons
and 16 protons, i.e. there is no resultant spin moment and negligible
hyperfine splitting from the other isotopes; 33S (0.700 and
"S (4.2%).
Ratio Of Emission and Absorption Line Widths.
In many cases, the width of the lamp emission
line cannot be neglected in comparison with the width of the
absorption line as this often causes bending of analytical curves,
i.e. the profile of the emission line as well as that of the
absorption line must be considered. These line profiles may be
a Gaussian function if the Doppler effect determines the line
shape or a Lorentzian function if collisional broadening is the
major component. (A combination of the two effects results in
a Voigt function).
The extreme case of Doppler broadened lines
has. been dealt with by Mitchell and Zemansky (IA). They have
tabulated values of the total absorption, defined as,
1 - T = 1 - I/I0 2
for different optical depths for line profiles with different
line-width ratios.
Defining,
Emission line width , Doppler broadened ... 5.3 Absorption line width
and converting absorption to absorbance, curves of absorbance
132

therefore,
and as
A))14 = 0.653 x 10⁸ sec-1
>■ A X =
against optical depth for various values of XI; are'shown in Fig.5.17(a).
Rubeska et al. have treated the case of collisional
broadened profiles. Their results, expressed as absorbance vs
optical depth for various values of XL, are presented in Fig.5.17(b).
Where,
Emission line-width XL = , Lorentz broadening ... 5.4
Absorption line-width
To achieve the bending of the analytical
curve observed with the sulphur calibration, it may be seen that
the emission line-width to absorption line-width ratio needs to
be greater than unity. The relative effects of the Doppler and
Lorentz broadening processes in the absorption cell and lamp
source may be estimated for the 180.7nm sulphur resonance line.
Natural Broadening.
Natural broadening of a spectral line is
related to the lifetime (t) of the excited electronic state and
the natural width of a resonance line may be defined as,
Al)" - zrrt A
2.1T
-1 sec ... 5.5
Where A2,1
is the transition proability for the line, and for
the 180.7nm S line,
A2,1 = 4.1 x 10⁸ sec
AXINI = 7.1 x 10⁻⁶ nm
133
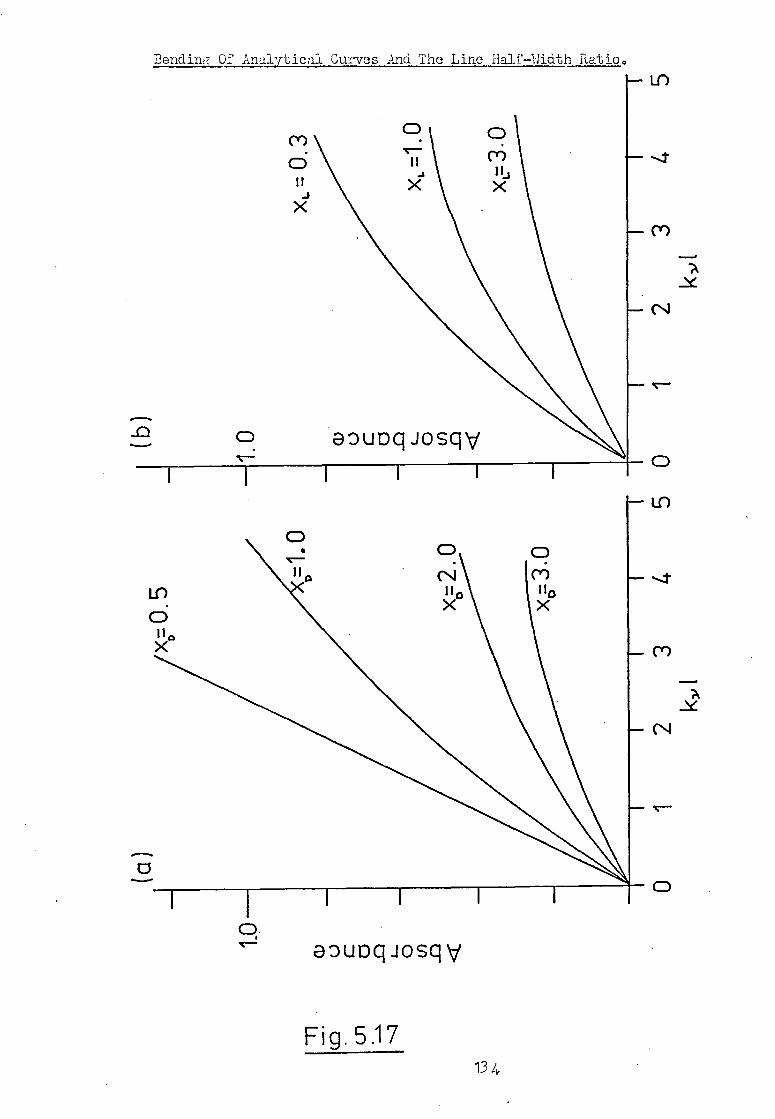
Absorbance
O
I I I Absor bance
0■1% WW1.
ti
X X r
x 11 r r I CA)II O
O (A)
O
01—
1
O
........
'6!.d
0
ooTweli L19,1P-M—JTEll ouTrl 014I DUF saAJno ruoTI-:[ruK JO zuTPuaa
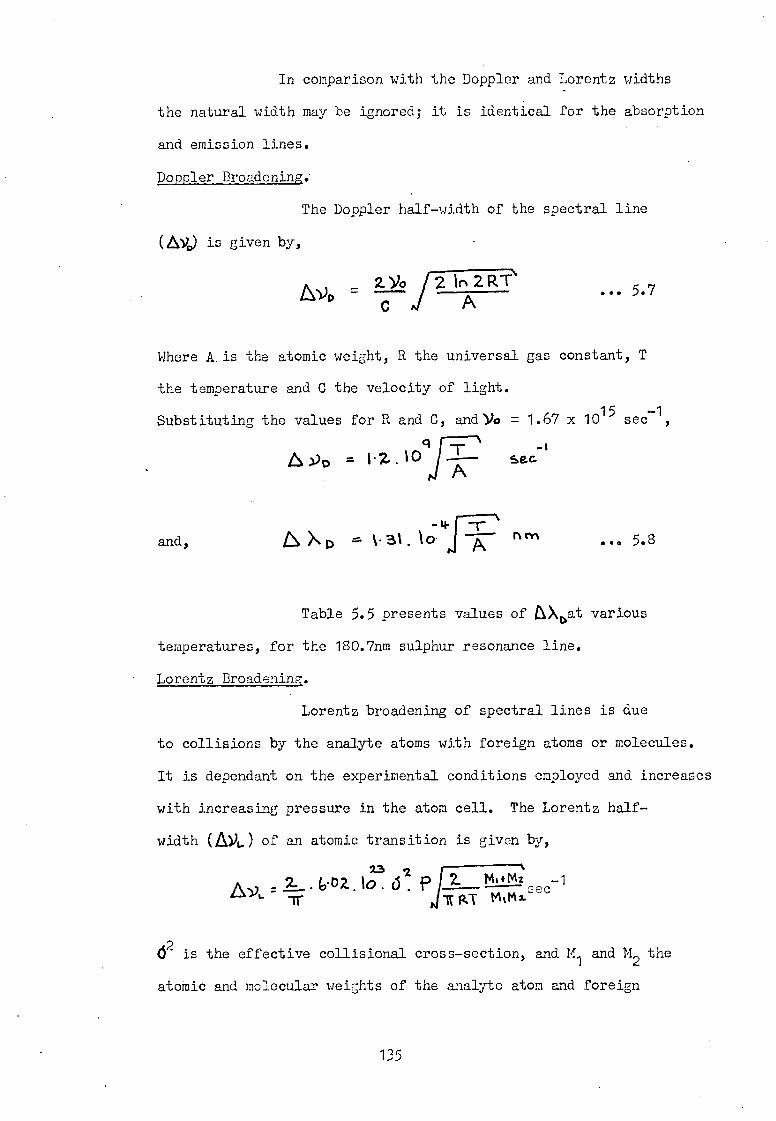
T
In comparison with the Doppler and Lorentz widths
the natural width may be ignored; it is identical for the absorption
and emission lines.
Doppler Broadening.
The Doppler half-width .of the spectral line
(Ali) is given by,
Avo= zyo 2 In 2 RT C A ... 5.7
Where A.is the atomic weight, R the universal gas constant, T
the temperature and C the velocity of light.
Substituting the values for R and C, andVo = 1.67 x 10¹⁵ sec-11
= i-2. 10
and, 60 D 31 • IC; *FA? "" ... 5.8
Table 5.5 presents values of LX at various
temperatures, for the 180.7nm sulphur resonance line.
Lorentz Broadening.
Lorentz broadening of spectral lines is due
to collisions by the analyte atoms with foreign atoms or molecules.
It is dependant on the experimental conditions employed and increases
with increasing pressure in the atom cell. The Lorentz half-
width (L))L) of an atomic transition is given by,
13 2 • (:).02.• 10 . P "2 -1 3.zec
1r miti
62 is the effective collisional cross-section, and M1 and M
2 the
atomic and molecular weights of the analyte atom and foreign
sec
135

gas species respectively. If the pressure (P) is measured in
torr, then substituting for the constants,
AA- = 1022. P. 61 N1. 4_
c-1 M% / se
Winefordner (12 62 1) has discussed the choice of value for for
flames and has suggested that it lies within the limits of 20
and 100 x 1516cm2. The maximum value of 10714cm2 is assumed here.
Thus,
= 4- sec-1
The pressure in the graphite furnace was atmospheric (ca. 760torr)
and in the EDL source 3torr. Assuming a furnace temperature of
2000K and EDL operating temperature of 500K the relative Lorentz
half-widths may be determined.
Graphite Tube Furnace.
For sulphur AAS, using nitrogen as the cell
purge gas, M1 is 32 and 142 is 28. Therefore,
1.9. log (2 sec-1
and,
Z.13 x 10 4 nri
EDL Source
Again, M1 is 32 and M2, using argon as the lamp filling
gas, is 40.
Therefore, &VL =14-•2106 2( sec-1
and converting to wavelength units,
6XL. = 1.55 x 1076 nm
136

Collisions between the gaseous atoms and molecules
not only cause broadening of the spectral line but also displaces
the line from its initial position. This effect may be ignored
here as the shift is usually much smaller than the broadening
effect. Both nitrogen and argon, being heavy gases, cause a shift
towards longer wavelengths. The displacement effect, therefore,
in the furnace and lamp source is similar and has little effect
on the ratio of the emission and absorption line widths.
Resonance Broadening.
This is often referred to as Holtzmark broadening
and is a particular case of collisional broadening. It is caused
by collisions between atoms of the same kind. The half-width
of the spectral line, therefore, increases with increasing concentration
of the analyte atoms; causing bending of the analytical curve.
Rubeska et al. (Ile) used the following
relationship to express the resonance broadened half-widthl Wik.
= X . sec-1
2m ).7c,
e and m are the charge and mass of the electron, respectively,
and N is the number of analyte atoms per unit volume. f is the
oscillator strength of the transition and for the 180.7nm S line
is 0.12. Several values have been proposed for the constant X 1
although they differ only insignificantly. A value of 0.32 is
assumed here.
Substituting for the constants and expressing the
half-width in terms of wavelength units,
.6.Xs = 4.5 x 10⁻¹⁴. X3. f ri cm
137
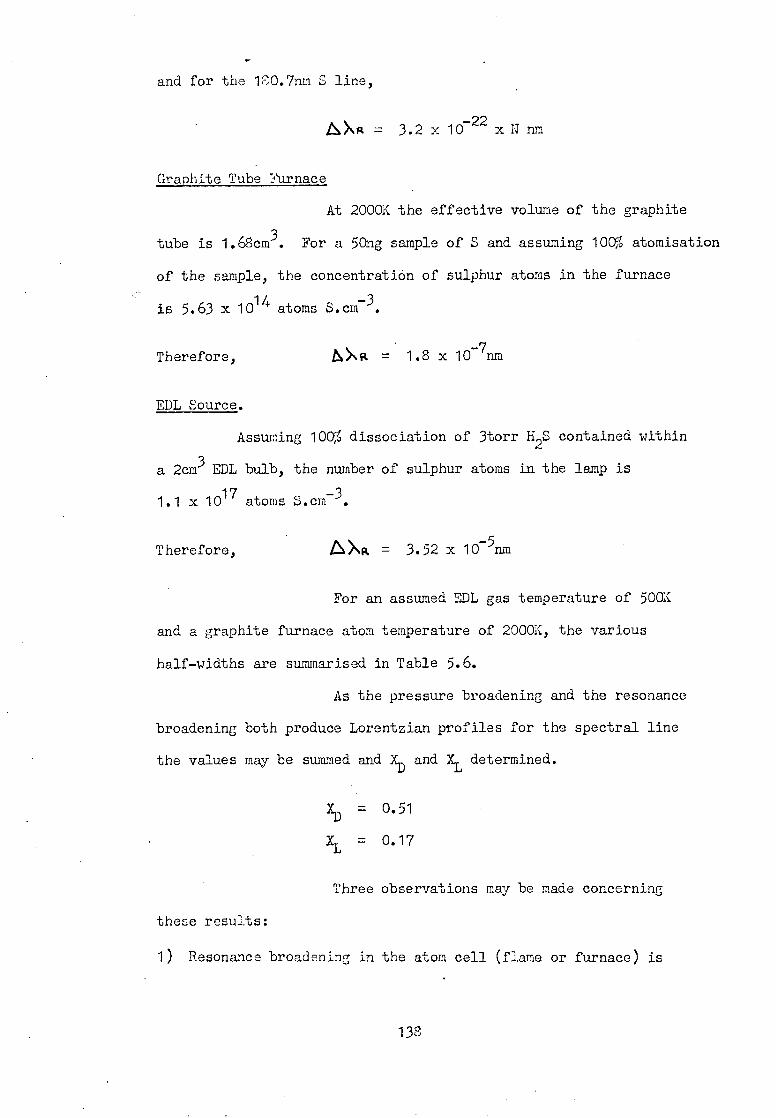
and for the 120.7nm S line,
ISXR = 3.2 x 10 22 x N nm
Graphite Tube Furnace
At 2000K the effective volume of the graphite
tube is 1.68cm3. For a 50ng sample of S and assuming 10C% atomisation
of the sample, the concentration of sulphur atoms in the furnace
is 5.63 x 10¹⁴ atoms S.cm-3.
Therefore, = 1.8 x 1 0 7nra
EDL Source.
Assuming 100% dissociation of 3torr H2S contained within
a 2cm3 EDL bulb, the number of sulphur atoms in the lamp is
1.1 x 10¹⁷ atoms S.cm-3.
Therefore) /SXR = 3.52 x 10⁵nm
For an assumed EDL gas temperature of 500X
and a graphite furnace atom temperature of 2000X, the various
half-widths are summarised in Table 5.6.
As the pressure broadening and the resonance
broadening both produce Lorentzian profiles for the spectral line
the values may be summed and XD and XL determined.
= 0.51
XL = 0.17
Three observations may be made concerning
these results:
1) Resonance broadening in the atom cell (flame or furnace) is
138
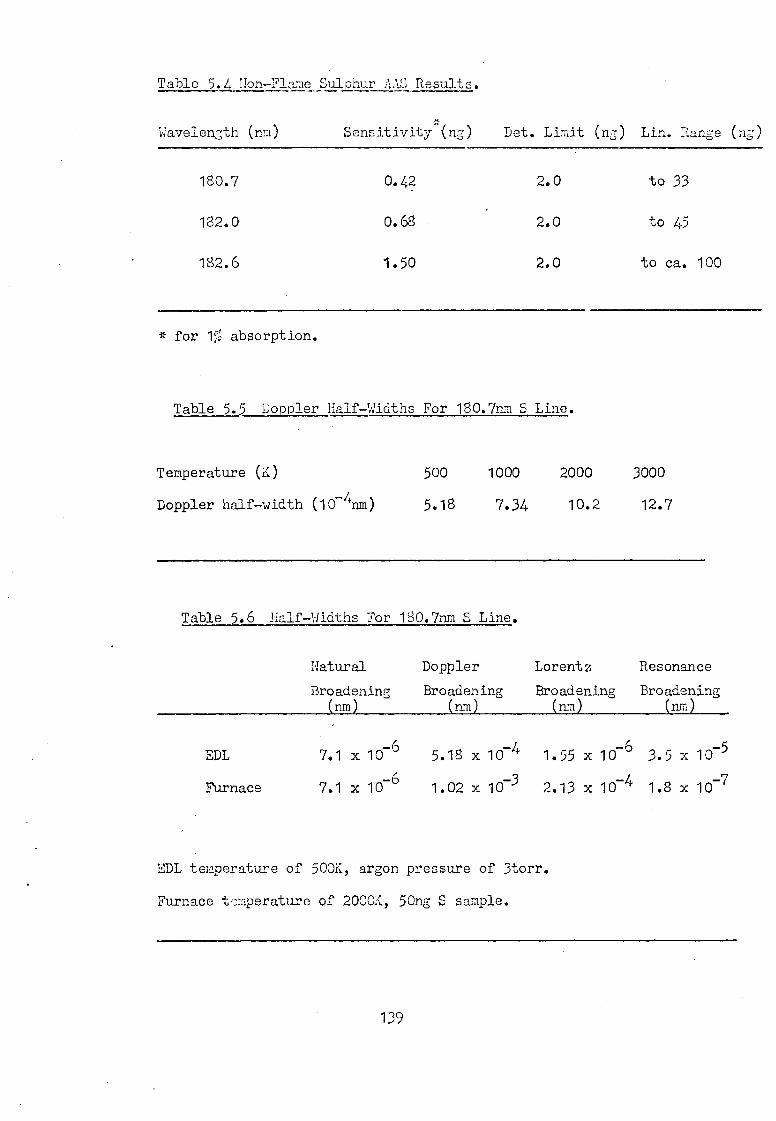
Table 5.4 Non-Flame Sulphur AAS Results.
Wavelength (nm) Sensitivity (ng) Det. Limit (ng) Lin. 1:ange (ng)
180.7 0.42 2.0 to 33
182.0 0.68 2.0 to 45
182.6 1.50 2.0 to ca. 100
* for 15 absorption.
Table 5.5 Doppler Half-Widths For 180.7nm S Line.
Temperature (K)
500 1000 2000 3000
Doppler half-width (104nm) 5.18 7.34 10.2 12.7
Table 5.6 Half-Widths For 180.7nm S Line.
Natural Doppler Lorentz Resonance
Broadening Broadening Broadening Broadening (nm) (nm) (nm) (nm)
EDL 7.1 x10 ( 5.18 x 10 4 1.55 x 10 ° 3.5 x 10 5
Furnace 7.1 x10⁶ 1.02 x 10 3 2.13 x 10 4 1.8 x 10 7
EDL temperature of 500K, argon pressure of 3torr.
Furnace temperature of 2000K, 5Ong S sample.
139
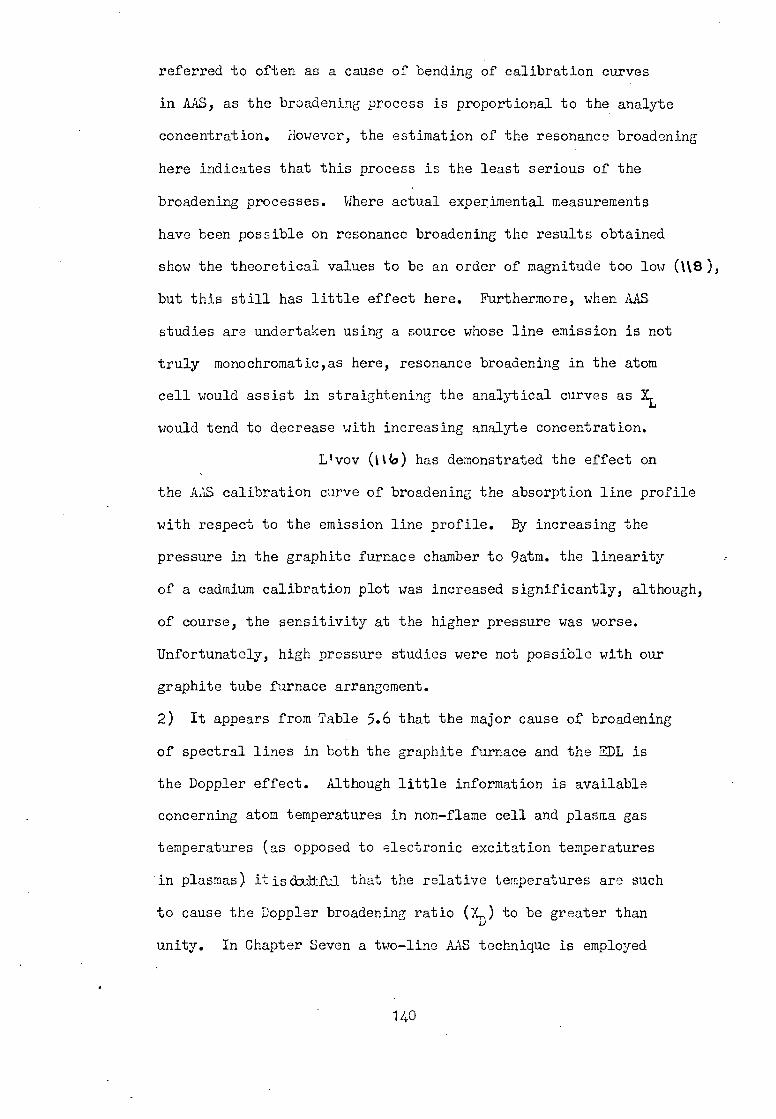
referred to often as a cause of bending of calibration curves
in AAS, as the broadening process is proportional to the analyte
concentration. However, the estimation of the resonance broadening
here indicates that this process is the least serious of the
broadening processes. Where actual experimental measurements
have been possible on resonance broadening the results obtained
show the theoretical values to be an order of magnitude too low (118),
but this still has little effect here. Furthermore, when AAS
studies are undertaken using a source whose line emission is not
truly monochromatic,as here, resonance broadening in the atom
cell would assist in straightening the analytical curves as XL
would tend to decrease with increasing analyte concentration.
Livov (illo) has demonstrated the effect on
the AXIS calibration curve of broadening the absorption line profile
with respect to the emission line profile. By increasing the
pressure in the graphite furnace chamber to 9atm. the linearity
of a cadmium calibration plot was increased significantly, although,
of course, the sensitivity at the higher pressure was worse.
Unfortunately, high pressure studies were not possible with our
graphite tube furnace arrangement.
2) It appears from Table 5.6 that the major cause of broadening
of spectral lines in both the graphite furnace and the DL is
the Doppler effect. Although little information is available
concerning atom temperatures in non—flame cell and plasma gas
temperatures (as opposed to electronic excitation temperatures
in plasmas) itisda±tfel that the relative temperatures are such
to cause the Doppler broadening ratio (X,) to be greater than
unity. In Chapter Seven a two—line AAS technique is employed
140

to determine the temperatures attained by an atomic vapour in
a commercial graphite atomiser; the results obtained indicate
the atomic vapour temperature follows the graphite wall temperature
quite closely. However, it is douletfla whether these results
may be applied here as non-metal dissociation and atomisation
for AAS cannot follow the same mechanisms and kinetics as are
assumed to exist for normal metal analyses with graphite furnaces.
3) The preceeding estimates of the relative broadening effects
occurring in the furnace and EDL source ignored the effects of
self-absorption in the source. As the mechanism of the plasma
discharge is not fully understood and no measurements of self-
absorption broadening in EDL sources have been undertaken, it
is not possible to assess the magnitude of this effect with the
sulphur EDL sources. If self-absorption in the sulphur containing
lamps is the limiting case here, i.e. self-absorption broadening
is greater than the effect of pressure broadening, then this must
be a special case as such bending of analyical curves was not
observed for iodine calibrations. Two other points also may be
made. Marshall (122) employed a similar sulphur EDL source for
the direct determination of this element at 180.7nm using a nitrogen-
separated nitrous oxide-acetylene flame and reported calibration
curves linear to absorbance values of 0.7 to 0.8. L'vov (V LB)
investigated the non-flame determination of iodine, sulphur and
phosphorus using a graphite cuvette assembly and reported linear
calibration graphs upto absorbance values of 0.3 to 0.5. Unfortunately,
he provides no details as to which element provided the least
linear analytical curve. However, it would appear that the non-
metals, and sulphur in particular, do not provide for long linear
141
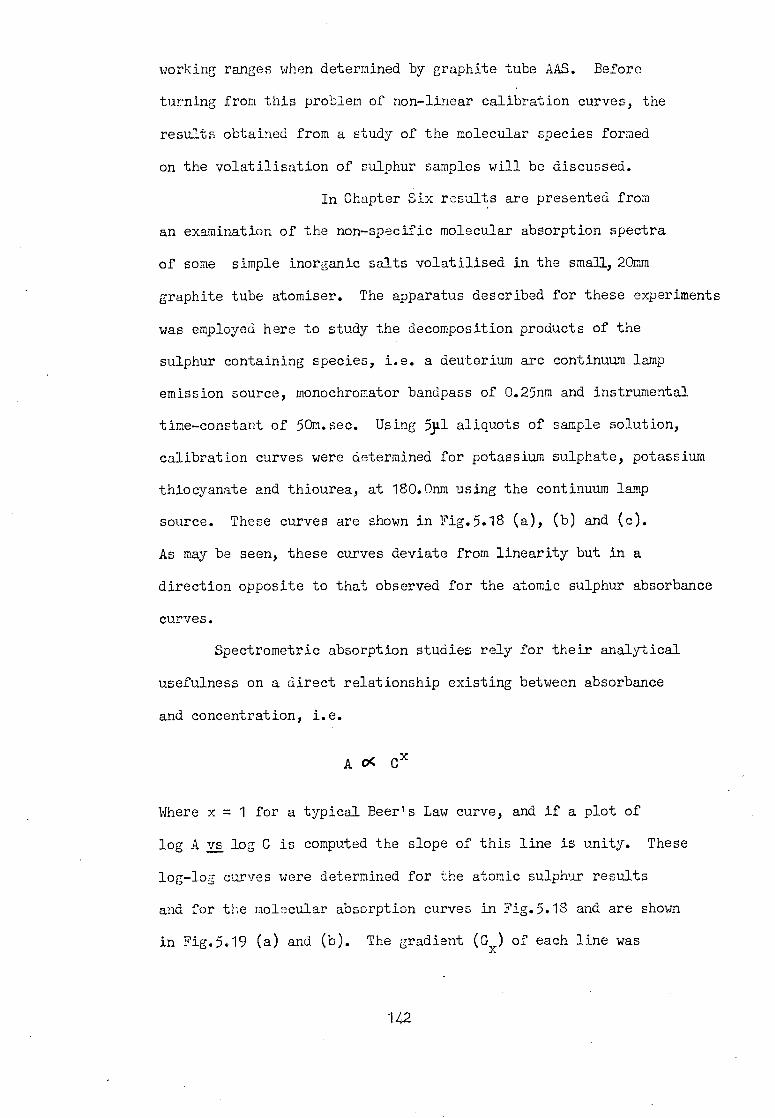
working ranges when determined by graphite tube AAS. Before
turning from this problem of non-linear calibration curves, the
results obtained from a study of the molecular species formed
on the volatilisation of sulphur samples will be discussed.
In Chapter Six results are presented from
an examination of the non-specific molecular absorption spectra
of some simple inorganic salts volatilised in the small, 20mm
graphite tube atomiser. The apparatus described for these experiments
was employed here to study the decomposition products of the
sulphur containing species, i.e. a deuterium arc continuum lamp
emission source, monochromator bandpass of 0.25nm and instrumental
time-constant of 50m.sec. Using 53t1 aliquots of sample solution,
calibration curves were determined for potassium sulphate, potassium
thiocyanate and thiourea, at 180.0nm using the continuum lamp
source. These curves are shown in Fig.5.18 (a), (b) and (c).
As may be seen, these curves deviate from linearity but in a
direction opposite to that observed for the atomic sulphur absorbance
curves.
Spectrometric absorption studies rely for their analytical
usefulness on a direct relationship existing between absorbance
and concentration, i.e.
A o< CX
Where x = 1 for a typical Beer's Law curve, and if a plot of
log A vs log C is computed the slope of this line is unity. These
log-log curves were determined for the atomic sulphur results
and for the molecular absorption curves in Fig.5.18 and are shown
in Fig.5.19 (a) and (b). The gradient (Gx) of each line was
142

a) sulphate b)thiocyanate c) thiourea
1.0—
Abs
orba
nce
0.5—
0 I I I I I
500 1000 0 200 400 0 100 pg.ml-1 S
Fig.5.18

logC 0.5 1.0
< -0.5- 0) 0
0
(i)= thiourea
(ii)=thiocyanate
<-0.5- rn 0
(iii) = sulphate
-1.0—
144
Fig.5.19

determined and the results were,
Gs (atomic sulphur calibration) = 0.81
Gso4 (sulphate calibration)
= 1.25
G (thiocyanate calibration) = 1.22
Gcs (thiourea calibration) = 1.22
It was of interest that the reciprocal of the sulphur AAS line
gradient was similar to the results for the molecular species,
1/Gs = 1.22
This served to indicate that the species responsible for the
molecular absorption at 180.0nm was responsible for the deviation
in linearity of the sulphur AAS calibration curves determined
at 180.7nm.
With the deuterium arc continuum source the non-specific
molecular absorption spectra were determined from 5,1tl aliquots
of aqueous solutions of potassium sulphate, potassium thiocyanate
and thiourea at 5 and 10nm intervals between 180nm and 290nm
using the small graphite tube. These spectra are shown in Fig.5.20
(a), (b) and (c). An atomising voltage of 8.5V was used throughout
and a rnonochromator spectral bandpass of 0.25nm. Fig.5.20 (a)
also shows the spectrum observed by Fuwa (V2*) on spraying sulphur
containing solutions (as sulphuric acid or cysteine) into a long-
path absorption tube containing the exhaust gases from an air-
acetylene flame. Fuwa attributed this spectrum to SO2 absorption
and proposed the use of the absorption maximum at 207nm for the
direct determination of sulphur. Thompson et al. (MS) have
145

0.6—
0.4— U C 0 .0 0 U)
0.2—
o Graphite. tube
o Flame
--- SO2
220 N,nm
180 200 240 260
146
Fig. 5.20 (b) and (c)
• 250pg.mr1 S (KSCN)
o 100pg.ml 1 S (NH2)2S
a)
C 0
0 tn 03—
Molecular Absorption From Sulphur Containinc species.
180 200 220
240 A s nth
Fig. 5.20 (a)
E —50
L46 0
0 eL
—25 0
0 U)
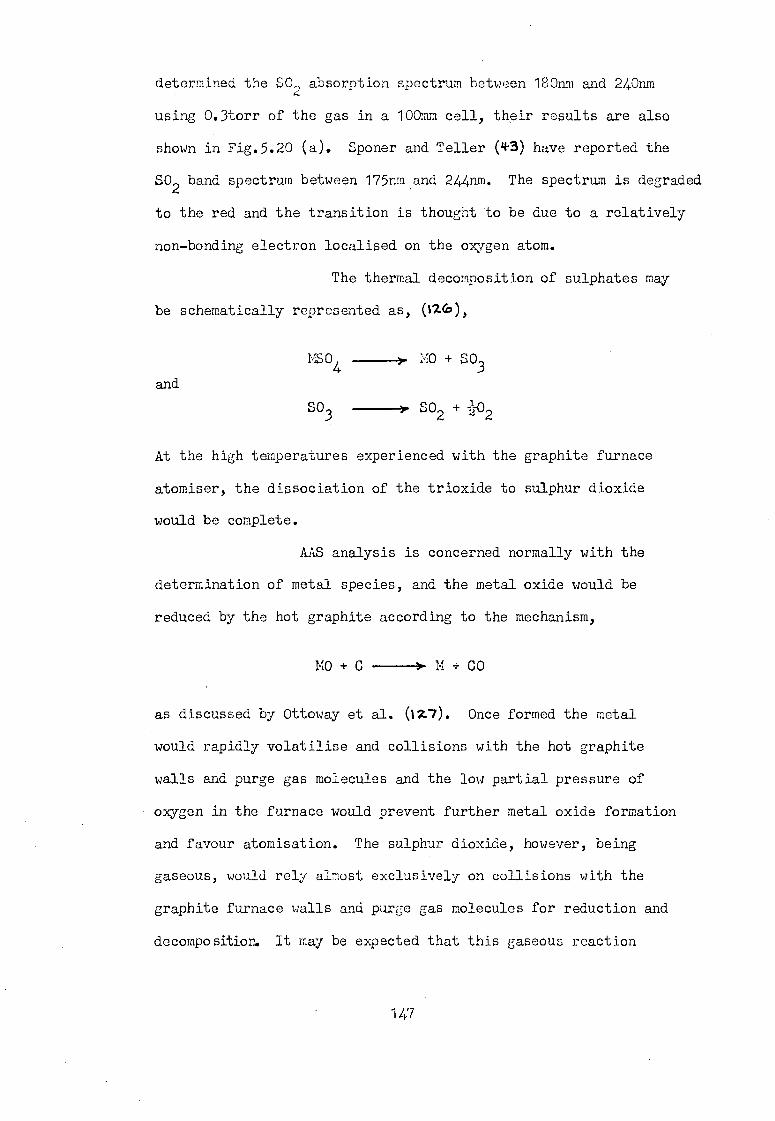
determined the SO2 absorption spectrum between 180nm and 240nm
using 0.3torr of the gas in a 100mm cell, their results are also
shown in Fig.5.20 (a). Sponer and Teller (4.3) have reported the
SO2
band spectrum between 175nm and 244nm. The spectrum is degraded
to the red and the transition is thought to be due to a relatively
non—bonding electron localised on the oxygen atom.
The thermal decomposition of sulphates may
be schematically represented as, (M29),
MSO4
MO + S03
and
SO3
SO2 + 2 - 2
At the high temperatures experienced with the graphite furnace
atomiser, the dissociation of the trioxide to sulphur dioxide
would be complete.
AAS analysis is concerned normally with the
determination of metal species, and the metal oxide would be
reduced by the hot graphite according to the mechanism,
MO + C M + CO
as discussed by Ottoway et al. (127). Once formed the metal
would rapidly volatilise and collisions with the hot graphite
walls and purge gas molecules and the low partial pressure of
oxygen in the furnace would prevent further metal oxide formation
and favour atomisation. The sulphur dioxide, however, being
gaseous, would rely almost exclusively on collisions with the
graphite furnace walls and purge gas molecules for reduction and
decomposition, It may be expected that this gaseous reaction
147
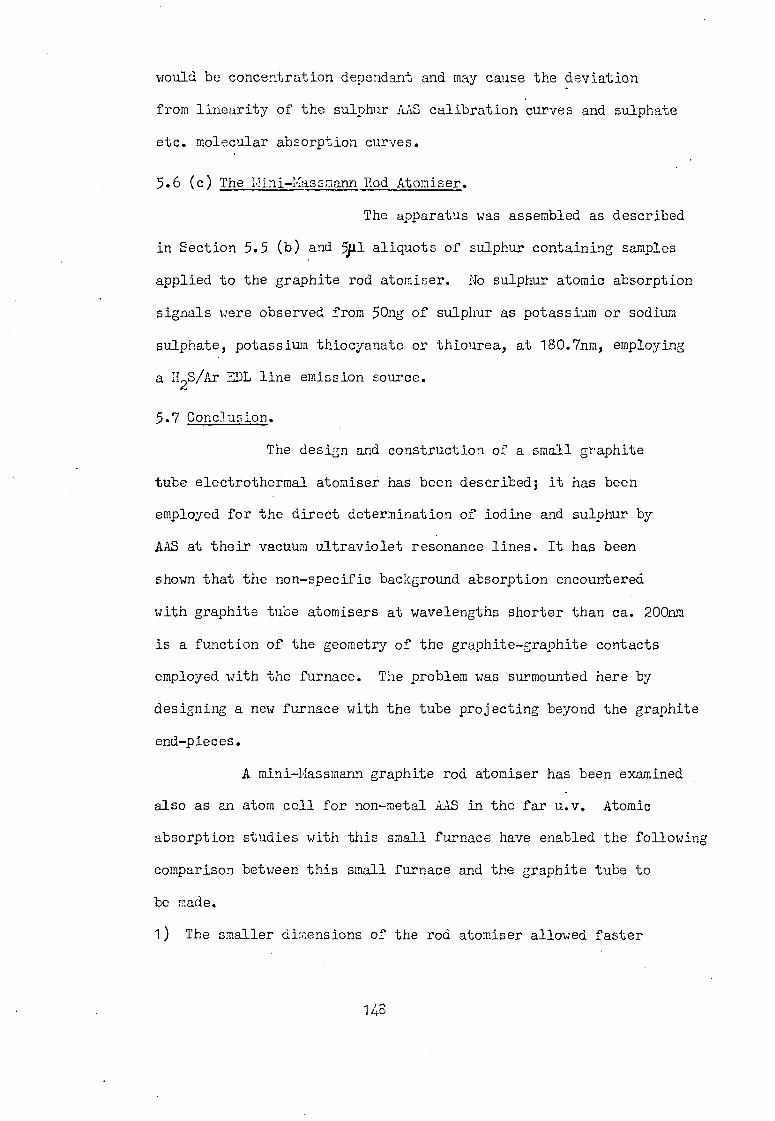
would be concentration dependant and may cause the deviation
from linearity of the sulphur AAS calibration curves and sulphate
etc. molecular absorption curves.
5.6 (c) The Ilini-Massmann Rod Atomiser.
The apparatus was assembled as described
in Section 5.5 (b) and 5111 aliquots of sulphur containing samples
applied to the graphite rod atomiser. No sulphur atomic absorption
signals were observed from 5Ong of sulphur as potassium or sodium
sulphate, potassium thiocyanate or thiourea, at 180.7nm, employing
a H2S/Ar EDL line emission source.
5.7 Conclusion.
The design and construction of a small graphite
tube electrothermal atomiser has been described; it has been
employed for the direct determination of iodine and sulphur by
AAS at their vacuum ultraviolet resonance lines. It has been
shown that the non-specific background absorption encountered
with graphite tube atomisers at wavelengths shorter than ca. 200nm
is a function of the geometry of the graphite-graphite contacts
employed with the furnace. The problem was surmounted here by
designing a new furnace with the tube projecting beyond the graphite
end-pieces.
A mini-Massmann graphite rod atomiser has been examined
also as an atom cell for non-metal AAS in the far u.v. Atomic
absorption studies with this small furnace have enabled the following
comparison between this small furnace and the graphite tube to
be made.
1) The smaller dimensions of the rod atomiser allowed faster
148
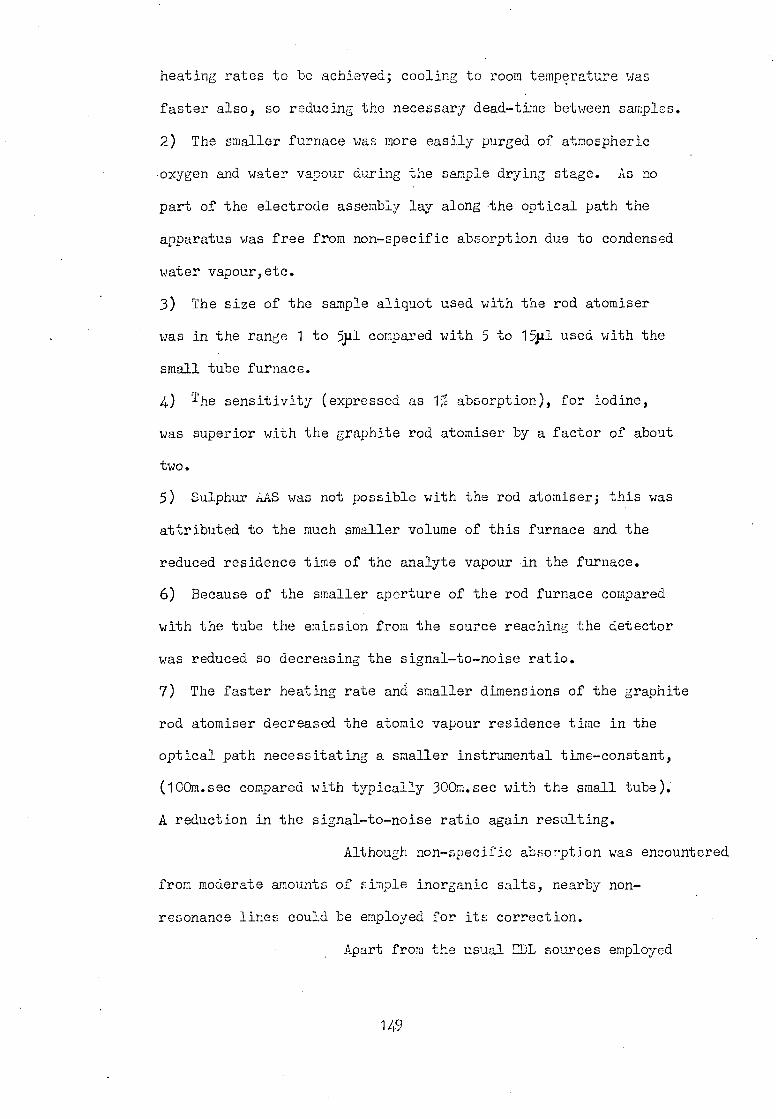
heating rates to be achieved; cooling to room temperature was
faster also, so reducing the necessary dead-time between samples.
2) The smaller furnace was more easily purged of atmospheric
oxygen and water vapour during the sample drying stage. As no
part of the electrode assembly lay along the optical path the
apparatus was free from non-specific absorption due to condensed
water vapour,etc.
3) The size of the sample aliquot used with the rod atomiser
was in the range 1 to 5pl compared with 5 to 15)11 used with the
small tube furnace.
4) The sensitivity (expressed as 1% absorption), for iodine,
was superior with the graphite rod atomiser by a factor of about
two.
5) Sulphur AAS was not possible with the rod atomiser; this was
attributed to the much smaller volume of this furnace and the
reduced residence time of the analyte vapour in the furnace.
6) Because of the smaller aperture of the rod furnace compared
with the tube the emission from the source reaching the detector
was reduced so decreasing the signal-to-noise ratio.
7) The faster heating rate and smaller dimensions of the graphite
rod atomiser decreased the atomic vapour residence time in the
optical path necessitating a smaller instrumental time-constant,
(1C0m.sec compared with typically 300m.sec with the small tube)..
A reduction in the signal-to-noise ratio again resulting.
Although non-specific absorption was encountered
from moderate amounts of simple inorganic salts, nearby non-
resonance lines could be employed for its correction.
. Apart from the usual )L sources employed
149
for non-metal AAS a demountable hollow cathode lamp has been
examined as a line emission source for iodine AS. The results
obtained with this source were similar to the results obtained
using the LL emission source. Unfortunately, time did not permit
an investigation of sulphur AAS with the demountable hollow cathode
lamp.
Finally, a discussion has been presented concerning the
nature of the causes of bending of analytical curves and the
deviation from linearity and Beer's Law in non-flame AAS. The
results obtained for sulphur AAS indicate that the production
of sulphur atomic vapour in the graphite tube furnace was a complex
function of SC2 reduction in the tube, when sulphate samples
were examined. Although a similar atomic vapour production
mechanism appears to occur when the sulphur is originally present
as thiourea or thiocyanate, the molecular spectra observed with
these salts could not be identified to indicate the nature of the
absorbing species.
150

SIX
151
6.1 Introduction
In previous chapters the direct determination
of iodine and sulphur has been discussed, employing their low
wavelength resonance lines. Where interferences due to inorganic
salts were studied, the effect of the foreign ions on the absorption
signal was shown to be an enhancement of the absorption signal,
which could be corrected for by repeating the measurement at a
nearby non-resonance line. The validity of this technique, however,
relies on a foreknowledge of the nature of the interference so
that a suitable non-resonance line may be chosen. This chapter
is concerned with the study of the nature of these interference
absorption signals to assist in selecting the non-resonance line,
and possibly gain an insight into the mechanism of sample dissociation
in graphite furnace. atomisers.
The non-specific absorption spectra
produced by some simple inorganic salts using a commercial HGA 2000
graphite furnace have been investigated in the wavelength range
190nm to 360nm. Using the smaller graphite tube furnace described
in Chapter Five, timabsorption spectra have been determined in the
wavelength range 180nm to 250nm.
The absorption signals obtained
at the iodine 206.1nm non-resonance line observed with potassium
iodide, iodate and periodate in the HGA 2000 furnace are shown
to be due to the molecular iodide.
6.2 Apparatus.
To examine the non-specific absorption spectra observed
in graphite furnace atomisers, two non-flame AAS instruments
were employed.
152
(a) In the wavelength range 190nm to 360nm a Perkin-:lmer Model
305B Atomic Absorption Spectrophotometer fitted witha deuterium
background corrector and HG A 2000 graphite furnace atomiser was
used for the absorption measurements. The furnace was purged,
using automatic stop-flow conditions, with argon (meter reading
4) and the absorption signals obtained, using slit setting 3,
recorded on a conventional potentiometric.chart-recorder (type
112 511, Servoscribe Ltd.,). Sample solutions were transferred
to the furnace using a icpi Eppendorf pipette, and dried at 100°C
for 30see prior to atomisation for 15sec at 2200°C; unless
otherwise stated.
Molecular absorption spectra were obtained using
the deuterium background corrector as the continuum source. With
the deuterium lamp on, the spectrometer operates in the single-
beam mode and, if no line emission source is present in the apparatus,
the absorption signal recorded is the molecular absorption produced
by the sample in the graphite furnace. The absorption signals
were measured, against distilled water blanks, at 5nm or 10nm
intervals between 190nm and 360nm. each absorption measurement
was repeated several times. As the absorption zero was set at
each wavelength the spectra obtained were independent of any
variation in photomultiplier response in the wavelength region
examined.
(b) The absorption spectra in the 180nm to 250nm range were
obtained with the small graphite tube system used for the direct
determination of sulphur and iodine as described in Chapter Five.
The continuum source employed was a deuterium
153

arc lamp (type C70-6V-H, Cathodcon Ltd., U.K.) fitted with a
vitreosil window. Power to the lamp was supplied via a Model
504 APT Regulated Power Supply (lectronic industries Ltd., U.K.)
at 250mA and 807. To reduce the length of the optical path the
window of the lamp was fitted up against the chamber of the furnace
housing. The apparatus was used in the d.c. mode and to enhance
the signal-to-noise ratio, a 50,000pF capacitor was connected
across the input terminals of the oscilloscope used to record
the absorption signals; this provided for a time-constant of
50m.sec. Both entrance and exit slit widths were maintained at
150Rm ( spectral bandpass of 0.25nm) during the absorption meas-
urements.
Sample solutions, containing 10,000,11g.m11, of each
anion were prepared from the chloride, bromide, iodide, nitrate,
sulphate and phosphate of potassium and sodium using analytical
reagent grade salts; these were diluted as required using distilled
water. Stock solutions of iodine as potassium iodate and potassium
periodate were also prepared.
6.3 The Nature Of The Iodine Absorption Signals Observed In The
IDA 2000 At The 206.1nm Iodine Line.
The non-resonance 206.1nm iodine line has been
reported by several workers to be suitable for the direct determination
of iodine by AAS, (iX8,17.ci ). This line corresponds to the trans-
ition 5P5.2Pi - 6S
2 P5/2 and has a transition probability of
3 x 10⁶sec
-1. As its lower energy level is only 0.94eV above
the ground state for iodine it may be expected to be populated
to an appreciable extent at the temperatures attained in typical
flames and electrothermal atomisers commonly employed for AAS.
154
At 2700:: the population of this level would be about of the
total atomic iodine population in the atom cell. The use of this
line for the direct determination of iodine is attractive as a
purged optical path and vacuum monochrOmator are not necessary.
Lvov et al. (1n) used their conventional furnace
system to study the iodine absorption at 206.1nm; with an argon
pressure in the chamber of 3atm. A detection limit of 2 x 10⁻⁹g I
was claimed. Thompson (I2A) reported the determination of iodine
at this wavelength using an air-acetylene flame, but quoted a
poor sensitivity (1300ug.m171 for 1% absorption). Kirkbright
and Wilson WIC have more recently examined this absorption at
206.1nm using an HGA 2000 graphite furnace and iodine IDL source
and obtained a sensitivity, for 1% absorption, of 35ng iodine.
The analytical curve was linear to 7.5,pg I, and was independant
of whether the iodine was present as the iodide, iodate or per-
iodate of potassium. However, when the deuterium arc background
corrector was employed during the examination of iodine absorption
at 206.1nm no signal was observed. As no absorption signal for
.iodine has been reported at the 184.4nm and 187.6nm non-resonance
lines, whose lower energy levels are similar to that of the 206.1nm
line and which have greater_ oscillator strengths; the absorption
signal observed at 206.1nm would appear to be anomolous.
The nature of this absorption signal was
examined using the Perkin-Elmer AAS spectrometer with the HGA
2000 furnace and the results are presented here.
Results.
The stock solutions of potassium iodide, iodate and periodate
were diluted with distilled water to provide working solutions
155
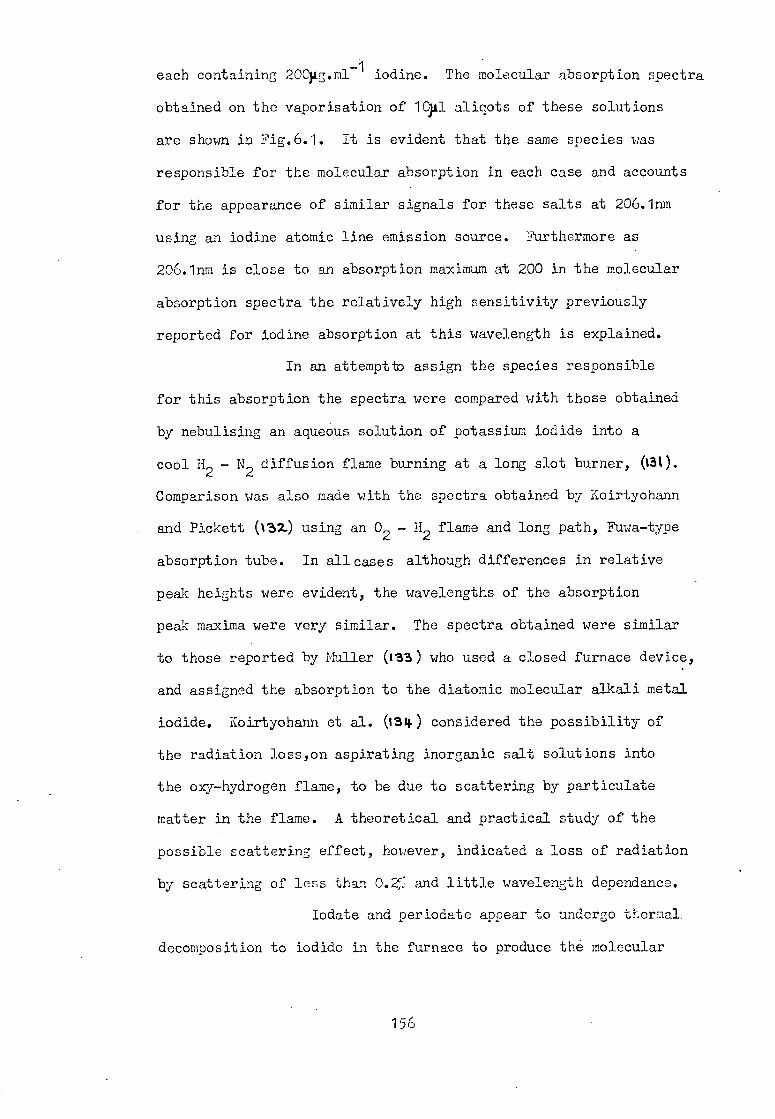
each containing 200Fg.m1 1 iodine. The molecular absorption spectra
obtained on the vaporisation of 14t1 aliqots of these solutions
are shown in Fig.6.1. It is evident that the same species was
responsible for the molecular absorption in each case and accounts
for the appearance of similar signals for these salts at 206.1nm
using an iodine atomic line emission source. Furthermore as
206.1nm is close to an absorption maximum at 200 in the molecular
absorption spectra the relatively high sensitivity previously
reported for iodine absorption at this wavelength is explained.
In an attempt to assign the species responsible
for this absorption the spectra were compared with those obtained
by nebulising an aqueous solution of potassium iodide into a
cool H2 - N2
diffusion flame burning at a long slot burner, (131).
Comparison was also made with the spectra obtained by Koirtyohann
and Pickett (132.) using an 02 - H2 flame and long path, Fuwa-type
absorption tube. In all cases although differences in relative
peak heights were evident, the wavelengths of the absorption
peak maxima were very similar. The spectra obtained were similar
to those reported by Muller (t33) who used a closed furnace device,
and assigned the absorption to the diatomic molecular alkali metal
iodide. Koirtyohann et al. (134) considered the possibility of
the radiation loss,on aspirating inorganic salt solutions into
the oxy-hydrogen flame, to be due to scattering by particulate
matter in the flame. A theoretical and practical study of the
possible scattering effect, however, indicated a loss of radiation
by scattering of less than 0.25 and little wavelength dependance.
Iodate and periodate appear to undergo thermal
decomposition to iodide in the furnace to produce the molecular
156

KI Absorption Spectra In The EGA 2000
0.2 KI
0.1—
0.1—
200 250 300
Wavelength, nm
Fig.6.1 157

absorption spectrum of the alkali metal iodide. Alkali metal
iodates are known to decompose on heating to give the periodate
and iodide, and as the periodates are powerful oxidising agents,
.like their parent acids, it is probable that in the presence of
the hot graphite at the furnace wall reduction of the periodate
to the iodide takes place.
6.4 Absorption By Other Common Salts In The HGA 2000.
The corresponding non-specific, molecular
absorption effects observed with other alkali metal salts in
the same wavelength range(190nm to 360nm) were investigated also.
To enable comparison with the results obtained for potassium iodide)
stock solutions of sodium and potassium sulphate, nitrate, chloride,
bromide and iodide were diluted to provide solutions containing
200pg.m1-1 of the anion. For the sulphates and nitrates of sodium
and potassium no absorption was detected at this concentration in
the wavelength range 190nm to 360nm using the deuterium arc lamp
source. It is probable that these salts decompose on heating
by a mechanism such as, (Section 5.5):
14504
MO + SO
and
MNO3 YO + NO
and subsequent reduction of the metal oxide by the hot graphite,
MO + C _______4.M + CO
as discussed by Ottoway et al. (1.1).
For the halide salts, however; no such mechanism
is available and they vaporise without decomposition. It is for
158

0.4
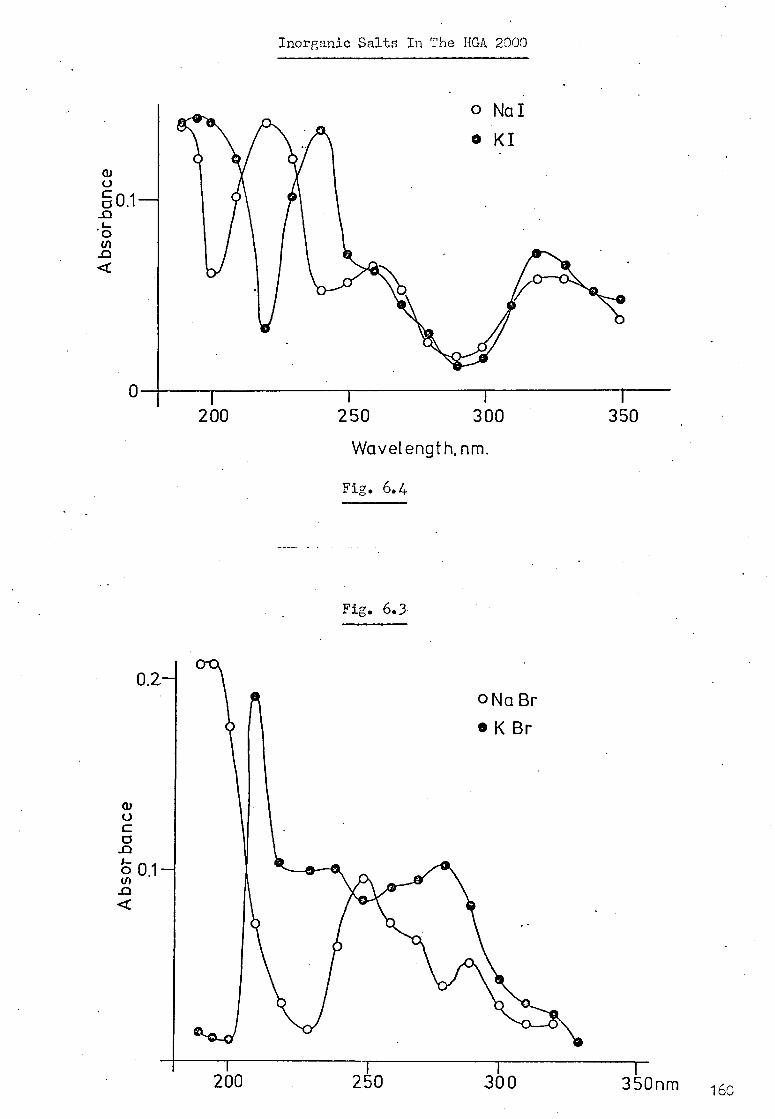
Fig. 6.4
Fig. 6.3
0.2.— o Na Br
• K Br
200 2510
1 300 350nm
Inorganic Salts In The EGA 2000
0
1 200
250 300 350
Wavelength, nm.
160
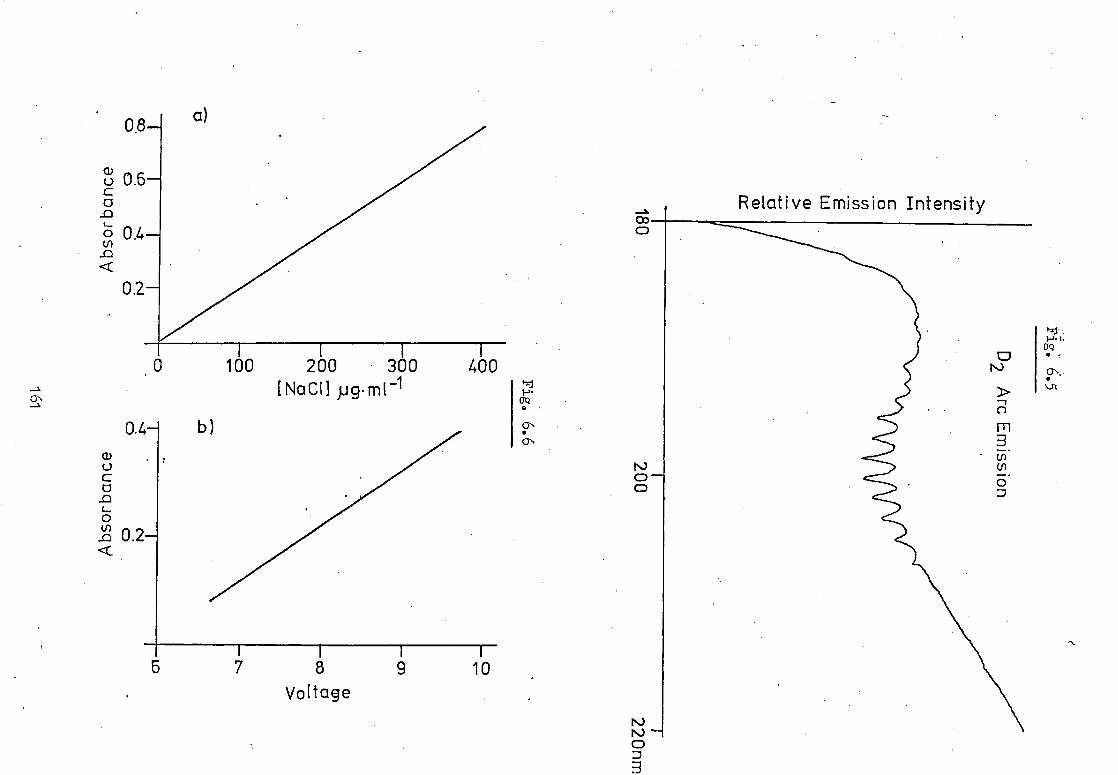
I 1 I 7 8 9 10
Voltage
UOIS
SIW
] O
N
Relative Emission Intensity
0.8— a)
0.6-
0.2—
I 1 1 1 0 100 200 300 400
[NaCl]
0.4— b)
a _o 0"
.1g 0.2—
6

this reason, and their high absorption coefficients, that the
alkali metal halides are a common cause of interference in many
applications of electrothermal atomisation to AAS. The molecular
absorption spectra obtained for the vaporisation of 10p1 aliquots
of the bromides, chlorides and iodides of sodium and potassium
are shown in Figs. 6.2, 6.3 and 6.4, respectively. Again, a
comparison between these spectra obtained here using the HGA 2000
graphite furnace and those of Wood (H2 - N
2 flame) and Koirtyohann
and Pickett (02 - H2 flame) serve to indicate that it is the molecular
diatomic halide which was responsible for the absorption. The
wavelengths of maximum absorption obtained in the molecular spectra
are listed in Table 6.1.
6.5 Absorption Spectra Of Common Inorganic Salts In The Small
Graphite Furnace Atomiser.
The emission spectrum obtained from the
deuterium arc operated under the conditions previously stated
1 and with a nitrogen flow-rate of 11.min through the atomiser
chamber is shown in Fig.6.5. Because of the vitreosil window
fitted to this lamp, no radiation of wavelengths shorter than
180nm was transmitted.
The stock solutions of the inorganic salts
were diluted as required and absorbance vs concentration analytical
curves determined. In all cases (with the exception of the
sulphates, discussed in Section 5.5) no deviation from linearity
was observed for absorbance values below 1.0. A typical calibration
curve is shown in Fig. 6.6 (a) for sodium chloride at 180nm and
the effect of atomising voltage on the absorption from 204tg.m1-1
Cl- as NaC1,at 180nm,in Fig.6.6 (b).
162
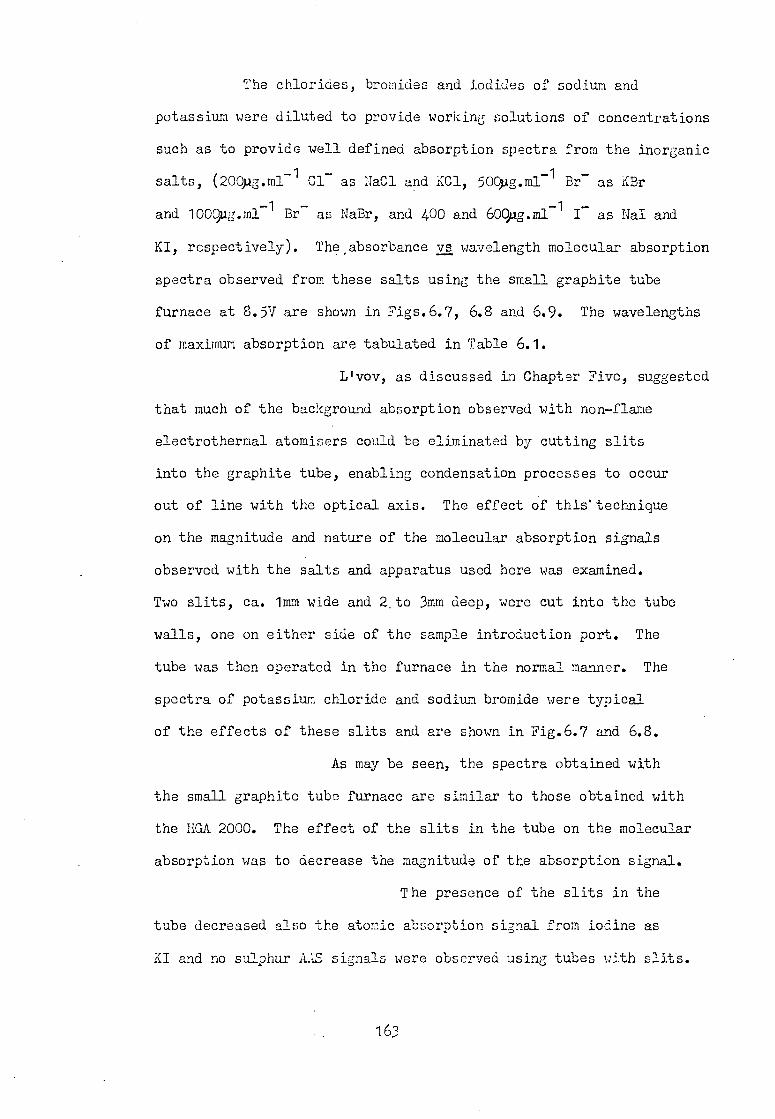
The chlorides, bromides and iodides of sodium and
potassium were diluted to provide working solutions of concentrations
such as to provide well defined absorption spectra from the inorganic
salts, (200,pg.m1 1 Cl as NaC1 and KC1, 500,11g.m1 1 Br- as KBr
and 1000,pg.m1-1 Br as NaBr, and 400 and 601491g.m1-1 I as NaI and
KI, respectively). The,absorbance vs wavelength molecular absorption
spectra observed from these salts using the small graphite tube
furnace at 8.5V are shown in Figs.6.7, 6.8 and 6.9. The wavelengths
of maximum absorption are tabulated in Table 6.1.
Lvov, as discussed in Chapter Five, suggested
that much of the background absorption observed with non-flame
electrothermal atomisers could be eliminated by cutting slits
into the graphite tube, enabling condensation processes to occur
out of line with the optical axis. The effect of this'technique
on the magnitude and nature of the molecular absorption signals
observed with the salts and apparatus used here was examined.
Two slits, ca. 1mm wide and 2.to 3mm deep, were cut into the tube
walls, one on either side of the sample introduction port. The
tube was then operated in the furnace in the normal manner. The
spectra of potassium chloride and sodium bromide were typical
of the effects of these slits and are shown in Fig.6.7 and 6.8.
As may be seen, the spectra obtained with
the smell graphite tube furnace are similar to those obtained with
the HGA 2000. The effect of the slits in the tube on the molecular
absorption was to decrease the magnitude of the absorption signal.
The presence of the slits in the
tube decreased also the atomic absorption signal from iodine as
KI and no sulphur A_1S signals were observed using tubes with slits.
163
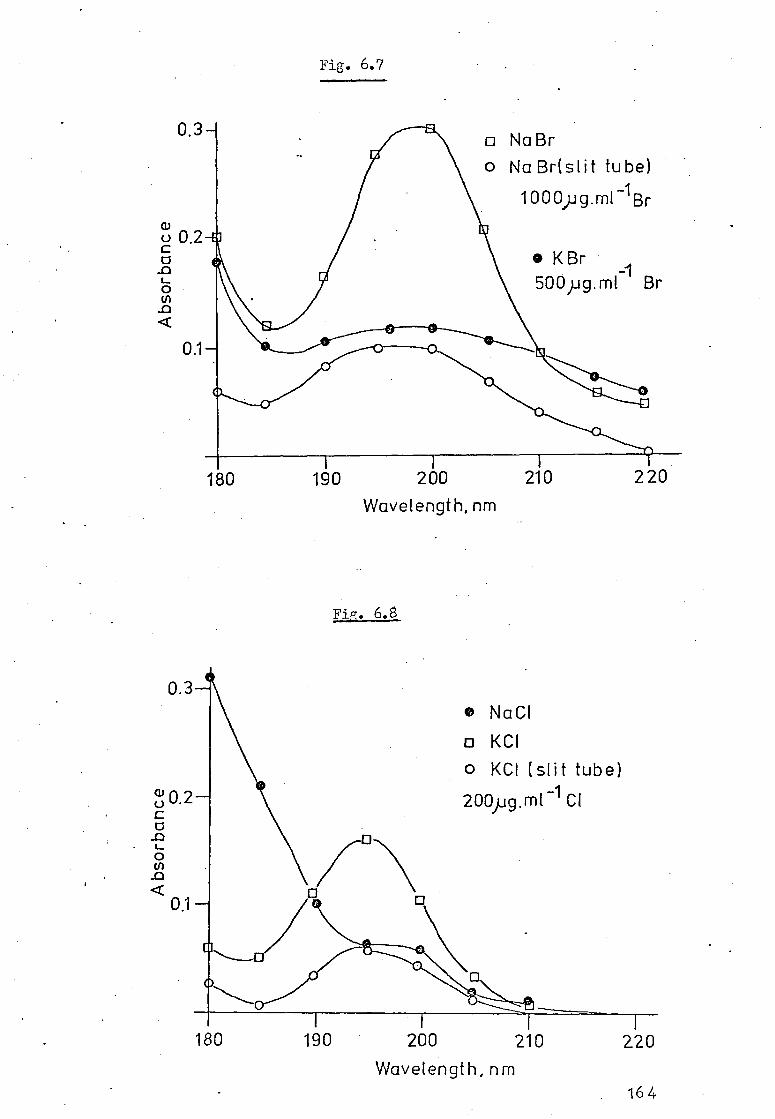
164
2.20 180 190 200 210 Wavelength, nm
1 I 190 200
Wavelength, nm 220 210 180
Fig. 6.8
0.3 ® NaCI o KCI o KCI (slit tube)
200,pg.ml -1 CI
0 cn
0.1
Fig. 6.7
o NaBr o NaBr(slit tube)
1000„pg.m1-1Br
0.3—
KBr 1
500jug.ml Br
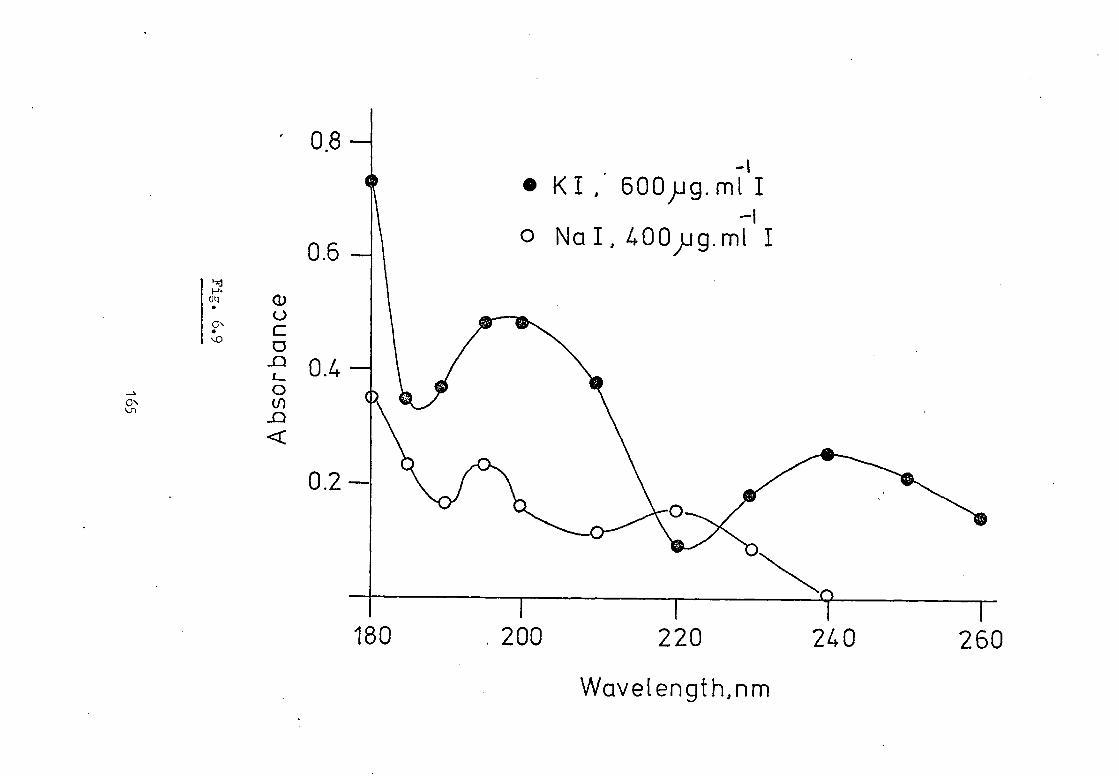
260 180 200 220 240
0.8
• K1 , I
o Na I , 400pg.ml I 0.6
0.2
Wavetength,nm

6.6 Conclusion.
Because of the common occurrence of the alali metal
halides, particularly sodium chloride, in sample matrices or in
solutions after dissolution of samples, it is frequently necessary
to separate the analyte element from these salts before analysis
by AAS. It is clear from the results presented here that the absorption
by such species has definite wavelength dependence, so that the
severity of the observed non-specific absorption by alakali metal
halides varies with the wavelength of the resonance line of the
analyte element to be determined. The use of background correction
minimises the errors observed provided that the interferant is not
present at excessively high concentrations. Ediger and Kerber (135)
have recently reported the minimisation of interferences caused
by molecular absorption in the presence of high concentrations of
sodium chloride by the use of ammonium nitrate addition to the sample,
viz.
NaC1 + NH4NO3
NaNO3
+ NH4C1
The ammonium chloride sublimes in the furnace at 335°C and, as
confirmed in this work, the residual sodium nitrate produces no
absorption over the wavelength range 190nm to 360nm.
Following the completion of the work described
here a paper by Surles and Culver (t36) has been published. This
paper discusses the molecular absorption spectra in the range 200nm
to 400nm, produced by the vaporisation of fluorides, chlorides and
iodides of sodium and potassium using a carbon rod atomiser. Where
comparisons are possible the molecular spectra obtained are similar
to those presented here and are included in Table 6.1.
166
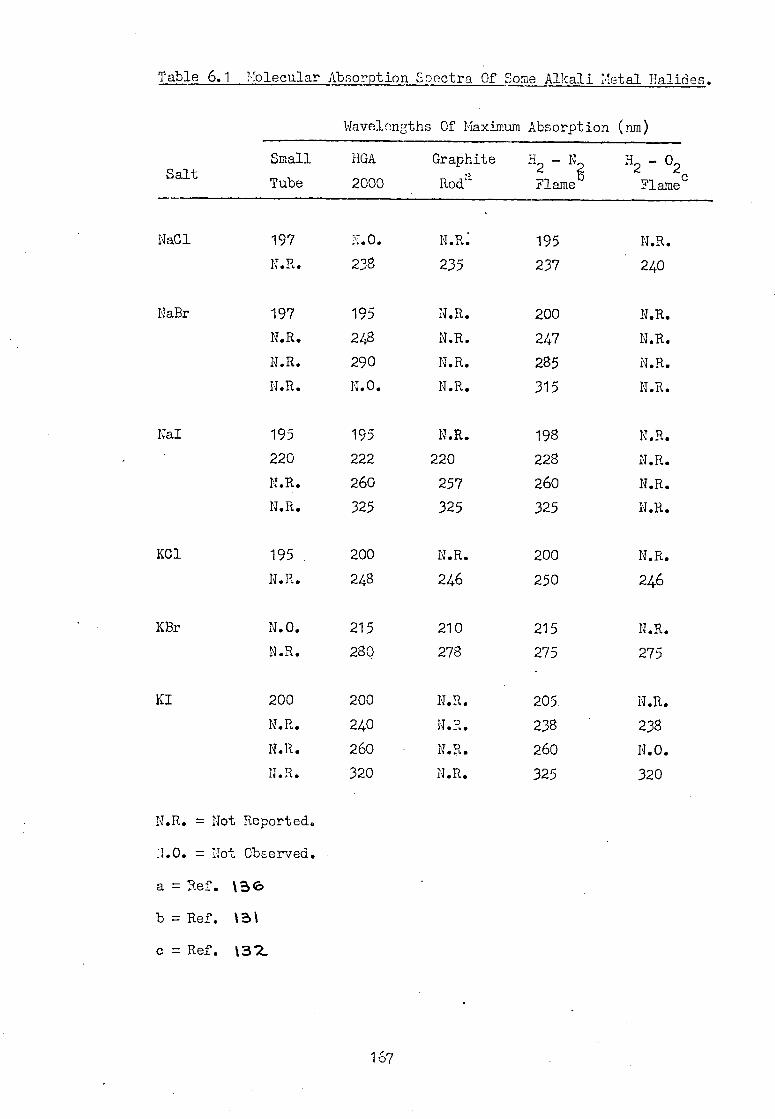
Table 6.1 .Molecular Absorption Spectra Of Some Alkali Metal Halides.
Wavelengths Of Maximum Absorption (nm)
Salt Small
Tube
HGA
2000
Graphite
Rod'
:2 - N22
Flame
H2 - 02 Flamec
NaC1 197 N.O. N.R. 195 N.R. N.R. 238 235 237 240
NaBr 197 195 N.R. 200 N.R. N.R. 248 N.R. 247 N.R. N.R. 290 N.R. 285 N.R. N.R. N.O. N.R. 315 N.R.
Nal 195 195 N.R. 198 N.R. 220 222 220 228 N.R. N.R. 260 257 260 N.R. N.R. 325 325 325 N.R.
KCI 195 200 N.R. 200 N.R. N.R. 248 246 250 246
KBr N.O. 215 210 215 N.R. N.R. 280 278 275 275
KI 200 200 N.R. 205 N.R. N.R. 240 N.H. 238 238 N.R. 260 N.R. 260 N.O. N.R. 320 N.R. 325 320
N.R. = Not Reported.
N.O. = Not Observed. •
a = Ref. 13e
b = Ref. 131
c = Ref. 132.
167

SEVEN
168

7.1 Introduction.
The graphite furnace atomiser is an attractive
atom cell to the analyst employing AAS techniques because of its
often negligible background absorption and emission compared with
flame cells and its capability of atomising many refractory, oxide-
forming elements. However, despite the now widespread and routine
'application of such devices few measurements have been made of the
temperature attained by the atomic vapours produced in a non-flame
cell. Where studies relating to the kinetics and atom producing
mechanisms have been undertaken using graphite atomisers (137,v59),
it has been customary to accept the manufacturers calibration of
the temperature of the furnace and no results have been reported
concerning the variation in furnace temperature within its useful
lifetime. As the performance of a graphite furnace for AAS depends
ultimately on its heating rate and terminal temperature attained
during atomisation this lack of data concerning these systems is
surprising.
This chapter describes the determination of the terminal
temperature attained by the HGA 2000 graphite furnace atomiser at
various applied voltages and the heating rates associated with these
temperature programmes. Finally, a method of monitoring the temperature
of the atomic vapour contained within the graphite furnace is examined
and applied to the atomisation of gallium and indium.
7.2 Terminal Temperatures Attained By The HGA 2000 Graohite Furnace.
The HGA 2000 graphite furnace atomiser employed
in these studies was as described previously. The electrical power
to the furnace was supplied via a commercial transformer system
(Perkin-Elmer Ltd.) and furnace temperature selection achieved by
169

monitoring the readout-meter provided with this unit. This set
temperature was the approximate terminal temperature attained by
the furnace during its heating-cycle. Because of the change in
electrical resistance of a graphite tube throughout its useful
lifetime and because the open nature of this furnace gives rise
to a temperature gradient in the length of the tube it was necessary
to determine independently this terminal furnace temperature and
compare the observed values with the temperature indicated at the
meter.
At temperatures in excess of ca. 600°C a hot body
begins to emit radiation in the visible regions of the spectrum,
a dull red colour being observed. As the temperature increases the
apparent colour changes through yellow to the 'white' associated
with incandescent lamps. The optical pyrometer employs this visible
emission from a hot surface to measure the temperature of the surface
by comparison with a standard, calibrated filament; the disappearing-
filament pyrometer. A Northrup-Leeds optical pyrometer was employed
here.
The terminal temperature achieved by the graphite
furnace varies throughout its length (e.g. the centre is hotter
than the ends) and a reproducible viewing point was selected for
study with the pyrometer. As the sample for AAS is placed in the
furnace at its centre, and it is here that the sample remains until
volatilised, this was the point selected for viewing. By removing
the observation tube from the furnace housing the inside surface
of the graphite tube, directly opposite the sample introduction
port, was visible. The temperature of this spot in the furnace
was determined at various set temperatures ranging from 1000°C to
170

2200°C, in 200° steps, by focussing the radiation from the inner
wall of the furnace at the viewing lens cf the optical pyrometer.
These furnace temperature settings and the pyrometer temperature
measurements were repeated many times during the useful lifetime
of several graphite tubes whilst the furnace was employed for normal
analysis.
A comparison of the set and observed furnace temperatures
is presented graphically in Fig.7.1. It was apparent that the
observed temperature of the furnace deviated from the temperature
selected by upto ± 10% depending on the age of the graphite tube
and the set temperature. The mean observed temperature, throughout
the useful lifetime of the furnace, was between 3% and 7% greater
than the set temperature; the deviation increasing with increasing
temperature.
Because of the deviation in observed and set temperatures
and to avoid confusion the term 'furnace temperature' used in the
remainder of this chapter refers to the optical pyrometer temperature
and not the temperature as provided by the meter on the furnace
power supply. Where reference to the power settings is necessary
the voltage applied across the graphite tube is quoted as this
is independent of the condition of the furnace.
7.3 Temperature—Time Profiles Of The IRA 2000 Furnace.
Findlay et al. Om ) have described a method for
monitoring the furnace temperature with respect to time using
thermocouples placed inside the graphite tube. With this apparatus
temperatures upto 1700°C were measured and considerable temperature
gradients were observed to exist, both radially and axially, in the
HGA 2000 furnace. Most atomic absorption studies, however, are
171
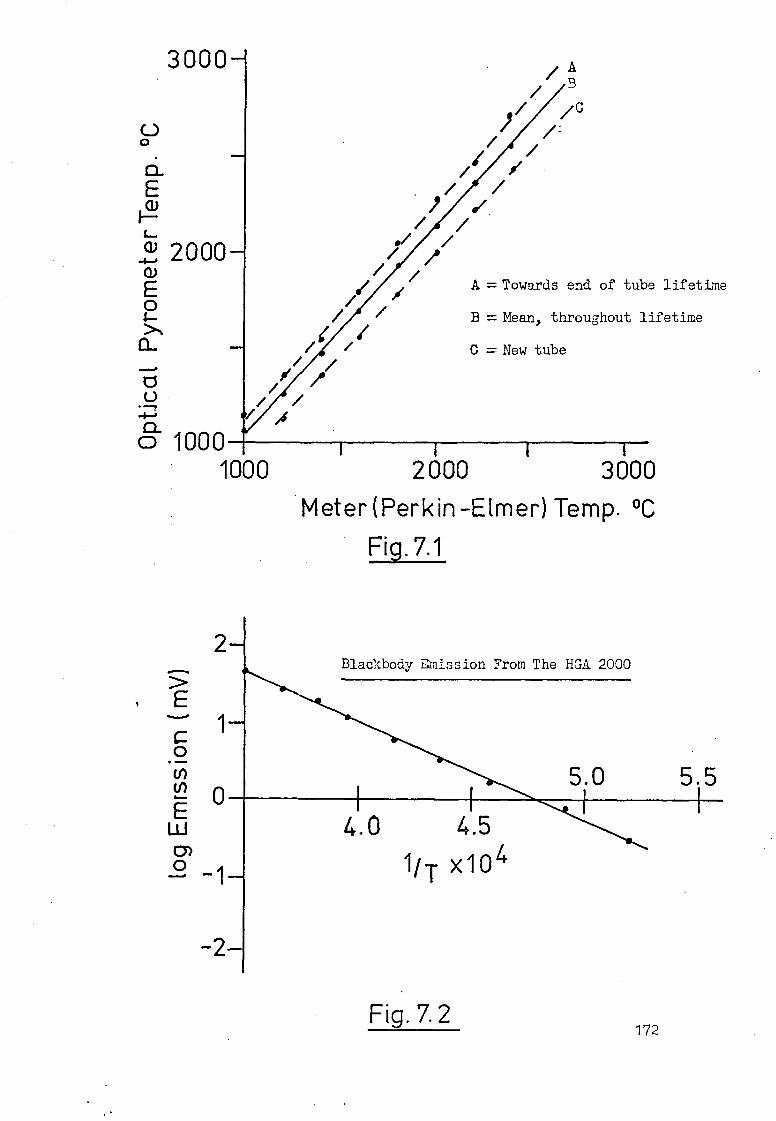
/- 0
3000–
/
/A
/ /0
0
.1 (D 2000– / /
, // E / / A = Towards end of tube lifetime
0 / / / B = Mean, throughout lifetime
>, ‘ Ci / . --
/ •
o 1000 1000 2 000 3000
Meter (Perkin-Eimer) Temp. °C Fig. 7.1
N
L_
/ / C = New tube
2–
E
0
0 E w 0 —1–
Blackbody Emission From The HGA 2000
5.0 5.15
1 1 4.0 4.5
1/ T x104
-2–
Fig. 7. 2 172
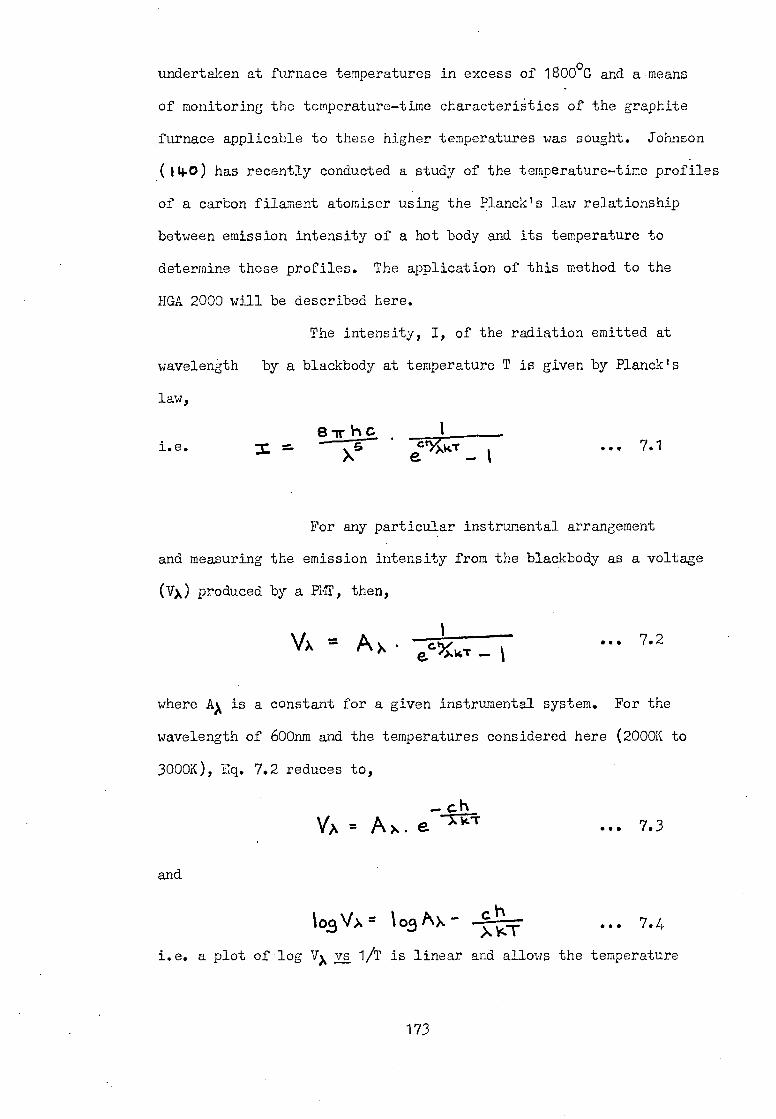
undertaken at furnace temperatures in excess of 1800°G and a means
of monitoring the temperature-time characteriStics of the graphite
furnace applicable to these higher temperatures was sought. Johnson
014.0) has recently conducted a study of the temperature-time profiles
of a carbon filament atomiser using the Planck's law relationship
between emission intensity of a hot body and its temperature to
determine these profiles. The application of this method to the
HGA 2000 will be described here.
The intensity, I, of the radiation emitted at
wavelength by a blackbody at temperature T is given by Planck's
law,
B -lih c i.e. ... 7.1
For any particular instrumental arrangement
and measuring the emission intensity from the blackbody as a voltage
(VV) produced by a PMT, then,
Vi, = A>, . cy ... 7.2
where A). is a constant for a given instrumental system. For the
wavelength of 600nm and the temperatures considered here (2000K to
3000K), Eq. 7.2 reduces to,
VA = A A. e -ricr ... 7.3
and
t0.9 V 103 A>, - >c,t1, k4.7. ... 7.4
i.e. a plot of log Vx vs 1/t is linear and allows the temperature
173
of the emitter to be determined from the emission intensity measured
as voltage from a suitable radiation detector system.
The Perkin-Elmer Model 305B Spectrometer was
operated in the emission mode with a slit-setting N° 3 and constant
gain applied to the PMT. At a wavelength of 600nm the emission
from the furnace was monitored with respect to elapsed time from
the start of the heating cycle and at various applied voltages across
the graphite tube. The emission intensity vs time curves were recorded
on a potentiometric chart recorder the scale of which was set such
that no damping of the signal was observed by the recorder time-
constant. The terminal temperature attained by the furnace was
determined at each applied voltage using the disappearing-filament
optical pyrometer as previously described.
A plot of log(peak emission intensity, mV) vs
1/T (K) is shown in Fig.7.2 and is a straight line. Employing this
linear relationship it was possible to convert the emission intensity-
time curves to temperature-time curves and the results are presented
in Fig. 7.3. Temperatures belcw 10000C were difficult to measure
with an acceptable accuracy using the optical pyrometer and linear
extrapolation to room temperature was assumed. The validity of this
assumption was verified by a heating rate (°/sec) vs (applied voltage)2
plot for this region, Fig. 7.4, which was linear as expected.
7.4 Measurement Of Electronic Excitation Temoeratures Of Atomic
Species By A Two-Line Atomic Absorption Method.
Browner and Winefordner(144 )have described
a two-line atomic absorption technique for the measurement of flame
temperatures which is applicable to non-flame atomisation devices.
It is a straightforward atomic absorption method, using an uncalibrated
174
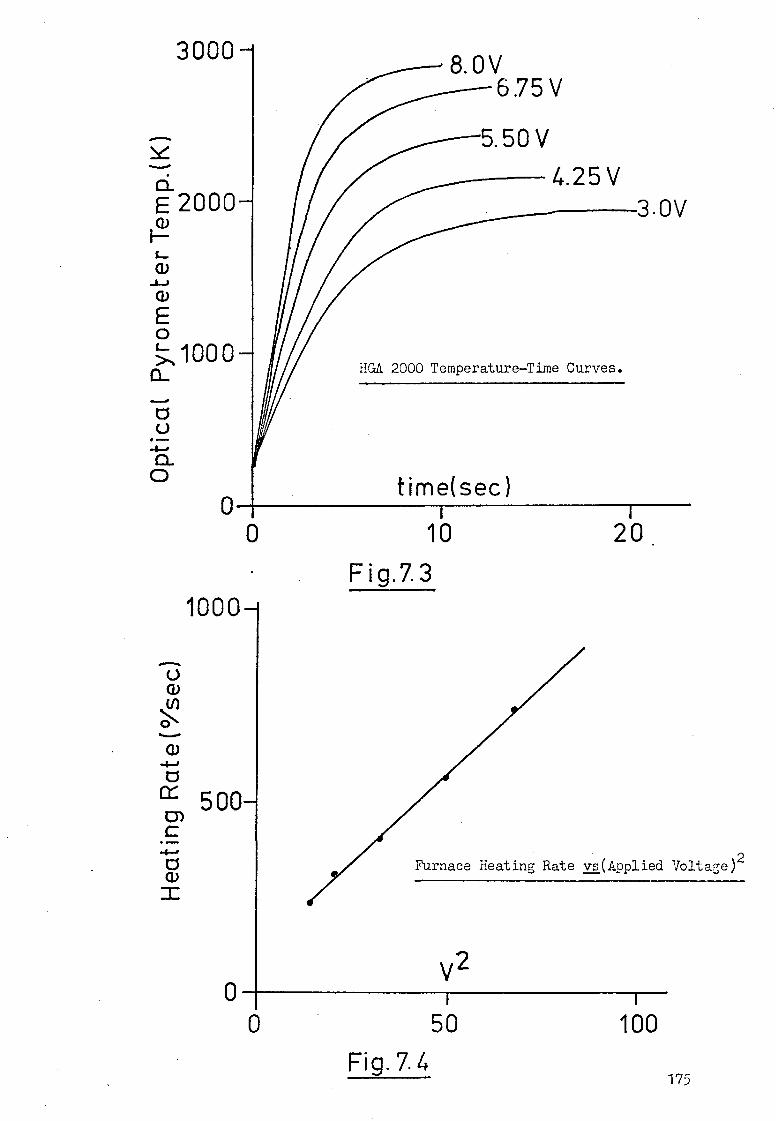
20. 10
Fig.7.3 1000—
Furnace Heating Rate vs(Applied Voltage)2
V2 0 I
0 50
Fig.7.4 175
100
3000
ci E 2000
a) a) E 0 '5,1000 C-
0 U
Ct. 0
8.0V 6.75V
5.50V
4.25V 3.0V
HGA 2000 Temperature—Time Curves.
time(sec)
Y2.
La e.2 1. c)a. n a_ X3)]
c c,2
..o 7.7
continuum light source, that is relatively simple, rapid and
reasonably accurate. The technique is applicable to any atomic
absorption spectrometer without any modification. The theoretical
basis of this two-line atomic absorption temperature measurement
technique is briefly discussed.
The absorption factor,M, is defined as
the fraction of incident radiation absorbed by the analyte atoms,
i.e.
Absorbed radiation intensity = I0 -I =AI ... 7.5 Incident radiation intensity
Io I
For atomic absorption using a continuum emission source two limiting
cases may be considered. In the limiting case of low optical density,
oc --= ... 7.6
where e and m are the charge and mass of the electron respectively,
c is the velocity of light, 1 is the absorption path length,ikois
the peak wavelength of absorption, n is the concentration of atoms
at the lower energy level involved in the transition, f is the
absorption oscillator strength and s is the spectral bandwidth of
the monochromator.
At high optical densities Eq.7.6 becomes,
whereapis the Doppler half-width of the line and a. is the damping
constant, defined by,
0_ = #
176
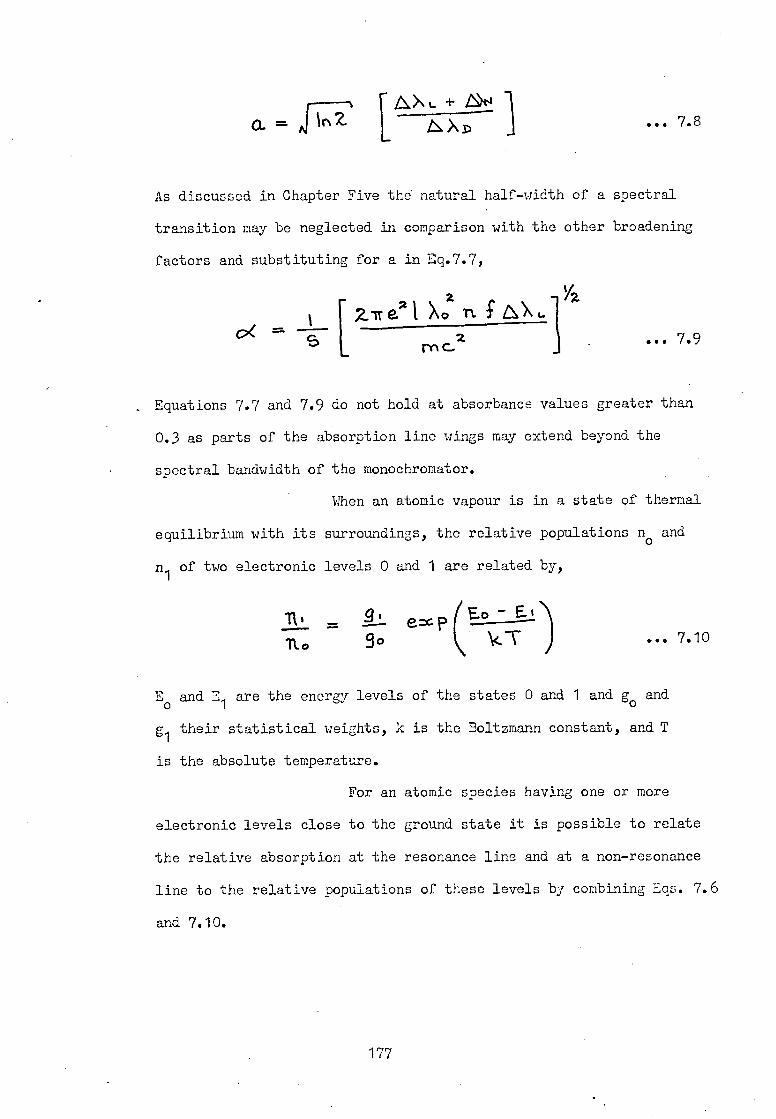
Ct. = 11,2 r AX + NA4
... 7.8
As discussed in Chapter Five the natural half-width of a spectral
transition may be neglected in comparison with the other broadening
factors and substituting for a in 1:q.7.7,
0.< 1 2.-Tr a2t -n. S 2 rn
V2
... 7.9
Equations 7.7 and 7.9 do not hold at absorbance values greater than
0.3 as parts of the absorption line wings may extend beyond the
spectral bandwidth of the monochromator.
When an atomic vapour is in a state of thermal
equilibrium with its surroundings, the relative populations no and
n1 of two electronic levels 0 and 1 are related by,
Tt I no
90 emc (E° E kV ... 7.10
Eo and '
1 are the energy levels of the states 0 and 1 and go
and -
g1 their statistical weights, k is the Boltzmann constant, and T
is the absolute temperature.
For an atomic species having one or more
electronic levels close to the ground state it is possible to relate
the relative absorption at the resonance line and at a non-resonance
line to the relative populations of these levels by combining Eqs. 7.6
and 7.10.
177

i.e. At low absorbance values,
T Et — E.o
k In 1( 91c-1 (L)2(_c_=.21 9000 A X01 04, Ij
... 7.11
and at high absorbance values,
T Et — Eo
IC trIPLi)(112V4212( AXL‘ 9 -fp Xb 04, ... 7.12
where Ocand V. referto the relative absorption signals at the lines
of wavelength Xo and XI whose lower states have energies Eo and E1
and whose Lorentz half-widths are LXL. andOkLi. To achieve optimum
conditions for measuring p( the energy separations of 0 and 1 should
be less than 1eV for flame temperatures below 4000K.
Of those elements with suitable energy levels
and f-values the lines of the first term of the sharp series of
gallium (403.30nm and 417.20nm), indium (410.18nm and 451.13nm), and
thallium (377.57nm and 535.05nm) were the most suitable for practical
measurements. The physical constants relating to these transitions
are shown in Table 7.1. The ratio of 06/0c, for each line pair
is an exponential function of temperature, Fig.7.5. In practice °C/,
may be measured with good precision over the range 1 G (44es 4. 5
and this restricts the working ranges of temperature for the elements
to:
Gallium, 650 to 2200K
Indium, 1220 to 3500K
Thallium, 3650 to 7750K
Without knowledge of the Lorentz half-
widths the low absorbance limiting case must be used for temperature
178
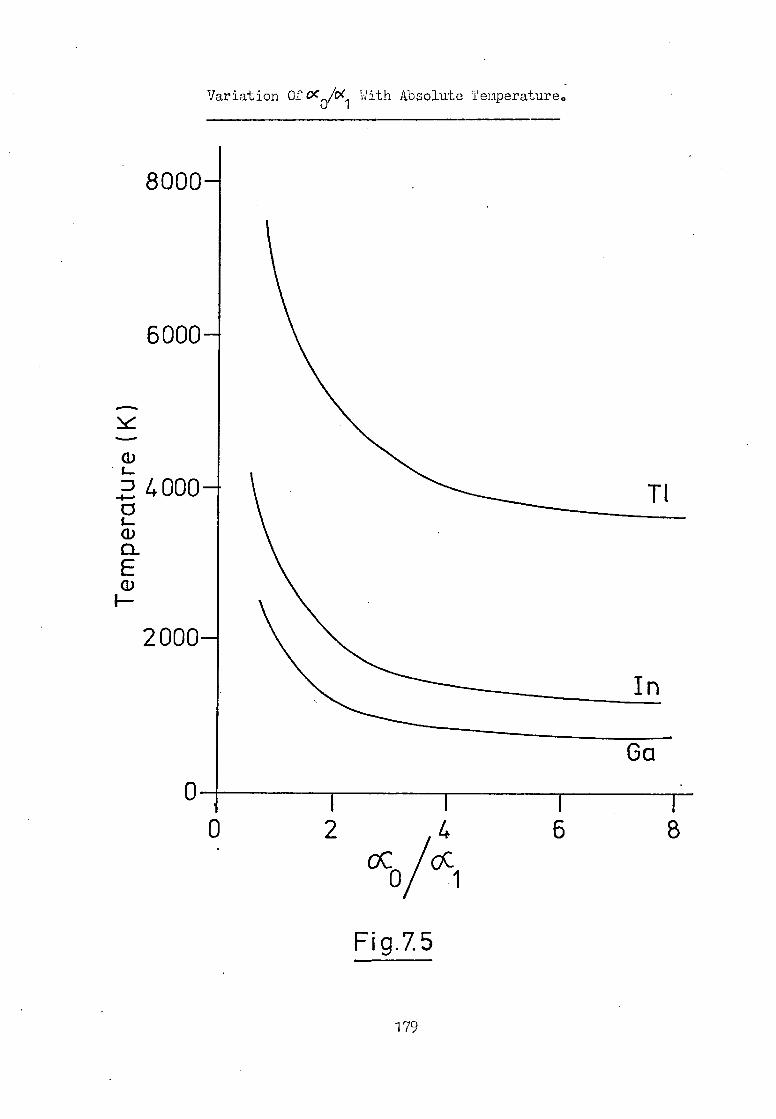
Ga
Variation Ofc< With Absolute Temperature,
8000—
6000—
a)
' 4000— 5 a)
E a)
2000—
T1
0 2 4 6 GC
0/X,
1
Fig.7.5
179
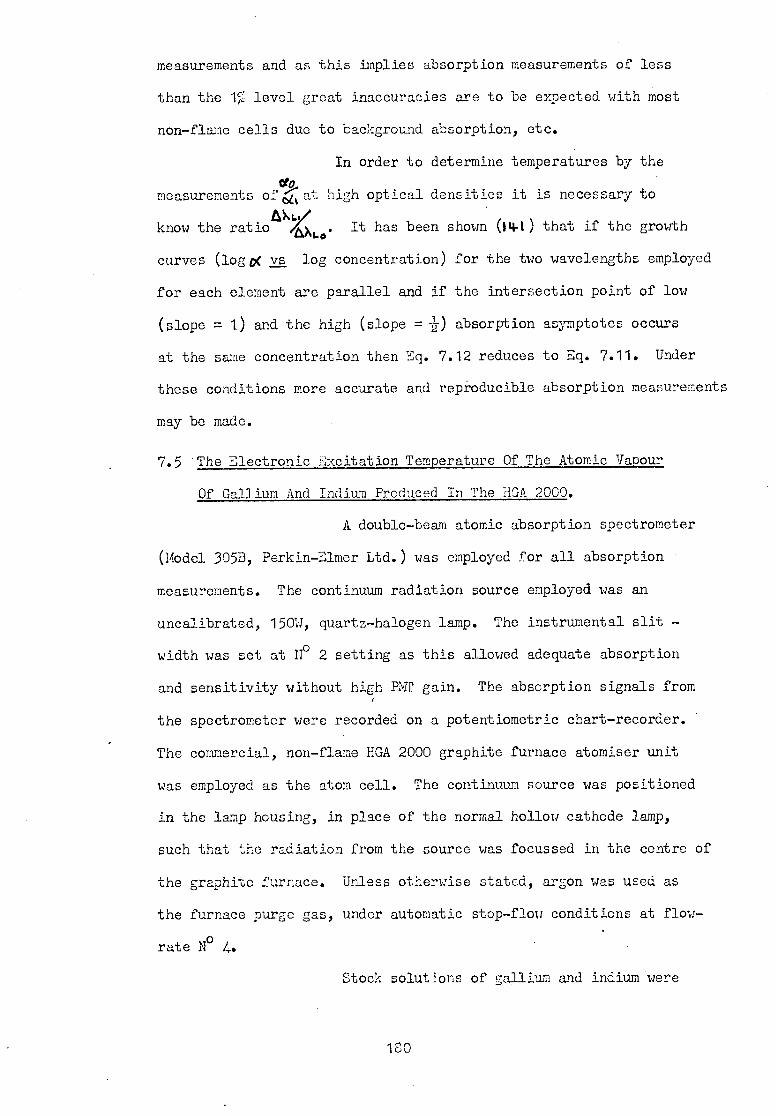
measurements and as this implies absorption measurements of less
than the 1 level great inaccuracies are to be expected with most
non-flame cello due to background absorption, etc.
In order to determine temperatures by the
measurements of ccit at high optical densities it is necessary to
know the ratio 4.1,1 ,/,' 1.0. It has been shown (OW that if the growth
curves (logo( vs log concentration) for the two wavelengths employed
for each element are parallel and if the intersection point of low
(slope = 1) and the high (slope =. 0 absorption asymptotes occurs
at the same concentration then Eq. 7.12 reduces to Eq. 7.11. Under
these conditions more accurate and repi.oducible absorption measurements
may be made.
7.5 'The Electronic Excitation Temperature Of The Atomic Vapour
Of Gallium And Indium Produced In The HGA 2000.
A double-beam atomic absorption spectrometer
(Model 305B, Perkin-Elmer Ltd.) was employed for all absorption •
measurements. The continuum radiation source employed was an
uncalibrated, 150W, quartz-halogen lamp. The instrumental slit -
width was set at N° 2 setting as this allowed adequate absorption
and sensitivity without high PMT gain. The absorption signals from
the spectrometer were recorded on a potentiometric chart-recorder.
The commercial, non-flame HGA 2000 graphite furnace atomiser unit
was employed as the atom cell. The continuum source was positioned
in the lamp housing, in place of the normal hollow cathode lamp,
such that the radiation from the source was focussed in the centre of
the graphite furnace. Unless otherwise stated, argon was used as
the furnace purge gas, under automatic stop-flow conditions at flow-
rate N° 4.
Stock solutions of gallium and indium were
180

prepared from the pure metals by dissolution in ca. 3C% analytical
% grade nitric acid. The stock solutions (10,009mg.m1 1) were diluted
as necessary using distilled water. A 10Al aliquot of the required
sample was transferred to the graphite tube using an Eppendorf
micropipette. The solution was dried at 100°C for ca. 30sec prior
to atomisation with a voltage of 5.5V applied across the furnace.
As a precaution against monochromator drift during
the absorption studies with a continuum source the following procedure
was employed for the indium solution analysis. Using an indium
hollow cathode lampline source the line at 410.18nm was selected
and the monochromator set. The HCL was replaced by the continuum
lamp and the absorption from an indium solution determined from two
samples of equal indium concentration. The 451.13nm indium line
was then selected, again using the HCL, and the absorption by the
same concentration of indium solution determined. The 410.18nm
line was re-selected and a second concentration of indium solution
examined. By this procedure of constant checking of the wavelength
with the aid of an indium HCL it was expected problems with wavelength
drift to be negligible. Alternate measurements ofa at the resonance
line and non-resonance line ensured that any change in the heating
rate of the furnace associated with its use were smoothed-out.
Because of the change in furnace properties with use (as described
in Section 7.2) the absorption measurements were repeated many times
(more than ten) over a period of several weeks and the mean absorption
peak heights recorded for various indium solution concentrations.
An identical procedure was employed for the gallium absorption
studies.
Growth curves were constructed for both
181

metals at each line and these are shown in Figs.7.6 and 7.7 for
gallium and indium respectively. The inflection points of these
curves are shown in Table 7.2.
The inflection points for both metals
occurred at the same concentration for the resonance and non-resonance
lines; therefore the approximation to reduce the high absorption
equation (Eq.7.12) to the form of the low absorbance equation (Eq.7.11)
could be applied. Substituting the constants from Table 7.1 into
Eq. 7.11 for gallium and indium prOvides Eqs. 7.13 and 7.14.
Indium
16.3_ ___ T(K) = 7;;/ ) log(1.08 06
Gallium ... 7.13
T(K) — 1383 ... 7.14 log(2.637%)
The growth curve plots shown in Figs.7.6
and 7.7 include the atomic vapour temperatures determined using the
points of the curves and Eqs. 7.13 and 7.14. The results are
summarised in Table 7.3.
Using both gallium and indium as the sensing
elements the atomic vapour temperatures in each case were similar
and were ca. 15% below the furnace wall temperature. As mentioned
previously the working temperature range for gallium is 65000 to
220000 and hence the poorer precision of the results obtained with
this metal are understandable. The two-line atomic absorption
temperature measurements in Table 7.3 were determined by recording
the absorption peak heights. Thus, no information relating to the
variation in temperature of the atonic vapour produced ins the7rapnits
furnace with respect to time was obtained. From the above results
it cannot be said that the recorded temperatures were the maximum
182
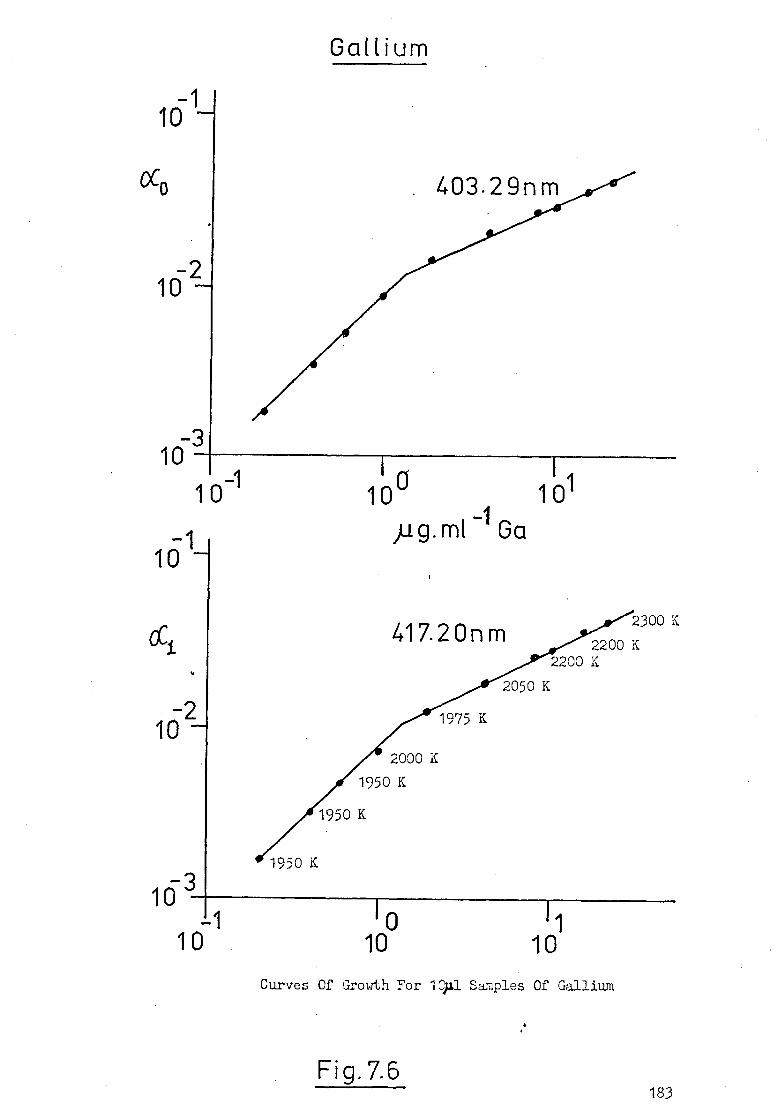
1975 K 162—
lo 10 10
10 —
417.20nm 2300 K
2200 K 2200 K
2050 K
2000 K
1950 K
1950 K
1950 3 10
10-1
Gallium
101 —
103
10 -1 10 10
p 1g.m1 Ga
Curves Of Growth For 14L1 Samples Of Gallium
Fig. 7.6 183
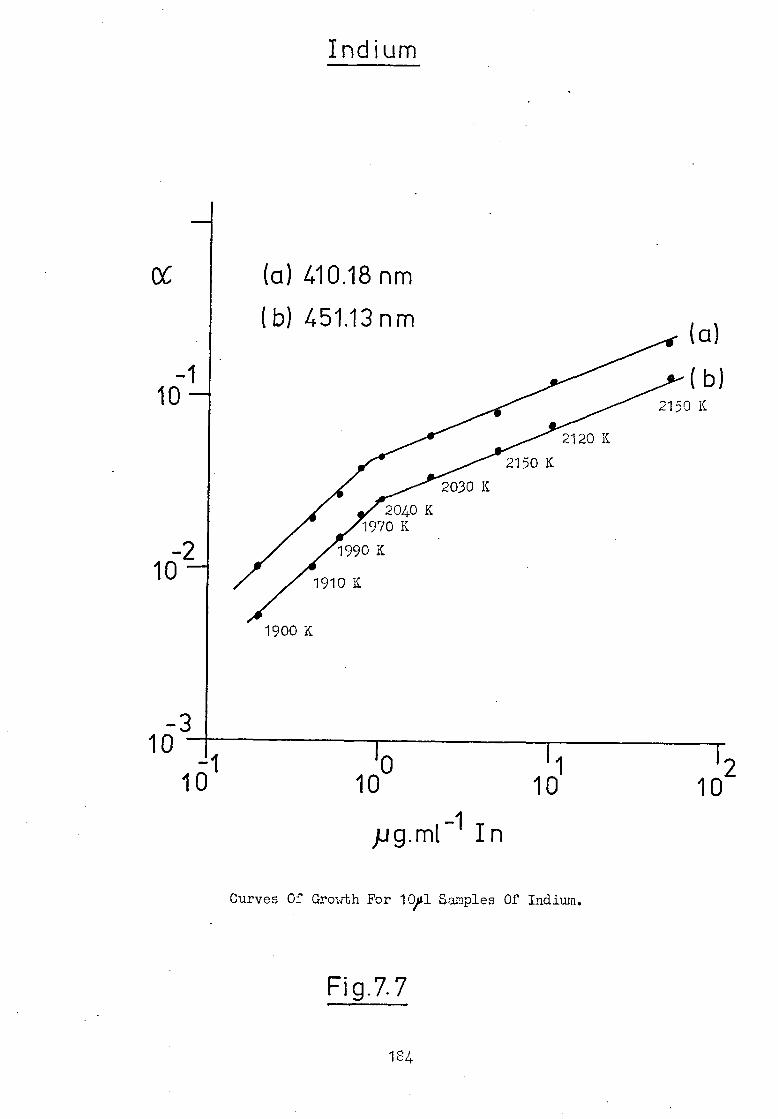
(a) 410.18 nm
(b) 451.13nm
oc
-2 10
1900 K
Indium
-3 10 10 1 1 1 2 -1
10 10 10 10
pg.mt 1 In
Curves Of Growth For 10,1 Samples Of Indium.
84.

Table 7.1 Physical Constants For Ga, In and Tl.
Element Wavelength (nm) gf Transition (cm-1)
Gallium 403.29 0.258 0 - 24,789
417.20 0.405 825 - 24,789
Indium 410.18 0.288 0 - 24,373
451.13 0.628 2,213 - 24,373
Thallium 377.57 0.250 0 - 26,478
535.05 0.540 7,793 - 26,478
Table 7.2 Inflection Points For Growth Curves.
Element
Wavelength (nm) Inflection Point (pg;m1-1)
Gallium 403.29 1.5 417.20 1 . 5
Indium 410.18 1.0 451.13 1.1
185
atomic temperatures but merely the atom temperatures corresponding
to maximum absorption.
An experimental method for the determination
of the temperature-time characteristic profiles of an atomic vapour
produced in a graphite furnace and the results obtained are presented
in the next section.
7.6 Temperature-Time Profiles Of An Atomic Vapour In The HGA 2000.
Because of the useful working range (1220K to
3500K) indium was selected as the study element. A standard solution
of.2yg.m1 -1 indium was employed for all absorption measurements.
A logl aliquot of the 2yg.m1-1 indium solution
was pipetted into the graphite tube and following the drying stage
(30sec at 100°C) the potentiometric chart recorder and atomisation
programme were activated simultaneously. Thus an absorption vs time
profile was recorded. The alternate resonance and non-resonance
line wavelength selection previously discussed in Section 7.5 was
employed to minimise instrumental drift.
The absorption-time profiles were obtained
for the indium resonance line (410.18nm) and non-resonance line (451.13nm)
at various applied voltages across the graphite tube. 04 was
measured at various times from the absorption-time profiles and
hence an atomic vapour temperature-time profile determined at each
of the applied furnace voltages.
The resultant temperature-time profile curves
of the indium atomic vapour in the HGA 2000 at applied voltages
across the furnace of 4.25V, 5.507, 6.757 and 8.00V are shown in
Figs. 7.8 (a), (b), (c) and (d) respectively. Also included with
these figures are the temperature-time curves for the furnace as
determined with the optical pyrometer. Finally, as a further comparison,
186

187
10 12 I i I 1 2 4 6 8
time (sec)
—0.03
—0.02
—0.01
2 000—
1000—
2 4 6 8 time(sec)
10 12
3000—
2000
6-1 000 - E a)
451.13nm
(.)
0 _D
—0.02
—0.01
4.25 V
Fig. 7.8

0 21 4
I 61
time (sec) Fig.7.8
8 10 12
188
6.75 V Furnace Temp.
2000—
Atom Temp.
1000—
410.18nm
451.13rim 1 8 10
Furnace Temp.
ci.. E 0 a) 3 000
2 4 8.0 V
6
2000— Atom Temp.
1000—
410.18nm
451.13nm
—0.03
_0.02
—0.01
12
—0.03
—0.02
—0.01
Abs
orba
nce
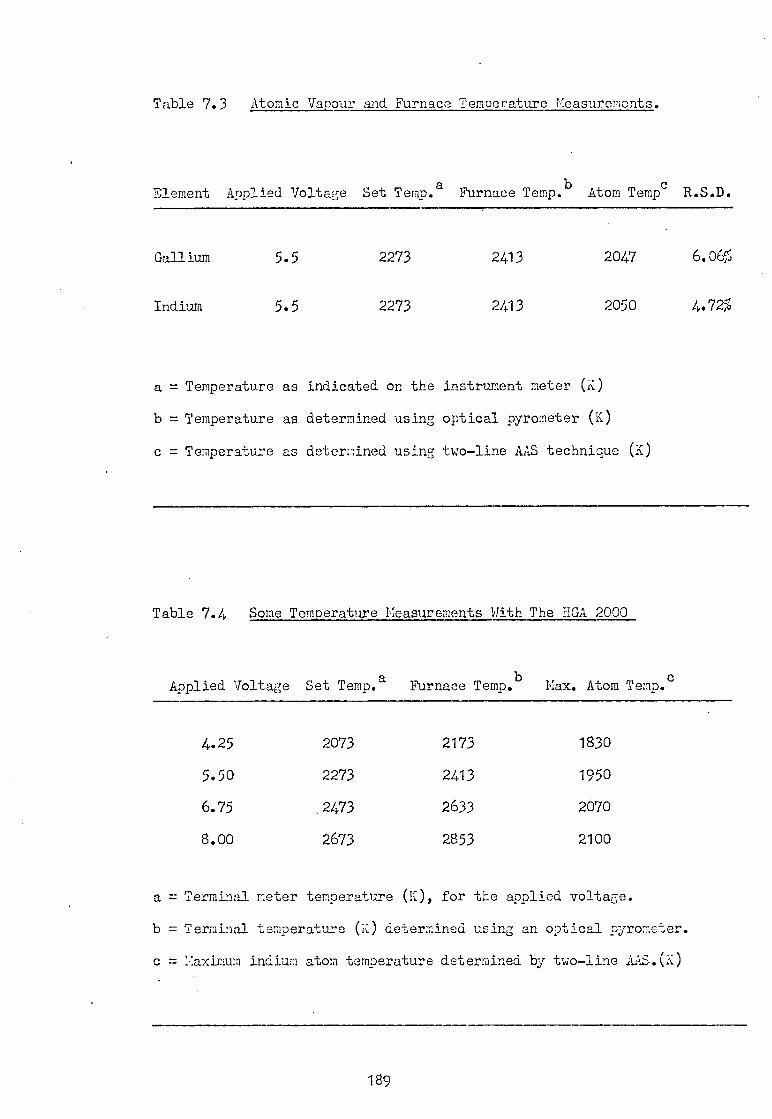
Table 7.3 Atomic Vapour and Furnace Temperature Measurements.
element Applied Voltage Set Temp.a Furnace Temp.b
Atom Tempc
R.S.D.
Gallium 5.5 2273 2413 2047 6.06%
Indium 5.5 2273 2413 2050 4.72%
a = Temperature as indicated on the instrument meter (K)
b = Temperature as determined using optical pyrometer (K)
c = Temperature as determined using two-line AAS technique (K)
Table 7.4 Some Temperature Measurements With The HGA 2000
Applied Voltage Set Temp.a Furnace Temp.b Max. Atom Temp.c
4.25 2073 2173 1830
5.50 2273 2413 1950
6.75 . 2473 2633 2070
8.00 2673 2853 2100
a = Terminal meter temperature (K), for the applied voltage.
b = Terminal temperature (K) determined using an optical pyrometer.
c = Maximrm indium atom temperature determined by two-line AAS.(K)
189
the absorbance-time profiles are included for the resonance and
non-resonance absorption processes. Some significant results obtained
from these curves are presented in Table 7.4.
The atomic vapour temperature-time profiles
were of similar distribution to the absorption-time curves,i.e.
rising rapidly to a maximum value, corresponding to maximum absorption
or temperature and falling to lower absorption or temperature values
more gradually with increasing time. This decay, however, was less
pronounced for the temperature-time curves than for the absorption-
time profiles.
7.7 Discussion And Conclusion.
The temperature-time characteristics of
a resistively heated graphite electrode (such as a rod or tube
furnace) depend on the applied voltage, electrode length and cross-
sectional area, and the density, specific heat, thermal conductivity,
resistivity and emissivity of the electrode material. The electrical
power supplied to a graphite furnace, PIN, may be dissipated by
conduction, Pc, and radiation, PR, as well as supplying power to
raise the furnace temperature, PT, i.e.
PIN = PT + PR + PC
Many of the functions controlling the
magnitude of these power terms are themselves dependent and any
theoretical solution of the nature of the temperature-time profiles
of graphite furnaces must take this into account. Cresser and Mullins
Oka) applied a simplified theoretical approach to calculate these
profiles for graphite and tungsten filaments. The temperature-time
characteristic curves shown in Fig.7.3 for the HGA 2000 graphite
190
tube atomiser were similar to those obtained by Cresser, i.e. a
linear relationship existed between furnace temperature and time
until temperatures were reached when power losses due to radiation
and thermal conduction became significant.
The twoline atomic absorption method of
temperature determination has been applied to the study of the atom-
isation of gallium and indium in the HGA 2000 graphite furnace.
Bratzel and ChaRrabarti ( i4-3) applied this method from peak-absorption
measurements to the determination of temperatures of atomic vapours
produced by graphite filament and graphite rod atomisers. Their
studies indicated that gallium gave higher atomic vapour temperatures
than indium; for indium the concentrational location of the inflection
points between the low and the high absorption portions of the growth
curves were not the same for the resonance and non-resonance lines
and low absorption figures only could be used. The higher temperature
achieved for gallium was attributed by these workers to the greater
boiling point (2676K) of this metal than that of indium (2353K),
implying that because gallium is in direct contact with the surface
of the rod for a longer time, the temperature attained was greater.
The temperature studies reported here using
the EGA 2000 graphite tube show similar temperatures for both gallium
and indium (Table 7.3) and both species fulfilled the equilibrium
condition of similar concentrational inflection points between
the resonance and non-resonance transitions in their growth curves.
These facts probably relate to the increased tendancy to thermal
equilibrium using the larger graphite tube atomiser and the increased
atom residence times associated with these systems.
Temperature measurements derived solely
from peak absorption methods provide no information concerning the
191
change in atom temperature with time during the heating cycle of a
furnace. Using indium as the study element temperature-time profiles
of the atomic vapour were determined for various applied voltages
across•the graphite tube, Fig.7.8. In all cases the mean temperature
of the atomic vapour in the furnace increased with the increase
in furnace wall temperature, achieved a maximum temperature at the
same time as the absorption maximum occurred and finally tailed-off
in a manner similar to, but less dramatic than, the absorption curves.
L'vov (116 ) has shown that the atomic absorption signal duration
using a tube furnace is controlled mainly by the rate of atom-loss
by diffusion from the furnace. Because of the open nature of the
HGA 2000 tube furnace a severe temperature gradient is likely to
exist along the length of the hot tube and the decreasing rate of
atomic vaoour temperature following its maximum value may be attributable
to the diffusion process controlling the absorption curve. That
this decreasing rate is less severe than observed for the absorption
process may be due to collisions with the hot furnace walls or
purge-gas molecules or atoms.
A study of the temperature-time curves employing
various purge-gases (e.g. N2, Al.., Hel Ar-H2, etc) would provide
further information on atom formation and residence processes in
non-flame, tube furnaces.
192

EIGHT
193
8.1. Introduction.
Analytical atomic spectrometry depends for its
sensitivity and selectivity on the separation of the required spectral
lines from any background spectrum and the detection and monitoring
of this radiation of interest. For example, the selectivity of
atomic emission analysis is subject to the ability to isolate the
analyte emission from any source background emission or sample
matrix emission. The sensitivity of A7_,S is controlled ultimately
by the capability of the detector to monitor this required emission.
Although in AAS the atomic vapour produced in the flame or electrothermal
cell serves as a very narrow bandpass filter such that absorption
only occurs at the resonance lines emitted by the source, a dispersion
element or filter is required to isolate these resonance transitions.
As discussed in Chapter One the most common dispersion
element and detector assembly for analytical spectrometry is the
monochromator and photomultiplier—tube arrangement. Whilst these
systems are relatively simple when concerned with visible and middle
ultraviolet radiation, in the vacuum ultraviolet far more sophisticated
apparatus is required. Several workers have described the adaptation
of commercial spectrophotometers to the region 180nm to 200nm,
usually by simply removing the atmospheric oxygen from the monochromator
by inert gas purging. However, in general, these techniques for
extending the wavelength range of the apparatus are of little value
at wavelengths shorter than 180nm. At these low wavelengths ent-
rainment of oxygen and water vapour in the monochromator and optical
path causes a severe loss in transmission and vacuum systems are
normally required.
The atoms of many elements, including the halogens,
194

carbon, sulphur, oxygen, nitrogen, phosphorus and mercury emit
intense resonance line radiation in the region 120nm to 200nm.
The possibility of providing a simple, non-dispersive system for
the detection of radiation from the atomic line emission of these
elements would be attractive for their detection and determination
at these low wavelengths by the techniques of atomic emission,
absorption and fluorescence spectrometry. By analogy with the
advantages of the adoption of non-dispersive detection systems
rather than grating or prism monochromator-detectors in analytical
atomic spectroscopy in the near u.v. and visible regions of the
spectrum, the use of a non-dispersive detection system in the vacuum
ultraviolet might be expected to yield advantages of simplicity,
large aperture and suitability for operation in simultaneous multi-
element analysis.
This chapter discusses the theory and describes
the construction, use and preliminary evaluation of photoionisation
detectors for the detection of radiation in the Schumann U.V. from
a microwave excited argon plasma at atmospheric pressure or from
a flow-through demountable hollow cathode lamp source. The photo-
iOnisation detector (PID) appears to offer the possibilities for
non-dispersive spectrometry in the vacuum ultraviolet region.
These detectors can be constructed to detect radiation in the far
ultrviolet regions of the spectrum and their useful properties
include high spectral selectivity, high quantum efficiencies and
very low noise levels. A typical PID consists of a chamber containing
a gas or vapour at low pressure and two electrodes across which
a constant d. c. potential is applied. When the chamber is irradiated
by photons whose energy is sufficient to cause ionisation of the
195
molecules of the gas or vapour an ionisation current is produced
and may be registered in the external circuit. The magnitude of
the current is proportional to the incident photon flux at those
wavelengths capable of causing ionisation. The spectral response
of a PID is controlled on the short wavelength (high energy) side
by the transmission characteristics of the material from which the
window is made and on the long wavelength (low energy) side by the
photoionisation threshold of the filler gas or vapour. By careful
selection of the window material and the filler gas, detectors with
a spectral bandpass of only a few nanometres may be constructed
to detect radiation in the wavelength range 105nm to 200nm. They
may be made to have large optical aperture, are 'solar—blind' and
may be rugged and compact.
To date the use of such detectors has been
limited to rocket use 045.) including observations of the solar
spectrum, and the determination of molecular oxygen densities in
the atmosphere by absorption measurements and the intensity of
solar Lyman—gemission and adjacent u.v. emission lines, (144,14(7).
Although Chubb and Friedman (141) have described the determination
of water vapour by its absorption at 121.6nra in air and Strober et
al. (448) have described commercially available PID chambers to
detect radiation in the region 105nm to 140nm.
8.2 Theory of Photoionisation Detectors.
It has been previously mentioned that the spectral
response of a PID is dependent on the transmission characteristics
of the window material employed and the photoionisation characteristics
of the filling gas or vapour. Fig.8.1 shows schematically a typical
parallel plate photoionisation chamber. A quantum of radiation
196

Fig. 8.1 The Action Of A ?ID.
by
I. C
C 0
PID Action
Fig.8,2 Current—Voltage Characteristics.
gas gain"
plateau'
C
Applied Voltage
197

transmitted by the window, of sufficient energy to promote ionisation
in the gas contained within the chamber, will produce an ion-pair
if the radiation is absorbed. Provided a minimum voltage (V1) is
applied between the plate electrodes these charged species will be
collected by the electrodes and a current will flow in the circuit.
If the applied voltage (V) is less than V1 recombination of the
ion-pairs is probable and the ion-collecting efficiency is impaired.
a) The Current Produced by a PR).
We can define the photoionisation
efficiency, or photoionisation yield, (t), as the number of ion-
pairs produced per photon absorbed and, for incident radiation of
wavelengths shorter than the. ionisation threshold of the gas,
is approximately unity for many gases and vapours. (It is interesting
to note that should the absorbed radiation be sufficiently energetic
to cause doubly ionised species then r may be greater than unity). Thus the current, i (amperes), generated by the BID is proportional
to the number of ion-pairs, Ni, produced by the incident radiation
which, in turn, is proportional to the number of photons per second
absorbed, N , by the gas and the photoionisation yieldlt.
i.e.
8.1
The absorption of the radiation by the gas or vapour in the PID is defined
by the Beer-Lambert Law,
I = Io. exp ( - dt.n.l ) 8.2
. Where I (photons.sec 1 ) is the intensity of the incident radiation
entering the gas, I is the transmitted radiation and n is the number
of atoms or molecules of gas per unit volume in the cell of length 1.
198
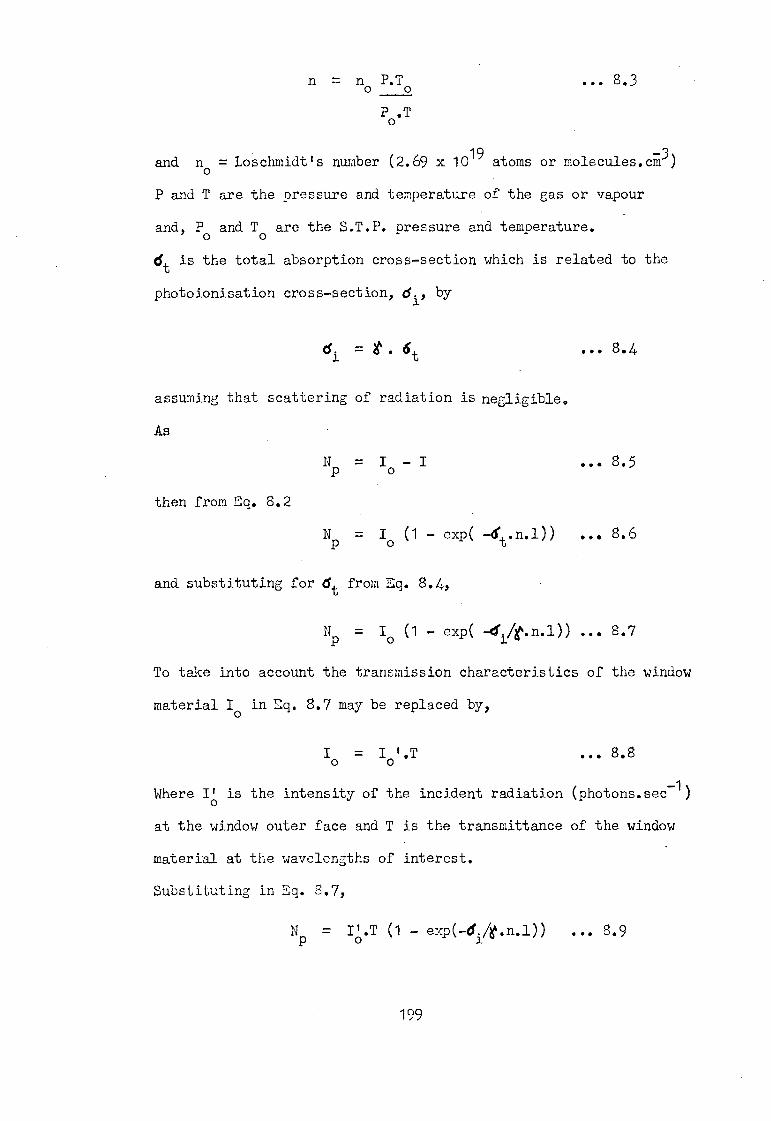
n = no P.To
8.3
P0 .T
and no = Loschmidt's number (2.69 x 10¹⁹ atoms or molecules.cm3 )
P and T are the pressure and temperature of the gas or vapour
and, Po and To are the S.T.P. pressure and temperature.
dt is the total absorption cross-section which is related to the
photoionisation cross-section) d., by
di = . t
assuming that scattering of radiation is negligible.
As
Np = Io - I
then from Eq. 8.2
... 8.4
... 8.5
N = Io (1 - exp( -d .n.1)) ... 8.6
and substituting for dt from Eq. 8.4,
Np = I0 (1 - exp( -diAt.n.1)) ... 8.7
To take into account the transmission characteristics of the window
material Io in Eq. 8.7 may be replaced by,
Io = Io'.T ... 8.8
Where I' is the intensity of the incident radiation (photons.sec 1)
at the window outer face and T is the transmittance of the window
material at the wavelengths of interest.
Substituting in Sq. 8.7,
N=II.T(1-exg-d.'e.1)) ... 8.9
199
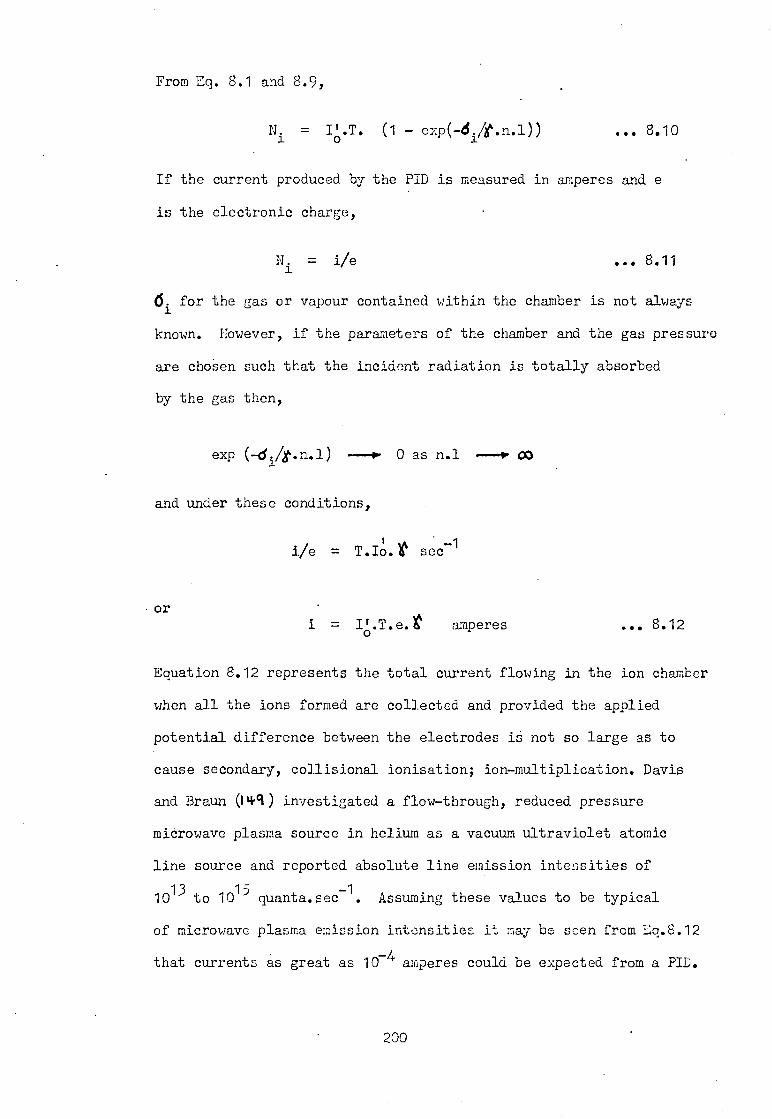
From Eq. 8.1 and 8.9,
Ni = I.T. (1 - exp(-6i/t.n.1)) ... 8.10
If the current produced by the PID is measured in amperes and e
is the electronic charge,
N. = i/e ... 8.11
61 . for the gas or vapour contained within the chamber is not always
known. However, if the parameters of the chamber and the gas pressure
are chosen such that the incident radiation is totally absorbed
by the gas then,
exp (-6i/t.n.1) ---r 0 as n.1 ---r 00
and under these conditions,
1 , i/e = T.Io.0 sec-1
or i = Il.T.e.t amperes ... 8.12
Equation 8.12 represents the total current flowing in the ion chamber
when all the ions formed are collected and provided the applied
potential difference between the electrodes is not so large as to
cause secondary, collisional ionisation; ion-multiplication. Davis
and Braun (101) investigated a flow-through, reduced pressure
microwave plasma source in helium as a vacuum ultraviolet atomic
line source and reported absolute line emission intensities of
1013 to 10
15 quanta.sec
-1. Assuming these values to be typical
of microwave plasma emission intensities it may be seen from Llq.8.12
that currents as great as 10 4 amperes could be expected from a PID.
200
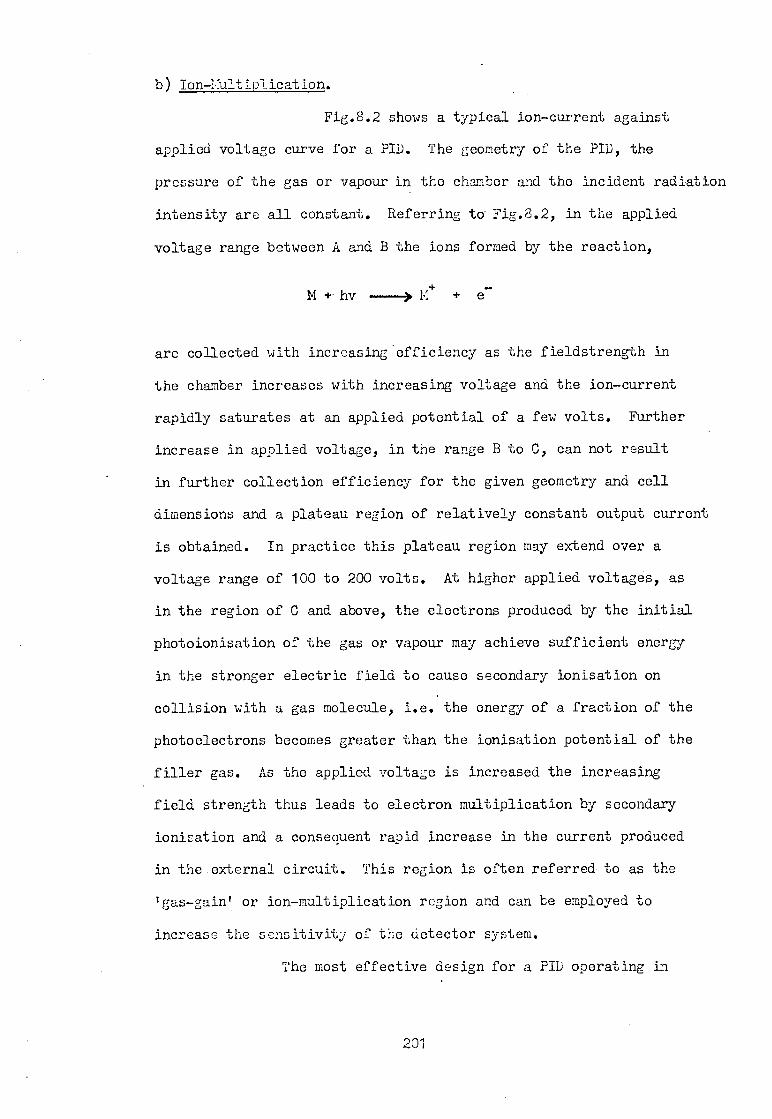
b) Ion-Y.u2tielication.
Fig.8.2 shows a typical ion-current against
applied voltage curve for a PID. The geometry of the PID, the
pressure of the gas or vapour in the chamber and the incident radiation
intensity are all constant. Referring to Fig.8.2, in the applied
voltage range between A and B the ions formed by the reaction,
M + hv + e-
are collected with increasing efficiency as the fieldstrength in
the chamber increases with increasing voltage and the ion-current
rapidly saturates at an applied potential of a few volts. Further
increase in applied voltage, in the range B to C, can not result
in further collection efficiency for the given geometry and cell
dimensions and a plateau region of relatively constant output current
is obtained. In practice this plateau region may extend over a
voltage range of 100 to 200 volts. At higher applied voltages, as
in the region of C and above, the electrons produced by the initial
photoionisation of the gas or vapour may achieve sufficient energy
in the stronger electric field to cause secondary ionisation on
collision with a gas molecule, i.e. the energy of a fraction of the
photoelectrons becomes greater than the ionisation potential of the
filler gas. As the applied voltage is increased the increasing
field strength thus leads to electron multiplication by secondary
ionisation and a consequent rapid increase in the current produced
in the external circuit. This region is often referred to as the
'gas-gain' or ion-multiplication region and can be employed to
increase the sensitivity of the detector system.
The most effective design for a PID operating in
201

the gas-gain mode is a cylindrical outer electrode with a thin
central wire. The electric field of such a coaxial arrangement
is given by,
E = V
... 8.13
r In (a/b)
Where E is the electric field at a distance r from the centre of
the PID, V is the applied voltage and a and b are the radii of the
outer cylindrical electrode and thin wire electrode respectively.
It can be seen that the field strength increases rapidly as r approaches
b, i.e. the electron, or positive ion, is accelerated towards the
central wire.
If the PID is operated in the plateau region it is
often immaterial whether the ions are collected or the electrons.
However, when operating in the gas-gain region it is best for the
applied voltage to be arranged such that electrons and not ions
are driven to the central wire as electrons have greater mean-free
paths than ions and are responsible for the initiation of the ion-
multiplication process. If the polarity of the applied field is
reversed higher voltages are necessary to provide ion-multiplication.
c) The Spectrn1 Response of a PID at Wavelengths Near The
Ionisation Threshold.
The theoretical treatment of the variation in
the efficiency of photoionisation in the region where the energy
of the ionising photons exceeds the ionisation potential of the
gas or vapour by only a few eV has been discussed by several workers,
(1st), i51052 ). A qualitative description is sufficient here.
For a covalently bonded molecule R1R2
three
different photoprocesses need to be considered OW,
202
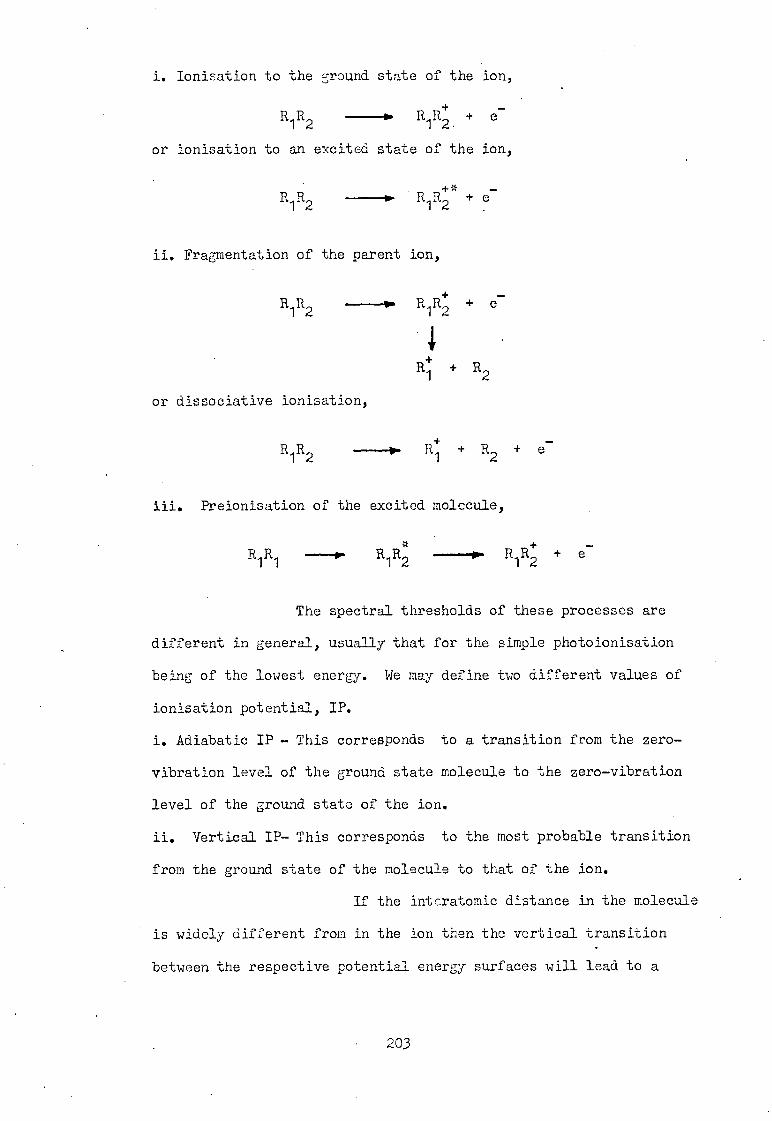
i. Ionisation to the ground state of the ion,
R1R2
R1R2.
+ e
or ionisation to an excited state of the ion,
R1R2
2 + e
_
ii. Fragmentation of the parent ion,
R1R2
R1R2 e
R+1 + R
2
or dissociative ionisation,
R1R2
n + 1 + R2
Preionisation of the excited molecule,
e-
The
12 _ _ R R+
-1R P 1 1 2 +
The spectral thresholds of these processes are
different in general, usually that for the simple photoionisation
being of the lowest energy. We may define two different values of
ionisation potential, IP.
i. Adiabatic IP - This corresponds to a transition from the zero-
vibration level of the ground state molecule to the zero-vibration
level of the ground state of the ion.
ii. Vertical IP- This corresponds to the most probable transition
from the ground state of the molecule to that of the ion.
If the interatomic distance in the molecule
is widely different from in the ion then the vertical transition
between the respective potential energy surfaces will lead to a
203
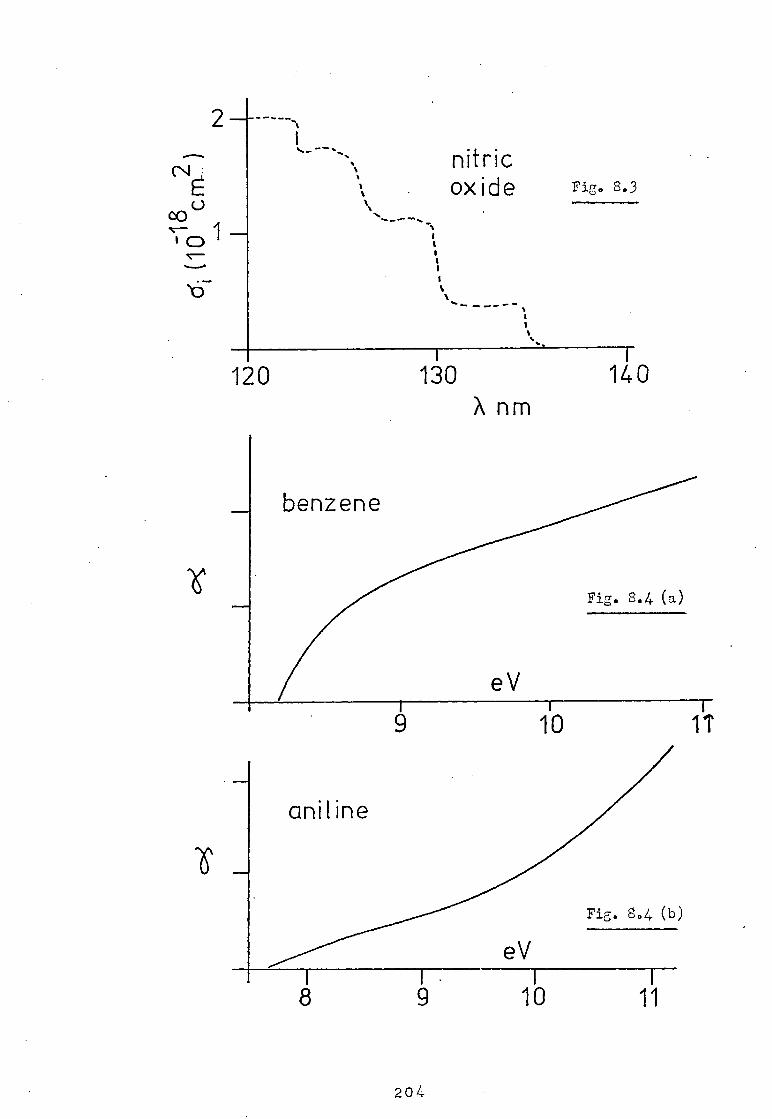
nitric oxide Fig. 8.3
120 130 X nm
140
benzene
Fig. 8.4 (a)
eV
9
10 liT
aniline
-6%
Fig. 8.4 (b)
eV
9 10 11
204

vibrationally excited ground state of the positive ion; in
accordance with the Franc-Condon principle.
When photoionisation proceeds only from a single
vibrational level of the molecule to a single level of the ion the
threshold law for the ionisation efficiency is expressed by a step
function. The photoionisation efficiency is zero when hv - IP < 0
(where hv is the energy of the photon). A jump occurs when hv = IP
and it remains constant for hv - IP > 0. Fig. 8.3 shows the variation
of the photoionisation cross-section, 61, as a function of incident
radiation wavelength for nitric oxide, (050). Several well marked •
steps corresponding to the positions of the vibrational levels of
the ion are evident and the portion of the curve within the limits
of one vibrational level is well defined by a step function. The
jump in cfi at the longest wavelength corresponds to the 0-0 transition,
i.e. the adiabatic IP of nitric oxide. The other steps on the di
curve correspond to transitions to the higher vibrational levels
of the ion.
In the ionisation of more complex molecules the curves
for the photoionisation efficiency become considerably more complex,
as at temperatures considerably above OK the molecules always have
a supply of vibrational energy. The occupancy of these vibrational
levels will obey approximately the Boltzmann Law. Ionisation from
these vibrational levels gives rise to an ion current at photon
energies lower than the first adiabatic ionisation potential. If
the probabilities of ionisation from all vibrational levels are
equal the increase in the photoionisation efficiency must follow
an exponential law for increasing photon energy. In general, these
levels are not resolved and the ionisation originating from them
205
results in a smoothing-out of the abrupt jumps in the ion current,
both in the region of the transitions to the various excited levels
of the ion and in the region of the adiabatic ionisation potential.
In the case in which the interatomic distances
in the molecule and the ion differ little the probability of tran-
sition to the higher. vibrational levels is smaller than to the
lowest level and an abrupt increase in the ion current at the- ionisation
threshold is observed which tapers off as the photon energy is
increased, eg. benzene, Fig. 8.4a. In the converse case, in which
the probability of transition to the higher levels is greater,
corresponding to the case of differing interatomic distances in the
ion and molecule, the observed rise in ion current with increasing
photon energy is more gradual becoming steeper with increasing
energy, eg. aniline, Fig. 8.4b. In both cases, at higher photon
energies, the region of the ionisation continuum is achieved and
the ionisation yield varies more smoothly with energy and the nature
of the variation is determined by the structure of the energy levels
and the probability of transitions between them.
8.3 Construction of a Photoionisation Detector.
The PID assembly used in this work is shown
in Fig.8.5. A Pyrex cylinder (90mm in length, 29mm diameter, 2mm
wall thickness) fitted with a B14/23 ground glass cone and socket
on one end and a side-arm fitted with a three-way 2mm bore tap was
employed as the detector envelope. The electrode assembly, mounted
onto glass-to-metal sealing rods through the ground glass cone,
consisted of a cylindrical sheet copper cathode (80mm in length,
25mm internal diameter, 0.19mm thickness) along the central axis
of which a 1mm tungsten wire anode was located. The electrodes
206

three way tap
ground glass joints ethylamine envelope
p.t.f.e. supports Ca F2
window
glass to metal seal central tungsten
wire electrode cylindrical copper electrode
O ^-2
0
0 (D
UO
T '4
.r.7. S
I LI O
T 0 q
.07.4
c1 e
tT a,

were insulated from each other by means of the glass and PI T-2 anode
supports shown in Fig.8.5. A polished calcium fluoride window
(3mm thickness, 25mm diameter) was mounted in a cylindrical aluminium
holder sealed with epoxy resin cement onto the end of the PID envelope.
The aluminium window holder was fitted externally with an annular
depression in which an 0-ring was positioned to permit vacuum sealing
of the detector at the exit slit of the vacuum monochromator employed
in some of the work. All the components of the PID were carefully
cleaned and degreased before assembly. The ground glass joints
were sealed with high temperature wax.
A d.c. voltage (5 to 400 volts) was provided
across the detector from a dry battery supply. The photoionisation
current was registered using a picoammeter (type P24, Knick, Berlin)
and the voltage output from this device was displayed on a potentio-
metric chart recorder.
To evaluate the potential of this assembly
as a detector of far u.v. radiation it was necessary first to examine
a variety of ultraviolet sources before selecting suitable filling
gases for the PID.
8.4 Vacuum Ultraviolet Line Emission Sources.
a) Microwave Plasma Source.
Davis and Braun (141) have described an
intense vacuum u.v. atomic line emission source produced by microwave
excitation of various gases in helium under flow conditions at
reduced pressures. The line emission from excited carbon, nitrogen,
oxygen, sulphur, selenium, chlorine, bromine, hydrogen and krypton
were examined and the spectra observed between 120nm and 200nm
were free from spectral impurities. Reduced pressure, flow-through
208

plasmas, however, require more elaborate construction and operation
than .atmospheric pressure systems. The plasma used in the studies
described here was a low-powered, microwave excited argon plasma
supported in a fused silica tube (150mm length, 2mm i.d.) within
a 4-wave resonant cavity. This assembly is shown in Fig.8.6. The
. 1 argon flow-rate was variable between 0.5 and 1.0 litre.= by
means of a Teter-Rate type C flow-meter and the plasma discharge
was viewed end-on along the central axis of the silica tube. Power
(ca. 50 watts) was supplied at 24501,21z from the 200 watt microwave
power supply previously described.
The spectral emission characteristics of the
plasma source were established using the 1-metre normal incidence
vacuum grating monochromator. This was equipped with an end-window
photomultiplier tube (=I 6256 B) whose silica window had been
sensitised using sodium salicylate. Kriastianpoller and Knapp (1600)
and Samson (17 )have described in great detail the use of this material
for sensitising photomultiplier tubes to radiation of low wavelengths.
The flat response to incident radiation between 80nm and 300nm
and relatively high quantum efficiency make sodium salicylate the
most common sensitising agent in use today. The fluorescence emission
peak of sodium salicylate is at 390nm and this corresponded with
the peak response of the 6256B photomultiplier tube, Fig.8.7a.
Using a compressed inert-gas spray-gun a saturated solution of
sodium salicylate was sprayed onto the face of the photomultiplier
window to provide a coating of between 1 and 2mg.cm 2; the optimum
layer density for this material. A hot-air blower was
employed to evaporate the solvent. The weight of the organic salt
deposited on the window was determined by calibrating the spray
gun emission. This was achieved by spraying several pre-weighed
209

detection system
uartz 2mm. o.d.
argon
Variac
coaxial connector
coupling adjustment
Atmospheric Microwave Plasma.
The At mospher
ic Microwave P
lasma.
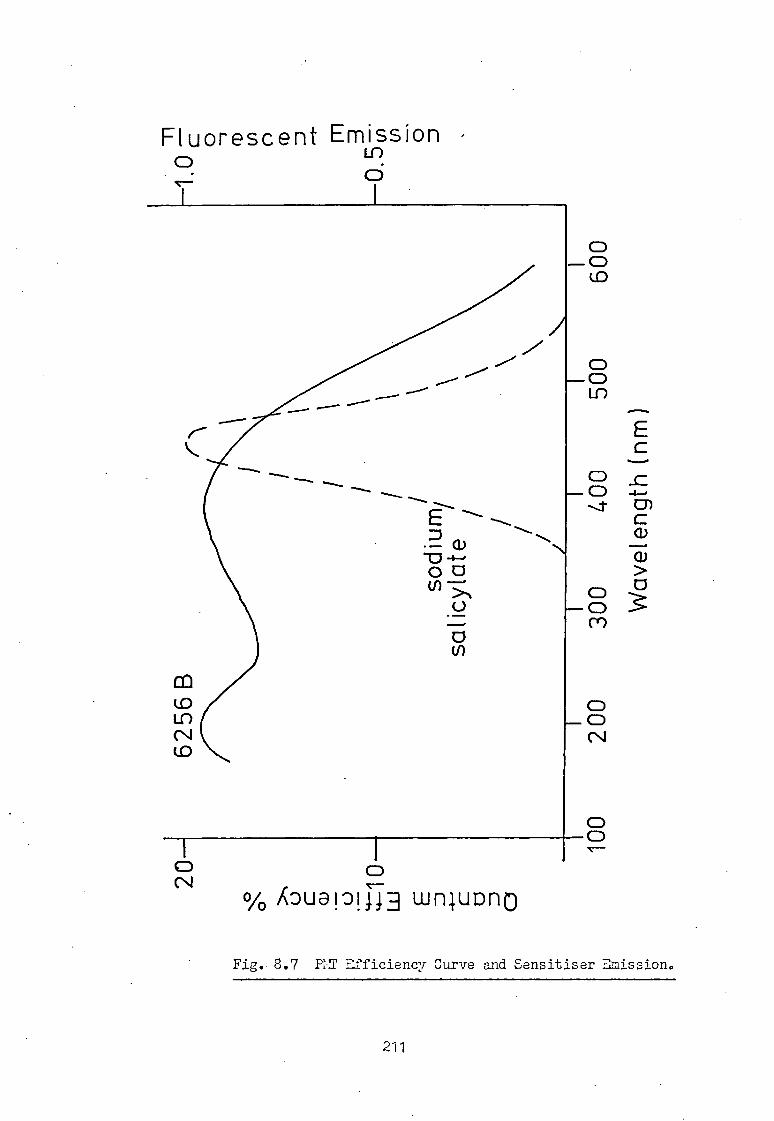
(WU
) lN5U
819AID
M
Quantum Efficiency % O O
N.) 01 rn Co
O O
0 - 0
— 0
.uoTssTm7 aesmsues pi e GAano .KoueToTKra Lk/. L.B
rn (D-O
I o
uo!ss!w3 lueoseJonH

Fig. 8.8 Spectrum From Argon Microwave Plasma.
G
F
C C
A
I I I 1 1 1 I 130 140 150 160 170 180 190
Wavelength,(nm ). Line. WavelengthInm Species. L.ine Wavelength,nm Species
A 127.75 Carbon 148.18 Carbon
B 130.22 Oxygen F 156.10 Carbon
130.49 G 165.72 Carbon
130.60 H 175.19 Carbon
C 132.93 Carbon I 193.04 Carbon
D 146.33 Carbon
212

thin glass slides with the salicylate-methanol solution and re-
weighing the slides after evaporation of the solvent. The number
of passes of the spray...gun over the face of the slides necessary
to provide the required deposit of sodium salicylate was thus determined.
The signals from the photomultiplier tube
were led directly to a potentiometric chart recorder.
Spectral Emission Characteristics Of The Argon Microwave Plasma.
The atmospheric pressure, microwave excited
argon plasma apparatus was assembled as described above. With an
. - 1 argon flow-rate of 1.0 to 1.51itres.min and an applied microwave
power of ca. 100-watts the plasma was initiated using a Tesla discharge
coil. The flow-rate was lowered to 1.0 litre.min 1 argon and the
microwave power to 50 to 60 watts. With the plasma discharge immed-
iately up against the entrance window of the vacuum monochremator
and employing a spectral bandpass of 0.08nm the spectrum from the
plasma was recorded between 120nm and 200nm. The voltage to the
PMT was maintained at 1600V. The spectrum obtained and the atomic
lines observed, with their assigned transitions, is shown in Fig.8.8.
The emission lines observed were thought to be due to impurities
in the argon and pick-up from the walls of the silica tubing.
Sharp (154) has shown that in a low-powered
microwave argon plasma that although the electronic temperature
is in excess of 5000K a gas temperature of only ca. 1000K is obtained.
This difference may be attributed to the inefficient transfer of
kinetic energy from the electrons to gas atoms or molecules. Many
compounds do not atomise at such a low temperature and it is usually
necessary for any sample to be introdacedinto the plasma as a gas or
vapour, i.e. the plasma is employed solely as a means of excitation.
213

To investigate the vacuum ultraviolet emission characteristics
from the non-metallic elements the vapour introduction techniques
were used.
A one litre flask was positioned in the argon flow line
between the flow-meter and i.,-wave cavity. To investigate the low
wavelength spectrum of iodine a few milligrams of the solid were
placed in the flask and the plasma operated as discussed previously.
Chlorine atomic emission was examined by passing the argon supply
over a few millilitres of CC14 contained within the flask. Atomic
emission from sulphur was observed by bleeding a 1% SO2 in argon
mixture into the plasma-argon supply line. The emission spectra
from these iodine,sulphur and chlorine containing plasmas recorded
in the wavelength range 120nm to 200nm are shown in Figs.8.9, 8.10 and 8.11.
The spectra were not as free from impurities as
those observed by Braun et al. using the reduced pressure plasma.
and similar sample introduction techniques but the spectra obtained
here did serve to indicate the intense emission lines from the
non-metal atoms in the vacuum ultraviolet.
b) A Demountable Hollow Cathode Lamp Source.
The atmospheric microwave plasma was not the
only vacuum u.v. atomic emission source examined, a commercial
demountable hollow cathode lamp source was employed also. The
details of the construction and use of this lamp as a line emission
source have been discussed in Chapter Five. Its operation here
was identical, i.e. a 3min thick calcium fluoride window was used
and aluminium cathodes because of their spectral purity employed.
To examine the spectral atomic emission characteristics
of chlorine and bromine a variety of salts containing these elements
were investigated. The compounds producing the most intense and
214
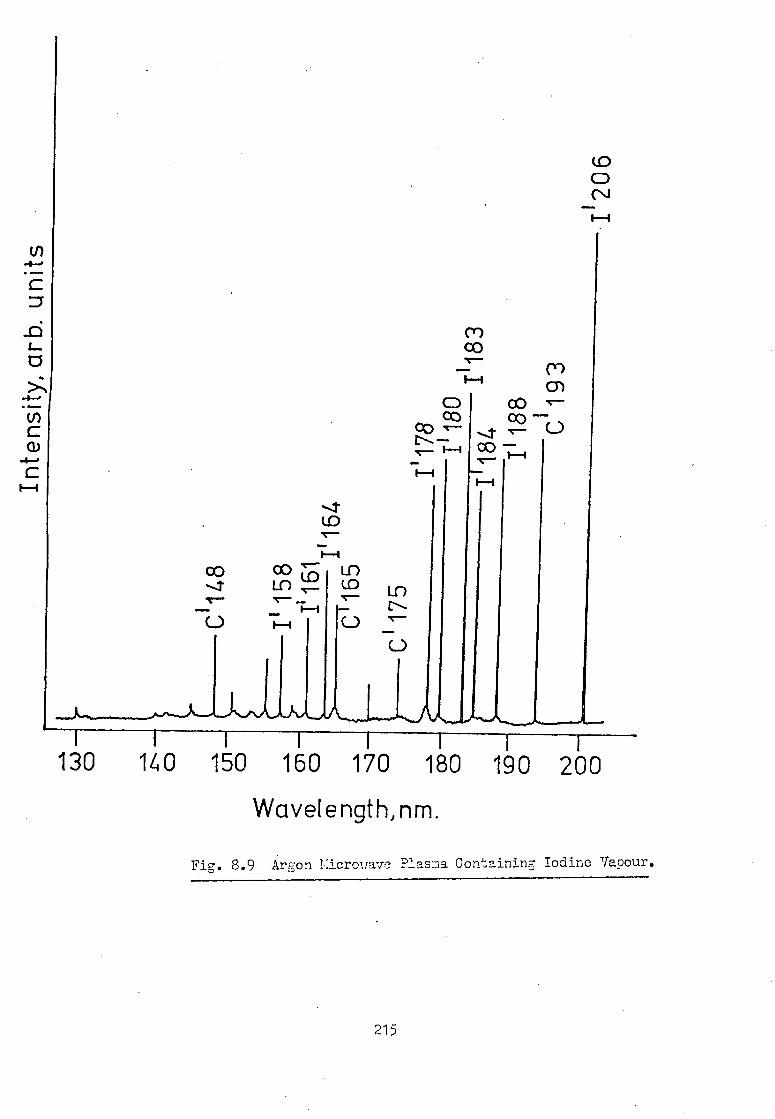
LO O N
LO
7-4 CO CO Lf) LO Lc)
1-1 C.)
I I 1 1 1 I I 130 140 150 160 170 180 190 200
Wavelength, nm.
Fig. 8.9 Argon licrowave Plasma Containing Iodine Vapour.
If)
U
215

CO
0
•
(5)
0
N co
N co
O CO •c-
LD
(i)
130 140 150 160 170 180 190
Wavelength, nm.
Fig. 8.10 Argon Microwave Plasma With Sulphur Dioxide.
216
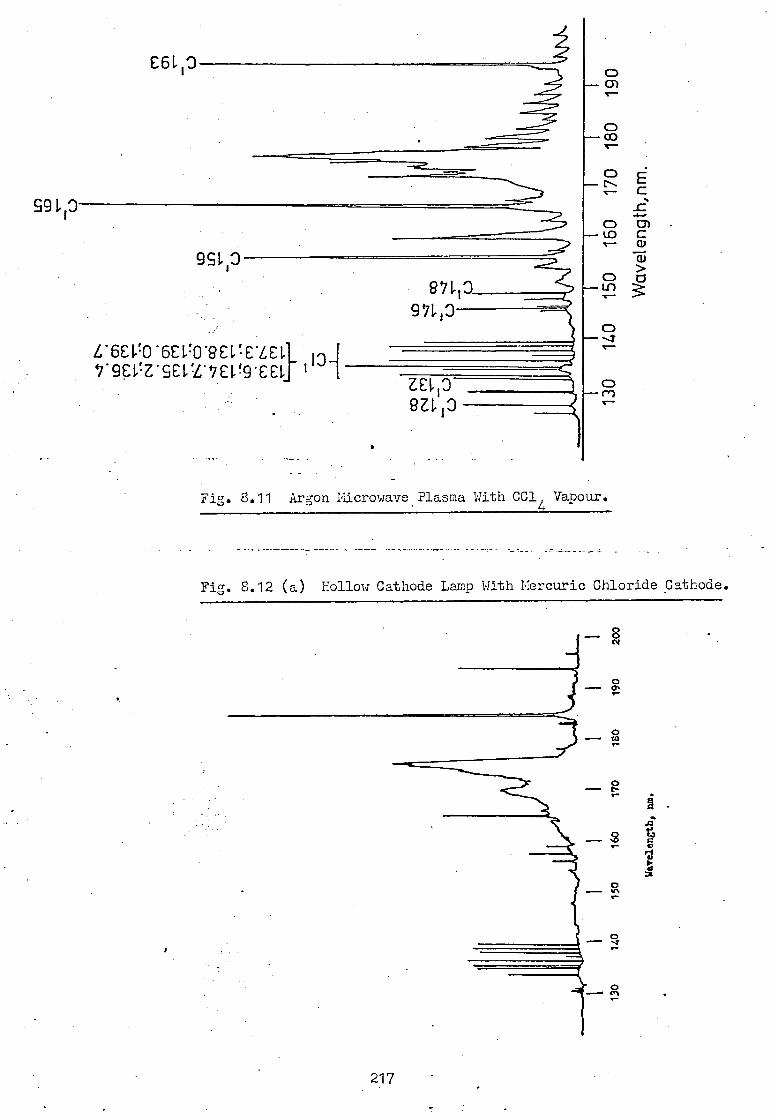
87110 971.10
ZE1.1 0 8Z1. 1 3
C61.0 - 0)
--- CO
591.,3
95113
— N. s--
Wa v
elen
gth,
nm
.
0 - (0
•-•
—In
o —
L'6C1.10'6C1.:0"9EVE7.61 41
} 91.Z'SCVL'ICV9'661. I
Fig. 8.11 Argon Microwave Plasma With CG14 Vapour.
Fig. 8.12 (a) Hollow Cathode Lamp With Mercuric Chloride Cathode.
0 ••••••• Q.
•■••■ft,
Wave
leng
th, n
m.
217

0 I-
0 - CO
0
0 I-
Fig. 8.12 (b) Hollow Cathode Lamp With Lead Bromide Cathode.
Fig. 8.12 (c) Hollow Cathode Lamp With Lead Chloride Cathode.
Cr \
Wave
leng
th, n
u.
218

cleanest soectra in the vacuum ultraviolet were mercuric chloride
and lead bromide, Figs. 8.12 a and b. As before, mixtures of the
sample and tungsten powder (1 to 1 w/w) were compressed into the
blank aluminium cathodes and drilled out to provide a deposit of
the mixture, ca. 1mm thickness, on the inside of the hollow cathode.
As a comparison, Fig. 8.12 c shows the spectrum, in the same wavelength •
range, of a lead chloride/tungsten/aluminium cathode lamp. The
spectral bandpass of the monochromator and voltage to the PNT was
the same in each case and the.same as employed during the atmospheric
microwave plasma studies. The hollow cathode lamp source was mounted
up against the entrance window of the monochromator and the 30mm
path between the source and window purged free of air using argon
passing through a 30mm, 20mm diameter glass tube forming the optical
path.
In general the spectra obtained using the
demountable hollow cathode lamp were of greater spectral purity
than those obtained from the microwave plasma, however, the atomic
line emission intensities were typically an order of magnitude
inferior.
8.5 Selecting The Filling Gas For A PID.
The number of crystalline window materials
suitable for use as cut-off filters in the vacuum ultraviolet is
limited. The PID described in Section 8.3 was fitted with a 3mm
thickness calcium fluoride window providing for a short wavelength
cut-off of ca. 125nm. To limit the spectral bandpass of the detector,
and because of the intensity of the oxygen atomic triplet emission
from the microwave plasma at 130nm and the profusion of atomic
chlorine emission lines in the wavelength range 130nm to 140nm from
219
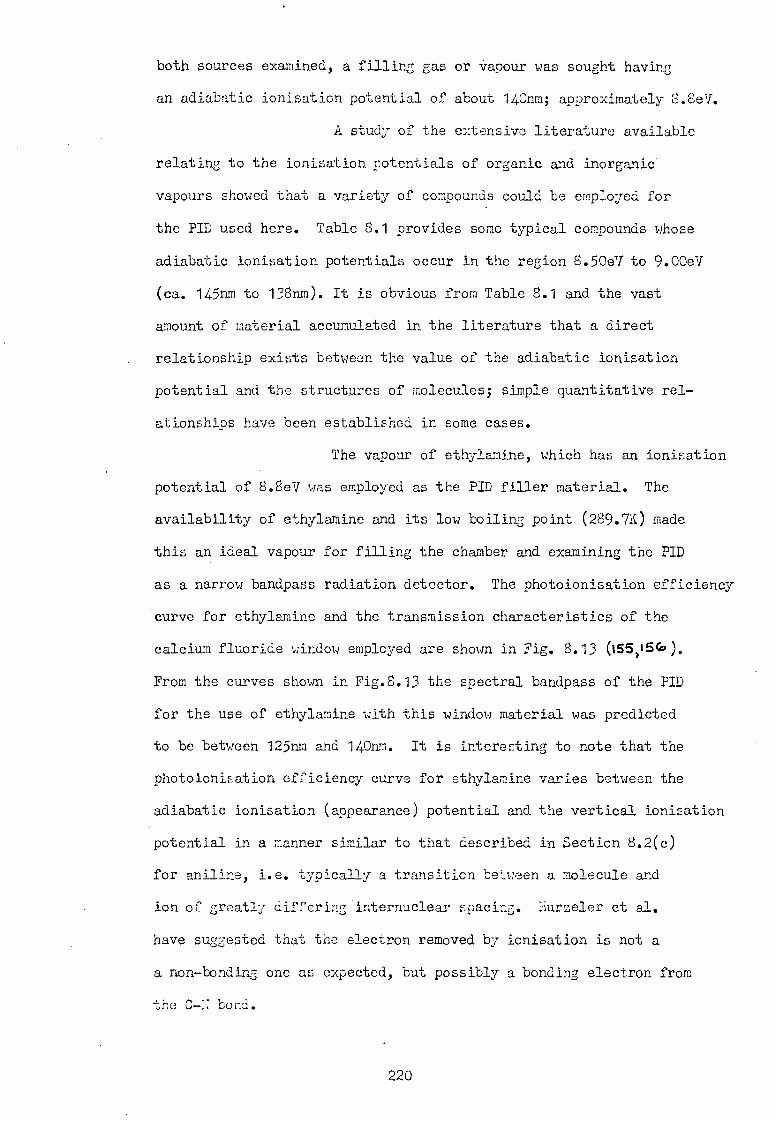
both sources examined, a filling gas or vapour was sought having
an adiabatic ionisation potential of about 140nm; approximately 8.8eV.
A study of the extensive literature available
relating to the ionisation potentials of organic and inorganic.
vapours showed that a variety of compounds could be employed for
the PID used here. Table 8.1 provides some typical compounds whose
adiabatic ionisation potentials occur in the region 8.50eV to 9.00eV
(ca. 145nm to 138nm). It is obvious from Table 8.1 and the vast
amount of material accumulated in the literature that a direct
relationship exists between the value of the adiabatic ionisation
potential and the structures of molecules; simple quantitative rel-
ationships have been established in some cases.
The vapour of ethylamine, which has an ionisation
potential of 8.8eV was employed as the PID filler material. The
availability of ethylamine and its low boiling point (289.7K) made
this an ideal vapour for filling the chamber and examining the PID
as a narrow bandpass radiation detector. The photoionisation efficiency
curve for ethylamine and the transmission characteristics of the
calcium fluoride window employed are shown in Fig. 8.13 (155115C* ).
From the curves shown in Fig.8.13 the spectral bandpass of the PID
for the use of ethylamine with this window material was predicted
to be between 125nm and 140nm. It is interesting to note that the
photoionisation efficiency curve for ethylamine varies between the
adiabatic ionisation (appearance) potential and the vertical ionization
potential in a manner similar to that described in Section 8.2(c)
for aniline, i.e. typically a transition between a molecule and
ion of greatly differing internuclear spacing. Hurzeler et al.
have suggested that the electron removed by ionisation is not a
a non-bonding one as expected, but possibly a bonding electron from
the C bond.
220

Table 8.1 Lome ::.aterials :aving ionisation Poteintials In
The Re7ion 8.55e7 to 8.8CeV
Vapour Ionisation Pot. (eV) Vapour Ionisation Pot.
o-xylene 8.56 iso-propylamine 8.72
m-xylene 8.59 iso-butylamine 8.70
ruethylarnine 8.97 t-butylamine 8.64
ethylamine 8.80 toluene 8.82
n-propylamine 8.78 ethyl benzene 8.76
n-butylamine 8.71 n-propyl benzene
n-butyl benzene
8.72
8.69
Table 8.2 Some Materials Having Ionisation Potentials In
The Region 6.90eV to 7.0CeV
Vapour
Ionisation Pot. (eV) Vapour Ionisation Pot.
(eV)
N1N-di-n-butylaniline 6.95 N,N,-di-n-propylaniline 6.96
N,N-diethyl-p-toluidine 6.93 N,N,-diethyl-p-bromoaniline 6.96
p-bis(dimethylaminobenzene)6.90 N,N,-diethylaniline 6.99
221

pump
detector
cold trap
0-20 torr pressure guage
argon
Et NH2
ballast Dewar
Fig. 8.14 The PID Filling System.
Fig. 8.13 Predicted Response Of The PID.
>1 100- 0 C a)
L.6 C
U) "E .05
40—
0 _c 0- 20—
1mmCaF2...
2mm raF 2
—100
—80
—60
—40
—20
C2H5NH2
UO
! SSIW
SU
DJ±
%
120 130 140 150
Wavelength,nm.
222
8.6 The Photoionisation Detector.
A simple vacuum and purging system was constructed
to permit the filling of the PID with ethylamine (or other gases
or vapours). This is shown in Fig.8.14. Anhydrous ethylamine
(10 mis.) was placed in the pear-shaped flask and frozen by immersion
of the flask in liquid nitrogen. The complete system was then
evacuated using a two-stage rotary pump and flushed out several
times with argon. On a further evacuation of the complete system
tap A was closed to isolate the flask containing the ethylamine.
The liquid nitrogen was then removed from beneath the flask and
the ethylamine allowed to warm to produce a steady increase in ethylamine
vapour pressure. By first closing tap B and then opening tap A
the system was flushed out several times with ethylamine vapour,
followed each time by re-evacuation to a pressure of ca. 3 torr,
Tap B was then finally closed and a preselected pressure of ethylamine
vapour admitted to the system via tap A. With taps A and B both
closed the detector was sealed by closing tap C and removed from
the system for use. oven with the simple PID system constructed
for this study the PID envelope would maintain a fill pressure as
low as 1 torr for periods in the excess of eight hours and was
simply and rapidly refilled when necessary.
8.7 The Spectral Response Characteristics Of The ahvlamine P=D.
The spectral response characteristics of the
ethylamine PID were studied using both available sources, i.e. a
microwave excited argon plasma and the demountable hollow cathode
lamp system.
The PID was filled with ethylamine vapour at 2 torr
and positioned at the exit slit of the vacuum monochromator; the
223 •
PID was mounted such that the window of the ionisation chamber
formed the vacuum.seal with the monochromator. The argon microwave
plasma, as described previously, was viewed by the monochromator
using a spectral bandpass of 1.6nm. The emission spectrum of the
argon plasma was recorded using the PIL at 85V applied potential;
the signal from the PID was recorded on a potentiometric chart recorder.
The spectrum recorded is shown in Fig. 8.15. As a comparison Fig.8.15
also shows the spectrum of the argon plasma obtained using the vacuum
monochromator at the same spectral bandpass (1.6nm) with the photo-
multiplier detector, at 700V. It is clear from a comparison of these
spectra that the PID responds only to radiation in the wavelength
range predicted. Whereas the carbon and oxygen line emissions in
the region 128nm to 132nm are observed, the more intense longer
wavelength carbon lines between 140nm and 193nm are not detected.
As a further test of the response characteristics
of the ethylamine PID the demountable hollow cathode lamp source
with argon filler gas and an aluminium cathode containing a mixture
of tungsten and mercuric chloride was employed. The spectrum from
this source in the range 130nm to 200nm was obtained using the
monochromator-photomultiplier detection system and is shown in
Fig. 8.12 a. The spectrum consisted of atomic line emission from
chlorine, oxygen, carbon and mercury and was obtained using an argon
purged optical path (30mm) between the source and monochromator
entrance window. The experiment was then repeated with this 30mm
path-length purged with a 1% methane in argon gas mixture. As
methane absorbs strongly at wavelengths less than 140nm (1567) the
emission intensity from the source at low wavelengths is attenuated.
The spectrum obtained under these conditions is shown in Fig. 8.16
224
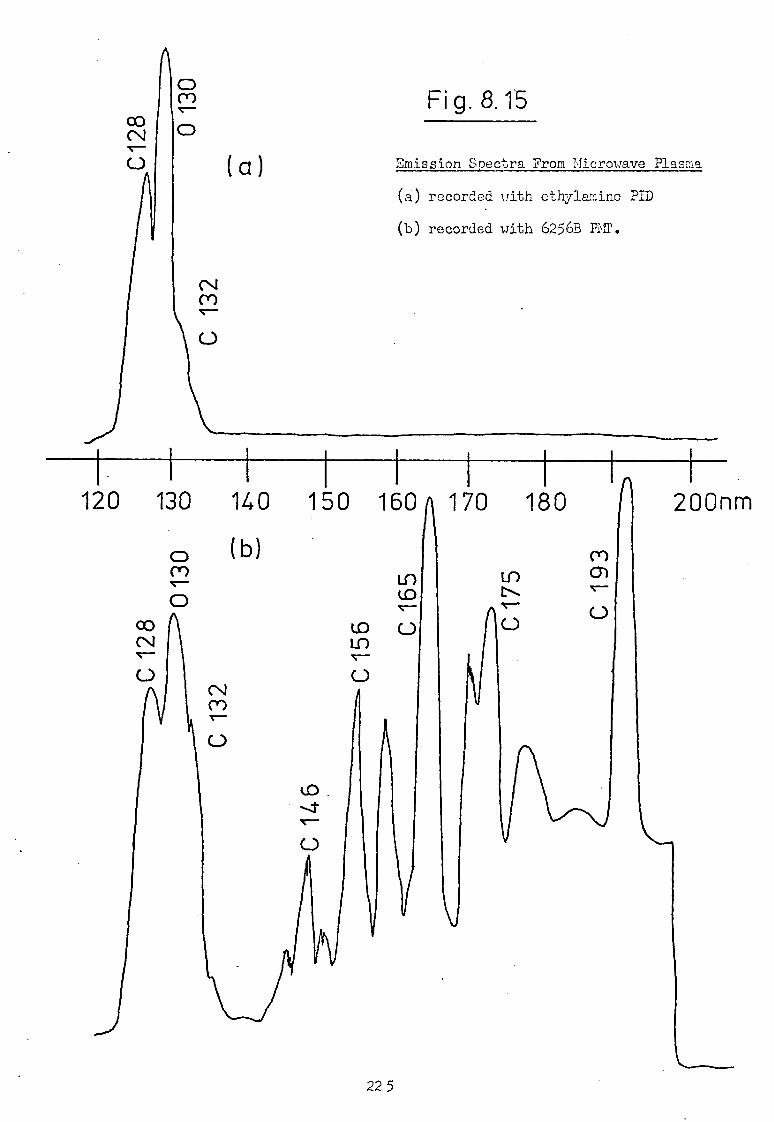
Fig. 8.15
Emission Spectra From Microwave Plasma
(a) recorded with ethylamine PID
(b) recorded with 6256B PMT.
120 130 140 150 160170 180
Ol o (b) co 0
LI)
225
If) N-
ro

Fig. 8.16
(1) DHCL + HgC12 Spectrum, Argon Purged Path
Inte
nsity
, ar b
. un i
ts
LO DHCL + HgC12 Spectrum, Argon + 1% CH4
Purged Path.
I I II I I I I 130 140 150 160 170 180 190 200
Wavelength, nm.
226
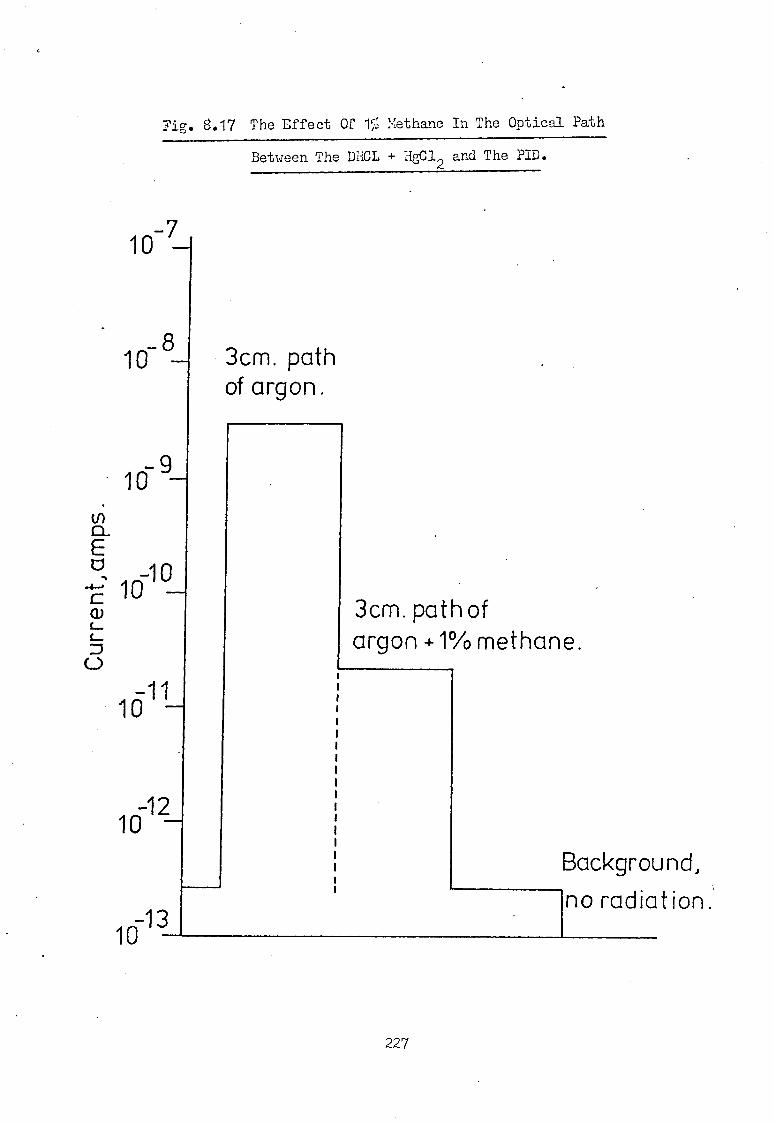
10-
109_
U)
E ci -10
4E: 10 — a) J
C.)
Fig. 8.17 The Effect Of 1;"; Methane In The Optical Path
Between The DHCL + HgC12 and The PID.
10
3cm. path of argon.
3cm. path of argon +1% methane.
10 1
Background, no radiation.
10-13
227

and clearly- demonstrates the absorption of the oxygen and chlorine
atomic line emission between 130nm and 140nm'and the unaffected
intensities at longer wavelengths. These experiments were repeated
using the PID in the non-dispersive mode, i.e. with the radiation
falling directly on to the detector via the 30mm purged path without
using the vacuum monochromator. The response obtained in the presence
and absence of 1%. methane in the argon purge gas is shown in Fig.8.17.
The decrease in PID response observed in the presence of methane
correlates well with the decrease in intensity of the emission recorded
between 130nm and 140nm shown in Fig.8.16 in the presence of methane
using the PIE detector. It was thus apparent that it was the incident
radiation below 140nm to which the PID responded.
8.8 The Effect Of Ethylamine Vapour Pressure And Applied Voltage
On The Response Of The PID.
The radiation from the demountable hollow
cathode source with an aluminium cathode containing a mixture of
tungsten powder and solid mercuric chloride was allowed to fall
directly onto the PID in the non-dispersive mode of operation. The
effect of the fill pressure of ethylamine vapour and the applied
d.c. potential on the response of the detector to incident radiation
in the range 130nm to 140nm was examined under these conditions.
The picoammeter response was determined at applied voltages between
5 volts and 400 volts for a number of ethylamine filler vapour
pressures. The current-voltage curves obtained are shown in Fig.8.18.
The sharp current rise regions at low applied voltages, the plateau
regions and the regions of gas-gain, ion-multiplication, as described
in Section 8.2 (b) are clear. It can be seen that at the higher
voltages, in the gas-gain region, an increase in' he sensitivity
of the detector by two to three orders of magnitude is possible.
228
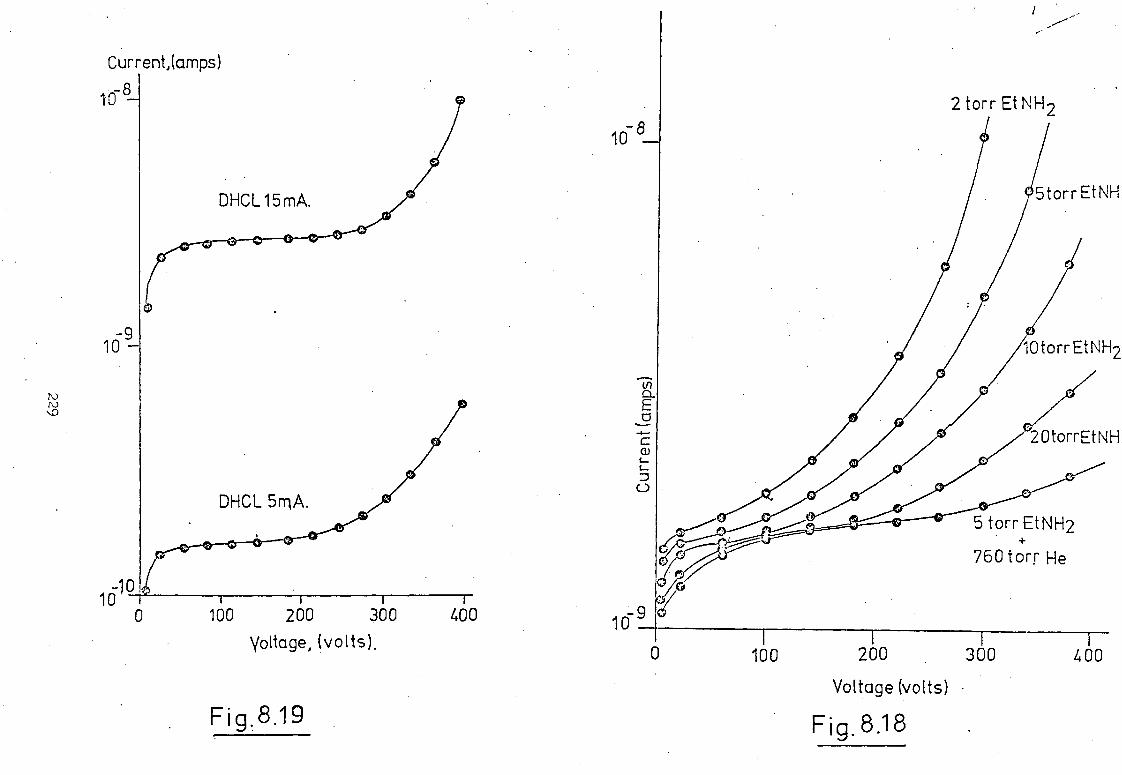
2 torr Et NH2
5torr EtNH
Cur
ren t
(am
p s)
DHCL 5mA.
100 200 300 Voltage, (volts).
. Fig. 8.19
10torrEtNH2
20torrEtNH
5 torrEtNH2
760 tore He
10 —
Current,(amps)
10-8—
I I 0 100 200 300
Voltage (volts)
Fig. 8.18
400

The effect shown in Fig. 8.18,where the ion current is inversely
proportional to the pressure of the ethalamine present over the
range studied, can be explained on the basis of the mean free-path
of the electrons formed on ionisation. Thus, as the ethylamine
pressure was increased the mean free-path of the photoelectrons
decreased so that there was insufficient time to permit their
acceleration to energies sufficient to cause secondary ionisation
on collision with an ethylamine molecule. This effectively delayed
the onset of the ion-multiplication region to higher applied voltages.
The limiting case shown in Fig. 8.18 corresponds to the addition
of helium as an inert filler gas at atmospheric pressure in the
presence of 5 torr of ethylamine. Under these conditions the plateau
region extended to greater than 300V without observation of secondary
ionisation.
Fig. 8.19 demonstrates the dependance of the PID response
on the incident radiation intensity from the source employed. An
increase in operating current from 5mA to 15mA d.c. resulted in
an increase in current of ca. one order of magnitude due to the
equivalent increase in intensity from the oxygen and chlorine atomic
line emission between 125nm and 140nm. The proportionality between
incident intensity and PID response is observed in both the plateau
and ion-multiplication regions.
8.9 Quantitative Analysis With The ahvlamins, PTD.
It has been shown how a narrow spectral
bandpass detector may be constructed and operated to monitor radiation
in the wavelength region 125nm to 140nm using ethylamine vapour'
as the ionisation medium and a calcium fluoride window as the short
wavelength cut-off filter. Attempts to employ the ethylamine PID
230

as a quantitative ultraviolet detector for atomic spectrometry met
with little success but the experiments will be reviewed here to
indicate the problems accompanying the use of a PID with the atomic
emission systems examined.
The atmospheric pressure argon microwave plasma atomic
emission source was observed to become very unstable when samples
such as CC141 SO
2' 02, N
2' etc. were introduced into the argon supply.
This perturbation of the plasma may be attributed to the low gas
temperature attained within the plasma and the high collisional
cross-sections of these molecules makes them very efficient in quenching
the discharge. To overcome this problem of instability a variety
of techniques have been proposed and employed by many workers to
introduce samples into the plasma without disturbing the discharge.
Johnson 057) used a radiofrequency, inductively heated nickel
boat assembly to accomodate up to 100 microlitres of sample solution
or ca. 50mg of powdered solid sample. The sample was dried in the
boat, contained within the argon stream and then the sample volatilised
into the argon flow and carried into the plasma. However, many
disadvantages and interference effects were observed with this
technique. Dagnall et al. have examined a platinum loop filament
to introduce the sample into the plasma. The sample, typically
1/41, is dried and then volatilised from an argon sheathed, resistively
heated platinum filament and fed into the discharge. A platinum
loop assembly in conjunction with the argon microwave plasma was
examined as an atomic emission source for the determination of
chlorine using the ethylamine PIT). ":7:xperiments conducted with
such an assembly, however, gave no clear indications as to whether
chlorine emission from sodium chloride and ammonium chloride
231

volatilised into the plasma was detected by the PID. Unfortunately,
the intense oxygen emission at 130nm from the plasma served to
provide a large background signal (typically 10 7 amperes) at the
detector and no further signal was observed above this on volatilising
the chlorine containing sample from the platinum filament.
To further limit the spectral bandpass
of the ethylamine PIE, a barium fluoride window (135nm cut-off,
2mm thickness, 25mm diameter) was positioned between the plasma and PID.
The currents obtained from the PID were now limited to ca. 5 x 10-12
amperes and reached only ca. 10 10 amperes when GC14
vapour was
continuously flowing into the argon stream into the plasma. The
low response by the detector to the atomic chlorine emission from
the plasma was attributed to the poor transmission characteristics
of the double (GaF2-BaF2) window arrangement employed. No further
experiments were undertaken with the atmospheric argon plasma and
ethylamine PID system.
The radio-frequency, induction-coupled, atmospheric
argon plasma is a far more efficient atomic emission source than
the microwave plasma. Gas temperatures in excess of 8000K are
attainable and the discharge is not so susceptible to perturbation
by sample introduction. However, air-borne radio-frequency interference
with such devices is a problem. The PID containing 2 torr ethylamine
was assembled alongside a radio-frequency plasma, connected by an
argon purged optical path. 0.1M HG1 solution was nebulised into
the plasma but no atomic emission signals were detectable by the
PID owing to the very high noise level, typically 105 to 10 7 amperes,
generated by the plasma system and received by the PID. Screening
the cables from the detector to the readout device from such large
spurious signals was not accomplished; a complete redesign of the
232
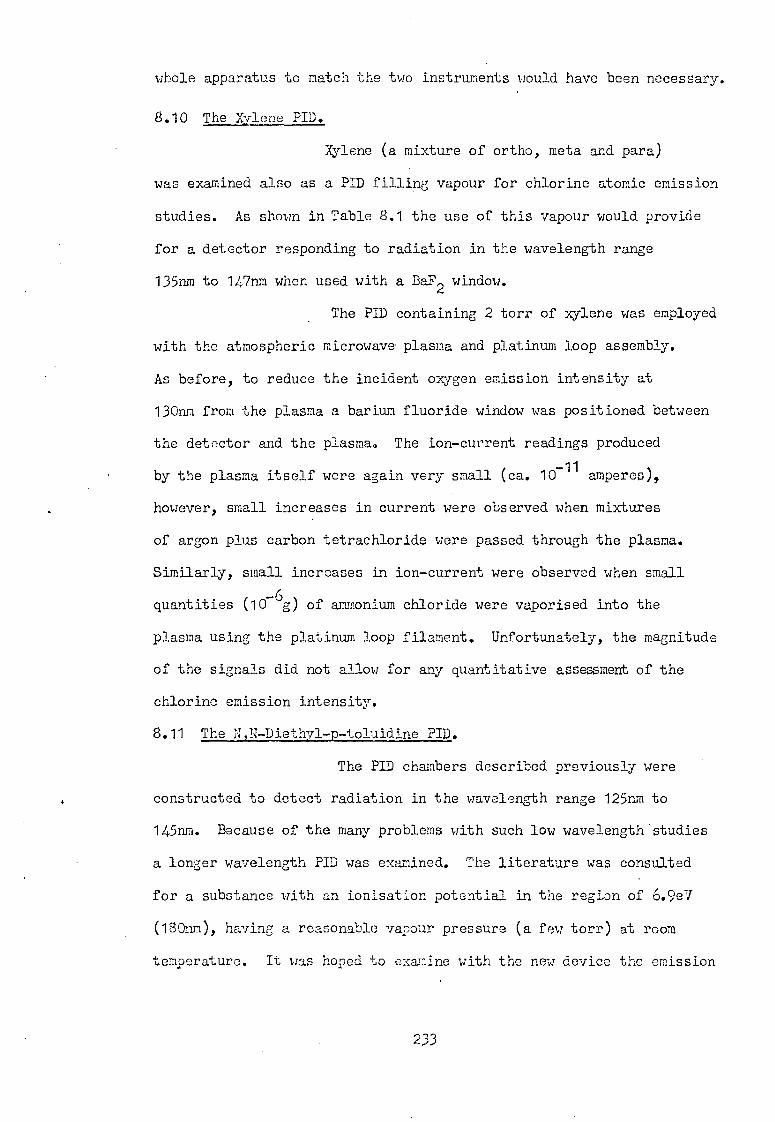
whole apparatus to match the two instruments would have been necessary.
8.10 The Xylene PID.
Xylene (a mixture of ortho, meta and para)
was examined also as a PID filling vapour for chlorine atomic emission
studies. As shown in Table 8.1 the use of this vapour would provide
for a detector responding to radiation in the wavelength range
135nm to 147nm when used with a BaF2 window.
The PID containing 2 torr of xylene was employed
with the atmospheric microwave plasma and platinum loop assembly.
As before, to reduce the incident oxygen emission intensity at
130nm from the plasma a barium fluoride window was positioned between
the detector and the plasma. The ion-current readings produced
by the plasma itself were again very small (ca. 10 11 amperes),
however) small increases in current were observed when mixtures
of argon plus carbon tetrachloride were passed through the plasma.
Similarly, small increases in ion-current were observed when small
quantities (10-6g) of ammonium chloride were vaporised into the
plasma using the platinum loop filament. Unfortunately, the magnitude
of the signals did not allow for any quantitative assessment of the
chlorine emission intensity.
8.11 The N,N-Diethyl7p-toluidine PID.
The PID chambers described previously were
constructed to detect radiation in the wavelength range 125nm to
145nm. Because of the many problems with such low wavelength studies
a longer wavelength PID was examined. The literature was consulted
for a substance with an ionisation potential in the region of 6.9eV
(180nm), having a reasonable vapour pressure (a few torr) at room
temperature. It was hoped to examine with the new device the emission
233
lines from excited iodine, sulphur and phosphorus atoms in the
wavelength region 175nm to 181nm. Possible compounds having an
ionisation potential in the 6.9e7 region are shown in Table 8.2
(158 ,05q). II,N,-diethyl-p-toluidine was available and was used
as the PID filling gas. The usual chamber, with calcium fluoride
window, was employed and the lower wavelength limit was set by the
transmission characteristics of the quartz-bulb EDL sources examined
with this detector. The PID was filled (to ca. 2 torr) with the
organic vapour and operated in a similar manner as for ethylamine
and xylene.
An iodine EDL source was supported in a iwave
resonant cavity and operated at ca. 50 watts applied microwave
power. A current of 3 x 10⁻¹⁰ amperes was obtained with an argon
purged path between the detector and 0ZOL and a PID applied voltage
of 85V. As a similar current was using a high pressure mercury
vapour discharge lamp as the source it was evident that the 11,N,-
diethyl-p-toluidine was capable of detecting radiation of wavelengths
as high as the 184.9nm mercury resonance line; 6.7eV. With no
source emission falling on the detector or a stop placed between
the source and PID, currents of ca. 1012 amperes were obtained.
Cold-Vapour nercury AAS.
A mercury iJ)L was operated at 12W applied
microwave power in a i-wave resonant cavity. The optical path
between the source and detector was provided by a 40mm long, open-
ended cylindrical glass cell (20mm i.d.). With oxygen-free nitrogen
purging of the EDL cavity and optical path the measured current
- was 1.1 x 10
10 amperes. When nitrogen, at the same flow-rate,
was passed over mercury before being introduced into the glass the
234
- - current dropped to 0.7 x 10 10 amperes, but rose again to 1.1 x 10 10
amperes on switching the pure nitrogen directly into the glass cell.
The decrease in current was shown to be due to mercury atomic
absorption of the 184.9nm mercury resonance line by repeating the
experiment using a deuterium arc continuum source; no decrease in
current was observed when the nitrogen was passed over the mercury
pool prior to the glass cell. The small currents observed with
this PID did not allow its spectral bandpass to be determined using
the vacuum monochromator.
8.12 Conclusions.
The preliminary work described here indicated that
simple, high efficiency, narrow spectral bandpass, solar-blind
photoionisation detectors may offer advantages for detection of
radiation at short wavelengths in analytical atomic emission spect-
rometry. They should prove most valuable when used for non-dispersive,
on-line detection systems. The most useful wavelength range for
such detectors lies between 120nm and 200nm and detectors operating
in this region using different window and filler materials have
been described in this chapter.
The two major advantages of the PID over the
alternative and more common vacuum monochromator - photomultiplier-
tube system are the great savings in both cost and space. Correct
and careful assembly of the PID is essential to achieve optimum
results and construction features should include a guard ring to
prevent leakage currents, a thin window to provide high transmittance
over the required spectral bandpass of the PID, and adequate shielding
to prevent air-borne interference causing spurious noise signals.
Current vs applied voltage curves were obtained
235

for the ethylamine PID at various pressures of ethylamine and it
was observed that gas-gains of the order of 103 could be obtained.
For studies of weak ultraviolet sources it would be desirable to
operate the detectors in the gas-gain mode.
By careful selection of window material and filler
gas a large selection of banciasses in the region 105nm to 200nm
are available. As many of the compounds with ionisation potentials
above 150nm are solids at normal temperature a heated chamber is
necessary to achieve adequate vapour pressure of the material.
These experiments used primarily emission techniques
to evaluate the PID. The use of the argon atmospheric microwave
plasma as a vacuum ultraviolet emission source with the PID had
several disadvantages. The high background emission from the plasma
and the difficulties experienced in introducing samples into the
plasma are practical problems not easily solved and contrast with
the intense u.v. atomic emission obtained with this source. The
demountable hollow cathode lamp appears to have a greater potential
as a suitable line emission source for use in the region 105nm to
200nm. However,a more detailed study is required into the possible
use of this source as a quantitative emission system for elemental
analysis.
236

NINE
237

9.1 Conclusion.
This thesis has described the direct. determination
by AAS of iodine and sulphur in aqueous solutions using non-flame
electrothermal graphite atomisers. The vacuum ultraviolet resonance
transitions of these elements have been employed for these studies
and the sensitivities achieved are comparable to those for trace
metal analysis by non-flame AAS.
The major difficulties encountered with atomic
spectrometry in the vacuum ultraviolet have been reviewed and for
the AlS of iodine and sulphur were observed to be:
a) achieving a sufficiently intense line emission source to permit
an acceptable signal-to-noise ratio to be obtained.
b) achieving a sufficiently transparent optical path to allow
the transmission of the source radiation.
c) the construction of a suitable non-flame cell to provide the
atomic species of interest without the associated problem of
interference from background absorption by the hot cell.
Two types of line emission source have been
examined. For the AAS of iodine and sulphur a variety of EDL
sources were considered and the best in terms of signal-to-noise
ratio are those containing iodine as mercuric iodide and sulphur
as hydrogen sulphide. Both lamps are capable of responding to
electronic modulation of the applied microwave power and a comp-
arison between mechanical (chopper) modulation and electronic
modulation has shown the latter to be superior in terms of signal-
to-noise ratio of the emitted resonance radiation. The major
disadvantage of this technique is the need for a specially prepared
(mercuric iodide) lamp in the case of iodine which would follow
the modulating signal. For the iodine studies a water-cooled
238
demountable, hollow cathode lamp has been employed also as a line
emission source. The sensitivities (for 15 absorption) and detection
limits achieved at the two resonance lines examined (183.0nm and
178.2nm) using this source are comparable to those obtained using
the ML source. Fitted with a calcium fluoride window or lithium
fluoride window this HOL may have great potential as a line emission
source for the AAS of phosphorus, bromine and chlorine whose
resonance lines are difficult to obtain from EDL sources.
To achieve a relatively transparent optical
path for the vacuum ultraviolet two techniques have been employed.
The one-metre, grating monochromator was a vacuum system and,
as previously stated, with the rotary and diffusion pumps is capable
of achieving and maintaining pressures of less than 10-6 tors..
The use of an evacuated optical path between the source and entrance
slit of the monochromator was not undertaken. The problems associated
with the construction and operation of such a system would have
far outweighed the few advantages with the apparatus. Instead,
for the optical path and atom cell an inert-gas purging system
has been employed. By passing nitrogen or argon at a relatively
low flow-rate continuously through the glass and aluminium tubing
forming the optical path the majority of atmospheric oxygen and
water vapour is successfully eliminated from the system. Although
this technique requires a constant supply of inert gas for purging
that no vacuum seal must be broken to introduce samples into the
atom cell provided the technique with a simplicity of operation
not achieved with vacuum techniques.
The major problems encountered with the direct
determination of iodine and sulphur by AAS are related to the
239
construction and operation of the atom cell. It has been shown
that the graphite tube furnace employed by Johnson et al. (95 )
for the direct determination of metals at wavelengths in the
middle and near ultraviolet regions is not suitable for routine
vacuum ultraviolet AAS. The background absorption obtained with
this atomiser was severe at 183.Onm and at the sulphur resonance
line (180.7nm) prevented a serious study of this elements AAS
characteristics. It has been demonstrated that the background
interference from the graphite tube atomiser is a function of the
graphite tube - graphite end-piece contact and for the elimination
of this interference no part of this contact can remain in the
optical path. To reduce the dead-time between samples and reduce
the time necessary for drying and purging of the atom chamber a
relatively open atom cell is necessary. The problems associated
with the construction of a tube furnace combining these points
have been discussed and the construction and operation of a furnace
fulfilling these rquirements is described in Chapter Five.
The graphite rod atomiser has been examined
also as an atom cell for sulphur and iodine AAS. The characteristics
of this furnace are midway between those of the small graphite
tube and the graphite filament atomisers. The major advantage
of this cell for vacuum ultraviolet AAS is the ease of purging
the cell of oxygen and sample solvent; this reduces the time per
analysis. Unfortunately, whilst satisfactory results are obtained
with this device for iodine AAS at 183.Onm no atomic sulphur
could be detected at 180.7nm, 182.0nm and 182.6nm. The failure
to perform sulphur AAS with the graphite rod atomiser may be attributed
to the relatively short residence-time of the analyte species
in the hot furnace. Indeed, the volatile nature of the simple
240
sulphur thermal decomposition products (e.g. SO2) appears to be
responsible for the deviations in linearity of the sulphur analytical
curves obtained with the graphite tube furnace. As discussed in
Chapter Five the successful determination of sulphur by AAS appears
to require a long residence-time in the hot environment of the
atomiser to produce a reasonably linear working range for analytical
purposes.
Whilst the sensitivity attained in AAS using
electrothermal atomisers is frequently far superior to that with
flames the non-flame cells, in general, exhibit greater interference from
sample matrix effects e.g. non-specific absorption by thermally
stable salts. Because of the common occurrence of these salts
in the samples frequently encountered with non-flame AAS the lack
of data concerning the nature of this non-specific absorption
is surprising. Chapter Six of this thesis describes a study of
the non-specific molecular absorption observed with some simple
alkali metal salts vaporised in the small graphite tube atomiser
and the commercial HGA 2000 tube furnace. Although the discussion
relates more to the qualitative spectral characteristics of the
molecular absorption, rather than the magnitude and relative
severity of each potential interferant, it is of interest that
the spectra obtained are very similar to those observed using
cool flame cells. The wavelengthsof maximum absorption of incident
radiation corresponded, within experimental error, to the wavelengths
calculated by Herzburg for the electronic transitions of the
gaseous ionic molecules. Thus, the absorption by the salts examined
exhibit a wavelength dependence. To correct for the molecular
absorption by the common inorganic salts studied as interferants
241
in the ASS studies of iodine and sulphur a nearby non-resonance
line has been employed. The lines employed are within 2nm of
the wavelength of the resonance transitions and no changes in the
molecular absorption spectra were observed over the wavelength
region of interest, i.e. in this case the technique of employing
a non-resonance line for background correction is justified. At
the concentration of the salts examined in the molecular absorption
studies no absorption by oxy-anion salts (e.g. nitrates, sulphates,
phosphates, etc.) is observed in the HGA 2000 graphite furnace.
At low wavelengths (in the vacuum ultraviolet)
the complexity and cost of the instruments necessary for quantitative
atomic spectrometry frequently prohibits their use as common,
routine analytical techniques. Partly to simplify the instrumental
arrangements employed in atomic spectrometry the study of non-
dispersive systems has stimulated much research; especially with
atomic fluorescence spectrometry in the middle ultraviolet. The
heart of any non-dispersive apparatus is the detector, which must
have a limited spectral-response bandpass. In the vacuum ultra-
violet such a detector is the photoionisation detector and Chapter
Eight has described the construction, operation and evaluation
of such a device. With intense emission sources (1013 to 1015
quanta.sec-1) currents as high as 10 4 amperes may be generated.
Although this may be considered an upper limit, using a microwave-
excited argon plasma at atmospheric pressure, the maximum current
observed was ca. 10 6 amperes, and more typically 108 amperes.
The spectral selectivity of PID chambers is shown to be dependent
on the nature of window material forming the entrance to the
chamber and the ionisation characteristics of the filling gas
242
or vapour. The use of these detectors for quantitative analysis
was limited in the studies described in this thesis by the emission
systems employed. No emission system capable of producing an
intense, quantitative emission signal from an analyte was available.
9.2 SuFestions For Further Study-.
Following the studies described in this
thesis relating to the non-flame AAS of iodine and sulphur, the
application of the furnace and the techniques described here to
the analysis of 'real' samples would be of interest. This work
could follow two paths. The graphite tube furnace and vacuum
spectrometer assembly of the type discussed in this thesis could
be employed directly or a commercial system, such as the HGA 2000
graphite atomiser and 305B spectrometer, could be modified to enable
the vacuum ultraviolet studies to be conducted. The basic modif-
ications to the Perkin-lmer 305B apparatus for low wavelength
studies have been described by Wilson (75) and were merely the
sealing of the monochromator housing to facilitate inert-gas
purging of the monochromator and extension arms fitted to the ends
of the furnace to prevent the entry of atmospheric oxygen into
the system. To reduce the background absorption observed with
this furnace at wavelengths less than 200nm the graphite end-cones
employed with the furnace could be modified to remove the contact
area from the optical path. An end-window photomultiplier tube
of high gain (e.g. al 6256B) would provide for increased signal-
to-noise ratio of the source emission. Again only minor modifi-
cations to most commercial instruments would be necessary to achieve
this. The background-correction facility of many commercial
instruments is undertaken using a deuterium-arc continuum source
fitted usually with a Vitreosil window. The low wavelength cut-
243

off limit of this material (180nm) and the solarisation of the
window by the ultraviolet radiation with increasing use provides
for only low intensity radiation of wavelengths shorter than ca.
190nm. A continuum source with a thin quartz window or (better)
a sapphire window would not suffer from these disadvantages. The
use of such a background corrector for eliminating or reducing
non-specific absorption is very important at low wavelengths and
would greatly enhance the practical value of non-metal, non-flame
AAS. The lamp housing of most commercial atomic absorption spect-
rometers will allow the use of EDL sources or a demoumtable, hollow
cathode lamp such as described in Chapter Five with little or no
modification.
Wilson (28) has described the use of the Leipert
amplification procedure for increasing the sensitivity of determining
iodine by /US. Iodide in aqueous solutions is oxidised to iodate
by bromine water, the solution is acidified and excess iodide
added. The iodate reacts with the added iodide to liberate six
equivalents of iodide for each equivalent of iodate (or iodide)
in the original sample. The liberated iodine may be separated
from the excess iodide by extraction into an organic solvent (e.g.
MIBIC) and the organic solution nebulised directly into a nitrogen-
separated nitrous oxide-acetylene flame. Unfortunately, the highly
volatile iodine and organic solvent would both be removed from
the furnace during the drying stage if this procedure were applied
to non-flame 112,S. The use of organic solvents with non-flame
techniques at low wavelengths requires a special study. Many
organic solvents have greater absorption coefficients in the vacuum
ultraviolet than water and trace quantities could cause complete
244

abporption of the incident radiation, presenting many problems
should condensation occur along the optical path, as discussed
in Chapter Five for the case of water vapour. Thus, for example,
the determination of sulphur in oils would be best undertaken
probably by oxidation of the sample prior to non-flame AAS.
The direct determination of phosphorus
by non-flame AAS at its vacuum ultraviolet resonance lines has
been demonstrated by L'vov and should be possible using the graphite
tube furnace described in Chapter Five. Studies of phosphorus
EDIL sources (160 have indicated that elevated temperatures are
necessary for the required intense line emission to be achieved
i.e. the use of a thermostated resonant cavity. A preliminary
examination of the demountable hollow cathode lamp containing an
aluminium cathode with a lining of red phosphorus showed the resonance
emission to be reasonably intense but very unstable during operation
for several hours.
At wavelengths shorter than 200nm a serious
problem with non-flame AAS is the intense absorption produced by
the vaporisation of modest amounts of common inorganic salts.
Following the absorption spectra presented in this work a further,
more detailed study as to the nature and magnitude of more inter-
fering salts would be of interest.
The past decade has seen a dramatic growth in
the technique of atomic absorption spectrometry and the field of
atomic emission spectrometry has remained relatively quiet. However,
the use of the radio-frequency, induction-coupled argon plasma
as a high temperature atom cell for atomic emission appears to
promise a renaissance for the atomic emission techniques. An
245
interesting field of study would be the use of such a plasma with
PID chambers for selective, non-dispersive, multi-element atomic
emission spectrometry. a)rokin et al. (162) have examined the
use of organometallic compounds as filler vapours in photoionisation
chambers. Although elevated temperatures (typically 75° to 150°C)
are necessary to achieve a sufficient vapour pressure of the material
the relatively low ionisation potentials of these compounds (typically
160nm to 200nm) enables the construction of PID chambers for
monitoring phosphorus, iodine, sulphur and mercury radiation.
These detectors would be useful for special applications such as
GLC detectors etc .
0000000000000
246
References.
1. Fraunhofer, J., Gilberts Ann. 56, 264 (1817)
2. Kirchoff, G. and Bunsen, R., Fogg. Ann., 110, 161 (1860)
3. "Practical Spectroscopy", Harrison,G.R., Prentice Hall (1942)
4. "Practical Spectroscopy", Cutting, T.A., W.Heinemann Ltd. (1952)
5. Stokes, G.G., Collected Papers, Univ. Press Camb. /1 267 (1880)
6. Schumann, V., Ann. de Phys. 5, 349 (1901)
7. Lyman, T., Mem. Am. Acado Arts Sci., 13, 3 (1906)
8. Millikan, R.A. and Bowen, I.S., Phys. Rev., 23, 1 (1924)
9. Osgood, T.H., Phys. Rev., 22, 567 (1927)
10. Boyce, J.C., Revs. Mod. Phys., 13, 1 (1941)
11. Lyman, T., "The Spectroscopy Of The Extreme Ultraviolet."
Longmans, Green, New York, 2nd. Ed. (1928)
12. Lyman, T., Astrophys J., 60, 1 (1924)
13. Garton, U.R.S., J. Sci. 36, 11 (1959)
14. Cann, M.W.P., Appl. Opt., 8, 1645 (1969)
15. Samson, J.A.R., Planetry Aeronomy V , N.A.S.A. CR-17 (1.963)
16. Golman, K., Physica, 29, 1024 (1963)
17. Samson, J.A.R., "Techniques Of Vacuum U.V. Spectroscopy"
J.Wiley and Sons Inc., (1967)
18. Dickerman, P.J. and Deul, R.W., J..iant. Rad. Transfer,
Al 807 (1964)
19. Wilkinson, P.G. and Byam, E.T., Appl. Opt., 581 (1965)
20. Hunter, W.R., Proc. 10th Colloq. Spec. Int., 247 (1962)
21. Schuler, H., Physik Zeitschr., 22, 264 (1921)
22. Sullivan, J.V. and Walsh, A., Spec. Acta, 21, 721 (1965)
23. Milazzo, G., Appl. Opt., 21, 135 (1967)
24. Newburgh, R.G., Appl. Opt., 2, 864 (1963)
25. Newburgh, R.G., Heroux, L. and Hinteregger, H.E.1 Appl. Opt., 1,.733 (1962)
247

26. Mazzo, G. and Spranzi, N., Appl. Spec., 21, 172 (1967)
27. Milazzo, G. and Sopranzi, N., Appl. Spec., 21, 256 (1967)
28. Wilson, P.J., Ph.D. Thesis Univ. of London (1974)
29. Hittorf, W., Wiedermann's Ann., XXI, 138 (1884)
30. Mansfield., J.M. and Winefordner, J.D., Anal. Chem., 37, 1049 (1965)
31. Dagnall, R.M., Thompson, K.C. and West, T.S.) Talanta, 11A, 551 (1967)
32. Browner, R.F. and Winefordner, J.D., Spec. Acta, 28B, 263 (1973)
33. Davis, D. and Braun, W., Appl. Opt., 7, 2071 (1968)
34. Warneck, P., Appl. Opt., 1, 721, (1962)
35. Samson, J.A.R., Vacuum U.V. Light Sources, N.A.S.A.-395 (1963)
36. Mann, C.K., Vickers,T.J. and Gulick, w.n., Inst. Analysis,
Harper and Row, (1974)
37. Tousey, R., Appl. Opt., 1, 679 (1962)
38. McNasby, J.R. and Okabe, H., Adv. in Photochem., 3, 157 (1964)
39. Carver, J.H. and Mitchell, P., J.Sci. Inst., LI., 555 (1964)
40. Garton, W.R.S., Adv. in At. and Mol. Phys., 2, 93 (1966)
41. Kaye, W.I., Appl. Spec., 15, 130 (1961)
42. Thompson, B.A., Harteck, P. and Reeves, R.R., J.Geophys. Res.68,6431 (1963)
43. Sponer, H. and Teller, E., Rev. of Mod. Phys., 13, 75 (1941)
44. Rowland, H.A., Phil. Mag., 16, 197 (1883)
45. Ducleaux, J. and Jealet, P., J. Phys. Radium, 2, 156 (1921)
46. Koller, L.R., "Ultraviolet Radiation" Chapman and Hall Ltd.,
London, (1952)
47. Golay„ M.J.E., Rev. Sci. Inst., 18, 347 (1947)
48. Sharpe, J., E.M.I. Doc., R/P006 (1961)
49. Dunkelman, L. Fowler, W.B. and Hennes, J., Appl. Opt., 1, 695 (1961)
50. Kaye, W.I., Appl. Spec., 15, 89 (1961)
51. Kaye, W.I., Appl. Spec., 15, 130 (1961)
52. Gunther,F.A., Barkley, J.H., Kolbezen, R.0 and Stagg, R.A.
Anal. Chem., 28, 1985, (1952)
248
53. Malamand, F., Moth. Phys. Analyse., 6, 349 (1970)
54. Gots,'i., Ikeda, S., Hirokawa, A, Senoh, H. and Tokoku, A.,
Japan Analyst, 13, 661 (1964)
55. Konovalov, V.A. and Frisch, S.B., J. Tech. Phys., h, 523 (1934)
56. McNally, J.R., Harrison, G.K. and Rowe, E., J. Opt. Soc. Am.,
37, 93 (1947)
57. Kirkbright, G.F. and Wilson, P.J., Anal. Chim. Acta, 68, 462 (1974)
58. Kirkbright, G.F., Ward,A.F. and West,T.S., Anal. Chim. Acta, 62 (1972)
59. Kirkbright,G.F., Ward, A.F. and*West, T.S., Anal. Chim.Acta,L (1973)
60. Walsh, A., Spec, Acta, 7, 108 (1955)
61. Kirkbright,G.F., Marshall,M. and West,T.S., Anal. Chem., 12379(1972)
62. Kirkbright,G.F., Marshall,M. and West,T.S., Anal. Chem.,4401288(1972)
63. Kirkbright,G.F., Wilson,P.J. and West,T.S.,At. Abs. News.111,53(1972)
64. Kirkbright, G.F., Analyst, 96, 609 (1971)
65. Woodriff, R., Appl. Spec., 28, 413 (1974)
66. Winefordner, J. D. and Vickers T.J., Anal. Chem., ll, 150R (1972)
67. King, A.S., Astrophys. J., 27, 353 (1908) 68. Collins, A.D. and Blackwell, D.E., Appl. Opt., 2, 1606 (1970) 69. L'vov, B.V., Spec. Acta, 17, 761 (1961)
70. L'vov, B.V., Spec. Acta, .2413., 53 (1969)
71. Lvov, B.V., Pure Appl. Chem., 23, 11 (1970)
72. Woodriff, R. and Ramelow, G., Spec. Acta, 23B, 665 (1968)
73. Massmann, H., Spec. Acta, 23, 215, (1968)
74. Manning, D.C., and Fernandez, F., At. Abs. News., 9, 65 (1970)
75. Kirkbright,G.F. and Wilson,P.J., At. Abs. News., 11, 140 (1974)
76. Morrow, R.W. and McElhaney, R.J., Appl. Spec., 27, 386 (1973)
77. Amos, N.D. and Matousek, J.P., Paper J2, Pitts. Conf., (1972)
78. Becker-Ross, H. and Fp1k, 4th Int. Conf. Appl. Spec.,
Toronto, Can. (1973)
79. Alder, J.F., and West, T.S., Anal. Chim. Acta, 51, 365 (1970)
80. Marshall, M., Ph.D. Thesis, London Univ., (1972)
249

81. Cantle, J.E. and West, T.S., Talanta, 20, 5 (1973)
82. Baird, R.2. and Gabrielian, S.M., Appl. Spec., 28, 273 (1974)
83. Donega, H.M. and Burgess, T.E., Anal. Chem., 1521 (1970)
84. Russell, B.J. and Walsh,A., Spec. Acta, 15, 883 (1959)
85. Garton, Adv. in Atomic and Phys., 2, 93 (1966)
86. Nelson, L.S. and Kuebler, N.A., Spec. Acta, 19, 781 (1963)
87. Wendt, R.R. and Tassel, V.A., Anal. Chem., 337 (1966)
88. Veillon, C. and Margoshes, M., Spec. Acta, 23B, 503 (1968)
89. Biochemists Handbook, Ed. C. Long, Spon (1961)
90. Yamamoto, Y., Humumani, T., Hayashi, Y. and Otani, Y.,
Bull. Chem. Soc. Japan, 38, 2204 (1965)
91. Kumumani,*T., Bull. Chem. Soc. Japan, .142, 956 (1969)
92. Christian, G.D. and Feldman, F.J., Anal. Chem. Acta, 40, 173 (1968)
93. Kiess, C.E. and Corliss, C,H., J. Res. Nat. Bur. Std.,
63A, 1 (1959)
94. Lawrence, G.M., Astrophys. J., 148, 261 (1967)
95. Dagnall, R., Johnson, D. and West, T.S., Anal. Chin. Acta,
67, 79 (1973)
96. Hieftje, G.M., Anal. Chem., 81A (1972)
97. Hieftje, G.M., Anal. Chem., /L, 69A (1972)
98. Sharpe, J., R/P021 Y 70, En' Symposium,(1964)
99. Wiese, W.L., Smith,M.W. and Miles, B.N.,
N.S.R.D.S. — N.B.S. 22, At. Trans. Probs., II, Washington D.C. (1969)
100. Lawrence, G.M., Astrophys J., 148, 261 (1967)
101. Magyar,B., Santos, F., Hely. Chien. Acta, 52, 820 (1969)
102. Dunk, R., Mostyn, R.A. and Hoare, P.C., At. Abs. News.,
8, 79 (1969)
103. Looyenga, R.U. and Huber, C.O., Anal. Chin. Acta, 55 , 179 (1971)
104. Rose, S.A. and Holtz, D.T., Anal. Chin. Acta, Lo 239 (1969)
105. Jugneis, E. and Anavi, Z., Anal. Chin. Acta, 55, 179 (1971)
250
106. Salet, J. Bull. Soc. Chim. Fr., 68, 404 (1869)
107. Veillon, C. and Park, J.Y., Anal. Chim. Acta, 60, 293 (1972)
108. Aldous, K.M., Dagnall, R.M. and West, T.S., Analyst, 15, 417 (1970)
109. Everett, G.L. and West, T.S., Anal. Chia:. Acta, 68, 387 (1974)
110. Belcher, R., Bogdanski, S.L. and Townshend, A.,
Anal. Chim. Acta, 67, 1 (1973)
111. Aldous, K.M., Dagnall, R.M., Pratt, S.J. and West, T.S.,
Anal. Chem., j, 1851 (1969)
112. Kirkbright, G.F. and Marshall, M., Anal. Chem., ZA, 1288 (1972)
113. Phillips, L.P., Rev. Sci. Inst., 2,2, 7 (1971)
114. Browner, R.F., Dagnall, R.M. and West, T.S., Anal. Chim. Acta,
Z11 163, (1969)
115. Dagnall, R.M., Silvester, M.D. and West, T.S., Talanta, 18, (1971).
116. L'vov, B.V., "Atomic Absorption Spectrochemical Analysis"
Adam Hilger Ltd., (1970)
117. Baird, R.B. and Gabrielion, Appl. Spec., 28, 273 (1974)
118. Rubeska, I. and Svoboda, V., Anal. Chim. Acta, 2z, 253 (1965)
119. Mitchell, A.C.G. and Zemansky„ M.N.,
"Resonance Radiation and Excited Atoms", Cambridge Press (1971)
120. Wiese,W.L., SmithIM.W. and Miles,B., IS.R.D.S.-U.B.S.22,II, (1969)
121. Parsons,M.,McCarhy,W. and Winefordner,J.,Appl.Spece,20,2231(1966)
122. Kirkbright, G.F. and Marshall, M., Anal. Chem., LA, 7 (1972)
123. L'vov, B.V., AAS - Sheffield Conf., 11 (1969)
124. Fuwa, K. and Vallee, B.L., Anal. Chem., Z1.1 188 (1969)
125. Thompson, B.A., Harteck, P. and Reeves, R.R.,
J. Geophys. Res., 68, 6431 (1963)
126. High Temperature Properties and Decomposition of Inorganic Salts.
Part 1. Sulrthates, - :1.13.S. 7 (1966)
127. Ottoway, J.M. and Campbell, W.E., Talanta, 21, 837 (1974)
128. L'vov, B.V. and Khartsyzov, A.D., Zh. Prikl. Spectrosk., 11, 9 (1969)
129. Thompson, K.C., Spectroscopy Letts., 3, 59 (1970)
251
130. Kirkbright, G.F. and Wilson, P.J., At. Abs. News., 13, 140 (1974)
131. Wood, S.J., Ph. 1). Thesis, London Univ., (1971)
132. Koirtychann, S.R. and Pickett, E.E., Anal. Chem., 38, 585 (1966)
133. Muller, L.A., Ann. Physik, 82, 39 (1927)
134. Koirtyohann, S. and Pickett, E.E., Anal. Chem., 35 1C37 (1966)
135. Ediger, R.D. Peterson, G.E. and Kerber, J.D.,
At. Abs. News., 13, 61 (1974).
136. Culver, B.R. and Surles, T., Anal. Chem., Z2, 920 (1975)
137. Fuller, C.W., Anal. Chico. Actal 62, 442 (1972)
138. Clark, D., Dagnall, P.M. and West, T.S., Anal. Chim. Acta,
63, 11 (1973)
139. Findlay, W.j., Zdrojewski,A. and ':cuickest, N., Specroscopy Letts.,
7, 63 (1974)
140. Johnson, D.J., Sharp, B.L. and West, T.S., Anal. Chem., L7, 1234 (1975)
141. Browner, R.F. and Winefordner, J.D., Anal. Chem., 44, 247 (1972)
142. Crosser, M.S. and Mullins, C.E., Anal. Chim. Acta, 68, 377 (1974)
143. Bratzel, M.D. and Chakrabarti, C.L., Anal. Chim. Acta, 63, 1 (1973)
144. Carver, J.H. and Mitchell, P., J. Sci. Inst., 555 (1964)
145. Byrann, A., Astrophys. J., 121, 480 (1956)
146. Byrann, A., Astrophus. J., 128, 738 (1958)
147. Chubb, T.A. and Friedman, H., Spec. Acta, 8, 121 (1956)
148. Strober, A., Scolnik, R. and Hennes, J.P., Appl. Opt., 2, 735 (1963)
149. Davis, D. and Braun, W., Appl. Opt., 7, 2071 (1968)
150. Vilesov, F.I., Sov. Phys. Usp., 6, 888 (1964)
151. Wigner, E.P., Phys. Rev., 73, ICO2 (1948)
152. Coltman, S., Phys. Rev., 102, 171 (1956)
153. Terenin, and Vilesov, F.I., Adv. in Photochem., 2, 385 (194)
154. Sharp, B., Ph.D. Thes-is, Univ. of London (1972)
155. Hurzeler, H., Inghram, M.G. and Morrison, J.D., J.Chem. Phys.,
28, 76 (1958)
252
156. Wilkinson, P.G., Johnston, H.L., j.Chem. Phys., 18, 190 (1950)
157. Johnson, D., M.D. Thesis, Univ. of London (1973)
- 158. "Ionisation Potentials, Appearance Potentials and heats Of
Formation Of Gaseous Positive Ions" U.S.N.B.S. (1969)
159. Handbook Of Chemistry and'Physics, E62, Chemical rubber Co.
160. Kristianpoller,N. and KnappIR.A., 53rd. Ed. (1973)
Appl. Opt., 915 (1964)
161. Bartley, D., Private Communication.
162. Sorokin, L.S., Adamchuk, V.K. and Dmitriev, A.B.,
Prib. i Tekhnika 2ks., .1216 (1970)
253