some examples of airgrav vector gravity data and
TRANSCRIPT

Sander Geophysics
Some Examples of AIRGrav Vector Gravity Data and Comparison with Ground Truth
Marianne McLeish, Steve Ferguson Sander Geophysics

Presentation Outline
• About Sander Geophysics
• AIRGrav System
• Comparison to ground truth (Kauring Test Area)
• AIRGrav results of the “Geodetic Slope Validation Survey 2014” test line

Sander Geophysics • High resolution airborne geophysics – petroleum, mineral, environmental • Founded in 1956 currently 150 employees, 17 aircraft • Head office at the Ottawa International Airport, Canada • World-wide operations – fixed-wing and helicopter

AIRGrav System
• AIRGrav designed and built specifically for airborne gravity surveying by SGL
• 10 years of R&D following by 16 years of survey flying, 12 gravimeters
• Three axis (x y z) gyro stabilized platform, three (x y z) accelerometers
• Dual frequency GPS receivers • Gravity = inertial accelerations – GPS
accelerations • Raw gravity data sampled at 128 Hz
Airborne Inertially Reference Gravimetry

AIRGrav Operations • < 100 kg – can be used in any of SGL’s aircraft and others • Concurrent magnetic, radiometric, methane sensing, LIDAR, etc. • Height above ground level: 60 m to 1000 m or higher • Operate under normal flight conditions • Short lead-ins to lines • Drape surveys – unaffected by horizontal accelerations and turbulence

Comparison to Ground Truth Kauring Test Area
Established by Geoscience Australia, Geological Survey of Western Australia, Rio Tinto Ltd. And CGG-Airborne
Located approximately 100 km East of Perth, Australia
Gently rolling topography, 200 – 400 m ASL
Larger “AG” area is ~21 km E-W and 20 km N-S
Ground data spaced at ~500 m Smaller “AGG” area is ~5.6 km by 5 km,
centred in the AG area AGG area has dense ground data to
allow airborne gradiometer testing

Comparison to Ground Truth Survey Description
Approx 21 km x 20.5 km 200 m line spacing 2 km control line spacing Flown in 2012 for Victoria Department of
Primary Industries Nominal clearance of 80 m
• AIRGrav Data • Line data low pass filtered to 40 sec full
wavelength • Gridded with 50 m cell size • Traverse and control line data adjusted at
intersections

Comparison to Ground Truth
Reference Data Grid all available ground data at 50 m
interval Upward continue to surface defined by
flight data, using frequency domain method
Vertically integrate Gz at flight height and create horizontal derivatives
Correct for long wavelength errors using EGM2008

Reference East Gravity Component
Measured East Gravity Component

East Gravity Component Comparison with Reference
Filter (m)
Lowpass (GE – Ref) (mGal)
Lowpass (GE)– Ref (mGal)
750 0.61 0.62
1125 0.59 0.60
1500 0.57 0.59
*filters are stated as half-wavelengths

Reference North Gravity Component
Measured North Gravity Component

North Gravity Component Comparison with Reference
Filter (m)
Lowpass (GN – Ref) (mGal)
Lowpass (GN)– Ref (mGal)
750 0.85 0.85
1125 0.83 0.84
1500 0.81 0.83
*filters are stated as half-wavelengths

Reference Vertical Gravity Component
Measured Vertical Gravity Component
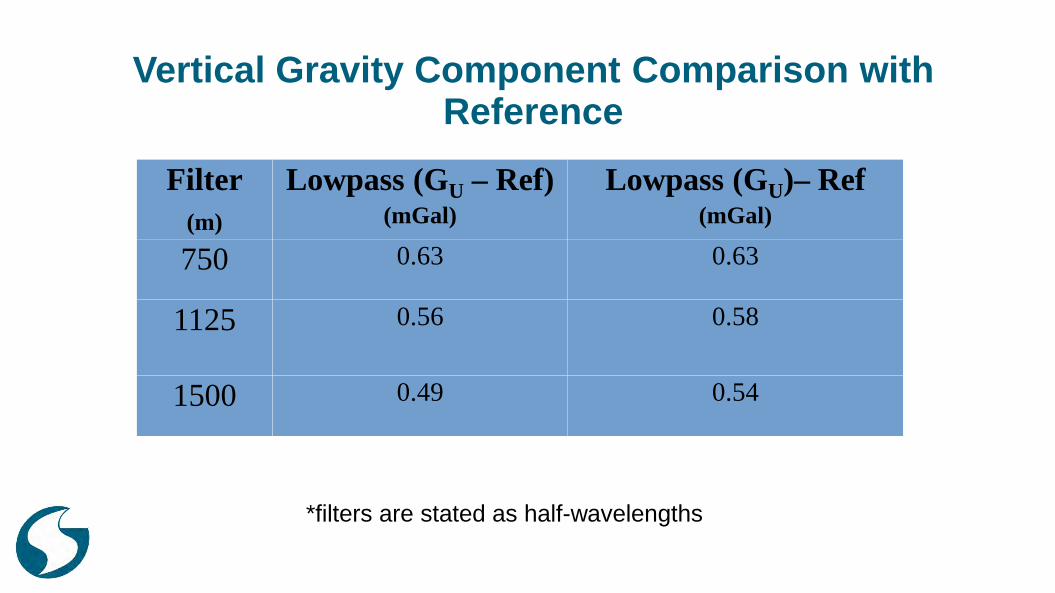
Vertical Gravity Component Comparison with Reference
Filter (m)
Lowpass (GU – Ref) (mGal)
Lowpass (GU)– Ref (mGal)
750 0.63 0.63
1125 0.56 0.58
1500 0.49 0.54
*filters are stated as half-wavelengths

Kauring Conclusions Kauring area is probably the most accurate gravity
test site available Contains challenging small anomalies suitable for
testing gravity gradiometers AIRGrav matches reference data to ~0.6 mGal at
750 m wavelength, ~0.5 mGal at 1125 m wavelength Bouguer corrected gravity data produces slightly
better results: matches reference data to ~0.4 mGal at 1000 m wavelength
Horizontal components match to ~0.6 mGal (east) and ~0.8 mGal (north) at 1125 m wavelength
Integral transform of east and north components produces independent estimate of the vertical gravity component to ~0.8 mGal at 1125 m wavelength

Geoid Slope Validation Survey 2014 GSVS14 represents the second survey
conducted by the NGS to test the accuracy of the gravimetric geoid model, which will be the basis for the next American Vertical Datum
It was conducted in Iowa, predominantly along Highway 30, from Denison to Cedar Rapids
~ 200 miles (325 km) long, 204 survey benchmarks
Medium-high, relatively flat, and gravimetrically complex area ranging from 740 feet to 1,440 feet above sea level

SGL GSVS14 Survey Flight Information
• June 28, 2015 • Repeat line flown West
then East • 600 m ellipsoidal (~ 400
m AGL at East end, ~200 m AGL at West end)
• 320 km long • ~ 55 m/s (200 km/h) • Also flown next day at
2185 m ellipsoidal, 58 m/s, West and East (results not presented here) GSVS14 line = Red SGL flown line = Yellow

• Kalman Filter combination of GPS positions and gravimeter accelerations
• EGM 2008 used during processing to loosely constrain horizontal component estimates, which are corrupted by uncertainty in gyro drift
• 100 s (5.5 km) full wavelength filter applied
Processing Steps

• Blue = Westward
• Red = Eastward
• Std dev from mean = 0.582 mGal
• W std dev from EGM2008 = 1.27 mGal
• E std dev from EGM2008 = 1.21 mGal
East Component

• Blue = Westward
• Red = Eastward
• Std dev from mean = 0.567 mGal
• W std dev from EGM2008 = 1.35 mGal
• E std dev from EGM2008 = 1.62 mGal
North Component

• Blue = Westward
• Red = Eastward
• Std dev from mean = 0.418 mGal
• W std dev from EGM2008 = 1.62 mGal
• E std dev from EGM2008 = 1.67 mGal
Normal Gravity Disturbance

• Comparison of EGM 2008 with both the Eastward and Westward passes indicates a sloping trend
• Likely indicates error in EGM 2008
• ~ 2 mGal error over 4° longitude
EGM 2008 error trend

• Horizontal components
corrected for remaining long wavelength error (600 km full-wavelength) using EGM 2008
• Integrate horizontal components along flight path (Westward and Eastward separately) to compute relative equipotential surfaces
• West std dev of diff = 11.3 mm • East std dev of diff = 11.5 mm
Difference of Equipotential Surfaces and EGM 2008

• Standard deviation of the difference between the Eastward and Westward computed relative equipotential surfaces = 2.03 mm
Difference of Computed Relative Equipotential Surfaces

Conclusions AIRGrav produces measurements of three gravity components repeatable at
the sub-mGal level Data is capable of extending the EGM2008 model to wavelengths as short as
5 km Capable of producing equipotential surfaces accurate to mm level Horizontal components can be used to verify geoid models – have provided
data to Geodetic Survey Division of NRCan

Thank you!
The processing team at SGL Stefan Elieff for his work on the Kauring Test Area data