some aspects of the static and dynamic compressive behaviour of β-brass single crystals
TRANSCRIPT
J O U R N A L O F M A T E R I A L S S C I E N C E 10 ( 1 9 7 5 ) 1 4 0 5 - 1 4 1 8
Some aspects of the static and dynamic compressive behaviour of p-brass single crystals
N. D. BROOM* , A. L. T I T C H E N E R Department of Mechanical Engineering, University of Auckland, New Zealand
The compressive behaviour of/3-brass single crystals has been investigated in uninterrup- ted static and dynamic tests and in interrupted tests using static-static, static-dynamic, dynamic-dynamic and dynamic-static loading sequences. Static and dynamic strain-rates were 1.5 x 10-' and 3.2 • 10 ~ sec -1 respectively. Slip traces on the statically deformed crystals were wavy and deformation occurred by single slip on either (T01) I-111] or (~11) 1-111] or by a transition mode involving both (T01) [111] and (7.11 [111]. Except for anomalous behaviour in the dynamic reload following static preload the dynamic slip traces were straight with deformation occurring by multiple slip on four {11 O} planes involving two (111) directions. It is shown that there is no direct causal relationship between the lower work-hardening rate and level of flow stress and the crystallography of slip in dynamic deformation. The work-hardening rate and flow stress in static and dynamic loading are rather determined by the dynamics of the deformation. The differences in the substructural features as observed by transmission electron microscopy arise principally from the differences in the slip modes and cannot be interpreted as controlling the stress-strain behaviour. The low work-hardening rate and flow stress in dynamic deformation is believed to be due to the production of short-lived disorder. The absence of a/2(111~ dislocations in thin foils is explained in terms of the fast reordering reaction in /3-brass.
1. I n t r o d u c t i o n The compressive behaviour of fl-brass single crystals has recently been reported [1, 2] as a function of temperature and rate of deformation. The dynamic stress/strain curves, which were obtained at strain-rates in the range 20 to 10 ~ sec -1, exhibited several unusual features. The most striking feature is that the dynamic work-hardening rate and flow stress were lower than for static deformation. Such beha- viour does not appear to have been observed in any other metal or alloy.
Titchener and Ferguson [2], besides reporting the stress/strain behaviour in normal un- interrupted static and dynamic tests, also investigated the effect of interrupting the tests, i.e. unloading and reloading the specimens. Four sequences of preload-reload are possible, namely static-static, dynamic-dynamic, static-
dynamic and dynamic-static. Titchener and Ferguson noted unusual behaviour in tests involving a static-dynamic sequence. In the dynamic reload, after the initial upper yield point that was always present, the flow stress was less than the flow stress at which the static preload had ceased. In some tests the flow stress in the dynamic reload appeared to be little different from that obtained in an uninterrupted dynamic test at the same total strain.
Titchener and Ferguson [2] postulated that the observed dynamic behaviour of their crystals was analogous to the behaviour of statically deformed disordered alloys in that they showed coarse slip and a reduced rate of work- hardening. They suggested that such behaviour could be a consequence of the movement of (a/2) (1 1 1) dislocations rather than super- dislocations and that the stresses reached at the
*Present address: Department of Metallurgy and Material Science, University of Cambridge, Pembroke Street, Cam- bridge, UK. �9 1975 Chapman and Hall Ltd. 1405
N. D. B R O O M , A. L. T I T C H E N E R
upper yield in the dynamic tests might be high enough to enable the dislocations to move as unit (a/2) (1 1 1) dislocations.
It is plausible to suppose that a knowledge of the slip behaviour and the dislocation sub- structure associated with the static and dynamic regimes of deformation may assist in an under- standing of the unusual features of the stress/ strain curves offl-brass single crystals, and throw light on the postulated mechanism of dynamic deformation. The present paper, which is aimed at elucidating the mechanisms of deformation of fl-brass single crystals, reports the analysis of slip traces and the substructural changes observed by transmission electron microscopy. It deals with the stress/strain behaviour under uninterrupted and interrupted static and dynamic compression.
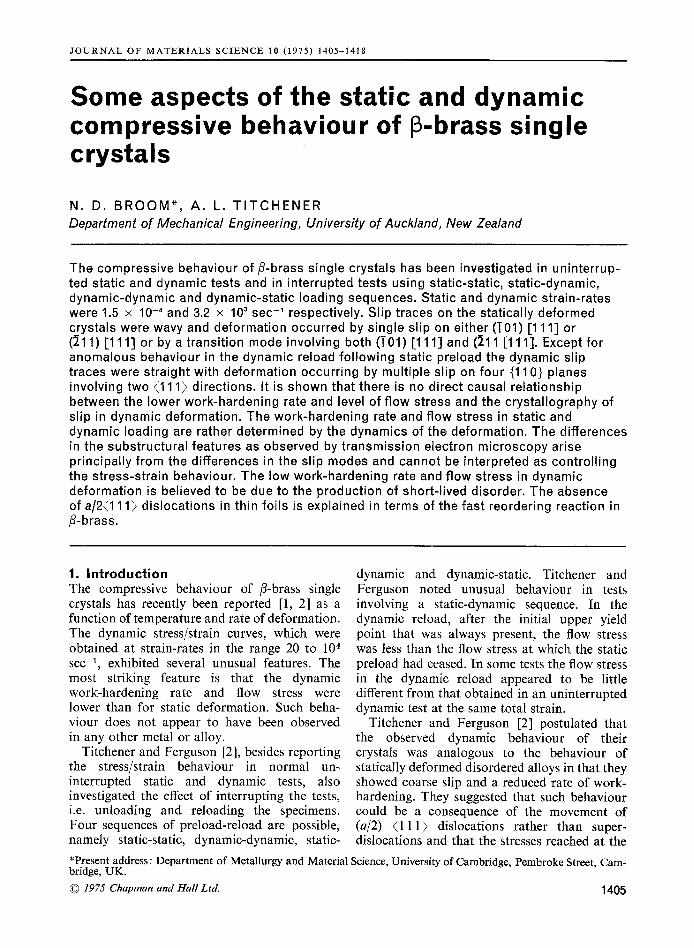
2. Experimental Four single crystals of predetermined orientation were grown from the melt by a method similar to that described by Ferguson and Titchener [1 ]. The orientation selected for investigation was one which displayed the distinctive dynamic behaviour observed by Titchener and Ferguson [2], and the crystals were produced by reseeding from four portions of one crystal. The orienta- tion is shown in Fig. 1, which also snows the small variations arising from the reseeding technique. Small accidental differences in com- position (from 51.41 to 52.31~ Cu) had no observable effect on the behaviour of the crystals. A check spectrographic analysis of one of the crystals is presented in Table I. Parallel-ended damage-free specimens 0.180 to 0.190 in. diameter by 0.200 to 0.220 in. long were pre-
il l
001 011
Figure 1 Orientation of crystals used in the present investigation.
1406
T A B L E I Impurity levels in fl-brass single crystals
Impurity Amount (ppm)
Lead 20 Tin < 5 Iron 70 Nickel 20 Silver 30 Manganese < 5 Cadmium Trace Bismuth < 10 Antimony < 20 Arsenic < 20 Aluminium < 5
pared from these crystals using standard spark- erosion and electropolishing techniques.
Specimens were compressed uniaxially at room temperature in uninterrupted static and dynamic loading respectively, and by interrupted loading using static-static, static-dynamic, dynamic-dynamic and dynamic-static loading sequences. The static and dynamic loading rates were 1.5 x 10 -~ and 3.2 x 10³ sec -1 respectively. Static tests were carried out in an Instron testing machine, the autographic load/compression curves being corrected for machine deflection. The dynamic tests were carried out using the split-Hopkinson-bar technique used by Titchener and Ferguson [2] with some minor modifications to the recording procedure. The method of analysing the dynamic data was a simplification of that used by Campbell and Duby [3] and Hauser et al. [4]. When the specimen strength is small compared with the stress in the input bar, the stress transmitted to the output bar is a close approximation to the average stress in the specimen. Also the variation in strain-rate during the test is small. The relatively low ratio of length to diameter of the specimens was necessary in order to avoid difficulties in dynamic testing [5, 6]. Ferguson [7] found that varying the length/diameter ratio of his specimens between 0.4 and 2.0 had no effect on the dynamic stress/strain curve. However, since he observed barrelling at the larger ratios, these were avoided in the present investigation.
Most specimens were deformed to predeter- mined strains. In the dynamic test this was achieved by placing the specimen inside a hardened steel spacer in the form of a cylindrical annulus. Spacer and specimen were placed between the input and output bars and the loading on the specimen was, therefore, relieved when it had been compressed to a length equal to
T H E C O M P R E S S I V E B E H A V I O U R O F B - B R A S S S I N G L E C R Y S T A L S
that of the spacer. To prevent accidental re- loading after the first impact the cavity between the spacer and the specimen was partially filled with petroleum jelly, and the upper bar, the spacer and the lower bar were taped together. Between the preload and reload sequences in the interrupted tests the slip traces on the specimen were analysed and then removed by electro- polishing to enable the reload traces to be investigated. The time interval required for analysing the preload slip traces, removing them, and inserting the specimen into the equipment for reloading was maintained constant at 4 h; an appreciably shorter interval than this could not be achieved. The effects of any ageing between preload and reload were examined by means of a series of static-static and static- dynamic tests with varying intervals of ageing between preload and reload. Analysis of slip traces was not possible in such tests when the time of interruption was short.
The operative slip planes were determined by a combination of X-ray techniques and optical microscopy using Nomarski interference con- trast.
Thin foils for examination by transmission electron microscopy were prepared, by means of a conventional disc technique, from variously oriented slices cut from the deformed crystals by spark erosion. All foils were examined at 100 kV. The Burg+rs vectors of dislocations observed in the thin foils were determined by comparing the experimental images obtained using two-beam conditions with theoretically computed images of dislocations generated from programmes
developed by Head [8] and Humble [9]. Dis- location densities in the deformed crystals were determined using a technique described by Shtremel and Belykov [10].
3. Results 3.1. U n i n t e r r u p t e d t e s t s 3.1.1. Stress/strain curves and s/ip-trace
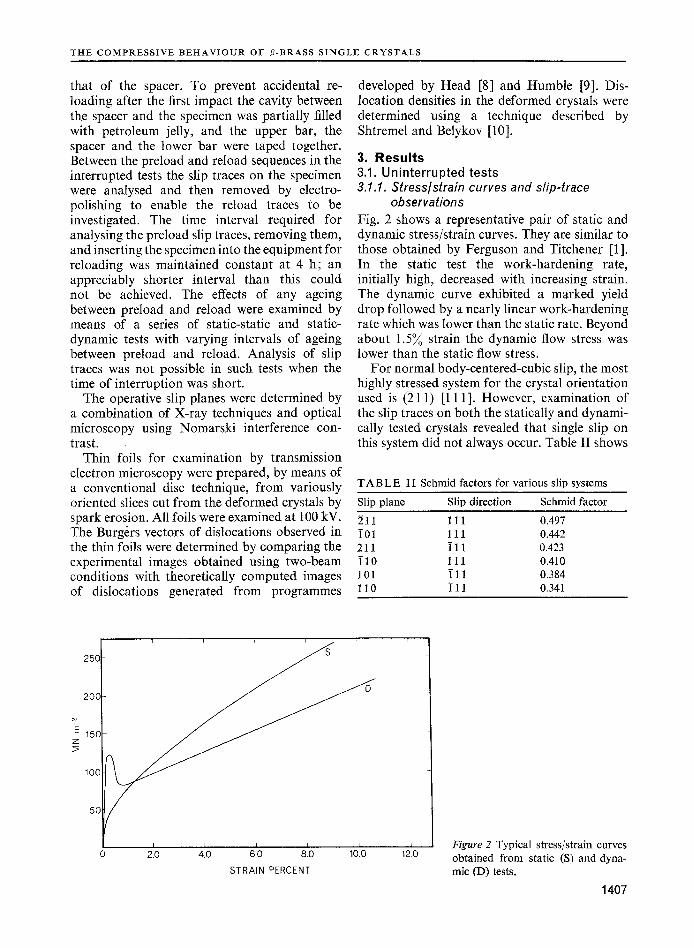
observations Fig. 2 shows a representative pair of static and dynamic stress/strain curves. They are similar to those obtained by Ferguson and Titchener [1]. In the static test the work-hardening rate, initially high, decreased with increasing strain. The dynamic curve exhibited a marked yield drop followed by a nearly linear work-hardening rate which was lower than the static rate. Beyond about 1.5~ strain the dynamic flow stress was lower than the static flow stress.
For normal body-centered-cubic slip, the most highly stressed system for the crystal orientation used is (21 1) [1 1 1]. However, examination of the slip traces on both the statically and dynami- cally tested crystals revealed that single slip on this system did not always occur. Table II shows
TABLE II Schmid factors for various slip systems
Slip plane Slip direction Schmid factor
211 111 0.497 i01 111 0.442 211 i l l 0.423 110 111 0.410 101 i l l 0.384 110 i l l 0.341
1,0[
0 2.0 4.0 6.0 8.0 10.0 12,0
STRAIN PERCENT
Figure 2 Typical stress/strain curves obtained from static (S) and dyna- mic (D) tests.
1407
N. D. B R O O M , A. L. T I T C H E N E R
the Schmid factors for this and other highly stressed systems.
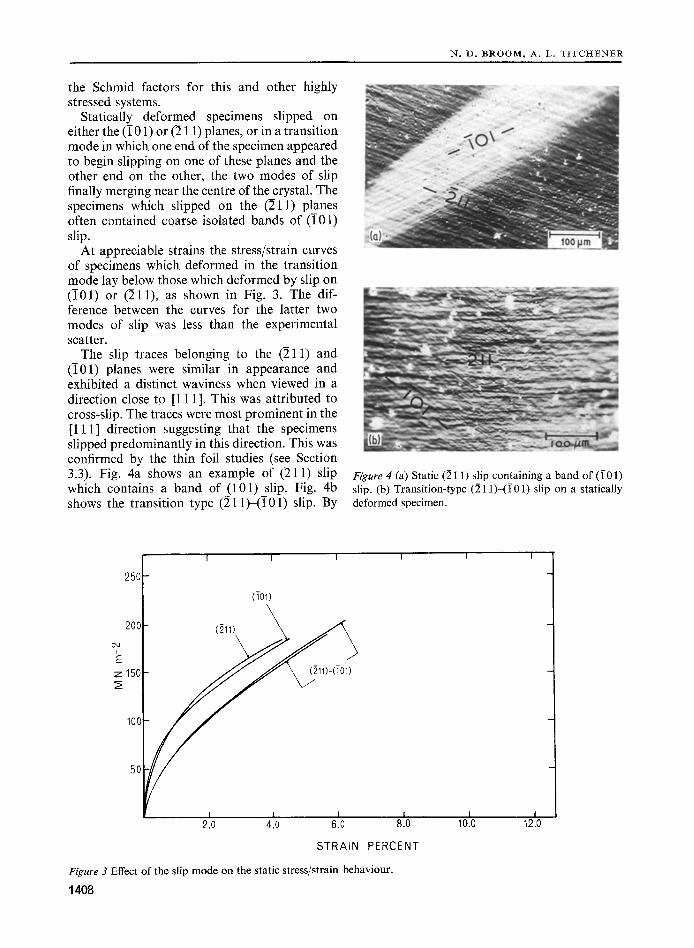
Statically deformed specimens slipped on either the (501) or (211) planes, or in a transition mode in which one end of the specimen appeared to begin slipping on one of these planes and the other end on the other, the two modes of slip finally merging near the centre of the crystal. The specimens which slipped on the (211) planes often contained coarse isolated bands of ( i01) slip.
At appreciable strains the stress/strain curves of specimens which deformed in the transition mode lay below those which deformed by slip on ( i01) or (211), as shown in Fig. 3. The dif- ference between the curves for the latter two modes of slip was less than the experimental scatter.
The slip traces belonging to the (211) and (501) planes were similar in appearance and exhibited a distinct waviness when viewed in a direction close to [111 ]. This was attributed to cross-slip. The traces were most prominent in the [111] direction suggesting that the specimens slipped predominantly in this direction. This was confirmed by the thin foil studies (see Section 3.3). Fig. 4a shows an example of (211) slip which contains a band of (501) slip. Fig. 4b shows the transition type (211)-(5 01) slip. By
250
(TO1)
200
I
z 150
I0C
50
I I I I L I
Figure 4 (a) Static (211) slip containing a band of (i01) slip. (b) Transition-type (211)-(i 01) slip on a statically deformed specimen.
I I I I I I 2.0 4.0 6.0 8.0 10.0 12.0
STRAIN PERCENT
Figure 3 Effect of the slip mode on the static stress/strain behaviour.
1408
T H E C O M P R E S S I V E B E H A V I O U R O F f 3 - B R A S S S I N G L E C R Y S T A L S
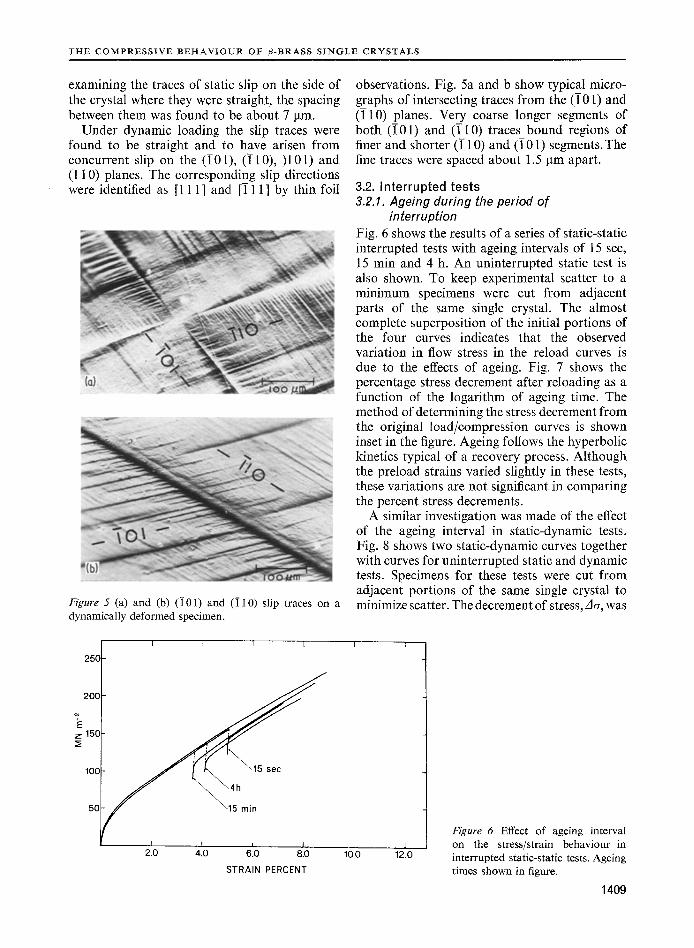
examining the traces of static slip on the side of the crystal where they were straight, the spacing between them was found to be about 7 lain.
Under dynamic loading the slip traces were found to be straight and to have arisen from concurrent slip on the (i01), (510),)101) and (110) planes. The corresponding slip directions were identified as [111] and [111] by thin foil
Figure 5 (a) and (b) ( i 01 ) and ( i l 0 ) slip traces on a dynamically deformed specimen.
2513
200
E z 150
100
50
i 1 I [ I
l 4h~15 s e c
I 210 4.0 61.0 8.0 1010
STRAIN PERCENT
observations. Fig. 5a and b show typical micro- graphs of intersecting traces from the (I01) and (510) planes. Very coarse longer segments of both ([01) and (510) traces bound regions of finer and shorter (i 10) and (i01) segments. The fine traces were spaced about 1.5 gm apart.
3.2. Interrupted tests 3.2.1. Ageing during the period of
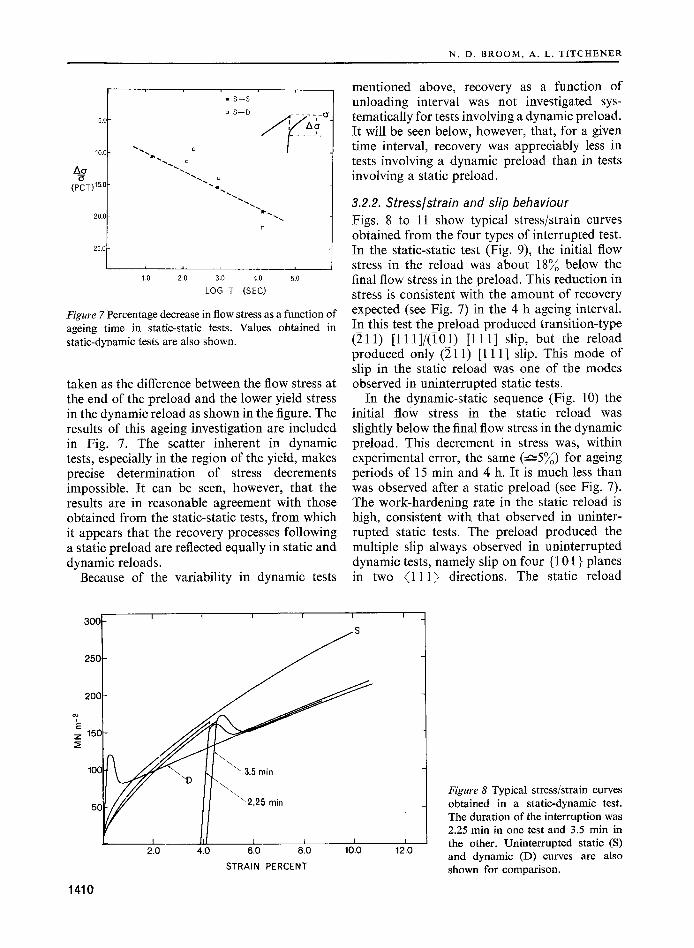
interruption Fig. 6 shows the results of a series of static-static interrupted tests with ageing intervals of 15 sec, 15 rain and 4 h. An uninterrupted static test is also shown. To keep experimental scatter to a minimum specimens were cut from adjacent parts of the same single crystal. The almost complete superposition of the initial portions of the four curves indicates that the observed variation in flow stress in the reload curves is due to the effects of ageing. Fig. 7 shows the percentage stress decrement after reloading as a function of the logarithm of ageing time. The method of determining the stress decrement from the original load/compression curves is shown inset in the figure. Ageing follows the hyperbolic kinetics typical of a recovery process. Although the preload strains varied slightly in these tests, these variations are not significant in comparing the percent stress decrements.
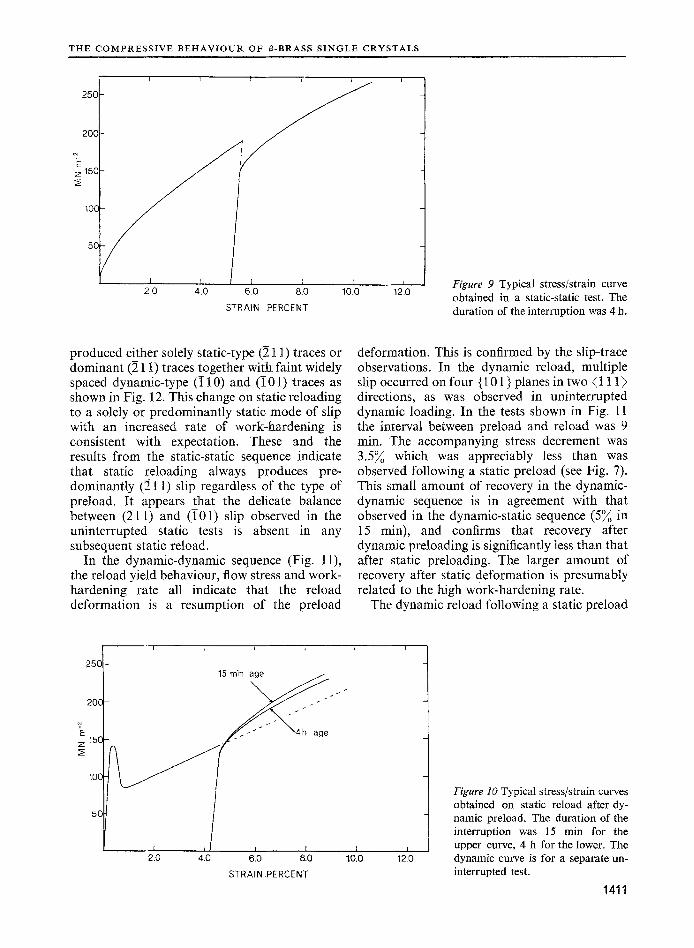
A similar investigation was made of the effect of the ageing interval in static-dynamic tests. Fig. 8 shows two static-dynamic curves together with curves for uninterrupted static and dynamic tests. Specimens for these tests were cut from adjacent portions of the same single crystal to minimize scatter. The decrement of stress,Act, was
i
1 12.0
Figure 6 Effect of ageing interval on the stress/strain behaviour in interrupted static-static tests. Ageing times shown in figure.
1409
N. D. BROOM, A. L. TITCHENER
10,(
(PCT) 15x
20.(
25.s
�9 S - - S
o S - - D
13
. . . . . i - O"
_ J .
i i i i
1.0 2 .0 3.0 4.0 5.0
LOG T (SEC)
Figure 7 Percentage decrease in flow stress as a function of ageing time in static-static tests. Values obtained in static-dynamic tests are also shown.
taken as the difference between the flow stress at the end of the preload and the lower yield stress in the dynamic reload as shown in the figure. The results of this ageing investigation are included in Fig. 7. The scatter inherent in dynamic tests, especially in the region of the yield, makes precise determination of stress decrements impossible. It can be seen, however, that the results are in reasonable agreement with those obtained from the static-static tests, from which it appears that the recovery processes following a static preload are reflected equally in static and dynamic reloads.
Because of the variability in dynamic tests
mentioned above, recovery as a function of unloading interval was not investigated sys- tematically for tests involving a dynamic preload. It will be seen below, however, that, for a given time interval, recovery was appreciably less in tests involving a dynamic preload than in tests involving a static preload.
3.2.2. Stress/strain and slip behaviour Figs. 8 to 11 show typical stress/strain curves obtained from the four types of interrupted test. In the static-static test (Fig. 9), the initial flow stress in the reload was about 18% below the final flow stress in the preload. This reduction in stress is consistent with the amount of recovery expected (see Fig. 7) in the 4 h ageing interval. In this test the preload produced transition-type (211) [ l l l ] / ( i 0 1 ) [111] slip, but the reload produced only (211) [111] slip. This mode of slip in the static reload was one of the modes observed in uninterrupted static tests.
In the dynamic-static sequence (Fig. 10) the initial flow stress in the static reload was slightly below the final flow stress in the dynamic preload. This decrement in stress was, within experimental error, the same (-'-5%) for ageing periods of 15 min and 4 h. It is much less than was observed after a static preload (see Fig. 7). The work-hardening rate in the static reload is high, consistent with that observed in uninter- rupted static tests. The preload produced the multiple slip always observed in uninterrupted dynamic tests, namely slip on four {101 } planes in two (111) directions. The static reload
30(3
25C
20C
E 150
100
50
1410
I I
I 2.0 4.O
I I I
~ 3 . 5 min
~ 2 . 2 5 rain
I I I 6.0 8.0 10.0
STRAIN PERCENT
i 12.O
Figure 8 Typical stress/strain curves obtained in a static-dynamic test. The duration of the interruption was 2.25 min in one test and 3.5 rain in the other. Uninterrupted static (S) and dynamic (D) curves are also shown for comparison.
T H E C O M P R E S S I V E B E H A V I O U R O F B - B R A S S S I N G L E C R Y S T A L S
25C
20E
E z 15C
10(
5C
I I f I 2.0 4 .0 6 .0 8.0
STRAIN PERCENT
[ I 10.0 12.0
Figure 9 Typical stress/strain curve obtained in a static-static test. The duration of the interruption was 4 h.
produced either solely static-type (21 l) traces or dominant (211) traces together with faint widely spaced dynamic-type (i 10) and ( i01) traces as shown in Fig. 12. This change on static reloading to a solely or predominantly static mode of slip with an increased rate of work-hardening is consistent with expectation. These and the results from the static-static sequence indicate that static reloading always produces pre- dominantly (211) slip regardless of the type of preload. It appears that the delicate balance between (211) and ( i01) slip observed in the uninterrupted static tests is absent in any subsequent static reload.
In the dynamic-dynamic sequence (Fig. 11), the reload yield behaviour, flow stress and work- hardening rate all indicate that the reload deformation is a resumption of the preload
deformation. This is confirmed by the slip-trace observations. In the dynamic reload, multiple slip occurred on four {101 } planes in two ( 1 1 1 ) directions, as was observed in uninterrupted dynamic loading. In the tests shown in Fig. 11 the interval between preload and reload was 9 rain. The accompanying stress decrement was 3.5~ which was appreciably less than was observed following a static preload (see Fig. 7). This small amount of recovery in the dynamic- dynamic sequence is in agreement with that observed in the dynamic-static sequence (5% in 15 min), and confirms that recovery after dynamic preloading is significantly less than that after static preloading. The larger amount of recovery after static deformation is presumably related to the high w0rk-hardening rate.
The dynamic reload following a static preload
250
20C
I' E
z 15C
100
50
I I 2.0 4.0
L l
15 min age
I t ? 6.0 8.0 10.0
STRAIN PERCENT
I 12.0
Figure 10 Typical stress/strain curves obtained on static reload after dy- namic preload. The duration of the interruption was 15 min for the upper curve, 4 h for the lower. The dynamic curve is for a separate un- interrupted test.
1411
N. D. B R O O M , A. L. T I T C H E N E R
300
250
200
E 150 z
100
I I I L
[ I I 2.0 4.0 6.0
I [ I I
I I I I 8.0 10.0 12.0 14.0 16.0
STRAIN PERCENT
Figure 11 A typical stress/strain curve for a dynamic-dynamic test. The duration of the interruption was 9 rain.
exhibited anomalous behaviour. Fig. 8 shows curves from this sequence together with un- interrupted static and dynamic curves. At strains beyond the initial yield the dynamic reload curve lies below the uninterrupted static curve. As was discussed in Section 3.2.1 this difference in the flow stresses may be explained in terms of the recovery (Fig. 7) occurring during the inter- ruptions, which were 2.25 and 3.5 min. The coincidence between the reload dynamic curves and the uninterrupted dynamic curve is for- tuitous. Longer interruptions in the static- dynamic sequence lowered the dynamic reload curves even further, as may be inferred from Fig. 7.
Slip observations on three specimens sepa- rately subjected to the static-dynamic loading
sequence all revealed that a static-type slip mode occurred in the dynamic reload as well as in the static preload. The particular mode of static slip occurring in the dynamic reload did not appear to be governed by the mode in the static preload, as is evident from Table III , which presents the results from four tests. The
TABLE I I I Modes of preload and reload slip in static- dynamic interrupted tests. Slip direction was [111 ] in all cases
Test Static preload Dynamic reload
A ( i00 (i0]) B (i01) (211) C (i01) (i01)-(211)
("transition") D (211) (211)
Figure 12 Strong (211) slip traces together with faint (i 01) and (i 10) traces observed in a specimen preloaded dynamically, repolished, and reloaded statically.
1412
multiple slip characteristic of uninterrupted dynamic deformation was never observed in dynamic reloading following static preloading. Fig. 13 shows a typical set of slip traces following the dynamic reload.
As was observed in uninterrupted tests, the static-mode slip traces produced in reloads were fine and wavy, whether produced by static or dynamic deformation. The multiple traces which appeared in the dynamic reload of a dynamic- dynamic test, like those produced in an un- interrupted dynamic test, were straight and both very fine and very coarse.
T H E C O M P R E S S I V E B E H A V I O U R O F t 3 - B R A S S S I N G L E C R Y S T A L S
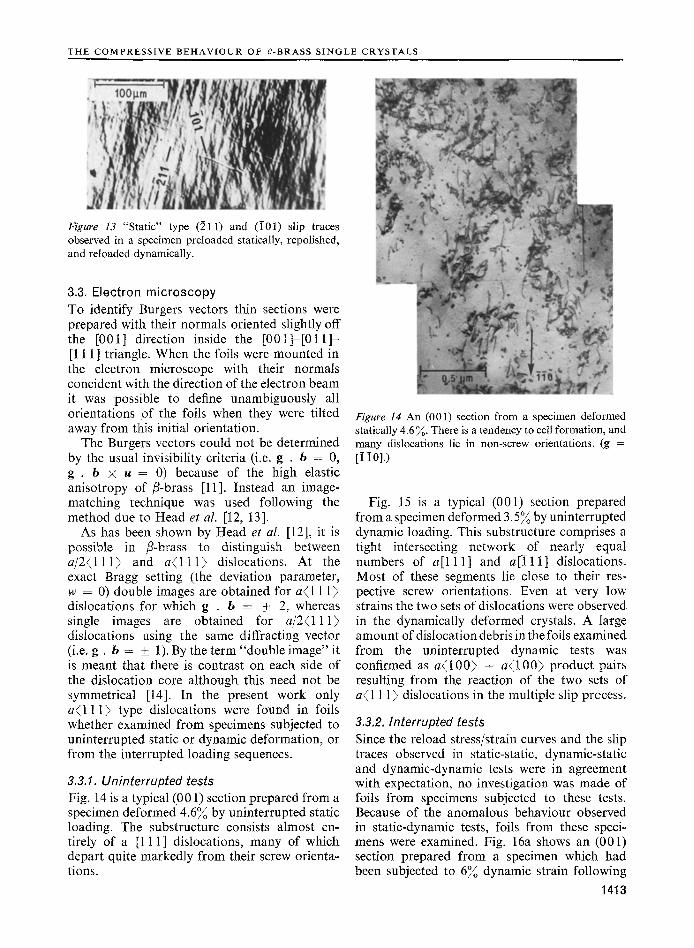
Figure 13 "Static" type (211) and (iO1) slip traces observed in a specimen preloaded statically, repolished, and reloaded dynamically.
3.3. Electron microscopy To identify Burgers vectors thin sections were prepared with their normals oriented slightly off the [001] direction inside the [001]-[011]- [111] triangle. When the foils were mounted in the electron microscope with their normals concident with the direction of the electron beam it was possible to define unambiguously all orientations of the foils when they were tilted away from this initial orientation.
The Burgers vectors could not be determined by the usual invisibility criteria (i.e. g . b = 0, g . b • u = 0) because of the high elastic anisotropy of/3-brass [11]. Instead an image- matching technique was used following the method due to Head et al. [12, 13].
As has been shown by Head et al. [12], it is possible in /~-brass to distinguish between a / 2 ( 1 1 1 ) and a ( 1 1 1 ) dislocations. At the exact Bragg setting (the deviation parameter, w = 0) double images are obtained for a ( 1 1 1 ) dislocations for which g . b = + 2, whereas single images are obtained for a / 2 ( l l l ) dislocations using the same diffracting vector (i.e. g . b = + 1). By the term "double image" it is meant that there is contrast on each side of the dislocation core although this need not be symmetrical [14]. In the present work only a ( 1 1 1 ) type dislocations were found in foils whether examined from specimens subjected to uninterrupted static or dynamic deformation, or from the interrupted loading sequences.
3.3.1. Uninterrupted tests Fig. 14 is a typical (001) section prepared from a specimen deformed 4.6~ by uninterrupted static loading. The substructure consists almost en- tirely of a [111] dislocations, many of which depart quite markedly from their screw orienta- tions.
Figure I4 An (001) section from a specimen deformed statically 4.6 ~. There is a tendency to cell formation, and many dislocations lie in non-screw orientations. (g = [i i0].)
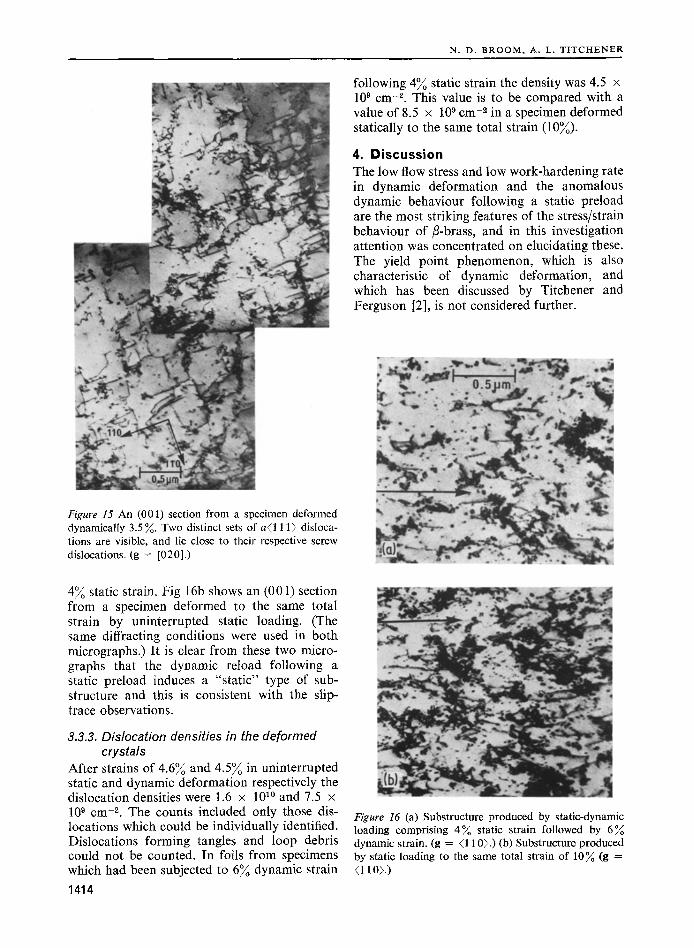
Fig. 15 is a typical (001) section prepared from a specimen deformed 3.5~ by uninterrupted dynamic loading. This substructure comprises a tight intersecting network of nearly equal numbers of al l 1 l] and a [ l l l ] dislocations. Most of these segments lie close to their res- pective screw orientations. Even at very low strains the two sets of dislocations were observed in the dynamically deformed crystals. A large amount of dislocation debris in the foils examined from the uninterrupted dynamic tests was confirmed as a ( 1 0 0 ) + a ( 1 0 0 ) p r o d u c t pairs resulting from the reaction of the two sets of a ( 1 1 1 ) dislocations in the multiple slip process.
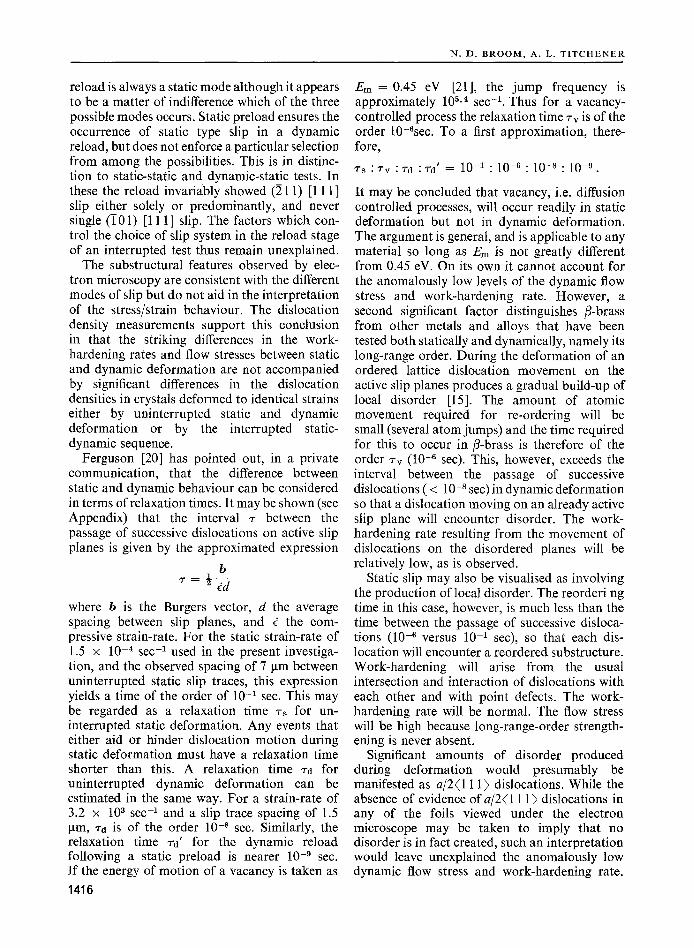
3.3.2. Interrupted tests Since the reload stress/strain curves and the slip traces observed in static-static, dynamic-static and dynamic-dynamic tests were in agreement with expectation, no investigation was made of foils from specimens subjected to these tests. Because of the anomalous behaviour observed in static-dynamic tests, foils from these speci- mens were examined. Fig. 16a shows an (001) section prepared from a specimen which had been subjected to 6~ dynamic strain following
1413
N. D. B R O O M , A. L. T I T C H E N E R
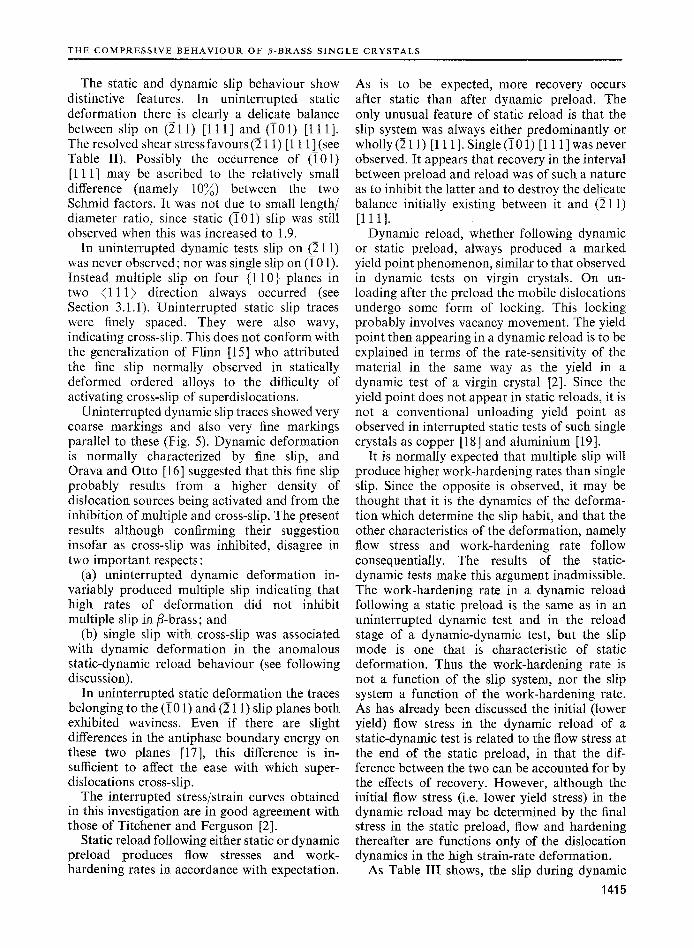
following 4 ~ static strain the density was 4.5 x 10 9 cm -2. This value is to be compared with a value of 8.5 x 10 9 cm -2 in a specimen deformed statically to the same total strain (10~).
4. Discussion The low flow stress and low work-hardening rate in dynamic deformation and the anomalous dynamic behaviour following a static preload are the most striking features of the stress/strain behaviour of E-brass, and in this investigation attention was concentrated on elucidating these. The yield point phenomenon, which is also characteristic of dynamic deformation, and which has been discussed by Titchener and Ferguson [2], is not considered further.
Figure 15 An (001) section from a specimen deformed dynamically 3.5 ~. Two distinct sets of a<l 11> disloca- tions are visible, and lie close to their respective screw dislocations. (g = [020].)
4 ~ static strain. Fig 16b shows an (001) section from a specimen deformed to the same total strain by uninterrupted static loading. (The same diffracting conditions were used in both micrographs.) It is clear from these two micro- graphs that the dynamic reload following a static preload induces a "static" type of sub- structure and this is consistent with the slip- trace observations.
3.3.3. Dislocation densities in the deformed crystals
After strains of 4.6~ and 4 .5~ in uninterrupted static and dynamic deformation respectively the dislocation densities were 1.6 x 101~ and 7.5 x 10 9 cm -2. The counts included only those dis- locations which could be individually identified. Dislocations forming tangles and loop debris could not be counted. In foils from specimens which had been subjected to 6 ~ dynamic strain
1414
Figure 16 (a) Substructure produced by static-dynamic loading comprising 4 ~ static strain followed by 6~ dynamic strain. (g = <110>.) (b) Substructure produced by static loading to the same total strain of 10~ (g = <110>3
T H E C O M P R E S S I V E B E H A V I O U R OF ~3-BRASS S I N G L E C R Y S T A L S
The static and dynamic slip behaviour show distinctive features. In uninterrupted static deformation there is clearly a delicate balance between slip on (211) [111] and (i01) [111]. The resolved shear stress favours (211) [111] (see Table II). Possibly the occurrence of (I01) [111] may be ascribed to the relatively small difference (namely 10~) between the two Schmid factors. It was not due to small length/ diameter ratio, since static (501) slip was still observed when this was increased to 1.9.
In uninterrupted dynamic tests slip on (211) was never observed; nor was single slip on (501). Instead multiple slip on four {110} planes in two (111) direction always occurred (see Section 3.1.1). Uninterrupted static slip traces were finely spaced. They were also wavy, indicating cross-slip. This does not conform with the generalization of Flinn [15] who attributed the fine slip normally observed in statically deformed ordered alloys to the difficulty of activating cross-slip of superdislocations.
Uninterrupted dynamic slip traces showed very coarse markings and also very fine markings parallel to these (Fig. 5). Dynamic deformation is normally characterized by fine slip, and Orava and Otto [16] suggested that this fine slip probably results from a higher density of dislocation sources being activated and from the inhibition of multiple and cross-slip. The present results although confirming their suggestion insofar as cross-slip was inhibited, disagree in two important respects:
(a) uninterrupted dynamic deformation in- variably produced multiple slip indicating that high rates of deformation did not inhibit multiple slip in/3-brass; and
(b) single slip with cross-slip was associated with dynamic deformation in the anomalous static-dynamic reload behaviour (see following discussion).
In uninterrupted static deformation the traces belonging to the (501) and (21 l) slip planes both exhibited waviness. Even if there are slight differences in the antiphase boundary energy on these two planes [17], this difference is in- sufficient to affect the ease with which super- dislocations cross-slip.
The interrupted stress/strain curves obtained in this investigation are in good agreement with those of Titchener and Ferguson [2].
Static reload following either static or dynamic preload produces flow stresses and work- hardening rates in accordance with expectation.
As is to be expected, more recovery occurs after static than after dynamic preload. The only unusual feature of static reload is that the slip system was always either predominantly or wholly (211) [111 ]. Single (i01) [111 ] was never observed. It appears that recovery in the interval between preload and reload was of such a nature as to inhibit the latter and to destroy the delicate balance initially existing between it and (211) [111].
Dynamic reload, whether following dynamic or static preload, always produced a marked yield point phenomenon, similar to that observed in dynamic tests on virgin crystals. On un- loading after the preload the mobile dislocations undergo some form of locking. This locking probably involves vacancy movement. The yield point then appearing in a dynamic reload is to be explained in terms of the rate-sensitivity of the material in the same way as the yield in a dynamic test of a virgin crystal [2]. Since the yield point does not appear in static reloads, it is not a conventional unloading yield point as observed in interrupted static tests of such single crystals as copper [t8] and aluminium [19].
It is normally expected that multiple slip will produce higher work-hardening rates than single slip. Since the opposite is observed, it may be thought that it is the dynamics of the deforma- tion which determine the slip habit, and that the other characteristics of the deformation, namely flow stress and work-hardening rate follow consequentially. The results of the static- dynamic tests make this argument inadmissible. The work-hardening rate in a dynamic reload following a static preload is the same as in an uninterrupted dynamic test and in the reload stage of a dynamic-dynamic test, but the slip mode is one that is characteristic of static deformation. Thus the work-hardening rate is not a function of the slip system, nor the slip system a function of the work-hardening rate. As has already been discussed the initial (lower yield) flow stress in the dynamic reload of a static-dynamic test is related to the flow stress at the end of the static preload, in that the dif- ference between the two can be accounted for by the effects of recovery. However, although the initial flow stress (i.e. lower yield stress) in the dynamic reload may be determined by the final stress in the static preload, flow and hardening thereafter are functions only of the dislocation dynamics in the high strain-rate deformation.
As Table III shows, the slip during dynamic
1415
N. D. B R O O M , A. L. T I T C H E N E R
reload is always a static mode although it appears to be a matter of indifference which of the three possible modes occurs. Static preload ensures the occurrence of static type slip in a dynamic reload, but does not enforce a particular selection from among the possibilities. This is in distinc- tion to static-static and dynamic-static tests. In these the reload invariably showed (211) [111] slip either solely or predominantly, and never single ( i01) [1 11] slip. The factors which con- trol the choice of slip system in the reload stage of an interrupted test thus remain unexplained.
The substructural features observed by elec- tron microscopy are consistent with the different modes of slip but do not aid in the interpretation of the stress/strain behaviour. The dislocation density measurements support this conclusion in that the striking differences in the work- hardening rates and flow stresses between static and dynamic deformation are not accompanied by significant differences in the dislocation densities in crystals deformed to identical strains either by uninterrupted static and dynamic deformation or by the interrupted static- dynamic sequence.
Ferguson [20] has pointed out, in a private communication, that the difference between static and dynamic behaviour can be considered in terms of relaxation times. It may be shown (see Appendix) that the interval ~- between the passage of successive dislocations on active slip planes is given by the approximated expression
b
where b is the Burgers vector, d the average spacing between slip planes, and ~ the com- pressive strain-rate. For the static strain-rate of 1.5 x 10 -~ sec -1 used in the present investiga- tion, and the observed spacing of 7 Ixm between uninterrupted static slip traces, this expression yields a time of the order of 10 -1 sec. This may be regarded as a relaxation time 7s for un- interrupted static deformation. Any events that either aid or hinder dislocation motion during static deformation must have a relaxation time shorter than this. A relaxation time ~-a for uninterrupted dynamic deformation can be estimated in the same way. For a strain-rate of 3.2 x 10⁸ sec -1 and a slip trace spacing of 1.5 gin, Zd is of the order 10 .8 sec. Similarly, the relaxation time ~'a' for the dynamic reload following a static preload is nearer 10 .9 sec. If the energy of motion of a vacancy is taken as
1416
E m = 0.45 eV [21], the jump frequency is approximately 105.4 sec -1. Thus for a vacancy- controlled process the relaxation time ~'v is of the order 10-6sec. To a first approximation, there- fore,
Ts :~v :~'d :~'d' = 10 -1 : 10 -6 : 10 -s : 10 -9 �9
It may be concluded that vacancy, i.e. diffusion controlled processes, will occur readily in static deformation but not in dynamic deformation. The argument is general, and is applicable to any material so long as Em is not greatly different from 0.45 eV. On its own it cannot account for the anomalously low levels of the dynamic flow stress and work-hardening rate. However, a second significant factor distinguishes fl-brass from other metals and alloys that have been tested both statically and dynamically, namely its long-range order. During the deformation of an ordered lattice dislocation movement on the active slip planes produces a gradual build-up of local disorder [15]. The amount of atomic movement required for re-ordering will be small (several atom jumps) and the time required for this to occur in fi-brass is therefore of the order Vv (10 -G sec). This, however, exceeds the interval between the passage of successive dislocations ( < l0 -8 sec) in dynamic deformation so that a dislocation moving on an already active slip plane will encounter disorder. The work- hardening rate resulting from the movement of dislocations on the disordered planes will be relatively low, as is observed.
Static slip may also be visualised as involving the production of local disorder. The reorderi ng time in this case, however, is much less than the time between the passage of successive disloca- tions 0 0 -6 versus 10 -1 sec), so that each dis- location will encounter a reordered substructure. Work-hardening will arise from the usual intersection and interaction of dislocations with each other and with point defects. The work- hardening rate will be normal. The flow stress will be high because long-range-order strength- ening is never absent.
Significant amounts of disorder produced during deformation would presumably be manifested as a /2 (111) dislocations. While the absence of evidence of a/2(11 1) dislocations in any of the foils viewed under the electron microscope may be taken to imply that no disorder is in fact created, such an interpretation would leave unexplained the anomalously low dynamic flow stress and work-hardening rate.
T H E C O M P R E S S I V E B E H A V I O U R OF 0 - B R A S S S I N G L E C R Y S T A L S
More probably it may be taken as confirmation that the disorder is short-lived. This is plausible since the interval between the completion of a test and the viewing of a foil greatly exceeds the time likely to be required for re-ordering. Consistent with this, long-range order cannot be suppressed in fi-brass by quenching [22, 23], and the kinetics of re-ordering by vacancy motion can be expected to be very high [21 ].
5. C o n c l u s i o n s
The results of the present investigation indicate that particular modes of slip are associated with static and dynamic deformation whether by uninterrupted loading or by interrupted loading consisting of static-static, dynamic-dynamic, or dynamic-static sequences. Anomalous behaviour is observed during the dynamic reload following static preloading.
It is shown that there is no causal relationship between the work-hardening rate and flow stress and the slip characteristics in static and dynamic deformation of fi-brass single crystals, and that the work-hardening rate and flow stress are believed to be a function of the dynamics of deformation. The substructural features arise principally from the different modes of slip and cannot be interpreted as controlling the stress/ strain behaviour.
An explanation for the striking differences in the work-hardening rate and flow stress of the static and dynamic behaviour is suggested in terms of the production of short-lived disorder. The absence of a/2(1 1 1) dislocations in the foils is explained in terms of high re-ordering rates.
The reason for multiple slip in dynamic deformation remains unexplained.
A p p e n d i x
For single slip the macroscopic shear strain may be written as
S
7---~/
where s is the average shear displacement on the active slip planes (average slip step) and d is the average distance between these planes. If, on average, n dislocations move a distance x on any one slip plane, the slip step will be
X s -= n b -
w
where b is the Burgers vector and w is the width of the crystal in the direction of slip. Hence
nb x ~ (la) 7 - d w
o r
~ 7 d . - (lb)
w b
If the duration of the stress/strain test is t and the strain-rate is assumed uniform
t = _ = - . ( 2 ) 7 e
where 7 and e are the maximum shear and normal strains. The average spacing between active dislocations on a slip plane is w/n and their average velocity is x/t. Hence the time interval -r between the passage of successive dislocations past a point is
win x/t
t nx/w (3)
Substituting from Equations lb and 2 yields
b -- (4)
Uniaxial plastic compression or extension of a single crystal is essentially plane strain deforma- tion and the maximum shear and normal strains are, therefore, related by the expression
whence
p _ ~ 2 ~ .
Thus, to a first approximation, the time interval -r is given by
b Td (s)
where ~- may be regarded as a relaxation time in the manner discussed in Section 4.
A c k n o w l e d g e m e n t s The authors acknowledge the assistance of the Director, Physics and Engineering Laboratory, Gracefield, and Dr S. Bullivant, Department of Cell Biology, University of Auckland, for providing electron microscope facilities; the Director, Meat Industry Research Institute,
1417
N . D . B R O O M , A. L . T I T C H E N E R
H a m i l t o n , f o r the l o a n o f e q u i p m e n t ; a n d the
R e s e a r c h C o m m i t t e e o f the N e w Z e a l a n d U n i v e r s i t y G r a n t s C o m m i t t e e fo r s u p p o r t . T h e y are g ra te fu l to D r G. K . U n d e r h i l l f o r t r ans -
c r ib ing c o m p u t e r p r o g r a m m e s . T h e y especia l ly
w i sh to t h a n k D r W. G. F e r g u s o n fo r m a n y
inva luab l e d i scuss ions .
References l . W . G . F E R G U S O N and A. L . T I T C H E N E R , N . Z . . Z
Science 14 (1971) 224. 2. A. L . T I T C H E N E R and w. G. F E R G U S O N , ,[. Inst.
Metals 99 (1971) 345. 3. J. D. CAMPBELL and J. DUBY, Proc. Roy. SoP. A236
(1956) 24. 4. F. E. H A U S E R , G . A . S I M M O N S and J. E. D O R N ,
"Response of Metals to High Velocity Deformation" (Interscience, New York, 1961) p. 93.
5. E. D. H. DAVIES and s. c. HUNTER, J. Mech. Phys. Solids 11 (1963) 155.
6. J. w. EDIN~TON, Phil. Mag. 19 (1969) 1189. 7. w. G. FERGUSON, Ph.D. Thesis, University of
Auckland, New Zealand, 1964. 8. A. K. HEAD, Aust. J. Phys. 20 (1967) 557.
9. v. HUMBLE, ibid21 (1968) 325. 10. M. A. S H T R E M E L and B. G. B E L Y K O V , Phys. Met.
Metallogr. 25 (1968) 125. 11. R. C. CRAWFORD and D. R. MILLER, Phil. Mag. 14
(1966) 1071. 12. A. K. H E A D , M. H . L O R E T T O and e. H U M B L E , Phys.
Stat. Sol. 20 (1967) 505. 13. ldem, ibid 20 (1967) 521. 14. v. HUMBLE, private communication (1971). 15. v. A. FLINN, Trans. Met. Soc. A I M E 218 (1960) 145. 16. R. N. ORAVA and H. E. OTTO, J. Metals 22 (1970) 17. 17. M. J. MARCINKOWSKI and R. M. FISHER, J. Appl.
Phys. 34 (1963) 2135. 18. A. L. TITCHENER and G. J. DAVIES, Phil. Mag. 11
(1965) 1225. 19. A. R. C. WESTWOOD and T. BROOM, Acta Met. $
(1957) 77. 20. w. G. rERCUSON, private communication (1973). 21. M. J. KOCZAK, H. HERMAN and A. C. DAMASK,
Acta Met. 19 (1971) 303. 22. o . CHIPMAN and B. E. WARREN, J. Appl. Phys. 21
(1950) 696. 23. s. G. CUPSCHALK and N. BROWN, Acta Met. 16
(1968) 657. Received 3 October 1974 and accepted 28 January 1975.
1418