some aspects of convection as well as graphite and carbide
TRANSCRIPT

Some aspects of convection as well as graphite
and carbide formations during casting.
Fareed Ashraf Khan
Licentiate Thesis
Stockholm 2018
KTH Royal Institute of Technology
School of Industrial Engineering and Management
Department of Materials Science and Engineering
Division of Processes
SE-100 44 Stockholm
Sweden
Akademisk avhandling som med tillstånd av Kungliga Tekniska Högskolan i Stockholm, framlägges för offentlig granskning för avläggande av Teknologie Doktorsexamen, torsdag den 12 juni 2018, kl. 10.00 i M131 Sefström, Brinellvägen 23, Kungliga Tekniska Högskolan, Stockholm.
ISBN 978-91-7729-830-4
TRITA-ITM-AVL 2018:31
Stockholm 2018

Fareed Ashraf Khan: Some aspects of convection as well as graphite and
carbide formations during casting.
KTH Royal Institute of Technology
School of Industrial Engineering and Management
Department of Materials Science and Engineering
Division of Processes
SE-100 44 Stockholm
Sweden
ISBN 978-91-7729-830-4
TRITA-ITM-AVL 2018:31
© Fareed Ashraf Khan, 2018

3
Abstract
It is an established fact that segregation during casting affects
the physical properties of carbon-based ferro alloys; this
motivates the study of the segregation behaviour of carbon and
carbide-forming solute elements. In this context, this thesis
investigates two different situations: the effects of cooling rate
and turbulence on the precipitation behaviour of the graphite
nodules in nodular cast iron; the nature of carbide precipitation
in a bearing steel grade and the effects of subsequent soaking
on these carbides.
The structures of boiling water reactor inserts cast by the uphill
and downhill casting of nodular cast iron were examined. The
samples were taken from representative locations in the top,
middle and bottom cross sections of the castings. It was
observed that in uphill-cast inserts the nodules were larger but
fewer in number the bottom section, whereas in downhill-cast
inserts the nodules in the bottom section were smaller, but
greater in number. Variation in volume fraction of the graphite
nodules across the inserts was also observed. The probable
cause of this variation was the difference in cooling rate in
different sections of the insert. Between the steel tubes located
at the central part of the casting, the fraction of graphite was
lower, which could be the result of carburization of the steel
tubes.
To study the effects of melt stirring during the solidification of
nodular cast iron, several experiments were conducted at
variable cooling rates and for different stirring times.
Examination of the microstructure was conducted using Light
Optical Microscope (LOM) and Scanning Electron Microscope
(SEM). It was observed that during stirring the melt oxidized and
oxide nuclei were formed. The number of nucleation sites for the
precipitation of graphite nodules increased, which raised the

4
nodule count and the fraction of the graphite precipitated. The
matrix transformed from pearlite to ferrite, which could be due to
the fact that more carbon had diffused out of the matrix.
The segregation behaviour in hypereutectoid bearing steel
produced by ingot casting was also studied. The effects of
soaking on micro and macro segregation was investigated in
samples taken from as cast and soaked ingots; emphasis was
laid on the bulk matrix and A-segregation channels. Samples
were also taken from ingots which were soaked and then hot
worked. The micro and macro examination of the microstructure
was conducted using LOM and SEM. Quantitative and
qualitative composition analysis was performed using Energy-
dispersive X-ray spectroscopy (EDX) and an electron micro
probe analyzer (EMPA). It was observed that M3C, M2C and
M6C had precipitated. The carbide morphology in the bulk matrix
was different to that in the A-segregation channels. All the
primary carbides in the bulk matrix were found to have dissolved
after 4 hours of soaking at 1200oC.
Key Words:
carbides, heat treatment, cast iron, ball bearing steel, casting,
cooling rate, structure analysis, nodule distribution, melt stirring,
nuclei,

5
Sammanfattning
Det är ett faktum att segringar som uppstår under gjutning
påverkar materialegenskaperna hos kolbaserade järnlegeringar;
detta utgör motivationen till studien av segringsuppträdandet
hos kol och karbidbildande ämnen. Denna avhandling behandlar
två olika aspekter inom ramen för detta ämne: påverkan av
kylningshastighet och turbulens på kärnbildningen av
grafitnoduler i nodulärt gjutjärn samt karbidbildning i kullagerstål
och dess påverkan på den efterföljande värmebehandlingen av
dessa karbider.
Strukturen hos rör till vattenkokare som tillverkats av nodulärt
gjutjärn som gjutits med fyllning från botten eller från toppen
undersöktes. Prover togs från representativa tvärsnittspositioner
från toppen, mitten och botten av de gjutna ämnena. Resultaten
visade att användandet av bottenfyllda kokiller gav upphov till
större men färre karbider i nedre delen av ämnet, medans
användandet av toppfyllda kokiller gav upphov till mindre men
fler karbider i nedre delen av ämnet. Variationer av
volymfraktionen av grafitnoduler längs tvärsnitten observerades
också. Den mest sannolika orsaken till denna variation var
skillnaden i kylhastighet i de olika områdena av tvärsnitten. Hos
rör tillverkade av det centrala delen av ämnet så var fraktionen
grafit lägre, vilket kan bero på en uppkolning av rören.
Ett flertal experiment utfördes med varierande
kylningshastigheter och olika omrörningstider för att studera
inverkan av omrörning av smältan på stelningen av nodulärt
gjutjärn. Studier av mikrostrukturen genomfördes med ljusoptisk
mikroskopi och svepelektronmikroskopi. Resultaten visade att
smältan oxiderades under omrörningen, vilket resulterade i
bildandet av oxider. Detta ledde till en ökning av
kärnbildningsområden för grafitnoduler, vilket ledde till en ökning
av antalet noduler samt fraktionen av grafit som fälldes ut.

6
Strukturen omvandlades från perlit till ferrit, vilket troligen
orsakades av att kol hade diffunderat ut från strukturen.
Segringsbeteendet hos hypereutektoida kullagerstål tillverkade
genom götgjutning undersöktes också. Effekten av
värmebehandling på mikro- och makrosegringar undersöktes i
prover tagna från gjutna och värmebehandlade ämnen. Fokus
var på att studera strukturen i ämnena samt A-segringar.
Dessutom togs prover från ämnen som först värmebehandlats
och därefter varmbearbetats. Både mikro- och
makroundersökningar av mikrostrukturen utfördes med
ljusoptisk mikroskopi och svepelektronmikroskopi. Dessutom så
genomfördes kvantitativa sammansättningsbestämningar med
energidispersiv röntgenspektroskopi och
elektronmikroprobsanalys. Resultaten visade att M3C, M2C och
M6C karbider hade fällts ut. Karbidmorfologin i huvuddelen av
strukturen skiljde sig från den som återfanns i A-segringar.
Samtliga primära karbider i huvuddelen av strukturen hade lösts
upp efter 4 timmars värmebehandling vid 1200oC.
Nyckelord:
karbider, värmebehanding, gjutjärn, kullagerstål, gjutning,
kylningshastighet, strukturanalys, nodulefördelning,
smältrörelse, kärnor.

7
Acknowledgements
I would like to express my deepest gratitude to Professor Hasse
Fredriksson, who provided me an opportunity to join his team
and also for being a great mentor during studies at KTH, I
appreciate all his contributions of time and for his erudite
advices.
Let me express my sincere gratitude to my distinguished and
learned supervisors Docent Michael Vynnycky, Professor Bo
Rogberg and Professor Pär Jönsson for their valuable advises,
critical comments and guidance. Their cooperation to
accomplish my study was immense and is highly appreciated.
Financial and material support provided by Ovako steel, SKB
and Hugo Carlsson foundation, was of immense importance in
completing this work.
Let’s not forget my colleagues at Process Division for their
support and for providing nice and friendly working environment.
My thanks to my former colleagues and friends at Casting
Division for all their help and support. You have been there
during work and afterwards, always being friendly and
supportive.
Most importantly I want to thank my siblings for their
encouragement and support during this time. Last but not least
many thanks to my wife for her love, care and understanding.

8

9
List of appended supplements
Supplement I
Muhammad, H., Khan, F., Jutner, A., Fredriksson, H.,
Structure investigation of downhill and uphill casted inserts.
Accepted for publication in SKB journal, 2017
Supplement II
Fareed Ashraf Khan, Hasse Fredriksson, Melt Stirring of
Nodular Cast Iron. 11th International Symposium on the Science
and Processing of Cast Iron, (SPCI-XI), Jönköping, 2017
(Accepted for publication)
Supplement III
Fareed Ashraf Khan, The effect of soaking on
segregation and primary-carbide dissolution in an ingot-cast
bearing steel. (Transcript ready for submission to a journal).

10
Author’s contribution to the different supplements of
the dessertion.
Supplement I Literature survey, structure and chemical
analysis, major part of writing of the section of
the report which is concerned with the Mapping
of the structure including the size, count and
fraction of the graphite nodules. Only the
section which was contributed by me is
discussed in this thesis report.
Supplement II. Literature survey, laboratory and industrial
experiments, structure and chemical analysis,
major part of writing.
Supplement III. Literature survey, laboratory experiments,
structure and chemical analysis,
thermodynamic calculations, major part of
writing.

11
Contents
Chapter 1-------------------------------------------------------------------11
1.1 Introduction---------------------------------------------------11
1.2 Aim of present work----------------------------------------11
1.3 Cast iron grades------------------------------------------- -12
1.4 Steels----------------------------------------------------------13
1.4.1 Bearing steel------------------------------------------------ 14
1.5 Casting Techniques----------------------------------------14
1.5.1 Furan Resin Sand Casting-------------------------------15
1.5.2 Ingot casting-------------------------------------------------15
1.5.2.1 Segregation during Ingot casting------------------------16
1.5.2.2 Banding--------------------------------------------------------17
1.5.2.3 Homogenization process----------------------------------17
1.5.2.4 Turbulence during casting--------------------------------19
Chapter 2 Methodology-----------------------------------22
2.1 Nodularity and factors effecting the Nodule
size and count---------------------------------------22
2.2 Segregation and precipitation of carbides-- ----------22
2.3 Soaking--------------------------------------------------------23
Chapter 3 Experimental-----------------------------------24
3.1 Nodular Cast Iron--------------------------------------------24
3.1.1 Stirring Technique-------------------------------------------25
3.1.2 Sample and analysis technique--------------------------26
3.2 Bearing Steel-------------------------------------------------29
3.2.1 Material--------------------------------------------------------29
3.2.2 Sample and analysis technique-------------------------30
Chapter 4 Results and discussions------------------32

12
4.1 Cast Iron – Structure analysis of inserts---------------32
4.1.1 Discussions---------------------------------------------------43
4.2 Stirring and its effects------------------------------------------45
4.2.1 Discussions-------------------------------------------------------49
4.3 Bearing Steel-microstructure and chemical analysis--51
4.3.1 Discussions-------------------------------------------------------63
Chapter 5 Concluding remarks-------------------------69
5.1 Conclusions-----------------------------------------------------69
5.2 Future work------------------------------------------------------74
6. References------------------------------------------------------75
Appended supplements

13
Chapter 1
1.1 Introduction
Most of the metallic materials used for engineering purposes are
alloys. Alloying is conducted to improve the mechanical
properties, corrosion resistance, thermal resistance and to
create special properties such as super-conductivity and shape
memory effects. On a broad spectrum alloys can be divided into
ferrous and non-ferrous alloys.
The annual global production of ferrous materials exceeds the
total production of non-ferrous materials by more than one order
of magnitude [1]. Low cost and easy availability is not the only
reason for this tremendous demand for ferrous alloys, but is
mainly governed by versatility of practical properties that can be
modified by alloying and processing [2].
It is also important to state to state that metals have crystalline
structure. The crystalline structure of metallic materials varies
one another in shapes and sizes. The properties of the metallic
materials are determined by its microstructure.
1.2 Aim of present work
During solidification of metal alloys micro and macro
segregations take place. Due to this phenomena, the
concentration of alloying elements is unevenly distributed in the
matrix. The segregation is caused due to the rejection of solute
elements and impurities into the liquid from the solidified alloy
matrix. This is due to the difference in solubility in solid and liquid
phases at equilibrium temperatures. During a dendritic
solidification, the solid dendrite has low alloying elements
composition. Then the liquid present in the interdendritic region,
partition of solute elements is called microsegregation. Also
shrinkage cavities can be formed due to solidification and
cooling shrinkage. Then the pressure inside the melts decreases
and the melt is sucked through the interdendritic channels and a

14
local deviation of the melt composition compared to mean
composition occurs [3]. This phenomena is called macro-
segregation.
Segregation is the main reason for the precipitation of some
particular phases.
The present work revolves around the study of the
precipitation of nodules in cast irons and carbides in bearing
steels.
1.3 Cast iron grades
The microstructure of the cast iron depends on the type and
quantity of added alloying elements, solidification and the heat
treatment technique being used. Depending on the
microstructure, application and mechanical properties cast iron
is classified [4,5] as described below.
White cast iron:
White cast iron is hard and brittle and has a comparatively low
melting point and lower silicon content. The fractured surface
shows white cracks due to the presence of carbides.
Grey cast iron:
Grey cast iron is the most widely used cast iron for general
purpose engineering. This is due to its high fluidity, good
machinability and reasonably good mechanical properties. It is
also called flake graphite, due to flaky morphology of the
graphite being precipitated. The matrix consist of ferrite, pearlite
or a mixture of both phases.
The fractured surface is greyish in colour. The grey cast iron is
further divided into five different types. These types are
described on the basis of the morphology and distribution of
graphite flakes.
Malleable cast iron:

15
When white cast iron is heat treated the carbides convert to
irregularly shaped spheroidal graphite particles and the product
is called a malleable cast iron. Its properties varies between grey
and white cast iron and behaves like low carbon steel.
Nodular cast iron
The production of nodular cast iron started in the middle of the
20th century. Many features affect the properties of the nodular
cast iron, but the elements which influence the matrix and
graphite morphology are most important [6]. Mg is added to the
cast iron as a nodule former. Mg has high affinity for oxygen and
will readily react with the absorbed oxygen in the melt and form
MgO particles. These oxides act as nuclei on which graphite
deposits.
The use of nodular cast iron (NCI) for different applications
increases due to its lower cost and its ease to be recycled.
Recently intrust is increasing in using of NCI in thin wall castings
has been seen. The attempts are being made to increase the
use of NCI for the manufacturing the components that require a
high strength to weight ratio [7].
1.4 Steel
The commercial steel was developed in 19th centuary after Sir
Henry Bessemer's development of efficient technique to lower
the carbon content in cast iron to less than 2% [8]. The steel
produced was harder and more malleable than cast iron.
Steel is most commonly used material for buildings in the
infrastructure and industries and it exists in more than 3500
different grades. Depending on the alloying content and
application it is classified into four groups [9]:
1. Carbon steels- it includes low, medium and high
carbon steels
2. Alloy steels- commonly alloyed by metals like
manganese, silicon, nickel, and chromium.

16
3. Stainless steels – it normally contains around 10%
chromium and can be graded as austenitic, ferritic and
martensitic steels.
4. Tool steels- alloyed with molybdenum and
tungsten.
Due to wide range of alloy compositions, steel have diverse
mechanical properties.
1.4.1 Bearing Steel
The steel used for making ball bearings should sustain very
severe cyclic and static loads, while giving a good service
reliability in very hostile environments. The bearing is made up
of rolling parts such as balls, tubes and rings. The steel used for
bearing undergoes a very high reduction in the plastic range of
ingots into billets. There are two types of steel used for producing
most of the bearings: i) a steel which has soft core and tenacious
surface, produced through case hardening or induction
hardening and ii) a steel which is hardened through out there
body due to martensitic or bainitic structures [10]. The bearing
steel market is historically dominated by steels having 0.8-1.1 %
C and less than 3% solute contents [10,11]. The focus of this
work is the High-Carbon Chromium-Bearing steel grade 100Cr6
(SAE 52100) containing 1% C,1.5% Cr and 0.1% Mo, which is
the most popular alloy for bearings. Bearing steel is usually cast
with two methods, ingot casting and continuous bloom casting.
The ingots cast by uphill teeming casting goes through large
forging reductions to accomplish the required final quality. After
solidification the ingots are removed from the mould and sent to
soaking pit, where they are kept at a suitable
temperature(soaking temperature) for a certain time (soaking
time) before the initial rolling is started [12].
1.5 Casting Techniques

17
The art and technique of forming metals is known since 4000
years BC. The casting process was not actually changed till the
middle of 19th century. Net shape castings were produced and
were used without any subsequent plastic forming. During and
after the nineteenth century additional work was done on
improving and refining the old casting techniques and new
casting processes were developed [4].
Casting processes can be divided into two major categories,
based on the products being produced, component casting and
casting processes to produce wires, plates, strips and other
basic products.
During the casting process, the molten metal from the oven is
transferred to a ladle. Then the melt is poured into the moulds
usually made of sand or metal, where it solidifies in the shape of
cavity of the mould. Most common techniques are Sand casting,
Plaster mold casting, Shell molding, Investment casting, Waste
molding of plaster, Evaporative-pattern casting, Permanent mold
casting and Die casting [4].
Two casting techniques are discussed here in relation to this
work.
1.5.1 Furan Resin Sand Casting
Furan resin sand is a self-hardening sand mould. The sand
mould surface becomes solid and hard after the burning of the
resin coating. Due to the high strength of the mould, this process
can be used for the production of medium sized casting to
castings weighing several tones. The main advantages of this
type of castings are enhanced surface qualities, comparatively
less casting defects, and complex castings can be produced with
good dimensional tolerance [13].
High production cost and low production rate are the main
disadvantages of this process. This technique is mostly used for
cast iron and not used for steels due to poor gas permeability.
1.5.2 Ingot casting

18
Ingot casting is also called chill mould casting. This technique
is used for the production of material for rolling e.g rod, pipe, wire
or sheet metal manufacturing. It’s a permanent mould casting
technique and the mould is usually made of cast iron and is in
rectangular or circular shape. In this casting technique, the melt
is teemed into the mould from the ladle in two different ways. In
downhill casting, the melt is poured from the top and during uphill
casting the melt is teemed from the bottom of the mould. An
insulating layer called hot top is introduced at the top of the melt
to reduce the size of the pipe. To improve the surface quality the
mould walls are commonly coated with mould black [4].
1.5.2.1 Segregation during Ingot casting
Several kinds of segregation takes place in an ingot during
casting, due to fundamentally the same phenomena. The basic
reason for the occurrence of these segregations is the flow of
solute rich liquid due to the thermal gradients, density
differences and due to the feed contraction caused during
solidification [4,14,15] Numerous types of segregations take
place in an ingot. The most common ones are illustrated in Fig.
1 and are briefly described below;
The positive segregation- solute concentration is higher than the
mean concentration of the solute.
The negative segregation-solute concentration is less than the
mean concentration. Both the positive and negative
segregations are formed during the sedimentation of free
crystals.
The A-segregations have pencil like channels, which contains
very high solute concentrations. They are usually caused due
to the thermal flow of liquid generated due to thermal gradients.
Furthermore V-Segregations are formed due to thermal
contraction during solidification [4,16]. Beside these
segregations interdendritic segregations are also formed.
These also adversely effects the mechanical properties of the
material. The interdendritic segregation is caused by the micro

19
segregation, which is caused due to uneven distribution of
alloying elements on a short range distance, if the partition
constant k<1 the solute elements gets enriched in the
remaining liquid. If the diffusion rate of these alloys is low in the
solid state the last solidified liquid between the dendrites arms
is enriched with solute elements [4,14].
Fig. 1. A rough illustration of the crystal structure and macro segregation occurring during solidification of large ingots. The dashes delineate the extents of the different crystal zones.
1.5.2.2 Banding
The interdendritic segregation of solute elements seems to be
responsible for the banding and successive hot working
operation, which align these segregated areas in the working
direction [20]. Alternative bands have quite dissimilar chemistry
and microstructures, Elements with low diffusion coefficient, acts
very sluggishly to homogenisation effect of hot working. [48]
Fisher et al [19] observed that for 300μm dendrite arms spacing,
to reduce the substitutional elements segregation by 50%, 35hrs
soaking time is required at a soaking temperature of 1250 oC.
20
1.5.2.3 Homogenization process
To counter the segregations caused during solidification the
ingots undergoes an isothermal treatment called soaking. The
soaking or homogenization treatment has the same objective as
a solution treatment, it is carried out to homogenize the carbon
composition in the austenitic region and to obtain a uniform
distribution of other alloying elements [16]. The homogenization
process is isothermal and the short range and long range
diffusion are the controlling factors. The diffusion process follows
the Hume-Rothery rules [17]. It usually occurs in a FCC-
Austenitic single phase field but can also happen in a multiphase
regime. The degree of homogenization during soaking depends
on several factors like such as the soaking temperature and
time, dendritic arm distance, diffusion coefficient of the diffusing
element and chemical inhomogeneity [4].Beswick [18] observed
that in hypereutectoid steels, Cr influences the carbide stability.
Furthermore, that the diffusion of carbon is reduced at the
carbide –matrix interface due to the slow diffusion of Cr. Beswick
also observed the enrichment (FeCr)3C during soaking and
concluded that an extended soaking time causes the matrix to
become diluted in chromium This in turn, reduces the
hardenability of the matrix. Beside that when we relate the
carbide dissolution during soaking to the Cr composition in the
carbide and matrix, an equilibrium balance is observed between
the composition of chromium and carbon in the matrix,
independent of the soaking conditions. Kwan-Ho Kim et al [21]
concluded that the soaking time and temperature is dependent
on the diameter of the largest carbide particle being precipitated
and calculated the soaking time dependent on the Cr diffusivity.
Mihaly et al [24] summarised that the carbon concentration
gradient acts as the driving force for its solid state diffusion.
Specifically the diffusion is higher if the concentration difference
is higher. As the carbon composition difference decreases, the

21
driving force decreases. Thereafter the homogenization process
stops when the conc. difference is around 0.05-0.1 wt%.
1.5.2.4 Turbulence during casting
On a macro level, the casting process is a combination of fluid
flow and heat transfer. Besides the mass transfer, the
convection has an important role in heat transfer and causes a
rapid removal of superheat from the melt during solidification.
The mechanical properties of the casting are affected by the
microstructure which is affected by the heat transfer pattern, fluid
flow in the mold and the inoculation process. Numerous flow
mechanisms occur during pouring of melt into the cast. Im et al.
[25] have reported results on the concurrent filling in a two-
dimensional square cavity. Various flow systems involved during
such processes are: (i) filling via a gating system. (ii) momentum
of flow due to oncoming melt, and (iii) natural convection due to
thermal and density gradients [26].
During ingot casting, the melt is poured into the mould through
a gating system. The mould in ingot casting is filled in two
different paths. Either the melt is poured through the top called
Downhill Casting or the mould is filled from the bottom called
Uphill Casting. Generally during uphill casting four to six moulds
are fixed in one stool. The main purpose of the uphill casting is
to decrease the chances of reoxidation and to have a calm filling
procedure. During the Downhill casting the melt is teamed into
the mould from the top. The flow of melt is very turbulent as
compared to the Uphill casting process. Also, the melt stream in
Downhill casting has a large area in-contact with the air, which
increase the chances of oxygen and nitrogen absorption by the
melt. The absorbed gases reacts with the metals in the melt and
forms oxides [4,27]. Also the convection in the melt increases

22
the melt’s interaction with the air. Swaminathan et al. [28] have
tracked the air/liquid interface during pouring. According to
Cambell [29] an oxide film is formed on the surfaces, which are
exposed to atmosphere during pouring. After every few seconds
this film is carried away by the flowing melt into the mould and a
new oxide film is formed. Szekely [30] has described the
formation of eddies in the melt pool away from the wall. These
eddies can be carriers along with other convection flows, which
distribute the oxide particles throughout the mould during
casting.

23
Fig.2. Simplified sketch of the outlay of the thesis, demonstrating the
interaction between the supplements.

24
Chapter 2 Methodology
2.1 Nodularity and factors effecting the Nodule size
and count
The mechanical properties of nodular cast iron are influenced by
many different factors that are related to the microstructure of
the material. One important factor is the variation in the number
and size of the graphite nodules between different areas in the
structure [31]. These variations are most probably related to the
casting conditions. During the casting of large components, one
can expect a very strong convection during the mold filling as
well as during the solidification process. The number of nodules
is related to the nucleation of graphite nodules. The more
available nucleants there are, the more graphite nodules will
precipitate on them. The strong variation in the coarseness of
the structure can be related to the convection during the casting
and solidification process [4,32]. However it is also related to the
cooling rate of the melt during the solidification process. The
cooling rate will vary over the cross section depending on the
location and thickness of the sections of the casting.
2.2 Segregation and precipitation of carbides
Solute contents of alloys makes them prone to chemical
segregation during casting. As the solidification of primary
austenite phase proceeds the solute discharged will be
accumulated in the melt. In addition the mean composition of this
melt will move along the liquidus line and the melt will become
highly rich in solute elements. While the steel freezes at eutectic
temperature, the residual melt is highly rich in solute elements.
Elements, like Cr and Mo have a strong affinity for carbon [10,33]
and the melt finally solidifies with precipitation of large primary
carbides. This results in the formation of large eutectic structure

25
carbides. However, these carbides are fragmented during
mechanical working but the particles remain coarse. These
coarse carbides particles can instigate fatigue damage and
adversely affect the formability [10].
2.3 Soaking
To counteract the segregation and primary carbide precipitation
caused during solidification, the ingots usually undergo soaking.
It is carried out at rolling temperatures typically at 1200oC, to
homogenize the substitutional alloying elements in the austenitic
region, dissolve the primary carbides and to reach a uniform
distribution of other alloying elements [34]. The homogenization
process is isothermal and the diffusion has both short- and long-
range controlling factors.

26
Chapter 3 Experimental
3.1 Nodular Cast Iron
In the report an analysis of the matrix structure and graphite
phase across and along one downhill casted and one uphill
casted so called insert used in Boiling Water Reactor (BWR)-is
presented. The result is discussed in relation to the most
important casting conditions.
Test bars from two different BWR-inserts were investigated,
including an uphill and a downhill cast insert. The two inserts
were cast in sand molds. The downhill cast insert is called 176
and was manufactured by a foundry in Sweden. The uphill cast
insert is called 172 and was manufactured by a foundry in
Finland. Comparison of the structures of the two different inserts
was performed.
Various studies has been conducted to see the effect of the
composition, super heat, cooling rate, inoculation and impurities
on graphite phase [4,32], but the effects of stirring or vigorous
shearing of the melt during solidification of cast iron has never
been studied before this work. Our study focused on the effect
of the turbulence / convection on the matrix and the graphite
morphology in nodular cast iron. Stirring during solidification can
change the effect of heat and mass transfer and also increase
the interaction of oxygen with the melt. This in turn effects the
micro-structure and composition distribution of the graphite. [35]
for this purpose the melt was mechanically stirred during
solidification for different durations. During the trials investigated
the formation of different oxides and its effect on the graphite
morphology were studied.
The microstructure was analyzed in relation to the position and
properties. Four main structural parameters were investigated,
namely: graphite nodule distribution, nodule size, numbers, and
fraction of graphite.

27
3.1.1 Stirring Technique
Fig.3 illustrates the experimental arrangement. Stirring was
conducted by a quartzes rod fitted on a variable speed drilling
machine. Graphite crucibles with quartz sleeves fitted inside
them were used. Special resistance furnaces were designed and
developed to control the melt temperature and the cooling rate
during the stirring. Two different furnaces were built. The original
furnace could be used to heating the crucibles to 650 oC
Fig.3, Schematic illustration of the configuration of the
equipment during experiments.
and could hold only one mold at a time. Therefore some
experiments were conducted by the second resistance furnace
which could hold two graphite molds at a time. Moreover the
molds could be heated to 1200 oC.
Experiments were conducted at Roslagsgjuteriet AB in Herräng,
Sweden. Table. 1, gives the composition of the melt. Melt was
28
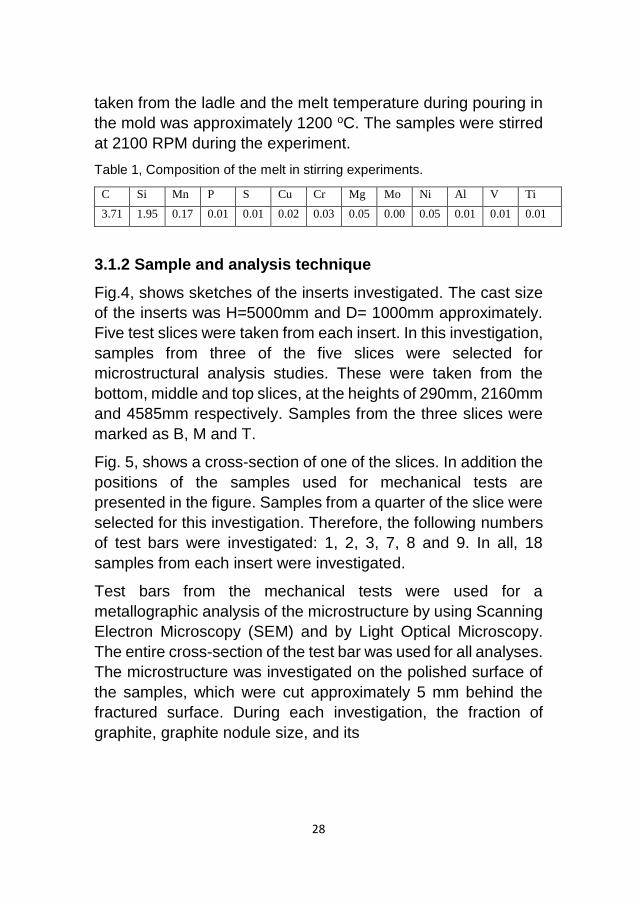
taken from the ladle and the melt temperature during pouring in
the mold was approximately 1200 oC. The samples were stirred
at 2100 RPM during the experiment.
Table 1, Composition of the melt in stirring experiments.
C Si Mn P S Cu Cr Mg Mo Ni Al V Ti
3.71 1.95 0.17 0.01 0.01 0.02 0.03 0.05 0.00 0.05 0.01 0.01 0.01
3.1.2 Sample and analysis technique
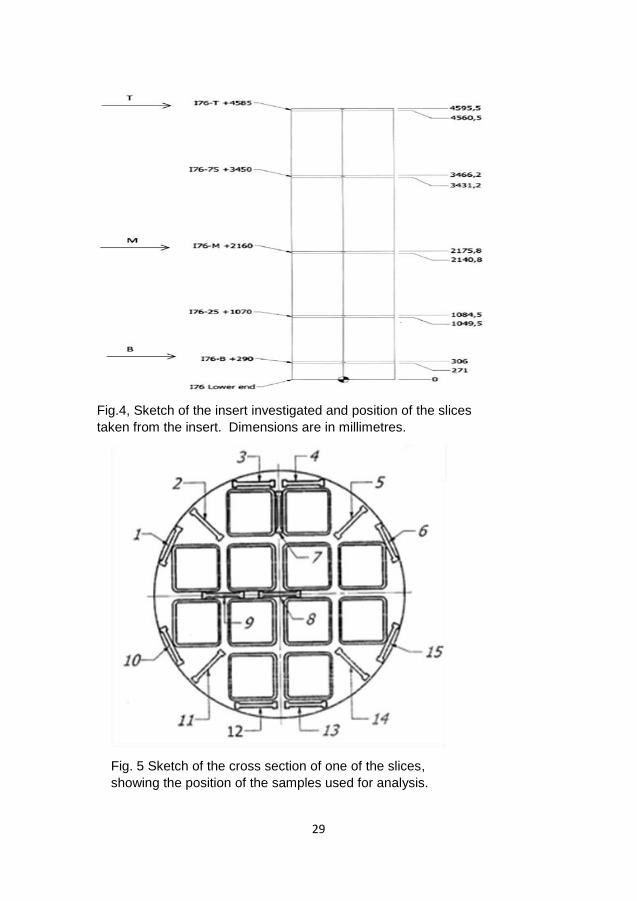
Fig.4, shows sketches of the inserts investigated. The cast size
of the inserts was H=5000mm and D= 1000mm approximately.
Five test slices were taken from each insert. In this investigation,
samples from three of the five slices were selected for
microstructural analysis studies. These were taken from the
bottom, middle and top slices, at the heights of 290mm, 2160mm
and 4585mm respectively. Samples from the three slices were
marked as B, M and T.
Fig. 5, shows a cross-section of one of the slices. In addition the
positions of the samples used for mechanical tests are
presented in the figure. Samples from a quarter of the slice were
selected for this investigation. Therefore, the following numbers
of test bars were investigated: 1, 2, 3, 7, 8 and 9. In all, 18
samples from each insert were investigated.
Test bars from the mechanical tests were used for a
metallographic analysis of the microstructure by using Scanning
Electron Microscopy (SEM) and by Light Optical Microscopy.
The entire cross-section of the test bar was used for all analyses.
The microstructure was investigated on the polished surface of
the samples, which were cut approximately 5 mm behind the
fractured surface. During each investigation, the fraction of
graphite, graphite nodule size, and its
29
Fig. 5 Sketch of the cross section of one of the slices,
showing the position of the samples used for analysis.
Fig.4, Sketch of the insert investigated and position of the slices
taken from the insert. Dimensions are in millimetres.

30
distribution were determined. In this case, the Qwin Standard
and Adobe Photoshop Element software were used for image
analysis. Samples to be studied using Light optical microscopy
investigation were first analyzed without any etching. Thereafter
they were etched with a 2 % Nital solution to enable a study the
matrix structure. Also microprobe analysis were conducted using
Joel SEM and ESPIRIT 2.0 softwares to analyze each peak that
appeared during micro analysis.
Carefully the representative area was selected for observation.
In stirred samples, the areas most affected due to stirring ie. the
lower central areas were selected. Details of the experimental
conditions are given in table.2. All the samples were initially
cooled in the furnace. Thereafter the crucibles were taken out
from the furnace and cooled in ambient conditions.
Table:2 Experimental conditions of the stirring experiments.
Sample
#
Stirring
Time
Inoculant Graphite
Added
Crucible
temp.
before
pouring
Comments
ROS 1 no
stirring
added - - As cast
ROS 2 10 sec added - Room
temp.
-
ROS 3 27 sec added - Room
temp.
-
ROS 4 28 sec added - 4500C -
ROS 5 42 sec. added - 6500C -
ROS 6 85
seconds
added - 800OC -
ROS 8 100
seconds
added 15 grams 1000OC -

31
Samples for the Light microscopy investigation were first
analyzed without any etching. Therefore, they were etched with
2 % Nital enable a study of matrix structure. Also, microprobe
analysis were conducted using Joel SEM and ESPIRIT 2.0
software to analyze each peaks that appeared during micro
analysis.
3.2 Bearing Steel
In the presented work the solidification structure and
segregations in ingot cast ball bearing steel were investigated as
well as the structure and segregations in hot worked and soaked
materials. Different etching techniques as well as SEM EDX
measurements were used to determine different types of primary
carbide precipitations. Initially, Thermo-Calc calculations were
carried out to receive guidance regarding the solidification mode
including the primary carbide precipitations and solid state
phase transformations [36-38]. Also a simple model was
developed to have an idea of the dissolution time of the primary
carbides during soaking.
3.2.1 Material
Two different steel grades having similar composition were used
in this investigation. The compositions of the steels used are
given in table 3. These are commercially available “Through
Hardening” bearing steels, which are carbon steels that have a
hyper-eutectoid composition.
Composition:
Table 3: Composition of the alloy investigated in weight %
Alloy # C Si Mn P S Cr Ni Mo Cu
Aloy1 0.98 0.52 0.97 0.012 0.005 1.89 0.14 0.56 0.128
Alloy2 0.94 0.63 1.03 0.009 0.004 1.94 0.17 0.04 0.144

32
The alloys were melted in an electric arc furnace, treated in a
ladle furnace including vacuum degassed and then cast into 4.2-
ton ingots by uphill casting. Once solidified, the ingots were
removed from the molds and soaked in the soaking pits to
homogenize the segregated areas. Thereafter the ingots were
hot worked to a size of 147x147 mm, corresponding to an
elongation factor of 16.
3.2.2 Sample and analysis technique
From alloy1 samples of a size of 251mm X 103mm were cut off
from a position which corresponds to half the ingot height at the
central part of the ingots cross section. Cross section samples
from alloy2 were cut at a position corresponding to half of the
ingot height.. Sample designations, soaking times and hot
working conditions are presented in table 4.
Table 4: Designation of samples investigated
Sample designation
Alloy # Soaking time Hot Working
0SB Alloy1 No/As Cast No
0SA Alloy1 -“- -“-
SOA4h Alloy1 4 hours No
SOB4h Alloy1 4 hours No
SO20h Alloy1 20 hours No
HW4h Alloy2 4 hours Yes - Rolled
HW20h Alloy2 20 hours Yes - Rolled
After grinding and cleaning, the samples were macro-etched in
a solution consisting of 38% HCl, 12% H2SO4 and water.
After meticulous visual observations of the macro-etched slabs,
several representative areas were selected and micro samples
were cut from these selected areas. For alloy1 the selected
areas were from the A-segregations channels and from the bulk.
Caution was taken to cut the samples from similar locations from
the slab samples to enable a more reliable comparison. In
33
addition, in order to carefully study the soaking effect on the cast
structure in A-segregates and the bulk, soaking was performed
on micro samples, 0SA and OSB in a lab furnace at 1200 oC for
4 hours. The soaked sample has the designation SOA4h and
SOB4h respectively, in Table 6.
After grinding and cleaning, the samples were polished using a
3-micron and then a 1-micron diamond suspension polish. For
optical microscopy and SEM imaging, the samples were etched
with a 2% Nital solution.
To differentiate between different groups of carbides selective
etching was conducted to color specific carbides the sample
were etched with Groesbeck’s reagent [39-41]. The MC carbides
are not attacked by the solution and they appear in a pink color,
M2C are colored dark brown, M6C are out lined and colored blue
or yellow, M7C3 are faintly attacked and colored, while M3C is not
affected by the etching. To verify the results the samples were
also etched by using Murakami’s reagent [39,40], which gives
similar etching affects as Groesbeck’s reagent.
After conducting the microscopic observations, the specific
areas of interest were marked for EDX and EMPA analysis
equipment mounted on Hitachi SEM. The samples were then re-
polished, as the analysis of the etched sample does not provide
the true results because the etchant depletes or reacts with
certain phases and changes the composition. After re-polishing,
quantitative and qualitative composition analyses were
performed of the matrix and of the carbide precipitation. The
secondary arm spacing was measured in the bulk and in A-
segregated areas LOM microscopic analysis.

34
Chapter 4 Results and discussions
4.1 Cast Iron – Structure analysis of inserts
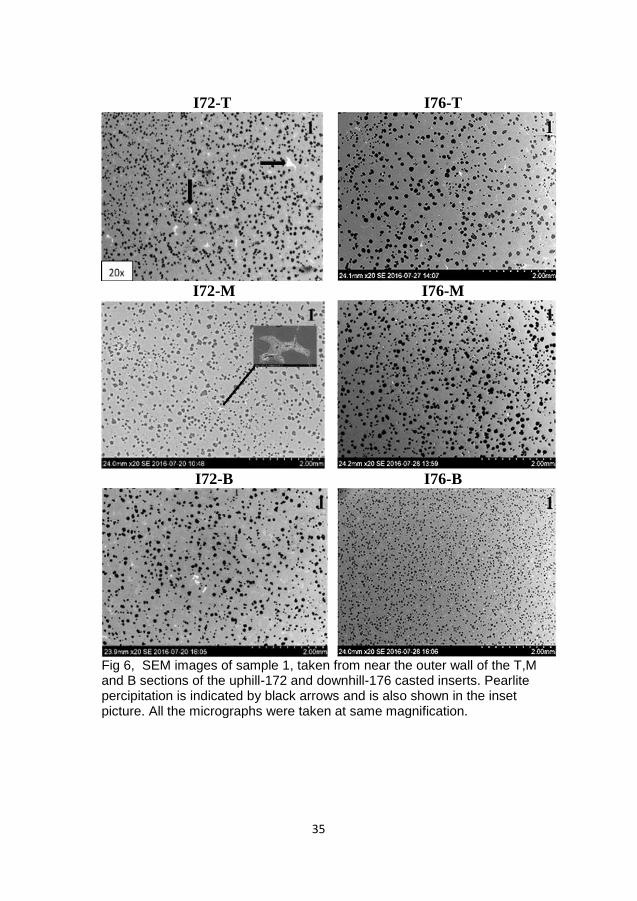
On studying the SEM micrographs of the uphill- and downhill-
cast inserts, shown in Figs. 6 and 7, very little pearlite
precipitation was observed, marked with black arrow in sample
172-T-1. Comparison of samples taken from the area close to
the wall with those from the central part of the insert shows that,
in both inserts, pearlite is mainly precipitated in the areas close
to the mold wall, with insignificant amounts in the central areas.
Similarly it was observed in the micrographs that the nodules
which were precipitated in the areas close to the wall were
comparatively large, had a wider size range and were mostly of
type II [42]; on the other hand, the nodules observed in the
samples taken from central area of the casting were significantly
smaller and had a narrow size distribution. Figs. 8 and 9 give us
a more detailed view of the nodule count and size distribution in
each sample in the T,M and B cross-sections of the uphill- and
downhill-cast inserts. In the graph representing the sample 172-
T shown in Fig. 8A, we observe that the nodule count/mm2 is
significantly higher as compared to the M and B areas of the
uphill-cast insert and the size range in 172-T is also narrower as
compared to that at locations B (Fig. 8B) and M (Fig. 8C). In
uphill-cast insert’s top central area, most of the nodules are
within the 6 to 40 micron size range, whereas the nodule count
is very high. But if we observe the area along the wall in uphill
casting top, we see that the nodule sizes are distributed over a
wider size range and the nodule count is very low as compared
to the central area. Similar results can be observed in all the
sections of uphill- and downhill-cast inserts, although in the
downhill-cast case the nodule count is higher and the size
distribution range is narrower for the bottom section, as
compared to the middle and top sections.
35
I72-T I76-T
I72-M I76-M
I72-B I76-B
Fig 6, SEM images of sample 1, taken from near the outer wall of the T,M and B sections of the uphill-172 and downhill-176 casted inserts. Pearlite percipitation is indicated by black arrows and is also shown in the inset picture. All the micrographs were taken at same magnification.

36
I72-T I76-T
I72-M I76-M
I72-B I76-B
Fig 7, SEM images of sample 8, taken from the center of the T,M and B sections of the uphill-172 and downhill-176 casted inserts. The white spots represents the pearlite phase. All the micrographs were taken at same magnification.
8

37
Fig. 9. (A,B and C) Shows the nodule size range and distribution together
with the nodule count in the T, M and B sections of the uphill casted sample.
Measured over an area of 27.6 mm2
B
C
A

38
Fig. 10. (A,B and C) Shows the nodule size range and distribution together
with the nodule count in the T, M and B sections of the downhill casted
sample. Measured over an area of 27.6 mm2
A
B
C

39
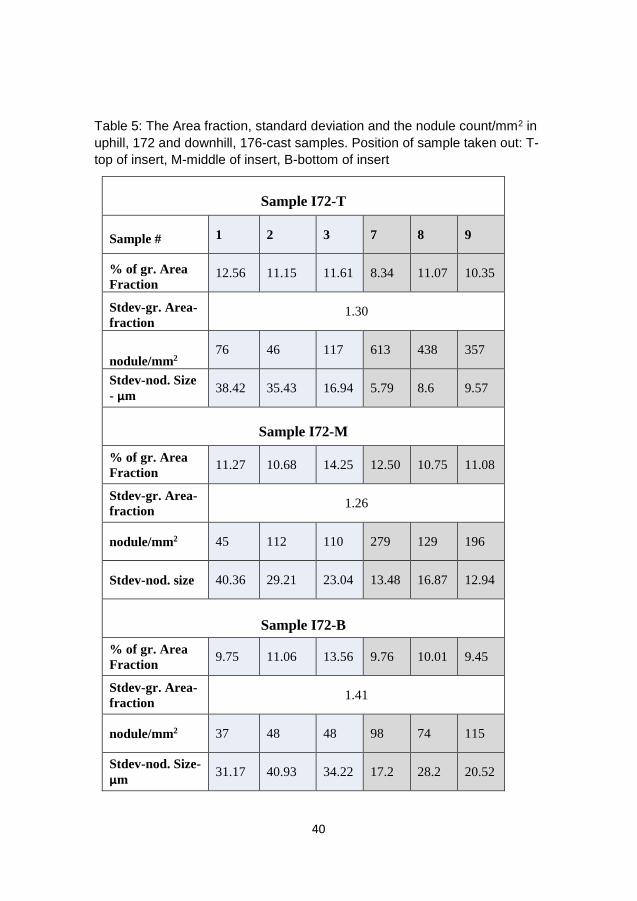
Table 5 gives more detailed results of the nodule count, size
distribution and area fraction of the nodules. The nodule
count/mm2 in the central sections of both castings is mostly more
than 200 % of the nodule count along the wall. The standard size
deviation is quite high in the samples along the wall as compared
to the samples from the central section of the casting. The
samples 172-T and 176-B show quite a homogeneous size
distribution in the central section and have high nodule count.
The size deviation is higher in samples 172-B and 176-T and
they have a comparatively lower nodule count. Looking at
Fig.10, we can observe that top of uphill- and the bottom of
downhill-cast inserts have a higher nodule count and that the
maximum number of nodules are in the 6 to 40 microns size
range. It can also be noted that the downhill-cast insert has a
comparatively higher count of finer nodules.
40
Table 5: The Area fraction, standard deviation and the nodule count/mm2 in
uphill, 172 and downhill, 176-cast samples. Position of sample taken out: T-
top of insert, M-middle of insert, B-bottom of insert
Sample I72-T
Sample # 1 2 3 7 8 9
% of gr. Area
Fraction 12.56 11.15 11.61 8.34 11.07 10.35
Stdev-gr. Area-
fraction 1.30
nodule/mm2 76 46 117 613 438 357
Stdev-nod. Size
- μm 38.42 35.43 16.94 5.79 8.6 9.57
Sample I72-M
% of gr. Area
Fraction 11.27 10.68 14.25 12.50 10.75 11.08
Stdev-gr. Area-
fraction 1.26
nodule/mm2 45 112 110 279 129 196
Stdev-nod. size 40.36 29.21 23.04 13.48 16.87 12.94
Sample I72-B
% of gr. Area
Fraction 9.75 11.06 13.56 9.76 10.01 9.45
Stdev-gr. Area-
fraction 1.41
nodule/mm2 37 48 48 98 74 115
Stdev-nod. Size-
μm 31.17 40.93 34.22 17.2 28.2 20.52

41
Sample I76-T
% of gr. Area
Fraction 11.92 11.92 11.82 11.58 10.85 10.88
Stdev-gr. Area-
fraction
0.46
nodule/mm2 31 51 49 161 252 173
Stdev-nod. Size -
μm 44.65 34.17 28.2 19.12 11.78 15.15
Sample I76-M
% of gr. Area Fraction
13.8 13.01 12.24 10.5 11.41 11.96
Stdev-gr. Area-fraction
1.06
nodule/mm2 48 57 54 280 310 334
Stdev-nod. size 37.88 39.12 34.42 28.18 11.44 10.59
Sample I76-B
Sample # 10.92 11.31 14.93 10.83 10.27 11.33
% of gr. Area Fraction
1.53
Stdev-gr. Area-fraction
107 69 53 596 377 264
nodule/mm2 19.24 29.22 36.6 8.88 8.52 12.5

42
Fig. 10. Comparison between the nodule size distribution and nodule count
of the three cross-sections of the uphill- and downhill-cast inserts..
Measured over an area of 27.6 mm2.
When we compare the size distribution between the samples
closer to the wall and the samples from the center of the three
sections of both castings – Fig. 11(A,B and C), it is very clear
that, for the uphill-cast sample, the average size distribution in
the areas close to the centre increases from top to bottom, but
the nodule count decreases. In the downhill case, it is opposite,
i.e. the size distribution decreases and the nodule count
increases from top to bottom. From Fig. 12, we can see that total
nodule count in the uphill-cast sample decreases from top to
bottom, whereas the nodule count in the downhill-cast insert
increases.
Fig. 13 shows that the nodule count is not proportional to the %
area fraction of nodules. Rather, we see a higher % of area
fraction along the wall as we compare the centre in each cross
section of both castings, whereas the nodule count is higher at

43
Fig. 11. The average size distribution and nodule count of the samples
close to the wall (1, 2 and 3) and samples close to the middle part (7,8,9) of
the three cross-sections of the uphill- and downhill-cast inserts.

44
the centre. On comparing the three cross-sections of both
castings, we observe that the area fraction of nodules is higher
at the middle M section, as compared to the top T and bottom B
sections.
Fig.12: The average nodule count /mm2, average % area fraction of graphite
and the standard deviation of graphite fraction along T, M and B cross-
sections individually, for the uphill- and downhill-cast inserts.

45
Fig. 13: The average % area fraction of graphite for the samples close to
the wall (1, 2 and 3) and close to the middle of the insert (7, 8 and 9), of the
three cross sections T, M and B individually, for uphill and downhill casting.
4.1.1 Discussion
It was observed that the nodule size and size distribution range
is higher in the material close to the mold wall, compared to the
central part of the inserts. This might be related to the difference
in the cooling rates of the two main areas. The cross-sections of
samples 1 and 2 are close to the mold wall, but are also part of
thicker casting sections, which seem to solidify more slowly
compared to the internal areas. The melt between the steel
tubes is cooled by the steel tubes as well as the sand inside the
steel tubes during the solidification process. The regions close
to the mold wall are only cooled by the sand mold, which has a
lower heat capacity than the steel tubes. This results in a much
higher cooling rate of the melt between the steel tubes,
producing more nuclei for the growth of graphite nodules, and
thus larger numbers of nodules.
After the solidification process, the temperature gradient
decreases. The cooling rate also decreases and eventually
becomes the same for different parts of the casting. This affects
46
the fraction of pearlite in different parts of the castings. The
larger number of nodules in the central parts gives a shorter
diffusion distance for the transformation of austenite to ferrite,
resulting in a lower fraction of pearlite in the central parts than in
the regions close to the wall.
Another observation is that the fraction of graphite is lower in the
regions between the steel tubes than in the material close to the
mold wall. This indicates that the carbon content is lower in this
region than in the region closer to the wall. The most plausible
explanation for this is that the carbon content in the steel tubes
increases during the solidification and cooling processes of
casting. When the melt with a high carbon content comes into
contact with the steel tubes with a low carbon content, carbon
starts to diffuse into the steel tubes and, as a result, the carbon
content in the material between the tubes decreases.
There is a difference in the graphite morphology between the
uphill- and downhill-cast inserts. The average number of nodules
per mm2 in the downhill casting is 38 % higher than in the uphill
casting. The explanation for this is the stronger turbulence in the
melt during downhill casting, compared to the convection in the
melt during uphill casting. It is expected that more oxides for
nucleation of graphite are formed when there is strong
convection in the melt. Oxygen is picked up from the gas in the
mold during casting, in spite of the inert atmosphere in the mold.
Since magnesium has a very high affinity for oxygen and there
is still sufficient oxygen in the mold, more oxides are formed due
to the violent movement of the melt, and these act as nuclei for
the graphite nodules.
The fraction of large nodules is larger at the bottom of the uphill-
cast insert than in the downhill-cast insert. The reason for this is
that during uphill casting new hot liquid is filled from the bottom
and the cold liquid is pressed upwards. The bottom part is thus
heated, giving a lower cooling rate in this region during the

47
solidification. Thus, fewer graphite nodules are formed, and
these grow to a larger size.
In the downhill-cast inserts, the opposite nodule size distribution
is observed. The largest and fewest nodules are observed at the
top. This is probably not a result of the difference in cooling rate
of the liquid between the bottom and the top. The reason is most
likely that convection during the casting operation decreases
with increasing liquid height during the casting operation. As
discussed in the previous paragraph, this causes decreased
nucleation of new nodules.
4.2 Stirring and its Effects
Microstructure analysis by LOM and SEM:
Some of the representative results are discussed here. Figs. 14 (a, b) show the matrix of an unstirred as cast sample (ROS 1), for which inoculant was added in the melt prior to pouring in the mold. It was observed that the graphite nodules are surrounded by ferrite in a pearlitic matrix. Carbides have precipitated in typical morphologies.
Fig. 14: Sample ROS 1 (optical microscope). a) Graphite nodules surrounded by ferrite in pearlitic matrix. Carbides have precipitated. b) SEM micrograph nodules in variable sizes are seen.
Fig.15 (a,b) shows results for sample ROS 4, which was stirred for 28 sec. It was observed that the structure has completely

48
transformed from a pearlitic matrix to a ferritic matrix,with a few smaller intergranular pearlitic precipitations. In the area most affected by stirring, precipitation of graphite nodules has increased and we see a large number of small nodules formed, along with other morphologies (Fig. 15a). The nodule count has increased and we see quite a few large and small agglomerated nodules. Large string-like structures, both branched and straight, can also be seen. Very few carbides are present in the affected area, although we observed the precipitation of carbides along the wall of the crucible; some precipitation of graphite was
observed within these carbides.
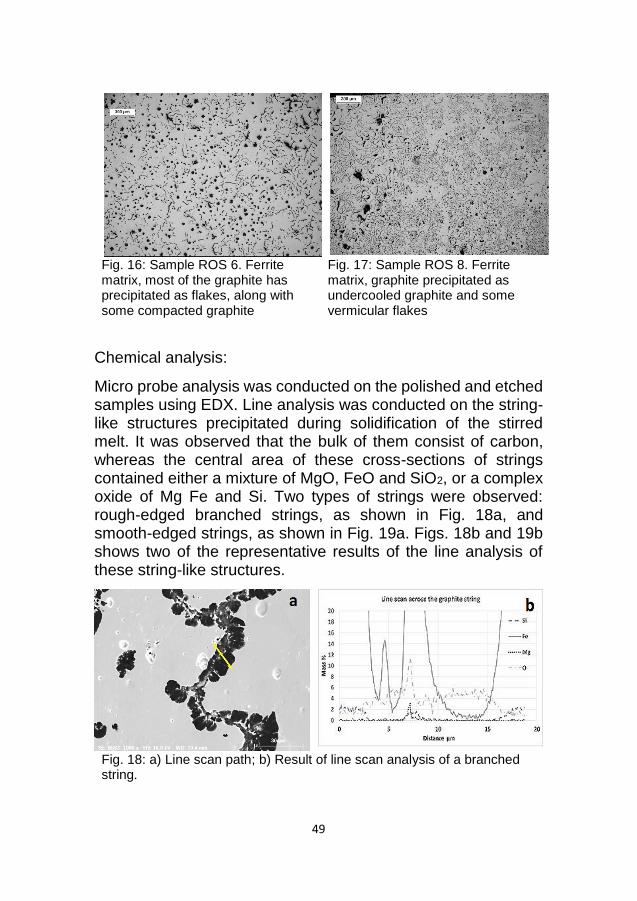
Sample ROS 6, which contains higher carbon content and is presented in Fig.16, shows a ferritic matrix; most of the graphite has precipitated as flakes with some
Fig. 15(a,b): Sample ROS 4. Ferrite matrix. Small interdendritic pearlite precipitates marked by arrows. Increased nodule count in variable sizes.
nodular and chunky precipitation. The reference, which was
cooled in the same conditions but without any stirring, shows
precipitation of nodular graphite; some of the nodules were quite
large. In Fig. 17, which is for sample ROS 8, shows that the
matrix is ferritic, with large portion of graphite precipitated as
undercooled graphite and some vermicular flakes; very few
nodules are visible.
49
Fig. 16: Sample ROS 6. Ferrite matrix, most of the graphite has precipitated as flakes, along with some compacted graphite
Fig. 17: Sample ROS 8. Ferrite matrix, graphite precipitated as undercooled graphite and some vermicular flakes
Chemical analysis:
Micro probe analysis was conducted on the polished and etched samples using EDX. Line analysis was conducted on the string-like structures precipitated during solidification of the stirred melt. It was observed that the bulk of them consist of carbon, whereas the central area of these cross-sections of strings contained either a mixture of MgO, FeO and SiO2, or a complex oxide of Mg Fe and Si. Two types of strings were observed: rough-edged branched strings, as shown in Fig. 18a, and smooth-edged strings, as shown in Fig. 19a. Figs. 18b and 19b shows two of the representative results of the line analysis of these string-like structures.
Fig. 18: a) Line scan path; b) Result of line scan analysis of a branched string.

50
Fig. 19: a) The line scan path; b) Result of line scan analysis of a smooth surface string.
Graphite morphology and distribution:
Fig.20, Size distribution, count/mm and the % area fraction of the all the graphite morphology precipitated.
Fig.21, Size distribution, count/mm and the % area fraction of the graphite nodule precipitated.

51
From the graphs in Figs. 20 and 21, we can observe that the
graphite nodule/particle count and area fraction have increased
due to increased the stirring time and prior heating of the
crucible. Since the graphite in samples ROS 6 and ROS 8
graphite as flakes, it is not included in this analysis.
4.2.1 Discussion
We have observed that the count of nodules plus other particles
has increased significantly in the stirred samples, as compared
to the non-stirred sample. This increase in the graphite particles
/ nodules precipitation can be due to the formation of oxides
during stirring of the melt, as a result of the increased interaction
of the melt with the environment; this increases the oxygen
content in the melt, hence causing the precipitation of oxides.
These oxide particles act as nuclei for the growth of the graphite
nodules. The precipitation of higher numbers of oxide particles
increases the number of graphite precipitation sites. This causes
an increase in the nodule count. But the stirring also causes the
evaporation of Mg, hence decreasing the Mg content of the melt,
which causes precipitation of a significant number of non-
nodular graphite particulates [43].
String-like structures formed in the stirred sample. Chemical
analysis showed that the oxides of Mg, Si and Fe were present
at the centers of these strings and that these oxides were
surrounded by graphite. It seems that initially Fe and Si oxides
precipitated in the form of strings at the surface, since at the
surface a non-equilibrium condition is created due to the
interaction of the melt with the atmosphere. The Fe and Si oxides
formed during this process were unstable oxides which
decomposed and formed MgO [44]. During stirring, these stringy
oxides were dispersed in the bulk and some of them fragmented
into smaller particles; these oxide particles and stringy oxides
acted as nuclei for the deposition of graphite. The fact that there
was no other graphite precipitated in the close vicinity of these

52
strings shows that they were precipitated during early stages of
solidification.
It is also possible that small MgO particles are formed around
the strings when they are transformed to more stable oxide; the
process is similar to that illustrated by Fredriksson et al. [45]
when dissolving graphite in Fe-Ti alloy, which gave a large
number of TiC nuclei. The oxide particles formed due to the
stirring in the melt act as an inoculant and precipitate most of the
graphite from the matrix, thereby discouraging the formation of
cementite. This is probably the reason why we see an increase
in the precipitation of graphite fraction when increasing the
stirring time and decreasing the cooling rate. By increasing the
precipitation of graphite particles, we decrease the diffusion
distance for carbon atoms, thereby increasing the amount of
graphite phase.
Transformation to a ferritic matrix might be caused due to slow
cooling of the sample, since the crucible was heated before
pouring the melt and then the furnace was switched off after
stirring, although the crucible was left in the furnace to cool down
until it reached below eutectoid temperature. After that, the
crucible was taken out and cooled in ambient conditions. The
conversion from pearlite to a ferrite matrix can also be due to the
coarseness of the structure: the finer the structure, the shorter is
the diffusion distance, which favors a ferritic matrix. Diffusion is
also affected by the cooling rate: lower cooling rate gives a larger
time for diffusion. Also, since the nodule count is increased due
to the increase in the amount of nuclei available, this decreases
the diffusion distance of carbon atoms; hence, more carbon
diffuses out of the matrix, increasing the area fraction of graphite
precipitated. It seems that a larger amount of the carbon in
stirred area has precipitated out of the matrix, due to the
transformation of austenite phase to the ferrite phase, which can
lower the carbide and martensite precipitation. The increase in

53
volume fraction might also be a result of more ferrite in the
matrix, as can be observed in samples ROS 4 and ROS 5.
During stirring, the Mg present in the melt reacted with the
environment and evaporated; this is verified by the fact during
stirring lots of sparks were observed coming from the melt. Also,
the oxygen content of the melt increases relative to the Mg
content. That could be the reason for the formation of graphite
shapes other than nodular. So, we observe a decrease in
nodularity in general, and where the stirring was continued for a
longer time period the graphite has precipitated in other forms.
4.3 Bearing Steel – microstructure and chemical analysis
Macrosegregation:
Randomly orientated dendrites were seen after macro-etching of
the unsoaked and soaked samples, as shown in Figs. 22a and
b respectively. These randomly orientated dendritic structures
are typically representative of an equiaxed crystal zone. The
areas exhibiting darker shades correspond to regions with high
segregation (16). The dendritic structure is not clearly visible in
the soaked sample due to the homogenization of solute
elements. The rounded dark areas
Fig. 22a. Cross section of macro
etched as cast unsoaked sample
0S. A-segregation channels are
marked with arrows. Equiaxed
crystals are visible.
Fig. 22b. Cross section of macro
etched, as-cast soaked sample
SO20H. The dendritic structure is not
clearly visible due to the
homogenization of solute elements.

54
marked by arrows in Fig. 22a represent A-segregation channels.
The diameters of the A-segregation spots are 3 mm on average.
Microstructure in bulk, un-soaked samples:
The microstructure in the bulk can be seen in Fig. 23a. The
etching has revealed a dendrite structure. The secondary arm
spacing was measured as 270 μm ± 41 μm.
Precipitation of a white phase of primary carbides occurs at
certain interdendritic regions and is marked by arrows. The area
fraction of primary carbide was measured to be 𝑓𝑠𝐶𝑎𝑟𝑏𝑖𝑑𝑒 =
0.0011. This value can be compared to the Scheil calculations,
which indicate a fraction of liquid, 𝑓𝐿 = 0.01, at the start
precipitation of M6C at 1148oC. Assuming that all remaining
liquid would solidify to primary carbide, there is a big difference
between the calculated and measured results.
Fig. 23b shows a SEM back scattered micrograph of the bulk
matrix of the unsoaked as cast sample. A gray phase of
Fig. 23a. LOM micrograph of as
cast sample 0S. Carbide
precipitation marked by arrows can
be seen in interdendritic regions.
Some ferritic crystalline growth can
be seen in the center of dendrites.
Fig. 23b. SEM back scattered
micrograph of as cast sample 0S,
showing the distribution of carbides
and MnS along the interdendritic
region. Some lamellar precipitates
can be observed in the pearlitic
matrix.

55
carbide exists in the interdendritic region with precipitation of
MnS and a white phase. The matrix has a lamellar structure.
The SEM images exhibited in Figs. 24a and b were recorded
with backscattered electron (BSE) imaging, and show the
carbides precipitated in the bulk matrix of unsoaked as cast
sample. The composition of Mo and Cr in the carbide at the
points marked A, B, C and D were selected for chemical
analysis. In Fig. 24a, analysis of the light gray carbide
compositions at locations A and B in the matrix is in the range of
5-8% Cr and 3.4% Mo. The grey border carbide, marked by C,
surrounding the light silver carbide shows compositions of
approximately 12.4% Cr and 7.5% Mo. The light silver carbide in
the centre, marked by D, has values as high as20.5%Cr and
53.5% Mo.
In Fig. 24b, the white carbide, marked A, contains 5.3% Cr and
51.5% Mo. The light silver carbide, marked C, contains 27.7%
Cr and 50.1 % Mo. The grey border carbide, surrounding the
Fig 24a: Composition analysis of a
carbide in the bulk matrix of an
unsoaked sample. The mass
percentage composition at area
marked by: A) 5.5% Cr, 3.1% Mo;
B) 7.8% Cr, 4.3% Mo; C) 12.43%
Cr, 7.5% Mo; D) 20.5% Cr, 53.5%
Mo.
Fig 24b. EDS analysis of a carbide
in the bulk matrix of an unsoaked
sample The mass percentage
composition at area marked by: A)
5.3% Cr, 51.53% Mo; B) 29.7% S,
61.7% Mn; C) 22.7% Cr, 50.1%
Mo; D) 7.7% Cr, 5.8% Mo.

56
light silver carbide, marked D, contains 7.7 % Cr and 5.8% Mo.
In the last solidified region MnS, type III, has precipitated,
marked by B, with high concentrations of Mn and S.
The micro segregations of Cr and Mo in the bulk matrix of
unsoaked as cast samples were mapped by EMPA. The results
are presented in Fig. 25. The concentrations in the interdendritic
areas are quite high with spots of very high concentrations,
which seem to originate from primary carbides. In the center of
the dendrites, the concentration is more even. The map also
shows that the elements are not evenly distributed along the
interdendritic regions, but vary substantially.
The segregation index, defined as the concentration in the
interdendritic matrix divided by the concentration in the center of
the dendrites, is roughly 3.4%/1.4% = 2.4 for Cr, and
1.8%/0.4%=4.5 for Mo. The micro segregation is higher for Mo
than for Cr.
Fig. 25. EMPA report of sample 0S, showing the distribution of Mo and Cr
in the bulk matrix. Uneven distribution of alloying elements along the
interdendritic region was observed, with high concentration spots.
By color etching, it was possible to reveal more details about the
primary carbides and especially the white carbides, as seen in
Figs. 26a and 26b. According to [39-41], M2C is colored brown,
M6C is outlined and colored blue and M7C3 is faintly colored.
Cementite is not affected by the etch reagent.

57
Both Figs. 26a and b show a eutectic structure of carbides with
M2C as brown phase and M6C as blue phase appearing,
especially at the borders between the brown and white phases.
These carbides are precipitated in a matrix of uncolored white
Fig. 26a. Matrix of the colored
etched sample 0S. M2C is
colored brown, M6C is outlined
and colored blue, and M7C3 is
faintly colored.
Fig. 26b. Matrix of the colored etched
sample 0S. M2C is colored brown, M6C
is outlined and colored blue, and M7C3
is faintly colored.
phase in contrast to the matrix, which is shifting in a slightly gray
tone. This white phase seems to correspond to the gray phase
in Fig. 23a and Fig. 24a.
Hardness measurements were carried out in order to try to
distinguish between different carbides. In the center of the
dendrite, the hardness was about 210 HV. In the primary carbide
precipitation, the hardness varied between 900-1200 HV,
depending on the amount of grey carbon phase and silver/white
phase present. One conclusion is that the white phase in Figs.
26a and 26b is carbide and not retained austenite.
An EDS analysis in SEM was carried out to evaluate how the Cr
and Mo concentration decreases from the center of the dendrite
to the interdendritic region. The results are presented in Fig. 27
as dotted lines. Every dot is a measurement point. In the same
diagram, the results from calculating the micro-segregation
profiles by Scheil’s, are plotted as solid lines, with 𝑘𝐶𝑟𝛾/𝐿
= 0.58 and
𝑘𝑀𝑜𝛾/𝐿
= 0.31. The k-values were evaluated from the Thermo-Calc
Scheil calculation at the stage when the first M6C was
precipitated. There is good agreement between the measured

58
and calculated concentrations until 𝑓𝑠~0.93. The measurement
values for 𝑓𝑠 >0.93 originate mainly from the grey carbide.
Microstructure in bulk, soaked samples:
No primary carbides were seen in the interdendritic regions of
the sample soaked for 20 hours; see Fig. 28a. The contrast
between the center of the dendrite and the interdendritic region
has decreased, which shows that the composition difference of
alloying elements has decreased in these areas, as compared
to the unsoaked sample in Fig. 23a.
Fig. 27. Comparison between calculated and experimental values of Mo
and Cr segregation along the dendrite. It can be seen that precipitation of
carbides starts earlier than predicted by the Scheil calculation.
To enable a comparison with the unsoaked condition, an EDS
analysis in SEM was carried out to evaluate how the Cr and Mo
concentration decreases from the interdendritic region to the
center of the dendrite after soaking. The results are presented in
Fig. 28b. An evaluation of the segregation index gives
2.6%/1.5%=1.7 for Cr and 1.25%/0.4%=3.1 for Mo. In
comparison with the unsoaked samples, the index has
decreased mainly due to decreased concentrations in the
interdendritic areas.

59
In the sample from the bulk matrix SOB4h, all the primary
cabides were dissolved after soaking for 4 hours at 1200oC in
the lab furnace, while few small carbides remained in the sample
SOA4h in the A-segregate region, when soaked under same
conditions.
Microstructure in A-segregates, un-soaked samples:
Fig. 29a shows the dendrite structure in the A-segregated
channels. The secondary arm spacing is smaller compared to
that in the bulk. In the A-segregated area, the secondary arm
spacing was measured as 183 μm ± 29 μm. Also, a large primary
carbide network was observed in the A-segregation channel.
The area fraction of carbide in this region was 𝑓𝑠𝐶𝑎𝑟𝑏𝑖𝑑𝑒 = 0.0027,
i.e. twice that in the bulk.
Fig. 28a. Microstructure of the
sample SO20h. No primary carbides
are visible in LOM. Less intense
solute segregation.
Fig. 28b. SEM picture of sample
SO20h, exhibiting secondary
carbide precipitated along the inter-
crystalline region. It also shows the
pattern of EDS analysis.
Fig. 29b shows the SEM image of interdendritic regions and
carbides with indications of point analyses by aid of EDS,
marked by A, B, C and D. The gray border carbide, marked by
A and darker carbide phase, marked by B, has the composition
10-12% Cr and 5-6% Mo. The white carbide phase, marked C,
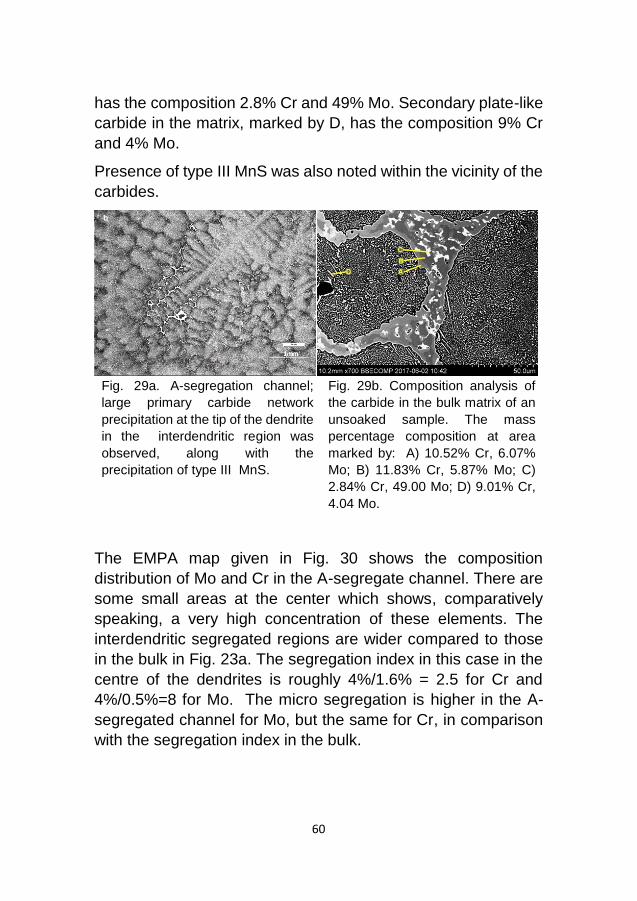
60
has the composition 2.8% Cr and 49% Mo. Secondary plate-like
carbide in the matrix, marked by D, has the composition 9% Cr
and 4% Mo.
Presence of type III MnS was also noted within the vicinity of the
carbides.
Fig. 29a. A-segregation channel;
large primary carbide network
precipitation at the tip of the dendrite
in the interdendritic region was
observed, along with the
precipitation of type III MnS.
Fig. 29b. Composition analysis of
the carbide in the bulk matrix of an
unsoaked sample. The mass
percentage composition at area
marked by: A) 10.52% Cr, 6.07%
Mo; B) 11.83% Cr, 5.87% Mo; C)
2.84% Cr, 49.00 Mo; D) 9.01% Cr,
4.04 Mo.
The EMPA map given in Fig. 30 shows the composition
distribution of Mo and Cr in the A-segregate channel. There are
some small areas at the center which shows, comparatively
speaking, a very high concentration of these elements. The
interdendritic segregated regions are wider compared to those
in the bulk in Fig. 23a. The segregation index in this case in the
centre of the dendrites is roughly 4%/1.6% = 2.5 for Cr and
4%/0.5%=8 for Mo. The micro segregation is higher in the A-
segregated channel for Mo, but the same for Cr, in comparison
with the segregation index in the bulk.

61
Examples of color etching of the carbides in the A-segregated
interdendritic areas are shown in Figs. 31a and 31b. A eutectic
precipitation of white carbon phase and brown M2C dominates.
Fig. 30. EMPA report of sample 0S, showing the distribution of Mo and Cr in
an A-segregate channel. High concentration areas in the middle of the
carbide can be seen.
Fig. 31a. Color etching of
primary carbides in A-
segregate. The eutectic consists
mainly of M2C, brown color and
white carbide phase. Some M6C
exists at the border.
Fig 31b. Color etching of primary carbides
in an A-segregation channel at lower
magnification.
Hardness measurements gave values in the range of 500-800
HV, with some values up to 1140 HV. The lower hardness of the

62
carbides in A-segregate could be attributed to larger areas of
dark gray carbides.
Results on hot worked and soaked material:
A banded structure was observed in the hot worked samples.
These bands were aligned in the hot working direction. The
segregation bands were very distinctive in the samples heat
treated for 4 hours (HW4h) and then deformed, as shown in Fig.
32a, whereas for the ingot heat treated for 20 h and then
deformed, the bands are weaker with low levels of contrast
between the bands, as shown in Fig. 32b.
A high degree of segregation of the alloying elements in the
darker areas of these bands was noted. The fraction of
secondary carbides was also high in these dark bands, and
some of the carbides were observed to be surrounding the
elongated MnS. The average distance between the darker
bands is about 230 μm in Fig. 32a. This distance can be
compared with the recalculated average dendrite arm spacing of
70 ~ μm, after hot working with an elongation factor of 16. This
shows that it is only the most segregated interdendritic areas in
the cast structure that give rise to the bands.
Linear analyses by EDS were carried out across the banded
structure in Fig. 32a and 32b. The results are presented in Fig.
33a and 33 33b. The results show variations in concentrations
with high peaks due to presence of carbides. However, it is
interesting to note that the average differences between dark
and light band decreases with soaking time.

63
Fig. 32a. LOM image of the banded
structure of sample HW4h. The
band lines are sharp and narrower.
High contrast.
Fig. 32b. LOM image of the banded
structure of sample HW20h. Band
lines are blunt and wider. Low
contrast.
Fig. 33a. Line analysis of sample
HW4h, showing the distribution of
Cr along the bands.
Fig. 33b. Line analysis sample
HW20h, showing the distribution of
Cr along the bands.
Fig. 34 shows micrographs of both dark and light bands in
sample HW4h, which was soaked for 4 hours and deformed, and
sample HW20h, which was soaked for 20 hours and deformed.
Both the samples are equally strained. Fig. 34a shows the dark
band with high alloying element concentration, the structure
consisting of completely spheroidized carbides within the ferrite
matrix. No lamellar cementite is visible. Fig. 34b shows the
lighter band with a lower composition of alloying elements. The
sample has a mixture of spheroidized carbides and lamellar

64
pearlite scattered around. Fraction of pearlite phase is high, in
some areas secondary carbides are seen nestled in the pearlitic
matrix. Fig. 34c exhibits a darker band within the sample soaked
for 20h and deformed, yielding large spheroidized regions with
comparatively finer carbides that are mixed with a small pearlitic
region containing pearlite lamella. Fig. 34d shows a lighter area
in the banded structure, which exhibits a structure similar to that
in Fig. 34b, but with higher fraction of lamellar pearlite region. It
is obvious that the soaking time and concentration differences
influence the matrix structure.
a)
b)
c)
d)
Fig. 34. Micrographs of the hot worked samples etched with Nital: (a)
sample HW4h exhibiting a dark band region (b) sample HW4h, showing
lighter region, (c) sample HW20h exhibiting a darker region and (d) sample
HW20h, showing a lighter region, of the banded structure.

65
4.3.1 Discussion
In Fig. 23a, it can be seen that the primary carbides precipitate
only at certain interdendritic areas. Consequently, the alloy
concentration varies from one area to another. However, the
Scheil equation predicts a continuous precipitation of primary
carbides in interdendritic regions. The measured area fraction of
carbide was 𝑓𝑠𝑐𝑎𝑟𝑏𝑖𝑑𝑒=0.0011. The Scheil calculation shows that
carbide M6C starts to precipitate at 𝑓𝐿=0.01. Assuming that all of
the remaining liquid solidifies to carbide, the total primary
precipitation of carbide should be 10 times that of the measured
fraction. It is obvious that the Scheil’s equation does not predict
the amount of primary carbide precipitation for the bearing steel
studied.
The average distance between the segregation lines in the hot
worked samples in Fig. 32 is, on average, 230 μm. This
corresponds to a distance of 920 μm in the as cast samples,
which can be compared with the average measured secondary
arm spacing of 270 μm. From this, it clear that the concentrations
in the interdendritic areas vary from region to region, giving
peaks of high concentration which cause precipitation of primary
carbides. A hypothesis to explain this is that the concentration
peaks arise due to redistribution of enriched liquid by fluid flow
caused by solidification shrinkage.
A summary of measured micro segregation levels of Cr and Mo
for as cast samples is presented in Table 6. Soaking for 20 hours
decreases the Cr concentration significantly in interdendritic
areas, but not in the dendrite center. The explanation is that the
concentration gradient is steeper closer interdendritic areas and
hence the back diffusion rate will be higher. In A-segregate
channels, the mean compositions of Cr and Mo are higher
compared to those in the bulk. This is the explanation as to why
the fraction of interdendritic carbides is higher in A-segregation
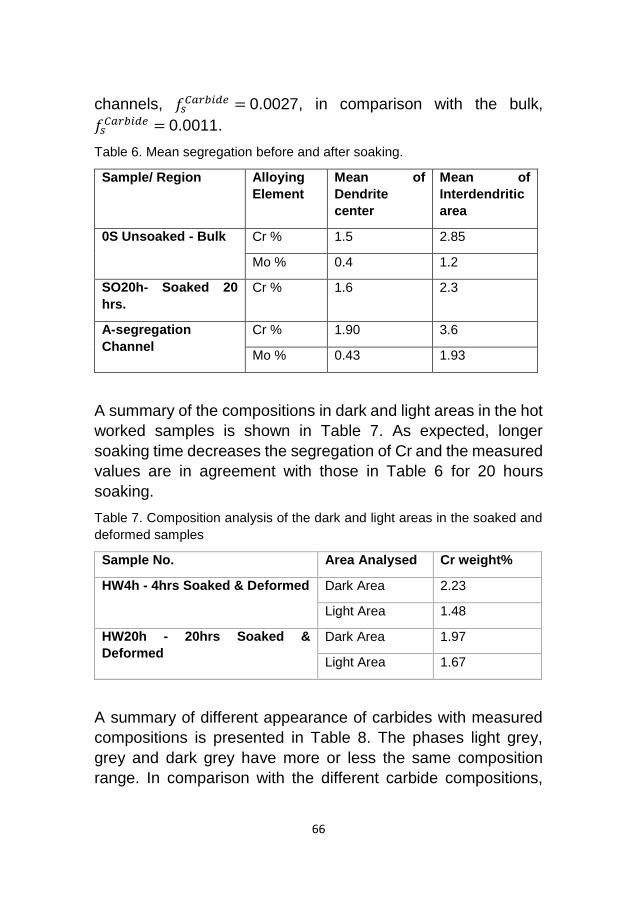
66
channels, 𝑓𝑠𝐶𝑎𝑟𝑏𝑖𝑑𝑒 = 0.0027, in comparison with the bulk,
𝑓𝑠𝐶𝑎𝑟𝑏𝑖𝑑𝑒 = 0.0011.
Table 6. Mean segregation before and after soaking.
Sample/ Region Alloying
Element
Mean of
Dendrite
center
Mean of
Interdendritic
area
0S Unsoaked - Bulk Cr % 1.5 2.85
Mo % 0.4 1.2
SO20h- Soaked 20
hrs.
Cr % 1.6 2.3
A-segregation
Channel
Cr % 1.90 3.6
Mo % 0.43 1.93
A summary of the compositions in dark and light areas in the hot
worked samples is shown in Table 7. As expected, longer
soaking time decreases the segregation of Cr and the measured
values are in agreement with those in Table 6 for 20 hours
soaking.
Table 7. Composition analysis of the dark and light areas in the soaked and
deformed samples
Sample No. Area Analysed Cr weight%
HW4h - 4hrs Soaked & Deformed Dark Area 2.23
Light Area 1.48
HW20h - 20hrs Soaked &
Deformed
Dark Area 1.97
Light Area 1.67
A summary of different appearance of carbides with measured
compositions is presented in Table 8. The phases light grey,
grey and dark grey have more or less the same composition
range. In comparison with the different carbide compositions,

67
calculated by Thermo-Calc, the closest carbide type is
cementite, M3C. The result from the color etching also supports
that these phases are M3C carbides. It could also be possible
that the gray and dark gray phases are M23C6. The white phase
in the bulk samples corresponds to M6C with high content of Mo.
The measured composition of the light silver phase in the bulk
sample could be a mix of different carbides, for example M7C3
and M6C. The color etching, Fig. 26, indicates that the white
carbide in Fig. 23b and in Fig. 29b is M2C (brown color), with
M6C, blue colored, appearing at the border of cementite. This
also indicates that M6C precipitated during cooling, and not
during solidification. Primary carbides in A-segregated areas
shown in Fig. 31 seem to be a cooperated precipitation of
cementite and M2C. This difference in carbide appearance in
comparison to the bulk could be attributed to higher level of the
carbide-forming elements Cr, Mo and C.
Table 8. Summary of appearance of carbides and corresponding measured
compositions
Shade of the
carbide
Composition of Cr. wt
%
Composition of Mo.
wt %
Bulk A-
segr.
Bulk A-segr.
Light grey in matrix 5.5 - 9.0 9 3.1 - 4.4 4.4
Grey phase 7.7 - 12.4 10.5 5.8 - 7.5 6.1
Dark gray phase 11.8 5.9
Light silver 20.5 - 22.7 50.1 - 53.5
White 5.3 2.8 51.5 49
To get an idea of the dissolution time of the primary carbides, a
simple model was developed with the following assumptions:
1. Diffusion of Cr in γ is the rate-determining step for carbide
dissolution.

68
2. The phase boundary between dissolving carbide and γ does
not move.
3. The concentration gradient in γ is assumed to be a straight
line, as shown in Fig. 35a.
A mass balance for Cr between carbide and γ gives:
(𝐶𝐶𝑟𝐶𝑎𝑟𝑏𝑖𝑑𝑒/𝛾
− 𝐶𝐶𝑟𝛾/𝐶𝑎𝑟𝑏𝑖𝑑𝑒
) ∙ 𝑤 = 𝑥 ∙ (𝐶𝐶𝑟𝛾/𝐶𝑎𝑟𝑏𝑖𝑑𝑒
− 𝐶𝐶𝑟0 )
Eq (1)
𝑥 = 0.477 ∙ √4𝐷𝑡 Eq
(2)
where 𝐶𝐶𝑟𝑐𝑎𝑟𝑏𝑖𝑑𝑒/ 𝛾
is Cr-concentration in the carbide, 𝑤 is the
thickness of dissolved carbide, 𝐶𝐶𝑟𝛾/𝑐𝑎𝑟𝑏𝑖𝑑𝑒
is the Cr-concentration
in γ in contact with carbide, 𝐶𝐶𝑟0 is the concentration in the center
of the dendrite, D is the diffusion constant of Cr and t is
Fig. 35a. Cr concentration in γ versus
distance from the primary carbide for
different soaking times. The diffusion
distance, x, in Eq.(3) is marked out.
Fig. 35b. Dissolved primary carbide
versus soaking time at different
soaking temperatures. The circles
indicate half the thickness of the
primary carbides and corresponding
time for complete dissolution.
time. The diffusion distance, x, is determined from the error
function (erf) solution of Fick’s second law by solving
erf(x/√4Dt) = 0.5.

69
Input data to Eq.(1) and Eq.(2) are given in Table 9 for
calculations of concentration gradients and dissolved carbide
thickness.
Table 9. Input data to Eq.(2) and Eq.(3), with a note on where the values are
taken from
Cr, weight
%
Note Temp. oC
D, (cm2/s)
[47]
𝐶𝐶𝑟𝐶𝑎𝑟𝑏𝑖𝑑𝑒/𝛾
10 Table 9 1150 0.9 10-10
𝐶𝐶𝑟𝛾/𝐶𝑎𝑟𝑏𝑖𝑑𝑒
4 Table 3 1200 1.7 10-10
𝐶𝐶𝑟0 1.5 Table 7 1250 3.3 10-10
Fig. 35b shows the results of calculated carbide thickness
versus soaking time for three different soaking temperatures.
From Figs. 23b and 29b, it is possible to estimate the thickness
of the primary carbides to be about 12 μm. The circles indicate
half the carbide thickness and the results indicate that the
primary carbides are dissolved before 4 hours soaking at the
temperatures 1200oC and 1250oC, but not for the lower
temperature 1150oC. This is in agreement with the measurement
results of carbides on the soaked samples.
The detailed mapping of the remaining primary carbides in the
soaked sample SOA4h showed a few primary carbides left in the
A-segregated area. It indicates that there exist areas in the ingot
that have quite high segregation levels in the interdendritic
regions. To meet the requirement of having no primary carbides
in the final product by setting a sufficient soaking time and
temperature will not be an easy task. For example, selecting a
soaking time of 10 hours would, most probably, dissolve all of
the carbides. However, it would be very difficult to prove this from
a practical point of view, since a huge number of micro-samples
would need to be taken from different positions in the ingot for
evaluation, in order to have a reliable statistical basis.

70

71
Chapter 5 Concluding remarks
5.1 Conclusions
The segregation behaviour of carbon in carbon-based ferro
alloys were investigated in this study. The focus was laid on the
precipitation of graphite nodules in nodular cast iron and the
precipitation and dissolution of carbides during soaking of a
bearing steel grade. In nodular cast iron, the effects of
solidification conditions, cooling rate and convection on the
variation in the number and size of the graphite nodules was
investigated. Experiments were conducted to observe the
effects of convection during solidification on the graphite nodule
precipitation. Further investigations were conducted on the
segregation, precipitation of carbides and formation of banded
structure in bearing steel and how these factors are affected by
soaking. The specific conclusions drawn from this work may be
summarized as follows:
1. The nodule size and size distribution range is higher in the
material close to the mold wall and at the thinner sections of the
casting, compared to the central and thicker parts of the casting.
This is attributed to the difference in the cooling rates of these
areas. Specifically, higher cooling rates produces more nuclei on
which graphite nodules precipitate.
2. Due to the precipitation of a larger number of graphite nodules
in the thicker areas of the casting, the diffusion distance for the
austenite to ferrite transformation decreases. This results in a
lower fraction of pearlite in the central area of the casting
compared to the area close to the wall.
3. The average number of nodules per mm2 in the downhill-cast
sample is 38% higher than in the uphill-cast one, due to stronger
turbulence in the melt in the former, as compared to the latter.
4. An increase of the level of convection in the melt during
solidification can result in an increased number of nuclei. This,

72
in turn, increases the number of nucleation sites for graphite
precipitation and thereby increases the nodule count.
5. String-like structure formed in the stirred sample. Chemical
analysis showed that oxides of Mg, Si and Fe were present at
the centre of these strings and that these oxides were
surrounded by graphite.
6. An increase in the precipitation of the graphite phase can
transform the structure of nodular cast iron from a pearlite matrix
to a ferrite matrix, due to the decrease in the diffusion distance.
7. The convection in the melt can causes the evaporation of Mg;
this decreases the Mg content of the melt which causes
precipitation of a significant number of non-nodular graphite
particulates.
8. Primary carbides precipitate in the interdendritic regions
during the solidification of the bearing steel.
9. EDS analysis shows that the major part of the primary
carbides that precipitated in bearing steel contains ~ 10 wt% Cr
and 5 wt% Mo. This indicates that the carbides most likely are
cementite.
10. The colour etching of bearing steel reveals that M2C carbide
precipitates in cooperation with cementite during solidification.
11. A-segregated channels contain about double the amount of
primary carbides compared to the bulk; this is due to the higher
concentrations of carbide-stabilizing elements Cr and Mo.
12. The primary carbides in the bulk matrix of the investigated
bearing steel grade are dissolved after 4 hours of soaking at
1200oC.
13. The most interdendritic segregated areas in the bulk give rise
to a banding structure in the hot worked material.

73
Fig. 36, Simplified sketch of the layout of the different sections of the thesis
and the most important conclusions for each supplement.

74
Concluding Discussion:
As mentioned earlier, in this study the segregation behaviour of
carbon in carbon-based ferro alloys was investigated. The
effects of convection in the melt on the precipitation of the
graphite nodules and the overall structure during solidification of
nodular cast iron and the precipitation behaviour of the carbides
in the bearing steel grade 100CrMnMoSi8-4-6 was not reported
in earlier studies. Hence, the results from the laboratory scale
analysis and some industrial experiments render some new
information about the subject. The actual layout of the thesis,
along with some main conclusions for individual sections, is
displayed in Fig. 36.
The mechanical properties of nodular cast iron are influenced by
many different factors that are related to the microstructure of
the material; among the main factors are the variation in the
number and size of the graphite nodules between different areas
in a large casting. These variations are most probably related to
the casting conditions. The number of nodules is related to the
nucleation of graphite nodules; the more nuclei are available for
the formation of graphite nodules, the more nodules there are.
The cooling rate will vary over the cross-section depending on
the thickness, shape and location of the section. Higher cooling
rate produces more nuclei for the growth of graphite nodules and
thus larger numbers of nodules.
During the casting of large components, one can expect very
strong convection during mold filling as well as during the
solidification process. Various studies have been conducted to
see the effect of composition, superheat, cooling rate,
inoculation and impurities on graphite phase [3,10], but the
effects of stirring or vigorous shearing of the melt during the
solidification of cast iron has not been studied carefully before.
In this study, we analysed the effect of turbulence/convection on
the matrix and the graphite morphology in nodular cast iron. The
convection in the melt during solidification increases the

75
interaction of the melt with the environment, which increases the
oxygen content in the melt, hence causing the precipitation of
oxides. These oxide particles act as the nuclei for the growth of
the graphite nodules. The precipitation of a higher number of
oxide particles increases the number of graphite precipitation
sites. This causes an increase in the nodule count. The average
number of nodules per mm2 in the downhill-casting sample was
38 % higher than in the uphill-cast one. This is attributed to the
greater convection in the melt during downhill casting. Due to the
interaction of the melt with the atmosphere during convection,
string-like structure having oxides of Mg, Si and Fe at the centre
and surrounded by graphite were formed. It seems that initially
Fe and Si oxides precipitated in the form of strings at the surface;
since these oxides are unstable, they decomposed and formed
MgO. During stirring, these stringy oxides were dispersed in the
bulk and some of them fragmented into smaller particles; these
oxide particles and stringy oxides acted as nuclei for the
deposition of graphite.
The larger number of nodules in the central parts gives a shorter
diffusion distance for the transformation of austenite to ferrite,
resulting in a lower fraction of pearlite in the regions with higher
nodule count, than in the regions with lower nodule count.
In bearing steel, primary carbides precipitate in the inter-
dendritic region, the major part these carbides contains ~ 10 wt%
Cr and 5 wt% Mo and is probably cementite. M2C carbide
precipitates in cooperation with cementite. The A-segregated
channels contain about double the amount of primary carbides
compared to the bulk, due to the higher concentrations of
carbide-stabilizing elements Cr and Mo. These primary carbides
are dissolved after 4 hours of soaking at 1200oC.

76
5.2 Future work
- More experimental studies to relate the nodule count and size
distribution with the physical properties of the casting.
- To fully understand the mechanism and effects of stirring on
the melt and also to find the optimum conditions to control the
nodule morphology.
- The decomposition behaviour of the carbides during soaking of
bearing steel, has to be examined.

77
6. References
1. Commodity Special Feature. World Economic Outlook,
International Monetary Fund,October 2015.
2. Hans Berns, W. T. Ferrous Materials: Steel and Cast Iron.
Springer Science & Business Media. (2008)
3. Pickering EJ: ‘Macrosegregation in steel ingots: the
applicability of modelling and characterisation techniques’, ISIJ
Int., 2013, 53, 939–949
4. H. Fredriksson and U. Åkerlind: Materials Processing during
Casting. John Wiley & Sons Ltd. West Sussex , (2006)’
5. Peter Marks: European cast iron and steel casting grades.
Beuth Verlag, 2nd Edition 2009.
6. S.N. Lekakh, J. Qing, V.L. Richards, K.D. Peaslee. AFS
Proceedings 2013-American Foundry Society, Schaumburg, IL.
Panel 13-1321.
7. Bahubali B S and Vasudev D S. IOSR Journal of Mechanical
and Civil Engineering, 2013, 5(6): 17–23
8. Rick Campbell. The History of Steel: A Selected Works. All
Nations Press. 2015
9. David Llewellyn, Roger Hudd. Steels: Metallurgy and
Applications. Elsevier,
1998.
10. H. K.D. H. Bhadeshia: Prog. Mat. Sci., 57(2012), 268
11. J. Cappel, M. Weinberg and R. Flender: Ball Bearing Journal,
2(2004), 261.
12. Handbook of Thermal Process Modeling Steels, [ed] Cemil
Hakan Gur, Jiansheng Pan, CRC Press, (2008), 300.

78
13. M. Holtzer et al., Microstructure and Properties of Ductile Iron
and Compacted Graphite Iron Castings, Springer Briefs in
Materials. 2015
14. M. C. Flemings and G.E. Nereo: Transactions of the
Metallurgical Society of AIME, 242(1968), 50.
15. J. H. Hollomon and L. D. Jaffe: Castings, Steel,
Homogenization of Steel Castings. (1942), Watertown Arsenal,
Vol. 632/G.
16. Steel Casting Hand Book. [ed.] Thomas L. Malcolm Blair. 6.
s.l. : ASM International, (1995).
17. W. Hume-Rothery: Atomic Theory for Students of Metallurgy.
London: Institute of Metals, (1969).
18. J. M. Beswick: Metallurgical Transactions A, 18(1987), 1897.
19. R. M. Fisher, G. R. Speich, L. J. Cuddy and H. Hu: Proc. of
the Darken Conference. Monroeville, PA, (1976), 463.
20. Herring, Daniel H. Industrial Heating, v.81, no.10, 2013 Oct,
p.16(2)
21. K.-H. Kim, S.-D. Park and C.-M. Bae: Met. Mater. Int.,
20(2014), 207.
22. J. O. Andersson, T. Helander, L. Höglund, P. F. Shi and B.
Sundman: Calphad, 26(2002), 273.
23. Jin S., Chen Q., Bratberg J. (2016) Thermodynamic
Calculations and Precipitation Simulations of HSLA Steels. In:
HSLA Steels 2015, Microalloying 2015 & Offshore Engineering
Steels 2015. Springer, Cham
24. Mihaly Reger, Balazs Vero, Imre Felde, Ibolya Kardos..
Journal of Mechanical Engineering, 2, 2010, Vol. 56, pp. 143-
149.
25. I. T. Im, W. S. Kim and K. S. Lee, International Journal of
Heat and Mass Transfer, Vol. 44, pp. 1507-1515, 2001.

79
26. N. P. Yadav, Deepti Verma, International Journal of
Chemical, Molecular, Nuclear, Materials and Metallurgical
Engineering Vol:9, No:12, 2015
27. J. Campbell, “Complete Casting Handbook, Metal Casting
Processes, Metallurgy,Techniques and Design”. Aug 2015.
ISBN: 978-0-444-63509-9
28. C. R. Swaminathan and V. R. Voller, Appl. Math. Modelling,
1994, Vol. 18, pp. 101-108,
29. J. Campbell, “Castings”. ISBN: 978-0-7506-4790-8, pp. 17-
18
30. J. Szekely, “Fluid Flow Phenomena in Metals Processing”,
ISBN: 978-0-12-680840-7.
31. S.N. Lekakh, J. Qing, V.L. Richards, K.D. Peaslee. AFS
Proceedings 2013-American Foundry Society, Schaumburg, IL.
Panel 13-1321.
32. J. Müller, W. Siefer: Giessereiforschung 45 (1993) No. 3, pp.
92-98
33. H.E. Kline. Technical Report, Airsearch Manufacturing
Companyof Arizona, USA1978, 22-0751,
34. Steel Casting Hand Book. [ed.] Thomas L. Malcolm Blair. 6.
s.l. ASM International, 1995.
35. J. M. Radzikowska. ASM Handbook Volume 9,
Metallography and Microstructures (ASM International),
Published: December 01, 2004,Pages: 565 - 587 (23).
36. Andersson J.O., Helander T., Höglund L., Shi P.F., and
Sundman B. Thermo-Calc and DICTRA, Computational tools for
materials science. (2002) Calphad, 26, 273-312.
37. Jin S., Chen Q., Bratberg J. Thermodynamic Calculations
and Precipitation Simulations of HSLA Steels. (2016) In: HSLA
Steels 2015, Microalloying 2015 & Offshore Engineering Steels
2015. Springer, Cham

80
38. E. Erişir, O.G. Bilir, A.E. Gezmişoğlu. IOP Conf. Ser. Mater.
Sci. Eng., 179 (2017), p. 012021
39. Vander Voort, G., Manilova, E., & Michael, J. A Study of
Selective Etching of Carbides in Steel. (2004). Microscopy and
Microanalysis, 10(S02), 76-77.
doi:10.1017/S1431927604883375
40. Vander Voort, G..F., Metallography and microstructures.
ASM Handbook, Vol 9, p 257
41. De Colnet, Et al. Quantitative description of MC, M2C, M6C
and M7C3 carbides in high speed steel rolls. Third International
Conference on Material structure & micromechanics of fracture,
Brno (2001).
42. Spheroidal graphite cast irons – Classification, ISO
1083:2004
43. G.M Goodrich .AFS Transactions 669, (Committee 5J
Report) (97-30)—, page 669-683
44. Ellingham, H. J. T. (1944), "Transactions and
Communications", J. Soc. Chem. Ind. (London), 63 (5): 125,
doi:10.1002/jctb.5000630501
45. Hasse Fredriksson, Ulla Akerlind, “Solidification and
Crystallization Processing in Metals and Alloys”, 2012, ISBN:
978-1-119-99305-6. Page 175-182
46. R.M. Fisher, G.R. Speich, L.J. Cuddy, and H. Hu.
Proceedings of the Darken Conference. Monroeville, PA : s.n.,
1976. pp. 463-88.
47. A. W. Bowen, G. M. Leak, Met. Trans. 1(1979), 1695
48. Krauss, George. Solidification,. Metallurgical and Materials
Transaction B, 2003, Vol. 34B, pp. 781-792.