solving the candle problem: exploring the link between ...€¦ · finding creative,...
TRANSCRIPT

Solving the "Candle Problem:" exploring the link
between financial incentives and performance
in individuals and groups.
by
Joachim Ramm
Master’s thesis
This master’s thesis is submitted for completion of the following degree
Master of Economics
University of Bergen, Institute of Economics
August 2012

II
Page intentionally left blank

III
Acknowledgements
I wish, first and foremost, to thank my supervisors Professor Sigve Tjøtta and Professor Gaute
Torsvik. Their help and guidance has been invaluable. In addition to their academic and moral
support, I wish to thank them and the Department of Economics at the University of Bergen
for the financial support necessary for conducting the experiment.
I would also like to thank my fellow students, especially those who helped me carry out the
experiment.
Finally, I would like to thank the lovely Vanessa for helping me with the language and
proofreading the drafts along the way.
All interpretations and errors are my own responsibility.
Joachim Ramm, Bergen, 31. August 2012.

IV
Abstract
Solving the "Candle Problem:" exploring the link between financial incentives and
performance in individuals and groups.
by
Joachim Ramm, Master in Economics
University of Bergen, 2012
Supervisors: Sigve Tjøtta and Gaute Torsvik
Sam Glucksberg demonstrated in an experiment that the use of financial incentives could
reduce performance in solving an insight problem. I wish to conduct a modified version of
this experiment to investigate if his results can be duplicated. In addition, I wish to examine if
the results are the same when a group of participants attempt to solve the same problem as
individual participants.
The experiment was divided into two sessions. One session where pairs attempted to solve the
problem, and one session where individual participants were asked to solve the same problem.
Within each session the participants were either assigned to an incentivized or a non-
incentivized condition.
The results from the experiment indicate that the use of financial incentives created no
difference in the mean solution time within each session of the experiment; the incentivized
and the non-incentivized participants performed equally well in both sessions. The difference
between the sessions was, however, significant with the participants in the group session
performing significantly better than the individual participants. The results also indicate that
males might have a lower mean solution times than females.

V
Table of Contents
Acknowledgements .................................................................................................................III
Abstract ................................................................................................................................... IV
Table of Contents .................................................................................................................... V
List of Tables ......................................................................................................................... VII
Table of Figures .................................................................................................................... VII
1. Introduction .......................................................................................................................... 1
1.1. An introduction of the research on the use of financial incentives ........................... 1
1.2. The “Candle Problem” .................................................................................................. 3
1.3. Glucksberg’s version of the “Candle Problem” .......................................................... 5
1.4. Research Question ......................................................................................................... 7
1.5. Results ............................................................................................................................. 8
1.6. Disposition ...................................................................................................................... 9
2. Conceptual Framework ..................................................................................................... 10
2.1. General theoretical framework .................................................................................. 10
2.2. Thesis specific considerations ..................................................................................... 15
2.3. Different versions of the “Candle Problem” ............................................................. 19

VI
2.4. Summary ...................................................................................................................... 22
3. The Experiment .................................................................................................................. 24
3.1. Recruitment process .................................................................................................... 24
3.2. Design ............................................................................................................................ 26
3.3. Procedure ..................................................................................................................... 28
4. Results ................................................................................................................................. 32
4.1. Descriptive Analysis .................................................................................................... 33
4.2. Statistical Analysis ....................................................................................................... 35
4.2.1 Mann-Whitney test ................................................................................................ 35
4.2.2 Regression analysis ................................................................................................ 36
5. Discussion ............................................................................................................................ 41
6. Appendix ............................................................................................................................. 47
Appendix A1. Invitation and instructions ........................................................................... 47
Appendix A2. Data from the experiment ............................................................................ 51
Appendix A3. Results from the unpaired two-sample t-test with equal variances ............ 53
Appendix A4. Budget ........................................................................................................... 54
References ............................................................................................................................... 55

VII
List of Tables
Table 1 - Glucksberg (1962), Mean Solution Times, standard deviation in brackets ........ 6
Table 2 - Descriptive table, robust standard error in brackets ......................................... 33
Table 3 - Regression analysis, dependent variable: Time ................................................... 38
Table 4 - Regression analysis, dependent variable: lnTime ................................................ 39
Table of Figures
Figure 1 - The “Candle Problem” ........................................................................................... 4
Figure 2 - Standard incentive theory .................................................................................... 12
Figure 3 - Setup of the experiment ....................................................................................... 28
Figure 4 - First set of instructions ......................................................................................... 29
Figure 5 - Task description .................................................................................................... 30
Figure 6 - Box-and-Whisker plot for the two sessions ........................................................ 34

1
1. Introduction
This section will contain a brief introduction of the research on the use of financial incentives.
An overview of the “Candle Problem” and Sam Glucksberg’s variation will follow. Then, the
research questions of this thesis and the results from the experiment are presented. At the end
of the chapter, there will be an overview of the disposition for the rest of the thesis.
In the context of this thesis, the term “financial incentives” refers to the possibility of
attaining a financial reward by performing at a certain level.
1.1. An introduction of the research on the use of financial incentives
Performance-based compensation has long been used to increase effort and productivity
among employees. The reason for using performance-based compensation is due to an
apparent, well established and well documented relationship; the performance-based
compensation is thought to increase motivation and effort, which in turn increase
performance.
Over the last couple of decades, however, research found indications that, under certain
circumstances, financial incentives may actually lead to a reduction in performance. One of
the earliest and most well-known papers on this topic is Sam Glucksberg’s “The Influence of
strength of drive on functional fixedness and perceptual recognition” (1962). Glucksberg
conducted an experiment where the participants were asked to solve an insight problem. He
found that the participants who were incentivized by a performance-based compensation
actually performed worse than the non-incentivized participants.

2
In the beginning of the 1970’s, research pioneered by Edward Deci found indications that the
use of tangible rewards, especially financial incentives, could have detrimental effects on
intrinsic motivation1 (Deci, 1971). This intrinsic motivation was by Deci deemed crucial to
the performance in the type of problem (i.e. insight problem) used by Glucksberg in his paper.
This and later research ( (Amabile, 1985), (Ariely, Gneezy, Loewenstein, & Mazar, 2009) and
(Deci, Koestner, & Ryan, 1999)) indicates that the relationship between financial incentive
and performance is perhaps more complex than originally assumed. The types of tasks where
the use of financial incentives is believed to be more likely to cause detrimental effects are in
the so-called “insight problems.” These effects include an over-optimal level of arousal
(Yerkes-Dodson law2), increased propensity of functional fixedness, choking, known from the
world of sport where misses are more common during competition than in practice (Dandy,
Brewer, & Tottman, 2001), a narrowing of focus making the less obvious solutions harder to
reach (Ordóñez, Schweitzer, Galinsky, & Bazerman, 2009) and increased risk taking (Larrick,
Heath, & Wu, 2009).
The view that financial incentives can be detrimental to performance is not shared by
everyone. Some researchers claim that the use of financial incentives does, in fact, increase
performance. Kruse, Blasi and Freeman (2012) investigated whether linking an employee’s
pay to firm performance helped a number of firms vying to become one of the “100 Best
1Intrinsic motivation refers to an interest or enjoyment for engaging in a task for no other reason than
the task itself.
2 Yerkes-Dodson law predicts that there is an optimal level of effort, and that beyond this point, the
increasing effort starts to have a detrimental effect on performance (Yerkes & Dodson, 1908).

3
Companies to Work For in America” increase their employees’ performance. They found that
the combination of group incentive pay and policies increasing employee influence led to
reduced turnover and increased return on equity. Another paper used data from Dutch firms to
investigate the relationship between performance-related pay and productivity. The study
found that the use of performance-related pay increased productivity at the firm level with 9%
and employment growth with 5% (Gielen, Kerkhof, & van Ours, 2010).
It is important to uncover the true effects of financial incentives. The tasks the typical
employee in the western world performs are increasingly complex and rely on skills such as
finding creative, non-conventional solutions and interpersonal relationships. This growing
complexity combined with the fact that performance-based compensation is a very popular
and common way of reimbursing employees,3 causes a huge potential “loss” in productivity,
if the use of financial incentives does in fact reduce performance. The goal is that this thesis
will make a contribution to the scholarship necessary to increase knowledge in this field.
1.2. The “Candle Problem”
The problem used by Glucksberg in his 1962 discoursee is called the “Candle Problem.” This
is also the problem the participants in the experiment conducted in relation to this thesis
attempted to solve. The “Candle Problem” is usually conducted by first dividing the
participants into two groups which differ in some pre-existing characteristic, such as time
lived abroad ( (Maddux & Galinsky, 2009), age (German & Defeyter, 2000), or the level of
financial incentive (Glucksberg, 1962).
3 http://cep.lse.ac.uk/pubs/download/dp1112.pdf

4
The participant is then presented with a candle, a box containing tacks and a box/book of
matches, and asked to attach the candle to the wall by only using the objects presented so that
the candle can burn properly, and that no wax will drip on the table or on the floor. The
correct way to solve this problem is to be able to perceive that either the box containing the
tacks or the box of matches can also act as a container or platform for the candle. See figure 1
for the standard setup and solution to the “Candle Problem4.” The participants usually have a
time limit to solve the problem.
Figure 1 - The “Candle Problem5”
Standard setup Solution
4 Note that in this depiction of the setup a book of matches is used, in the version conducted in regards
to this thesis a box of matches were used. Using a box of matches gives an additional way to reach
the solution; the box containing the matches can also be used a platform or container for the candle.
5 http://lessonstream.org/2011/03/31/the-candle-problem/

5
1.3. Glucksberg’s version of the “Candle Problem”
Sam Glucksberg’s version of the “Candle Problem” is the most well-known. In Glucksberg’s
experiment, 128 participants (males, randomly selected from the introductory psychology
course at New York University) were divided into two groups. The two groups of 64
participants conducted each a different variation of the “Candle Problem,” one in which the
box was empty and the tacks were placed on the table (“tacks outside box” version), and one
in which the tacks were situated inside the box (“tacks inside box” version). The participants
in both groups were assigned either to a non-reward condition named “low-drive” (non-
incentivized group), or a reward condition where they could receive $5 for being among the
top 25% fastest solvers, or $20 for being the fastest, named the “high-drive” condition
(incentivized group). Glucksberg’s hypothesis for the “tacks outside box” version was, “when
the correct habit is dominant, a high drive should facilitate problem solving,” and for the
“tacks inside box” version, the hypothesis was “when the correct habit is low in the habit
hierarchy, a high drive should retard problem solving.” A failure was defined as being unable
to find the correct solution within the provided time limit of 15 minutes. In the “tacks outside
box” version, the results were as expected; the group with the financial incentive performed
better, both in a lower number of failures and a lower solution time.
The surprise came in the “tacks inside box” version, this time the incentivized group
performed worse. See table 1 for results.

6
Table 1 - Glucksberg (1962), mean solution times, standard deviation in brackets
Tacks outside box Tacks inside box
Incentivized Non-incentivized Incentivized Non-incentivized
Mean 3.67 (4.52) 4.99 (5.42) 11.08 (4.84) 7.41 (5.63)
Number of failures 2 6 16 10
N 32 32 32 32
Time is measured in minutes
Glucksberg reported a statistically significant difference between the incentivized and the
non-incentivized group in the “tacks inside box” version when their results were evaluated by
a t-test (t = 2.73, P < 0.01). The same discovery was not made in the “tacks outside box”
version. He contributes the reason for not finding a significant difference in the “tacks outside
box” version to the fact that the solution might have been too obvious, thus creating a ceiling
effect6.
The hypothesis formulated by Glucksberg states: “When the correct habit is low in the habit
hierarchy, a high drive should retard problem solving.” This statement can be interpreted as
the existence of extrinsic financial incentives can inhibit the performance in problems
classified as “insight problems.”
6 Since the solution where the tacks are outside the box is so obvious and easy to reach there is not
much time to “gain” by exerting extra effort. So the increase in effort caused by the financial
incentives doesn’t help to significantly lower the solution times.

7
1.4. Research Question
The results from Glucksberg’s “tacks inside box” version of the “Candle Problem” are very
insightful when viewed in the light of traditional economic theories, which predict that the use
of financial incentives lead to an increase in the expected performance. It would, however, be
interesting to conduct variations of Glucksberg’s experiment to determine if the mechanism
detected by Glucksberg is also valid under other circumstances, such as when both genders
attempt to solve the “Candle Problem” and when participants cooperate in groups. In addition,
little research has been done to directly compare the effect of financial incentives between
individuals and groups.
The experiment conducted in association with this thesis is a variation of Glucksberg’s
experiment. The experiment was conducted in two sessions, one in which individual
participants attempted to solve the ”Candle Problem,” and one in which pairs attempted to
solve the problem. Allowing participants to attempt to solve the “Candle Problem” in groups
has not, to my knowledge, been done before and will hopefully provide insights into the
effects of financial incentives on performance in a group setting. Comparing the two
variations can also highlight any differences in the response to financial incentives between
groups and individuals.
Due to the results attained by Glucksberg and the relative similarity between his experiment
and the experiment conducted in this thesis, it is expected that the results in the individual
session will be the same. In the group session, the lack of precedence from earlier experiments
makes any predictions regarding the results more difficult. Due to the relative similarities to
Glucksberg’s experiment, it is also expected that the financial incentive will have a
performance retarding effect in the group setting. Earlier research has shown that groups have

8
better insight-problem solving abilities than individuals (Smith, Bushouse, & Lord, 2010), it
is therefore expected that the groups will perform better than the individuals.
This thesis will investigate the following three hypotheses:
1. The use of financial incentives will cause the incentivized participants to perform inferior
to the non-incentivized participants in solving the “Candle Problem” on an individual
level.
2. The use of financial incentives will cause the incentivized participants to perform inferior
to the non-incentivized participants in solving the “Candle Problem” in a group setting.
3. The participants in the group session of the “Candle Problem” will perform at a higher
level than the participants in the individual session.
1.5. Results
The results from the experiment did not show any significant statistical difference in the mean
solution times between the incentivized and the non-incentivized participants in either the
individual or the group session. Therefore, hypotheses 1 and 2 are rejected. Between the two
sessions, there was a difference in the mean solution time, with the participants in the group
session having a significantly lower mean solution time than the participants in the individual
session. Therefore, hypothesis 3 is not rejected. There are also some indications in the data
that males might have a lower mean solution time than females.

9
1.6. Disposition
This thesis is organized in the following way. Following Section One, Section Two presents
the conceptual framework, including the general theoretical framework, thesis specific
considerations and an overview of some earlier versions of the “Candle Problem.” Section
Three contains a description of the recruitment process, the experimental design and the
procedure of the experiment. Section Four contains the descriptive and statistical analysis of
the data. Section Five holds a discussion on the findings and some suggestions for further
research. Lastly, Section Six contains the appendix.

10
2. Conceptual Framework
This chapter will first focus on outlining the general theoretical framework regarding the use
of financial incentives, followed by a description of some aspects of the use of (financial)
incentives more specific to this thesis and the “Candle Problem.” A short overview of earlier
publications of the “Candle Problem” will follow before a brief summary will end the chapter.
2.1. General theoretical framework
The aspects of economic theory that are most relevant to the use of financial incentives and
performance are rational choice theory, agency theory and incentive theory, the latter two of
which are founded on the rational choice theory.
Rational choice theory is a theory that tries to understand and predict human behaviour. The
modern approach (after Paul Samuelson (1938)) is based on revealed preferences; individuals
act consistently and if they do, we can model their choices as if they maximize a utility
function. This theory has been dominant within the field of economics for several decades and
has, due to its apparent success, also gained popularity in other social sciences.
In economics, financial incentives are often studied in a principal agent framework. The basic
idea in this model is that the principal does not have the time or expertise to perform a certain
task; he therefore hires an agent to perform this task. In the context of this thesis, the agent
can be thought of as an employee while the principal can be thought of as an employer. There
exists an information asymmetry between the agent and the principal (the agent has better
information regarding his preferences and effort than the principal), which creates two

11
problems: (i) the objectives of the agent may not be aligned with those of the principal, and
(ii) the agent may have an incentive to shirk7.
Solutions to the agent-principal problems that have been suggested include: increased
monitoring of the agent (Prendergast, 1999), more sophisticated screening processes and
complete contracts. Increased monitoring can be interpreted as a signal of distrust from the
principal8, and can in complex situations, be prohibitively expensive. Screening processes are
designed to achieve a correct representation of the agent’s preferences, so that the agent with
the most similar objectives to the principal can be hired for the job. Complete contracts means
that every possible outcome of the future is included in the contract with the respective rights
and responsibilities of the parties involved. To create these complete contracts is a theoretical
exercise and not possible in real life.
Agency theory further assumes that the level of compensation is linked to some observable,
contractible outcome that is positively correlated with effort; a higher performance-based
compensation will lead to a higher level of effort from the agent (Awasthi & Pratt, 1990),
which in turn leads to a higher expected performance. This expected increase in performance
originates in the rational choice theory. When financial incentives are used, two effects
influence the behavior of the agent: (i) the additional wealth can be used by the individual to
consume more goods, (ii) the relative “cost” of not working goes up (the opportunity cost of
7 This depends on the preference of the agent. If the agent wants to maximize the same thing as the
principal, then a problem does not exist; the more aligned the preferences are, the less of a problem
shirking becomes.
8 This increased monitoring has, however, also been hypothesized to have positive effects: the
increased monitoring can be perceived as supporting by the employee (Frey & Jegen, 2001).

12
leisure time increases), and work thus becomes relatively more profitable. Both of these
effects are expected to cause a rational agent to increase his amount of effort.
While the scope of the agent-principal model is limited to explaining the relationship between
financial incentives and effort, the incentive theory goes one step further and attempts to
explain the relationship between financial incentives and increased performance by depending
on two underlying assumptions: (i) financial incentives lead to an increase in motivation and
effort, (ii) this increase in motivation and effort results in an increase in performance (see
Figure 2).
Figure 2 - Standard incentive theory
Financial
incentives
Increased
motivation and
effort
Increased
performance
Critisism has been raised agaist the first of these assumptions. Some scholars claim that the
use of financial incentives can create a “conflict of motivation,” where the extrinisic
motivation created by the use of financial incentives reduce, or crowd out, intrinsic motivation
( (Deci, 1971) and (Frey & Jegen, 2001)). In addition, the “multi-task problem” has been put
forth (Prendergast, 1999); when a part of the task is rewarded, the motivation and effort that
goes into the non-rewarded part of the task can be reduced. An example of such can be a
teacher whose pay is dependent on the students’ exam results; this can cause the teacher to
focus on teaching the students exam-relevant questions, while overlooking other equally
important parts of the curriculum.

13
Additionally, researchers hypothesize that the frequent use of financial incentives can cause a
reduction of the individuals’ perception of the “value” of the incentive (Suvorov, 2003). In
other words, the incentive needs to consist of an increasingly larger amount to have the same
effect on the motivation of the potential recipients. Furthermore, an unconsidered and
exaggerated use of financial incentives can cause an “addiction” to rewards in the sense that a
reward becomes expected when similar tasks are faced in the future. The use of incentives can
also have a signaling effect on the attractiveness of the task, which can cause some
individuals to view the tasks as more unpleasant when an incentive is used (Suvorov, 2003).
In the experiment conducted in this thesis, it is assumed that the first assumption in the
standard incentive theory holds, and the focus will therefore be on the second assumption9.
Several research papers have claimed that the increase in effort and motivation does not
necessarily lead to an increase in performance, especially in the so-called “insight tasks” (
(Ariely, Gneezy, Loewenstein, & Mazar, 2009), (Camerer & Hogarth, 1999) and (Gino &
Ariely, 2012)).
Ariely (2009) and his colleagues subjected participants to six different tasks (2 tasks labeled
as “memory tasks,” 1 task labeled as a “creative task” and 3 tasks labeled as “motor skills
tasks).” They used three different levels of incentive during their experiment; low, medium
and high. The participants could receive a reward dependent upon their assigned level of
incentive (low, medium or high) and whether they reached either of two specified
9 This seems to be warranted in this situation; for students, the prospect of earning some extra money
should be enough to increase motivation and effort. The experiment is an isolated occurrence and
should not reduce, or crowd out, any intrinsic motivation among the participants. The problem of
multi-tasking also seems irrelevant in this setting.

14
performance levels, labeled “good” or “very good.” The researchers found no significant
difference in performance between the low and medium incentive levels, the participants in
the low-incentive group, however, performed significantly better than the participants in the
high-incentive group.
The fact that increased motivation and effort can lead to no improvement or even a reduction
in performance seems out of place when considering economic theory, where it is
commonplace to view effort as a choice which has a cost to the individual (Ariely, Gneezy,
Loewenstein, & Mazar, 2009). When effort has a cost to the individual, and if too much effort
decreases performance, the rational individual will reduce the amount of effort in order to
achieve optimal performance and maximize his surplus. The fact that, under certain
circumstances, the use of financial incentives can reduce performance, might suggest that the
increase in motivation and effort is not controllable or voluntarily. This increase might cause
other psychological phenomena, which can be detrimental to the performance in the task, to
become prevalent.
Despite the possible detrimental effects that the use of financial incentives can have on
performance10
, the problems outlined in the principal agent framework have led to the rise of
several types of compensation-schemes. These compensations-schemes are designed to
incentivize a correct representation of the agent’s objective and efforts, and align the interest
of the agent and the principal. The most common of these compensations schemes are
individual performance-based compensation schemes and organization-wide gain sharing
10
Research (Deci, 1971) has shown that the use of rewards such as verbal praise, increased
responsibility or other type of social recognition are a lot less likely to cause these detrimental
effects .

15
plans. A performance-based compensation scheme is where an individual or several
individuals are, partly or fully, compensated contingent on to what extent certain pre-defined
goals are met. These goals are usually, but not necessarily, the result of negotiations between
the individual(s) and some sort of employer/manager. The extent to which the performance-
based compensation is part of the whole compensation package varies greatly across
industries and professions. Performance-based compensation does not necessarily mean a
cash bonus; it can also include stock options, stocks, contributions towards retirement savings
or other types of financial compensation.
This type of variable compensation scheme has several varieties; performance-contingent
compensation, completion-contingent compensation and engagement-contingent
compensation.
2.2. Thesis specific considerations
While the previous part of the chapter was dedicated to more general considerations regarding
the use of performance-based compensation, the following section contains topics more
specific to this thesis and the “Candle Problem.”
Glucksberg hypothesized that the results he obtained could be contributed to the fact that
when the solution is not straightforward, a financial incentive will intensify the effects of a
psychological phenomenon named “functional fixedness,” and thus hamper the solution of the
problem.
The German psychologist Karl Duncker first described functional fixedness in the 1930’s. He
theorized that once an object or process has been associated with performing a certain task, it

16
can be challenging to perceive that it can be used in another way (Duncker, 1945). Duncker
went on to design an experiment, involving a so-called insight problem, to conceptualize the
idea of functional fixedness; this experiment was called the “Candle Problem.”
The existence of functional fixedness and other detrimental effects seems to be almost
exclusively found in the so-called “insight problems.” Problems are, in this setting, usually
divided into two main categories: mechanical problems and insight problems. The “Candle
Problem” has been classified as an insight problem, which implies that is has certain
characteristics; one, prior experience is not considered to be a critical factor in solving the
problem. Two, restructuring of the problem is considered to be crucial in finding the solution
(Ohlsson, 1984). Restructuring means that the individual attempting to solve the problem has
to come to perceive the problem in a way that was not obvious upon initial consideration
(Sheerer, 1963), or put another way, the solution is not straightforward.
Mechanical problems are the other main category of problems, and are typically memory or
recall problems, probability matching tasks and clerical tasks (Camerer & Hogarth, 1999). A
low or no initial level of intrinsic motivation characterizes these problems and cognitive
ability is not considered crucial for solving them. The solution is often straightforward and the
process of reaching it usually demands skills like attention, keeping track of past trials and
persistence. Mechanical problems are also referred to as algorithmic or non-cognitive. In
these types of problems, the financial incentive appears to have the expected effect of
increasing performance through an increase in motivation and effort11
. Individuals are usually
11 But also here, as earlier mentioned, does there exist exceptions (Ariely, Gneezy, Loewenstein, &
Mazar, 2009).

17
assumed to have a higher level of intrinsic motivation for solving insight problems than for
mechanical problems (Pink, 2009).
An important topic in regards to conducting an experiment is randomization. Randomization
can be defined as “the assignment of experimental units to treatment by a random process
such that neither investigator nor patient knows the treatment to be assigned at the time the
patient is registered12
.”
This randomization process is critical to minimize confounding and selection bias.
Confounding occurs when the correlation between two events are due to the fact that both
events have a common cause. By randomizing the probability that some unknown variable
could influence the dependent and independent variable, the likelihood of confounding is
reduced. Selection bias can occur when the assignment of the participants follows a specific
pattern. For example, if the first half of the participants to show up were assigned to a certain
treatment while the second half of the participants were assigned to a different treatment, the
results could be influenced by the fact that the participants showing up first shared some
characteristic. If the participants had been randomly assigned to the treatment, the probability
of selection bias would have been reduced.
During this thesis’ run of the “Candle Problem,” the participants were randomly assigned to
the incentivized or non-incentivized group. The selection of which participants were to be in
either the incentivized or non-incentivized group was not done until the time of the
experiment, a procedure practice known as “allocation concealment.” Allocation concealment
and random selection was achieved through having the participants blindly pick a piece of
paper from a bowl just before they went into the room where the experiment was to be held.
12
http://www.biostat.umn.edu/~ph7420/2012/LECTURE%2003%202012.pptx

18
In the bowl, from which the papers were drawn, there were an identical amount of papers with
the numbers 1 or 2. A 1 indicated that the pair would be in the incentivized group, while a 2
indicated that they would be in the non-incentivized group.
A possible bias in an experimental setting consists of both observable and unobservable
variables. Through randomization, the bias becomes equally distributed across the different
treatments of the participants. The bias is therefore equally distributed between the different
treatment groups. The use of randomization makes it possible to use probability theory to
explain the results, and thus allows conclusions to be drawn on the effect of the treatment.
Another important aspect of the experiment is the different characteristics of a group vs. an
individual in a problem-solving situation. Extensive research has been done on the topic, and
the results seem to be quite clear; groups perform better than individuals in both insight and
mechanical problems (Smith, Bushouse, & Lord, 2010). Some of the benefits that have been
emphasized are the group members’ ability to help each other to break the individual’s locked
pattern of thought, the group’s superior memory capacity and the group members’ variety of
ideas and suggestions (Sage, 2010). There are researchers who argue that certain group
features can, at least in a brainstorming setting, inhibit creative efforts. These inhibiting
features include attention loss and social inhibitors (Mumford, Feldman, Hein, & Nagao,
2001).
Additional group characteristics have also been found to possibly influence the group’s
performance. Examples of such characteristics are the level of trust (Klimoski & Karol,
1976), the similarity of the personalities and the cultural diversity of the group members (
(Hoffman, 1959) and (Watson, Kumar, & Michaelsen, 1993)). The issues of trust,
personalities and cultural diversity are beyond the scope of this thesis and are therefore not
addressed further.

19
The problems discussed in this thesis are not physically demanding so that a group would not
benefit from its physical superiority.
2.3. Different versions of the “Candle Problem”
Central in this thesis is an experiment where the participants are asked to solve the “Candle
Problem,” this problem is classified as an insight problem. The “Candle Problem” has earlier
been used by several researchers ( (Fleck & Weisberg, 2004), (German & Defeyter, 2000),
(Gino & Ariely, 2012) and (Maddux & Galinsky, 2009)). It is worth noting that all
experiments referred to in this sub-chapter used both genders, as opposed to Glucksberg, who
only used male participants.
Maddux and Galinsky (2009) investigated if living abroad increases creativity. They found
that people who have spent time living abroad are more creative and argue, based on their
findings, that living abroad helps to broaden the mind and thus makes the individual more
able to find the correct albeit hidden solution to a problem. They base their conclusions there
among the results of the “Candle Problem,” that the time spent abroad played a significant
role in solving the problem more quickly.
German and Defeyter (2000) used the ”Candle Problem” to show that children aged 6 and 7
are significantly slower to use the box as a support for the candle to solve the problem when it
has been shown to have containment properties, than children at the age of 5. They thereby
suggest, that the children aged 5 are somewhat immune to the effects of functional fixedness,
showing no difference in solution times when the standard properties of the box containing
the tacks are shown. The results are interpreted to reveal that children develop intuitions on
the properties of objects based on past experience.

20
Fleck and Weisberg (2004) examined whether the use of verbal protocol, i.e. thinking “out
loud,” would help the participants in solving a range of insight problems. One group of the
participants was asked to say out loud everything they thought of as they attempted to solve a
number of insight problems, while the other group was not. The “Candle Problem” was one of
these insight problems. The participants were presented with the standard articles for solving
the problem (candle, a book of matches and a box of thumbtacks). They found no significant
difference in the solution times between the two groups of participants.
Gino and Ariely (2012) used the “Candle Problem” as part of their research to investigate
whether creative people are more dishonest than non-creative people. They conducted five
experiments in which the “Candle Problem” was part of the second experiment. The design of
the “Candle Problem” in this version gave participants a picture of the articles available
laying on a table next to a wall. The participants were then instructed to figure out, using only
the objects in the picture, how to attach the candle to the wall so that the candle burns
properly and does not drip wax on the table or floor. The time available to the participants
was 3 minutes. The results from the “Candle Problem” showed that the participants already
deemed as creative were more successful in solving the “Candle Problem.” The end result
from the study showed that, individuals who were deemed as creative were also found to
behave more dishonestly.
More uses of the “Candle Problem” can be found in the following papers: (Chrysikou, 2006),
(Galinsky & Moskowitz, 2000) and (Greene & Noice, 1999).

21
Other types of insight problems that have been used to study the effects of incentives on
insight problems includes: “The Nine-Dot problem13
” (Kershaw & Ohlsson, 2004), “Luchins’
Water-Jar Experiment14
” (McGraw & McCullers, 1979) and ”Packing Quarters15
” (Ariely,
Gneezy, Loewenstein, & Mazar, 2009).
13
The Nine-Dot problem consists of connecting nine dots on a piece of paper by drawing four straight
continuous lines that pass through each of the nine dots without lifting the pencil of the paper.
Kershaw and Ohlsson (2004) argue that the difficulty of many insight problems is due to a number
of factors and they conduct an experiment with the nine dot problem to investigate why this
problem is difficult.
14 McGraw and McCullers’ experiment included 10 problems regarding measuring a certain amount
water using three different sized jugs. These 10 problems were modeled after an experiment
conducted by Luchins (1942), hence the name. The first 9 problems required relatively complicated
three-jug solutions, while the 10th problem had a simpler two-jug solution. Rewards were given to
one group of participants while not to the other group. They found that the non-rewarded
participants performed better at problem 10. This superiority was also prevalent in problems 1-9,
but the difference was not significant.
15 Part of the study by Ariely et al. (2009) referred to earlier. The game of “Packing Quarters” involves
fitting nine metal pieces of quarter circles into a black wooden frame within a given time. To fit
eight pieces is not too difficult, but to fit the last piece, all the pieces have to be packed in a certain
way.

22
2.4. Summary
As mentioned, the true effects of the use of financial incentives are still not completely
understood, and the debate is ongoing. Some researchers ( (Ariely, Gneezy, Loewenstein, &
Mazar, 2009) & (Glucksberg, 1962)) have found that, at least under certain circumstances,
financial incentives can have detrimental effects on the performance in insight tasks. It seems
like the use of financial incentives can hinder individuals’ ability to think outside the box.
Several explanations for this reduction in performance have been suggested including
choking, over-optimal level of arousal, functional fixedness, narrowing of focus and increased
risk-taking. The effect of financial incentives in mechanical tasks is, in general, performance
enhancing, as suggested by the rational choice, agency and incentive theories.
As the standard of living in the western world continues to rise, it is a timely question to ask if
individuals, when their materialistic needs are fulfilled, still are motivated by the prospect of
receiving tangible rewards. As mentioned, some research does indicate that the use of rewards
such as increased responsibility, social recognition and verbal praise, have fewer of the
detrimental effects that have been observed by the use of financial rewards. Fewer negative
effects on these types of non-tangible rewards might suggest that the employees are concerned
by issues such as distribution of wealth, sustainability, personal development and realisation,
and non-material rewards.
On the topic of group performance vs. individual performance, there appears to be a strong
tendency that groups perform better in a wide range of tasks. This superior performance has
been attributed to the groups’ greater memory capacity, the wide range of ideas that group
members can provide and the triggering-of-memory that can occur when the plethora of ideas
are discussed.

23
As shown above, the “Candle Problem” has been used to investigate a number of hypotheses,
from the effect of having lived abroad on creativity, if creative individuals behave more
dishonest, the effects of thinking out loud while solving an insight problem, to the difference
in propensity of experiencing functional fixedness among different aged children. However, it
does not seem that the “Candle Problem” has been used to investigate the effect of financial
incentives in a group setting, or the difference in the effects of financial incentives in a group
vs. in an individual.
The results attained by Glucksberg are quite contradictory to a lot of traditional economic
theories, however, the lack of published replications and variations of Glucksberg’s results
make the strength, applicability and commonness of his results unknown.

24
3. The Experiment
This section contains the recruitment process, the design and the procedure of the experiment.
The experiment was divided into two sessions. The term “group session” refers to the session
where pairs attempted to solve the ”Candle Problem,” while the term “individual session”
refers to the session where individual participants were asked to solve the same problem. The
group session was conducted on Thursday, April 26th
, 2012, and the individual session was
conducted on Thursday, June 7th
, 2012. Both sessions were conducted on the University of
Bergen campus.
For the group session, the aim was to have 60 participants—a total of 30 pairs—15 in the
incentivized group and 15 in the non-incentivized group. Due to a mistake, 16 pairs were
assigned to the incentivized group and 14 to the non-incentivized group. For the individual
session, the aim was to have 30 participants, 15 in the incentivized group and 15 in the non-
incentivized group. In the end, 27 individuals participated, 13 in the incentivized group and 14
in the non-incentivized group.
3.1. Recruitment process
The group session
The participants for the group session were recruited either through an invitational e-mail or
through posters put up on the campus of the University of Bergen. At first, approximately 220
individuals received an e-mail (see appendix A1). The e-mail invited the recipient to
participate in an experiment, and informed him/her that the experiment would last
approximately 20 minutes and that he/she would receive NOK 100 for participating. To sign

25
up, the participants had to follow a link in the invitation email to the Expmotor16
web page,
where they could sign up by filling in their name, e-mail address, phone number and desired
time of participation.
The individuals who were invited first had, at an earlier point in time, indicated their interest
in participation in economic experiments. The first round of invitations garnered a total of 14
participants (a feedback rate of 6.3%). The invitation was then sent out to all students in the
Department of Economics and to students taking the following three courses: General
Psychology 1 (PSYK101), Methods in the Social Sciences (MET102) and Organizational
Theory (AORG101). In addition, posters were put up around the university area. In total,
approximately 700 people received the second round of invitations, which resulted in 44
additional participants (6.3% of the total individuals invited). On the day of the group session
a total of 58 participants had registered. Additional participants (2) were recruited on campus
during the session. An explanation for the relatively low number of respondents could be that
the time of the group session was fairly close to the exam period.
On the day of the group session, the participants in the morning period (9 a.m. – 11:40 a.m.)
received an SMS at approximately 8 a.m. reminding them of their participation. The
participants in the afternoon period (12:20 p.m. – 14:40 p.m.) received the reminder SMS at
approximately 12 p.m.
16
Developed by Thomas Halvorsen and Erik Sørensen at The Norwegian School of Economics (NHH)
in Bergen.

26
The individual session
The recruitment process for the individual session was, in general, the same as for the group
session. One difference was that the invitations were sent out earlier (9 days in advance) than
for the group session (the first invitations were sent out 4 days in advance). The invitations
were sent earlier because experience showed that more time could cause additional
individuals to sign up. The invitations were identical, except for the logical changes in time,
date and location. Due to the fact the most students had already finished their exams and were
thus deemed to be unlikely to participate, the invitations were only sent out to students still
attending classes. This included 401 first year law (JUSS 111) and 123 first year biology
students (BIO 101).
At the time of the individual session, 29 participants were registered (5.15 % of the total
individuals invited). Due to maintenance, the rooms booked for the individual session were
unavailable (this discovery was made in the afternoon the day before, and the session had to
be moved to another floor). The participants were made aware of this change in the reminder
of participation SMS they received on the morning (approx. 8 a.m.) on the day of the
individual session. 6 of the registered participants failed to show up; 4 were replaced with
random students during the session.
3.2. Design
Two rooms were booked to for the group session, making it possible to have two pairs
conducting the experiment simultaneously. For the individual session, four rooms were
booked, making it possible to have four participants conducting the experiment
simultaneously. It was a goal to conduct the experiment in as short amount of time as

27
possible, to minimize the chance that the participants would know the setup or the solution of
the problem. The group session was conducted over the course of 5,5 hours and the individual
session over the course of 3 hours.
Figure 3a below shows the setup of the experiment. A corkboard was attached to the wall.
Attached to the corkboard was a white A4 sheet of paper. The sheet of paper represented the
“wall” during the experiment and was attached approximately 15 cm up from the surface of
the table. The corkboard was attached to the wall with tack-it, and the sheet of paper was
attached to the corkboard with tack-it as well. Two chairs for the participants were placed on
either side of the table.
The participants were also provided with a candle (height approx. 9 cm, diameter 2 cm), a box
of matches (length 5.8 cm, width 3.5 cm and height 1.8 cm), and a box (length 5.8 cm, width
3.3 cm and height 1.6 cm) containing approximately 40 tacks (see figure 3b below). The
candle, box of matches and box containing the tacks were covered with a cloth until the
experiment started. Outside the rooms where the experiment was taking place, a waiting area
was set up. The set up for the individual session was as identical as possible, with the
exception that the second chair by the table was removed. The experiment leader was seated
approx. 3 meters diagonally away from the table, as out of sight as possible.

28
Figure 3 - Setup of the experiment
Figure 3a. Setup of the experiment. Figure 3b. Articles available to the participants.
(During the individual session one chair was removed).
3.3. Procedure
In the group session, the participants were assigned to random pairs, if possible, with someone
they did not know. In the waiting area, one participant from each pair was instructed to pick a
number from a bowl; this number could either have the value of 1 or 2. A 1 indicated that the
pair would be in the incentivized group, while a 2 indicated that they would be in the non-
incentivized group. In the morning period of the group session, 16 pieces of paper were put in
the bowl (8 numbered “1” and 8 numbered “2”). For the afternoon period, 16 new pieces of
paper were put into the bowl (8 numbered “1” and 8 numbered “2”). For the individual
session, 30 pieces of paper (15 numbered ‘1” and 15 numbered “2”) were put in the bowl at
the start of the session.
The pair was, after drawing a number, sent randomly to one of the two rooms. After entering
the room, the participants were instructed to sit down at each side of the table. The
participants then handed the experiment leader the piece of paper with the number on, and in
return received the first set of instructions outlining the experiment. The specific instruction
was dependent on the number they had drawn earlier.

29
In the individual session, the participants picked a piece of paper with a number as they
arrived and immediately entered an available room and followed the same procedure. The
numbers on the piece of paper were the same and had the same significance as in the group
session. The first set of instructions for the incentivized group in the group session is
presented in figure 4 (for the original Norwegian version see appendix A1):
Figure 4 - First set of instructions
The instructions for the non-incentivized group were identical, except that the first paragraph
(“Depending on how…”) was omitted, thereby just asking the participants in the non-
incentivized group to cooperate to solve the problem in as little time possible (for the original
Norwegian version, see appendix A1).
Welcome to the experiment.
Depending on how quickly you solve the coming problem you each have the opportunity to
win NOK 1000 or NOK 200. The participants in the pair solving the problem the quickest will
each receive NOK 1000, while the participants in the pairs solving the problem second and
third quickest will each receive NOK 200.
You will cooperate in solving the problem, only the articles under the cloth may be used. The
time will be measured.
You have 15 minutes available to solve the problem.
Any questions you have must be raised before the experiments starts.
Please indicate to the experiment leader when the aforementioned instructions are
understood.

30
For a student, the possibility of winning NOK 1000 was deemed as a tempting prize. The
prize amount is also roughly equivalent to the amount offered by Glucksberg ($5/$20 in 1960
equals NOK224/NOK896 in 201217
).
After the participants indicated that the instructions were understood, they handed them back
to the experiment leader. Then, all participants in both sessions received an identical task
description, and at the same time, the articles were uncovered and the time started.
The task description is presented in figure 5 (for the original Norwegian version see appendix
A1).
Figure 5 - Task description
The instructions to the participants in the individual session were as identical as possible, with
the logical changes made to adjust the instructions from plural to singular (for the original
Norwegian version see appendix A1).
The time would stop either when the problem was solved in accordance with the instructions
given, or when the time limit was reached (15 minutes).
17
Adjusted for inflation; $5 (1962) = $38.41 (2012), $20 (1962) = $153.65 (2012)
Average of monthly exchange rate April (5.7481) and May 2012 (5.9104) = 5.8293
$38.41 = NOK 223.9 and $153.65 = NOK 895.67.
Tasks: Attach the candle to the wall, defined by the A4 sheet of paper, so that the candle
can burn properly and that no wax will drip on the table or on the floor when the candle is
lit. The candle cannot be in contact with the table.

31
After the participants had solved the problem, they would leave the room and go to the
waiting area where they would receive NOK 100 for participating. The participants were also
asked not to discuss the experiment before 3 p.m. in the group session and 12:30 p.m. in the
individual session.
The articles (sheet of paper, matches, candle, tacks or boxes) that had any markings on them
from previous use were replaced and the articles covered, and the experiment was then ready
to be repeated. In both experiments, four participants were scheduled to arrive every 20
minutes.
In the group session, one extra participant was booked for the first two periods in the morning
(9 a.m. and 9:20 a.m.) and the first two periods in the afternoon (12:20 p.m. and 12:40 p.m.).
In case all five participants showed up, the last participant to arrive would receive NOK 100
for showing up and then asked to participate later (if so, the participant would again receive
NOK 100). All four participants that were overbooked showed up to the experiment, two
agreed to come back later and two received the money for showing up without any later
participation. In the individual session, no over-booking was done.
After the entire experiment was completed, the participants who were to receive money were
contacted by e-mail and given the option of either providing their bank details for wireless
transfer of the prize, or receiving the prize in person. All participants in both sessions who
were to receive a price opted to have the money transferred online.

32
4. Results
This chapter will present the results from the experiment and the analysis done with the data.
All of the analysis was done with the STATA software version 11.2. The results are presented
in the following way; first there will be a subchapter containing the descriptive analysis,
including a Box-and-Whisker plot. Then, there will be a subchapter with the statistical
analysis consisting of a Mann-Whitney test and two regression analyses. The data from the
experiment can be found in appendix A2.
To determine if any of the participants in either session had any prior experience with the
“Candle Problem” they were, after completing the task, asked if they were familiar with the
problem or the solution. This caused 1 pair from the incentivized group and 4 pairs from the
non-incentivized group in the group session to be eliminated from further analysis. In the
individual session, none of the participants answered that they had any prior knowledge of the
experiment. This left a total of 15 pairs in the incentivized group and 10 in the non-
incentivized group from the group session, and 13 participants in the incentivized group and
14 in the non-incentivized group from the individual session.
It is interesting to note that while none of the pairs in the group session failed to find a
solution to the “Candle Problem” within the provided time limit (15 min), 4 in the
incentivized and 4 in the non-incentivized group (7 female and 1 male) failed to find the
solution in the individual session. This result has been noted as ‘15.00” (see appendix A2).
The analysis with only the participants who managed to solve the problem has been labeled
“only successful participants.”
33
When the data was analyzed, it was found that within each session, there was no significant
difference between the incentivized and non-incentivized participants. However, between the
two sessions, there was a significant difference in the mean solution times. The participants
who attempted to solve the problem in pairs had a lower mean solution time than the
participants who attempted to solve the problem individually.
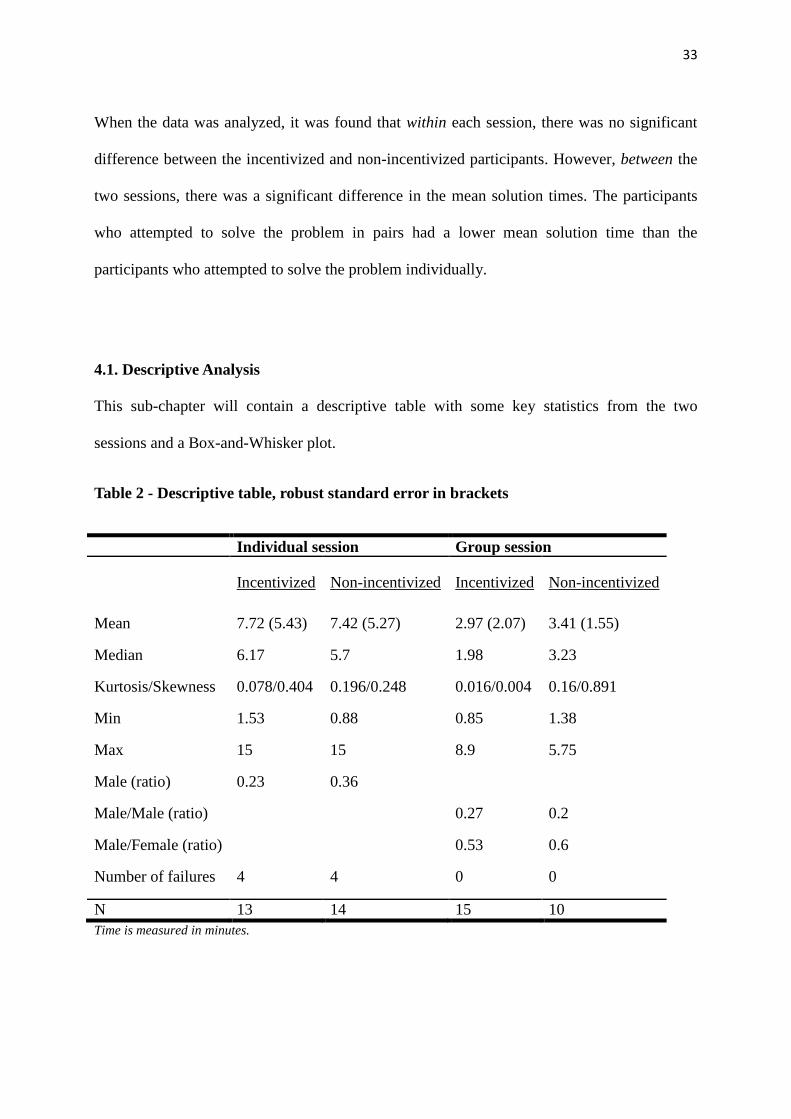
4.1. Descriptive Analysis
This sub-chapter will contain a descriptive table with some key statistics from the two
sessions and a Box-and-Whisker plot.
Table 2 - Descriptive table, robust standard error in brackets
Individual session Group session
Incentivized Non-incentivized Incentivized Non-incentivized
Mean 7.72 (5.43) 7.42 (5.27) 2.97 (2.07) 3.41 (1.55)
Median 6.17 5.7 1.98 3.23
Kurtosis/Skewness 0.078/0.404 0.196/0.248 0.016/0.004 0.16/0.891
Min 1.53 0.88 0.85 1.38
Max 15 15 8.9 5.75
Male (ratio) 0.23 0.36
Male/Male (ratio) 0.27 0.2
Male/Female (ratio) 0.53 0.6
Number of failures 4 4 0 0
N 13 14 15 10
Time is measured in minutes.

34
In the group session, the three quickest solution times were 0.85 min, 1.38 min and 1.38 min.
In the individual session, the three quickest solution times were 0.88 min, 1.53 min and 1.9
min.
Below is a graphical representation of the results from the experiment. The Box-and-Whisker
plot graphically visualize the difference in the solution times in the two sessions under both
the incentivized and the non-incentivized condition.
Figure 6 - Box-and-Whisker plot for the two sessions
The lower limit of the box is the 25th
percentile (Q1), the line within the box is the 50th
percentile (median) and the upper limit of the box is the 75th
percentile (Q3). The bottom
Tim
e in
min
.
0
5
10
15
Non-incentivized
Group Individual
Group
Individual
Incentivized

35
whisker is the lower quartile minus 1.5 times the interquartile rage, while the top whisker is
the upper quartile plus 1.5 times the interquartile range18
.
The mark above the top whisker in the incentivized group box is an outlier. The reason that
the boxes from the individual session appear not to have a top whisker is due to the fact that a
large enough proportion of the participants failed to find the solution to the problem within
the provided time limit, thus creating a cluster of data at the top specter of the figure.
4.2. Statistical Analysis
The statistical analysis includes a Mann-Whitney test and a regression analysis. The results
from the Mann-Whitney test will be presented first. The statistical analysis confirms what was
possible to deduct from the Box-and-Whisker plot displayed earlier; the difference within
each session was not significant while the difference between the sessions was significant.
Additionally, a t-test was conducted and the results can be viewed in appendix A3.
4.2.1 Mann-Whitney test
A Mann-Whitney is a non-parametric rank-sum test that does not require that the sample
belong to a normally distributed population. The kurtosis/skewness statistics presented in the
descriptive table indicate that the population from where the samples for the experiment were
drawn might not be normally distributed.
18 Interquartile range (IQR); a measure of dispersion, it is the difference between the upper (Q3) and
lower quartile (Q1) (Upton & Cook, 1996).
36
The Mann-Whitney test indicates that there are no significant differences between the
incentivized and the non-incentivized participants in either session. The z-value between the
incentivized and the non-incentivized participants within the group session is 0.916 and
within the individual session -0.098, neither which are a significant difference. Between the
two sessions, however, the z-value is -3.44, which is a significant difference at a significance
level of 1%.
4.2.2 Regression analysis
Two OLS-regressions were conducted for each session and between the two sessions. One in
which the dependent variable was Time and one in which the dependent variable was the
logarithm of Time labeled lnTime. The results can be viewed in the tables below.
The regressions were done to further explore any difference within each session, and to
investigate if a difference between the sessions could be determined. There is also one column
for only the successful participants in the individual session. The use of OLS implicitly
assumes that the independent variables are exogenous, have no multicollinearity and that the
error term has equal variance across the sample. The process of randomization and the nature
of the data should ensure that these assumptions are fulfilled.
The first regression is a straightforward OLS-regression with Time as the dependent variable
and dummy variables for gender, incentivized and the combination of male and incentivized
(for the group session is this combination male/male and incentivized). This computes the size
and sign of the change in the dependent variable of a change from 0 to 1 in the independent
dummy variable. For the second regression, a new dependent variable was defined: lnTime,
which is the logarithm of the variable Time. This regression had the same independent dummy

37
variables as the first regression. This lnTime regression was conducted to investigate if the
relationship between the independent variables and the dependent variable could be non-
linear. The interpretation of the coefficients from the lnTime regression is normally: when
multiplied by 100, the percentage change in the dependent variable resulting from a one-
percentage change in the independent variable. As this case involves dummy variables, the
interpretation is somewhat different: the base of the natural logarithm, e, to the power of the
coefficient of the independent variable, minus 1, multiplied by 100, gives the percentage
change in the independent variable when the independent dummy variable changes from 0 to
1.

38
Table 3 - Regression analysis, dependent variable: Time, (standard errors in brackets)
Variable Group Individual Individual
(only successful
participants)
All participants
Incentive -0.536 (0.89) -1.1 (2.401) 0.585(1.29) -0.852 (1.27)
Male -5.006 (-2.91)** -0.372(1.39)
Male19
-3.918 (1.764)**
Male/Male -1.284 (1.70)
Female/Male 0.568 (1.00)
Male x
Incentivized
3.301 (4.51) -2.677 (2.24)
Male20
x
Incentivized
2.681 (2.457)
Male/Male x
Incentivized
0.83 (1.9)
Group -4.666 (1.09)***
Constant 3.33 (1.01) 9.21 (1.74) 4.574 (0.98) 8.38 (1.078)
0.111 0.123 0.17 0.312
N 25 27 19 52
***, **, * indicates a level of significance of respectively 1%, 5% and 10%.
19
In this instance, the male dummy is for both sessions, meaning there was either a male participant in
the individual session, or a male/male group configuration in the group session.
20 In this instance, the male dummy is for both sessions, meaning there was either a male participant in
the individual session, or a male/male group configuration in the group session.

39
Table 4 - Regression analysis, dependent variable: lnTime, (standard errors in brackets)
Variable Group Individual Individual
(only successful
participants)
All participants
Incentive -0.285 (0.276) -0.034 (0.381) 0.247 (0.36) -0.161 (0.228)
Male -0.52(0.462) 0.116 (0.389)
Male21
-0.549 (0.317)*
Male/Male -0.496 (0.523)
Female/Male 0.08 (0.31)
Male x
Incentivized
0.041 (0.715) -0.896 (0.628)
Male22
x
Incentivized
0.255 (0.441)
Male/Male x
Incentivized
0.414 (0.583)
Group -0.779 (0.197)***
Constant 1.169 (0.31) 1.911 (0.28) 1.274 (0.28) 1.957 (0.193)
0.108 0.082 0.147 0.285
N 25 27 19 52
***, **, * indicates a level of significance of respectively 1%, 5% and 10%.
The regression analysis showed that the financial incentive caused no difference in the mean
solution time between the incentivized and the non-incentivized participants in either session.
However, the dummy variable Male in the individual session was significant at a 5%
21 In this instance, the male dummy is for both sessions, meaning there was either a male participant in
the individual session, or a male/male group configuration in the group session.
22 In this instance, the male dummy is for both sessions, meaning there was either a male participant in
the individual session, or a male/male group configuration in the group session.

40
confidence level in the Time regression. Furthermore, the Male dummy when all the
participants were considered was significant at a 5% confidence level in the Time regression
and at a 10% confidence level in the lnTime regression. In addition, the Group dummy was
significant at a 1% confidence level in both regressions.

41
5. Discussion
This chapter contains a brief summary of the experiment, a more detailed discussion
regarding the results, as well as some possible explanations for the results and suggestions for
further research.
Two identical sessions of the “Candle Problem” have been conducted, the only difference
being that in one session individual participants attempted to solve the problem, while in the
other session, groups of participants attempted to solve the problem. The effects of the
financial incentives have been investigated and the results from the two sessions have been
compared.
From the data obtained from the experiment, there is no indication that the financial incentive
had any effect on the level of performance. There exists no significant difference between the
incentivized and the non-incentivized participants in the either of the two sessions. The data
suggest that the mean solution times in the group session are lower than the mean solution
times in the individual session.
On the basis of the data collected during the experiment, hypotheses one and two are rejected
and hypothesis three is not rejected, leading to the following three main conclusions to be
drawn; firstly, the use of financial incentives did not affect the mean solution times of
individuals in this version of the “Candle Problem.” Secondly, the use of financial incentives
did not affect the mean solution times of groups in this version of the “Candle Problem.”
Thirdly, participants working together in a group have a lower mean solution time than
individuals in this version of the “Candle Problem.” Rather than using financial incentives,
the results suggest that encouraging individuals to collaborate is a more effective way of
improving performance in this version of the “Candle Problem.”

42
In addition, the data indicates that on an individual level, the mean solution time for males is
lower than the solution time for females when all the participants in the individual session are
considered. When only the successful participants are considered, no significant difference
can be detected. The reason for this difference could be that 7 out of the 8 participants who
did not manage to solve the “Candle Problem” before the time ran out were females.
Furthermore, when all participants in both sessions are considered, the dummy variable Male
is significant in both regressions. This possible gender difference is a thought-provoking
indication and should both be considered as a possible factor in future designs of this
experiment, as well as a conceivable starting point for research regarding gender differences
in solving insight problems. The dummy variables Male*Incentivized and
Male/Male*Incentivized was not found to be significant. Neither when all participants in the
experiment were considered could any effect of “male and incentivized” be detected.
The results from the individual session do not match the results attained by Glucksberg. There
are, however, a number of differences between this version and Glucksberg’s which could
explain this difference. In this version of the experiment, both females and males participated,
whereas Glucksberg only had male participants. This gender difference is a potentially
significant factor, especially when considering that the significance of the Male dummy in
parts of the regression. The reason for having both genders participating was mostly of a
practical nature; by allowing both genders to participate, the recruitment process was expected
to be easier. Additionally, in the other versions of the “Candle Problem” referred to in this
thesis, participants of both genders were used. It was also not within the scope of this thesis to
investigate possible gender differences.

43
Two regressions analyses with only the male participants from both sessions were conducted,
with respectively Time and lnTime as the dependent variables, and “Incentive” and “Group”
as the independent dummy variables. None of the dummy variables were found to be
significant.
There were also some differences in the articles available to the participants; in this version
the participants were given a box of matches, compared to the participants in Glucksberg’s
experiment, who were given a book of matches. The reason for this difference is that the
books of matches are no longer available in Bergen. A sheet of A4 paper defined the “wall” in
this experiment, whereas in Glucksberg’s experiment, the wall was a 36*24 inch corrugated
paper board. The sheet of paper might have been perceived as flammable and this might have
caused some participants not to opt for attempting to attach the candle to the “wall” by
melting wax. Some participants did ask if they could use the sheet of paper in their solution;
they were told that this was not an option. The reason for this “wall” modification was to
ensure that the “wall” could be replaced easily so that no marking of prior participants would
be visible. In addition, the use of plain paper was the more cost-effective option.
The instructions to the participants in this recent experiment also differed from the ones used
by Glucksberg. Glucksberg’s instructions to the non-incentivized participants included a
paragraph stating; “We are doing pilot work on various problems in order to decide which
will be the best one to use in an experiment we plan to do later. We would like to obtain
norms on the time needed to solve.” For the incentivized participants, Glucksberg included a
paragraph saying: “Depending on how quickly you solve the problem you can win $5.00 or
$20.00. The 25% of the Ss (i.e. participants) in your group will win $5.00 each; the best will
receive $20.00. Time to solve will be the criterion used” (Glucksberg, 1962). Brackets added.
There are two main differences between Glucksberg’s instructions and the ones used in the

44
experiment for this thesis. First, Glucksberg’s instructions informed the non-incentivized
participants that they were part of a pilot study, and did not mention anything about a time
limit. Glucksberg’s reason for omitting information about the time limit was to make the
participants think it was the problem that was being tested and not the participants themselves.
Secondly, the instructions to the incentivized participants said that the top 25% will be
rewarded; the instructions did not specify how many people this would include.
The fact that the instructions to the non-incentivized participants do not mention anything
about the time available to solve the problem has an important implication; there is the
possibility that the competition aspect, as well as the financial incentive, influenced the
performance of the participants in the incentivized group in Glucksberg’s experiment. Some
of the explanation for the difference in the results between the two experiments could be due
to the competition aspect and not the financial incentive per se. It was a goal for the
experiment conducted in relation to this thesis to be able to isolate the effect of the financial
incentive from any possible effects of the competition aspect. Therefore, both the incentivized
and the non-incentivized participants in this recent version were informed that they had 15
minutes available to solve to problem.
There are also some general aspects of conducting an experiment that could have implications
on the results. The fact that the individuals knew that they were participants in an experiment
might have caused them to expect a non-conventional solution. The participants in this recent
experiment might have been more accustomed to partaking in experiments and thus, to a
larger degree than in Glucksberg’s case, could have anticipated this type of unconventional
solution.
Another possible explanation for the results is the selection process of the participants. As
outlined, the participants were mainly first year students. In addition, the invitations for the

45
group session were sent out to people who had earlier indicated interest in participating in
experiments. These particular individuals were from different fields of study and in different
years. At least 14 participants were from the latter group, so it is safe to assume that a certain
amount of the participants in the group session were not first year students. In addition, due to
some participants failing to show up to the experiment, random people were asked to partake,
this totaled 4 participants in the group session and 6 participants in the individual session
(these were not necessarily first year students either). Perhaps individuals who had been
studying for several years react differently to financial incentives, or the “Candle Problem”
itself, than first year students.
The real life applications of the results are rather limited. A real life work place is a lot more
complex and unpredictable than this experiment can account for. The types of tasks
employees face also differ both in their complexity, scale and scope. These differences make
it difficult to draw any relevant conclusions from the results in the experiment. It is, however,
important to note that through experiments and future research, it might be possible to identify
factors that have a determining effect on performance.
Suggestions for future research
On the basis of the results from the experiment, a natural continuation would be to replicate
the setup with a larger sample to see if the findings can be confirmed, and if any additional
conclusions can be made. Given the indications of a gender difference in the individual
session, it would be interesting to further examine if this difference could also be detected in a
group setting with all female and all male groups. It would also be interesting to have the
participants attempt a range of different insight problems to rule out any problem specific

46
properties. It could also be possible to compare individuals who have studied for several years
against first year students to see if there exist any differences.
A replication of Glucksberg’s experiment would also be useful to investigate if his findings
can be reproduced. This would include only male participants, altering the instructions and
replacing some of the articles.

47
6. Appendix
Appendix A1. Invitation and instructions
Invitation23
(Norwegian).
(Emnefeltet på e-posten: Invitasjon til å være med på økonomisk eksperiment.)
Du er invitert til å være med på gjennomføringen av et eksperiment som handler om
problemløsning.
Eksperimentet vil ta ca. 20 minutter og vil bli gjennomført torsdag 26. april i rom 105 og 106
i Lauritz Meltzers hus (SV-bygget) i Fosswinckelsgate 6.
Eksperimentet går ut på å løse et praktisk problem og ingen forkunnskaper er nødvendig. Alle
deltagerne vil motta kr 100 for oppmøte.
Vennligst gå inn på en av websidene under ved å klikke på linken og meld deg på et av
tidspunktene med ledig plass.
For å melde deg på formiddagssesjonen (kl. 09.00 – 11.20), vennligst bruk følgende
link: www…
For å melde deg på ettermiddagssesjonen (kl. 12.20 – 14.20), vennligst bruk følgende
link: www…
Eventuelle spørsmål kan rettes til [email protected] eller på tlf. 452 925 99
På forhånd tusen takk.
Vennlig hilsen
Joachim Ramm
23
These are the instructions sent out to the potential participants for the group session. The
invitation for the individual session was identical with the exception of the time and date.

48
Invitation (English translation).
(Subject: Invitation to participate in economic experiment)
You have been invited to participate in an experiment involving problem solving.
The experiment will last approximately 20 minutes and will be conducted Thursday 26. April,
in room 105 and 106 in Laurtiz Meltzers house (SV-building) in Fosswinckelsgate 6.
The experiment involves solving a practical problem and no prior knowledge is required. All
participants will receive NOK 100 for attendance.
Sign up on one of the available times by following the links to the website under:
To participate in the morning session (09.00 – 11.20), please use the following link:
www…
To participant in the afternoon session (12.20 – 14.20), please use the following link:
www…
Any questions can be directed to [email protected] or phone number: 452 925
99.
Thank you in advance.
Kind regards
Joachim Ramm

49
Instructions, the incentivized group, group session (for English version see chapter 3).
Velkommen til eksperimentet.
Avhengig av hvor hurtig dere løser det kommende problemet vil dere hver ha muligheten til å
vinne kr 1000 eller kr 200. Deltagerne i paret som løser problemet hurtigst vil motta kr 1000
hver, men deltagerne i de parene som løser problemet nest og tredje hurtigst vil motta kr 200
hver.
Dere skal nå i samarbeid forsøke å løse problemet, kun artiklene under duken kan benyttes.
Tiden vil bli målt.
Der har 15 minutter tilgjengelig for å løse problemet.
Eventuelle spørsmål må tas opp før eksperimentet starter.
Vennligst indiker til eksperimentleder når de overnevnte instruksjonene er forstått.
Instructions, the non-incentivized group, group session (for English version see chapter 3).
Velkommen til eksperimentet.
Dere skal nå i samarbeid forsøke å løse et problem, kun artiklene under duken kan benyttes.
Tiden vil bli målt.
Der har 15 minutter tilgjengelig for å løse problemet.
Eventuelle spørsmål må tas opp før eksperimentet starter.
Vennligst indiker til eksperimentleder når de overnevnte instruksjonene er forstått.

50
Task description (for English version see chapter 3).
Oppgave: Fest lyset til veggen, definer av A4-arket, slik at lyset kan brenne skikkelig, og ikke
noe stearin vil dryppe på bordet eller gulvet når lyset er tent. Lyset skal ikke være i kontakt
med bordet.
Instructions, the incentivized group, individual session (for English version see chapter 3).
Velkommen til eksperimentet.
Avhengig av hvor hurtig du løser det kommende problemet vil du ha muligheten til å vinne kr
1000 eller kr 200. Deltageren som løser problemet hurtigst vil motta kr 1000, mens deltagerne
som løser problemet nest og tredje hurtigst vil motta kr 200 hver.
Kun artiklene under duken kan benyttes. Tiden vil bli målt.
Du har 15 minutter tilgjengelig for å løse problemet.
Eventuelle spørsmål må tas opp før eksperimentet starter.
Vennligst indiker til eksperimentleder når de overnevnte instruksjonene er forstått.
Instructions, the non-incentivized, individual session (for English version see chapter 3).
Velkommen til eksperimentet.
Du skal nå forsøke å løse et problem, kun artiklene under duken kan benyttes. Tiden vil bli
målt.
Du har 15 minutter tilgjengelig for å løse problemet.
Eventuelle spørsmål må tas opp før eksperimentet starter.
Vennligst indiker til eksperimentleder når de overnevnte instruksjonene er forstått.

51
Appendix A2. Data from the experiment
Observation Time Group Incentive Male Male/Male Female/Male
1 1.5 1 1 - 1 0
2 1.47 1 0 - 1 0
3 1.8 1 1 - 1 0
4 2.62 1 0 - 1 0
5 3 1 1 - 1 0
6 3.05 1 1 - 1 0
7 0.85 1 1 - 0 1
8 1.38 1 0 - 0 1
9 1.38 1 1 - 0 1
10 1.6 1 1 - 0 1
11 1.98 1 1 - 0 1
12 2.68 1 0 - 0 1
13 3.27 1 1 - 0 1
14 3.78 1 0 - 0 1
15 4.01 1 1 - 0 1
16 4.37 1 0 - 0 1
17 4.88 1 0 - 0 1
18 5.4 1 1 - 0 1
19 5.75 1 0 - 0 1
20 8.9 1 1 - 0 1
21 1.6 1 1 - 0 0
22 1.98 1 1 - 0 0
23 2.17 1 0 - 0 0
24 4.27 1 1 - 0 0
25 5.01 1 0 - 0 0

52
26 1.53 0 1 0 - -
27 1.9 0 1 1 - -
28 2.32 0 1 1 - -
29 3.42 0 1 0 - -
30 3.97 0 1 0 - -
31 5.37 0 1 0 - -
32 6.17 0 1 0 - -
33 7.48 0 1 0 - -
34 8.17 0 1 0 - -
35 15 0 1 0 - -
36 15 0 1 1 - -
37 15 0 1 0 - -
38 15 0 1 0 - -
39 0.88 0 0 0 - -
40 2.45 0 0 0 - -
41 2.82 0 0 1 - -
42 3.07 0 0 1 - -
43 3.72 0 0 1 - -
44 5.52 0 0 1 - -
45 5.52 0 0 0 - -
46 5.88 0 0 1 - -
47 6.75 0 0 0 - -
48 7.27 0 0 0 - -
49 15 0 0 0 - -
50 15 0 0 0 - -
51 15 0 0 0 - -
52 15 0 0 0 - -

53
Appendix A3. Results from the unpaired two-sample t-test with equal variances
***, **, * indicates a significance level of respectively 1%, 5% and 10%
Co
mp
aris
on
of
the
two
se
ssio
n, t
-va
lue
(p-v
alu
e
in b
rack
ets
)
-3.9
8 *
**
(0.0
00)
-2.1
**
(0.0
42)
Co
mp
aris
on
of
the
two
le
vels
of
trea
tmen
t, t
-
valu
e (p
-val
ue
in b
rack
ets
)
-0.5
69 (
0.5
75)
0.1
45 (
0.8
86)
Std
. Err
or
(min
)
0.5
3
0.4
9
1.4
1
1.5
1
0.3
7
1.0
01
0.3
7
0.5
05
Mea
n t
ime
(min
)
2.9
7
3.4
1
7.7
2
7.4
2
3.1
5
7.5
6
3.1
5
4.4
3
Nu
mb
er o
f o
bse
rvat
ion
s
15
10
13
14
25
27
25
19
Trea
tmen
t
Ince
nti
viz
ed
Non-i
nce
nti
viz
ed
Fro
m s
essi
on o
ne
Fro
m s
essi
on t
wo
Fro
m s
essi
on o
ne
Fro
m s
essi
on t
wo
Sess
ion
Gro
up
sess
ion
Ind
ivid
ual
se
ssio
n
Co
mp
aris
on
o
f th
e tw
o
sess
ion
s (a
ll
par
tici
pan
ts)
Co
mp
aris
on
of
the
two
se
ssio
ns
(on
ly
“su
cces
sfu
l”
par
tici
pan
ts)

54
Appendix A4. Budget
Session 1 (26. April)
Over booking 4*100 400
Attendance fee 60*100 6000
2nd
& 3rd
place 4*200 800
1st place 2*1000 2000
Materials 485
Session 2 (7. June)
Attendance fee 27*100 2700
2nd
& 3rd
place 2*200 400
1st place 1*1000 1000
Materials 406
Total 14191
All denominations are in NOK.

55
References
Amabile, T. M. (1985). Motivation and Creativity: Effects of Motivational Orientation on
Creative Writers. Journal of Personality and Social Psychology, 393-399.
Ariely, D., Gneezy, U., Loewenstein, G., & Mazar, N. (2009). Large Stakes and Big Mistakes.
Review of Economic Studies, 451-469.
Awasthi, V., & Pratt, J. (1990). The Effects of Monetary Incentives on Effort and Decision
Performance: The Role of Cognitive Characteristics. The Accouting Review, 797 -
811.
Camerer, C. F., & Hogarth, R. M. (1999). The Effects of Financial Incentives in Experiments:
A Review and Capital-Labor-Prodution Framework. Journal of Risk and Uncertainty,
7-42.
Chrysikou, E. G. (2006). When shoes become hammers: Goal-derived categorization training
enhances problem-solving performance. Journal of Experimental Psychology:
Learning, Memory, and Cognition, 935 - 942.
Dandy, J., Brewer, N., & Tottman, R. (2001). Self-consciousness and performance
decrements within a sporting context. The Journal of social psychology, 150 - 152.
Deci, E. L. (1971). Effects of Externally Mediated Rewards on Intrinsic Motivation. Journal
of Personality and Social Psychology, 105 - 115.
Deci, E. L., Koestner, R., & Ryan, R. M. (1999). A Meta-Analytic Review of Experiments
Examining the Effects of Extrinsic Rewards on Intrinsic Motivation. Psycological
Bulletin, 627-668.

56
Duncker, K. (1945). On Problem Solving. Psychological Monograph, Whole No. 270.
Fleck, J. I., & Weisberg, R. W. (2004). The use of verbal protocol as data: An analysis of
insight in the candle problem. Memory & Cognition, 900 - 1006.
Frey, B. S., & Jegen, R. (2001). Motivation Crowding Theory. Journal of Economic Surveys,
589-611.
Galinsky, A. D., & Moskowitz, G. B. (2000). Counterfactuals as Behavioral Primes: Priming
the Situation Heuristic and Consideration of Alternatives. Journal of Experimental
Social Psychology, 284 - 409.
German, T. P., & Defeyter, M. A. (2000). Immunity to functional fixedness in young children.
Psychonomic Bulletin & Review, 707–712.
Gielen, A. C., Kerkhof, M. J., & van Ours, J. C. (2010). How performance related pay affects
productivity and employment. Journal of Population Economics, 291-301.
Gino, F., & Ariely, D. (2012). The dark side of creativity: original thinkers can be more
dishonest. Journal of Personality and Social Psychology, 445-459.
Glucksberg, S. (1962). The Influence of Strength of Drive on Functional Fixedness and
Perceptual Recognition. Journal of Experimental Psychology, 36-44.
Greene, T. R., & Noice, H. (1999). Influence of Positive Affect Upon Creative Thinking and
Problem Solving in Children. Psychological Reports, 895 - 898.
Hoffman, R. L. (1959). Homogeneity of member personality and its effect on group problem-
solving. The Journal of Abnormal Psychology, 27-32.

57
Kershaw, T. C., & Ohlsson, S. (2004). Multiple Causes of Difficulty in Insight: The Case of
the Nine-Dot Problem. Journal of Experimental Psychology: Learning, Memory, and
Cognition, 3-13.
Klimoski, R. J., & Karol, B. L. (1976). The impact of trust on creative problem solving
groups. Journal of Applied Psychology, 630-633.
Kruse, D. L., Blasi, J. R., & Freeman , R. B. (2012, January). Does Linking Worker Pay to
Firm Performance Help the Best Firms Do Even Better. NBER Working Paper No.
17745.
Larrick, R. P., Heath, C., & Wu, G. (2009). Goal-Induced Risk Taking in Negotiation and
Decision Making. Social Cognition, 342-364.
Luchins, A. S. (1942). Mechanization in problem solving: The effect of Einstellung.
Psychological Monographs, i - 92.
Maddux, W. W., & Galinsky, A. D. (2009). Cultural Borders and Mental Barriers: The
Relationship Between Living Abroad and Creativity. Journal of Personality and
Social Psychology, 1047-1061.
McGraw, K. O., & McCullers, J. C. (1979). Evidence of a detrimental effect of extrinsic
incentives on breaking a mental set. Journal of Experimental Social Psychology, 285-
294.
Mumford, M. D., Feldman, J. M., Hein, M. B., & Nagao, D. J. (2001). Tradeoffs Between
Ideas and Structure: Individual Versus Group Performance in Creative Problem
Solving. The Journal of Creative Behavior, 1-23.

58
Ohlsson, S. (1984). Restructuring revisited: Summary and critique of the Gestalt theory of
problem solving. Scandinavian Journal of Psychology, 65-78.
Ordóñez, L. D., Schweitzer, M. E., Galinsky, A. D., & Bazerman, M. H. (2009). Goals Gone
Wild: The Systematic Side Effects of Over- Prescribing Goal Setting. Working Paper:
Harvard Business School.
Pink, D. (2009). Drive: The Surprising Truth About What Motivates Us. New York:
Riverhead Books.
Prendergast, C. (1999). The Provision of Incentive in Firms. Journal of Economic Literature,
7-63.
Sage, C. (2010). Group and Individual Performance on a Creativity Task: The Constraining
Effects of Examples. McNair Scholars Journal, Article 7.
Samuelson, P. A. (1938). A Note on the Pure Theory of Consumer's Behavour. Economica,
61-71.
Sheerer, M. (1963). Problem-solving. Scientific American, 118-128.
Smith, C. M., Bushouse, E., & Lord, J. (2010). Individual and group performance on insight
problems: The effects of experimentally induced fixation. Group Processes Intergroup
Relations, 91-99.
Suvorov, A. (2003). Addiction to Rewards. The European Winter Meeting of Econometric
Society, (p. 47). Madrid.
Upton, G., & Cook, I. (1996). Understanding Statistics. Oxford University Press.

59
Watson, W. E., Kumar, K., & Michaelsen, L. K. (1993). Cultural diversity's impact on
interaction process and performance: Comparing homogeneous and diverse task
groups. Academy of Managment Journal, 590-602.
Yerkes, R. M., & Dodson, J. D. (1908). The relation of strength of stimulus to rapidity of
habit-formation. Journal of Comparative Neurology and Psychology, 459-482.