solvency ii 041007
TRANSCRIPT

1
34th Annual GIRO Convention
Solvency II – QIS 3 and Beyond
2-5 October 2007Celtic Manor, Newport, Wales
R A ShawGuy Carpenter
Topics
� QIS 2 and QIS 3 Headlines
� QIS 3 Overview
� Market Value Margins
� QIS 3 – SCR Formula
� QIS 3 –MCR Formula, Group Issues and Questionnaire
� Internal Models
� Some Thoughts

2
QIS 3 OverviewPrior and Current QIS Studies
� Key input for Impact Assessment – several foreseen
� QIS I – 10/05 – end 12/05:� Technical Provisions in Life and Non-life
� QIS 2 – 5/06 – 7/06:� Solvency Requirements – SCR Standard Formula and Internal Models� Parameters used in the MCR and SCR
� QIS 3 – 4/07 – 7/07:� Refinement of SCR Standard Formula� Capital Requirement at Group Level
� QIS 4 – 4/08 – 7/08:� Refinement of SCR Standard Formula and Other� Public Consultation process Jan to Feb 2008
� QIS 5 – ?:
CEOPS QIS 2 Report December 2006
QIS 2 and QIS 3 Headlines QIS 2 - Respondents
� 514 Companies from 23 countries took part in QIS 2� Compared to 312 from 19 countries for QIS 1
3
CEOPS QIS 2 Report December 2006
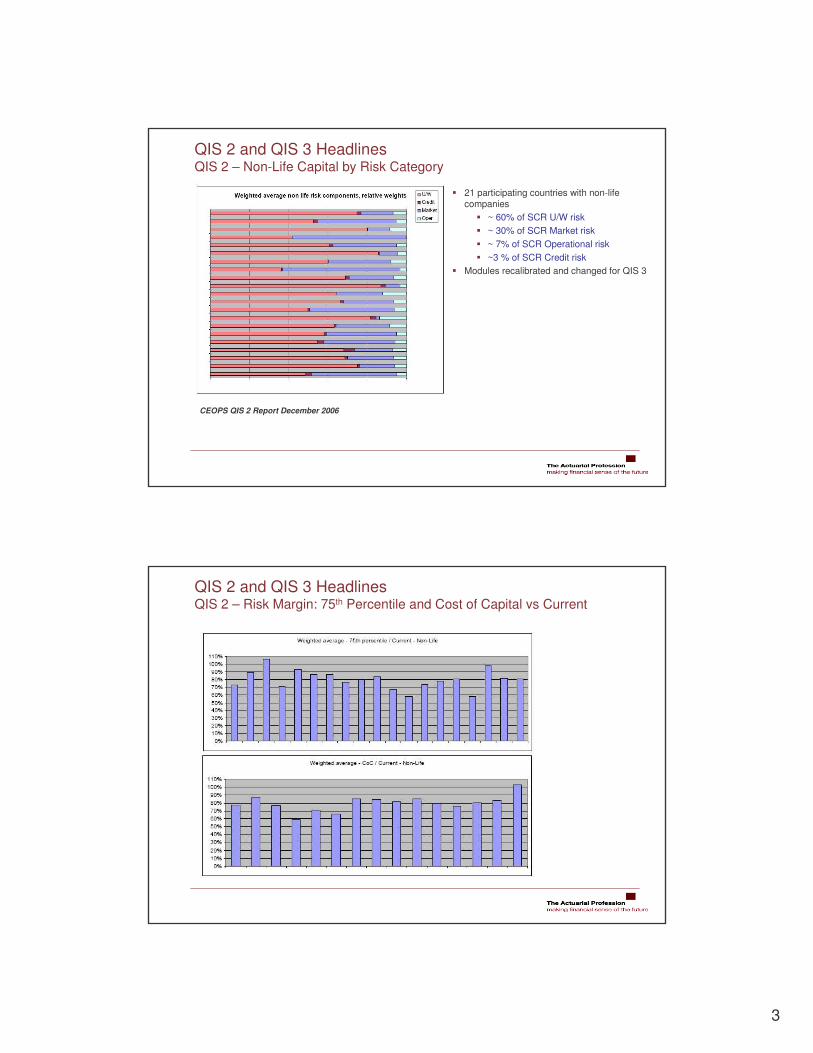
QIS 2 and QIS 3 Headlines QIS 2 – Non-Life Capital by Risk Category
� 21 participating countries with non-life companies
� ~ 60% of SCR U/W risk� ~ 30% of SCR Market risk� ~ 7% of SCR Operational risk� ~3 % of SCR Credit risk
� Modules recalibrated and changed for QIS 3
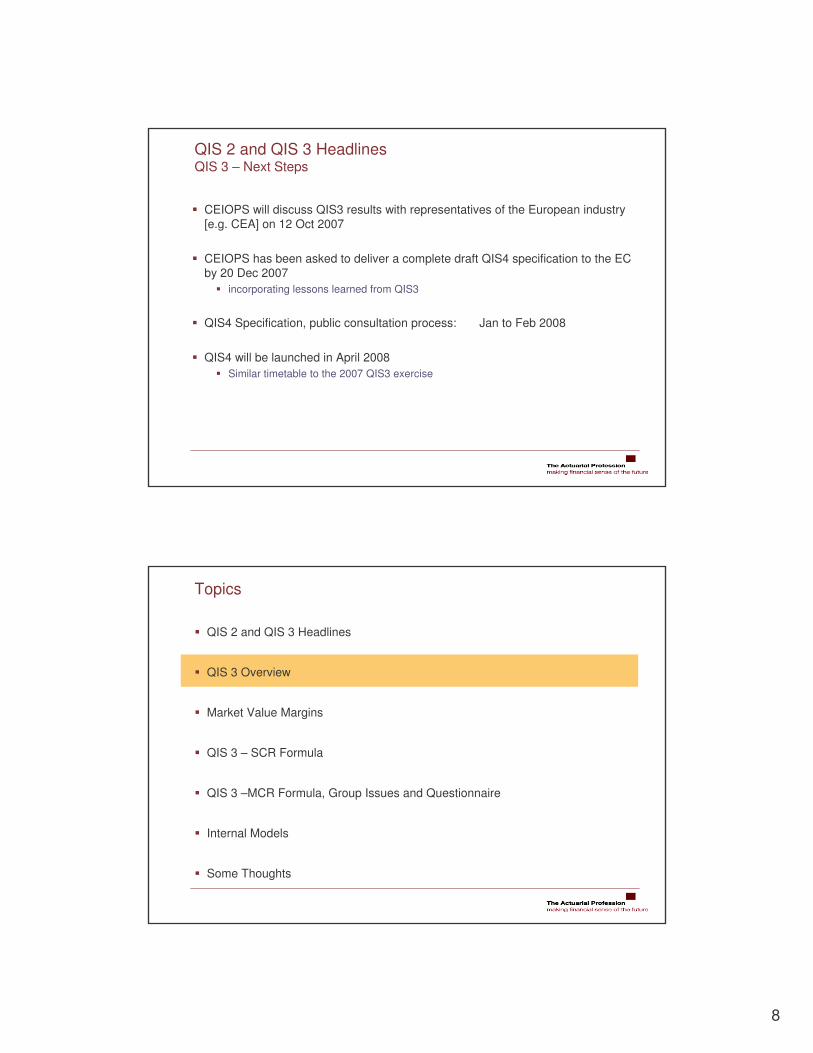
QIS 2 and QIS 3 Headlines QIS 2 – Risk Margin: 75th Percentile and Cost of Capital vs Current

4
QIS 2 and QIS 3 Headlines QIS 2 – Some Observations
� Overall – Non-Life� Technical provisions generally - decreases
� Capital requirement - increases
� Available Capital - increases
� Capital Availability / Capital Requirement Ratio – increases (For most respondents)
� Comparison of 75th percentile and Cost of Capital approaches� In most countries the differences were not significant
� A majority of participants in each country prefer the cost of capital provision� Simplicity and economic interpretation� Approximate methods made available that did not require stochastic modelling
� Cost of Capital – Most assumed that SRC / BE ratio remains constant during run-off� Market risk not included in these calculations by most participants
QIS 2 and QIS 3 Headlines QIS 2 – Some Observations
� SCR Capital Calibration � Some risk modules and correlations – too prudent
� e.g. Non-Life UW risk, Market risk and size factor
� Market risk correlations - too high� e.g. equities and property, equities and interest rates
� Non-Life UW risk market-wide volatility factors - too high � In particular for premium risk; size factor unsuitable for a number of mono-line players
� Non-Life UW Formulae� Profitability and pricing trends will increase measured volatility
� Reliability of historical combined ratios as an indicator of future loss� Does not allow for differences in non-proportional reinsurance programmes� Broad content with assumed correlations between lines of business
� Internal Models � Non-Life UW Risk – Internal Model capital < SCR placeholder capital
� Credit Risk – Internal Model capital > SCR placeholder capital

5
QIS 2 and QIS 3 Headlines QIS 3 – UK Respondents
� Total of 96 spreadsheets received � 46 from non-life firms� 39 from life firms� 11 from groups
� 70 completed questionnaires - many useful supplementary notes� More than 800 pages of qualitative comments covering all of the issues raised� Ad hoc email and verbal correspondence with firms over key technical and practical
aspects of the exercise
� Size of participating firms: � 41 large� 27 medium� 17 small
� Market coverage by annual premium� 74% for non-life� 66% for life
QIS 2 and QIS 3 Headlines QIS 3 – Overall Impact on Firms and Groups
� Calibration for QIS 3 still quite provisional
� Under QIS 3, most firms would see a reduction in their solvency ratios� Most well above 100%
� Some categories of firm observed a poor fit between QIS 3 SCR and Solvency I or ICAS – examples include:
� Annuity providers (risk margins)� Linked life business (cat lapse rate)� Friendly societies (realistic provisions)� Motor insurers (premium and reserve risk calibration)� Some niche operators (diversification and granularity of classes of business)

6
QIS 2 and QIS 3 Headlines QIS 3 – Summary of QIS 3 Output
� Non-life firms:� Underwriting risk is around 70% of SCR; Market risk a further 20%� As expected. � Balance of premium risk v reserve risk depends primarily on business mix
� Life firms:� Life underwriting risk had same weight as Market risk module� Expectations were that market risk should generally be greater. � Explanation may relate to a need to recalibrate parts of the underwriting risk module,
e.g. lapse cat risk
� Operational risk and Credit risk:� Lower under QIS 3 than using internal models, reflecting a wider scope of risk
measurement
� More sophisticated the model, the higher the risk charge
QIS 2 and QIS 3 Headlines QIS 3 – Summary of key perceived issues for UK firms
� Methodology / Calibration for Non-life underwriting risk
� Life:� Lapse Cat risk component for linked business� Annuity provisions – are these market consistent� Application of KC factor
� Design of MCR
� Use of Internal models
� Application of Solvency II to Groups
� Broad industry agreement that a single CoC measure at 6% was a poor fit, and that different values might be applied by class of business

7
QIS 2 and QIS 3 Headlines QIS 3 – Other issues for UK firms
� Many other useful issues raised about suitability, practicability and calibration:� Risk margin assessment� Operational risk� Non-life Cat risk� Scope of credit risk module� Classification of own funds
QIS 2 and QIS 3 Headlines QIS 3 – Use of Internal Models
� Many firms used internal model experience and output to inform both quantitative and qualitative responses to QIS3
� Has provided FSA with valuable benchmark data and views on the suitability and practicability of the standard formula SCR
� In practice, FSA expect that most medium or large solo UK firms and almost all Groups, will use at least a partial internal model
� High level standards to be met by firms are set out in the draft Directive. � FSA have carried out a parallel exercise looking at internal models v QIS3,
� Initial focus on a small number of Non-Life and Life firms
� In principle: SCR standard formula > internal model SCR � In practice: internal model SCR is considerably lower
� ~ 50% x standard formula, Non-Life and Life� Increased sophistication and granularity of internal models� Conservatism of the standard formula calibration� Internal models providing a better fit for certain types of firm (e.g. specialist writers)
8
QIS 2 and QIS 3 Headlines QIS 3 – Next Steps
� CEIOPS will discuss QIS3 results with representatives of the European industry [e.g. CEA] on 12 Oct 2007
� CEIOPS has been asked to deliver a complete draft QIS4 specification to the EC by 20 Dec 2007
� incorporating lessons learned from QIS3
� QIS4 Specification, public consultation process: Jan to Feb 2008
� QIS4 will be launched in April 2008� Similar timetable to the 2007 QIS3 exercise
Topics
� QIS 2 and QIS 3 Headlines
� QIS 3 Overview
� Market Value Margins
� QIS 3 – SCR Formula
� QIS 3 –MCR Formula, Group Issues and Questionnaire
� Internal Models
� Some Thoughts
9
QIS 3 Overview QIS 3 Goals
� Solvency Capital Requirement:Capital: MV Assets > MV Liabilities after 1 year with a 99.5% probability
� Calculation of capital requirement by means of the standard formula
� Practicality and suitability of the design of the standard formula.
� Suitability of calibration
� Potential impact on balance sheets
QIS 3 Technical Specification – Only Initial Proposals
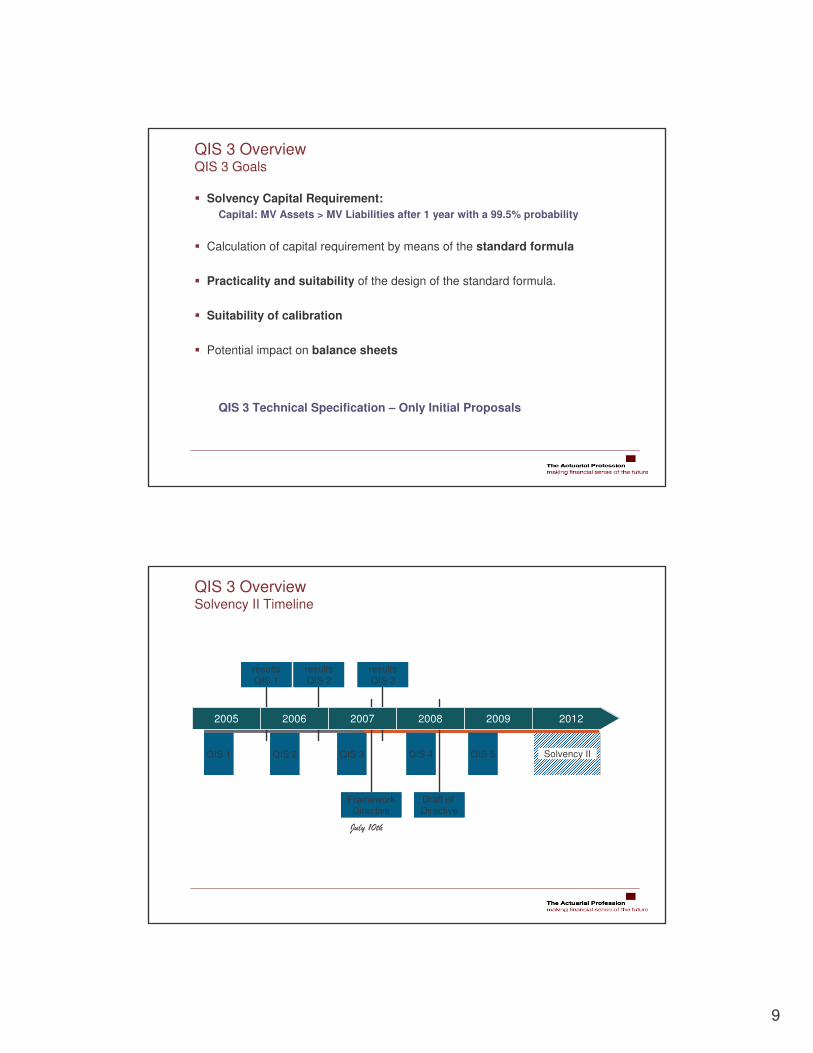
QIS 3 Overview Solvency II Timeline
QIS 1 QIS 2 QIS 3
2005 2006 2009 201220082007
resultsQIS 1
resultsQIS 2
resultsQIS 3
FrameworkDirective
Draft of Directive
QIS 4QIS 4 QIS 5QIS 5 Solvency II
���� ����
10
QIS 3 Overview The Three Pillars
Financial Resources Supervisory Review Disclosure
Economic Value based approach
Capital for 12-months
Capital includes all assets and liabilities
Capital - 99.5% VaR
Allow diversification and risk mitigation
Capital Add-Ons
Run-off sensitivity analysis over lifetime
IRCA
Evaluation Procedure
Public Disclosure of Key Information
SOLVENCY IIP
illar
I
Pill
ar I
I
Pill
ar I
II
�������������
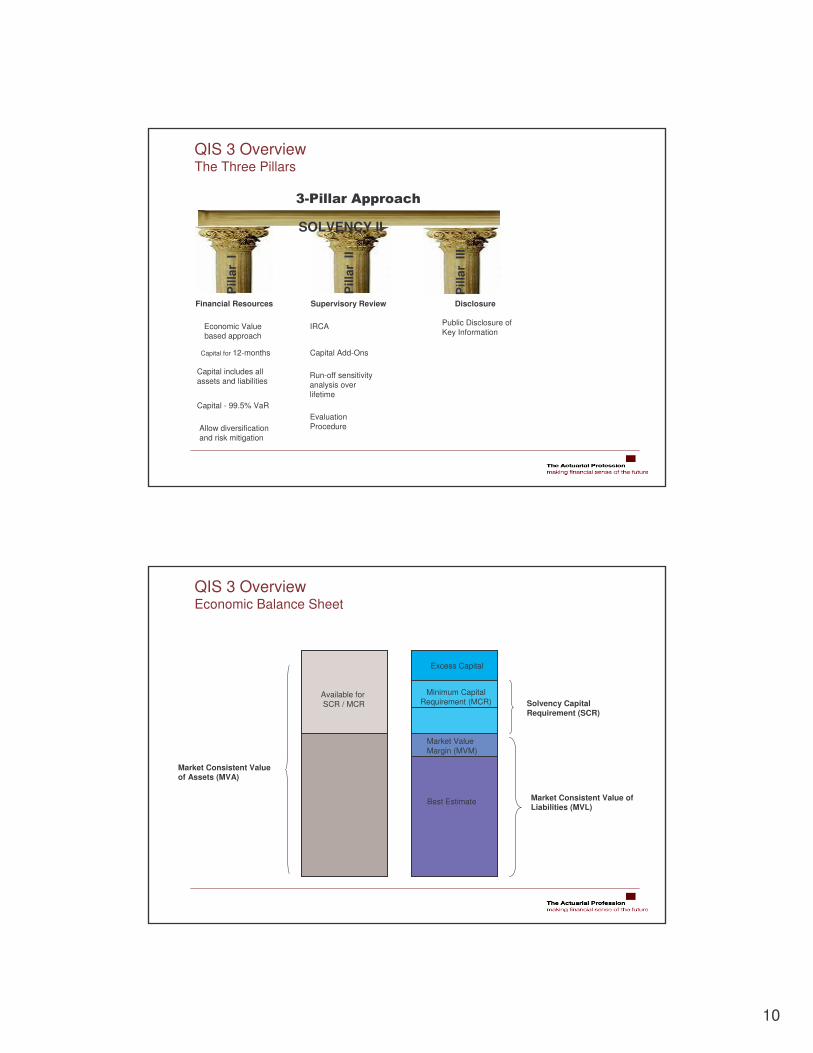
QIS 3 Overview Economic Balance Sheet
Available forSCR / MCR
Excess Capital
Market ValueMargin (MVM)
Best Estimate
Solvency Capital Requirement (SCR)
Market Consistent Value of Liabilities (MVL)
Market Consistent Value of Assets (MVA)
Minimum Capital Requirement (MCR)
11
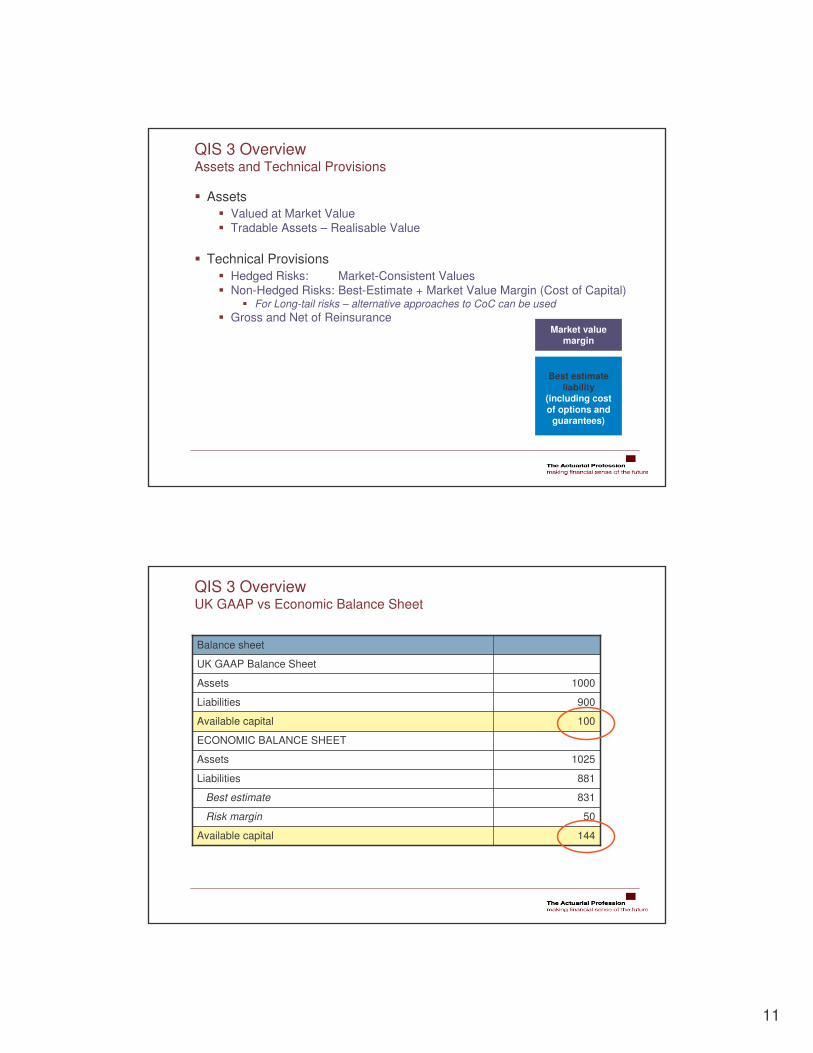
QIS 3 Overview Assets and Technical Provisions
� Assets� Valued at Market Value� Tradable Assets – Realisable Value
� Technical Provisions� Hedged Risks: Market-Consistent Values� Non-Hedged Risks: Best-Estimate + Market Value Margin (Cost of Capital)
� For Long-tail risks – alternative approaches to CoC can be used� Gross and Net of Reinsurance
Best estimate liability
(including cost of options and
guarantees)
Market value margin
QIS 3 Overview UK GAAP vs Economic Balance Sheet
144Available capital
50Risk margin
1025Assets
831Best estimate
881Liabilities
ECONOMIC BALANCE SHEET
100Available capital
900Liabilities
1000Assets
UK GAAP Balance Sheet
Balance sheet

12
QIS 3 Overview Technical Provisions: Best Estimate
� Technical Provisions comprise:� Claims Outstanding – Case reserves, IBNR and IBNER � Premium Provisions – UPR (including URR provision)
� Expected Present Value of Future Cashflows:� “ probability weighted averages of all future cash-flows (distributional outcomes) ”� At least 2 different methods should be applied� Gross and Net of Reinsurance
� Assumptions:� Realistic Actuarial Assumptions� Need to take account of risk factor probability distributions
� Discounting:� Risk-free discount rate - relevant liability duration� Expenses – expected value recognised in cashflows
� Reinsurance Default:� Assumes no reinsurer default� Assumes no own credit risk
� Accident and health� Workers’ compensation� Health� Others/default
� Motor, third party liability� Motor, other classes� Marine, aviation and transport� Fire and other damage of property� Third-party liability� Credit and suretyship
� Legal expenses� Assistance� Miscellaneous non-life insurance� Inwards reinsurance
� Prop. inwards reinsurance as above, � Non-prop. inwards reinsurance
� Property Business� Casualty Business� Marine, Aviation, Transport
QIS 3 Overview Non-Life Lines of Business

13
� Companies asked to classify their capital into three tiers� Capital is independent of accounting framework – market consistent valuation� QIS 3 Assumption: Contingent Capital (T3) not available to cover the MCR
QIS 3 Overview Eligible Capital
Tier1
Tier2
(Insurance) Tier3
Similar to Banking
Pendants Highest quality of
capital
Contingent capital
Provides a certain degree of loss
absorbency
Topics
� QIS 2 and QIS 3 Headlines
� QIS 3 Overview
� Market Value Margins
� QIS 3 – SCR Formula
� QIS 3 –MCR Formula, Group Issues and Questionnaire
� Internal Models
� Some Thoughts
14
1
2
3
1 2
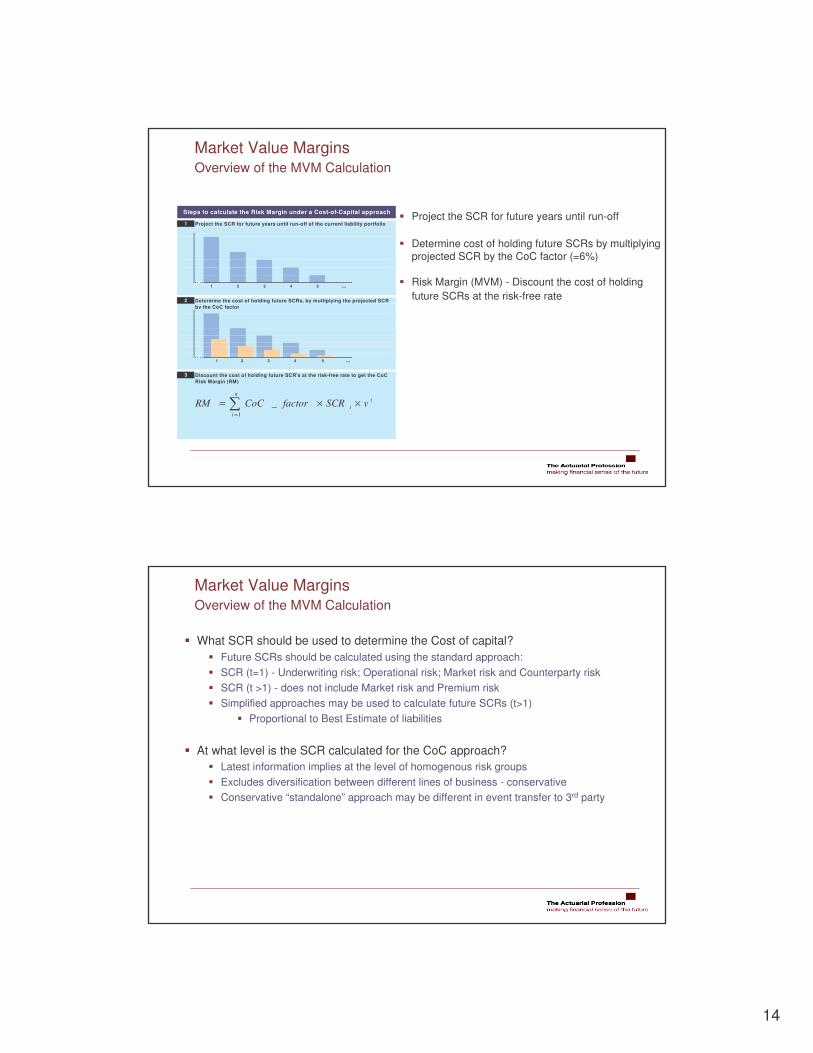
Discount the cost of holding future SCR's at the risk-free rate to get the CoC Risk Margin (RM)
3 4 5 ...
Steps to calculate the Risk Margin under a Cost-of-Capital approach
1 2 3 4 5 ...
Project the SCR for future years until run-off of the current liability portfolio
Determine the cost of holding future SCRs, by multiplying the projected SCR by the CoC factor
in
ii vSCRfactorCoCRM ××= �
=1
_
� Project the SCR for future years until run-off
� Determine cost of holding future SCRs by multiplying projected SCR by the CoC factor (=6%)
� Risk Margin (MVM) - Discount the cost of holding future SCRs at the risk-free rate
Market Value MarginsOverview of the MVM Calculation
Market Value MarginsOverview of the MVM Calculation
� What SCR should be used to determine the Cost of capital?� Future SCRs should be calculated using the standard approach:� SCR (t=1) - Underwriting risk; Operational risk; Market risk and Counterparty risk� SCR (t >1) - does not include Market risk and Premium risk� Simplified approaches may be used to calculate future SCRs (t>1)
� Proportional to Best Estimate of liabilities
� At what level is the SCR calculated for the CoC approach?� Latest information implies at the level of homogenous risk groups� Excludes diversification between different lines of business - conservative � Conservative “standalone” approach may be different in event transfer to 3rd party

15
Topics
� QIS 2 and QIS 3 Headlines
� QIS 3 Overview
� Market Value Margins
� QIS 3 – SCR Formula
� QIS 3 –MCR Formula, Group Issues and Questionnaire
� Internal Models
� Some Thoughts
adjustment for the risk -mitigating effect of future profit sharing=
Factors
Scenarios with simplified alternative
Scenarios
MarketNon Life HealthDefault
OperationalBSCR
SCR
Life
P&R Equity
Cat
FX
Lapse
Property
Spread
Int Rate
Expense
Disability
Mortality
Longevity
Cat
Concentation
Revision
QIS 3 – SCR FormulaOverview of the SCR Calculation

16
1000.50.25Non-Life
-10.250.250.25Health
--10.250.25Life
-
-
Health
--10.25Default
---1Market
Non-LifeLifeDefaultMarket
� Operational Risk Component removed from the diversification benefits� Diversification effects of Future Profit Sharing captured
QIS 3 – SCR FormulaSCR - Correlation Matrix
QIS 3 – SCR FormulaNon-Life Underwriting Risk
� Premium risk � Related to exposures earned next year
� Risk that incurred losses plus expenses are larger than the earned premium
� Reserve risk � Related to prior year’s business
� Risk that carried reserves are insufficient to cover future payments
� Catastrophe risk
� Segmentation by LOB
Premium & Reserve Risk Catastrophe
Correlation Non Life
Correlation LoB
Premium by LoB Reserve by LoB

17
QIS 3 – SCR FormulaNon-Life Underwriting Risk - Structure
� SCR is less responsive to UW Cycle� Removal of the Impact of expected profits / losses
� Capital Requirement (premium & reserve) = Volume Measure · Factor
� Factor, ρρρρ(σσσσ), ~ 3 * σσσσ� Factor of 3 based on the 99.5% ile of a Log-normal distribution
� σ = combined volatility factor
� σ = calculated by aggregating the volatility factors for the 15 classes of business for reserve risk and premium risk
� Using a 30 x 30 Correlation Matrix
� Volume Measure = Premium next year + Net Reserves
Structure Premium Reserve Catastrophe Aggregation
QIS 3 – SCR FormulaNon-Life Underwriting Risk - Premium
� Volatility factor is a function of � Market wide factor and
� Company specific factor
� Company factor contribution increases if more historical experience is available� Company specific factors calculated from variation in historical loss ratios
� Market wide factor = market-wide estimate of the volatility for premium risk � 10% - Motor, Property, General Liability
� 12.5% - Credit & Suretyship
� 20% - Inwards Reinsurance
Structure Premium Reserve Catastrophe Aggregation

18
QIS 3 – SCR FormulaNon-Life Underwriting Risk - Reserve
� Volatility factor = Market wide factor� Market wide factor = market-wide estimate of the std dev for reserve risk
� 10% - Property, Credit & Suretyship� 12.5% - Motor Third Party Liability� 15% - General Liability, Marine / Aviation / Transport� 20% - Inwards Reinsurance
Structure Premium Reserve Catastrophe Aggregation
QIS 3 – SCR FormulaNon-Life Underwriting Risk – Premium and Reserve
� Table shows the impact of the different factors used in QIS 2 and QIS 3� Factors are expressed as a percentage of the premium volume
� The QIS3 factors have decreased….but LOB correlations have increased � Large Companies - Similar requirements� SME – Benefited the most – removal of size factors
Structure Premium Reserve Catastrophe Aggregation
QIS 3QIS 2 QIS 3QIS 2 QIS 3QIS 2
76%
51%
51%
Mono line - 1 LOB only
110%
44%
44%
Multi line - 5 LOBs
56%40%37%84%Small (€50m)
56%40%37%46%Medium sized (€500m)
56%40%37%35%Large (€1000m)
Multi line - 10 LOBsCompany

19
QIS 3 – SCR FormulaNon-Life Underwriting Risk - Catastrophe
� CEIOPS has defined Regional and Trans-regional CAT scenarios� For each scenario i, companies asked to assess impact on NAV Cati
� Either using scenario-based or� Market-Loss approach
� Non-Life CAT risk charge is determined as
NLCat = √ � CATi,� Sum over all catastrophes > 25% of the Cost of most severe scenario.
Structure Premium Reserve Catastrophe Aggregation
� Combined (Premium and Reserve) charge aggregated with Catastrophe Risk� Assuming independence (see correlation matrix below)
Structure Premium Reserve Catastrophe Aggregation
10Catastrophe
01Premium + Reserve
CatastrophePremium + Reserve
QIS 3 – SCR FormulaNon-Life Underwriting Risk - Aggregation
20
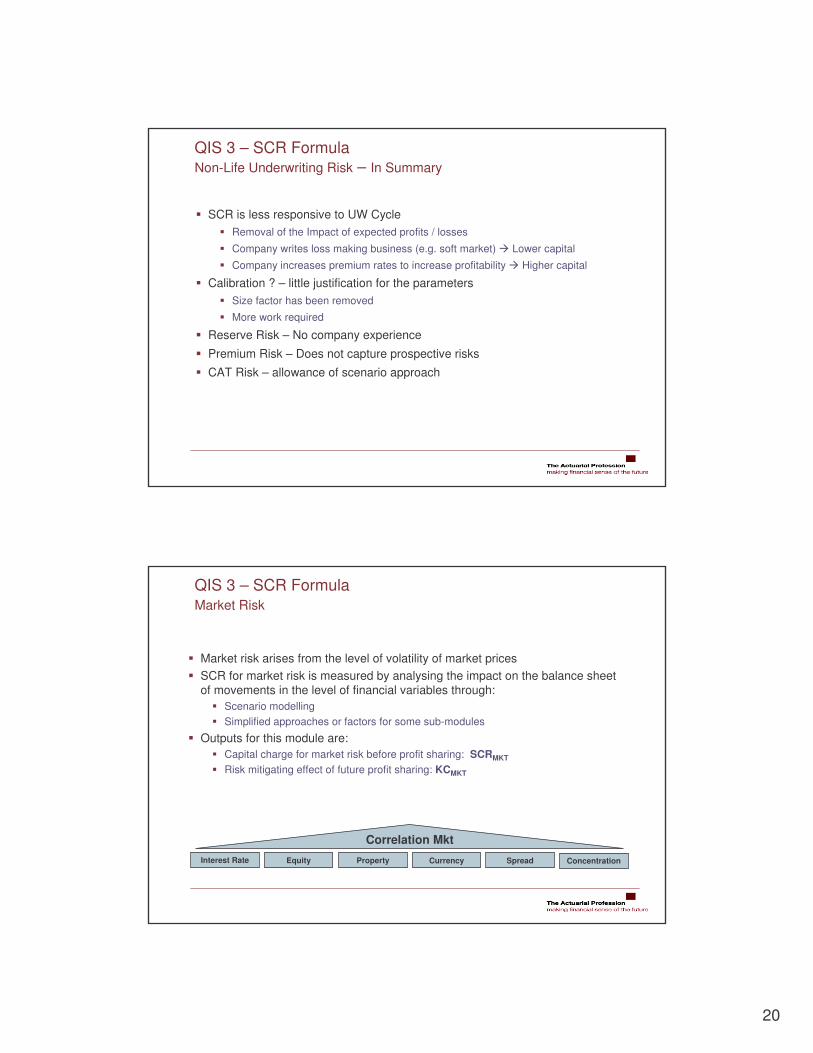
QIS 3 – SCR FormulaNon-Life Underwriting Risk – In Summary
� SCR is less responsive to UW Cycle� Removal of the Impact of expected profits / losses
� Company writes loss making business (e.g. soft market) � Lower capital
� Company increases premium rates to increase profitability � Higher capital
� Calibration ? – little justification for the parameters� Size factor has been removed
� More work required
� Reserve Risk – No company experience
� Premium Risk – Does not capture prospective risks
� CAT Risk – allowance of scenario approach
Interest Rate Equity Property Currency Spread Concentration
Correlation Mkt
� Market risk arises from the level of volatility of market prices� SCR for market risk is measured by analysing the impact on the balance sheet
of movements in the level of financial variables through:� Scenario modelling � Simplified approaches or factors for some sub-modules
� Outputs for this module are:� Capital charge for market risk before profit sharing: SCRMKT
� Risk mitigating effect of future profit sharing: KCMKT
QIS 3 – SCR FormulaMarket Risk

21
� Shocks scenarios to assess the net impact of increase or decrease of interest rates based on term structure:
� Different shocks are applied to different maturities � Impact should take into account any hedging instruments
QIS 3 – SCR FormulaMarket Risk – Interest Rate Risk
Interest Rate Equity Property Currency Spread Concentration
��
���
��
���
∆∆=
������������� ������������ ����������
0
QIS 3 – SCR FormulaMarket Risk – Interest Rate Risk
Interest Rate Equity Property Currency Spread Concentration
-0.40
0.56
5
-0.42
0.62
4
-0.37
0.49
7
-0.38-0.44-0.47-0.51Relative change down
0.520.690.770.94Relative change up
6321Maturity (years)
-0.34
0.42
12
-0.34
0.42
11
-0.34
0.42
14
-0.34-0.34-0.34-0.35Relative change down
0.420.420.440.46Relative change up
131098Maturity (years)
-0.31
0.38
19
-0.32
0.39
18
-0.31-0.33-0.33-0.34Relative change down
0.370.400.410.42Relative change up
20+171615Maturity (years)
� Example: If the 5-year interest rate equals 4% then the upwards “stressed” 5 –year interest rate = 4% x (1+0.56) = 6.24%
22
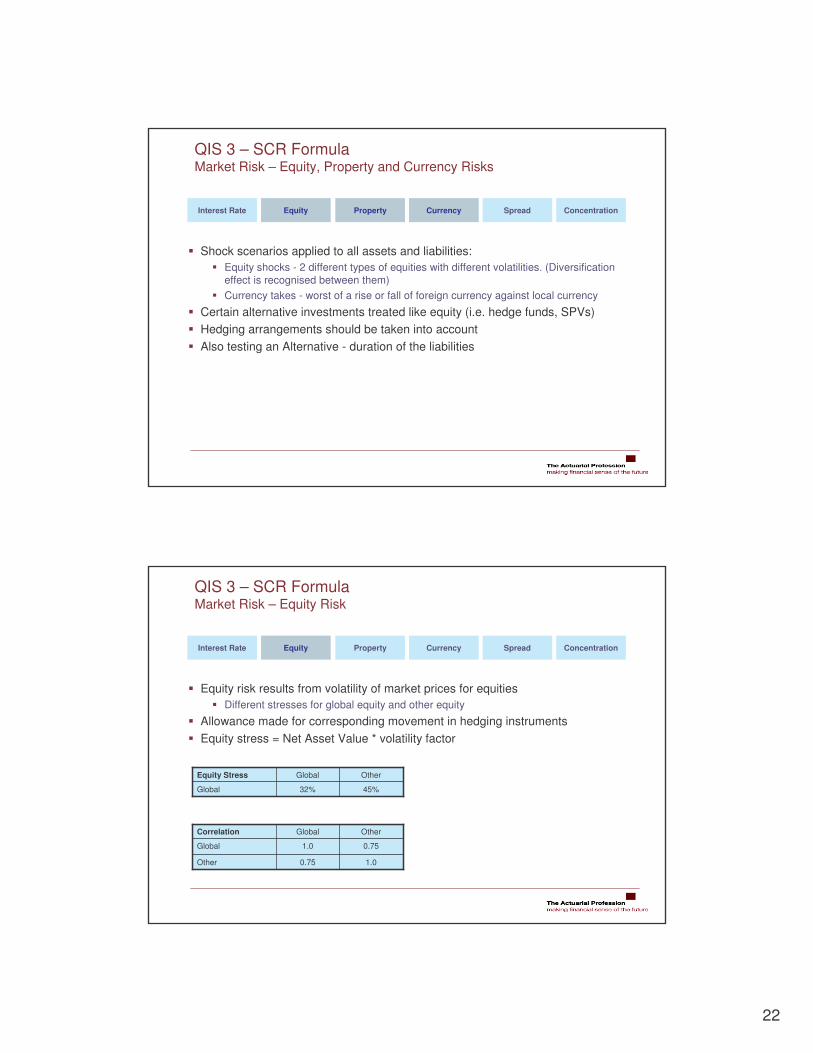
Interest Rate Equity Property Currency Spread Concentration
� Shock scenarios applied to all assets and liabilities:� Equity shocks - 2 different types of equities with different volatilities. (Diversification
effect is recognised between them)� Currency takes - worst of a rise or fall of foreign currency against local currency
� Certain alternative investments treated like equity (i.e. hedge funds, SPVs)� Hedging arrangements should be taken into account� Also testing an Alternative - duration of the liabilities
QIS 3 – SCR FormulaMarket Risk – Equity, Property and Currency Risks
Interest Rate Equity Property Currency Spread Concentration
� Equity risk results from volatility of market prices for equities� Different stresses for global equity and other equity
� Allowance made for corresponding movement in hedging instruments� Equity stress = Net Asset Value * volatility factor
1.00.75Other
0.751.0Global
OtherGlobalCorrelation
45%32%Global
OtherGlobalEquity Stress
QIS 3 – SCR FormulaMarket Risk – Equity Risk

23
Interest Rate Equity Property Currency Spread Concentration
� Property� Property risk arises from the level or volatility of market prices of property� Property risk is the immediate effect on the net value of asset and liabilities expected in
the event of a 20% fall in real estate benchmarks� Allowance is made for the investment policy e.g. hedging arrangements or gearing
� Currency� Currency risk is the immediate effect expected on the net value of asset and liabilities in
the event of a 20% change (greater of a rise or fall) in value of all other currencies against the local reporting currency
� Allowance is made for the individual currency positions and investment policy e.g. hedging arrangements or gearing
QIS 3 – SCR FormulaMarket Risk – Property and Currency Risks
Interest Rate Equity Property Currency Spread Concentration
� Spread risk arises from volatility of credit spreads over risk-free interest rate (term) � Government bonds do not have a charge� Capital requirement :
� Function F:
� Function m:
2%11.2%5.60%3.39%1.25%1.03%0.25%0.25%F(Rating)
NRCCCBBBBBBAAAAAARating
( )
( )( )( )
��
�
��
�
�
��
�
��
�
�
===
=
otherwisedur
CCCratingifdur
Bratingifdur
NRorBBratingifdur
durm
i
ii
ii
ii
i 4;min
6;min
8;min
� ••=i iisp ratingFdurmMVMkt )()(
QIS 3 – SCR FormulaMarket Risk – Spread Risk

24
Interest Rate Equity Property Currency Spread Concentration
� Concentration risk arises from additional volatility of concentrated asset portfolios and permanent losses of value due to the default of an issuer
� Only counterparty concentration risk is taken into account� Calculation is done in four steps:
� Calculate net exposure. Sum of the exposures across asset classes� Calculate excess exposure above a concentration threshold (which varies by rating of the
counterparty)� Calculate charge per ‘name’ as a function of excess exposure (parameters of the function
not intuitive)� Aggregate individual charges (independence assumed)
QIS 3 – SCR FormulaMarket Risk – Concentration Risk
Interest Rate Equity Property Currency Spread Concentration
� Aggregation assumes independence:
� Individual concentration charges:
� Excess exposure:
QIS 3 – SCR FormulaMarket Risk – Concentration Risk
5%A
5%AA-AAA
3%BBB
3%BB or lower
CTRating
0.9227
0.3862
0.2684
0.1840
g0
-0.0163A
0.0401AA-AAA
-0.0416BBB
-0.4314BB or lower
g1Rating
�=i
iconc ConcMkt 2
( )iixli XSggXSAssetsConc •+••= 10
���
���
−= CTAssets
EXS
xl
ii ;0max

25
0
1
-
-
-
-
Conc.
10.250.250.250.25Currency
-0000Conc.
-10.250.250.25Spread
--10.750.5Property
-
-
Spread
--10Equity
---1Interest
CurrencyPropertyEquityInterest
QIS 3 – SCR FormulaMarket Risk – Correlation Matrix
� Correlation Factors reduced compared to QIS 2
� Placeholder approach envisage to stress all assets, i.e. including those backing free surplus (i.e. assets - technical provision – SCR - other liabilities)
� Participants invited to provide alternative SCR (and MCR) calculations subject to exclusion of free assets from market risk
� Calculation is iterative:� Calculate the SCR based on all assets and use calculation to identify free assets
� Use above to identify assets not needed to cover technical provisions and SCR
� Exclude these assets and repeat the SCR calculation
� Repeat this calculation until the SCR no longer changes significantly
QIS 3 – SCR FormulaMarket Risk – Treatment of Free Assets
26
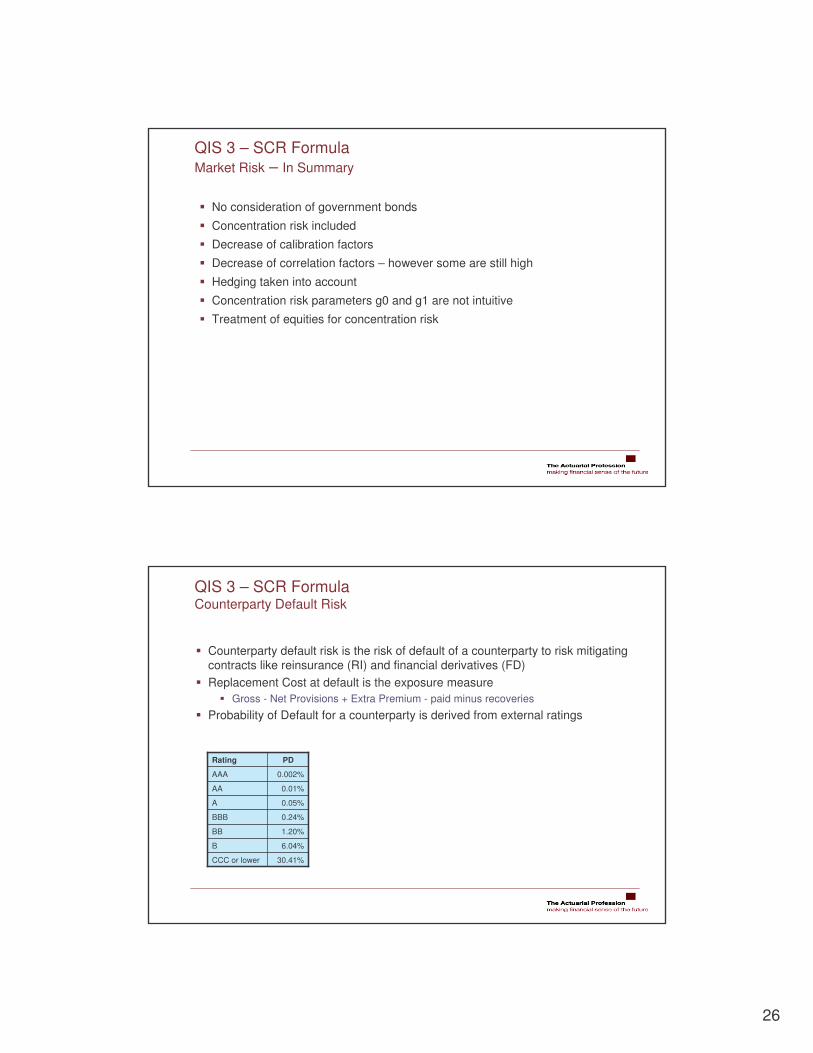
QIS 3 – SCR FormulaMarket Risk – In Summary
� No consideration of government bonds
� Concentration risk included
� Decrease of calibration factors
� Decrease of correlation factors – however some are still high
� Hedging taken into account
� Concentration risk parameters g0 and g1 are not intuitive
� Treatment of equities for concentration risk
QIS 3 – SCR FormulaCounterparty Default Risk
� Counterparty default risk is the risk of default of a counterparty to risk mitigating contracts like reinsurance (RI) and financial derivatives (FD)
� Replacement Cost at default is the exposure measure� Gross - Net Provisions + Extra Premium - paid minus recoveries
� Probability of Default for a counterparty is derived from external ratings
0.24%BBB
0.05%A
0.01%AA
0.002%AAA
6.04%B
1.20%BB
30.41%CCC or lower
PDRating
27
��
�⋅
−+⋅−⋅= − )995.0(
1)()1( 5.0 G
RR
PDGRNRCDef iii
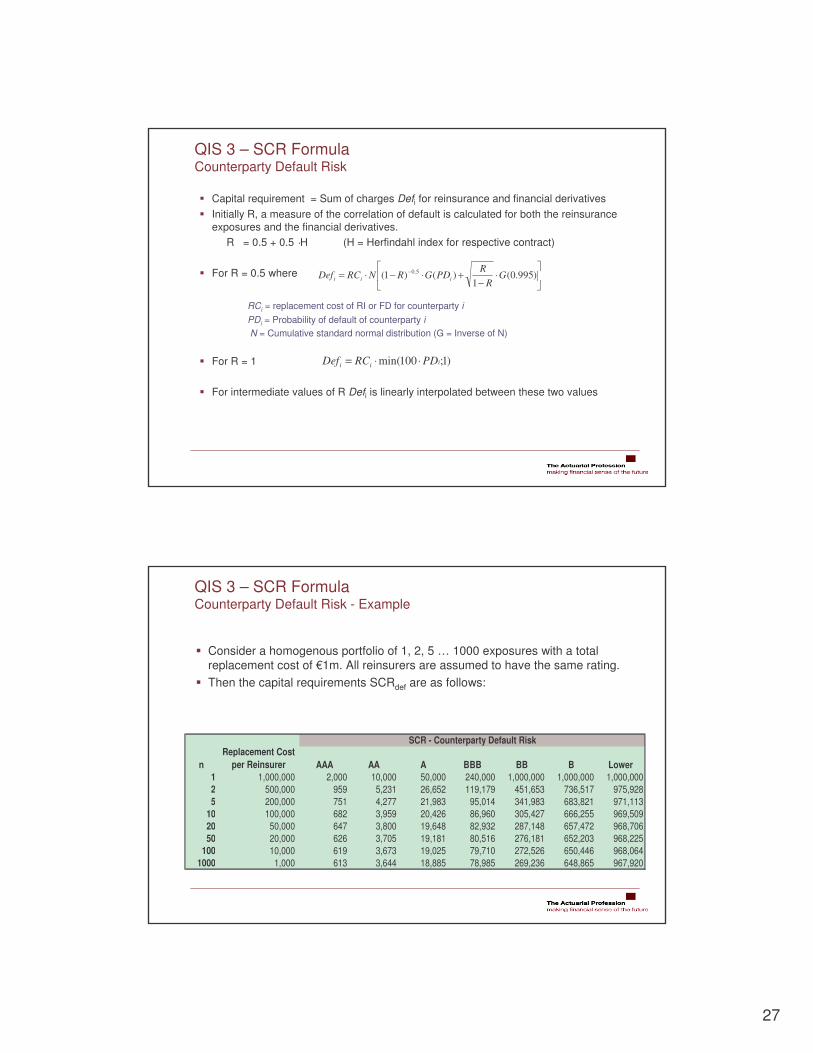
� Capital requirement = Sum of charges Defi for reinsurance and financial derivatives� Initially R, a measure of the correlation of default is calculated for both the reinsurance
exposures and the financial derivatives.R = 0.5 + 0.5 ·H (H = Herfindahl index for respective contract)
� For R = 0.5 where
RCi = replacement cost of RI or FD for counterparty iPDi = Probability of default of counterparty iN = Cumulative standard normal distribution (G = Inverse of N)
� For R = 1
� For intermediate values of R Defi is linearly interpolated between these two values
)1;100min( iii PDRCDef ⋅⋅=
QIS 3 – SCR FormulaCounterparty Default Risk
QIS 3 – SCR FormulaCounterparty Default Risk - Example
� Consider a homogenous portfolio of 1, 2, 5 … 1000 exposures with a total replacement cost of €1m. All reinsurers are assumed to have the same rating.
� Then the capital requirements SCRdef are as follows:
nReplacement Cost
per Reinsurer AAA AA A BBB BB B Lower1 1,000,000 2,000 10,000 50,000 240,000 1,000,000 1,000,000 1,000,0002 500,000 959 5,231 26,652 119,179 451,653 736,517 975,9285 200,000 751 4,277 21,983 95,014 341,983 683,821 971,113
10 100,000 682 3,959 20,426 86,960 305,427 666,255 969,50920 50,000 647 3,800 19,648 82,932 287,148 657,472 968,70650 20,000 626 3,705 19,181 80,516 276,181 652,203 968,225
100 10,000 619 3,673 19,025 79,710 272,526 650,446 968,0641000 1,000 613 3,644 18,885 78,985 269,236 648,865 967,920
SCR - Counterparty Default Risk
28
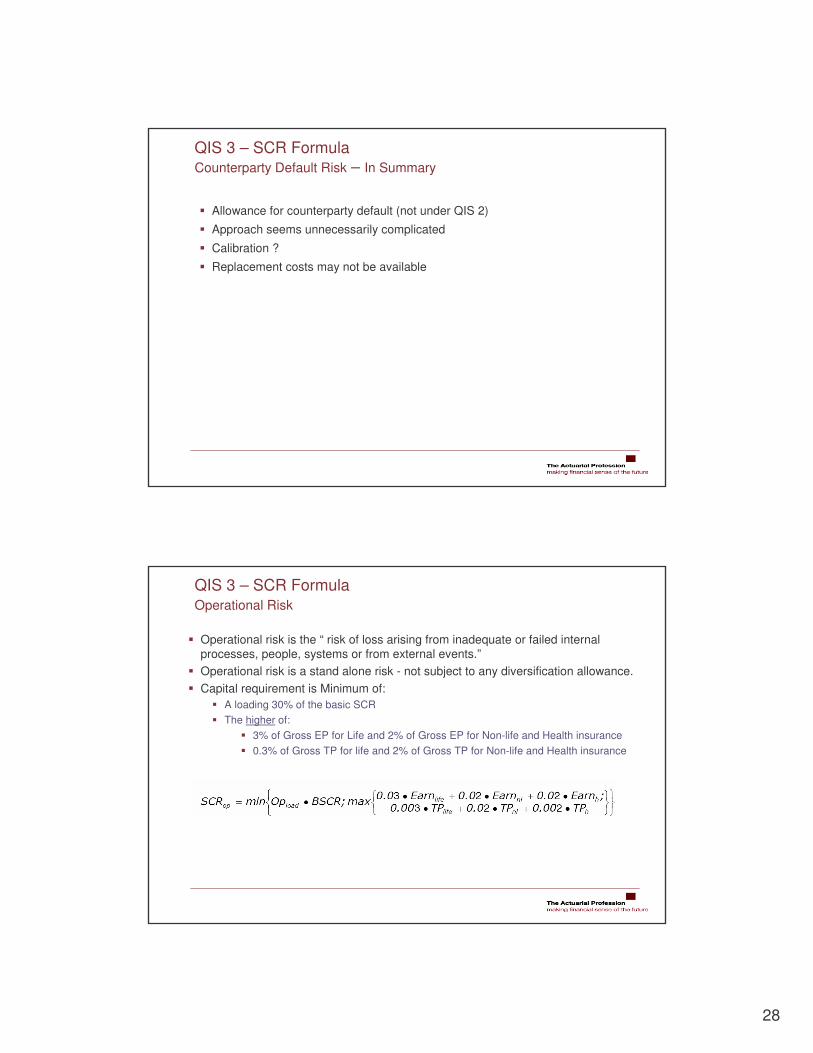
QIS 3 – SCR FormulaCounterparty Default Risk – In Summary
� Allowance for counterparty default (not under QIS 2)
� Approach seems unnecessarily complicated
� Calibration ?
� Replacement costs may not be available
� Operational risk is the “ risk of loss arising from inadequate or failed internal processes, people, systems or from external events.”
� Operational risk is a stand alone risk - not subject to any diversification allowance.� Capital requirement is Minimum of:
� A loading 30% of the basic SCR� The higher of:
� 3% of Gross EP for Life and 2% of Gross EP for Non-life and Health insurance� 0.3% of Gross TP for life and 2% of Gross TP for Non-life and Health insurance
QIS 3 – SCR FormulaOperational Risk

29
QIS 3 – SCR FormulaOperational Risk – In Summary
� Factors in the calculation reduced since QIS 2
� No allowance for Diversification with other major risk groups
� No incentives for improving operational and management processes
� Calibration
� Life Underwriting Risk is the risk arising from life insurance contracts:� Associated with both the perils covered� Processes followed in the conduct of the business
� Market Risk SCR � impact on Balance Sheet of changes in the assumptions used to project liability cash flows:
� Scenario simulation except for Catastrophe risk� Use of simplified approaches allowed for smaller undertakings
� Outputs are:� Capital charge for life underwriting risk before profit sharing: SCRLIFE
� Risk mitigating effect of future profit sharing: KCLIFE
QIS 3 – SCR FormulaLife Underwriting Risk
Biometric Lapse Expense Revision Catastrophe
Correlation Life

30
Topics
� QIS 2 and QIS 3 Headlines
� QIS 3 Overview
� Market Value Margins
� QIS 3 – SCR Formula
� QIS 3 –MCR Formula, Group Issues and Questionnaire
� Internal Models
� Some Thoughts
� Objectives: An MCR which is simple, robust and objective� Calibration: One-year time horizon, 90% VaR target level of confidence. � The following were being tested:
� Modular approach with alternative market risk methods � CEA approach as a % of the SCR (33%)
� Impact of a minimum monetary floor for the MCR
QIS 3 – MCR FormulaMCR Requirements

31
� First time group issues have been included in a QIS exercise� QIS 3 were seeking to understand:
� Size and sources of group diversification� Application of the principle of transferability� Size and nature of group specific risks� Assess difficulties in carrying out the calculations for groups
� Quantitative and qualitative information on internal models also being sought� Two Alternative approaches are being tested for groups
� Main method:� Aggregation of results from individual entities � Adjustment for non transferability of assets
� Alternative method: � Apply standard approach to consolidated data as if the group is a single entity� Adjustments for non-transferability of profits
QIS 3 – Group IssuesGroup Issues - Overview
� Two qualitative questionnaires were issued (in addition to the quantification)� Solo (31 questions)� Groups (39 questions)
� Questionnaires include:� Questions that all participants should answer� Others that subject to availability and applicability
� Focus of both questionnaires are:� Practicability� Suitability of methodology and calibration � Resource availability� Suggested simplifications and approaches
QIS 3 – QuestionnaireQuestionnaire - Overview

32
Topics
� QIS 2 and QIS 3 Headlines
� QIS 3 Overview
� Market Value Margins
� QIS 3 – SCR Formula
� QIS 3 –MCR Formula, Group Issues and Questionnaire
� Internal Models
� Some Thoughts
� QIS 3 Participants encouraged to calculate:� Capital by “Internal Models” and for each of the risk modules
� Partial Internal Models welcome:� Interest Rate and Equity Risk in particular (Banking Expertise)
� Issues:� Disaggregation of Output from Models to level of Granularity required � Risk Classification� Valuation bases may be different
� Supervisory Powers (Suggestions):� Should have the option to require companies to set up:
� Partial or Full Model � Prior approval of Internal Model required
� Power not to grant or withdraw
CEIOPS plans to publish a further consultation paper on Internal Models
Internal ModelsThe Role of Internal Models
33
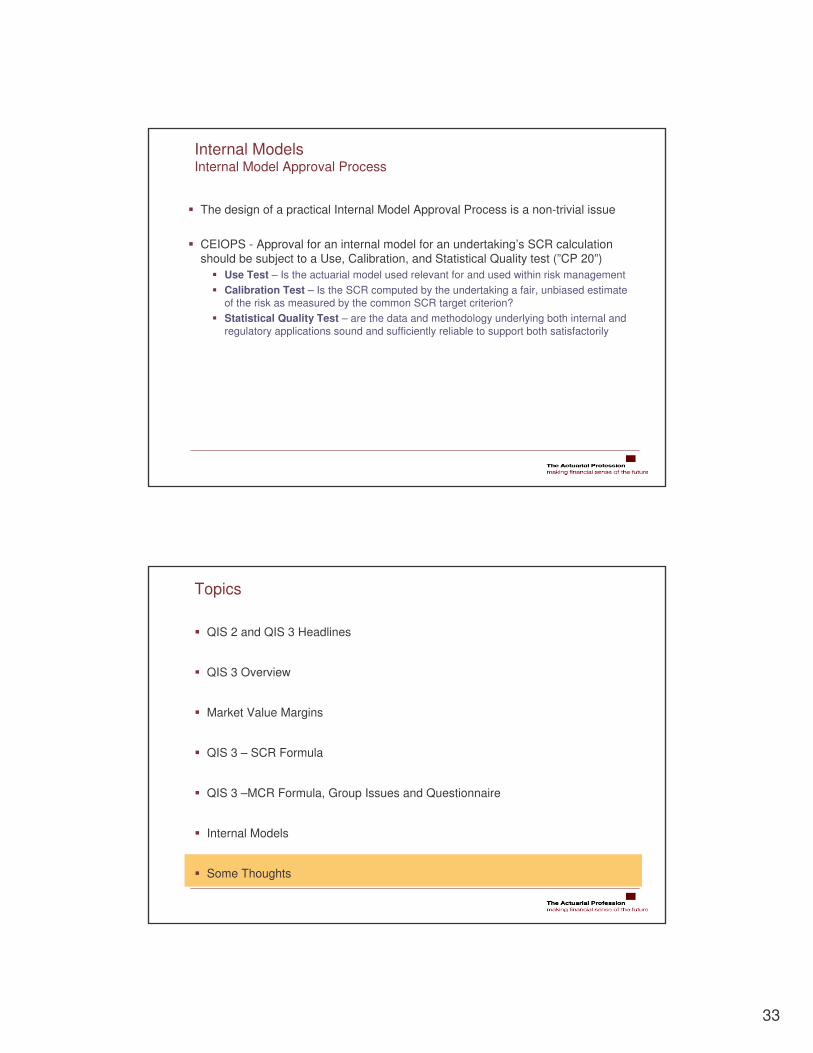
� The design of a practical Internal Model Approval Process is a non-trivial issue
� CEIOPS - Approval for an internal model for an undertaking’s SCR calculation should be subject to a Use, Calibration, and Statistical Quality test (”CP 20”)
� Use Test – Is the actuarial model used relevant for and used within risk management � Calibration Test – Is the SCR computed by the undertaking a fair, unbiased estimate
of the risk as measured by the common SCR target criterion? � Statistical Quality Test – are the data and methodology underlying both internal and
regulatory applications sound and sufficiently reliable to support both satisfactorily
Internal ModelsInternal Model Approval Process
Topics
� QIS 2 and QIS 3 Headlines
� QIS 3 Overview
� Market Value Margins
� QIS 3 – SCR Formula
� QIS 3 –MCR Formula, Group Issues and Questionnaire
� Internal Models
� Some Thoughts
34
Some ThoughtsIssues
� SCR Standard Formula:� One Size fits all:
� Formulae – Model risk ? � Parameters – Parameter risk ?� Differentiation by territory ?
� Factors to Net Financials - Premiums and Reserves� VaR vs TailVaR and Percentile
Are the Use of Internal Models Inevitable (UK: ICA vs ECR)
� SCR Correlation:� Determination of parameters ~ Economic or Underwriting Cycle ?� Some of the relationships look odd � Insurance Risk and Credit Risk
� Credit Risk – Expected Reinsurance Recoveries (not Stressed level)
� Cost of Capital – Basis and Assumptions� A series of 99.5% VaR 12-month calculations – Non-trivial
� Internal Models – Role, Validation and Approval Process