solvency and financial condition report 2020
TRANSCRIPT

SOLVENCY AND FINANCIAL CONDITION REPORT 2020


CONTENTS
Summary 2
A. Business and Performance 10
A.1 Business 10
A.2 Underwriting Performance 11
A.3 Investment Performance 13
A.4 Performance of other activities 16
A.5 Any other information 16
B. System of Governance 17
B.1 Governance Structure 17
B.2 Fit and Proper requirements 25
B.3 Risk management system including the own risk and solvency assessment 25
B.4 Internal control system 32
B.5 Internal Audit Function 33
B.6 Actuarial Function 33
B.7 Outsourcing 34
B.8 Any other information 34
C. Risk Profile 35
C.1 Underwriting risk 36
C.2 Market risk 38
C.3 Credit risk 39
C.4 Liquidity risk 40
C.5 Operational risk 41
C.6 Other material risks 41
C.7 Any other information 42
D. Valuation for Solvency Purposes 43
D.1 Assets 43
D.2 Technical provisions 51
D.3 Other liabilities 57
D.4 Alternative methods for valuation 61
D.5 Any other information 62
E. Capital Management 63
E.1 Own Funds 63
E.2 Solvency Capital Requirement split by risk module 67
E.3 Use of duration based sub-module in the calculation of the Solvency Capital Requirement 69
E.4 Differences between standard formula and any internal model used 69
E.5 Non-compliance with the Minimum Capital Requirement and non-compliance with the Solvency Capital Requirement 69
E.6 Any other information 69
Glossary 70
Appendices 72
Appendix 1 Balance Sheet 73
Appendix 2 Premiums, claims and expenses by line of business (life) 75
Appendix 3 Life and health SLT technical provisions 76
Appendix 4 Impact of long term guarantees measures and transitionals 77
Appendix 5 Own funds 78
Appendix 6 Solvency Capital Requirement - for undertakings on Standard Formula 79
Appendix 7 Minimum Capital Requirement - Only life or only non-life insurance or reinsurance activity 80
1

SUMMARY
PURPOSE OF THE SOLVENCY AND FINANCIAL CONDITION REPORTThis report will help you better understand our regulatory capital and financial position following the European-wide Solvency II regulations introduced on 1 January 2016. To help your understanding, the appendices to this report also detail seven specific Quantitative Reporting Templates (QRTs) for the company in the predefined format required under the regulations. The specifics of these templates are discussed in more detail across various sections of this report including sections A.2 (Underwriting Performance), A.3 (Investment Performance), D (Valuation for Solvency Purposes) and E (Capital Management).
It also covers how we are run, as well as a description of our business and performance, system of governance, risk profile, valuation for Solvency II purposes and our approach to capital management.
ABOUT USIrish Life Assurance plc ('ILA', 'we') is at the heart of the Irish Life Group ('Irish Life'). For more than 80 years Irish Life has helped people to confidently prepare and plan for their future. As one of Ireland’s leading financial services brands, Irish Life now takes care of over 1.3 million customers. It provides a range of innovative health and financial solutions, supported by the highest quality customer care.
Irish Life is proud to be a part of the Great-West Lifeco group of companies, one of the world's leading and most secure life assurance organisations. Great-West Lifeco and its subsidiaries - including the Great-West Life Assurance Company which was founded in Winnipeg, Canada, more than a century ago - have around $2.0 trillion Canadian dollars in consolidated assets under administration. They are members of the Power Financial Corporation group of companies.
Irish Life Assurance plc remained both operationally and financially resilient throughout 2020, despite the challenges presented by the COVID-19 pandemic. This can be seen in the overall performance detailed in Section A (Business
and Performance) and is a testament to the resilience of our workforce throughout this unusually challenging year.
OUR PURPOSE AND VISIONIrish Life's purpose is to help people build better futures. We do this by helping people take care of their health and financial well-being, so that they feel empowered to look to the future with more certainty and confidence.
Irish Life's vision is to be Ireland's home of Health and Wealth. We work to achieve this vision by providing our customers with the highest quality advice and guidance, that anticipates their changing needs at each stage of their life, backed by market leading product solutions and the highest standards of customer care.
Our ExO Innovation Hub is a key part of the delivery of Irish Life’s vision into the future. It represents our commitment to ensuring we continue to deploy leading edge technology and digital solutions to meet our current and future customers’ changing needs.
OUR GROWTH AND STRATEGYAt Irish Life, we combine the experience and security that comes with our 80 year heritage with a modern and customer focused approach to how we do business. We believe that both the best people and the best technology are needed to give the best levels of financial and customer service.
Our strategic programme aims to strengthen and expand our business, placing the customer at the centre of all we do backed by leading talent and digital capabilities. While 2020 was a year that tested the resilience of our business, we made sure that our customer services and processes remained open, while at the same time, addressing the challenges that the pandemic placed on us all. Our strategic ambitions remain as relevant now in a virtual and socially distant environment as they did pre-pandemic. We actively reviewed and amended our strategy during 2020 to speed up developments to help our customers and advisers face the challenges introduced by the COVID-19 pandemic. This included launching a fully digital advice process.
The development of digitally enabled products and services progressed well and provides a great platform to develop
2

further into 2021 and beyond. Generating key insights into our customers’ needs is being supported by our now established Connected Data centre of excellence which works in partnership with our customer, digital and business teams. The success of these initiatives can be seen by our increased customer satisfaction measures and the retention of our #1 market share position with ILA now having a 40.4% market share (this has improved by 4% from 2019). The investment in these initiatives is being supported by the continued delivery of operational efficiencies across all aspects of our business.
The pandemic highlighted the importance for us all to manage our mental, physical as well as financial well-being. Our well-being offering, which we have developed in partnership with our sister company Irish Life Health, has provided support to our external customers as well as our teams and their families during the year. We believe this offering, which will be extended into 2021, is a critical part of our programme to become Ireland’s home of health and wealth.
OUR VALUES AND ACHIEVEMENTSOur purpose and vision are supported by our four values - Customer First, Integrity, Professional People and Respect & Reward. This section shows examples of how our values were carried out during 2020.
CUSTOMER FIRST
HELPING PEOPLE BUILD BETTER FUTURESWe are passionate about helping people build better futures. Every day, all over the country, our financial advisers and distribution partners give sound financial advice to individuals, small to medium-sized enterprises (SMEs) and corporates. We are there for people when they need us most. In 2020, we paid out €272 million (2019: €317 million) in claims to our customers and their families affected by injury, illness and death. We paid €156
million (2019: €189 million) in 2,122 (2019: 2,411) life insurance claims, a further €50 million (2019: €62 million) in specified illness cover claims and another €64 million (2019: €64 million) in income protection claims.
At the end of 2020, we had €23.7 billion (2019: €22.1 billion) in funds under management for our pension customers and during 2020, we made payments related to pension products of €1.1 billion (2019: €1.2 billion)1.
Our flagship investment funds range is Irish Life Multi Asset Portfolio Solutions (MAPS®), at the end of 2020 funds under management in MAPS® across Pensions and Investment contracts were €11.9 billion (2019 €11.1 billion).
DELIVERING TOP CLASS CUSTOMER SERVICEA key goal and focus for our business is to deliver outstanding levels of service for customers and partners. We’re extremely proud of the way our teams demonstrated our core value of ‘customer first’ throughout 2020 and really stepped up to support our customers through the unprecedented challenges of COVID-19. Although most of our people had to quickly get set up and able to work from home, we continued throughout 2020 to deliver the highest standards of service to our customers and partners.
During 2020, we introduced a range of customer focused solutions such as payment breaks and deferral options for customers' plans and we made sure that all claims were handled sensitively and appropriately to support customers who were experiencing challenges from COVID-19. We ensured we maintained continuous availability of our channels of customer service throughout this period. We kept customers informed of our services and communicated with them about the levels of cover provided by individual insurance plans. We also created a dedicated COVID-19 section on our website to display key relevant information and included contact details if customers had queries on their cover and to keep them informed of the best ways to get the quickest service.
We also rolled out a new telephony and communications platform that will enable more seamless integration of voice, web chat and digital channels across our different business divisions. This will make it easier for our customers and business partners to connect with us through their channel of choice, and support continuous improvement in our customer experience.
We use an external company to help us measure our individual customer's satisfaction every month. Our award winning customer experience programme is called Intouch. It is based on the ‘perfect experience’ model which focuses on how specific actions and behaviours can drive a better customer experience and increase satisfaction. Setting and maintaining customer expectations is a core element of our programme and despite all the challenges 2020 presented with working remotely, our
CUSTOMER FIRSTWe keep our promises to our customers and always keep their interest in mind.
RESPECT & REWARDPeople feel respected, supported and rewarded for positively contributing to our shared success.
PROFESSIONAL PEOPLEWe deliver on Customer expectations through continuous development and improvement to maintain the highest standards throughout our organisation.
INTEGRITYWe are committed to the highest standards of good governance and business ethics.
1 The 2019 comparatives have been adjusted to be consistent with the disclosures in 2020.
3
customer services levels remained strong. For 2020 we achieved a customer satisfaction score of 85.9% from our individual customers. We are very proud of this achievement as it keeps us in the top quartile for customer satisfaction (as measured by The Leadership Factor Customer Satisfaction Index) but it also demonstrates the importance of continuing to listen and respond to our customers' feedback in these uncertain times.
We use the same external company to measure customer satisfaction monthly for our corporate customers. In 2020, we also set up an InTouch committee. This committee is comprised of colleagues from Operations, Member Engagement and Marketing with the common aim to drive better customer experience and increase satisfaction. In 2020, we achieved a customer satisfaction score of 82.9% for our corporate customers. We also ran our annual Client survey for corporate customers. The most recent survey results show continued strong performance with the score increasing by 1.9% from 2019 to 85.6% in 2020.
At the 2020 Irish Pension Awards, we were winners of the 'Excellence in Defined Contribution' award.
Other awards received during 2020:
• Our sister company, Irish Life Investment Managers Ltd. ('ILIM') (which provides ILA with asset management services and expertise) were winners of the Investment Manager of the Year at the 2020 Irish Pension Awards (for the 6th year running).
• Our sister company, Setanta Asset Management Ltd. (which provides ILA with asset management services and expertise) were winners of Equities Manager of the Year award at the 2020 Irish Pension Awards (for the 3rd year running).
FOCUSSING ON INNOVATIONIrish Life’s ExO Hub innovation centre continues to experiment with next generation technologies and develop solutions for customers.
One area of focus is the Next Generation age group (those aged 20-35 years). During 2020, the ExO Hub developed a digital proposition to engage younger people on their early protection needs, using a simple digital journey.
The ExO Hub makes the most of our partnership with Plug and Play in the broader Insurtech community, to connect us with Insurtech and Fintech start-ups that we can match with our business to solve real customer needs.
As part of that wider community, Irish Life has been leading a collaborative venture to explore how Ireland might develop a digital identity and credential sharing infrastructure that would benefit Irish citizens and its businesses.
RESPECT AND REWARDSince 2018, we have measured our employee engagement using an annual survey. The results across the group show that 82% (2019: 70%) of our employees strongly identify with and share the company's values and are engaged. This result marks a significant improvement on the previous survey and benchmarks well against the international and European norms for our sector and wider industry. Upon analysis, the upswing in engagement is seen to be as a result of strong communication (both leadership-level and local line of business level), engagement (supporting teams, their motivation and their performance for customers) and supports offered to our employees as we moved to a model of remote working.
We recognise that diversity makes us stronger and drives our success and growth as individuals and as a business. Our cross-company Diversity and Inclusion (D&I) leadership group acts to champion D&I across our campuses, and to bring together our different perspectives and capabilities.
Irish Life has continued the work under our D&I plan which is set out over 3 key strands - 'Achieve Your Potential', 'Be Your True Self' and 'Value & Support Each Other'. Some of the initiatives completed in 2020 under this programme include:
• Switched to digital offerings and supporting employees working from home. This included delivering our 'Diversity in Leadership' and Pride week celebration programmes virtually;
• Increased wellness and parental supports through-out 2020;
• Launched Women@Work Employee Resource Group with over 50% of employees attending these events in 2020;
• Board D&I training which focused on positive challenge as leaders.
These initiatives have resulted in Irish Life being shortlisted by The Chartered Institute of Personnel Development for Best D&I 2020. We also received global recognition for our role models, individuals from across our business recognised for showing leadership in various areas of D&I, in a number of prestigious publications for striving for better gender balance and supporting the LGBTQI+ community.
The new D&I Strategy developed for 2021-2022 was signed off by our Senior Leadership Team and Board during the year. This ambitious strategy will continue our goal to be a thought leader in the industry. Early progress has been achieved in the implementation of this strategy with projects established in the areas of: cognitive diversity assessments, Leadership Development Programme, D&I integration and expanding our D&I data collection beyond gender to race and disability.
SOCIAL AND EMPLOYEE MATTERSHelping to build secure futures in the wider community is of huge importance to Irish Life’s vision and values. Every January, all employees nominate two charities to benefit from fundraising initiatives. All funds raised by employees for the charities are
4
matched by the group and given to the two chosen charities, details of funds raised are outlined in the below table. During 2020, our staff charities, Laura Lynn Ireland's Children's Hospice and Barretstown, along with many others faced massive funding drops as they were no longer able to run their normal fundraising events. However, due to a number of virtual fundraising events we raised more funds in 2020, than in 2019, for our staff charities.
Year Charities Amount raised
2020Laura Lynn Ireland's Children's
Hospice and Barretstown€370,800
2019 Pieta House and Stewarts School €365,000
During 2020, alongside normal support for two main charities, Irish Life have also supported many other charities and initiatives:
• Gave COVID-19 donations to Family Carers Ireland (€350,000) and the Peter McVerry Trust (€150,000);
• Supplied 70 apartments to Front Line Workers so they could safely isolate while continuing to battle COVID-19, made parking spaces close to hospitals available to the HSE and secured warehouse facilities to help with the storage of medical equipment;
• Supplied premises on Grafton St and Henry St at no cost to Barretstown, National Council for the Blind of Ireland and St Vincent De Paul so they could set up Christmas fundraising shops;
• Irish Life and Staff also donated over €15,000 to The Cappuchins, St Vincent De Paul and the Salvation Army;
• Continued to support long standing educational partnerships with Scoil Chaoimhin and the P-Tech programme in Larkin College; and
• Supported local businesses such as The Coffee Dock, Tang and Centre Ville.
PROFESSIONAL PEOPLEWe are always working hard to attract and retain the most talented people, and to support and develop them throughout their careers. We have annual development programmes and mentoring in place to make sure all employees have an opportunity to develop their careers with us. We look for creative, original thinkers who will challenge us to be the best we can be. As a result, we have built a skilled and enthusiastic workforce with exceptional knowledge and expertise.
During the year, we implemented an integrated suite of HR applications from recruitment to payroll, and performance management to succession planning.
During 2020 the majority of our employees have been working from home due to COVID-19 restrictions. To support employees working remotely, the company gave employees the equipment and tools needed for home workstation set-up. Detailed FAQs and supports were provided to employees to
assist them with any queries they had and these were updated regularly as advice from the Government and HSE changed.
Flexible working arrangements which allowed us to maintain our excellent standards of customer service were agreed between staff and line management for employees with school going children, who were being educated at home, along with those employees fulfilling the role of carers.
Employee engagement and well-being was, and continues to be, a key priority for us to ensure that our staff are well positioned to serve our customers needs. We enhanced and adapted our communications, including fortnightly online updates from our CEO. We used numerous inventive ways of engaging within divisions and teams, to make sure we stay connected and informed. We engaged our Employee Assistance Programme provider to enhance offerings and services to all employees at the onset of COVID-19 in order to help employees deal with issues such as engagement, isolation, anxiety and stress. Online exercise and yoga classes were available to all employees, together with webinars on health and well-being, and activities and competitions for employees and their families. The effort and resilience shown by employees in adapting to the new norm was recognised and rewarded throughout the period.
On the Health and Safety side (H&S), we commenced online H&S self-assessments for everyone working from home in order to comply with H&S regulations and to ensure that employees had the best possible working from home experience
A small number of our employees were required to be physically present from the onset of COVID-19 due to the nature of their role. We implemented a wide range of safety measures throughout our buildings and across relevant processes in line with HSA guidelines, and monitor changes required as public health advice changes. The safety of our employees, customers and suppliers is paramount.
We prepared a COVID-19 response plan which covers the safe return of our employees to the workplace, in line with government protocols. These plans will continue into 2021 and are adapted as government and public health advice changes.
INTEGRITYIrish Life is committed to best practice Corporate Governance. The Board of Directors is responsible for the governance of Irish Life and is supported in this regard by an experienced senior management team. In our business, relationships with our customers and stakeholders are based on trust. This is achieved by adhering to our values of Customer First, Integrity, Respect and Reward and Professional People and by ensuring all divisions within Irish Life operate with the highest ethical standards, which are set out in our enterprise-wide Code of Conduct which is approved by the Board. The Board oversees compliance with the Code through our Compliance function, who monitor that the code is being adhered to.
5

Irish Life is committed to abiding by the principles of acting honestly, fairly and professionally in the best interests of our customers. An important element of these principles is that we have appropriate arrangements in place designed to prevent potential conflicts of interest from adversely affecting the interests of our customers.
We have Group-wide policies that prohibit any form of bribery, corruption, fraud or money laundering, which all our Irish Life team must comply with. This is continuously monitored and updated.
Irish Life has a Speaking-Up policy as we are committed to the highest standards of openness, integrity and accountability. We believe it is important to have processes that allow all staff, and other people who work with us, to raise any concerns they may have about suspected wrongdoing within Irish Life. This is achieved through a mix of formal group processes which include a confidential anonymous telephone line and through informal local channels.
Our sister company Irish Life Financial Services Ltd. (ILFS) is tied to ILA for life assurance business and carries out a key role in distributing our products to customers. ILFS participates in the Consumer Protection Risk Assessment (CPRA) Framework. CPRA was launched by the Central Bank of Ireland to make sure that the culture, within financial services firms, is one where the firms are clearly able to show they are consistently putting the customer first. ‘Customer first’ is one of our core values and some examples of initiatives that are taken to make sure our financial advice process supports our customers include:
• Reward and Recognition The ‘Reward and Recognition’ initiative invites nominations
for colleagues who have gone above and beyond in the true spirit of customer first.
• Open Door The ‘Open Door’ digital platform was established to
encourage and enable individuals to submit ideas on how financial planning can improve both the protection of our customers and the service we provide to our customers.
• Trusted Colleague A ‘Trusted Colleague’ group has been established. The role
of the trusted colleague is primarily to listen to and engage with suggestions around improving how we interact with and advise our customers.
SUSTAINABLE INVESTMENTS Our clients trust us with their investments and meet our core promise to them - to deliver better futures. In response to a growing demand for more sustainable and responsible investment solutions which maintain a core focus of delivering superior risk adjusted returns, our sister company, ILIM, is currently converting their entire discretionary book of assets under management (AUM) to a responsible investment approach. This clearly considers Environmental, Social and Governance (ESG) factors in the investment approach and solidifies Irish Life as a leader in the Irish investment industry. The impact of these changes has been to reduce the carbon intensity of the equity portfolio by circa 30% in 2020. As at the end of 2020, ILIM has over €22 billion in responsibly managed AUM which sees a circa 46% increase from circa €15 billion at the end of 2019.
ILA holds assets of €10.7 billion in ILIM's responsibly managed AUM as at the end of 2020 (2019: €8.8 billion).
During 2020, our sister company, Setanta joined ILIM as member of ESG Ireland. Both firms look forward to working with other like-minded firms to share knowledge and promote greater awareness of responsible investing and the consideration of the ESG impacts in investment decisions.
ENVIRONMENTAL MATTERSAs part of the Irish Life Group, we are fully committed to the management of all aspects of our business to the highest environmental standards throughout our corporate buildings. Irish Life has developed an environmental policy which strives to protect the environment from the potential impacts of its activities, products and services and to assist in maintaining and improving the quality of the environment.
The ISO 14001 is the international standard that specifies requirements for an effective environmental management system. In 2018 Irish Life successfully transitioned to ISO14001:2015 which is audited annually, for certain buildings on our Abbey street campus. This certification sets out the criteria and framework that Irish Life follows for an effective environmental management system. Irish Life is required to consider all environmental issues, including waste management, and the effective use of resources.
As part of the environmental management system we have in place electric car charging points, LED lighting, colour-coded recycling stations, e-learning ISO training courses, the Government supported bike to work scheme and the Government travel pass scheme.
As part of a drive to reduce the reliance on single use plastic throughout the campus, staff members can now purchase compostable food containers and receive canteen discounts on coffee for using reusable cups, which have been supplied to all staff. We will continue to look for further opportunities to reduce our reliance on single use plastic on campus.
6

Our new office in Dundalk is a significant benchmark on how to design an environmentally friendly workplace. Designed from the beginning to be a Near Zero Energy Building, it generates as much energy as it consumes, and achieved a Leadership in Energy and Environmental Design gold standard in January 2020. The electricity supply to our main Abbey Street building is through a renewable energy supplier.
We aim to achieve 90% recycling for our corporate buildings, and we exceeded this target in each of the last two years.
INITIATIVES FOR IRELAND As Ireland's leading provider of pensions, managing the financial needs of more than 1 million Irish customers, Irish Life is acutely aware of the need to identify opportunities and anticipate challenges of changing demographics. Irish Life is proud of its long standing relationship with The Irish Longitudinal Study on Ageing (TILDA). TILDA’s vision is to make Ireland ‘the best place in the world to grow old’ by studying the health, wealth and quality of life aspects of ageing. TILDA has become a benchmark for longitudinal studies globally. The relevance and importance of its research has increased as awareness of the ageing profile of the Irish population grows. Our purpose in Irish Life is to help people build better futures, and TILDA helps us understand the health, economic and social circumstances of people aged 50 and older in Ireland. Life expectancy in Ireland is now 82 years, we can use the insights from TILDA to make sure people fully enjoy the years approaching and beyond retirement.
Irish Life are CSR (Corporate Social Responsibility) partners with the GAA’s Healthy Club Project, which aims to turn GAA clubs into health and well being hubs for communities. During 2020 Irish Life through our 'MyLife' app supported several nationwide steps challenge initiatives which were hugely successful in recognising and rewarding the importance of physical activity & the well being of communities. In the first quarter of 2021 over 28,000 GAA members, from over 600 clubs nationwide, participated in a distance challenge through our app.
Irish Life welcomed the publication in November of the Report of the Interdepartmental Pensions Reform and Taxation Group.2 In particular, the recommendations for reforming and simplifying the existing pensions landscape would be beneficial to consumers, regulators and pensions providers in the market. However, due to the current complexity within the market and the need to implement the provisions of the IORP II directive3 the correct sequencing of reforms is vital. Additional regulatory measures should not be implemented for small or single member schemes until there are other viable pensions vehicles in place for these scheme members. To increase regulatory burdens on smaller schemes, without providing alternative pensions options at a similar cost, could fundamentally damage both pension adequacy and coverage in the market.
With only 35% of private sector workers saving for their retirement, Ireland faces a pensions time bomb in the future as more and more people rely on the State pension as their only financial means. However, the business and sectors of the economy that have been worst impacted by COVID-19 are also most likely to be those that would be affected by auto-enrolment i.e. the hospitality and services sectors. These businesses need to be given time to recover and therefore a postponement on the implementation of auto-enrolment would be appropriate.
However, this does not mean that the core design blocks and decisions of auto-enrolment should be delayed. The State should progress with the Road Map for Pensions4 and have it ready for implementation once economic conditions have improved. In addition, key assumptions should be revisited based on the new fiscal position in which the State finds itself. Rather than incurring cost building an expensive separate IT system, other models that have worked well in other jurisdictions should be examined. In particular, the use of the Revenue Commissioners as the direct link between employers and pensions providers, similar to the New Zealand KiwiSaver, should be investigated. This would reduce costs and simplify administration for all.
OTHER INFORMATIONWe took all necessary steps to prepare for the impacts of Brexit. ILA’s business is almost exclusively in Ireland, with only a very small number of existing U.K. policies relating to products that are no longer sold. In order to prepare for Brexit, our sister company in the UK transferred a portfolio of European annuities to ILA in 2020. This transaction took place at fair market price.
BUSINESS AND PERFORMANCEWe have detailed our financial performance - which was influenced by market conditions, premium inflow and claims outflows - in section A. (Business and Performance).
At the end of 2020, we reported solvency capital that was €868m (2019: €789m) above the €1,142m (2019: €1,145m) Solvency Capital Requirement (SCR).
Our underwriting performance of €69m in 2020 decreased from €94m in 2019. The year-on-year change in this underwriting result was influenced by the impact of strong equity market performance during 2019 which was not repeated in 2020, along with a difference in interest rates and claims in 2020 relative to 2019. This is discussed in more detail in sections A.2 (Underwriting Performance)and A.3 (Investment Performance).
2 https://www.gov.ie/en/publication/98d7f-report-of-the-interdepartmental-pensions-reform-and-taxation-group/#3 https://www.pensionsauthority.ie/en/trustees_registered_administrators/iorp_ii_directive/4 https://www.gov.ie/en/publication/abdb6f-a-roadmap-for-pensions-reform-2018-2023/
7

After tax, our financial performance generated a profit for the financial year (excluding profits from the participating funds) of €97m (2019: €97m). The profit for the current financial year is driven by favourable mortality and morbidity experience, unfavourable investment experience, and basis changes related to insurance contract liabilities
Our individual and small business customer sales were behind in 2020 at €1,336m (2019: €1,647m). Annual Premium Equivalent (APE) sales were also behind at €218m (2019: €267m). 2020 saw investment sales slow across all distribution channels with low customer sentiment scores and uncertainty due to COVID-19 and Brexit being key contributing factors.
Our corporate customer sales increased by 110% to €1,553m (2019: €739m), APE sales increased to €433m (2019: €298m). This was mainly due to a number of large defined contribution (DC) sales in 2020.
We calculate our Solvency Capital Requirement (SCR) using the standard formula set by the European Insurance and Occupational Pensions Authority (EIOPA). We control and report solvency capital in line with the capital management and metrics detailed in section E (Capital Management). The table below summarises our year end position.
€m 2020 2019
Tier 1 - unrestricted
Issued share capital 1 1
Share premium account 340 340
Surplus funds - -
Reconciliation reserve 1,669 1,593
Available Own Funds (before foreseeable dividends and adjustments)
2,010 1,934
Foreseeable dividends, distributions and charges
- -
Ring fenced funds adjustment (Participating Funds)
- -
Total available Own Funds to meet the SCR 2,010 1,934
Solvency Capital Requirement (SCR) 1,142 1,145
Solvency ratio 176% 169%
Minimum Capital Requirement (MCR) 514 515
Eligible Own Funds as a percentage of MCR 391% 375%
Note: all tables in this document use units of millions and thousands. Because we have rounded the figures, the totals in the tables may not equal the sum of the components exactly.
SYSTEM OF GOVERNANCEYou can find out more about our governance process in section B. (System of Governance). We have summarised the structure of our Board below (more details in section B.1.1 (Governance Structure)).
The Board of Directors of ILA is responsible for the governance and oversight of all of ILA’s operations and risks.
As described in section A.1 (Business), the company serves individual customers, small and large corporate customers and other affinity groups. You can find more detail in section A (Business and Performance).
Executive management teams, who report to the Chief Operating Officer of ILA, are in charge of day-to-day activities. Business plans, strategies and annual budgets are developed and targets closely monitored.
Control functions oversee operations and all other business activities. IT and HR services are provided on a campus wide basis to ILA and other Irish companies in our group.
The committees critical to the governance structure are set out below.
GOVERNANCE STRUCTURE
Notes: *The Remuneration Committee and Nomination and Governance Committee are constituted at the level of the Irish Life Group, ILA's parent company, and their membership includes some non-ILA directors. ILA relies on these committees, as permitted under the Corporate Governance Code.
**The Executive Investment Management Committee also reports to the Board.
Board of Directors
Executive Risk
Management Committee
**Executive Investment
Management Committee
Operational Risk
Committee
Compliance Management Committee
Board Audit Committee
Board Risk Committee
*BoardRemuneration
Committee
*BoardNomination
and Governance Committee
8
RISK PROFILEOur risk profile reflects our main business activities.
We control the way we accept risks, using our expertise to manage them and create shareholder value from them. The Board approves our risk appetite at least once a year, defining a risk preference for all significant risks.
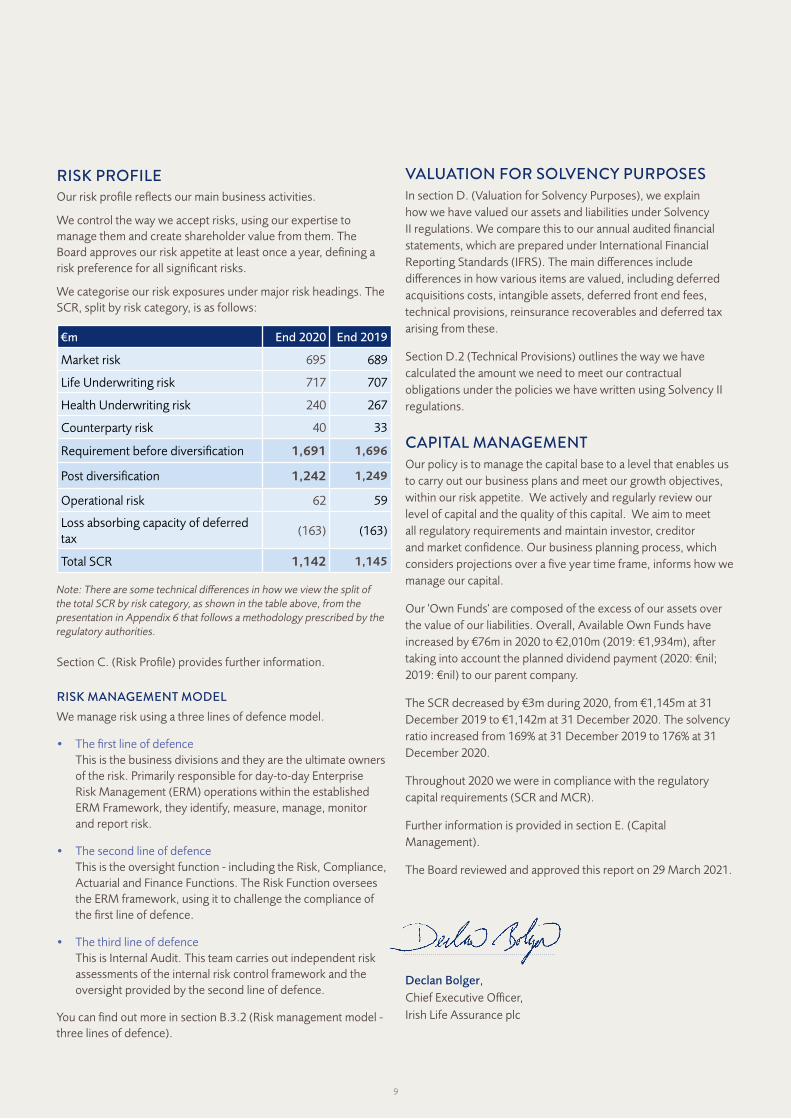
We categorise our risk exposures under major risk headings. The SCR, split by risk category, is as follows:
€m End 2020 End 2019
Market risk 695 689
Life Underwriting risk 717 707
Health Underwriting risk 240 267
Counterparty risk 40 33
Requirement before diversification 1,691 1,696
Post diversification 1,242 1,249
Operational risk 62 59
Loss absorbing capacity of deferred tax
(163) (163)
Total SCR 1,142 1,145
Note: There are some technical differences in how we view the split of the total SCR by risk category, as shown in the table above, from the presentation in Appendix 6 that follows a methodology prescribed by the regulatory authorities.
Section C. (Risk Profile) provides further information.
RISK MANAGEMENT MODELWe manage risk using a three lines of defence model.
• The first line of defence This is the business divisions and they are the ultimate owners of the risk. Primarily responsible for day-to-day Enterprise Risk Management (ERM) operations within the established ERM Framework, they identify, measure, manage, monitor and report risk.
• The second line of defence This is the oversight function - including the Risk, Compliance, Actuarial and Finance Functions. The Risk Function oversees the ERM framework, using it to challenge the compliance of the first line of defence.
• The third line of defence This is Internal Audit. This team carries out independent risk assessments of the internal risk control framework and the oversight provided by the second line of defence.
You can find out more in section B.3.2 (Risk management model - three lines of defence).
VALUATION FOR SOLVENCY PURPOSESIn section D. (Valuation for Solvency Purposes), we explain how we have valued our assets and liabilities under Solvency II regulations. We compare this to our annual audited financial statements, which are prepared under International Financial Reporting Standards (IFRS). The main differences include differences in how various items are valued, including deferred acquisitions costs, intangible assets, deferred front end fees, technical provisions, reinsurance recoverables and deferred tax arising from these.
Section D.2 (Technical Provisions) outlines the way we have calculated the amount we need to meet our contractual obligations under the policies we have written using Solvency II regulations.
CAPITAL MANAGEMENTOur policy is to manage the capital base to a level that enables us to carry out our business plans and meet our growth objectives, within our risk appetite. We actively and regularly review our level of capital and the quality of this capital. We aim to meet all regulatory requirements and maintain investor, creditor and market confidence. Our business planning process, which considers projections over a five year time frame, informs how we manage our capital.
Our 'Own Funds' are composed of the excess of our assets over the value of our liabilities. Overall, Available Own Funds have increased by €76m in 2020 to €2,010m (2019: €1,934m), after taking into account the planned dividend payment (2020: €nil; 2019: €nil) to our parent company.
The SCR decreased by €3m during 2020, from €1,145m at 31 December 2019 to €1,142m at 31 December 2020. The solvency ratio increased from 169% at 31 December 2019 to 176% at 31 December 2020.
Throughout 2020 we were in compliance with the regulatory capital requirements (SCR and MCR).
Further information is provided in section E. (Capital Management).
The Board reviewed and approved this report on 29 March 2021.
Declan Bolger, Chief Executive Officer,Irish Life Assurance plc
9

A. BUSINESS AND PERFORMANCE
COMPANY NAME: Irish Life Assurance plc
Name and contact details of the supervisory authority who is responsible for financial supervision of the company:
Central Bank of IrelandNew Wapping Street North Wall QuayDublin 1.
We are a wholly owned subsidiary of Canada Life Limited, a U.K. registered company, via our immediate parent, Irish Life Group Limited. The supervisory authority of Canada Life Limited is the Prudential Regulation Authority (PRA).
The contact details for the PRA are:20 MoorgateLondon, EC2R 6DA.
Name and contact details of the external auditor of the company is:
Deloitte Ireland LLP Chartered Accountants and Statutory Audit Firm Deloitte & Touche House Earlsfort Terrace Dublin 2.
Irish Life Assurance plc (ILA) is a member of the Great-West Lifeco group of companies, one of the world’s leading life assurance organisations.
Great-West Lifeco (Lifeco) and its subsidiaries, including The Great-West Life Assurance Company (GWL), have approximately $2.0 trillion Canadian dollars in consolidated assets under administration and at the end of 2020 had approximately 24,500 employees worldwide and are members of the Power Financial Corporation Group of companies. GWL is a wholly owned subsidiary of Lifeco which is incorporated in Canada and listed on the Toronto Stock Exchange.
Lifeco is the indirect parent company of The Canada Life Group (U.K.) Limited (CLG). CLG is the parent company of Canada Life Limited (CLL) which is a U.K. based insurance company.
CLL acquired Irish Life Group Limited in 2013. The Irish Life Group has a number of subsidiaries, and is subject to Solvency II group supervision as the insurance holding company for ILA and Irish Life Health.
Irish Life Investment Managers Limited, Canada Life Asset Management Limited, and Setanta Asset Management Limited are sister companies within CLG. They provide ILA with asset management services and expertise.
This section describes our organisational structure and financial performance over the last financial year.
A.1 BUSINESS
10

Below is a simplified diagram of how our parent company is organised.
We are the largest life and pensions group in Ireland, serving over 1.3 million customers. The Irish Life brand is one of the most established and recognised financial brands in Ireland. Our strong brand is thanks to our large distribution network, product innovation, flexibility and strong investment performance.
We operate through two main divisions, Irish Life Retail (Retail Life) for our individual and small business customers and Irish Life Corporate Business (Corporate Life) for our corporate customers. Our market share increased in 2020 to circa 40% (2019: circa 36%).
We provide pensions, life and investment products to individual and small business customers in Ireland. We lead the market with a comprehensive product range spanning protection, pensions, investment and regular savings products. We have the largest and most diverse distribution network of any life assurance company in Ireland, and have the largest direct sales force.
We have a multi-channel distribution strategy. This means that sales are split between:
• independent brokers and independently regulated tied agents
• tied agents in bank branches
• its employed and self-employed sales force.
We have well established bancassurance arrangements with a number of Ireland’s banks which gives us access to the largest network of bank branches in Ireland. Our total sales for individual and small business customers in 2020 of €1,336 million were behind the same period last year (2019: €1,647 million) mainly due to a fall in investment sales across all distribution channels with low customer sentiment scores and uncertainty due to COVID-19 and Brexit being key contributing factors.
We use an external company to help measure customer service every month. At the end of 2020 we achieved a score of 85.9% (2019: 86.0%). This keeps us in the top quartile of companies for customer satisfaction based on a league table of over 700 companies across all business sectors in Ireland and the U.K.
We sell pensions and risk products to our corporate customers, namely employers and affinity groups in Ireland, mainly through pension consultants and brokers.
The key drivers of sales growth for corporate customers are:
• employment and salary growth in the Irish economy
• the move towards defined contribution pensions, away from defined benefit pensions.
Our corporate customer sales increased by 110% to €1,553 million, compared to €739 million in 2019, mainly due to a number of large defined contribution (DC) sales in 2020.
GREAT-WEST LIFECO INC.
THE CANADA LIFE GROUP (U.K.) LIMITED
CANADA LIFE LIMITED
IRISH LIFE GROUP LIMITED
IRISH LIFE ASSURANCE PLC
A.2 UNDERWRITING PERFORMANCEWe prepare our financial statements under International Financial Reporting Standards (IFRS), as adopted by the European Union. The information in this section about underwriting performance is provided on an IFRS basis.
UNDERWRITING PERFORMANCE The tables below show the premiums, claims, expenses, and change in technical provisions, combined with the investment return for each of the Solvency II lines of business. We refer to the total of these items as the “underwriting result” in this report.
11

2020
€m Health insurance
Insurance with profit
participation
Index linked and unit-linked insurance
Other life insurance
Total
Premiums earned (net of reinsurance) 90 1 5,589 159 5,839
Claims (net of reinsurance) (67) (22) (4,448) (171) (4,708)
Change in technical provisions (net of reinsurance) (40) 3 (2,210) (25) (2,273)
Expenses (28) - (263) (123) (414)
Investment return 9 (4) 1,332 288 1,625
Underwriting result (37) (22) 1 128 69
Note: Over 90% of the gross written premiums are undertaken in Ireland.
2019
€m Health insurance
Insurance with profit
participation
Index linked and unit-linked insurance
Other life insurance
Total
Premiums earned (net of reinsurance) 101 2 6,087 253 6,443
Claims (net of reinsurance) (66) (14) (4,110) (187) (4,377)
Change in technical provisions (net of reinsurance) (49) 2 (7,574) (240) (7,861)
Expenses (29) - (258) (128) (415)
Investment return 9 11 5,919 365 6,304
Underwriting result (34) 1 64 63 94
Note: Over 90% of the gross written premiums are undertaken in Ireland.
The different lines of business shown in the tables, and the factors which influence their underwriting performance, are explained as follows:
(1) Health insurance: This line of business includes group and individual income protection business and group stand-alone serious illness business. The underwriting performance is influenced by:
• changes in our morbidity experience
• new business being written in the period.
(2) Insurance with profit participation: This line of business includes products that offer policyholders bonuses which reflect the fund’s experience on investment returns, mortality rates and expenses. The underwriting performance is influenced by:
• changes in investment markets
• mortality rates
• lapse experience
• payouts to policyholders.
Almost all the profits (where applicable) for this line of business are paid out to policyholders, so the profits are offset by an increase in the value of the non-controlling interest in the financial statements.
(3) Index-linked and unit-linked insurance: This line of business includes unit-linked products, where the unit-linked policyholders bear all the financial risks associated with the related assets. Examples of these products are defined contribution pensions and savings and investment plans. For a small proportion of these unit-linked products, we offer guarantees that protect policyholders from market falls in the underlying investments. The underwriting performance is mainly influenced by:
• management charges
• other fee income from the unit-linked business
• mortality, morbidity and lapse experience for unit-linked protection contracts.
(4) Other life insurance: This line of business includes our life assurance products such as term assurance products and annuities. The underwriting performance is influenced by:
12

• changes in mortality, morbidity and lapse experience
• new business being written in the period.
The material year-on-year variances in the underwriting result by product line are:
• Other Life Insurance: Increase in 2020 due to the year-on-year impact of interest rates on technical provisions offset by the impact of investment experience.
• Insurance with profit participation and Index-linked and unit-linked insurance: Decrease in 2020 mainly driven by strong equity market performance during 2019 which was not repeated in 2020 and differences in claims year-on-year.
RECONCILIATION TO IFRS PROFITSThe table below shows the reconciliation between the underwriting result and IFRS profits.
€m 2020 2019
Underwriting result 69 94
Other income5 26 18
Tax (14) (15)
Profit as per IFRS financial statements 81 97
Attributable to the non-controlling interest6 (16) -
Attributable to the Shareholder 97 97
5 Other income includes return on shareholder assets, management fees and other items.
6 Profit/(loss) attributable to the non-controlling interest includes the underwriting result of -€17m (2019: €2m) and a tax impact of €1m (2019: -€2m).
We made a profit of €97m after tax for the financial year (2019: €97m). This excludes losses of -€16m (2019: losses -€0m), which is attributed to the participating funds. The profit for the current financial year is driven by favourable mortality and morbidity experience, unfavourable investment experience, and basis changes related to insurance contract liabilities.
A.3.1 Non-Linked Investments
The make-up of the asset classes in the portfolio remained largely unchanged throughout the year. The tables below show our investment income and investment performance during each year for each class:
2020
Asset Class €m Dividends Interest Rent Total Income Gains and Losses
Equity and Unit Trusts 1 - - 1 (2)
Fixed Income - 67 - 67 230
Derivatives - (1) - (1) (1)
Mortgages - 2 - 2 1
Property - - 4 4 (7)
Cash and Deposits - - - - (3)
Grand Total 1 68 4 73 218
A.3 INVESTMENT PERFORMANCE
13

A.3.2 Unit-Linked InvestmentsThe make-up of the asset classes in the portfolio remained largely unchanged throughout the year. The tables below show our investment income and investment performance during each year for each class:
2020
Asset Class €m Dividends Interest Rent Total Income Gains and Losses
Equity and Unit Trusts 413 - - 413 240
Fixed Income - 170 - 170 403
Derivatives - - - - 275
Property - - 125 125 (199)
Cash and Deposits - (27) - (27) (47)
Grand Total 413 143 125 681 672
2019
Asset Class €m Dividends Interest Rent Total Income Gains and Losses
Equity and Unit Trusts 482 - - 482 4,757
Fixed Income - 185 - 185 611
Derivatives - - - - (231)
Property - - 131 131 13
Cash and Deposits - (16) - (16) 8
Grand Total 482 169 131 782 5,158
2019
Asset Class €m Dividends Interest Rent Total Income Gains and Losses
Equity and Unit Trusts 1 - - 1 8
Fixed Income - 76 - 76 330
Derivatives - (1) - (1) (44)
Mortgages - 2 - 2 6
Property - - 4 4 -
Cash and Deposits - - - - 1
Grand Total 1 77 4 82 301
INVESTMENT INCOMEOur net investment income from non-linked funds was €73m in 2020 (2019: €82m), which consists mainly of income from bond products of €68m (2019: €77m). This generated more than 92% (2019: 93%) of our overall investment income, with bonds achieving a rate of return of 1%.
INVESTMENT EXPENSESOur non-linked investment managers are Irish Life Investment Managers Limited and Canada Life Asset Management Limited, who charge an arm’s length fee based on assets under management.
INVESTMENT PERFORMANCEEurozone bonds rose through 2020 with the Eurozone 5year+ sovereign bond benchmark rising 7.4%. Core bond yields fell to new all-time lows in early March 2020 due to the impact of COVID-19, with the German 10 year yield falling to -0.91%. Yields rose from these lows as growth began to recover through the middle of the year while an increased supply of bonds to fund fiscal spending also weighed on yields. However, additional ECB asset purchases limited the upside in yields, with the German 10 year yield ending the year at -0.57%. Peripheral spreads were volatile, particularly in the early part of 2020, but narrowed over the course of the year on the back of large scale ECB bond buying and the inclusion of fiscal transfers from core to peripheral countries in the EU’s Recovery Fund, which was positive for peripheral bonds. Italian 10 year spreads against German equivalents ended the year at 111bps while Spanish spreads were at 61bps.
14

INVESTMENT INCOMEOur net investment income from unit-linked funds was €681m in 2020 (2019: €782m) which consists mainly of:
• dividend income of €413m (2019: €482m) which generated 61% (2019: 62%) of our overall investment income.
• income from bond products of €170m (2019: €185m) which generated more than 25% (2019: 24%) of our overall investment income.
• rental returns from properties of €125m (2019: €131m) which generated more than 18% (2019: 17%) of our overall investment income, from a portfolio of properties held in Ireland and the U.K.
Unit-linked funds earned management fee income of €269m (2019: €267m).
INVESTMENT EXPENSESOur unit-linked investment managers are Irish Life Investment Managers Limited and Setanta Asset Management Limited, who charge an arm’s length fee based on assets under management.
INVESTMENT PERFORMANCEHaving begun the year on a firm footing following a trade agreement between the US and China, the global economy suddenly fell into recession in the first quarter due to the outbreak of COVID-19. As restrictions were put in place across the world to contain the spread of the virus, activity ground to a halt. The global economy experienced one of the quickest and most severe recessions ever seen as growth contracted at an annualised rate of almost 20% in Q2. The recession however also proved to be one of the shortest ever witnessed, essentially spanning just two months through March and April with a recovery beginning in May as economies began to reopen from lockdowns as case numbers began to decline. The recovery was boosted by unprecedented levels of fiscal and monetary support from global authorities to combat the impact of COVID-19 on economies. With significant levels of pent up demand following lockdowns, the global economy surged at an historic annualised rate of almost 38% in Q3. Growth however slowed again in Q4 as fiscal supports in the US faded and restrictions were reintroduced in many regions on the back of a second wave of COVID-19. For the year, the global economy is estimated to have contracted by about 3.6% with China being the only major region to generate positive growth in 2020 as it emerged from the crisis ahead of others.
Equity markets started the year positively, reaching new all-time highs as growth seemed set to surprise to the upside as initial economic releases remained strong and Central Banks continued to maintain accommodative policy stances. Equities however entered a bear market, falling over 32% in just five weeks from the middle of February due to concerns over the potential economic fallout from the COVID-19 outbreak. Having bottomed
in late March, equity markets rallied sharply, supported by the fiscal and monetary stimulus measures announced by global authorities. The large levels of liquidity provided by Central Banks were a key contributor to the rebound in equity markets. The faster than anticipated reopening of economies and stronger than expected recovery in growth also supported markets as did medical advancements in terms of treatments and potential vaccines for the virus. By year end equity markets had recovered to reach new all-time highs. In November the result of the US Presidential election helped reduce political uncertainty while confirmation of several successful COVID-19 vaccine trials and the start of the rollout in December also boosted hopes that economic activity could recover further in 2021. Commitments by global Central Banks that monetary policy would remain relatively loose for the foreseeable future also contributed to the move to new highs in the latter part of the year. Overall, global equities rose 14.8% in local currency terms or 7.2% in Euro terms in 2020.
Eurozone bonds rose through 2020 with the Eurozone 5year+ sovereign bond benchmark rising 7.4%. Core bond yields fell to new all-time lows in early March 2020 due to the impact of COVID-19, with the German 10 year yield falling to -0.91%. Yields rose from these lows as growth began to recover through the middle of the year while an increased supply of bonds to fund fiscal spending also weighed on yields. However, additional ECB asset purchases limited the upside in yields, with the German 10 year yield ending the year at -0.57%. Peripheral spreads were volatile, particularly in the early part of 2020, but narrowed over the course of the year on the back of large scale ECB bond buying and the inclusion of fiscal transfers from core to peripheral countries in the EU’s Recovery Fund, which was positive for peripheral bonds. Italian 10 year spreads against German equivalents ended the year at 111bps while Spanish spreads were at 61bps.
The Irish commercial property market produced negative returns of -1.4% following the onset of the recession. While the office and industrial sectors proved to be relatively resilient during the year, the retail sector was weak as retail sales were impacted by lockdowns.
The Irish economy performed relatively well in 2020, with GDP estimated to have grown around 4% despite the negative impact from COVID-19. This however masks a two speed economy where strength in the multinational and trade sectors, centred on pharmaceuticals and technology, offset a contraction in domestic demand with both consumption and investment declining last year. As elsewhere, fiscal stimulus measures provided significant support to the Irish economy, particularly through the income subsidy schemes which helped offset the negative hit to the labour market. Brexit related uncertainty also acted as a drag through the year although the eventual agreement of a trade deal between the EU and UK at year end avoided a worst case outcome of a ‘no deal’ exit which would have had significant negative repercussions for Ireland.
15

A.3.3 Other information
At the end of 2020 we did not hold investments in off balance sheet securitisation vehicles.
A €2m (2019: €1m gain) pre-tax loss was recognised in the Statement of Comprehensive Income when we revalued owner occupied property.
We also recognised a €20m (2019: €4m loss) pre-tax actuarial loss on our defined benefit pension scheme. This was primarily due to a reduction in the discount rate used to value the future pension liabilities.
A.4 PERFORMANCE OF OTHER ACTIVITIESThere are no items to note.
A.5 ANY OTHER INFORMATIONThere are no items to note
16

B. SYSTEM OF GOVERNANCE
B.1.1 Governance structure
The Board of Directors of ILA is responsible for the governance and oversight of all of ILA’s operations and risks.
The company has two operating divisions: Retail Life and Corporate Life. Retail Life serves individual customers and some small group business. Corporate Life serves larger group business, including corporate customers and affinity groups with a large number of members. You can find more detail in section A (Business and Performance).
Each division has an executive management team, led by a managing director who reports to the Chief Operating Officer of ILA, in charge of day-to-day activities. There is also an ILA level Executive Committee. Each division develops business plans, strategies and annual budgets, which consolidate into a total position for ILA. The divisional managing directors and their executive management teams are responsible for meeting the targets set for each division.
Control functions work at an ILA level. They oversee the primary operating divisions and all other business activities. IT and HR services are provided on a campus wide basis to ILA and other Irish companies in our group.
Business and risk issues can be reported and escalated from the bottom up. Communication and guidance on policy and decisions happens from the top down.
The committees critical to the governance structure are set out below. A number of the committees are Board level committees, and their members are Directors of ILA. The other committees are executive level, and are made up of senior managers. The executive committees help the Board committees meet their objectives. Control functions support the executive committees and the Board Risk and Audit Committees. These are discussed in section B.1.5 (Key Functions).
Notes: *The Remuneration Committee and Nomination and Governance Committee are constituted at the level of the Irish Life Group, ILA's parent company, and their membership includes some non-ILA directors. ILA relies on these committees, as permitted under the Corporate Governance Code.
**The Executive Investment Management Committee also reports to the Board.
This section describes the structures, systems and processes we have put in place to direct and control our operations and risks so we can balance the interests of our many stakeholders.
B.1 GOVERNANCE STRUCTURE
Board of Directors
Executive Risk
Management Committee
**Executive Investment
Management Committee
Operational Risk
Committee
Compliance Management Committee
Board Audit Committee
Board Risk Committee
*BoardRemuneration
Committee
*BoardNomination
and Governance Committee
17

Main function Main responsibilities
Board of Directors Lead and control ILA. • Makes all material strategic decisions.
• Establishes an organisational structure with clearly defined authority levels and reporting responsibilities.
• Agrees the rules on management authority levels and what the Board should be notified of.
Board Risk Committee Responsible for ILA's risk governance and oversight of current risk exposures and current and future risk strategy.
• Reviews compliance within the Enterprise Risk Management (ERM) framework and advises the Board on risk oversight.
• Reviews the company’s Risk Appetite Framework and Risk Strategy.
• Approves the operation of the Risk and Compliance functions, making sure they have the resources, authority and independence to meet their responsibilities.
• Recommends changes to the risk and compliance management frameworks and policies.
• Promotes a company culture that supports risk management.
• Develops and approves responses when a risk exposure exceeds appetite.
Board Audit Committee
Act as an independent link between the Board and ILA’s external auditors.
• Recommends and monitors the choice of external auditors.
• Reviews the scope of the external audit and reviews the independence of the external auditors.
• Reviews the company’s annual report and financial statements, other public reports and reports we send to the regulatory authorities.
• Reviews the effectiveness of internal control systems.
• Manages the risks of financial reporting by reviewing significant financial reports.
• Reviews financial statements for ILA and Solvency II Pillar I and Pillar III requirements.
• Reports to the Board on financial statements it needs to approve.
• Monitors the Actuarial, Internal Audit and Finance functions. Ensures they have the resources, authority and independence to meet their responsibilities.
Board Remuneration Committee
Develop ILA’s remuneration policy.
• Decides, implements and operates our remuneration policies.
Board Nomination and Governance Committee
Recommend Board and Board Committee appointments to ILA. Keep the governance arrangements for ILA under review.
• Succession plans for the Board.
• Makes sure the Board and sub-committees have the right skills and resources.
• Arranges training for new directors and ongoing training for all directors.
• Oversee ILA's Corporate Governance.
Executive Risk Management Committee (ERMC)
Manage all ILA’s material risks, apart from operational and legal/regulatory compliance risks.
• Oversees risk exposures and recommends suitable risk policy (including insurance risks, market risk, credit risks and liquidity risk).
• Monitors capital and how assets and liabilities are matched.
• Reviews new product developments.
• Approves significant transactions.
• Monitors and reviews risk experience.
• Reviews and recommends material risk management matters, including risk mitigations.
18

Main function Main responsibilities
Executive Investment Management Committee (EIC)
Manage and oversee all investments undertaken by ILA.
• Reviews and recommends the ILA Investment Policy and monitors its implementation.
• Monitors and oversees the use of derivatives and stock lending activities.
• Oversees the performance of, and recommends the appointment or removal of investment managers and custodians.
• Monitors the operation of unit-linked funds, including the range of investment options available to policyholders.
• Ensures the management of the non-linked portfolio is aligned to ILA's risk appetite.
Operational Risk Committee (ORC)
Oversee and monitor ILA’s operational risk including conduct risk.
• Acts as a forum for prioritising and reviewing existing and emerging material operational risks.
• Designs and monitors key risk indicators attached to these risks.
• Is supported by two Operational Risk Committees - one for each of ILA’s operating divisions.
Compliance Management Committee (CMC)
Establish and oversee regulatory and compliance policies and standards and monitor compliance within the Company.
• Recommends appropriate regulatory and compliance policies and standards.
• Promote a risk culture that stresses integrity and effective compliance risk management throughout the company
• Monitors compliance across the company.
• Monitors the company's regulatory relationships.
• Keeps under review the company's consumer protection (conduct risk) compliance frameworks.
The following table shows the members of our Board and Board Committees at 31 December 2020:
Members Position Board Board Audit Committee
Board Risk Committee
Board Remuneration
Committee
Board Nomination
and Governance Committee
Mr Stefan Kristjanson Chairman of the Board and non-executive director Y
Mr Kilian Colleran Independent non-executive director Y Y Y
Ms Brenda Dunne Independent non-executive director Y Y Y Y Y
Mr Brian Forrester Non-executive director and Chairman of the risk committee Y Y Y Y Y
Mr Cecil Hayes Independent non-executive director and Chairman of the audit committee Y Y Y Y Y
Ms Rose McHugh Independent non-executive director Y Y Y Y Y
Mr Declan Bolger Chief Executive Officer and executive director Y
Mr David Killeen Finance Director and executive director Y
Company secretary is Ms Maria-Teresa Kelly
Mr Kristjanson was appointed Chairman of the Board on 8 April 2020, Mr Declan Bolger was appointed Chief Executive Officer on 15 June 2020, Ms Maria-Teresa Kelly was appointed Company Secretary on 29 May 2020. Mr Arshil Jamal resigned as Director and Chairman of the Board on 8 April 2020, Mr David Harney resigned as Chief Executive Officer on 15 June 2020 and as Director on 11 September 2020, Mr David Boyle resigned as Company Secretary on 29 May 2020.
19
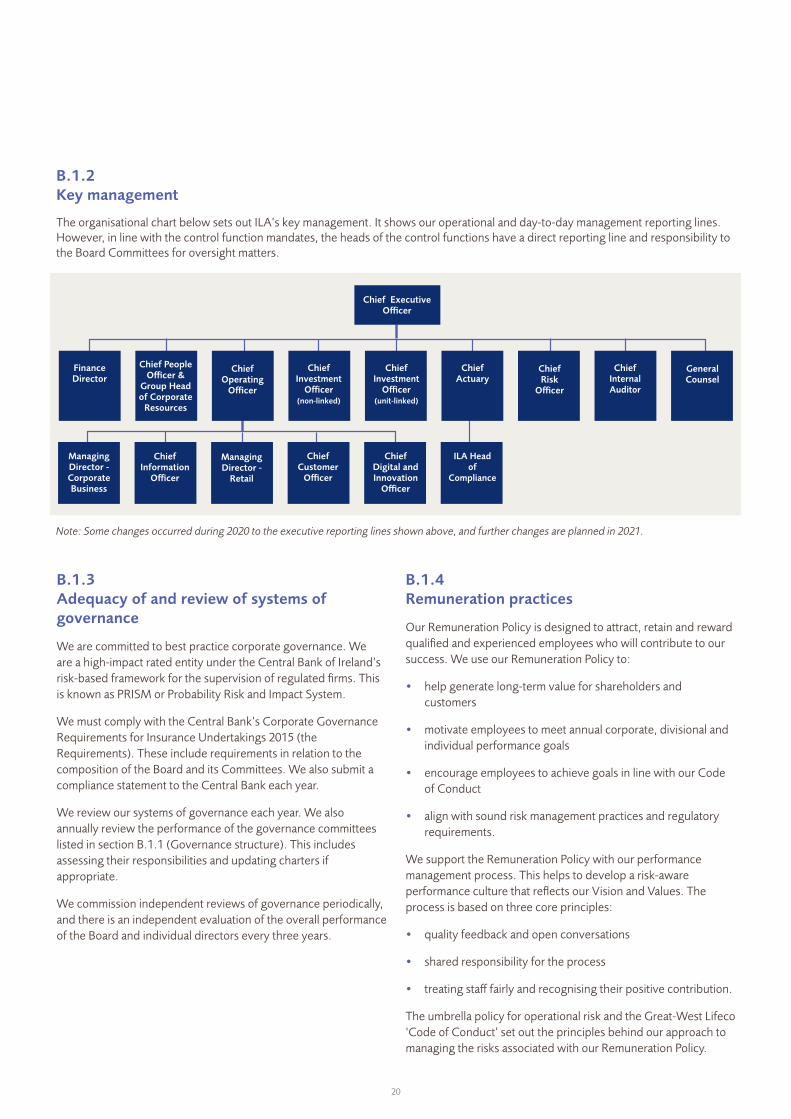
B.1.2 Key management
The organisational chart below sets out ILA’s key management. It shows our operational and day-to-day management reporting lines. However, in line with the control function mandates, the heads of the control functions have a direct reporting line and responsibility to the Board Committees for oversight matters.
B.1.3 Adequacy of and review of systems of governance
We are committed to best practice corporate governance. We are a high-impact rated entity under the Central Bank of Ireland’s risk-based framework for the supervision of regulated firms. This is known as PRISM or Probability Risk and Impact System.
We must comply with the Central Bank’s Corporate Governance Requirements for Insurance Undertakings 2015 (the Requirements). These include requirements in relation to the composition of the Board and its Committees. We also submit a compliance statement to the Central Bank each year.
We review our systems of governance each year. We also annually review the performance of the governance committees listed in section B.1.1 (Governance structure). This includes assessing their responsibilities and updating charters if appropriate.
We commission independent reviews of governance periodically, and there is an independent evaluation of the overall performance of the Board and individual directors every three years.
B.1.4 Remuneration practices
Our Remuneration Policy is designed to attract, retain and reward qualified and experienced employees who will contribute to our success. We use our Remuneration Policy to:
• help generate long-term value for shareholders and customers
• motivate employees to meet annual corporate, divisional and individual performance goals
• encourage employees to achieve goals in line with our Code of Conduct
• align with sound risk management practices and regulatory requirements.
We support the Remuneration Policy with our performance management process. This helps to develop a risk-aware performance culture that reflects our Vision and Values. The process is based on three core principles:
• quality feedback and open conversations
• shared responsibility for the process
• treating staff fairly and recognising their positive contribution.
The umbrella policy for operational risk and the Great-West Lifeco ‘Code of Conduct’ set out the principles behind our approach to managing the risks associated with our Remuneration Policy.
Note: Some changes occurred during 2020 to the executive reporting lines shown above, and further changes are planned in 2021.
Chief ExecutiveOfficer
FinanceDirector
Managing Director - Corporate Business
Chief People Officer &
Group Head of Corporate
Resources
Chief Information
Officer
Chief Operating
Officer
Managing Director -
Retail
Chief Investment
Officer (non-linked)
Chief Customer
Officer
Chief Investment
Officer (unit-linked)
Chief Digital and Innovation
Officer
Chief Actuary
ILA Head of
Compliance
Chief Risk
Officer
Chief Internal Auditor
General Counsel
20
The principles state that remuneration programmes should:
• promote sound and effective risk management and align with the risk strategy and preferences approved by the Board
• be consistent with business and risk strategy and shareholders’ long-term interests
• be consistent with the companies approach to the integration of sustainability risks in the investment decision making and investment advice process
• be communicated to all staff
• be competitive and fair
• attract, reward and motivate staff to deliver on objectives and achieve success
• be underpinned by clear, effective and transparent remuneration governance.
The Remuneration Policy is also designed to meet our regulatory requirements. We identified and assessed the applicable Solvency II principles around remuneration. Then we set up and documented the following compliance arrangements:
• establishing a Board Remuneration Committee to help the Board carry out its remuneration-related roles and responsibilities; the Remuneration Committee, based on data provided, makes sure we comply with the Remuneration Policy each year
• making sure there are specific remuneration arrangements (programmes) for the Board, senior leaders and the key control functions
• benchmarking base salaries against market rate for the role as defined in independent salary surveys
• assessing all bonus schemes against both personal and financial targets (the financial targets for senior oversight roles are not significantly linked to company performance)
• auditing and risk assessing the Remuneration Policy
• publishing our Remuneration Policy on our employee intranet site.
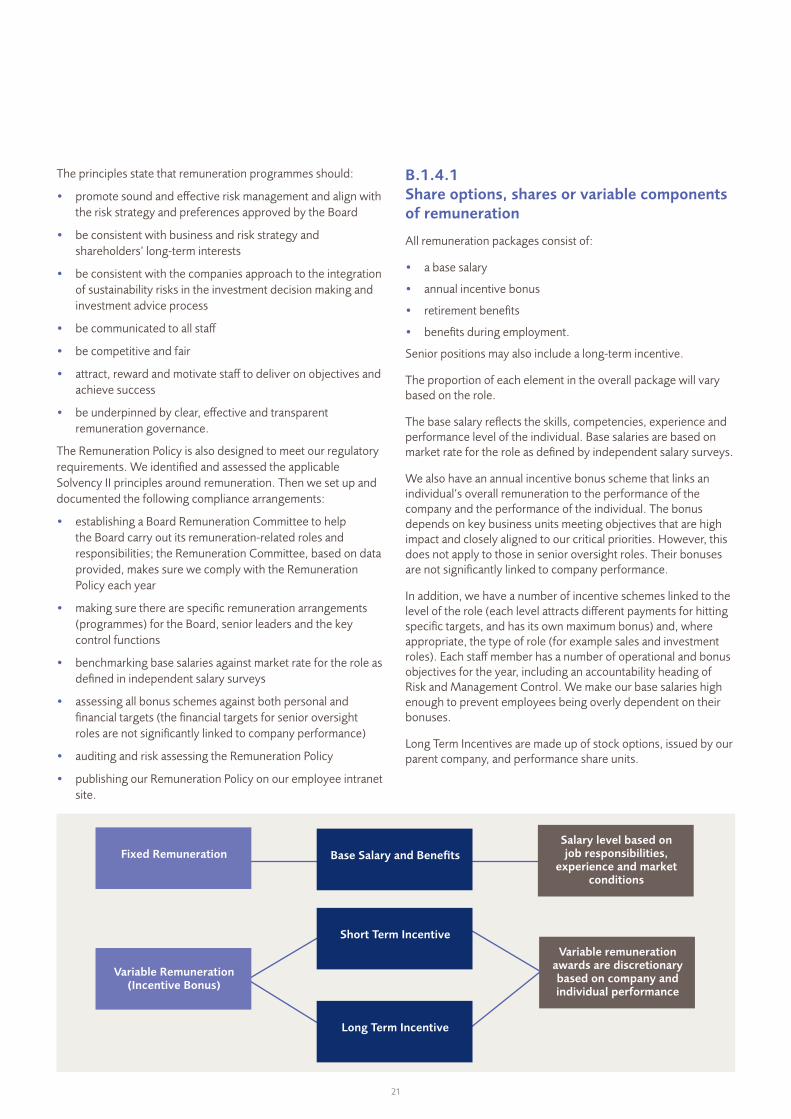
B.1.4.1 Share options, shares or variable components of remuneration
All remuneration packages consist of:
• a base salary
• annual incentive bonus
• retirement benefits
• benefits during employment.
Senior positions may also include a long-term incentive.
The proportion of each element in the overall package will vary based on the role.
The base salary reflects the skills, competencies, experience and performance level of the individual. Base salaries are based on market rate for the role as defined by independent salary surveys.
We also have an annual incentive bonus scheme that links an individual’s overall remuneration to the performance of the company and the performance of the individual. The bonus depends on key business units meeting objectives that are high impact and closely aligned to our critical priorities. However, this does not apply to those in senior oversight roles. Their bonuses are not significantly linked to company performance.
In addition, we have a number of incentive schemes linked to the level of the role (each level attracts different payments for hitting specific targets, and has its own maximum bonus) and, where appropriate, the type of role (for example sales and investment roles). Each staff member has a number of operational and bonus objectives for the year, including an accountability heading of Risk and Management Control. We make our base salaries high enough to prevent employees being overly dependent on their bonuses.
Long Term Incentives are made up of stock options, issued by our parent company, and performance share units.
Base Salary and BenefitsFixed Remuneration
Variable Remuneration (Incentive Bonus)
Short Term Incentive
Salary level based on job responsibilities,
experience and market conditions
Variable remuneration awards are discretionary based on company and individual performance
Long Term Incentive
21
B.1.4.2 Supplementary pension or early retirement schemes for the members of the management body and other key functions
Our Remuneration Policy does not include any supplementary pension or early retirement schemes for Board members or other key function holders. We offer enhanced early retirement pensions to all members of our Irish Life Group defined benefit scheme who are aged over 60 and have completed 40 years’ service.
The company has closed its defined benefit pension scheme to future accrual from 30 June 2018 and existing members have joined a company defined contribution plan for future service pension provision beyond this date. Members have retained the benefits they have accrued up to the date of closure of the scheme and these benefits are still linked to final salary.
B.1.4.3 Material transactions during the reporting period
There were no material transactions with senior ILA managers in the period, apart from transactions linked to their remuneration and transactions relating to insurance policies conducted on normal commercial terms.
B.1.5 Key functions
In line with the European Regulator’s Guidelines on System of Governance, (EIOPA-BoS-14/253), we consider key functions to be Risk Management, Compliance, Actuarial and Internal Audit. We also view Finance as a key function. Collectively, we refer to these five functions as ‘control functions’.
Control functions help the Board to manage ILA effectively. Each one reports to either the Board Audit or Risk Committee.
The Board Committee approves the mandate, resources and plans for the control functions annually.
The control functions report to each meeting of the Board Committees. The head of each control function has a direct line of communication with the relevant committee Chair.
Each control function is staffed by professionals with appropriate skills and experience, plus a deep knowledge of our business.
RISK
OverviewThis independent second-line function is separate from business operations and looks at them objectively. It has authority across all operating divisions, and access to all ILA records, information and personnel needed to carry out its responsibilities and follow up on issues. In addition, the Chief Risk Officer (CRO) has the right to access, and to attend meetings of, the Board Risk Committee.
The CRO reports to the Board Risk Committee and the Irish Life Group CRO on oversight matters and to the CEO on operational matters and day-to-day management.
The CRO updates each meeting of the Board Risk Committee, including producing a quarterly CRO Report.
The Risk Function's operational risk responsibilities are supported by operational risk resources within each business unit.
Main responsibilitiesThese are outlined in the Risk Function Mandate, which is set by the Board Risk Committee. Encompassing independent oversight of all forms of risk across all our business divisions, the Risk Function's responsibilities include:
• management and oversight of the Risk Appetite Framework
• monitoring and assessing risk culture
• setting risk principles
• maintaining risk policies
• risk governance
• carrying out risk processes including
– risk identification, assessment and prioritisation
– risk measurement and limit setting
– risk management, responses and mitigation strategies
– risk monitoring and reporting
– escalation, compliance, independent assurance and oversight at an aggregate and disaggregate level
• ensuring that risk infrastructure is effective
• Own Risk and Solvency Assessment (ORSA) process
• taking part in management committees.
GovernanceThe Board Risk Committee reviews the Risk Function Mandate annually, and makes sure the Risk Function complies with it. The Committee also assesses the Risk Function’s performance each year.
22

ACTUARIAL
OverviewThis independent second-line function is led by the Chief Actuary, who reports directly to the Board Audit Committee and to the Great-West Lifeco Chief Actuary for oversight matters. The Chief Actuary is responsible to the CEO for operational and day-to-day management.
The Actuarial Function is made up of:
• the actuarial reporting teams in each of our two business divisions - these teams carry out most of the actuarial calculations
• the Group valuation and reporting team which reviews, oversees and consolidates the results
• the actuarial development team which develops the actuarial models, processes and mechanisms behind the actuarial calculations.
• the IFRS17 team which is developing reporting capability for 2023.
Main responsibilitiesThese are outlined in the Chief Actuary Mandate, which is set by the Board Audit Committee. They include:
• calculating the value of our liabilities in relation to our insurance policies and reporting on this to the Board in line with regulatory requirements
• contributing to the effective implementation of our risk management system
• providing oversight of product development, pricing and reinsurance activities
• reviewing Policyholders’ Reasonable Expectations (PRE) on an ongoing basis and reporting to the Board on the Head of Actuarial Function’s interpretation of PRE
• calculating the value of our liabilities in relation to our life insurance business for inclusion in our financial statements
• providing an opinion to the Board on our underwriting and reinsurance arrangements and on the ORSA process
• providing support for actuarial activities within Irish Life Health.
GovernanceThe Board Audit Committee reviews the Chief Actuary Mandate annually, and makes sure the Actuarial Function complies with it. The Committee also assesses the Actuarial Function’s performance each year.
COMPLIANCEOverviewThis independent second-line function is separate from business operations and looks at them objectively. It ensures that mechanisms are in place to comply with regulations by assessing, monitoring and testing the effectiveness of our regulatory compliance management controls across the company. It is made up of compliance units embedded in Retail Life and Corporate Life plus a Group compliance unit.
It is led by the Chief Compliance Officer - Ireland (CCO), who is the statutory compliance officer for the company. The CCO reports directly to the Board Risk Committee on the oversight of compliance and has a dual reporting line to the Global Chief Compliance Officer and to the ILA Chief Actuary.
Main responsibilitiesThese are outlined in the Compliance Function Mandate which is reviewed and approved annually by the Board Risk Committee.
They include:
• establishing and maintaining a sound compliance framework for the independent oversight and management of our regulatory compliance risks including those relating to conduct risk and the fair treatment of customers
• providing advice and guidance to the business units and group functions on regulatory developments and other compliance matters, including advice and oversight on new and changing regulatory requirements
• promoting a risk culture that stresses integrity and effective compliance risk management throughout the company
• carrying out risk-based monitoring to assess our compliance requirements and procedures and how well we follow them
• making sure all directors, officers and employees acknowledge our Code of Conduct each year
• preparing the compliance plan and putting it into action
• co-ordinating our relationships with regulators
• reporting each quarter to the Board Risk Committee and each month to senior management on key regulatory matters
• training our staff and directors on relevant compliance matters.
GovernanceThe Board Risk Committee reviews the Compliance Function Mandate annually, and makes sure the Compliance Function complies with it. The Committee also assesses the Compliance Function’s performance each year.
23

FINANCE
OverviewThis function is led by the Finance Director (FD) who reports directly to the Board Audit Committee and the Great-West Lifeco European Chief Financial officer on oversight matters. The FD is responsible to the CEO for operational and day-to-day management.
It is made up of a central Group Financial Control (GF) team and finance teams in each of our two business divisions.
The divisional finance teams are our first line of defence in the Finance Function. They manage the financial control and reporting needs of their business lines, giving the GF team defined data through a centrally controlled general ledger and reporting platform.
The GF team are our second line of defence in the Finance Function. They review and oversee this data before adopting it for financial and regulatory reporting and performance management. The GF team, through the FD, give the Board and Board Audit Committee periodic financial and performance updates along with detail that helps the Board assess and approve the annual statutory financial statements and regulatory returns.
Main responsibilitiesThese include:
• financial control and governance
• reporting statutory and regulatory financial information, including preparing the financial statements
• budgetary, cost and financial management.
GovernanceThe Board Audit Committee reviews the Finance Director's Mandate annually and makes sure the Finance Director is complying with it. The Committee also assesses the Finance Director's performance each year.
INTERNAL AUDIT
OverviewThe Internal Audit function is provided by Group Internal Audit, and is independent of our business management activities. Internal auditors have no operational responsibility or authority over any of the activities audited.
The Chief Internal Auditor (CIA) reports functionally to the Chief Internal Auditor for Great-West Lifeco, and to the Board Audit Committee. The CIA reports administratively to the CEO.
Main responsibilitiesThe CIA is required to:
• Submit a risk-based internal audit plan to the Board Audit Committee on an annual basis;
• Ensure all audits on the internal audit plan are appropriately executed, and audit results (with applicable conclusions and recommendations) are communicated to appropriate parties;
• Follow up on audit findings and corrective actions, and report periodically to senior management and the Board Audit Committee on progress; and,
• Provide an overall opinion on Governance, Risk Management and Control to the Board Audit Committee on a regular basis.
GovernanceThe Board Audit Committee:
• Annually reviews and approves the mandate of the CIA;
• Reviews and recommends the appointment/removal of the CIA to the Board;
• Annually assesses the performance of the CIA and the effectiveness of the Internal Audit function; and,
• Annually reviews and approves the function's organisational and reporting structure, budget and resources.
The CIA maintains direct and unrestricted access to the Board Audit Committee, and meets regularly with the Chair of the Board Audit Committee, without other managers present.
The CIA maintains a quality assurance programme to drive continuous improvement and ensure conformance with the Institute of Internal Auditor’s (IIA) Standards and Code of Ethics. The CIA reports the results of this work to the Board Audit Committee every year.
24

B.2.1 Policies and processes in place to meet fit and proper requirements
We are committed to meeting all our fit and proper obligations. We ensure that everyone involved in this has the necessary qualifications, knowledge, skills and experience to carry out their role (fitness assessment); and is honest, ethical, financially sound and acts with integrity (probity assessment).
There is a job profile for all such roles. Typically, the job profile sets out the accountabilities for the job, the level of knowledge, skills and experience needed to do it, and the essential behavioural competencies.
We have documented HR processes for recruiting into roles that must meet fitness and probity requirements. If we become aware of any concerns about fitness and probity of someone in a role subject to the Fit and Proper Policy, we will investigate and take appropriate action as outlined in the Employee Relations Escalation Process.
We also have a Fit and Proper Policy which the ILA Board reviews and approves annually.
The Fit and Proper Policy sets out the process for the fit and proper assessments that determine a person’s fitness, probity and financial soundness.
Before we appoint anyone who effectively runs ILA or has another key function, we carry out due diligence to make sure that person is fit and proper for the role. The due diligence checks for assessing whether a person is fit and proper and is financially sound are set out in the Policy. These checks align to the Central Bank of Ireland’s Guidance on Fitness and Probity Standards as follows:
• evidence of compliance with Minimum Competency Code (where applicable)
• evidence of professional qualifications where relevant
• evidence of Continued Professional Development (CPD) where relevant
• record of interview and application
• reference checks
• record of previous experience
• record of experience gained outside of Ireland
• confirmation of directorships held and
• record of other employments.
The due diligence around probity and financial soundness checks takes the form of self-certification. We ask potential employees to complete a questionnaire on their probity and financial soundness. We then carry out independent directorship, judgements, negative news and regulatory sanction searches.
Most of the applicable roles are Pre-Approval Controlled Functions (PCFs) as defined in the Central Bank Reform Act 2010 (sections 20 and 22) Regulations. In addition to our internal due diligence, before making appointments into these functions, they are pre-approved by the Central Bank.
All those in a fit and proper role must reconfirm their adherence to the Fit and Proper standards and requirements every year. If we become aware of any concerns about the fitness and probity of someone in a role subject to the Fit and Proper Policy, we will investigate and take appropriate action, without delay. We will also notify the Central Bank of any actions taken, where a negative conclusion to an investigation has been reached.
B.2 FIT AND PROPER REQUIREMENTS
B.3 RISK MANAGEMENT SYSTEM INCLUDING THE OWN RISK AND SOLVENCY ASSESSMENT The Board manages all risks across the organisation, and has put in place a comprehensive risk management framework.
The framework includes a documented Enterprise Risk Management Policy. This establishes responsibilities for all key components of the risk management system, including the Board and Executive Risk Committees (see section B.1.1 (Governance Structure)). It also details the three lines of defence model we use, and establishes responsibilities and requirements for the first, second and third lines of defence.
The Board has also generated a Risk Appetite Statement and Risk Strategy document, which outline our appetite for each type of risk and our strategy for accepting, managing and mitigating
risks. A further suite of risk policies details the management strategies, objectives, processes, and reporting procedures and requirements for all of the risks we accept.
The Chief Risk Officer (CRO) has primary responsibility for implementing the risk management system. The Risk Function, under the leadership of the CRO, has created processes to make sure we comply with risk policies. It confirms this compliance each year to the Board Risk Committee as part of the annual review of all risk policies. The Risk Function also monitors and reports on all risks. This includes reporting risk exposures and compliance with risk limits to the Board and executive risk committees every quarter.
25

Board of Directors
FIRST LINE
Primary risk-taking and management responsibility and accountability
Investment and business divisions
SECOND LINE
Independent oversight of risk taking
Control functions
Risk, Compliance and Actuarial; supported by Finance
THIRD LINE
Independent validation
Internal Audit
There are more details of the key components of the risk management framework below. You can find greater detail on our risk profile and risk management strategies, objectives, processes and reporting procedures in section C (Risk Profile).
B.3.1 Enterprise Risk Management framework
Our Enterprise Risk Management (ERM) framework makes sure we can identify and manage all of our material risks, and that we can implement business strategy across the company while fully understanding the risks involved.
There are three broad ways in which each risk type can be treated: capitalisation (hold capital in respect of the risk), management and mitigation. We review the characteristics of each risk so we can identify the appropriate treatment. These reviews weigh up the:
• current and prospective size and complexity of each risk
• potential impact of the risk
• transferability of the risk
• market standard treatment of the risk.
The Irish Life Risk Appetite Framework and Risk Strategy documents set out our overall strategy for each type and level of risk we will assume. Our risk appetite may change as our resources and strategic objectives evolve.
We embed the risk appetite and tolerance for specific risks in the business through risk policies. These set out operational procedures, controls and limit structures that establish a risk management framework for each risk type. Together, our risk policies comprise our Risk Policy Framework.
B.3.2 Risk management model – three lines of defence
Risk taking is fundamental to a financial institution’s business profile. Prudent risk management, limitation and mitigation are therefore integral to our governance structure.
We operate the ‘three lines of defence’ risk model shown in the diagram below.
THE FIRST LINE OF DEFENCE
This is the business divisions and our investment managers. As the ultimate owners of the risk, they are primarily responsible for day-to-day ERM operations within the established ERM Framework. They identify, measure, manage, monitor and report risk.
Business divisions are accountable for the risks they assume in their operations from inception throughout the risk lifecycle. They must make sure their business strategies align with the ERM Policy including the Risk Appetite Framework.
First-line responsibilities include:
• diversifying products and services, customers and distribution channels
• developing prudent investment underwriting processes and diversifying by asset type, issuer, sector and geography
• following a disciplined application of pricing standards and underwriting, and conducting extensive testing of the risks involved in new products and offerings
26
• thoroughly managing the business by regularly reviewing, assessing and implementing relevant changes
• conducting business to safeguard our reputation through delivering fair customer outcomes by maintaining high standards of integrity based on our Code of Conduct and sound sales and marketing practices
• generating returns for shareholders through profitable and growing operations, whilst maintaining a strong capital position and accepting appropriate levels of risk in accordance with our risk appetite.
THE SECOND LINE OF DEFENCE
This is the oversight functions - including the Risk, Compliance, Actuarial and Finance Functions.
The Risk Function oversees the ERM framework, using it to challenge the compliance of the first line of defence with it. The Function’s specific responsibilities and accountabilities include independently reviewing risk identification, measurement, management, monitoring and reporting.
The Risk Function looks at the work of the Actuarial, Compliance and Finance Functions when assessing compliance with the ERM Framework. It makes sure there are no conflicts of interest and reinforces independence and objectivity.
THE THIRD LINE OF DEFENCE
This is Internal Audit. It carries out independent risk-based assessments of the internal risk control framework and the oversight provided by the second line of defence.
Internal Audit independently assures and validates the operational effectiveness and design of the ERM Framework. This includes periodic audits of first- and second-line control processes to help promote effective and efficient operations, integrity of financial reporting, appropriate information technology processes and compliance with law, regulations and internal policies.
B.3.3 Risk appetite and strategy
We employ a prudent approach to taking and managing risks, with emphasis on the resilience of business operations and sustainable growth. We recognise that negative externalities, such as environmental degradation, social risk issues and climate change, may impact the long-term sustainability of the business. We also recognise an expectation of customers that the firm will act in a responsible and sustainable manner. We aim to align business goals with our corporate social responsibility strategy, and other ‘green’ objectives.
The Board approved Risk Appetite Statement and Risk Strategy document sets out our appetite for each type of risk, our rationale for accepting risks, and our strategy for the type and level of risk we will assume. Our risk appetite will change as our resources and strategic objectives evolve.
The key objectives in the Risk Appetite Statement are below.
• Customer protection: customer outcomes and the avoidance of customer detriment will be key considerations in determining our strategy - meeting customer needs and expectations is a core principle in the design, distribution and administration of our products and services.
• Strong capital position: we maintain a strong balance sheet and do not take risks that would jeopardise our solvency.
• Strong liquidity: we maintain a high quality, diversified investment portfolio with enough liquidity to meet our policyholder and financing obligations under normal and stressed conditions.
• Mitigated earnings volatility: we aim to avoid substantial earnings volatility by managing risk concentration, limiting exposure to more volatile lines of business and diversifying our exposure to risk.
• Maintaining reputation: we consider the potential impact on our reputation in all our business activities.
These objectives support both shareholder and policyholder interests since both are best served if we continue to be financially strong and profitable. Equally, we can only remain profitable if customers, financial advisors and other interested parties are satisfied that we are a secure company.
Risk appetite statements establish the core risk strategy across the business. We develop these statements through an iterative reviewing, monitoring and updating process that involves our key functions. The Board then approves these statements. Our strategic and business plans are aligned with the risk parameters within the risk appetite statement.
We achieve our Risk Strategy goals by embedding a risk awareness culture across all our business activities, and being prudent when taking and managing risks. We focus on:
• diversifying products and services, customers and distribution channels
• prudent investment management and diversifying by asset type, issuer, sector and geography
• disciplined application of pricing standards and underwriting, and extensively testing the risks involved in new products and offerings
• thoroughly managing the business through regular reviews
• safeguarding our reputation by operating a highly ethical business, based on the employee Code of Conduct, and sound sales and marketing practices
• increasing returns to shareholders through profitable and growing operations, while maintaining a strong financial position.
The Irish Life Risk Appetite Framework sets out limits and thresholds for risks. The Risk Function then monitors these risks and reports on them each quarter to the executive and Board Risk Committee.
27

The Board sets risk policies that stipulate the type and level of risk the company is allowed to take on, along with the related risk management and reporting procedures. We establish risk processes and controls for each business division to enforce the specific risk policies approved by the Board.
B.3.4 Risk management processes: identification, assessment and treatment
The Risk Function oversees the identification of both existing and emerging risks within the company. Risks are identified from the bottom up as well as the top down. Our business divisions, senior managers, risk specialists and specific risk committees all have significant input to this. We also use our stress-testing framework, which draws on scenario analysis to spot emerging and previously unidentified risks.
We use individual risk assessment frameworks at the divisional level, overlaid with our risk materiality framework, to assess identified risks. Senior managers across the company ratify any risks considered material. The Board Risk Committee then monitors these regularly.
Our risk materiality framework follows the iterative approach in the chart below.
We have three different treatments for the risks we identify, and combine these treatments as appropriate. These treatments are the basis of our risk policies.
1. We may hold capital so we remain solvent if the risk impact becomes severe.
2. We may manage the risk through controls.
3. We may mitigate the risk by choosing not to take it on or transferring it to a third party.
Every year we evaluate the way we categorise risk as part of our Risk Appetite Framework review.
We also run an emerging-risk identification process. This involves the risk teams in the operating divisions, divisional Operational Risk Steering Committees, central risk teams and senior executives.
1. Is the risk (likely to be) capital consuming?
Risk Immaterial Risk Material
2. In a feasible worst case scenario,
is the risk likely to cause reputational damage or result in poor customer outcomes?
3. Considering other relevant information
(e.g regulatory compliance, peer practice, etc.) and applying expert judgment, is the risk
considered material?
NO, or difficult to quantify?
Iteration
YES
YES
YES
NO, or difficult to quantify?
NO, or difficult to quantify?
RISK MATERIALITY FRAMEWORK: A DECISION TREE
28

B.3.5 Risk management processes: monitoring, measurement and reporting
We monitor risk appetite limits, risk policy limits and key risk indicators (KRIs) against selected measures of risk. We measure our exposure to risk in a variety of different ways, including monitoring sums assured, nominal or market value of exposures, the level of actual deviation from expected outcomes and the range of potential deviations from expected outcomes.
Our risk limits and KRIs framework is multi-layered to make monitoring, evaluating and limiting risk-taking more effective. We monitor and review exposures regularly, and report to Board and Executive Risk Committees each quarter or more often if required.
The framework includes:
• limits linked to individual risks
• aggregate risk exposures for different risk categories, measured by how much they contribute to the capital we need.
The table below summarises how we measure different risks. In addition, we use our annual ORSA process to analyse the impact of different risks on company solvency under stress scenarios.
Risk category The main ways we measure risk
Mortality risk We measure mortality risk using the sum assured, both gross and net of reinsurance.
Longevity risk We measure longevity risk by assessing the value of those liabilities that are exposed to it. We consider our exposure both gross and net of reinsurance.
Morbidity risk We measure morbidity risk using the sum assured, both gross and net of reinsurance.
Expense risk We measure expense risk using actual, budgeted and projected expense levels.
Lapse risk We measure and monitor lapse risk by considering the number of policyholders who surrender their policies early compared to the number we expected to do so.
Credit risk - fixed interest/cash assets
We measure credit risk by referring to the value of the assets we have invested with different counterparties. Our risk policy limits depend on the financial strength of counterparties.
Credit risk - reinsurance counterparties
We measure our exposure to reinsurance counterparties both gross and net of mitigations such as any collateral we hold. We set a minimum rating for the financial strength of counterparties, depending on the type of reinsurance we’re looking for.
Equity/property risk We measure market risks, such as equity/property risk, by referring to the most recent market/fund value of investments, and the value of the management charges we collect from unit-linked funds that invest in equity and property assets.
Interest rate risk We measure interest rate risk by analysing how the values of our assets and liabilities change when interest rates move.
Liquidity risk We measure liquidity risk by comparing the quantity of our cash and assets we can readily convert into cash to the potential demand we might face for cash.
Currency risk We measure currency risk by analysing how the values of our assets and liabilities change when exchange rates move.
Operational risk We measure operational risk, including information technology risk, retrospectively by analysing operational risk losses and near misses; and prospectively by monitoring relevant Key Risk Indicators.
Strategic risk We do not measure strategic risk directly. Instead, we evaluate the existing and proposed key strategic initiatives that have been approved by the Board.
Legal and regulatory risk We analyse legal and regulatory risks as part of our compliance framework, and mainly measure them qualitatively through risk reporting.
Customer advice risk Customer advice is a core process that contributes to operational risk, and as such we monitor and measure it in the same way we do for all other aspects of operational risk as set out above. We also report on consumer protection and conduct risk using our compliance framework.
29

B.3.6 Investments
Prudent Person Principle
Our Board approved Investment Policy sets out the criteria we use when we invest our assets.
The Policy makes sure that our approach to investment management follows the Prudent Person Principle defined in Solvency II regulations. The Policy covers the investment of all our assets, including unit-linked assets.
The controls and processes set out in the policy make sure we invest in assets and instruments only when we can properly identify, measure, monitor, manage, control and report on their associated risks; and only when we can take these risks into account when we assess our solvency needs. The investment restrictions and requirements in the policy ensure the security, quality, liquidity and profitability of the investment portfolio, and that the assets are available when we need them.
The value of our liabilities change due to changing market conditions - for example when interest rates change or equity prices move. We invest in assets whose values move in a similar way to the liabilities.
Our Investment Policy also establishes principles and controls to manage potential conflicts of interest.
Other controls in the Policy include:
• using derivative instruments only if they help reduce risks or improve portfolio management
• limiting the amount of assets we can hold which are not publicly traded - apart from property assets, we have minimal exposure to such assets
• diversifying our assets through strategic asset allocation limits, specified by asset type and individual counterparty exposure limits
• placing strict rules around who we can lend assets to, and what security we need them to provide, whenever we lend assets to other investors in order to increase returns
• how we report and monitor investment positions, and our oversight responsibilities
• the approval process for investment operations.
Equity Investment Strategy
We offer a very broad range of unit-linked funds to our customers. These funds invest in a range of asset types, including a significant portion in equities. The investment returns for each fund accrue to our customers who have chosen to invest in the fund.
Our range of funds are categorised by how volatile future investment returns are expected to be. Funds with higher
levels of expected volatility are categorised as higher risk and only recommended to customers with a high risk appetite. Whilst being more volatile, these funds also have a higher level of expected returns based on how different asset types have performed in the past. Our higher volatility funds will often invest a large portion of their assets in equities. We recommend less volatile funds, with a lower portion of assets in equities, for customers who have a lower risk appetite.
We also manage two with-profits funds, which are no longer available to new customers. Similar to our unit-linked funds, the investment returns on these funds accrue to the customers who are currently invested in the funds. These funds hold a portion of their assets in equities and this allocation is kept under active review. One of the factors we consider is the term to go until maturity of the policies in the fund.
We do not have any other material direct equity investments.
Our Asset Managers
We have appointed Irish Life Investment Managers Ltd. (ILIM) and Setanta Asset Management Ltd. (Setanta) to manage the large majority of our unit-linked and with-profits funds. ILIM and Setanta are related companies within the same group as ILA. We also offer our customers access, at their discretion, to a range of funds managed by external asset managers.
Our asset managers have a range of criteria they use to make investment decisions. This includes how they engage with investee companies and factors taken into consideration when assessing investee companies including Environmental, Social and Governance factors. In the case of our group asset managers (ILIM and Setanta) we have regular engagement to ensure their investment approach continues to meet our needs.
We set a mandate for our group asset managers that outlines how each fund should be managed. This outlines the portion of assets that should be invested in equities and other asset types and what types of equities or other assets can be held by each fund. The mandate aligns with our customers' expectations for each fund. We assess the performance of the asset managers against this mandate.
We monitor the performance of our funds against funds offered by other firms, which have a similar risk level. Performance is assessed net of all investment costs including transaction costs. We consider the performance over a range of time horizons.
Our arrangements with asset managers are open ended, but can be terminated subject to a notice period.
30

B.3.7 Credit assessments
We do not rely solely on external credit assessments when we assess the credit quality of counterparties.
We decide on the credit ratings for all fixed interest investments we take on - including bonds, cash and commercial mortgages, and investments - through an internal credit review by the appointed investment manager. We supplement this with any ratings available from external credit rating agencies. We make sure the internal rating is not higher than the highest published rating from a major external credit rating agency. We refer to the regulatory guidelines for performing credit assessments and our Risk Function oversees the process.
The processes reflect the significance of the counterparty. We complete the rating process in advance of any investment with a new counterparty, and review it at least once each year.
Our Risk Function monitors the credit quality of the investment portfolio, along with our compliance with our investment limits, and reports these to the Executive Risk Management Committee and the Board Risk Committee each quarter.
The Risk Function also monitors and reports the credit quality of reinsurance counterparties to these committees each quarter.
B.3.8 ORSA
We see the Own Risk and Solvency Assessment (ORSA) process as key to our risk management system.
The ORSA evaluates our risk profile and solvency position in relation to business operations, strategy and plan.
Own: Reflects our business model and corporate structure and is integrated with business plans and strategy.
Risk: Evaluates risks, including emerging risks, relative to appetite, and outlines our risk management techniques and risk governance structures.
Solvency: Reviews potential solvency needs under normal and stress conditions and evaluates capital and liquidity available compared to requirements.
Assessment: Assesses current and projected risk position and solvency needs.
The ORSA is a year-round collection of processes, integrating our Enterprise Risk Management (ERM) Framework with capital management and business planning.
The ILA Board has put in place an ORSA Policy that sets out the roles and responsibilities for completing the ORSA. A regular ORSA is carried out each year. A non-regular ORSA may be performed following the occurrence of a material event at an interim date between annual ORSA reports or following a significant change in the Company’s risk profile or appetite.
The Board, with significant support from the Board Risk Committee, owns and directs the ORSA, and reviews and approves the ORSA Policy annually. The CRO conducts the ORSA process, producing the ORSA report and maintaining the ORSA record. The Board and Board Risk Committee steer this process, and review and approve the key aspects of the process at various points throughout the year. The annual ORSA process culminates in the ORSA report, which the Board reviews and approves.
The Actuarial Function helps the Risk Function to produce various aspects of the ORSA - capital projections and stress testing in particular. The Head of Actuarial Function also gives an Opinion on the ORSA to the Board.
The ORSA is the main link between the risk management system and capital management activities. We have listed the key steps in the ORSA process below. They include an assessment of our solvency capital requirements in light of our risk exposures. We carry out this assessment using the Standard Formula under Solvency II to evaluate our capital requirements, and by developing our own view of the appropriate level of capital. As part of this exercise we consider all the risks we are exposed to over the life-time of the insurance obligations, whether or not these risks are included in the Standard Formula calculation of capital requirements. A key output from the ORSA is an assessment of the level of capital we need to hold, which stems from our current and prospective risk profile.
We evaluate planned business strategies and proposed capital management activities as part of the ORSA process, capturing and reporting on their impact on the ORSA. The annual ORSA report projects our solvency resources for the following five years, under a base case and range of stress scenarios. The base case scenario reflects the approved business strategy and plans, updated to reflect changes to the operating environment and with certain adjustments where appropriate for the purpose of the ORSA.
We also look at how material developments to the strategy or to the capital position outside of the annual cycle would affect the ORSA.
KEY STEPS IN THE ORSA PROCESS
• Consider the business strategy The first-line business divisions present the business strategy to the Board to be challenged and approved. The business plans are informed by the findings of the ORSA. This presentation includes a review of the key assumptions underlying the plan, including projected sales, expenses and new business margins. The Board considers the risks associated with the business strategy. Where the proposals include changes that may materially impact the risk profile of the business, those will be reviewed and analysed through an ORSA lens.
31

• Assess the appropriateness of the Standard Formula We use the Standard Formula to calculate how much capital we must hold under the regulations. As part of the annual ORSA process the Board evaluates the risk profile of the business based on the assumptions underlying the Standard Formula. This tests whether the use of the Standard Formula is appropriate for our business.
• Complete an Own Solvency Needs Assessment (OSNA)
– We assess our own view of the capital required for the business, as distinct from the capital which the regulations say we must hold.
– We assess the appropriate additional layer of capital to hold above the regulatory requirements, to make sure we will still have sufficient capital even after adverse events.
• Select stress tests The Board, supported by the Risk Function, sets the stress and scenario tests we consider as part of the ORSA. The stress tests are forward looking while also taking past experience into account. We weigh up the impact of the stress tests on our business strategy.
• Produce the ORSA report The Risk Function produces an ORSA report each year under the direction of the Board. The CRO presents it to the Board Risk Committee, who review and recommend the report to the Board for approval. The report includes a solvency projection under the base assumptions as well as the result of the stress tests and an analysis of the results. The base assumptions are consistent with the Board-approved business plans, but with adjustments where appropriate to reflect developments
since the plans were approved. The report notes any material changes in the company’s risk profile since the previous ORSA and analyses the projected changes in the company’s risk profile in the future. The Board reviews and challenges the report. We submit the final report, once approved by the Board, to the Central Bank of Ireland.
• Review the level of capital held After considering the insights on our risk profile gained from each of the key steps above, along with other relevant matters, the Board reviews what level of capital we should hold.
• Addressing the ORSA findings The ORSA may generate recommendations such as risk mitigation initiatives or adjustments to business plans. We assign these actions as appropriate to the relevant area, and the Risk Function reports to the Board regularly on our progress in addressing them.
• Communicating the ORSA results The Risk Function communicates the results from the ORSA to the business divisions and other key functions as appropriate.
• Embedding the ORSA within decision making Throughout the year we bring significant new initiatives, such as product development and acquisitions, to the Board for approval. The Risk Function analyses the impact of these on the ORSA and present their findings to the Board for consideration.
• Reviewing risk policies The Board reviews and approves all risk policies each year. We update our risk policies to reflect the outcome from the ORSA process.
B.4 INTERNAL CONTROL SYSTEM
B.4.1 Internal control framework
We maintain an internal control framework, a set of processes created by the company’s board of directors, management and other personnel, which gives reasonable assurance that the following objectives will be achieved:
• effective and efficient operations
• reliable financial and management reporting
• compliance with applicable laws and regulations.
Our internal controls are key to managing significant risks to fulfilling our business objectives.
The Board determines our Internal Controls and Financial Management policy, and each year approves the policy following recommendation from the Board Audit Committee.
32

Five components of internal control underpin our internal control system.
1. Control Environment This set of standards, processes and structures is the foundation for all other components of internal control, providing discipline and structure.
2. Risk Assessment This is the process for identifying and assessing relevant risks to achieving our objectives, and the basis for deciding how to manage those risks.
3. Control Activities We establish these actions through policies and procedures that help make sure we all carry out management’s objectives.
4. Information & Communication This helps us identify, capture and exchange internal and external information in a form and timeframe that enables us all fulfill our responsibilities.
5. Monitoring Activities Ongoing evaluation enables us find out whether all components of the internal control system are present and functioning.
Our internal control system demands we have a combination of preventive, detective, directive and corrective control processes in place.
The Canadian Securities Administrators (CSA) requires the CEO and FD of a company whose securities are publicly traded to verify that they evaluate the design of their Internal Controls Over Financial Reporting (ICOFR) every quarter and that they review the effectiveness of their ICOFR every year. We must comply with this regulation because we are a subsidiary of a Canadian company.
Internal Audit, on behalf of management, tests the design and effectiveness of the key ICOFR controls to make sure we meet the requirements. Each year we review the relevance of these key controls and edit them accordingly, so they continue to reflect the existing control environment.
The FD must review and approve the Internal Controls and Financial Management Policy before it goes forward for Board approval. Each year our Board assesses whether any new internal controls are required and validates the effectiveness of these (if any) and all existing controls.
B.4.2 Compliance Function
You can find out more about the Compliance Function in section B.1.5 Key Functions above.
B.5 INTERNAL AUDIT FUNCTIONYou can find out more about the Internal Audit Function in section B.1.5 Key Functions above.
1. Control
Environment
5. Monitoring Activities
INTERNAL CONTROL
4. Information &
Communication 3. Control
Activities
2. Risk
Assessment
B.6 ACTUARIAL FUNCTIONYou can find out more about the Actuarial Function in section B.1.5 Key Functions above.
33

B.8 ANY OTHER INFORMATIONNo other items to note.
B.7 OUTSOURCINGDESCRIPTION OF OUR OUTSOURCING POLICYWhen appropriate, we can outsource specific business functions to reduce or control costs, to free internal resources and capital, and to harness skills, expertise and resources not otherwise available to us. However, outsourcing specific business functions may also expose the company to additional risks - risks that we must identify and manage. Our Outsourcing Policy is a Board-approved policy that sets out the principles and requirements for managing outsourcing arrangements.
The Board and senior management retain ultimate responsibility for any functions and activities we outsource. They have the necessary expertise to manage outsourcing risks and oversee outsourcing arrangements.
Our Outsourcing Policy sets out the following general principles for identifying and managing outsourcing risks:
• outsourcing arrangements must be identified and assessed based on their materiality
• outsourcing arrangements must be appropriately approved
• the capability of proposed service providers for material outsourcing must be thoroughly evaluated
• outsourcing contracts for material outsourcing must contain certain mandatory terms and conditions
• material outsourcing arrangements must be effectively monitored and controlled by senior management and the executive Operational Risk Committee, with oversight from the Board Risk Committee
• material outsourcing arrangements must have documented exit plans in place, which are regularly reviewed.
We take a prudent and conservative approach to outsourcing.
DETAILS OF OUTSOURCED CRITICAL OR IMPORTANT OPERATIONAL FUNCTIONS AND ACTIVITIES
Internal Provider Services provided Jurisdiction
Irish Life Financial Services Ltd (ILFS) Administration and distribution services for ILA. Ireland
Irish Life Investment Managers Ltd (ILIM) Investment Management Services Ireland
Setanta Asset Management Ltd Investment Management Services Ireland
Canada Life Asset Management Ltd (CLAM) Investment Management Services UK
Canada Life Group Services Ltd and Irish Life Group Services Ltd
These are shared services companies, which provide ILA and sister companies with services including Information Security, Internal Audit and other.
Ireland
Canada Life Group Services Ltd Administration of a small number of policies Ireland
External Provider Services provided Jurisdiction
Investment manager (2 firms) Investment management services for a small portfolio of assets Ireland
External consultancy firm Certain Actuarial services Ireland
External firm Administration of a small portfolio of policies Ireland
External firm Administration of a small portfolio of policies UK
External printing firm Certain printing and document management services Ireland
Call centre communication services Telephony and related communication services Ireland
OUTSOURCED KEY FUNCTIONSOur key functions are supported by services provided by shared services companies, as shown on the table above.
34

RISK APPETITE
The ILA Board sets our risk appetite, defining a risk preference level for all significant risks. The risk preferences range from ‘no appetite’ to ‘readily accepts’. We have the highest appetite for risks related to core business activities, particularly those related to insurance products and unit-linked investment management services.
RISK STRATEGY: SOLVENCY AND CAPITAL
The main objective of our risk strategy is to keep our commitments while growing shareholder value. This risk strategy involves generating returns to sustainably grow shareholder value through profitable and growing operations, while maintaining a strong balance sheet and taking a conservative approach to risk management.
RISK STRATEGY: CAPITAL USAGE AND GROWTH
We aim to maximise how efficiently we use capital and how well we control the risk to this capital. We achieve this through product design and setting target returns on the capital we invest.
We believe that controlled organic growth is essential to our continued profitability.
RISK STRATEGY: FUNDING
We will self-finance our sales plan and the payment of equity dividends. We do not currently plan to raise any new sources of capital.
RISK EXPOSURES
In this section we describe our main risk exposures and how we assess and mitigate them.
The table below shows our Solvency Capital Requirement (SCR) split by risk type. This is the capital needed to cover the ‘1 in 200 year’ adverse outcome, as set out in the Solvency II regulations. This capital can therefore be viewed as a measure of the total risk exposure to each risk type, net of risk mitigations.
This section categorises and explains our risk exposures under major risk headings.
Our risk profile reflects our main business activities, particularly those activities that are to do with creating and selling life insurance products and unit-linked investment and saving products.
We control the way we accept risks, using our expertise to manage them and create shareholder value from them. The ILA Board approves our risk appetite at least once a year.
We outline the main points about our risk profile and management strategy below.
C. RISK PROFILE
35

€m End 2020 End 2019
Market risk 695 689
Life underwriting risk 717 707
Health underwriting risk 240 267
Counterparty risk 40 33
Requirement before diversification 1,691 1,696
Post diversification 1,242 1,249
Operational risk 62 59
Loss absorbing capacity of deferred tax (163) (163)
Total SCR 1,142 1,145
C.1 UNDERWRITING RISKInsurance (underwriting) risk is linked to contractual promises and obligations made under insurance contracts. Exposure to this risk results from adverse events that occur under specified perils and conditions covered by the terms of an insurance policy.
Insurance risk includes uncertainties around:
• the ultimate amount of net cash-flows (premiums, commissions, claims, pay-outs and related settlement expenses)
• when these cash-flows are received in and paid out
• how the policyholder will behave (e.g. if and when policyholders decide to stop paying into their policies).
RISK DESCRIPTION
Insurance risks comprise mortality, longevity, morbidity, lapse, expense, and catastrophe risks. These risks could cause losses from the changing level, trend or volatility of claims as well as by a single catastrophic event.
Mortality risk
This relates to the risk of loss from higher than expected mortality rates. We are exposed to mortality risks through individual and group insurance policies, which pay benefits to insured policyholders upon death.
Longevity risk
This relates to the risk of loss from lower than expected mortality rates. We are exposed to longevity risk primarily through annuity
contracts, where regular payments are made to policyholders while the policyholder is alive.
Morbidity risk
This relates to the risk of loss from higher than expected levels of illness or injury, or lower than expected rates of recovery from illness or injury. We are exposed to morbidity risk when we sell income-replacement contracts (which pay a replacement income to policyholders who are unable to work due to illness or injury) and through specified-illness cover policies (which pay a lump sum on diagnosis of one of a number of specified illnesses).
Lapse risk
This is the risk of losses due to policy-holders ending their contracts early.
Expense risk
This is the risk of losses due to higher than expected expenses that we incur when administering our business. This includes the impact of inflation rates on expenses.
Catastrophe risk
This relates to losses caused by catastrophic events, for example a pandemic affecting the population or an industrial accident at a single location. We are exposed to catastrophe risk on our insured business, particularly where we provide group insurance coverage for the lives of many people who routinely work at the same location.
Throughout 2020 we were exposed to each of these insurance risks.
Note: There are some technical differences in how we view the split of the total SCR by risk category, as shown in the table above, from the presentation in Appendix 6 that follows a methodology prescribed by the regulatory authorities.
The market risk SCR mainly relates to interest, equity, currency and property risks (see section C.2 (Market Risk) for more details) and credit risk (see section C.3 (Credit Risk) for more details). The life and health underwriting risk SCR relates to lapse, expense, mortality, morbidity and longevity risks (see section C.1 (Underwriting Risk) for more details).
36
RISK ASSESSMENT AND MITIGATION
We use a series of techniques to assess, manage and mitigate underwriting risks.
Own Risk and Solvency Assessment (ORSA)
We assess all material risks, both qualitatively and quantitatively, as part of the annual ORSA process.
Risk limits
We have a series of risk limits that measure risk exposure from different sources of underwriting risk. Our Risk Function monitors these limits and reports on them each quarter to the Executive Risk Management Committee and the Board Risk Committee. By monitoring exposures, we can see trends in the risk profile over time and identify material deviations from business plans or from our appetite for each risk.
Stress testing
We use stress testing as part of the ORSA process to assess risk exposures and their potential impact. Stress testing can also be useful in helping us decide how to mitigate our exposure to risk.
Reinsurance
We set retention limits to restrict the insurance risks we retain that relate to an individual policy or a group of exposures. We reinsure amounts that are more than the limits.
Assumption/experience monitoring
When writing an insurance policy, we make a series of assumptions around the insurance experience that will unfold over the term of the contract. If the actual experience is worse than we assumed, the result will be lower profits or even losses.
Our Actuarial Function investigates insurance risk experience for our main exposures every year. This allows the Chief Actuary and the Board to assess the suitability of the assumptions made when pricing business, setting reserves and calculating the value of our liabilities for inclusion in our financial statements. Each year, after considering recommendations from the Chief Actuary, the Board approves the assumptions used to determine the value of our liabilities in relation to our insurance policies upon recommendation from the Board Audit Committee. The Executive Risk Management Committee and the Board Risk Committee also review the insurance risk experience each year.
We monitor risk experience against assumed/expected experience regularly through monthly business division management information, budget tracking and quarterly profit reporting. If this regular monitoring identifies a potential deviation in experience, the Actuarial Function investigates and feeds back into the pricing and reserving processes, as appropriate.
Underwriting
Our underwriting process includes an assessment of insurance risks before we issue policies. This assessment includes a medical underwriting assessment and a financial assessment for certain
product lines. We also carry out underwriting assessments when a claim is made.
Risk pricing
We control the development of new products and the pricing of new and existing products to minimise the risk of underwriting risks at a loss. The profitability of new and existing products depends on the applicable experience assumptions used to price the product (e.g. expense, claim and investment experience assumptions).
We monitor the profitability of new business against targets set through our annual budget process. Our operating divisions regularly monitor and report on sales volumes and profitability levels. We report results to the Board each quarter.
RISK CONCENTRATION
Our insurance concentration risks take a number of forms:
• We operate within Ireland, and a significant portion of the Irish population lives in the greater Dublin area, so our insurance risk exposure is relatively concentrated to a specific place. This is an on-strategy risk for us and we do not seek to reduce it.
• Individual policyholders with large sums assured can lead to some concentration risk. We actively manage this risk by using reinsurance. We reinsure large policies so that the retained sum assured is limited to the maximum amount we have set.
• We actively write group business and can face site concentration risk as a result. We use reinsurance to manage this risk.
• The sale of annuities to pension schemes can lead to longevity risk exposures concentrated in certain industries. Our portfolio is large and diverse, which reduces this concentration risk. We further reduce this risk with tailored pricing and by using reinsurance.
SENSITIVITIES / STRESS TESTINGYou can find out more about the stress testing and sensitivity analysis we carry out in section C.7.1 (Risk Sensitivities).
37

C.2 MARKET RISK
RISK DESCRIPTION
Market risks comprise equity/property risk, currency risk, interest rate risk, inflation risk and liquidity risk (see section C.4 (Liquidity Risk)). We are willing to accept market risk in certain circumstances as a consequence of our business model and seek to mitigate the risk wherever practical by matching our assets and liabilities.
Equity risk
This relates to losses due to falls in equity prices. We have no significant direct shareholder investments in equity markets. We do give policyholders access to equity markets through unit-linked products. Any gains or losses from those investments are incurred by policyholders. However, we are indirectly exposed to market levels as our charges depend on the value of the unit-linked funds. So if fund values fall due to falls in equity markets, our charges will fall as well. We also have some products, which are now closed, that provide investment guarantees.
Property risk
This relates to losses due to falls in property prices. It is similar to equity risk in that we also have indirect exposure to property market levels through charges collected from unit-linked funds. In addition, we have some direct property holdings, mainly owner-occupied premises.
Currency risk
This relates to losses due to changes in currency exchange rates. We have no significant direct exposure to currency market levels, as we hedge exposures that arise. It is similar to our equity risk exposure, in that we have indirect exposure to currency markets. If a change in currency exchange rates affects the value of unit-linked funds, it will also affect the value of the charges we collect.
Interest rate risk
This relates to losses due to changes in interest rates. The values of our liabilities linked to insurance policies are sensitive to prevailing long-term interest rates. However, we largely mitigate this exposure by holding assets whose values also move when interest rates change, offsetting the change in the values of our liabilities.
Inflation risk
This relates to losses due to changes in inflation rates. Some of our policies pay benefits to policyholders that increase in line with prevailing inflation rates, so higher than expected inflation rates may lead to losses. We partly mitigate this risk by holding assets that have a higher return when inflation rates are higher.
Defined benefit pension schemes
An indirect source of our market risks relates to the risk of economic loss caused by uncertainty around required contributions to our defined benefit pension schemes
We consider this risk to be a part of expense risk as a deterioration in the pension scheme position could lead to the need for greater contributions from the employer, which would increase expenses. Deterioration in the pension scheme position could stem from adverse market movements affecting the value of the pension scheme’s assets or liabilities.
RISK ASSESSMENT AND MITIGATION
We use a series of techniques to assess, manage and mitigate market risks.
ORSA
We assess all material risks, both qualitatively and quantitatively, as part of our annual ORSA process.
Risk limits
We have a series of risk limits that measure market risk exposure from different sources. Our Risk Function monitors these limits and reports on them each quarter to the Executive Risk Management Committee and the Board Risk Committee. By monitoring exposures we can see trends in the risk profile over time and identify material deviations from business plans or from our appetite for each risk.
Stress testing
We use stress testing as part of the ORSA process to assess risk exposures. Stress testing can also be useful in helping us decide how to mitigate our exposure to risk.
Asset Liability Matching (ALM)
We invest in matching assets to mitigate the market risks linked to policy liabilities.
• We invest in unit-linked assets to match the surrender value of unit-linked policies.
• We mitigate the interest rate and inflation rate exposure of non-linked products by matching liabilities with appropriate assets. That means the value of the liabilities and assets move by similar levels when interest and inflation rates change.
• We mitigate currency risk by holding assets of the same currency as liabilities or by hedging currency risks that arise.
Equity hedge
We operate an equity hedge to partially mitigate certain residual exposure to equity risk.
Reinsurance
We reinsure some market risks linked to certain legacy unit-linked products that gave investment guarantees to policyholders.
Prudent investment strategy
We invest our assets prudently, including assets that back policy liabilities and other shareholder assets. This is in line with the
38

Prudent Person Principle, as required by Solvency II regulations. You can find out more in section B.3.6 Prudent Person Principle about how we apply this. Our investment principles include:
• establishing strategic asset limits to make sure our investments are appropriately diversified
• maintaining a high level of liquidity, above the level we foresee we will need
• restricting the use of derivatives to make sure we only hold these instruments to manage investments efficiently or reduce investment risk
• keeping shareholder investments in equity/property assets low.
The Executive Investment Management Committee also oversees our market risks through its oversight of the company’s investments.
RISK CONCENTRATION
Our shareholder assets include owner-occupied properties in a single campus in central Dublin. Other than these assets, we do not have any significant concentrated holdings of individual equity or property assets.
You can find out more about concentration risks linked to our fixed interest assets holdings in section C.3 (Credit Risk).
SENSITIVIES / STRESS TESTINGYou can find out more about the stress testing and sensitivity analysis we carry out in section C.7.1 (Risk Sensitivities).
C.3 CREDIT RISK
RISK DESCRIPTIONCredit risk relates to risks from a counterparty’s potential inability or unwillingness to meet its obligations. Our counterparties include sovereign governments and corporate entities who issue fixed interest assets, reinsurers, insurance intermediaries, policyholders and derivative counterparties.
Our main source of credit risk is investments in fixed interest assets issued by borrowers, including sovereign governments and corporate entities. These assets are highly liquid and traded on various market exchanges. Credit risk also stems from deposits and other assets we place with banks.
We cede insurance risk to reinsurance companies to mitigate our insurance risk, and are willing to accept the resulting reinsurance counterparty risk within the limits we have set. Similarly, we are willing to accept derivative counterparty risk because we use derivatives to mitigate other risks, but have set limits in relation to this.
We are also willing to accept credit risk that results from our business model, e.g. through our dealings with group clients, brokers, intermediaries, policyholders, suppliers, service providers etc.
RISK ASSESSMENT AND MITIGATIONWe use a series of techniques to assess, manage and mitigate credit risk.
ORSA
We assess all material risks, both qualitatively and quantitatively, as part of the annual ORSA process.
Risk limits
We have a series of risk limits that measure credit risk exposure from different sources. Our Risk Function monitors these limits and reports on them each quarter to the Executive Risk Management Committee and the Board Risk Committee. By monitoring exposures
we can see trends in the risk profile over time and identify material deviations from business plans or from our appetite for each risk.
Stress testing
We use stress testing as part of the ORSA process to assess risk exposures. Stress testing can also be useful in helping us decide how to mitigate our exposure to risk.
Prudent investment strategy
Our overarching investment strategy involves targeting a diversified portfolio of assets from counterparties that are in the upper tier for credit quality. We establish limits by referring to aggregate portfolio and individual counterparty limits, as applicable. We then link these to credit ratings that assess the financial strength/creditworthiness of counterparties. Implementation of this investment strategy is overseen by the Executive Investment Management Committee, Executive Risk Management Committee, and the Board.
Reinsurance
In relation to our reinsurers, we deal only with counterparties that meet our specific creditworthiness requirements. We actively monitor the financial strength of our reinsurers. We also seek contractual protection such as collateral and offset rights where appropriate.
RISK CONCENTRATIONWe have set fixed interest and cash counterparty credit risk limits to manage credit concentration risk. Our largest counterparty is the German sovereign.
Our operations also lead to some concentration risk exposure linked to reinsurance counterparties. We diversify across reinsurers to reduce this risk. We also look for collateral, where appropriate, to reduce the risk.
39

C.4 LIQUIDITY RISK
RISK DESCRIPTION
Liquidity risk stems from a company’s inability to generate the necessary funds to meet its obligations as they fall due.
Our business model does not lead to significant liquidity risk as we hold assets that are greater than the value of our liabilities. Our business model is also cash-generating.
RISK ASSESSMENT AND MITIGATION
We monitor and assess potential liquidity risk regularly.
Day-to-day/expected liquidity strains
For day-to-day liquidity needs, we maintain adequate funds in instant-access bank accounts. Our Finance Function monitors and maintains balances daily.
The need to pay policyholders is the main generator of ongoing liquidity needs. For unit-linked policies, we fund claims by selling the unit-linked assets. For non-linked policies, we make sure liquid resources are available when we need them by investing in assets that generate cash when we need it to pay benefits to our policyholders.
Unexpected liquidity strains
Unexpected liquidity strains can stem from a number of sources. These include higher-than-expected insurance claims and collateral calls linked to derivatives or reinsurance arrangements. Liquidity strains could also arise from higher than expected policyholder encashment requests, if the assets held by ILA prove to be difficult to liquidate - for example, high levels of surrender requests from unit-linked property funds may cause a liquidity strain if the underlying properties held by the funds are difficult to sell in a timely manner.
We invest our assets to make sure we have ample liquidity to meet unexpected liquidity needs. We have established minimum and maximum strategic investment limits for different liquid and illiquid asset categories.
We hold significant assets to provide solvency capital cover for the company. These also act as a buffer for unexpected liquidity strains.
SENSITIVITIES / STRESS TESTINGThe Risk Function carries out regular stress testing to make sure we have sufficient liquidity to meet conceivable needs, even during times of severe strain. We report the results of
stress testing each quarter to the Executive Risk Management Committee and the Board Risk Committee.
The stress testing considers the potential liquidity strains we face. We compare these liquidity strains to the available liquid assets to make sure the available assets exceed our requirements.
RISK CONCENTRATION
As noted earlier, most of our insurance risks are located in Ireland. The associated concentration risk could lead to material liquidity strains from higher-than-expected insurance claims, as described above. And as explained above, high levels of surrender requests from unit-linked property funds could cause some liquidity strain. Most of the properties held by these funds are located in Ireland.
Our stress testing of liquidity risk captures these factors, and we hold ample liquidity to address the risk.
C.4.1 Expected profit included in future premiums
The regulations require us to state in this report the amount of 'expected profit included in future premiums'. This is the amount by which our liabilities are reduced due to the premiums expected from our policyholders in the future. When calculating our liability values we only include future premiums for certain policy types, in line with the requirements of the regulations.
At the end of 2020, expected profit included in future premiums was €290m (2019: €289m). This figure includes the impact of reinsurance but does not include any impact on tax provisions.
The value of our liabilities is reduced by this amount, which leads to a higher net asset position - i.e. a higher level of capital available. However, the amount of capital we have to hold also increases as a result of recognising these future premiums and so the higher capital available must be kept within the company to meet the higher requirement.
When we assess whether our liquid resources are adequate, as described above, we do not count the expected profit included in future premiums as it is not a liquid asset.
SENSITIVITIES / STRESS TESTINGYou can find out more about the stress testing and sensitivity analysis we carry out in section C.7.1 (Risk Sensitivities).
40

RISK DESCRIPTION
Operational risk is the risk linked to inadequate or failed internal processes, people and systems or from external events. Operational risks relate to all business processes.
We accept limited operational and other risks as part of our business model. We have controls in place to mitigate them through integrated and complementary policies, procedures, processes and practices, keeping in mind the cost/benefit trade-off.
We advise customers about their financial needs, and this causes operational risks. We use best management practices to mitigate and manage this risk.
Operational risks also include the risk of failing to identify and comply with new or emerging legal and regulatory requirements. To mitigate such risks and factor them in to new business decisions, we monitor regulatory developments closely, keep in regular contact with relevant regulators and capitalise on our internal communication processes.
Strategic risk stems from the potential inability to implement appropriate business plans and strategies, make decisions, allocate resources or anticipate business change. We instigate strategic risk management at the individual business division level and consolidate it upwards. Our senior leadership team makes decisions at the ILA level for subsequent review and approval by the Board.
RISK ASSESSMENT AND MITIGATION
The Risk Function co-ordinates operational risk management activities. In addition, the Internal Audit Function is key to auditing the processes and associated controls that manage operational risks.
We record operational risks, their associated controls and associated loss events for each of our business divisions. We identify our top operational risks and assess them for specific monitoring. We maintain Key Risk Indicators (KRIs) for each top operational risk, and report on these each quarter as part of a risk dashboard to the Operational Risk Committee (ILA ORC). This committee escalates operational risk issues as appropriate to the Board Risk Committee. The ILA ORC also receives quarterly reports on actual loss events and additional reporting on significant losses. We also monitor a series of risk limits and
report on them each quarter to the ILA ORC. In addition, the Risk Function reports risk limits and operational risk KRIs each quarter, with commentary, to the Board Risk Committee.
As part of the annual ORSA process, we assess our operational risks both qualitatively and quantitatively.
Business Continuity Planning (BCP) is key to mitigating operational risks. It helps ensure continuity of business in a crisis situation. Our Board has approved a BCP framework that applies across our business units.
Stress testing is a key tool in assessing operational risks. We carry out a range of operational risk stress tests each year. These help us develop our approaches to mitigation and management of operational risk.
We will not take on opportunities if we think they pose a risk to our reputation. When we design products and advice processes for customers, we consider any potential impact on our reputation.
As part of a large insurance group, we have a number of relationships with other group companies and rely on them for certain services. Our oversight and management of operational risks includes these shared service arrangements.
We have formal outsourcing agreements in place to manage external and inter-group outsourcing arrangements. These agreements set out the responsibilities of both parties and we monitor and review them regularly. This level of formality ensures we manage the associated risks with appropriate rigour.
RISK CONCENTRATION
Our business operations and policy administration are based mainly in a single campus in Dublin, with a second administration centre in Dundalk. We have centred most of the servicing of policies in these locations. We have partially mitigated the associated concentration risks through business continuity planning, which includes potential to carry out operations from alternative locations and an ability to widely deploy remote working capability. In case of an incident at the Dublin campus, we use off-site centres for data backup and restoration.
We have noted other concentration risks, such as providing insurance products within Ireland, in sections C.1 to C.4 above.
C.5 OPERATIONAL RISK
C.6 OTHER MATERIAL RISKSNo other items to note.
41

C.7.1 Risk sensitivities
We use a number of sensitivity tests to understand the volatility of our capital position. We regularly produce sensitivity tests on our key risk exposures to help inform our decision-making and planning processes, and as part of the framework we use to identify and quantify our risks.
Like every long-term business, we make a number of assumptions when we compile our financial results. These assumptions relate to future expense, mortality and other insurance experience rates, and policyholder lapse rates. Our assumptions are informed by an analysis of historic and expected experience.
We have set out the results of key risk sensitivity tests below. We produce these results from our financial reporting models. For each sensitivity test, we have shown the impact of a change in a single factor, and left other assumptions unchanged. You can see the change in our Solvency Capital Requirements (SCR) coverage ratio that would result from the sensitivities shown.
INTEREST RATESThe impact of a 0.5% increase or decrease in market interest rates. The test considers the impact on the value of our liabilities, net of reinsurance, offset by changes to the value of the assets we hold.
CREDIT SPREADSThe impact of a 0.5% increase in credit spreads on corporate bonds and our other non-sovereign assets. The test considers the impact on the value of our liabilities, net of reinsurance, offset by changes to the value of the assets we hold.
EQUITY/PROPERTY MARKET VALUESThe impact of a 10% fall in the market value of equity and property assets.
EXPENSESThe impact of a permanent 10% increase in maintenance expenses.
LAPSESThe impact of a permanent 10% increase or decrease in policyholder lapse rates.
MORTALITY The impact of a permanent 5% increase in mortality rates, excluding the mortality rate of the people we pay annuities to.
ANNUITANT MORTALITY The impact of a permanent 5% decrease in the mortality rate of the people we pay annuities to.
MORBIDITYThe impact of a permanent 5% deterioration in morbidity. We assume a 5% increase in incidence rates and a 5% reduction in recovery rates for those products where these assumptions are relevant.
The table below shows the sensitivity test results as they impact the SCR coverage ratio. These sensitivities have been selected on the basis of our key risk exposures. We accept these risks in line with the Company’s business strategy and risk appetite.
Sensitivity Test Impact on SCR Coverage Ratio
0.5% increase in interest rates 8%
0.5% decrease in interest rates -10%
0.5% increase in credit spreads 10%
10% fall in equity and property values -8%
10% increase in maintenance expenses -6%
10% increase in policy lapse rates 4%
10% decrease in policy lapse rates -4%
5% increase in mortality rates (assured lives) 0%
5% decrease in annuity mortality rates -4%
5% deterioration in morbidity rates -4%
C.7.2 Use of Special Purpose Vehicles
The regulations require us to include details of any Special Purpose Vehicles (SPVs) we use to transfer risks off our balance sheet, within this report.
We do not have any SPVs.
C.7 ANY OTHER INFORMATION
42

D.1 ASSETS
This section is about our valuation of each kind of asset for Solvency II basis. This includes explanations of:
1. how the value of each asset for Solvency II is different from valuing it for statutory financial reporting purposes that meets the EU’s International Financial Reporting Standards (IFRS).
2. the valuation bases, methods and main assumptions used for Solvency II and those used for statutory IFRS financial statements for the financial year ended 31 December 2020.
The Solvency II Balance Sheet is in Appendix 1.
1. VALUATION DIFFERENCES – SOLVENCY II V IFRSBalance Sheet Extract - Assets
The IFRS values in the following tables are as recorded in our annual report and financial statements. The Asset Type categorisation here is per the Solvency II balance sheet and not directly comparable to categorisation applied in the IFRS Statement of Financial Position.
2020
Asset Type (€m) Note IFRS Valuation Adjustments
Solvency II
Deferred acquisition costs 1 308 (308) -
Intangible assets 2 1 (1) -
Property, plant & equipment held for own use 3 111 - 111
Property (other than for own use) 4 32 32
Equities 5 40 40
Government bonds 6 2,982 2,982
Corporate bonds 6 2,291 2,291
Collateralised securities 6 27 27
Investment funds 7 43 43
D. VALUATION FOR SOLVENCY PURPOSES
43

2020
Asset Type (€m) Note IFRS Valuation Adjustments
Solvency II
Derivatives 8 8 - 8
Deposits other than cash equivalents 9 96 - 96
Unit linked assets 10 48,916 - 48,916
Loans and mortgages 11 114 - 114
Reinsurance recoverables Section D.2 2,134 (537) 1,597
Insurance & intermediaries receivables 12 28 - 28
Reinsurance receivables 13 109 - 109
Receivables (trade, not insurance) 14 1 - 1
Cash and cash equivalents 9 80 - 80
Any other assets, not elsewhere shown 15 670 - 670
2019
Asset Type (€m) Note IFRS Valuation Adjustments
Solvency II
Deferred acquisition costs 1 315 (315) -
Intangible assets 2 2 (2) -
Property, plant & equipment held for own use 3 132 - 132
Property (other than for own use) 4 17 - 17
Equities 5 43 - 43
Government bonds 6 2,871 - 2,871
Corporate bonds 6 2,073 - 2,073
Collateralised securities 6 9 - 9
Investment funds 7 44 - 44
Derivatives 8 5 - 5
Deposits other than cash equivalents 9 51 - 51
Unit linked assets 10 47,166 - 47,166
Loans and mortgages 11 108 - 108
Reinsurance recoverables Section D.2 1,975 (496) 1,479
Insurance & intermediaries receivables 12 24 - 24
Reinsurance receivables 13 94 - 94
Receivables (trade, not insurance) 14 4 - 4
Cash and cash equivalents 9 59 - 59
Any other assets, not elsewhere shown 15 137 - 137
44

2. VALUATION BASES, METHODS AND MAIN ASSUMPTIONS – SOLVENCY II V IFRSSolvency II sometimes uses a different set of valuation bases, methods and main assumptions than companies use for IFRS statutory financial statements. In this section we show where there are differences, and what those differences are, across various asset types as they apply for the financial year ended 31 December 2020.
Note 1: Deferred Acquisition Costs
Solvency II purposes: IFRS reporting purposes:
As per Article 12 of the Delegated Act, deferred acquisition costs are valued at nil for Solvency II purposes.
Acquisition costs for investment contracts represent those costs directly associated with acquiring new investment management service contracts. The company defers these costs to the extent that they are expected to be recoverable out of future revenues to which they relate.
Note 2: Intangible Assets
Solvency II purposes: IFRS reporting purposes:
As per Article 12 of the Delegated Act, intangible assets are valued at nil for Solvency II purposes, unless the intangible asset can be sold separately, and the company can demonstrate that there is a value for the same or similar assets derived in accordance with Article 10 of the Delegated Act.
Computer SoftwareComputer software is carried at cost, less amortisation (over a period of three to fifteen years) less provision for impairment, if any. The external costs and identifiable internal costs of acquiring and developing software are capitalised where it is probable that future economic benefits that exceed its cost will flow from its use over more than one year.
Purchased shareholders’ value of in force (VIF) businessWe have two business portfolios of long-term insurance and investment contracts that we acquired from other companies. The fair value of the portfolios is based on the net present value of the shareholders’ interest in the expected cash flows of the in-force business. On acquisition of these contracts the fair value was capitalised in the statement of financial position as an intangible asset. That part of the shareholders' interest which will be recognised as profit over the lifetime of the in-force policies is amortised and the discount is unwound on a systematic basis over the anticipated life of the related contracts (up to 20 years). Both portfolios were fully amortised at the end of the financial year.
All intangible assets are subject to an impairment review at least once a year. Events or changes in circumstances might mean that the carrying amount is not recoverable. If that is the case, it is written down through the income statement by the amount of any impairment loss identified in the year.
45
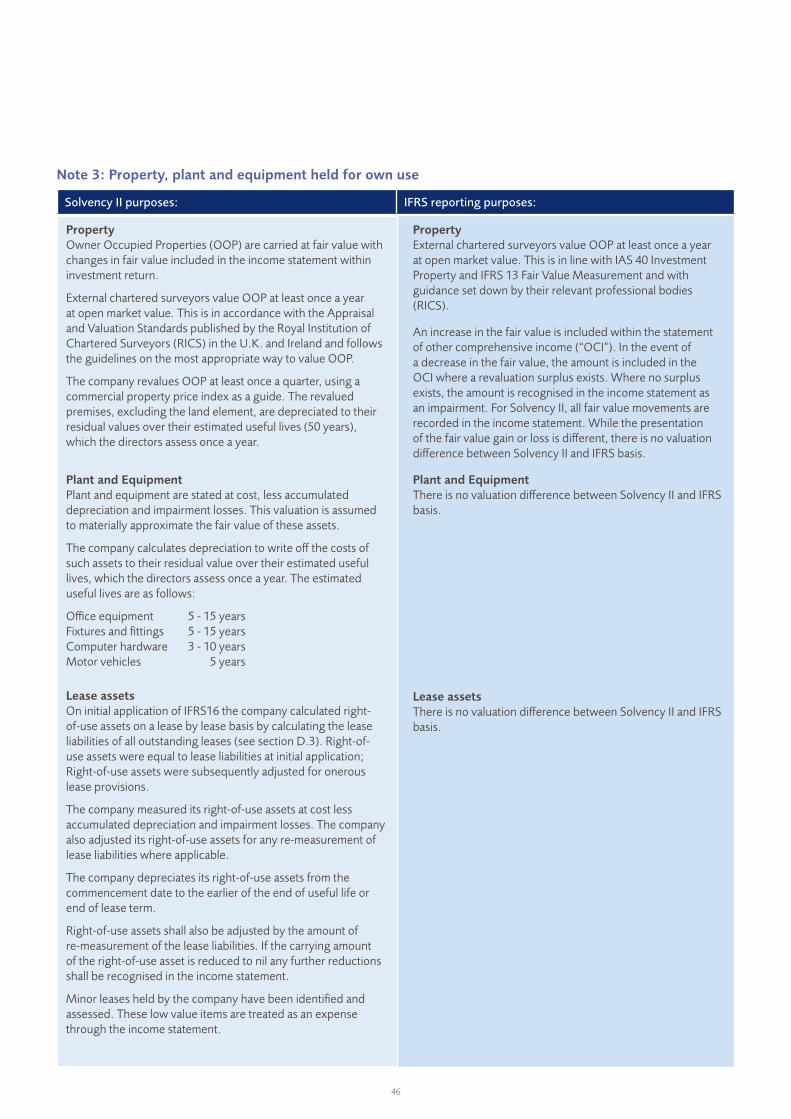
Note 3: Property, plant and equipment held for own use
Solvency II purposes: IFRS reporting purposes:
PropertyOwner Occupied Properties (OOP) are carried at fair value with changes in fair value included in the income statement within investment return.
External chartered surveyors value OOP at least once a year at open market value. This is in accordance with the Appraisal and Valuation Standards published by the Royal Institution of Chartered Surveyors (RICS) in the U.K. and Ireland and follows the guidelines on the most appropriate way to value OOP.
The company revalues OOP at least once a quarter, using a commercial property price index as a guide. The revalued premises, excluding the land element, are depreciated to their residual values over their estimated useful lives (50 years), which the directors assess once a year.
Plant and EquipmentPlant and equipment are stated at cost, less accumulated depreciation and impairment losses. This valuation is assumed to materially approximate the fair value of these assets.
The company calculates depreciation to write off the costs of such assets to their residual value over their estimated useful lives, which the directors assess once a year. The estimated useful lives are as follows:
Office equipment 5 - 15 years Fixtures and fittings 5 - 15 years Computer hardware 3 - 10 years Motor vehicles 5 years
Lease assets On initial application of IFRS16 the company calculated right-of-use assets on a lease by lease basis by calculating the lease liabilities of all outstanding leases (see section D.3). Right-of-use assets were equal to lease liabilities at initial application; Right-of-use assets were subsequently adjusted for onerous lease provisions.
The company measured its right-of-use assets at cost less accumulated depreciation and impairment losses. The company also adjusted its right-of-use assets for any re-measurement of lease liabilities where applicable.
The company depreciates its right-of-use assets from the commencement date to the earlier of the end of useful life or end of lease term.
Right-of-use assets shall also be adjusted by the amount of re-measurement of the lease liabilities. If the carrying amount of the right-of-use asset is reduced to nil any further reductions shall be recognised in the income statement.
Minor leases held by the company have been identified and assessed. These low value items are treated as an expense through the income statement.
PropertyExternal chartered surveyors value OOP at least once a year at open market value. This is in line with IAS 40 Investment Property and IFRS 13 Fair Value Measurement and with guidance set down by their relevant professional bodies (RICS).
An increase in the fair value is included within the statement of other comprehensive income (“OCI”). In the event of a decrease in the fair value, the amount is included in the OCI where a revaluation surplus exists. Where no surplus exists, the amount is recognised in the income statement as an impairment. For Solvency II, all fair value movements are recorded in the income statement. While the presentation of the fair value gain or loss is different, there is no valuation difference between Solvency II and IFRS basis.
Plant and EquipmentThere is no valuation difference between Solvency II and IFRS basis.
Lease assets There is no valuation difference between Solvency II and IFRS basis.
46

Note 4: Property (other than for own use)‘Property (other than for own use)’ means property we are holding for long-term rental yields and capital growth. It can be land or buildings.
Solvency II purposes: IFRS reporting purposes:
Investment properties are carried at fair value with changes in fair value included in the income statement within investment return.
External chartered surveyors value property at least once a year at open market value. This is in line with the Appraisal and Valuation Standards published by the Royal Institution of Chartered Surveyors (RICS) in the UK and Ireland and follows the guidelines on the most appropriate way to value property. Fair values take into account the highest and best use of the property and are based on yields which are applied to arrive at the property valuation.
Investment properties are revalued at least once a quarter using a commercial property price index as a guide.
External chartered surveyors value property at least once a year at open market value. This is in line with IAS 40 Investment Property and IFRS 13 Fair Value Measurement and with guidance set down by their relevant professional bodies (RICS).There is no valuation difference between Solvency II and IFRS basis.
Note 5: EquitiesEquities include common shares, preferred shares and exchange traded funds.
Solvency II purposes: IFRS reporting purposes:
The company values quoted equities based on the fair value determined by the closing bid price from the exchange where they are principally traded.
Management value unquoted equities in line with principles set down by the European Venture Capital Association. An unquoted equity valuation report is presented to the board at least once a year for review and approval.
There is no valuation difference between Solvency II and IFRS basis.
Note 6: Government Bonds, Corporate Bonds and Collateralised Securities
Solvency II purposes: IFRS reporting purposes:
The company values bonds based on the fair value determined by referring to quoted market bid prices. These are primarily from third-party independent pricing sources. If there are price movements above specified tolerances, the company makes sure those movements are correct by checking a second pricing source.
Where prices are not quoted in an active market, the company determines fair values by valuation models. The company maximises the use of observable inputs and minimises the use of unobservable inputs when measuring the fair value. The company uses a ‘mark to model’ valuation basis to determine a value appropriate to the industry sector. The model uses public bond spread data as a proxy for current spreads on fixed-interest assets. The company then uses this to develop a yield curve to discount the cash flows underlying the private placement to obtain its value.
For a limited number of small exposures or short duration bonds, the company uses amortised cost as a proxy for the mark to model valuation basis.
There is no valuation difference between Solvency II and IFRS basis.
47

Note 7: Investment FundsInvestment funds principally include Money Market Funds (MMFs).
Solvency II purposes: IFRS reporting purposes:
The company values MMFs at fair value based on a quoted market price where the asset is traded.
There is no valuation difference between Solvency II and IFRS basis.
Note 8: DerivativesDerivatives include currency forward rate contracts, currency swaps, futures contracts and forward rate agreements and options.
Solvency II purposes: IFRS reporting purposes:
The company values derivatives based on a counterparty valuation which is verified by an independent third-party valuation service.
There is no valuation difference between Solvency II and IFRS basis.
Note 9: Deposits other than cash equivalents; Cash and cash equivalentsDeposits other than cash equivalents’ means deposits we hold for investment purposes. ‘Cash and cash equivalents’ means cash we have in a bank or deposit account we hold ready to use for business operations.
Solvency II purposes: IFRS reporting purposes:
The company values cash and deposits at their face value. There is no valuation difference between Solvency II and IFRS basis.
Note 10: Unit-Linked AssetsWe hold unit-linked assets for the benefit of policyholders. They are made up of several kinds of investment assets, primarily:
1. property
2. equities
3. bonds
4. derivatives
5. deposits.
Both the Solvency II balance sheet and the IFRS statutory balance sheet present unit-linked assets as one line.
Note 10.1: Property (other than for own use)This means property we are holding for long-term rental yields and capital growth. It can be land or buildings.
Solvency II purposes: IFRS reporting purposes:
The company carries investment properties at fair value, with changes in fair value included in the income statement within investment return.
External chartered surveyors value property at least once a year at fair value in accordance with IAS 40 Investment Property and IFRS 13 Fair Value Measurement. This is in line with the RICS Valuation - Professional Standards 2017 published by the Royal Institution of Chartered Surveyors (RICS) in the U.K. and Ireland and follows the guidelines on the most appropriate way to value property.
Fair value is based on the highest and best use of the property, taking into account all of its particular attributes, including occupational tenancies, and prevailing market conditions.
There is no valuation difference between Solvency II and IFRS basis.
48

Note 10.2: EquitiesEquities include common shares, preferred shares and investments in collective investment schemes.
Solvency II purposes: IFRS reporting purposes:
The company values quoted equities based on the fair value determined by the closing bid price from the exchange where they are principally traded.
Management value unquoted equities in accordance with principles set down by the European Venture Capital Association. An unquoted valuation report is presented to the board at least once a year for review and approval.
The external manager values unlisted unit trusts using the latest published Net Asset Value (NAV). For funds providing daily liquidity, the most recent NAV for underlying listed unit trusts is rolled forward using the latest performance statistics that the relevant external manager has provided.
There is no valuation difference between Solvency II and IFRS basis.
Note 10.3: BondsBonds include government bonds, corporate bonds and collateralised securities.
Solvency II purposes: IFRS reporting purposes:
The company values bonds based on the fair value determined by referring to quoted market bid prices. These are primarily from third-party independent pricing sources. If there are price movements above specified tolerances, the company makes sure those movements are correct by checking a second pricing source.
Where prices are not quoted in an active market, the company determines fair values by valuation models. The company maximises the use of observable inputs and minimises the use of unobservable inputs when measuring the fair value. The company uses a ‘mark to model’ valuation basis to determine a value appropriate to the industry sector. The model uses public bond spread data as a proxy for current spreads on fixed-interest assets. The company then uses this to develop a yield curve to discount the cash flows underlying the private placement to obtain its value.
There is no valuation difference between Solvency II and IFRS basis.
Note 10.4: DerivativesDerivatives include Over-The-Counter derivatives (OTC), exchange traded derivatives, foreign exchange traded derivatives, currency forward rate contracts, futures contracts, forward rate agreements and options.
Solvency II purposes: IFRS reporting purposes:
The company uses the bid value supplied by the counterparty to value OTC Derivatives. The only exception to this is for options which are held in the PUTSELL fund. For these, the company uses the ask value provided by Bloomberg as these are held short. Where possible, the company uses independent third-party software to confirm the counterparty value is reasonable.
The company values exchange traded derivatives by using the closing price from the exchange in which they are traded.
The company values foreign exchange traded derivatives using a market feed of forward points and corresponding interest rates.
There is no valuation difference between Solvency II and IFRS basis.
49

Note 10.5: Deposits
Solvency II purposes: IFRS reporting purposes:
The company values deposits at their face value. There is no valuation difference between Solvency II and IFRS basis.
Note 11: Loans and Mortgages
Solvency II purposes: IFRS reporting purposes:
The company records loans and mortgages at fair value, determined by discounting expected future cash-flows using current market rates. Valuation inputs typically include benchmark yields and risk-adjusted spreads based on current lending activities and market activities.
There is no valuation difference between Solvency II and IFRS basis.
Note 12: Insurance & intermediaries receivables‘Insurance & intermediaries receivables’ includes outstanding premiums that policyholders are due to pay us.
Solvency II purposes: IFRS reporting purposes:
The company records receivables at their fair value, net of any amounts deemed as doubtful debts.
There is no valuation difference between Solvency II and IFRS basis.
Note 13: Reinsurance receivablesReinsurance receivables include the money that reinsurers are still due to pay us and the money we're due to receive from multinational pooling (MNP) arrangements.
Solvency II purposes: IFRS reporting purposes:
The company estimates amounts receivable from reinsurers in a manner consistent with the claim liability associated with the reinsured policy.
The company records MNP receivables on an accruals basis to account for premiums and claims activity that has not yet been agreed with the MNP.
There is no valuation difference between Solvency II and IFRS basis.
Note 14: Receivables (trade, not insurance)Receivables (trade, not insurance) relates to current tax owed to the company.
Solvency II purposes: IFRS reporting purposes:
The company records corporation tax assets at current tax rates. There is no valuation difference between Solvency II and IFRS basis.
Note 15: Any other assets, not elsewhere shown‘Any other assets, not elsewhere shown’ includes other unit-linked assets not shown anywhere else on the balance sheet, for example, broker outstanding balances. This section also includes other non-linked assets not shown anywhere else on the balance sheet, for example, intercompany debtors, accrued external fees and management charges due.
Solvency II purposes: IFRS reporting purposes:
The company records receivables at their fair value, net of any amounts deemed as doubtful debts.
There is no valuation difference between Solvency II and IFRS basis.
There have been no changes to the recognition and valuation basis during the year for the assets noted above.
There are no classes of assets subject to operating or finance lease arrangements.
For estimation uncertainty, please refer to section D.4 (Alternative Methods for Valuation).
50
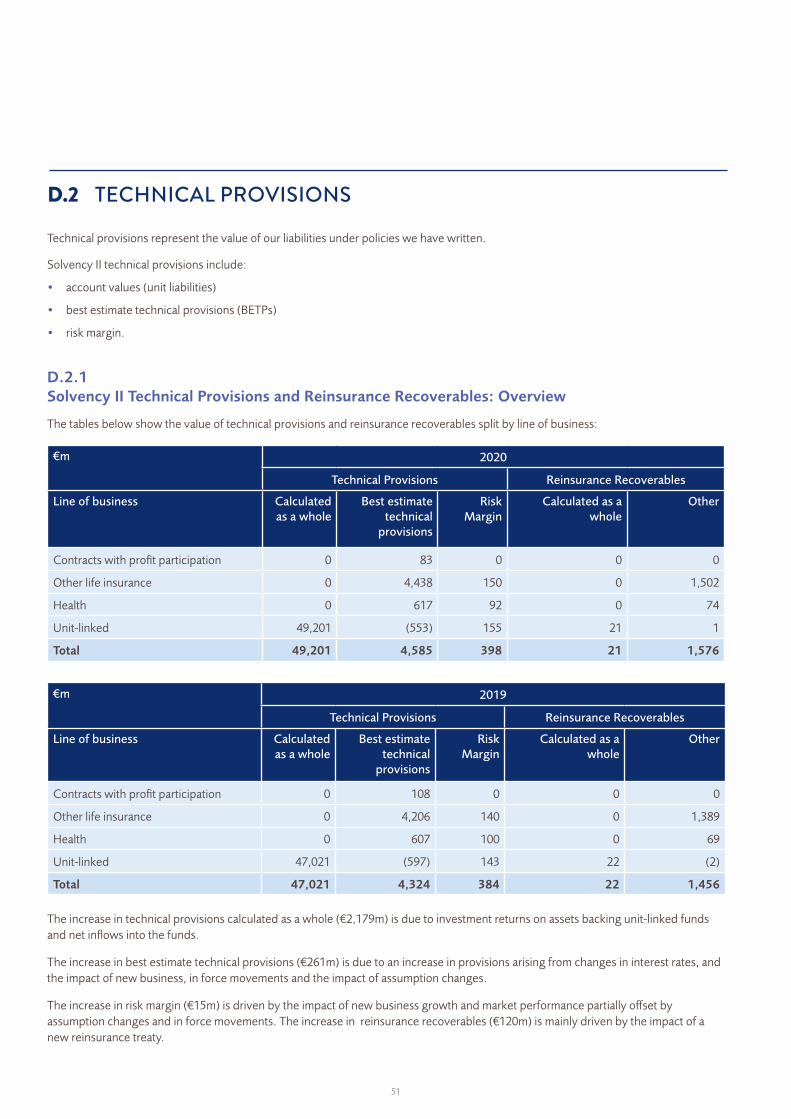
Technical provisions represent the value of our liabilities under policies we have written.
Solvency II technical provisions include:
• account values (unit liabilities)
• best estimate technical provisions (BETPs)
• risk margin.
D.2.1 Solvency II Technical Provisions and Reinsurance Recoverables: Overview
The tables below show the value of technical provisions and reinsurance recoverables split by line of business:
€m 2020
Technical Provisions Reinsurance Recoverables
Line of business Calculated as a whole
Best estimate technical
provisions
Risk Margin
Calculated as a whole
Other
Contracts with profit participation 0 83 0 0 0
Other life insurance 0 4,438 150 0 1,502
Health 0 617 92 0 74
Unit-linked 49,201 (553) 155 21 1
Total 49,201 4,585 398 21 1,576
€m 2019
Technical Provisions Reinsurance Recoverables
Line of business Calculated as a whole
Best estimate technical
provisions
Risk Margin
Calculated as a whole
Other
Contracts with profit participation 0 108 0 0 0
Other life insurance 0 4,206 140 0 1,389
Health 0 607 100 0 69
Unit-linked 47,021 (597) 143 22 (2)
Total 47,021 4,324 384 22 1,456
The increase in technical provisions calculated as a whole (€2,179m) is due to investment returns on assets backing unit-linked funds and net inflows into the funds.
The increase in best estimate technical provisions (€261m) is due to an increase in provisions arising from changes in interest rates, and the impact of new business, in force movements and the impact of assumption changes.
The increase in risk margin (€15m) is driven by the impact of new business growth and market performance partially offset by assumption changes and in force movements. The increase in reinsurance recoverables (€120m) is mainly driven by the impact of a new reinsurance treaty.
D.2 TECHNICAL PROVISIONS
51

D.2.1.1 Technical provisions calculated as a whole
Under Solvency II rules, certain technical provisions can be calculated “as a whole” which means that separate calculation of the best estimate and risk margin is not required. For ILA, unit liabilities representing the current account value of unit-linked contracts are classified as technical provisions as a whole. The value is based on the value of the underlying assets to which the contracts are linked. Other technical provisions are calculated as a best estimate plus a risk margin, as discussed in the sections below.
D.2.1.2 Best estimate technical provisions
Best estimate technical provisions (BETPs) represent the best estimate of the value of our obligations under the policies we have written.
The BETPs represent the probability-weighted average of future cash-flows, taking into account the time value of money. To allow for the time value of money we use the relevant risk-free interest rate term structure.
D.2.1.3 Reinsurance recoverables
We have a number of reinsurance arrangements in place which reduce our exposure to risks such as mortality risk, morbidity risk and longevity risk.
We work out the value of reinsurance recoverables like this:
The present value of the payments we expect to receive from reinsurers (under existing reinsurance arrangements) minus
The present value of the payments we expect to make to reinsurers (under existing reinsurance arrangements)
In general, the way we work out the value of reinsurance recoverables is the same as the way we work out the BETPs and in general, we use the same assumptions.
We do not have any reinsurance arrangements with special purpose vehicles.
D.2.1.4 Risk margin
The risk margin is meant to represent the extra premium that another insurer would require for taking on our insurance portfolio. It reflects the cost of holding the policy-related capital - the Solvency Capital Requirement (SCR) - for all our policies.
We work out the risk margin like this:
The present value of the projected capital on our existing business
multiplied by a cost-of-capital rate,
where the future capital in any given year is equal to the projected SCR arising on our existing business in that year.
EIOPA has prescribed a cost-of-capital rate of 6%.
We work out our aggregate risk margin and then split it between the lines of business, as in the table above.
D.2.2 Solvency II Technical Provisions and Reinsurance Recoverables: bases, methodology and assumptions
We work out the value of our BETPs and our reinsurance recoverables in line with Solvency II regulations. For most of our business, we use a projection of future cash-flows based on central assumptions. We make an adjustment to reflect a best estimate of catastrophe costs. In some cases we use different methods, which we discuss in the sections below covering the individual lines of business.
These are the three main categories of assumptions we use to work out the BETPs and reinsurance recoverables:
• demographic assumptions
• expense assumptions
• economic assumptions.
Demographic assumptions: include assumptions about how long policyholders will live, the rate at which they will die or get ill, and how many of them will let their policies lapse. We discuss these assumptions in the sections below that cover the demographic assumptions on each of the individual lines of business.
Expense assumptions: include assumptions about maintenance and investment expenses. We have set the expense assumptions based on the most recent expense investigation. We have taken into account the level of expenses we expect from different types of products and the amount of business in force.
The main economic assumptions are:
• the discount rate
• the rate of investment return on unit-linked funds
• the rate of increase of future benefits which are linked to inflation
• expense inflation.
We project future investment returns on unit-linked funds using the risk free yield curve specified by the EIOPA. We use the same risk free yields to discount the value of future cash-flows. We use the yield curve with the volatility adjustment for calculating
52

BETPs. (We discuss the volatility adjustment further in section D.2.5 Long Term Guarantee Measures). In line with the Solvency II requirements, we do not use the volatility adjustment when we work out the risk margin.
Our assumption about the inflation of future benefits is set considering the results of stochastic modelling. This considers a large number of possible future inflation scenarios. Our assumption about the inflation of expenses is based on long term assumptions about how we expect prices to go up, plus how we expect salaries to go up in excess of prices.
Our approach for working out expense and economic assumptions is similar across all lines of business.
Other than the difference in the yield curve noted above, the projected capital requirements we use to calculate the risk margin are based on the same assumptions we use to calculate the BETPs.
D.2.2.1 Demographic assumptions: Contracts with profit participation
This line of business includes participating endowment and whole life policies, as well as a small number of participating deferred annuity contracts.
The main demographic assumptions for this line of business are assumptions about the rate at which policyholders die or let their policies lapse. We generally make these assumptions based on our experience investigations. We apply expert judgement to make sure there is enough allowance for relevant trends or factors we expect to change.
D.2.2.2 Demographic assumptions: Other Life Insurance
This line of business includes annuity business, individual and group non-linked protection business.
The main demographic assumptions for this line of business are assumptions about the rate at which policyholders will die or get ill, and how many of them will let their policies lapse. We generally make these assumptions based on our experience investigations. We apply expert judgement to make sure there is enough allowance for relevant trends or factors we expect to change.
D.2.2.3 Demographic assumptions: Health
This line of business includes group and individual income protection business, and group serious illness business.
The main demographic assumptions for this line of business are assumptions about when policyholders will get ill, and when policyholders who are receiving income protection benefits will recover or die. We generally make these assumptions based on our experience investigations. We apply expert judgement to make sure there is enough allowance for relevant trends or factors we expect to change.
D.2.2.4 Demographic assumptions: Unit-Linked
This line of business includes unit-linked investment policies.
For most unit-linked business we use a projection of future cash-flows based on central assumptions to work out the BETPs and reinsurance recoverables. This is based on our best estimate assumptions. For material investment guarantees, we work out the BETPs using stochastic models. This means we use a large number of possible economic scenarios to work out the cost of the guarantees. The BETP is the average cost under all those scenarios.
The main demographic assumptions for this line of business are assumptions about the rate at which policyholders will die or get ill, and how many of them will surrender their policies early or let them lapse. We generally make these assumptions based on our experience investigations. We apply expert judgement to make sure there is enough allowance for relevant trends or factors we expect to change.
D.2.2.5 Significant simplifications used in the calculation of technical provisions
We use some simplifications when we work out the risk margin.
The actuarial valuation system produces an accurate projection of most of the SCR components used to work out the risk margin. Where this is not possible due to system constraints, we use a simplified method, which Solvency II regulations allow. Where we have adopted a simplified approach for projecting a component of the SCR, we use the risks that drive that component to project that component.
We do not use any other significant simplifications in the way we work out our technical provisions.
D.2.3 Level of uncertainty associated with the value of technical provisions
The value of the BETPs is based on expected future cash-flows. We work these out based on a number of assumptions. We explain the main assumptions in section D.2.1 Solvency II Technical Provisions and Reinsurance Recoverables: Overview above.
There is inherent uncertainty. Actual experience may differ from
53

our assumptions over time, and this may result in us changing our assumptions in the future.
Some of the key sources of uncertainty within the BETPs are the rate at which policyholders will die or get ill, how long they live, how many of them will let their policies lapse, and expenses.
• If the rate at which life insurance policyholders die - the mortality rate - or the rate at which they get ill - the morbidity rate - goes up, so will our BETPs. We partly mitigate against this uncertainty with our reinsurance arrangements.
• If people with annuities from us live longer, our BETPs go up. Again we partly mitigate against this uncertainty with reinsurance arrangements on some annuity blocks.
• Generally, if more policyholders let their policies lapse - a higher lapse rate - our BETPs go up. This is because the BETPs allow for the expected value of future profits, which will go down if more policyholders let their policies lapse.
• If expenses go up, so will our BETPs.
Our BETPs also vary depending on market movements, in particular movements in interest rates and the equity and property markets.
When interest rates change, the impact on our BETPs is usually offset, to a broad extent, by changes in the value of the assets backing our BETPs.
Equity and property values have an impact on future profits on unit-linked business. So they have an impact on our BETPs. If equity or property values fall, this will reduce our future profits on unit-linked business and increase our BETPs.
This table shows how our main assumptions affect our BETPs, net of reinsurance (excluding participating business):
Sensitivity Test Impact on BETPs (€m)
10% fall in equity and property values +82
10% increase in maintenance expenses +87
10% increase in policy lapse rates +18
10% decrease in policy lapse rates -19
5% increase in mortality rates (assured lives) +21
5% deterioration in morbidity rates +39
5% decrease in annuity mortality rates +25
D.2.4 Differences between Solvency II technical provisions and insurance contract liabilities and investment contract liabilities included in the financial statements
We prepare financial statements under International Financial Reporting Standards (IFRS). The basis of how we value our liabilities for IFRS is different from the basis Solvency II requires. The main differences are:
INVESTMENT CONTRACTS
IFRS allow for some recognition of future profits, through the recognition of Deferred Acquisition Costs (DAC) asset, net of the Deferred Front End Fees (DFEF). Solvency II gives a greater allowance for the present value of future profits on investment contracts within the BETPs, subject to some restrictions.
INSURANCE CONTRACTS
There are three main differences in the approach to valuing insurance contracts:
1. Under IFRS, we value insurance contracts using best estimate assumptions, but we allow for margins for adverse deviation. These margins allow for the possibility of mis-estimation and for our best estimate assumptions deteriorating in the future. The margins also provide reasonable assurance that insurance contract liabilities cover a range of possible outcomes.
Under Solvency II, we value all contracts (both investment and insurance contracts) using best estimate assumptions and a prescribed yield curve. We also allow for the risk associated with the business (quantified as the cost of capital) through the risk margin.
2. Under IFRS, the liability on any policy which is allowed to surrender is subject to a floor of zero.
Under Solvency II, there is no similar restriction on liability valuations.
3. Under IFRS, for participating business, the value of liabilities in the financial statements does not allow for future terminal dividends. The excess of assets over liabilities is reflected in the non-controlling interest line of the financial statements.
Under Solvency II, the technical provisions reflect the best estimate of future terminal dividends.
For each line of business, these tables show the differences between the Solvency II technical provisions and the technical provisions included in the financial statements (including insurance contract liabilities, investment contract liabilities and unit-linked liabilities):
54
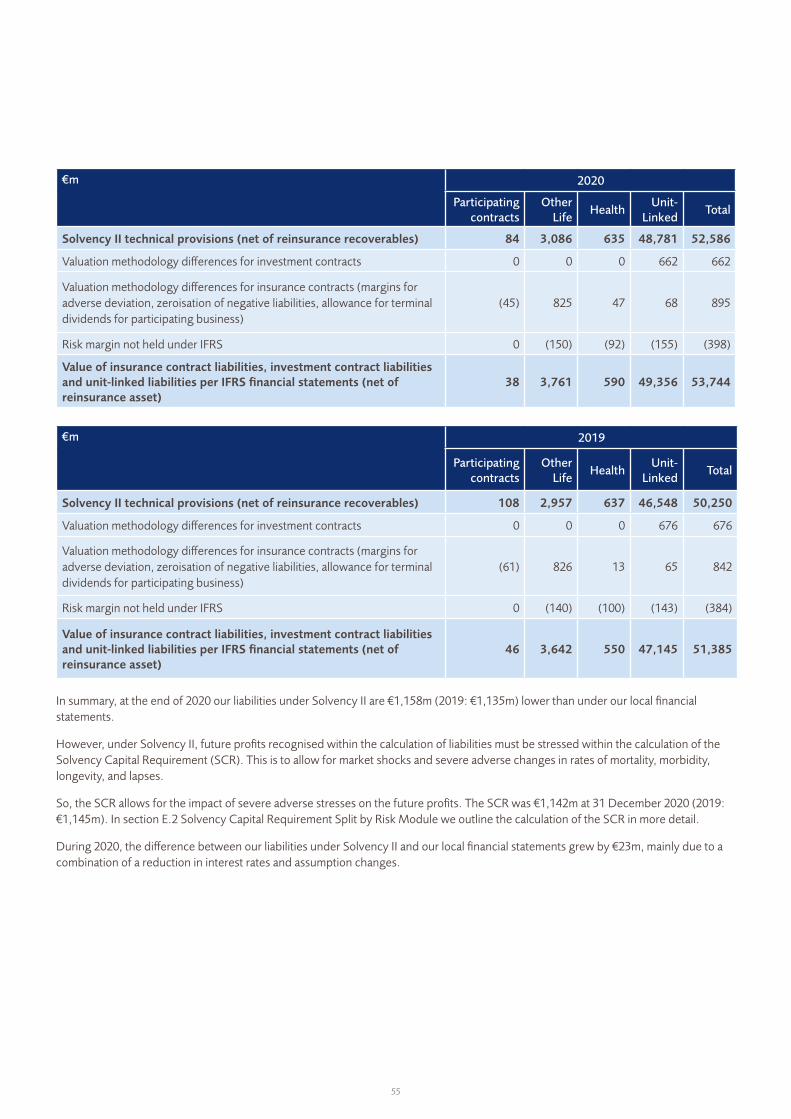
€m 2020
Participating contracts
Other Life
HealthUnit-
LinkedTotal
Solvency II technical provisions (net of reinsurance recoverables) 84 3,086 635 48,781 52,586
Valuation methodology differences for investment contracts 0 0 0 662 662
Valuation methodology differences for insurance contracts (margins for adverse deviation, zeroisation of negative liabilities, allowance for terminal dividends for participating business)
(45) 825 47 68 895
Risk margin not held under IFRS 0 (150) (92) (155) (398)
Value of insurance contract liabilities, investment contract liabilities and unit-linked liabilities per IFRS financial statements (net of reinsurance asset)
38 3,761 590 49,356 53,744
€m 2019
Participating contracts
Other Life
HealthUnit-
LinkedTotal
Solvency II technical provisions (net of reinsurance recoverables) 108 2,957 637 46,548 50,250
Valuation methodology differences for investment contracts 0 0 0 676 676
Valuation methodology differences for insurance contracts (margins for adverse deviation, zeroisation of negative liabilities, allowance for terminal dividends for participating business)
(61) 826 13 65 842
Risk margin not held under IFRS 0 (140) (100) (143) (384)
Value of insurance contract liabilities, investment contract liabilities and unit-linked liabilities per IFRS financial statements (net of reinsurance asset)
46 3,642 550 47,145 51,385
In summary, at the end of 2020 our liabilities under Solvency II are €1,158m (2019: €1,135m) lower than under our local financial statements.
However, under Solvency II, future profits recognised within the calculation of liabilities must be stressed within the calculation of the Solvency Capital Requirement (SCR). This is to allow for market shocks and severe adverse changes in rates of mortality, morbidity, longevity, and lapses.
So, the SCR allows for the impact of severe adverse stresses on the future profits. The SCR was €1,142m at 31 December 2020 (2019: €1,145m). In section E.2 Solvency Capital Requirement Split by Risk Module we outline the calculation of the SCR in more detail.
During 2020, the difference between our liabilities under Solvency II and our local financial statements grew by €23m, mainly due to a combination of a reduction in interest rates and assumption changes.
55

D.2.5 Long Term Guarantee MeasuresLong Term Guarantee measures are optional measures available to companies under the Solvency II regime. Long Term Guarantee measures can help to reduce the impact of credit spread changes on a company’s solvency position.
The Long Term Guarantee measures available to us include the matching adjustment and the volatility adjustment:
• The matching adjustment allows a company to adjust the Solvency II yield curve when they value policy liabilities. The company can adjust it by an amount that is linked to the yield on the backing assets it holds.
• The volatility adjustment allows a company to adjust the Solvency II yield curve by an amount which varies based on credit spreads on a specified asset portfolio.
We do not apply the matching adjustment.
We use the volatility adjustment for calculating technical provisions. At the end of 2020, the volatility adjustment represented an increase in the Solvency II forward rate yield curve of 7 basis points for the first 20 years.
These tables show the impact of reducing the volatility adjustment to zero on technical provisions (net of reinsurance recoverables), eligible Own Funds, the SCR and the MCR.
€m 2020
With volatility adjustment
Without volatility adjustment
Impact of volatility adjustment reducing to zero
Technical Provisions (net of reinsurance recoverables)7 52,586 52,622 36
Basic Own Funds 2,010 1,979 (31)
Eligible Own Funds 2,010 1,979 (31)
Solvency Capital Requirement (SCR) 1,142 1,144 3
Minimum Capital Requirement (MCR) 514 515 1
Solvency Margin Ratio 176% 173% (3)%
€m 2019
With volatility adjustment
Without volatility adjustment
Impact of volatility adjustment reducing to zero
Technical Provisions (net of reinsurance recoverables)7 50,250 50,284 34
Basic Own Funds 1,934 1,904 (30)
Eligible Own Funds 1,934 1,904 (30)
Solvency Capital Requirement (SCR) 1,145 1,148 3
Minimum Capital Requirement (MCR) 515 516 1
Solvency Margin Ratio 169% 166% (3)%
The year on year impact of reducing the volatility adjustment to zero is consistent with the magnitude of the adjustment to the yield curve arising from the volatility adjustment during 2020.
7 The impact on technical provisions net of reinsurance recoverables is comprised of an increase in gross of reinsurance technical provisions of €48m (2019: €45m) and an increase in reinsurance recoverables of €12m (2019: €11m).
D.2.6 Transitional MeasuresWe do not apply the transitional risk-free interest rate-term structure. Nor do we apply the transitional deduction to technical provisions.
D.2.7 Changes to assumptions compared to previous reporting periodThe main changes to our assumptions since 31 December 2019 calculations are:
• we updated our assumptions about mortality, morbidity and lapse rates, based on the results of our most recent experience investigations
• we updated assumptions about expenses, based on the results of our most recent expense investigations
• we updated the discount rate and the assumed rate of future investment returns on unit-linked funds based on changes in the risk free yield curve specified by EIOPA.
56

This section is about our valuation of each kind of ‘other liability’ for Solvency II purposes. This includes explanations of:
1. how the value of each other liability for Solvency II is different from valuing it for statutory financial reporting that meets the EU’s International Financial Reporting Standards (IFRS).
2. the valuation bases, methods and main assumptions used for Solvency II and those used for statutory IFRS financial statements for the financial year ended 31 December 2020.
The Solvency II balance sheet is in Appendix 1.
1. VALUATION DIFFERENCES – SOLVENCY II V IFRSBalance Sheet Extract – Other Liabilities
The IFRS values in the following tables are as recorded in our annual report and financial statements. The Liability Type categorisation here is per the Solvency II balance sheet and not directly comparable to categorisation applied in the IFRS Statement of Financial Position.
D.3 OTHER LIABILITIES
2020
Liability Type (€m) Note IFRS Valuation Adjustments
Solvency II
Other provisions 1 (101) 100 (1)
Pension benefit obligations 2 (1) - (1)
Deposits from reinsurers 3 (122) - (122)
Deferred tax liabilities 4 (50) (125) (175)
Derivative liabilities See Section D.1.2 (4) - (4)
Debts owed to credit institutions 5 (20) - (20)
Financial Liabilities other than debts owed to credit institutions
6 (17) - (17)
Insurance & intermediaries payables 7 (370) - (370)
Reinsurance payables 8 (25) - (25)
Payables (trade, not insurance) 9 - - -
Other liabilities 10 (216) - (216)
2019
Liability Type (€m) Note IFRS Valuation Adjustments
Solvency II
Other provisions 1 (119) 118 (1)
Pension benefit obligations 2 (1) - (1)
Deferred tax liabilities 4 (54) (125) (179)
Derivative liabilities Section D.1.2 (4) - (4)
Debts owed to credit institutions 5 (6) - (6)
Financial Liabilities other than debts owed to credit institutions
6 (19) - (19)
Insurance & intermediaries payables 7 (295) - (295)
Reinsurance payables 8 (25) - (25)
Payables (trade, not insurance) 9 (2) - (2)
Other liabilities 10 (122) - (122)
57

2. VALUATION BASES, METHODS AND MAIN ASSUMPTIONS – SOLVENCY II V IFRSIn this section you’ll find the valuation basis for Solvency II purposes for each class of liability in the table above. We also explain the differences between Solvency II and the IFRS statutory financial statements when it comes to valuation bases, methods and main assumptions used for the financial year ended 31 December 2020.
Note 1: Other provisions‘Other provisions’ include onerous contract provisions, customer complaints provisions and legal provisions.
In 2020, the onerous contract provision is accounted for within property, plant and equipment in line with IFRS 16, Leases. Customer complaints provisions and legal provisions are ongoing.
The valuation adjustment to other provisions is in relation to Deferred Front End Fees (DFEF).
Solvency II purposes: IFRS reporting purposes:
The company derives the value of each provision by management reviewing and evaluating the expected outflow required to settle the liability to which the provision applies. These reviews are presented to the Board Audit Committee for approval and inclusion in the Qualitative Reporting Templates (QRTs).
Similar to DAC, as per Article 12 of the Delegated Act, DFEF are valued at nil for Solvency II purposes.
Initial fees earned and incremental costs (mainly commission) paid on sale of an investment contract are deferred and recognised over the expected life of the contract. The company estimates the expected life of the contracts based on current experience and the term of the contracts. The company reviews this at least once a year. The maximum amortisation period for DFEF is 20 years.
Note 2: Pension benefit obligationsWe operate a defined benefit pension scheme and a hybrid scheme with a defined benefit element. Some staff participate in a defined benefit pension scheme - an Irish scheme sponsored by Canada Life Irish Holding Company Limited (CLIH), a member of the Canada Life Group. These schemes are closed to new members and from 30 June 2018, were closed to future accrual. Existing members have joined our defined contribution plan for future service pension provision beyond this date. Members have retained the benefits they accrued up to the date of closure of the schemes and these benefits are still linked to final salary.
These schemes are funded by contributions into separately administered trust funds. The benefits paid from the defined benefit schemes are based on percentages of the employees' final pensionable pay for each year of credited service. Under the rules of each of the Irish Life schemes, pension increases are wholly at the discretion of the schemes' principal employer.
Solvency II purposes: IFRS reporting purposes:
The net obligation of the company's defined benefit schemes represent the present value of the obligation to employees in respect of services to date, less the fair value of the plan assets. It is based on the IAS19 accounting standard.
The external scheme actuary calculates the present value of the obligation once a year. The present value of the obligation is determined by discounting the estimated future cash flows.
The discount rate is based on the market yield of high quality corporate bonds that have maturity dates approximating to the terms of the pension liability.
The estimated future cash-flows are based on the accrued past service benefits, future salary inflation, future price inflation and assumptions made about mortality.
There is no valuation difference between Solvency II and IFRS basis.
58

This table shows the annual movement in our Benefit Obligation liabilities:
Benefit obligation 2020 (€m) 2019 (€m)
Benefit obligation as at 1 January (1,376) (1,231)
Current service cost (1) (1)
Net interest cost (22) (28)
Actuarial loss (experience adjustments, financial and demographic changes) (95) (143)
Contributions by plan participants - -
Curtailment gain 7 2
Benefits paid 23 25
Benefit obligation as at 31 December (1,464) (1,376)
This table shows the nature and composition of our plan assets:
Asset Type 2020 Fair Value (€m)
2020 Plan assets (%)
2019 Fair Value (€m)
2019 Plan assets (%)
Equities 554 38 561 41
Bonds 783 54 691 50
Property 110 7 114 8
Cash and cash equivalents 16 1 9 1
Fair value of plan assets at 31 December 1,463 100 1,375 100
Note 3: Deposits from reinsurers Deposits from reinsurers are funds held by the company under reinsurance contracts. Premiums and claims due in the period are paid to or withdrawn from the funds withheld account.
Solvency II purposes: IFRS reporting purposes:
The company estimates amounts payable to reinsurers in a manner consistent with the claim liability associated with the reinsured policy.
There is no valuation difference between Solvency II and IFRS basis.
Note 4: Deferred tax liabilitiesDeferred tax is recognised in respect of all timing differences that have originated, but not yet reversed, at the balance sheet date. This means where transactions or events have occurred at that date it will result in an obligation to pay more tax or a right to pay less tax.
When calculating a net deferred tax liability, deferred tax assets are offset only to the extent that it is more likely than not that there will be suitable taxable profits from which the future reversal of the underlying timing differences can be deducted. The tax rate used to calculate the deferred tax balance is the rate that’s expected to be in-force at the time the tax becomes payable. There is no expiry date of taxable temporary differences.
Solvency II purposes: IFRS reporting purposes:
Article 15 of the Delegated Act dictates how the company accounts for deferred tax. It says that the company should:
• Recognise and value deferred taxes in relation to all assets and liabilities, including technical provisions.
There are no valuation differences between Solvency II and IFRS basis. However there is a deferred tax effect, resulting from the various accounting differences between Solvency II and Financial Statements as discussed throughout this document.
59
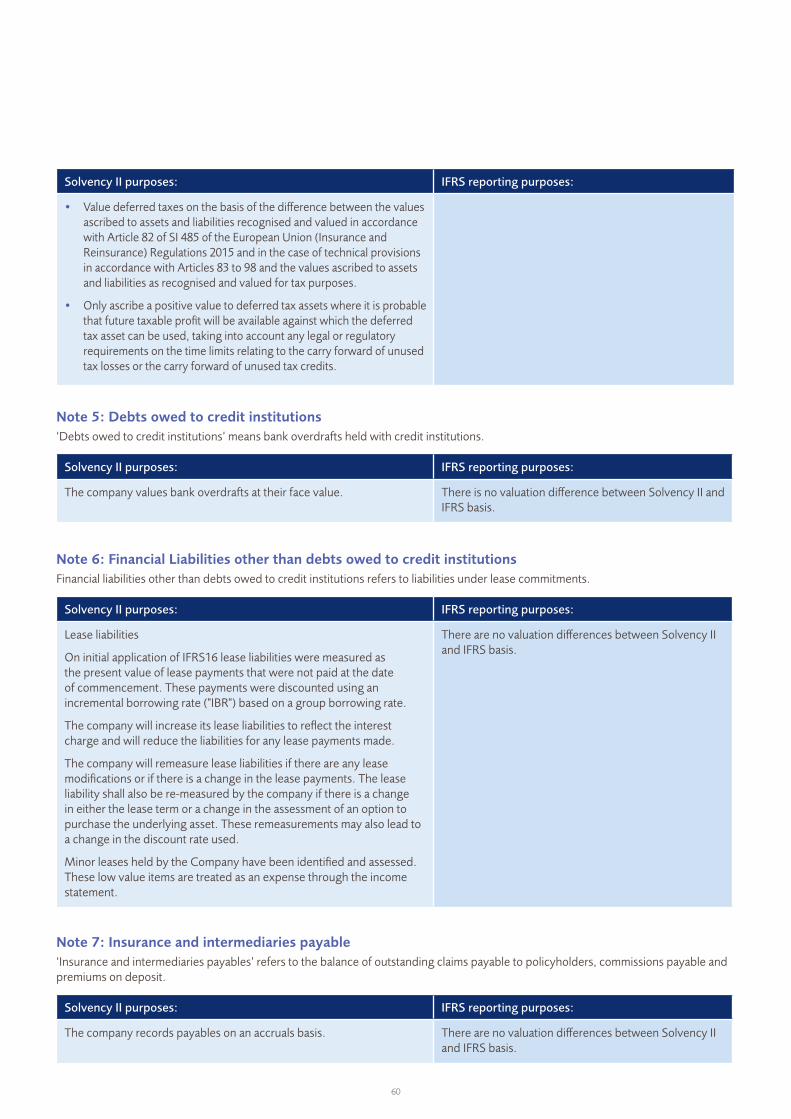
Solvency II purposes: IFRS reporting purposes:
• Value deferred taxes on the basis of the difference between the values ascribed to assets and liabilities recognised and valued in accordance with Article 82 of SI 485 of the European Union (Insurance and Reinsurance) Regulations 2015 and in the case of technical provisions in accordance with Articles 83 to 98 and the values ascribed to assets and liabilities as recognised and valued for tax purposes.
• Only ascribe a positive value to deferred tax assets where it is probable that future taxable profit will be available against which the deferred tax asset can be used, taking into account any legal or regulatory requirements on the time limits relating to the carry forward of unused tax losses or the carry forward of unused tax credits.
Note 5: Debts owed to credit institutions‘Debts owed to credit institutions’ means bank overdrafts held with credit institutions.
Solvency II purposes: IFRS reporting purposes:
The company values bank overdrafts at their face value. There is no valuation difference between Solvency II and IFRS basis.
Note 6: Financial Liabilities other than debts owed to credit institutionsFinancial liabilities other than debts owed to credit institutions refers to liabilities under lease commitments.
Solvency II purposes: IFRS reporting purposes:
Lease liabilities
On initial application of IFRS16 lease liabilities were measured as the present value of lease payments that were not paid at the date of commencement. These payments were discounted using an incremental borrowing rate ("IBR") based on a group borrowing rate.
The company will increase its lease liabilities to reflect the interest charge and will reduce the liabilities for any lease payments made.
The company will remeasure lease liabilities if there are any lease modifications or if there is a change in the lease payments. The lease liability shall also be re-measured by the company if there is a change in either the lease term or a change in the assessment of an option to purchase the underlying asset. These remeasurements may also lead to a change in the discount rate used.
Minor leases held by the Company have been identified and assessed. These low value items are treated as an expense through the income statement.
There are no valuation differences between Solvency II and IFRS basis.
Note 7: Insurance and intermediaries payable‘Insurance and intermediaries payables’ refers to the balance of outstanding claims payable to policyholders, commissions payable and premiums on deposit.
Solvency II purposes: IFRS reporting purposes:
The company records payables on an accruals basis. There are no valuation differences between Solvency II and IFRS basis.
60

Note 8: Reinsurance payables'Reinsurance payables' represent the balance due to reinsurers for outstanding reinsurance premiums and experience rating refunds for monies due to multinational pooling (MNP) arrangements.
Solvency II purposes: IFRS reporting purposes:
The company records payables on an accruals basis.
The company records MNP payables on an accruals basis to account for premiums and claims activity that has not yet been agreed with the MNP.
There are no valuation differences between Solvency II and IFRS basis.
Note 9: Payables (trade, not insurance)'Payables (trade, not insurance)' represent the current tax liability of the company.
Solvency II purposes: IFRS reporting purposes:
The company provides corporation tax payable on taxable profits at current tax rates.
There are no valuation differences between Solvency II and IFRS basis
Note 10: Other liabilities‘Other liabilities’ includes other unit-linked liabilities not shown anywhere else on the balance sheet, for example outstanding balances with brokers. This section also includes other non-linked liabilities not shown anywhere else on the balance sheet, for example intercompany liabilities, other taxation balances (PAYE, Exit Tax) and accruals.
Solvency II purposes: IFRS reporting purposes:
The company records payables on an accruals basis. There are no valuation differences between Solvency II and IFRS basis.
During the year there have been no changes to the recognition and valuation basis of the liabilities noted above.
During 2017 we granted a legal charge over a block of assets to support liabilities to a specific policyholder. The value of these assets at the end of 2020 was €287m (2019: €282m). We have substantially retained the benefit of all the risks and rewards associated with these assets and continue to recognise them as available to meet the liability to the policyholder. In certain circumstances, the policyholder could enforce the charge and obtain control of the assets to offset our obligation to them under the policy, the likelihood of which is remote.
For estimation uncertainty, please refer to section D.4 (Alternative Methods for Valuation).
OVERVIEW OF METHODOLOGY FOR VALUING INVESTED ASSETSThe Technical Specification (EIOPA 14/209) outlines the Solvency II rules on how to value assets and liabilities, other than technical provisions. It says that, unless otherwise stated, the default reference framework should be the international accounting standards, as adopted by the European Commission in line with Regulation (EC) No 1606/2002.
In most cases those international accounting standards (IFRS) and Solvency II give consistent valuations.
For our annual statutory financial statements we recognise assets and liabilities in line with IFRS. For our regulatory reporting we follow Central Bank guidelines.
As required under IFRS 13 (Fair Value Measurement), our annual audited statutory financial statements disclose how we value assets and liabilities across level 1, 2 and 3. This is the fair value hierarchy.
D.4 ALTERNATIVE METHODS FOR VALUATION
61
No other items to note.
D.5 ANY OTHER INFORMATION
• Level 1: fair value measurements based on quoted market prices (unadjusted) in active markets for identical assets or liabilities that the entity can access at the measurement date.
• Level 2: fair value measurements based on inputs other than quoted prices included within level 1 that are observable for the asset or liability either directly (i.e. as prices) or indirectly (i.e. derived from prices).
• Level 3: fair value measurements based on valuation techniques that include inputs for the asset and liability that are based on unobservable market data.
Level 1 and 2 show what’s known as a ‘mark to market’ approach. This means values are based on readily available prices in orderly transactions that are sourced externally.
Level 3 shows a ‘marked to model’ approach. This means values are based on assumptions or financial models.
Where assets are ‘marked to model’ the relevant primary investment manager must maintain supporting documentation addressing:
• a description of the process followed (model design) and the data/assumptions used by the approach (including assessment of data quality)
• the reason why a ‘mark to market’ approach is not possible
• the sign-off process applied in reviewing the valuation and other applicable controls (such as any applicable benchmarking of valuation output to other comparable methods)
• the level of uncertainty inherent in the valuation approach and an assessment of the model’s performance in this case, which should include any particular circumstances where the approach would be expected to be ineffective
• the results of any independent check performed in relation to model outputs
• possible alternative valuation models where primary models are complex.
At least once a year, the relevant primary investment manager presents a report to our Board Audit Committee for review and approval. The report outlines how the manager priced the asset, what management considered appropriate and the resulting valuation of unquoted securities we hold. These unquoted securities primarily consist of bonds, venture capital and unit trusts.
The Group Reporting Committee (GRC) is made up of the Finance Director (Chairman), Chief Actuary, Head of Group Valuation and Reporting, Head of Group Finance and Executive Financial Reporting Manager. The GRC is responsible for
monitoring and reviewing the Financial Reporting and Disclosure Policy, including making recommendations to the Board Audit Committee and assessing the application of the policy.
Among other responsibilities, the GRC is required to assess the relevance and adequacy of the policies associated with the valuation of assets and liabilities at least once a year. This has to include taking into consideration changes in accounting rules and policies as governed by the international accounting standards.
For invested assets, we expect that our primary investment managers maintain:
• sufficient independence in valuing assets
• sufficient documentation of applicable standards and guidelines
• sufficient control over valuation models
• sufficient management information
• consistent governance between internally and externally managed funds.
This is set out in our investment management agreements.
Where the unit-linked and non-linked investment managers hold units in the same fund, both investment managers will ensure they use the same fund price at the end of each quarter. Where this is not practical, the investment managers will contact the group financial reporting and control team to assess options. If the investment managers propose to use different prices for the same assets at the end of the financial year, this will be brought to the attention of the Board Audit Committee and set out the reasoning behind their proposal. The Board Audit Committee will review and, if appropriate, ratify the proposal.
We base estimates and associated assumptions on experience and various other factors that we believe to be reasonable under the circumstances. These factors are reflected in our judgements about the carrying amounts of assets and liabilities that are not objectively verifiable. We review estimates and underlying assumptions on an on-going basis. Where necessary, we revise them to reflect current conditions. This applies to uncertainties that arise on estimations we use when we value assets and liabilities.
ILA-invested assets are managed by three separate entities, two of which are part of the GWL group. ILA’s unit-linked invested assets are primarily managed by Irish Life Investment Managers Limited (ILIM). A small percentage of ILA’s unit-linked invested assets comprise the third-party Self Directed Funds (SDFs). These are managed by Irish Progressive Services International Limited (IPSI), a third-party administration company and former subsidiary of Irish Life Group Limited. ILA’s non-linked invested assets are managed by Canada Life Asset Management Limited (CLAM).
62

E. CAPITAL MANAGEMENT
‘Own Funds’ refers to the excess of the value of our assets over the value of our liabilities, where the value of our liabilities includes technical provisions and other liabilities.
Own Funds are divided into three tiers based on their permanence, and how well they can absorb losses. Tier 1 funds are of the highest quality.
We manage our Own Funds so that the solvency position stays within a targeted range although management may choose to operate outside this targeted range from time to time in order to provide financial flexibility.
E.1.1 Management of Own Funds
Our policy is to manage the capital base so that we meet all regulatory requirements. We also aim to maintain investor, creditor and market confidence, and to make sure there is enough capital to support our future growth. Our business planning process, which considers projections over a five year time frame, informs our capital management.
We manage our Own Funds so that we maintain high quality capital, mainly equity. The assets backing our Own Funds are mainly made up of:
• relatively secure assets such as fixed interest assets, as well as some owner occupied property holdings
• the expected value of future profits from our existing business, which we include when we calculate technical provisions (as discussed in section D.2 Technical Provisions). A large part of this value is offset by capital requirements in the Solvency Capital Requirement (SCR).
E.1 OWN FUNDS
This section describes the components of our Own Funds as at 31 December 2020, as well as the policies and processes we use to make sure we meet all regulatory capital requirements when we manage Own Funds.
63

E.1.2 Components of Own Funds
This table sets out and assesses the way we value and calculate our Own Funds:
Solvency II Own Fund Item How we value Own Funds (according to Solvency II rules)
Assessment
Ordinary share capital
Valued in accordance with Article 75 of Directive 2009/138.
This is the share capital and share premium, based on the company’s statutory accounts.
Share premium account related to ordinary share capital
All of the company’s share capital and share premium is classed as Tier 1 unrestricted.
Surplus funds
Article 91 of Directive 2009/138 (Article 106 of SI 485) defines surplus funds: "1. Surplus funds shall be deemed to be accumulated profits which have not been made available for distribution to policy holders and beneficiaries”
Tiering is in line with Article 69 of the Delegated Act.
The definition is understood to mean surplus available to With Profit fund holders.
Reconciliation reserveValued in accordance with Article 70 of the Delegated Act.
The reconciliation reserve equals the excess of assets over liabilities from the company Solvency II balance sheet. It is reduced by the following amounts:
i) Own shares - n/a
ii) Foreseeable dividends
iii) The basic own fund items listed above - ordinary share capital, share premium and surplus fund
iv) Restrictions relating to the company’s ring-fenced funds - see below
In line with Article 69, all reconciliation reserve is classed as Tier 1 unrestricted.
Restrictions in respect of the company’s ring-fenced funds
Valued in accordance with Article 81 of the Delegated Act.
Restrictions apply in respect of the assets in the company’s ring-fenced funds. The amount which must be deducted from Own Funds is calculated separately for each ring-fenced fund as: the value of assets held within the ring-fenced fund minus the value of the liabilities of the ring-fenced fund minus the SCR for the ring-fenced fund. The deduction in respect of each ring-fenced fund is subject to a minimum of zero.
Expected profits included in the future premiums
Valued in accordance with Article 70 of the Delegated Act.
Expected profit in future premiums contributes to the company’s Own Funds, as discussed in section C.4.1 Expected Profit Included in Future Premium. This is classed as Tier 1 unrestricted and is already included in the reconciliation reserve amount.
We do not hold any hybrid instruments.
64

This table shows the breakdown of our Own Funds:
€m 31 December 2020 31 December 2019
Tier 1 - unrestricted
Issued share capital 1 1
Share premium account 340 340
Surplus funds - -
Reconciliation reserve 1,669 1,593
Available Own Funds (before foreseeable dividends and adjustments) 2,010 1,934
Foreseeable dividends, distributions and charges - -
Ring-fenced funds adjustment (Participating Funds) - -
Total available Own Funds to meet the SCR 2,010 1,934
RECONCILIATION RESERVEThe reconciliation reserve will vary over time based on the experience of the company, including lapse and claims, expense levels and the impact of writing future new business.
CHANGES IN OWN FUNDS IN 2020Overall, Own Funds have increased by €76m in 2020.
The €76m increase is mostly due to:
• margins which emerged from our existing business
• experience gains and the impact of assumption changes
• offset by the impact of investment market returns during 2020 on the insurance business
Movements in the company’s Own Funds in the future will depend on the company’s experience and dividend payments. We intend to manage our Own Funds so that the solvency position stays within a targeted range, as noted at the beginning of Section E.1 Own Funds.
DEFERRED TAXESThe company's Own Funds include a net deferred tax liability of €174.6m as at 31 December 2020. This reflects tax that is expected to be paid in the future, if the future profits reflected in Own Funds arise as expected, and on undeclared surplus on net life business (as described in Section D.3.2, Note 4).
No deferred tax asset is held under Solvency II at the year end 2020.
RING-FENCED FUNDSWe have three ring-fenced funds relating to our pension schemes, and two ring-fenced funds relating to our Participating Business.
In the table above, there is a €0.1m deduction for ring-fenced funds on 31 December 2020 (2019: €0.3m). This relates to the excess of the surplus over the SCR in our ring-fenced Participating Funds.
For our pension schemes, the excess of liabilities over assets is €1.0m (2019: €1.0m). We show this on the balance sheet as a liability, and so it does not result in any additional available assets. As a result, we do not need to make any deductions to Own Funds relating to these pension schemes.
DEDUCTIONS TO OWN FUNDS AND RESTRICTIONS ON TRANSFERABILITYThere are no other deductions to Own Funds. There are also no significant restrictions on how we can transfer our Own Funds.
LIMITS ON ELIGIBILITY OF CAPITALThe limits on eligible Tier 2 capital, Tier 3 capital and restricted Tier 1 capital have no impact on our eligible Own Funds to cover the SCR.
ILA has no restricted Tier 1, Tier 2 or Tier 3 capital as at 31 December 2020.
65

E.1.3 Eligible Own Funds to cover Solvency Capital Requirement (SCR) and Minimum Capital Requirement (MCR)
This table sets out our eligible Own Funds to cover the SCR and MCR:
€m 31 December 2020 31 December 2019
Tier 1 - unrestricted 2,010 1,934
Tier 1 - restricted - -
Eligible Own Funds to meet SCR 2,010 1,934
Solvency Capital Requirement (SCR) 1,142 1,145
Solvency ratio 176% 169%
Minimum Capital Requirement (MCR) 514 515
Eligible Own Funds as a percentage of MCR 391% 375%
E.1.4 Equity in financial statements compared to Solvency II Own Funds
We prepare our financial statements under International Financial Reporting Standards (IFRS) rules.
There are some differences between the equity in our financial statements and the Solvency II Own Funds:
• The way we value insurance contract liabilities (including reinsurance assets) and investment contract liabilities in the financial statements differs from how technical provisions are valued under Solvency II (as discussed in section D.2 Technical Provisions).
• The financial statements allow us to defer incremental acquisition costs and upfront fees through a Deferred Acquisition Costs (DAC) asset and Deferred Front End Fees (DFEF) liability. These are not allowed under Solvency II valuation rules (as discussed in section D.1 Assets and D.3 Other Liabilities above).
• Our intangible assets are valued as nil under Solvency II (as discussed in section D.1 Assets above).
• We adjust deferred tax liabilities to reflect the impact on tax when assets and liabilities are valued differently (as discussed above).
This table shows the difference between the equity in the financial statements and the Solvency II Own Funds at the year end.
€m 31 December 2020 31 December 2019
Solvency II Own Funds 2,010 1,934
Differences in technical provisions (1,158) (1,135)
Investment contracts DAC and DFEF 209 199
Differences in valuation of intangible assets 1 2
Deferred tax 124 124
Proposed dividends - -
Other - -
Financial statements: shareholder equity plus non-controlling interest 1,186 1,124
The difference between Solvency II Own Funds and shareholder equity plus non-controlling interest in the financial statements has increased from €810m at 31 December 2019 to €824m at 31 December 2020. This is mainly due to the larger increase in policy liabilities in the financial statements relative to the technical provisions under Solvency II, due to a combination of a reduction in interest rates, investment market returns and assumption changes.
66

We calculate the SCR using the standard formula. The SCR includes:
• the Basic Solvency Capital Requirement (BSCR)
• the SCR for operational risk
• any adjustments for the loss-absorbing capacity of deferred taxes and technical provisions.
We calculate the BSCR using these six risk modules:
• market
• counterparty (default)
• life underwriting
• non-life underwriting
• health underwriting
• intangible assets.
We combine the results from each of these risk modules using correlation factors.
The table below shows the split of the SCR. The non-life underwriting and intangible assets risk modules do not apply to us, so are not included in the table.
€m 31 December 2020
31 December 2019
Market risk 695 689
Counterparty risk 40 33
Life Underwriting risk 717 707
Health Underwriting risk 240 267
Operational risk 62 59
Diversification impacts (449) (447)
Loss absorbing capacity of deferred tax
(163) (163)
SCR 1,142 1,145
Note: In the table above, we have shown the SCR for each risk category after allowing for the impact of the loss absorbing capacity of technical provisions. This mainly impacts the market risk category. In Appendix 6, the SCR for each risk category is shown before allowing for the loss absorbing capacity of technical provisions, and the loss absorbing capacity of technical provisions is shown separately. Another reason for a difference in the SCRs in comparison to Appendix 6 is how the adjustment for diversification due to ring fenced funds is allocated to the individual SCRs. The presentation of the QRT in Appendix 6 is in line with the EIOPA SFCR guidelines.
The SCR decreased by €3m during 2020, from €1,145m at 31 December 2019 to €1,142m at 31 December 2020. The decrease is mainly due to:
• a €27m decrease in the Health Underwriting Risk, primarily due to movements in the existing book of business net of new business growth
• a €10m increase in the Life Underwriting Risk, mainly due to the impact of interest rates on our longevity risk
• a €7m increase in the Counterparty Risk due to an increase in exposures during 2020
• a €5m increase in the Market Risk, mainly due to a reduction in interest rates in 2020.
E.2.1 Use of simplified methods
Every stress or shock impact we used to calculate our overall SCR was produced separately on a full calculation basis. This means that we do not use any of the simplifications allowed in the Delegated Acts when we calculate the SCR except for the ones mentioned below.
We did use some simplifications when we worked out the counterparty SCR:
• We used a simple 85% factor to reduce the value of the collateral assets for reinsurance (excluding funds withheld), which allowed for market risk.
• For Retail Life, we split the overall risk mitigating effect from reinsurance by counterparty. We assumed that the risk mitigating effect was split between counterparties in the same proportion as the best estimate reinsurance asset is split between counterparties
E.2.2 Undertaking specific parameters and capital add-ons
We do not use undertaking specific parameters. No capital add-ons apply to us.
E.2 SOLVENCY CAPITAL REQUIREMENT SPLIT BY RISK MODULE
E.1.5 Transitional arrangements
We do not use any Solvency II transitional arrangements.
E.1.6 Ancillary Own Funds
We do not have any ancillary own fund items.
67
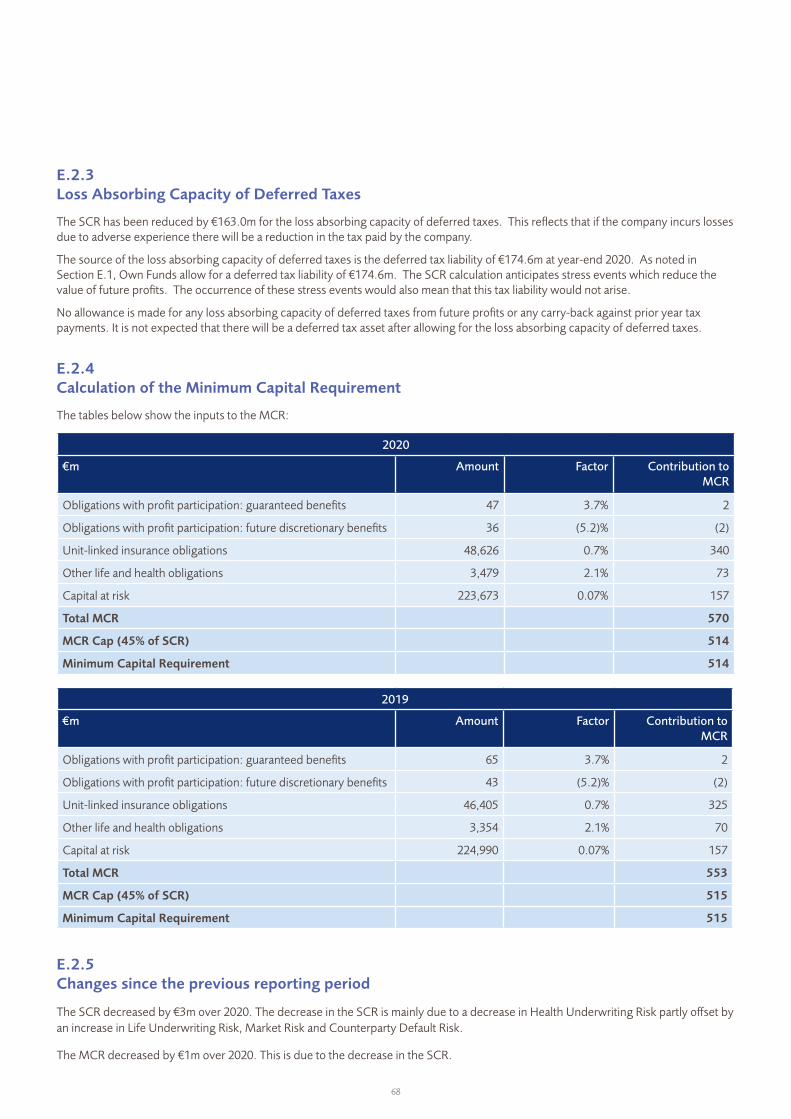
E.2.3 Loss Absorbing Capacity of Deferred Taxes
The SCR has been reduced by €163.0m for the loss absorbing capacity of deferred taxes. This reflects that if the company incurs losses due to adverse experience there will be a reduction in the tax paid by the company.
The source of the loss absorbing capacity of deferred taxes is the deferred tax liability of €174.6m at year-end 2020. As noted in Section E.1, Own Funds allow for a deferred tax liability of €174.6m. The SCR calculation anticipates stress events which reduce the value of future profits. The occurrence of these stress events would also mean that this tax liability would not arise.
No allowance is made for any loss absorbing capacity of deferred taxes from future profits or any carry-back against prior year tax payments. It is not expected that there will be a deferred tax asset after allowing for the loss absorbing capacity of deferred taxes.
E.2.4 Calculation of the Minimum Capital Requirement
The tables below show the inputs to the MCR:
2020
€m Amount Factor Contribution to MCR
Obligations with profit participation: guaranteed benefits 47 3.7% 2
Obligations with profit participation: future discretionary benefits 36 (5.2)% (2)
Unit-linked insurance obligations 48,626 0.7% 340
Other life and health obligations 3,479 2.1% 73
Capital at risk 223,673 0.07% 157
Total MCR 570
MCR Cap (45% of SCR) 514
Minimum Capital Requirement 514
2019
€m Amount Factor Contribution to MCR
Obligations with profit participation: guaranteed benefits 65 3.7% 2
Obligations with profit participation: future discretionary benefits 43 (5.2)% (2)
Unit-linked insurance obligations 46,405 0.7% 325
Other life and health obligations 3,354 2.1% 70
Capital at risk 224,990 0.07% 157
Total MCR 553
MCR Cap (45% of SCR) 515
Minimum Capital Requirement 515
E.2.5 Changes since the previous reporting period
The SCR decreased by €3m over 2020. The decrease in the SCR is mainly due to a decrease in Health Underwriting Risk partly offset by an increase in Life Underwriting Risk, Market Risk and Counterparty Default Risk.
The MCR decreased by €1m over 2020. This is due to the decrease in the SCR.
68
We do not use the duration based equity risk sub-module.
E.3 USE OF DURATION BASED SUB-MODULE IN THE CALCULATION OF THE SOLVENCY CAPITAL REQUIREMENT
We use the standard formula to calculate the SCR.
No other items to note.
During 2020 we were in compliance with the SCR and MCR requirements.
E.4 DIFFERENCES BETWEEN STANDARD FORMULA AND ANY INTERNAL MODEL USED
E.6 ANY OTHER INFORMATION
E.5 NON-COMPLIANCE WITH THE MINIMUM CAPITAL REQUIREMENT AND NON-COMPLIANCE WITH THE SOLVENCY CAPITAL REQUIREMENT
69

GLOSSARY
Accommodative policy stancesAccommodative monetary policy, also known as loose credit or easy monetary policy, occurs when a central bank attempts to expand the overall money supply to boost the economy when growth is slowing (as measured by Gross Domestic Product (GDP)).
Ancillary own fundsInvestment, or capital, that’s been promised to a company but not paid. For Solvency II, this counts as capital towards an insurer's Solvency Capital Requirement. However, it only counts as Ancillary Own Funds - and therefore towards Solvency II requirements - if:
• the insurer could call in the capital at any point
• there are no conditions attached to transferring the capital
• the regulator has approved the commitment to transfer the capital.
Annualised rate An annualised rate of return is calculated as the equivalent annual return an investor receives over a given period.
Annual premium equivalentAnnual premium equivalent (APE) is a common sales measure calculation used by insurance companies, where the sales are measured by taking the value of regular premiums, plus 10% of single premiums written during the year.
Arms length feeFee charged in a transaction between two related parties should be the same as that in a transaction between two unrelated parties on the open market.
Assets under administrationAssets managed by a financial institution on behalf of a client.
BancassurancePartnership between a bank and an insurance company to allow a bank to sell insurance products.
Bear marketA bear market is when prices of securities fall sharply, and a sweeping negative view causes the sentiment to further entrench itself. As investors anticipate losses in a bear market and selling continues, pessimism grows.
BPSBasis points (BPS) refers to a common unit of measure for interest rates and other percentages in finance. One basis point is equal to 1/100th of 1%, or 0.01%, or 0.0001, and is used to denote the percentage change in a financial instrument.
Bulk annuity A group of policies written by an insurer that pays retirement income to policyholders. We typically sell bulk annuities when a defined benefit pension scheme wants to insure its liabilities. This usually happens when a pension scheme is being wound up.
Capital add-on An additional amount of capital which the supervisory authority may, in exceptional circumstances, require a company to hold over and above the Solvency Capital Requirement.
Capital at riskThe loss that an insurance company would make if someone with a policy dies. The capital at risk for any policy cannot be less than zero.
It is calculated like this:
• the amount that the company would pay if the person died, minus
• the amount that the company would receive from reinsurers if the person died, under its reinsurance arrangements, minus
• the technical provisions minus reinsurance recoverables that the company holds for that policy.
The total capital at risk is the sum of the capital at risk for all the policies the company has written.
70

Correlation factorsFactors which reflect the relationships between the risks included in the calculation of the Solvency Capital Requirement.
Defined ContributionDefined contribution (DC) schemes are occupational pension schemes where a customer's contributions and their employer’s contributions are both invested and the proceeds used to buy a pension and/or other benefits at retirement. The value of the ultimate benefits payable from the DC scheme depends on the amount of contributions paid, the investment return achieved less any fees and charges, and the cost of buying the benefits.
Delegated actOne of the tools the EU uses to put a law in place. Generally, they use an ‘implementing act’ for ruling on procedure and on how to follow legislation that already exists in other acts. They use a ‘delegated act’ for ruling on the content of legislation. A delegated act might, for example, add or change elements of a piece of legislation that are not fundamental to that legislation’s essence.
The Solvency II regime involves both implementing acts and delegated acts.
DerivativesFinancial products made up of assets packaged together. The value of the product depends on - or ‘derives’ from - the value of the underlying assets. The asset could be, for example, currency or a commodity. Futures and options are examples of derivatives.
Duration based equity risk sub-moduleThis allows a company to hold a lower SCR in respect of some equity holdings, as long as it meets certain conditions and gets approval from the supervisory authority.
Forward rate agreementsAn agreement to buy a particular amount of currency at a fixed price on a fixed date in the future.
Future discretionary benefitsBenefits which ILA may pay in addition to the minimum benefits payable under a policyholders’ contract. For example, for participating business (see definition), bonuses may be paid to policyholders based on the profits of the participating fund.
Hybrid instrumentsAn investment product that combines two or more different financial instruments, usually an equity and a debt security.
Irish Life Multi Asset Portfolios (MAPS®)Irish Life MAPS® are a range of unit linked funds, which are available across pension, investment and savings plans. There are five MAPS funds. Each fund is managed to a specific risk level.
Lapse rateA measure of how often customers cancel their policies early or stop paying premiums. It is usually calculated as the number of policies which lapsed in a given year out of the total number of policies that were in place in that year.
Loss absorbing capacity of technical provisionsThe reduction in the SCR which arises due to reductions in future discretionary benefits (see definition) expected in adverse scenarios.
Off balance sheetNot on a company’s balance sheet. Items that are considered off balance sheet are generally ones the company does not have legal claim to or responsibility for.
Onerous contract provisionsA contract where the unavoidable costs of meeting the obligations under the contract exceed its expected economic benefits.
Own Risk and Solvency Assessment (ORSA)A set of processes which assess a company’s risk profile and the capital it needs to hold in light of these risks. It assesses both the current risk profile, and what it is likely to be in the future. It helps us make decisions, and analyse strategy and risk. In line with standard insurance regulations, we carry out an ORSA each year.
Participating businessPolicies where the benefits paid to policyholders include bonuses which vary depending on the profits earned by a fund (the ‘participating fund’) which the company maintains.
Peripheral BondsSpain, Portugal, Italy and Greece are called 'peripheral' because of their higher bond yields and more volatile spreads. The 10-year spread (the market benchmark) reflects the difference between the yield on a country's 10-year bond and the yield on the German benchmark bond.
Ring-fenced fundA fund where a company cannot use the assets within the fund to meet liabilities outside the fund.
SecuritisationDifferent types of contractual debt being pooled, and then sold to various investors.
Special purpose vehicleAn entity formed by a company for a particular project or task, usually to hold assets.
Transitional arrangementsArrangements which allow companies to gradually switch from the Solvency I to Solvency II capital calculation basis.
With profit fund holdersPolicyholders whose benefits include bonuses which vary depending on the profits earned by a ‘participating fund’ (see ‘participating business’ definition).
71

APPENDICES
Amounts in the tables that follow are in €’000s.
72
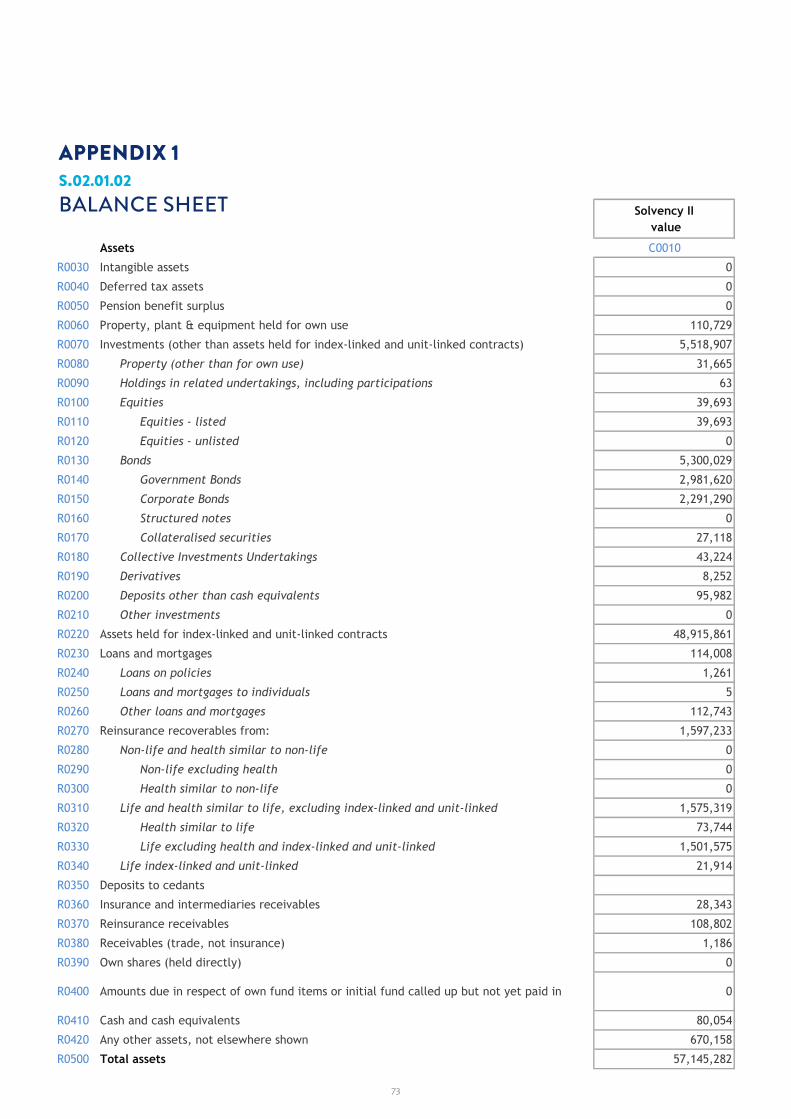
APPENDIX 1 S.02.01.02 BALANCE SHEET
S.02.01.02
Balance sheetSolvency II
value
Assets C0010
R0030 Intangible assets 0
R0040 Deferred tax assets 0
R0050 Pension benefit surplus 0
R0060 Property, plant & equipment held for own use 110,729
R0070 Investments (other than assets held for index-linked and unit-linked contracts) 5,518,907
R0080 Property (other than for own use) 31,665
R0090 Holdings in related undertakings, including participations 63
R0100 Equities 39,693
R0110 Equities - listed 39,693
R0120 Equities - unlisted 0
R0130 Bonds 5,300,029
R0140 Government Bonds 2,981,620
R0150 Corporate Bonds 2,291,290
R0160 Structured notes 0
R0170 Collateralised securities 27,118
R0180 Collective Investments Undertakings 43,224
R0190 Derivatives 8,252
R0200 Deposits other than cash equivalents 95,982
R0210 Other investments 0
R0220 Assets held for index-linked and unit-linked contracts 48,915,861
R0230 Loans and mortgages 114,008
R0240 Loans on policies 1,261
R0250 Loans and mortgages to individuals 5
R0260 Other loans and mortgages 112,743
R0270 Reinsurance recoverables from: 1,597,233
R0280 Non-life and health similar to non-life 0
R0290 Non-life excluding health 0
R0300 Health similar to non-life 0
R0310 Life and health similar to life, excluding index-linked and unit-linked 1,575,319
R0320 Health similar to life 73,744
R0330 Life excluding health and index-linked and unit-linked 1,501,575
R0340 Life index-linked and unit-linked 21,914
R0350 Deposits to cedants
R0360 Insurance and intermediaries receivables 28,343
R0370 Reinsurance receivables 108,802
R0380 Receivables (trade, not insurance) 1,186
R0390 Own shares (held directly) 0
R0400 Amounts due in respect of own fund items or initial fund called up but not yet paid in 0
R0410 Cash and cash equivalents 80,054
R0420 Any other assets, not elsewhere shown 670,158
R0500 Total assets 57,145,282
73

S.02.01.02
Balance sheet
Solvency II value
Liabilities C0010
R0510 Technical provisions - non-life 0
R0520 Technical provisions - non-life (excluding health) 0
R0530 TP calculated as a whole 0
R0540 Best Estimate 0
R0550 Risk margin 0
R0560 Technical provisions - health (similar to non-life) 0
R0570 TP calculated as a whole 0
R0580 Best Estimate 0
R0590 Risk margin 0
R0600 Technical provisions - life (excluding index-linked and unit-linked) 5,380,650
R0610 Technical provisions - health (similar to life) 709,075
R0620 TP calculated as a whole 0
R0630 Best Estimate 616,693
R0640 Risk margin 92,382
R0650 Technical provisions - life (excluding health and index-linked and unit-linked) 4,671,575
R0660 TP calculated as a whole 0
R0670 Best Estimate 4,520,927
R0680 Risk margin 150,648
R0690 Technical provisions - index-linked and unit-linked 48,802,649
R0700 TP calculated as a whole 49,200,577
R0710 Best Estimate -553,006
R0720 Risk margin 155,078
R0740 Contingent liabilities 0
R0750 Provisions other than technical provisions 1,374
R0760 Pension benefit obligations 1,438
R0770 Deposits from reinsurers 121,713
R0780 Deferred tax liabilities 174,568
R0790 Derivatives 3,947
R0800 Debts owed to credit institutions 19,942
R0810 Financial liabilities other than debts owed to credit institutions 17,019
R0820 Insurance & intermediaries payables 370,412
R0830 Reinsurance payables 25,054
R0840 Payables (trade, not insurance) 0
R0850 Subordinated liabilities 0
R0860 Subordinated liabilities not in BOF 0
R0870 Subordinated liabilities in BOF 0
R0880 Any other liabilities, not elsewhere shown 216,326
R0900 Total liabilities 55,135,093
R1000 Excess of assets over liabilities 2,010,189
APPENDIX 1 S.02.01.02 BALANCE SHEET continued
74

APPE
ND
IX 2
S.05
.01.0
2
PREM
IUM
S, C
LAIM
S AN
D E
XPEN
SES
BY L
INE
OF
BUSI
NES
SS.
05.0
1.02
Life
Hea
lth
insu
ranc
e
Insu
ranc
e w
ith
prof
it
part
icip
atio
n
Inde
x-lin
ked
and
unit
-lin
ked
insu
ranc
e
Oth
er li
fe
insu
ranc
e
Ann
uiti
es
stem
min
g fr
om
non-
life
insu
ranc
e co
ntra
cts
and
rela
ting
to
heal
th
insu
ranc
e ob
ligat
ions
Ann
uiti
es
stem
min
g fr
om
non-
life
insu
ranc
e co
ntra
cts
and
rela
ting
to
insu
ranc
e ob
ligat
ions
oth
er
than
hea
lth
insu
ranc
e ob
ligat
ions
Hea
lth
rein
sura
nce
Life
re
insu
ranc
e
C021
0C0
220
C023
0C0
240
C025
0C0
260
C027
0C0
280
C030
0
Prem
ium
s w
ritt
en
R141
0G
ross
95
,082
1,19
85,
605,
703
502,
803
6,20
4,78
7
R142
0Re
insu
rers
' sha
re6,
246
016
,539
341,
143
363,
928
R150
0N
et88
,836
1,19
85,
589,
164
161,
661
5,84
0,85
9
Prem
ium
s ea
rned
R151
0G
ross
96
,231
1,19
85,
605,
703
500,
266
6,20
3,39
7
R152
0Re
insu
rers
' sha
re6,
246
016
,539
341,
143
363,
928
R160
0N
et89
,985
1,19
85,
589,
164
159,
123
5,83
9,47
0
Clai
ms
incu
rred
R161
0G
ross
70
,056
22,4
654,
460,
039
442,
790
4,99
5,35
0
R162
0Re
insu
rers
' sha
re3,
261
012
,391
271,
322
286,
975
R170
0N
et66
,795
22,4
654,
447,
648
171,
468
4,70
8,37
5
Chan
ges
in o
ther
tec
hnic
al p
rovi
sion
s
R171
0G
ross
44
,669
-3,1
542,
214,
457
175,
967
2,43
1,93
9
R172
0Re
insu
rers
' sha
re4,
275
04,
222
150,
725
159,
222
R180
0N
et40
,394
-3,1
542,
210,
235
25,2
422,
272,
717
R190
0Ex
pens
es in
curr
ed28
,419
273
262,
741
122,
528
413,
961
R250
0O
ther
exp
ense
s20
7
R260
0To
tal e
xpen
ses
414,
168
Prem
ium
s, c
laim
s an
d ex
pens
es b
y lin
e of
bus
ines
s
Line
of
Busi
ness
for
: lif
e in
sura
nce
oblig
atio
nsLi
fe r
eins
uran
ce o
blig
atio
ns
Tota
l
75
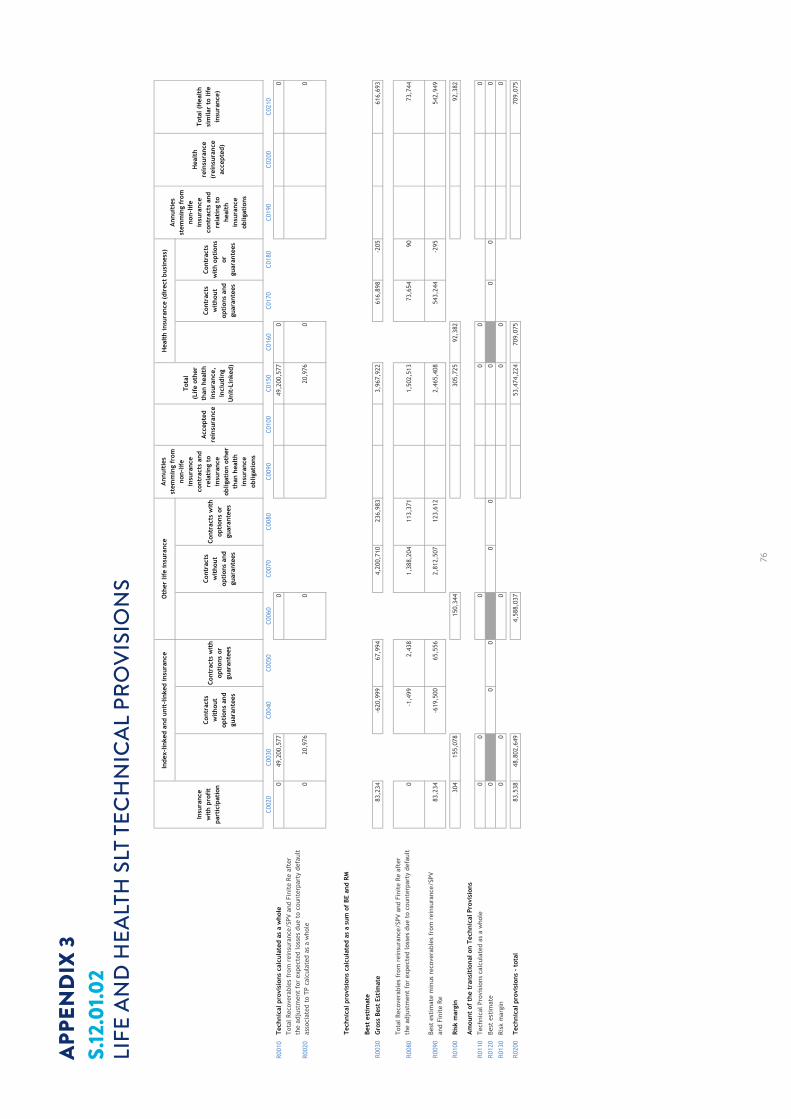
APPE
ND
IX 3
S.12
.01.0
2
LIFE
AN
D H
EALT
H S
LT T
ECH
NIC
AL P
ROVI
SIO
NS
S.12
.01.
02
Life
and
Hea
lth
SLT
Tech
nica
l Pro
visi
ons
Cont
ract
s w
itho
utop
tion
s an
d gu
aran
tees
Cont
ract
s w
ith
opti
ons
or
guar
ante
es
Cont
ract
s w
itho
utop
tion
s an
d gu
aran
tees
Cont
ract
s w
ith
opti
ons
or
guar
ante
es
Cont
ract
s w
itho
ut
opti
ons
and
guar
ante
es
Cont
ract
s w
ith
opti
ons
or
guar
ante
es
C002
0C0
030
C004
0C0
050
C006
0C0
070
C008
0C0
090
C010
0C0
150
C016
0C0
170
C018
0C0
190
C020
0C0
210
R001
0Te
chni
cal p
rovi
sion
s ca
lcul
ated
as
a w
hole
049
,200
,577
049
,200
,577
00
R002
0
Tota
l Rec
over
able
s fr
om r
eins
uran
ce/S
PV a
nd F
init
e Re
aft
er
the
adju
stm
ent
for
expe
cted
loss
es d
ue t
o co
unte
rpar
ty d
efau
lt
asso
ciat
ed t
o TP
cal
cula
ted
as a
who
le0
20,9
760
20,9
760
0
Tech
nica
l pro
visi
ons
calc
ulat
ed a
s a
sum
of
BE a
nd R
M
Best
est
imat
e
R003
0G
ross
Bes
t Es
tim
ate
83,2
34-6
20,9
9967
,994
4,20
0,71
023
6,98
33,
967,
922
616,
898
-205
616,
693
R008
0
Tota
l Rec
over
able
s fr
om r
eins
uran
ce/S
PV a
nd F
init
e Re
aft
er
the
adju
stm
ent
for
expe
cted
loss
es d
ue t
o co
unte
rpar
ty d
efau
lt0
-1,4
992,
438
1,38
8,20
411
3,37
11,
502,
513
73,6
5490
73,7
44
R009
0Be
st e
stim
ate
min
us r
ecov
erab
les
from
rei
nsur
ance
/SPV
an
d Fi
nite
Re
83,2
34-6
19,5
0065
,556
2,81
2,50
712
3,61
22,
465,
408
543,
244
-295
542,
949
R010
0Ri
sk m
argi
n30
415
5,07
815
0,34
430
5,72
592
,382
92,3
82
Am
ount
of
the
tran
siti
onal
on
Tech
nica
l Pro
visi
ons
R011
0Te
chni
cal P
rovi
sion
s ca
lcul
ated
as
a w
hole
00
00
00
R012
0Be
st e
stim
ate
00
00
00
00
0
R013
0Ri
sk m
argi
n0
00
00
0
R020
0Te
chni
cal p
rovi
sion
s -
tota
l83
,538
48,8
02,6
494,
588,
037
53,4
74,2
2470
9,07
570
9,07
5
Hea
lth
insu
ranc
e (d
irec
t bu
sine
ss)
Ann
uiti
es
stem
min
g fr
om
non-
life
insu
ranc
e co
ntra
cts
and
rela
ting
to
heal
th
insu
ranc
e ob
ligat
ions
Hea
lth
rein
sura
nce
(rei
nsur
ance
ac
cept
ed)
Tota
l (H
ealt
h si
mila
r to
life
in
sura
nce)
Insu
ranc
e w
ith
prof
it
part
icip
atio
n
Inde
x-lin
ked
and
unit
-lin
ked
insu
ranc
eO
ther
life
insu
ranc
eA
nnui
ties
st
emm
ing
from
no
n-lif
e in
sura
nce
cont
ract
s an
d re
lati
ng t
o in
sura
nce
oblig
atio
n ot
her
than
hea
lth
insu
ranc
e ob
ligat
ions
Acc
epte
d re
insu
ranc
e
Tota
l (L
ife
othe
r th
an h
ealt
h in
sura
nce,
in
clud
ing
Uni
t-Li
nked
)
76

APPENDIX 4S.22.01.21 IMPACT OF LONG TERM GUARANTEES MEASURES AND TRANSITIONALS
S.22.01.21
Impact of long term guarantees measures and transitionals
Amount with Long Term Guarantee
measures and transitionals
Impact of transitional on
technical provisions
Impact of transitional on interest rate
Impact of volatility
adjustment set to zero
Impact of matching
adjustment set to zero
C0010 C0030 C0050 C0070 C0090
R0010 Technical provisions 54,183,299 0 0 48,340 0
R0020 Basic own funds 2,010,189 0 0 -31,436 0
R0050 Eligible own funds to meet Solvency Capital Requirement 2,010,189 0 0 -31,436 0
R0090 Solvency Capital Requirement 1,141,725 0 0 2,522 0
R0100 Eligible own funds to meet Minimum Capital Requirement 2,010,189 0 0 -31,436 0
R0110 Minimum Capital Requirement 513,776 0 0 1,135 0
77

APPENDIX 5S.23.01.01 OWN FUNDS Basic own funds before deduction for participations in other financial sector as foreseen in article 68 of Delegated Regulation 2015/35
S.23.01.01
Own Funds
TotalTier 1
unrestrictedTier 1
restrictedTier 2 Tier 3
C0010 C0020 C0030 C0040 C0050
R0010 Ordinary share capital (gross of own shares) 1,127 1,127 0
R0030 Share premium account related to ordinary share capital 339,873 339,873 0
R0040 Initial funds, members' contributions or the equivalent basic own-fund item for mutual and mutual-type undertakings 0 0 0
R0050 Subordinated mutual member accounts 0 0 0 0
R0070 Surplus funds 56 56
R0090 Preference shares 0 0 0 0
R0110 Share premium account related to preference shares 0 0 0 0
R0130 Reconciliation reserve 1,669,133 1,669,133
R0140 Subordinated liabilities 0 0 0 0
R0160 An amount equal to the value of net deferred tax assets 0 0
R0180 Other own fund items approved by the supervisory authority as basic own funds not specified above 0 0 0 0 0
R0220 Own funds from the financial statements that should not be represented by the reconciliation 0 reserve and do not meet the criteria to be classified as Solvency II own funds
R0230 Deductions for participations in financial and credit institutions 0 0 0 0
R0290 Total basic own funds after deductions 2,010,189 2,010,189 0 0 0
Ancillary own funds
R0300 Unpaid and uncalled ordinary share capital callable on demand 0
R0310 Unpaid and uncalled initial funds, members' contributions or the equivalent basic own fund item 0
R0320 Unpaid and uncalled preference shares callable on demand 0
R0330 A legally binding commitment to subscribe and pay for subordinated liabilities on demand 0
R0340 Letters of credit and guarantees under Article 96(2) of the Directive 2009/138/EC 0
R0350 Letters of credit and guarantees other than under Article 96(2) of the Directive 2009/138/EC 0
R0360 Supplementary members calls under first subparagraph of Article 96(3) of the Directive 2009/138/EC 0
R0370 Supplementary members calls - other than under first subparagraph of Article 96(3) of the Directive 2009/138/EC 0
R0390 Other ancillary own funds 0
R0400 Total ancillary own funds 0 0 0
Available and eligible own funds
R0500 Total available own funds to meet the SCR 2,010,189 2,010,189 0 0 0
R0510 Total available own funds to meet the MCR 2,010,189 2,010,189 0 0
R0540 Total eligible own funds to meet the SCR 2,010,189 2,010,189 0 0 0
R0550 Total eligible own funds to meet the MCR 2,010,189 2,010,189 0 0
R0580 SCR 1,141,725
R0600 MCR 513,776
R0620 Ratio of Eligible own funds to SCR 176.07%
R0640 Ratio of Eligible own funds to MCR 391.26%
Reconcilliation reserve C0060
R0700 Excess of assets over liabilities 2,010,189
R0710 Own shares (held directly and indirectly) 0
R0720 Foreseeable dividends, distributions and charges 0
R0730 Other basic own fund items 341,056
R0740 Adjustment for restricted own fund items in respect of matching adjustment portfolios and ring fenced funds 0
R0760 Reconciliation reserve 1,669,133
Expected profits
R0770 Expected profits included in future premiums (EPIFP) - Life business 290,064
R0780 Expected profits included in future premiums (EPIFP) - Non- life business 0
R0790 Total Expected profits included in future premiums (EPIFP) 290,064
for mutual and mutual - type undertakings, callable on demand
78

APPENDIX 6S.25.01.21 SOLVENCY CAPITAL REQUIREMENT - FOR UNDERTAKINGS ON STANDARD FORMULA
S.25.01.21
Solvency Capital Requirement - for undertakings on Standard Formula
Gross solvency capital requirement
USP Simplifications
C0110 C0090 C0120
R0010 Market risk 718,545
R0020 Counterparty default risk 40,685
R0030 Life underwriting risk 728,934
R0040 Health underwriting risk 243,947
R0050 Non-life underwriting risk 0
R0060 Diversification -474,468
R0070 Intangible asset risk 0
R0100 Basic Solvency Capital Requirement 1,257,642
Calculation of Solvency Capital Requirement C0100
R0130 Operational risk 62,353
R0140 Loss-absorbing capacity of technical provisions -15,271
R0150 Loss-absorbing capacity of deferred taxes -162,999
R0160 Capital requirement for business operated in accordance with Art. 4 of Directive 2003/41/EC 0
R0200 Solvency Capital Requirement excluding capital add-on 1,141,725
R0210 Capital add-ons already set 0
R0220 Solvency capital requirement 1,141,725
Other information on SCR
R0400 Capital requirement for duration-based equity risk sub-module 0
R0410 Total amount of Notional Solvency Capital Requirements for remaining part 1,087,454
R0420 Total amount of Notional Solvency Capital Requirements for ring fenced funds 54,276
R0430 Total amount of Notional Solvency Capital Requirements for matching adjustment portfolios 0
R0440 Diversification effects due to RFF nSCR aggregation for article 304 0
Approach to tax rate C0109
R0590 Approach based on average tax rate No
Calculation of loss absorbing capacity of deferred taxesLAC DT
C0130
R0640 LAC DT -162,999
R0650 LAC DT justified by reversion of deferred tax liabilities -162,999
R0660 LAC DT justified by reference to probable future taxable economic profit 0
R0670 LAC DT justified by carry back, current year 0
R0680 LAC DT justified by carry back, future years 0
R0690 Maximum LAC DT -162,999
USP Key
For life underwriting risk:1 - Increase in the amount of annuity benefits9 - None
For health underwriting risk:1 - Increase in the amount of annuity benefits2 - Standard deviation for NSLT health premium risk3 - Standard deviation for NSLT health gross premium risk4 - Adjustment factor for non-proportional reinsurance5 - Standard deviation for NSLT health reserve risk9 - None
For non-life underwriting risk:4 - Adjustment factor for non-proportional reinsurance6 - Standard deviation for non-life premium risk7 - Standard deviation for non-life gross premium risk8 - Standard deviation for non-life reserve risk9 - None
79

S.28.01.01
Minimum Capital Requirement - Only life or only non-life insurance or reinsurance activity
Linear formula component for non-life insurance and reinsurance obligations C0010
R0010 MCRNL Result 0
Net (of reinsurance/SPV) best
estimate and TP calculated as a whole
Net (of reinsurance) written premiums in the last 12 months
C0020 C0030
R0020 Medical expense insurance and proportional reinsurance 0 0
R0030 Income protection insurance and proportional reinsurance 0 0
R0040 Workers' compensation insurance and proportional reinsurance 0 0
R0050 Motor vehicle liability insurance and proportional reinsurance 0 0
R0060 Other motor insurance and proportional reinsurance 0 0
R0070 Marine, aviation and transport insurance and proportional reinsurance 0 0
R0080 Fire and other damage to property insurance and proportional reinsurance 0 0
R0090 General liability insurance and proportional reinsurance 0 0
R0100 Credit and suretyship insurance and proportional reinsurance 0 0
R0110 Legal expenses insurance and proportional reinsurance 0 0
R0120 Assistance and proportional reinsurance 0 0
R0130 Miscellaneous financial loss insurance and proportional reinsurance 0 0
R0140 Non-proportional health reinsurance 0 0
R0150 Non-proportional casualty reinsurance 0 0
R0160 Non-proportional marine, aviation and transport reinsurance 0 0
R0170 Non-proportional property reinsurance 0 0
Linear formula component for life insurance and reinsurance obligations C0040
R0200 MCRL Result 569,875
Net (of reinsurance/SPV) best
estimate and TP calculated as a whole
Net (of reinsurance/SPV) total
capital at risk
C0050 C0060
R0210 Obligations with profit participation - guaranteed benefits 47,098
R0220 Obligations with profit participation - future discretionary benefits 36,136
R0230 Index-linked and unit-linked insurance obligations 48,625,657
R0240 Other life (re)insurance and health (re)insurance obligations 3,479,068
R0250 Total capital at risk for all life (re)insurance obligations 223,672,917
Overall MCR calculation C0070
R0300 Linear MCR 569,875
R0310 SCR 1,141,725
R0320 MCR cap 513,776
R0330 MCR floor 285,431
R0340 Combined MCR 513,776
R0350 Absolute floor of the MCR 3,700
R0400 Minimum Capital Requirement 513,776
APPENDIX 7 S.28.01.01 MINIMUM CAPITAL REQUIREMENT - ONLY LIFE OR ONLY NON-LIFE INSURANCE OR REINSURANCE ACTIVITY Linear formula component for non-life insurance and reinsurance obligations
80

Notes:
81

SOLVENCY AND FINANCIAL CONDITIONREPORT 2020
Irish Life Assurance plc is regulated by the Central Bank of Ireland.
ILA 13098 (REV 04-21)