solutions eco 100y introduction to … 1 of 13 department of economics prof. gustavo indart...
TRANSCRIPT

Page 1 of 13
Department of Economics Prof. Gustavo Indart University of Toronto June 26, 2008
ECO 100Y INTRODUCTION TO ECONOMICS
Midterm Test # 2
LAST NAME
FIRST NAME
STUDENT NUMBER Circle your section of the course: L0201 – T/R from 3:00 to 5:00 PM L5101 – T/R from 6:00 to 8:00 PM
INSTRUCTIONS: 1. The total time for this test is 1 hour and 50 minutes. 2. Aids allowed: a simple calculator. 3. Write with pen instead of pencil.
DO NOT WRITE IN THIS SPACE
Part I 1. /10
2. /10
3. /10
4. /10
5. /10
Part II 1. /15
2. /15
Part III /40
TOTAL /120
AASOLUTIONS

Page 2 of 13
PART I (50 marks)
Instructions:
• Answer all questions in the space provided (if space is not sufficient, continue on the back of the previous page).
• Each question is worth 10 marks. Marks will be given entirely for the explanation.
1. (From Test 1 – Summer 2007) Oranges are produced with a fixed factor (land) and a
variable factor (labour).
Statement: Ronaldo – a former ECO100 student – states with authority that when the average product of labour is increasing, the marginal product of labour must also be increasing in the orange industry.
Position: Do you agree with Ronaldo’s statement? Use a proper diagram to analyze this situation and indicate, with reasons, whether you agree or disagree with Ronaldo.
I don’t agree with Ronaldo’s statement.
The average product of labour is increasing as long as the marginal product of labour is greater than the average product. Let’s look at an example. Suppose that the average product of labour is 10 when 5 units of labour are used in production and that the marginal product of the 6th unit of labour is 16 – what is the average product of labour when 6 units of labour are used in production? Well, since the additional unit of labour increases total product by more than each of the previous 5 units had, on average, increased total product, the average product of labour rises. In our example, total product increases from 50 units to 66 units and thus the average product of labour increase from 10 units to 11 units.
Therefore, the correct statement should be that when the average product of labour is increasing, the marginal product of labour must be greater than the average product in the orange industry. But note that the marginal product of labour might be increasing or decreasing when it’s greater than the average product. This is illustrated in the following diagram.
AP MP
A
B
L LBLA
AP MP

Page 3 of 13
2. (From Test 2 – Summer 2006) Scooters are produced in a constant cost industry with two factors of production: capital [K] and labour [L]. The price of labour [the wage rate] increases by 5% and, at the same time, the price of capital [rental fee] increases by 2%.
Statement: Wendy is of the view that the long-run impact of this change in the relative prices of the factors of production will be an increase in both the marginal product of labour and the marginal product of capital.
Position: Do you agree with Wendy’s view? Use a proper diagram to analyze this situation and indicate, with reasons, whether you agree or disagree with Wendy’s view.
No, I don’t agree with Wendy’s view.
Although the prices of both K and L have increased, the price of L has increased relatively more, which means that the relative price of labour has increased. Therefore, in the long-run a profit maximizing firm will produce any given output using more of the relatively less expensive factor of production and less of the relatively more expensive factor of production. In this case, therefore, the firm will substitute capital for labour (i.e., it will adopt a more capital-intensive method of production). This is represented by a movement up along the isoquant representing the level of output being produced.
Given the assumption of diminishing marginal productivity of factors of production, as the quantity of K increases, the MPK decreases; in turn, as the quantity of L decreases, the MPL increases. Therefore, Wendy’s view is incorrect. [Note that this outcome is reinforced by the fact the MP of a factor of production also increases when the quantity of another factor of production increases.]
The statement can also be discussed as follows. The firm will minimize the cost of producing any particular level of output by choosing a combination of K and L given by the point of tangency between the isoquant and an isocost line. At this point the slopes of the isoquant and the slope of the isocost are equal, i.e., the MRTS is equal to the relative price of labour (w/r).
Initially, MRTS = w/r where MRTS = MPL/MPK. This equilibrium is altered when w/r increases to w’/r’. Indeed, now MPL/MPK < w’/r’. To restore equilibrium, then, MPL must increase (through a decrease in L) and MPK must decrease (through an increase in K).
K
L
K1
K2
L1 L2
Q1
Page 4 of 13
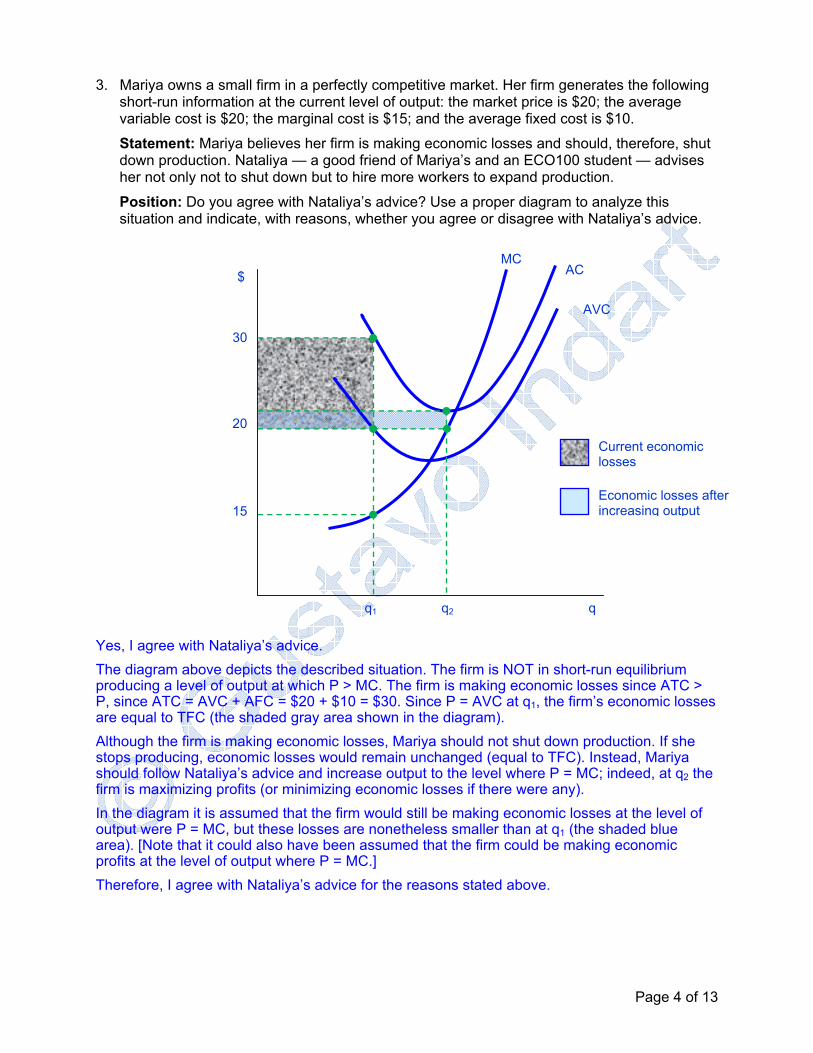
3. Mariya owns a small firm in a perfectly competitive market. Her firm generates the following short-run information at the current level of output: the market price is $20; the average variable cost is $20; the marginal cost is $15; and the average fixed cost is $10.
Statement: Mariya believes her firm is making economic losses and should, therefore, shut down production. Nataliya — a good friend of Mariya’s and an ECO100 student — advises her not only not to shut down but to hire more workers to expand production.
Position: Do you agree with Nataliya’s advice? Use a proper diagram to analyze this situation and indicate, with reasons, whether you agree or disagree with Nataliya’s advice.
Yes, I agree with Nataliya’s advice. The diagram above depicts the described situation. The firm is NOT in short-run equilibrium producing a level of output at which P > MC. The firm is making economic losses since ATC > P, since ATC = AVC + AFC = $20 + $10 = $30. Since P = AVC at q1, the firm’s economic losses are equal to TFC (the shaded gray area shown in the diagram). Although the firm is making economic losses, Mariya should not shut down production. If she stops producing, economic losses would remain unchanged (equal to TFC). Instead, Mariya should follow Nataliya’s advice and increase output to the level where P = MC; indeed, at q2 the firm is maximizing profits (or minimizing economic losses if there were any). In the diagram it is assumed that the firm would still be making economic losses at the level of output were P = MC, but these losses are nonetheless smaller than at q1 (the shaded blue area). [Note that it could also have been assumed that the firm could be making economic profits at the level of output where P = MC.] Therefore, I agree with Nataliya’s advice for the reasons stated above.
MC
AVC
$
q q1
30
20
15
Current economic losses
Economic losses after increasing output
q2
AC

Page 5 of 13
4. (From Test 2 – Summer 2007) A perfectly competitive industry is in long-run equilibrium. Property taxes increase by $500 for each firm in the industry.
Statement: Andrej concludes that the short-run impact of this tax increase will be an increase in the industry price and a decrease in the industry output.
Position: Do you agree with Andrej’s conclusion? Use a proper diagram to analyze this situation and indicate, with reasons, whether you agree or disagree with Andrej.
No, I don’t agree with Andrej’s conclusion.
Property taxes are part of the firm’s fixed costs, that is, property taxes are independent of the level of output. Therefore, an increase in fixed costs will cause the AC curve to shift up but will leave the AVC and the MC curves unchanged.
Since for prices greater than the minimum of the AVC curve the MC curve is also the firm’s supply curve, the supply of a representative firm remains unchanged. And since the industry short-run supply curve is equal to the horizontal summation of the firms’ short-run supply curves, the industry short-run curve doesn’t change either. Therefore, industry price and output do not change in the short-run. This is shown in the diagram below.
Of course, each firm will be making now economic losses equal to the $500 increase in property taxes, and thus some of them will exit the industry in the long run. In the long run, therefore, industry price will increase and industry output will fall. But NOT in the short run.
AC2
q1
AVC
S
AC1
P1
Q1
P1
q
MC
D
P
Q
$
Economic Losses

Page 6 of 13
5. (From Problem Set 7) A perfectly competitive industry is in short-run equilibrium and each of the “n” firms is initially making normal profits. Material costs decrease such that the average variable cost curve shifts down by exactly $3.00 per unit of output.
Statement: Emily claims that this decrease in variable cost will have the following short-run impact once a new short-run equilibrium is achieved: the industry price will decrease by $3.00; industry output will decrease; each firm will produce an unchanged output and make economic profits, and more firms will enter the industry in the short run.
Position: Do you agree with Emily’s Claim? Use a proper diagram to analyze this situation and indicate, with reasons, whether you agree or disagree with Emily.
I disagree with Emily’s claim.
The diagram below depicts the original short-run equilibrium: price is P1, quantity transacted in the market is Q1, each firm is making zero economic profits and producing an output q1 (where Q1 = n1*q1, n1 being the number of firms in the industry).
A decline in costs of $3 per unit of output causes the MC and the AC curves to shift down by exactly $3 at each level of output. [Note that the minimum of the new AC curve (i.e., the intersection of the new AC curve with the new MC curve) is at the same level of output as the minimum of the initial AC curve.]
Because industry supply is the (horizontal) summation of the MC curves (above the minimum of their respective AVC curves) of each firm in the industry, the industry supply curve also shifts vertically down by the same amount as the MC curve, i.e., by exactly $3 per unit of output. Therefore, given that the demand curve has a negative slope (i.e., it’s not perfectly inelastic), the short-run equilibrium price decreases but by less than $3 (to P2 as shown in the diagram). At the lower equilibrium price P2 the quantity transacted in the market increases to Q2.
In perfect competition firms are price-takers and will produce the profit-maximizing level of output where P = MC. Therefore, at P2 each firm will produce output q2, where q2 > q1. [Note that since we are in the short run, the number of firms remains constant and thus Q2 = n1*q2.] Since P2 > AC, each firm is now making economic profits in the short run as shown in the diagram by the shaded blue area. [Note that these economic profits will attract more firms into the industry in the long run, but not in the short run since the quantity of capital is assumed constant in the short run.]
Therefore, Emily’s claim is incorrect: in the short run, the industry price will fall by less than $3; industry output will increase; each firm will produce a larger output and make economic profits; and the number of firms in the industry will remain unchanged.
P1 P1
P2 P2
Q2 Q1 q2 q1
P1 − $3P1 − $3
S1
S2
MC1 AC1
MC2
AC2
P $
Q
D
q

Page 7 of 13
PART III (30 marks)
Instructions:
• Answer both questions in the space provided (if space is not sufficient, continue on the back of the previous page).
• Each question is worth 15 marks.
Question 1 (From Test 2 – Summer 2005) Suppose Aramark Co. produces 10,000 pocket calculators a day using only two factors of production: capital (K) and labour (L). The price of labour is $100 a day and the price of capital is $200 a day, and the total daily cost of producing 10,000 calculators a day is $50,000.
a) What is the equation for the isocost curve corresponding to a total cost of $50,000 a day? (2 marks) Draw this isocost curve in the diagram above and indicate all relevant points. (1 mark) Add a convex isoquant tangent to the isocost curve at 200 units of labour per day (point A). How many units of capital per day are employed? (1 mark)
TC = PL L + PK K 50,000 = 100 L + 200 K or K = 250 – 0.5 L
If L = 200, then K = 250 – 0.5 (200) = 250 – 100 = 150
K
L 500
250
200
150
LB
KB
Q1
A
B
Page 8 of 13
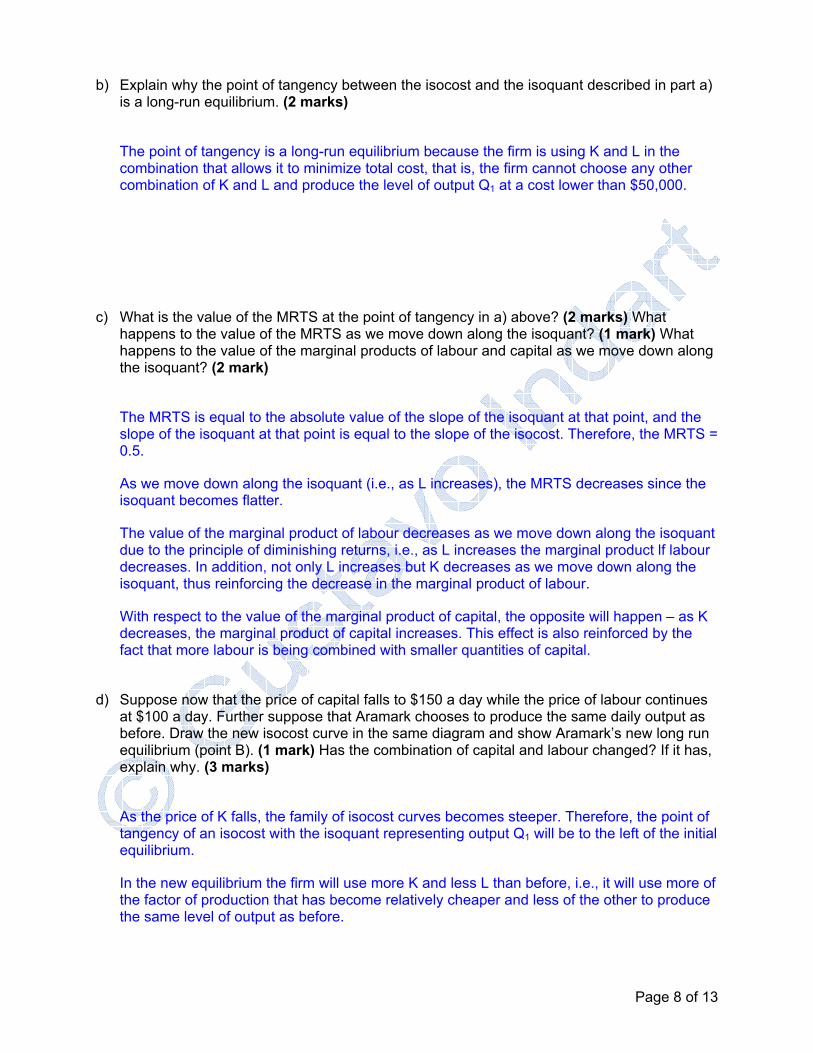
b) Explain why the point of tangency between the isocost and the isoquant described in part a) is a long-run equilibrium. (2 marks)
The point of tangency is a long-run equilibrium because the firm is using K and L in the combination that allows it to minimize total cost, that is, the firm cannot choose any other combination of K and L and produce the level of output Q1 at a cost lower than $50,000.
c) What is the value of the MRTS at the point of tangency in a) above? (2 marks) What happens to the value of the MRTS as we move down along the isoquant? (1 mark) What happens to the value of the marginal products of labour and capital as we move down along the isoquant? (2 mark)
The MRTS is equal to the absolute value of the slope of the isoquant at that point, and the slope of the isoquant at that point is equal to the slope of the isocost. Therefore, the MRTS = 0.5.
As we move down along the isoquant (i.e., as L increases), the MRTS decreases since the isoquant becomes flatter.
The value of the marginal product of labour decreases as we move down along the isoquant due to the principle of diminishing returns, i.e., as L increases the marginal product lf labour decreases. In addition, not only L increases but K decreases as we move down along the isoquant, thus reinforcing the decrease in the marginal product of labour.
With respect to the value of the marginal product of capital, the opposite will happen – as K decreases, the marginal product of capital increases. This effect is also reinforced by the fact that more labour is being combined with smaller quantities of capital.
d) Suppose now that the price of capital falls to $150 a day while the price of labour continues at $100 a day. Further suppose that Aramark chooses to produce the same daily output as before. Draw the new isocost curve in the same diagram and show Aramark’s new long run equilibrium (point B). (1 mark) Has the combination of capital and labour changed? If it has, explain why. (3 marks)
As the price of K falls, the family of isocost curves becomes steeper. Therefore, the point of tangency of an isocost with the isoquant representing output Q1 will be to the left of the initial equilibrium.
In the new equilibrium the firm will use more K and less L than before, i.e., it will use more of the factor of production that has become relatively cheaper and less of the other to produce the same level of output as before.

Page 9 of 13
Question 2 (15 marks) The graph below depicts isoquants for two levels of output that can be produced with different combinations of capital and labour.
a) Suppose the price of one unit of labour is $4 and the price of one unit of capital is also $4.
Given these prices of labour and capital, draw in the diagram above the isocost line corresponding to the minimum cost of producing 200 units of output. (1 mark) How many units of capital and labour would this firm employ to produce this output at minimum cost? (Note: Use whole units, not fractions of units of labour and capital.) (1 mark) What is the minimum total cost of producing 200 units of output? (1 mark) What is the equation for this isocost line? (1 mark)
This firm would use 4 units of capital and 4 units of labour to produce 200 units of output at minimum cost. The total cost of producing 200 units of output would be:
TC = w L + r K = $4 (4) + $4 (4) = $32 Therefore, the equation for this isocost line is:
32 = 4 L + 4 K or K = 8 – L
Labour
12
8 12 4
4
8
Cap
ital
16
Q = 300
Q = 200

Page 10 of 13
b) Given these prices of labour and capital in part a), now draw in the diagram above the isocost line corresponding to the minimum cost of producing 300 units of output. (1 mark) How many units of capital and labour would this firm employ to produce this output at minimum cost? (Note: Use whole units, not fractions of units of labour and capital.) (1 mark) What is the minimum total cost of producing 300 units of output? (1 mark) What is the equation for this isocost line? (1 mark)
This firm would use 7 units of capital and 4 units of labour to produce 300 units of output at minimum cost. The total cost of producing 300 units of output would be:
TC = w L + r K = $4 (4) + $4 (7) = $44 Therefore, the equation for this isocost line is:
44 = 4 L + 4 K or K = 11 – L c) Given a) and b) above, what (if anything) can be said about returns to scale? Is the firm
enjoying constant, increasing, or decreasing returns to scale? (3 marks)
The firm enjoys increasing returns to scale since LRAC decreases as the firm increases the scale of production from 200 to 300 units. Indeed,
LRAC (200) = TC (200) / 200 = 32 / 200 = 0.16 LRAC (300) = TC (300) / 300 = 44 / 300 = 0.1467
d) Suppose that the price of one unit of labour falls to $2 (while the price of one unit of capital
remains as before), draw in the diagram above the new isocost line corresponding to the minimum cost of producing 300 units of output. (1 mark) How many units of capital and labour would this firm employ to produce this output at minimum cost? (Note: Use whole units, not fractions of units of labour and capital.) (1 mark) What is the minimum total cost of producing 300 units of output? (1 mark) What is the equation for this isocost line? (1 mark)
This firm would use 4 units of capital and 8 units of labour to produce 300 units of output at minimum cost. The total cost of producing 300 units of output would be:
TC = w L + r K = $2 (8) + $4 (4) = $32 Therefore, the equation for this isocost line is:
32 = 2 L + 4 K or K = 8 – 0.5 L

Page 11 of 13
PART III (40 marks)
Instructions: Enter your answer to each question in the table below. Only the answer recorded in the table will be marked. Table cells left blank will receive a zero mark for that question. Each question is worth 4 marks. No deductions will be made for incorrect answers.
AA 1 2 3 4 5 6 7 8 9 10
B E A A C D C B D B 1. (From May/2006 exam) Suppose fixed costs are $100 and average variable costs are
constant regardless of output. Which of the following is then true? A) Marginal cost will equal average total cost. B) Average total cost will decrease when output is increased. C) Marginal cost will be less than average variable cost. D) Average total cost will be constant. E) None of the above is true.
2. (From May/2006 exam) When one additional unit of labour is hired, total product increases
from 100 to 110 units of output per unit of time. Marginal product of labour must therefore be A) increasing. B) decreasing. C) constant. D) zero. E) positive.
3. (From May/2005 exam) A perfectly competitive industry is in long run equilibrium with a
constant cost industry supply curve. The government imposes a specific commodity tax of $2.00 per unit of output. As a result, which one of the following statements is correct in the long run?
A) Consumer price will increase by $2.00 and industry output will fall. B) Consumer price will increase by less than $2.00 and industry output will fall. C) Industry output will increase and consumer price will be unchanged. D) Industry output will decrease and consumer price will decrease. E) None of the above is correct.
4. A firm in a perfectly competitive industry is producing in the short run where industry price
equals its short run marginal cost. In this position, each representative firm is producing 100 units of output with total revenue of $5,500, total cost of $8,000 and total fixed cost of $3,000. The firm's best profit strategy in the short run is to
A) maintain output at its present level. B) increase output until marginal cost equals minimum average variable cost. C) increase output until marginal cost equals the minimum point of average total costs. D) shut down. E) None of the above.
Page 12 of 13
5. (From May/2004 exam) For a certain firm, total cost is $10 at 5 units of output and $13 for 6
units. In that range of output, marginal cost is A) decreasing and less than average total cost. B) decreasing and greater than average total cost. C) increasing and greater than average total cost. D) equal to average total cost. E) increasing and less than average total cost.
6. (From August/2005 exam) Suppose that the production function indicates that 200 units of
labour and 400 units of capital can produce 1000 units of output and that 600 units of labour and 1200 units of capital can produce 4000 units of output. On this basis, it can be concluded that the firm is experiencing
A) increasing marginal returns to labour. B) decreasing marginal returns to labour. C) constant returns to scale. D) increasing returns to scale. E) none of the above.
7. (From August/2005 exam) A firm is using its plant to produce 500 units of output daily. Its
marginal cost at this output is $8.00; its average cost is $7.50; its average variable cost is $4.00. The daily total fixed cost associated with this plant must be
A) $7.50. B) $750. C) $1,750. D) $3,750. E) none of the above.
8. (From May/2007 exam) A perfectly competitive firm’s marginal cost is $35, its average cost
is $40, its average variable cost is $30, its price is $32, and its output is 800 units. Its total cost of producing 801 units is
A) less than 32,000. B) more than 32,000 but less than 32,040. C) 32,040. D) more than 32,040 but less than 35,040. E) None of the above.
9. A firm’s fixed costs are $50. If total costs are $150 for one unit of output and $260 for two
units, then the marginal cost of the first unit is and the marginal cost of the second unit is .
A) $150; $260. B) $150; $110. C) $100; $210. D) $100; $110. E) None of the above.

Page 13 of 13
10. (From May/2007 exam) A perfectly competitive industry is in long-run equilibrium with an increasing cost industry supply curve. The government then provides a subsidy to every firm of $10 per unit of output. As a result, which of the following statements is correct in the long run?
A) Consumer price will decrease by $10 and industry output will rise. B) Consumer price will decrease by less than $10 and industry output will rise. C) Consumer price will decrease by more than $10 and industry output will rise. D) Consumer price will decrease but industry output will not change. E) Industry output will increase but consumer price will not change.