solubility of c-o-h mixtures in natural melts: new experimental data
TRANSCRIPT
633
ANNALS OF GEOPHYSICS, VOL. 48, N. 4/5, August/October 2005
Key words CO2 – H2O – solubility – mixed fluid –silicate melt – experimental data
1. Introduction
The knowledge of the distribution ofvolatile species between silicate melts and gas-es (or fluids) is crucial to understand degassingprocesses in magmatic systems. Although natu-ral fluids are complex multicomponent phasesand may contain several mol% SO2, H2S, HCl,HF and others, CO2 and H2O are commonly themajor fluid species exsolving from degassingmagmatic melts and the system C-O-H is often
Solubility of C-O-H mixtures in natural melts: new experimental dataand application range of recent models
Roman Botcharnikov, Marcus Freise, Francois Holtz and Harald BehrensInstitut für Mineralogie, Uni Hannover, Germany
AbstractThe effect of pressure, temperature, and melt composition on CO2 and H2O solubilities in aluminosilicatemelts, coexisting with CO2-H2O fluids, is discussed on the basis of previously published and new experimen-tal data. The datasets have been chosen so that CO2 and H2O are the main fluid components and the conclu-sions are only valid for relatively oxidizing conditions. The most important parameters controlling the solu-bilities of H2O and CO2 are pressure and composition of melt and fluid. On the other hand, the effect of tem-perature on volatile solubilities is relatively small. At pressures up to 200 MPa, intermediate compositionssuch as dacite, in which both molecular CO2 and carbonate species can be dissolved, show higher volatilesolubilities than rhyolite and basalt. At higher pressures (0.5 to 1 GPa), basaltic melts can incorporate high-er amounts of carbon dioxide (by a factor of 2 to 3) than rhyolitic and dacitic melts. Henrian behavior is ob-served only for CO2 solubility in equilibrium with H2O-CO2 fluids at pressures <100 MPa, whereas at high-er pressures CO2 solubility varies nonlinearly with CO2 fugacity. The positive deviation from linearity withalmost constant CO2 solubility at low water activity indicates that dissolved water strongly enhances the sol-ubility of CO2. Water always shows non-Henrian solubility behavior because of its complex dissolutionmechanism (incorporation of OH-groups and H2O molecules in the melt). The model of Newman and Lowen-stern (2002), in which ideal mixing between volatiles in both fluid and melt phases is assumed, reproducesadequately the experimental data for rhyolitic and basaltic compositions at pressures below 200 MPa butshows noticeable disagreement at higher pressures, especially for basalt. The empirical model of Liu et al.(2004) is applicable to rhyolitic melts in a wide range of pressure (0-500 MPa) and temperature (700-1200°C) but cannot be used for other melt compositions. The thermodynamic approach of Papale (1999) al-lows to calculate the effect of melt composition on volatile solubilities but needs an update to account formore recent experimental data. A disadvantage of this model is that it is not available as a program code. Thereview indicates a crucial need of new experimental data for scarcely investigated field of pressures and flu-id compositions and new models describing evident non-ideality of H-C-O fluid solubility in silicate meltsat high pressures.
Mailing address: Dr. Roman Botcharnikov, Institut fürMineralogie, Uni Hannover, Callinstr. 3, D-30167 Hanno-ver, Germany; e-mail: [email protected]

634
Roman Botcharnikov, Marcus Freise, Francois Holtz and Harald Behrens
taken as an analogue for natural mixed fluids.However, even in this simplified system, thesolubilities of volatile components in melts re-main difficult to predict for natural aluminosil-icate melts and controversial datasets can befound in the literature. Apart from experimentalor analytical problems, two main reasons ex-plain the difficulty to elaborate a general modelfrom the available experimental database: 1)the relative abundance of molecular species(e.g., CO, CO2, H2O, CH4, H2) in the fluids andtheir fugacities depend upon pressure, tempera-ture and oxygen fugacity, which is notoriouslydifficult to control in high pressure and hightemperature experiments; 2) the solubilitymechanisms of volatiles in silicate melts de-pend on bulk composition of the melt. For ex-ample, carbon is mainly dissolved as molecularCO2 in rhyolites but as carbonate in basalts, andboth species are present in intermediate systems(e.g., Holloway and Blank, 1994).
In this study we use the available experi-mental datasets and new results, presented here,to work out the possible effects of bulk compo-sitions (rhyolite to basalt), pressure and temper-ature on the solubility of C-O-H species incommon natural silicate melts. Thereby, weconsider only data from studies in which CO2
and H2O have been the dominant species in thecoexisting fluid phase. Thus, the discussion islimited to f O2 conditions varying from oxidiz-ing to moderately reducing. For example, at 1GPa, 1400°C, CO2 should be the dominant car-bon species down to a log f O2 of delta NNO-1(Holloway and Blank, 1994).
Based on pioneering studies on water andCO2 solubilities in silicate melts (e.g., Burnhamand Davis 1971, 1974; Holloway, 1987; Stolper,1982; Silver and Stolper, 1985; Fogel and Ru-therford, 1990; Blank et al., 1993; Dixon et al.,1995), models for predicting CO2 and H2O solu-bilities and equilibrium fluid compositions havebeen elaborated by Holloway and Blank (1994),Dixon (1997), Papale (1999) and Newman andLowenstern (2002). The merit of the Volatile-Calc model proposed by Newman and Lowen-stern (2002) is that the software is directly avail-able and that it can be used easily to model mag-matic processes in basaltic and rhyolitic sys-tems. The authors recommend using the model
up to 500 MPa (but not above) and examples ofapplications are given by Lowenstern (2000,2001). In addition, an empirical model was pro-posed by Liu et al. (2004) to predict CO2 andH2O solubilities in rhyolitic melts. Applicabilityand limitations of the more recent models (Pa-pale, 1999; Newman and Lowenstern, 2002; Liuet al., 2004) are discussed in the light of new ex-perimental data.
2. Generalities
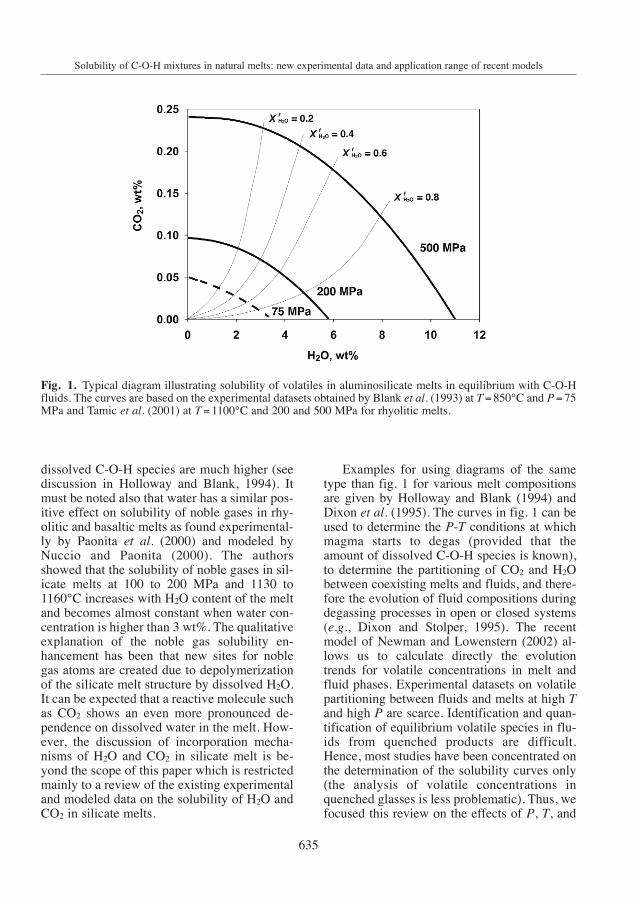
The solubility of volatiles in melts in equi-librium with a C-O-H-bearing fluid is common-ly represented as shown in fig. 1 for rhyoliticmelts. The X- and Y-axes in fig. 1 correspond tothe amount of dissolved O-H species (ex-pressed as wt% H2O) and of dissolved C-Ospecies (expressed as wt% CO2) in the silicatemelt, respectively. The thick curves in fig. 1represent the maximum amount of H2O andCO2 which can be dissolved concomitantly inmelts coexisting with C-O-H-bearing fluids.The intersections of the solubility curves withthe X- and Y-axes of fig. 1 correspond to thesolubility of pure H2O or CO2, respectively.The composition of the fluid coexisting withthe melt is given by the thin lines (for fixedmole fraction of water, X f
H2O ). At a given pres-sure (P) and temperature (T), melts in equilibri-um with water-rich fluids contain high wateramounts and can only incorporate little CO2
(the water activity in such systems is high)whereas melts equilibrated with CO2-rich fluidscontain less water and can incorporate higherCO2 amounts (the water activity is low).
The thick curves in fig. 1 show that volatilesolubility is strongly dependent on pressure.The nonlinear shape, especially marked at highpressure (500 MPa) is the result of non-idealsolubility behavior of mixed C-O-H fluids inthe silicate melt. In pioneering experimentsperformed at high pressure (up to 2 GPa), theaddition of small amounts of water to a CO2-bearing fluid was found to increase the solubil-ity of CO2 (Mysen et al., 1976). This cannot beobserved in rhyolite melts up to 500 MPa (fig.1) but does not necessarily disagree with thehigh pressure studies in which the amounts of
635
Solubility of C-O-H mixtures in natural melts: new experimental data and application range of recent models
dissolved C-O-H species are much higher (seediscussion in Holloway and Blank, 1994). Itmust be noted also that water has a similar pos-itive effect on solubility of noble gases in rhy-olitic and basaltic melts as found experimental-ly by Paonita et al. (2000) and modeled byNuccio and Paonita (2000). The authorsshowed that the solubility of noble gases in sil-icate melts at 100 to 200 MPa and 1130 to1160°C increases with H2O content of the meltand becomes almost constant when water con-centration is higher than 3 wt%. The qualitativeexplanation of the noble gas solubility en-hancement has been that new sites for noblegas atoms are created due to depolymerizationof the silicate melt structure by dissolved H2O.It can be expected that a reactive molecule suchas CO2 shows an even more pronounced de-pendence on dissolved water in the melt. How-ever, the discussion of incorporation mecha-nisms of H2O and CO2 in silicate melt is be-yond the scope of this paper which is restrictedmainly to a review of the existing experimentaland modeled data on the solubility of H2O andCO2 in silicate melts.
Examples for using diagrams of the sametype than fig. 1 for various melt compositionsare given by Holloway and Blank (1994) andDixon et al. (1995). The curves in fig. 1 can beused to determine the P-T conditions at whichmagma starts to degas (provided that theamount of dissolved C-O-H species is known),to determine the partitioning of CO2 and H2Obetween coexisting melts and fluids, and there-fore the evolution of fluid compositions duringdegassing processes in open or closed systems(e.g., Dixon and Stolper, 1995). The recentmodel of Newman and Lowenstern (2002) al-lows us to calculate directly the evolutiontrends for volatile concentrations in melt andfluid phases. Experimental datasets on volatilepartitioning between fluids and melts at high Tand high P are scarce. Identification and quan-tification of equilibrium volatile species in flu-ids from quenched products are difficult.Hence, most studies have been concentrated onthe determination of the solubility curves only(the analysis of volatile concentrations inquenched glasses is less problematic). Thus, wefocused this review on the effects of P, T, and
Fig. 1. Typical diagram illustrating solubility of volatiles in aluminosilicate melts in equilibrium with C-O-Hfluids. The curves are based on the experimental datasets obtained by Blank et al. (1993) at T = 850°C and P = 75MPa and Tamic et al. (2001) at T = 1100°C and 200 and 500 MPa for rhyolitic melts.
636
Roman Botcharnikov, Marcus Freise, Francois Holtz and Harald Behrens
melt composition on the solubility of C-O-Hspecies in silicate melts (thick lines in fig. 1).
3. Solubilities of H2O and CO2 as a functionof temperature
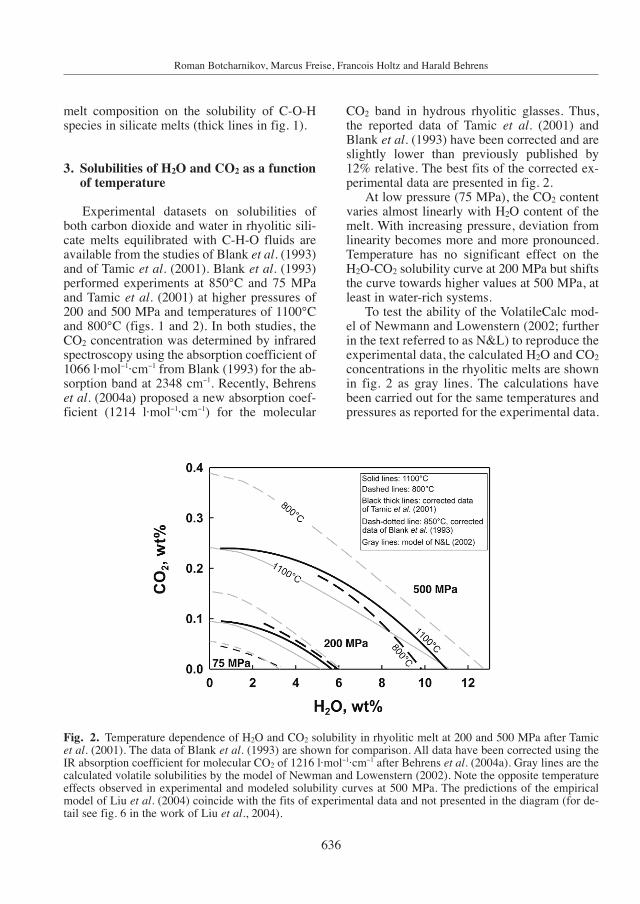
Experimental datasets on solubilities ofboth carbon dioxide and water in rhyolitic sili-cate melts equilibrated with C-H-O fluids areavailable from the studies of Blank et al. (1993)and of Tamic et al. (2001). Blank et al. (1993)performed experiments at 850°C and 75 MPaand Tamic et al. (2001) at higher pressures of200 and 500 MPa and temperatures of 1100°Cand 800°C (figs. 1 and 2). In both studies, theCO2 concentration was determined by infraredspectroscopy using the absorption coefficient of1066 l·mol−1·cm−1 from Blank (1993) for the ab-sorption band at 2348 cm−1. Recently, Behrenset al. (2004a) proposed a new absorption coef-ficient (1214 l·mol−1·cm−1) for the molecular
CO2 band in hydrous rhyolitic glasses. Thus,the reported data of Tamic et al. (2001) andBlank et al. (1993) have been corrected and areslightly lower than previously published by12% relative. The best fits of the corrected ex-perimental data are presented in fig. 2.
At low pressure (75 MPa), the CO2 contentvaries almost linearly with H2O content of themelt. With increasing pressure, deviation fromlinearity becomes more and more pronounced.Temperature has no significant effect on theH2O-CO2 solubility curve at 200 MPa but shiftsthe curve towards higher values at 500 MPa, atleast in water-rich systems.
To test the ability of the VolatileCalc mod-el of Newmann and Lowenstern (2002; furtherin the text referred to as N&L) to reproduce theexperimental data, the calculated H2O and CO2
concentrations in the rhyolitic melts are shownin fig. 2 as gray lines. The calculations havebeen carried out for the same temperatures andpressures as reported for the experimental data.
Fig. 2. Temperature dependence of H2O and CO2 solubility in rhyolitic melt at 200 and 500 MPa after Tamicet al. (2001). The data of Blank et al. (1993) are shown for comparison. All data have been corrected using theIR absorption coefficient for molecular CO2 of 1216 l·mol−1·cm−1 after Behrens et al. (2004a). Gray lines are thecalculated volatile solubilities by the model of Newman and Lowenstern (2002). Note the opposite temperatureeffects observed in experimental and modeled solubility curves at 500 MPa. The predictions of the empiricalmodel of Liu et al. (2004) coincide with the fits of experimental data and not presented in the diagram (for de-tail see fig. 6 in the work of Liu et al., 2004).
637
Solubility of C-O-H mixtures in natural melts: new experimental data and application range of recent models
The model of N&L always predicts a negativeeffect of temperature on volatile solubilities atpressures 200 and 500 MPa and this effect in-creases with pressure. This trend is in agree-ment with the experimental data at 200 MPabut it contrasts with the experimental findingsfor water-rich conditions at 500 MPa. Since themodel is based on experiments performed withpure H2O and CO2 fluid phases (Silver, 1988;Silver et al., 1990; Fogel and Rutherford, 1990),and on the low-pressure data of Blank et al.(1993), it reproduces data for mixed fluids witha good precision only at low pressures (devia-tions are almost in the range of the error bars).It is noteworthy that at 500 MPa, the model ofN&L predicts almost linear solubility curves inthe H2O-CO2 solubility field and does not re-produce the non-linear solubility behavior ofCO2 and H2O in the C-H-O-rhyolite system.This is due to the assumption of an ideal be-havior of volatiles and independence of H2Osolubility on CO2 concentration in the melt andvice versa in the N&L’s model. The empiricalmodel of Liu et al. (2004) gives a much betterprediction of solubility trends, especially athigh P. The calculated solubility curves coin-cide with the fitted experimental data (fig. 2).
A rough estimation of the temperature de-pendence of H2O-CO2 solubility in basalticmelts can be derived comparing the results ofDixon et al. (1995) and Jendrzejewski et al.(1997) obtained at 1200 and 1300°C, respec-tively. Since solubility of volatiles is a strongfunction of pressure, it is possible to compareonly a few experimental data obtained at 50MPa. In these two studies, different absorptioncoefficients were used to calculate the amountof dissolved CO2 from the peak height of themid infrared carbonate band at 1522 cm−1. Ap-plying the same absorption coefficient for bothstudies (398 l·mol−1·cm−1, Jendrzejewski et al.,1997) and using samples with similar watercontent (0.35 to 0.4 wt% H2O), the CO2 solubil-ity is 210 ppm at 1200°C (Dixon et al., 1995)and 257 ppm at 1300°C (Jendrzejewski et al.,1997). This suggests that temperature may havea small positive effect on CO2 solubility at 50MPa in basaltic melts. However, this conclu-sion is based on data from different laboratoriesand may be an artifact of different experimental
conditions. In contrast, Pan et al. (1991) noteda negative temperature dependence of pure CO2
solubility at higher pressures (1.0 and 1.5 GPa).However, the variation of CO2 solubility issmall and remains constant within error over atemperature range from 1300 to 1600°C. It canbe noted that, in the pressure range 0.5 to 3.5GPa, a compilation of all available data for CO2
solubilities in other silicate liquids coexistingwith pure CO2 confirms a general negative tem-perature effect on CO2 solubility in a variety ofcompositions (Ca-rich leucitite: Thibault andHolloway, 1994; albite: Stolper et al., 1987,melilitite: Brey, 1976; diopside: Rai et al., 1983;Ca-melilitite, Mg-melilitite, phonolite, andesite:Brooker et al., 2001; haplo-phonolite: Morizet et al., 2002).
4. The effect of melt composition on H2Oand CO2 volatile solubilities
It is well known that the solubilities of waterand CO2 in silicate melts are strongly dependenton the melt composition. In general, at given Pand T, the H2O solubility increases whereas theCO2 solubility decreases with SiO2 content ofthe melt (e.g., Blank and Brooker, 1994; Hol-loway and Blank, 1994; Brooker et al., 2001;King and Holloway, 2002).
To understand the compositional effects ofthe melt on the solubility of H2O and CO2, ex-perimental data obtained at identical pressureshave to be compared. Identical temperaturesmay be not strictly required because of the smalltemperature dependence of volatile solubilities.Only few experimental datasets for silicate meltsof different compositions at same pressure areavailable in the literature. The pressure range inwhich comparisons are possible is 75 MPa to 1GPa. The existing data are mostly restricted tothe rhyolitic and basaltic compositions (e.g.,Blank et al., 1993; Dixon et al., 1995; Tamic et al., 2001). One study illustrates volatile solu-bility in icelandite (composition close to an-desite, Jakobsson, 1997) at high temperature andpressure. In addition, King and Holloway (2002)studied experimentally the solubility of H2O andCO2 in water-poor (<3.5 wt% H2O) andesiticmelt at 1300°C and 1 GPa. Recently, Behrens

638
Roman Botcharnikov, Marcus Freise, Francois Holtz and Harald Behrens
et al. (2004b) presented a dataset for daciticmelts investigated at 1250°C and 100, 200 and500 MPa. In our comparison, we also used newexperimental data for basaltic melts obtained at1150°C, 500 MPa and 1200°C, 200 MPa whichare presented in more detail in the Appendix A.
Systematic datasets at same P and T aremissing for pressures below 100 MPa and,hence, the direct examination of the differencein H2O and CO2 solubility between silicic andmafic melt compositions is difficult. Rough es-timations are possible only at 75 MPa based onthe data of Blank et al. (1993) for rhyolite at850°C and one sample of Jendrzejewski et al.(1997) for basalt at 1300°C. The results showthat the concentrations of dissolved CO2 arehigher in rhyolite than in basalt (450 ppm forrhyolite, corrected value, and 370 ppm forbasalt), neglecting the temperature effect(which should be small at this pressure). Theexperiments of Dixon et al. (1995), performedat 72 MPa and 1200°C, also indicate lower sol-
ubility of volatiles in basalt (290 ppm CO2, val-ue corrected).
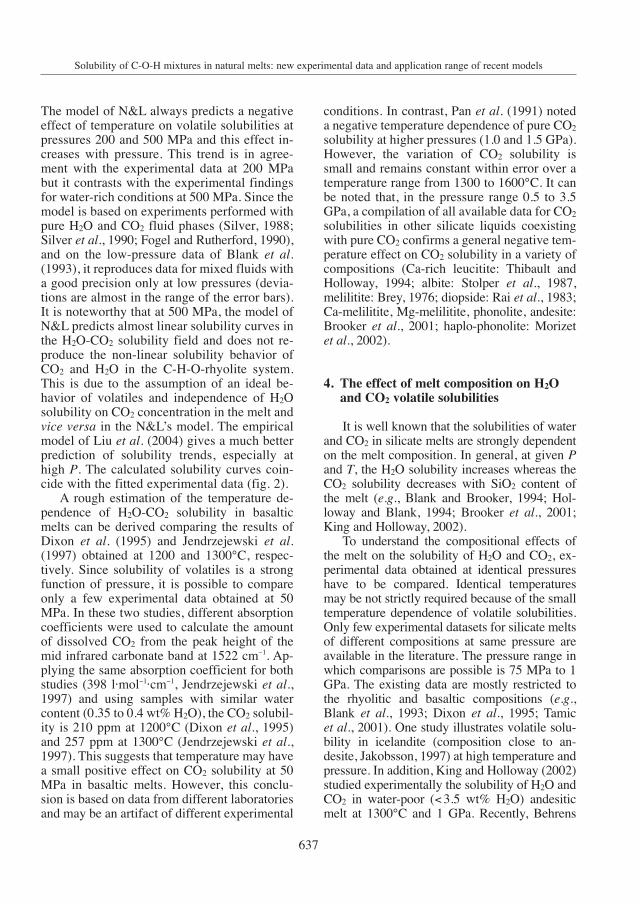
At 100 MPa, compositional trends can be ex-tracted from three studies (fig. 3): two for basalt(Pawley et al., 1992; Jendrzejewski et al., 1997)and one for dacite (Behrens et al., 2004b). Notethat we present only the data of Pawley et al.(1992) for relatively oxidizing conditions assum-ing that CO2 and H2O are the main fluid species.For low water contents, the data for basaltic meltsindicate CO2 solubility in the range 500-650ppm. The solubility of both CO2 and H2O isslightly higher in dacitic melt than in basalticmelt (fig. 3) in the CO2-rich as well as in the H2O--rich part of the diagram. For comparison, themodeled solubilities (N&L) of C-O-H species inrhyolite and basalt (calculated for SiO2= 49wt%)are shown as gray lines in fig. 3. The model iswithin the experimental error for basaltic meltsbut tends to underestimate slightly the volatilesolubilities. Assuming that volatile solubilities inrhyolite and dacite do not differ strongly at 100
Fig. 3. Solubilities of H2O and CO2 in basaltic (dots) and dacitic (dotted line) melts at 100 MPa. The datasetfor dacitic melt and the experimental procedure is described in detail by Behrens et al. (2004b). Gray lines showmodeled solubilities of volatiles in rhyolitic (dashed line) and basaltic (solid line) melt compositions.

639
Solubility of C-O-H mixtures in natural melts: new experimental data and application range of recent models
MPa (which is at least the case for pure water sol-ubility), this underestimation is more pronouncedfor dacite and rhyolite melts.
The available experimental data for differ-ent melt compositions at 200 MPa are summa-rized in fig. 4. Assuming that the temperatureeffect is low, the solubilities of H2O and CO2 inrhyolite and basalt do not differ significantly,except for water-rich compositions. At high wa-ter activities, water solubility is known to behigher in rhyolitic than in basaltic melts. Thevolatile solubility curves, calculated with theN&L model (basaltic system is modeled againfor SiO2= 49wt%), predict lower values thanthe experimental data. It should be noted thatdacitic melt shows a higher ability to dissolveCO2 and H2O when compared to basalt andhigher ability to dissolve CO2 when comparedto rhyolite. This difference may be related tothe presence of both molecular CO2 and car-bonate species in dacitic melt.
At 500 MPa total pressure, a similar CO2 sol-ubility gap between rhyolite and dacite can beobserved (fig. 5). However, in contrast to lowerpressures, basaltic melts have a much higher ca-pacity to dissolve C-O species compared to rhy-olitic and dacitic melts (figs. 3, 4 and 5). The in-crease in CO2 concentration in basaltic melts isvery pronounced with the first addition of CO2 tothe fluid. With a further increase in the molefraction of CO2 in the fluid (X f
CO2), the CO2 sol-ubility remains almost constant. The strong devi-ation from an ideal behavior in basalt melt sug-gests that water dissolved in basaltic melt mayinfluence the solubility mechanism of CO2 andstabilize carbonate groups (e.g., King and Hol-loway, 2002). The CO2 solubility in basalt meltsfor high X f
CO2 shown in fig. 5 is approximatelytwo times higher than values extrapolated fromdata of Pan et al. (1991). This may be related tothe effect of oxygen fugacity influencing the flu-id phase composition and particularly the
Fig. 4. The effect of silicate melt composition on solubilities of water and carbon dioxide at 200 MPa in thetemperature range 1100-1250°C. The black lines are the best polynomial (2nd order) fits of experimental data.Basalt composition (SC1, see table A.I. in Appendix A) was investigated at 1200°C and MnO-Mn3O4 oxygenbuffer (to vary mole fraction of H2O in the fluid phase, CO2 was added as silver oxalate source, Ag2C2O4). Thedescription of experimental and analytical technique is presented in the Appendix A. Gray lines are modeled sol-ubilities for rhyolite and basalt after Newman and Lowenstern (2002).

640
Fig. 5. The solubility of H2O and CO2 in melts of different compositions at 500 MPa. The experimental strat-egy used for the basaltic system (OB93-190) and description of the lines are given in Appendix A and fig. 4.Note the significant increase in CO2 solubility in basalt (by a factor of 2 to 3) when compared with rhyolitic anddacitic compositions.
Fig. 6. Available experimental data on H2O-CO2 solubility at 1 GPa for melt compositions close to andesite. Sol-id and dashed lines are the best fits of the data points obtained by Jakobsson (1997) at 1400°C for icelandite (54.5wt% SiO2) and by King and Holloway (2002) at 1300°C for andesite (59-60 wt% SiO2). Remarkable is that the sol-ubility of CO2 in icelandite at low X f
H2O is almost independent on H2O content of the melt (or on water activity),which is similar to the observed solubility behavior of CO2 in basaltic melt at 500 MPa and 1150°C (see fig. 5).
Roman Botcharnikov, Marcus Freise, Francois Holtz and Harald Behrens

641
Solubility of C-O-H mixtures in natural melts: new experimental data and application range of recent models
CO2/CO ratio (e.g., Pawley et al., 1992). The ex-periments plotted in figs. 4 and 5 were at strong-ly oxidizing conditions (log fO2= NNO + 3 ifaH2O = 1.0) and those of Pan et al. (1991) atmore reducing conditions close to NNO oxygenbuffer (note however, that Pan et al., 1991, esti-mated the molar ratio CO2/(CO2+CO) to be0.93). Experimental datasets obtained at identi-cal conditions but different fO2 conditions over awide range of fluid phase composition (X f
H2O
varying from 0 to 1) would help to understandvolatile solubility laws in basaltic melts. The cal-culated volatile solubilities after Newman andLowenstern (2002) are presented as gray lines infig 5. The predictions are closer to the experi-mental data for rhyolite than for basalt.
Experimental datasets for andesitic melts ob-tained at 1 GPa and 1400°C (Jakobsson, 1997;icelandite) and 1300°C (King and Holloway,2002) are plotted in fig. 6. Despite the fact thatthe temperatures of the experiments are similar,the solubilities of H2O and CO2 are found to bemuch higher in icelandite than in andesite. Kingand Holloway (2002) attributed this difference tothe amount of non-bridging oxygens in bothmelts, emphasizing that icelandite with 54.5wt% SiO2 has a higher NBO/T content (0.40)than andesite (60 wt% SiO2) with a NBO/T of0.30. It is also interesting to note that the solubil-ity of CO2 in icelandite at 1 GPa is approximate-ly constant over a wide range of H2O content ofthe melt (at high X f
CO2), as was observed forbasaltic melt at 0.5 GPa (see fig. 5).
5. Pressure effect on H2O and CO2 volatilesolubilities
The pressure effect on H2O-CO2 solubilitiesin rhyolite, dacite and basalt melts can be esti-mated from the comparison of datasets shownon figs. 3-6. In general, pressure has a largepositive effect on both H2O and CO2 solubility.In detail, the dependence of CO2 solubility on Pis more pronounced in basalt (containing car-bonates) than in dacite (containing molecularCO2 and carbonates) and in rhyolite (containingonly molecular CO2). This is consistent withhigher reaction volumes when CO2 is dissolvedin molecular form compared to its dissolution
as carbonate in silicate melts (Holloway andBlank, 1994; Behrens et al., 2004b).
6. Limitations for using CO2-H2O solubilitymodels
The comparison between calculated H2O-CO2 solubilities using the model of N&L andexperimental results (fluids containing mainlyCO2 and H2O) shows that the model predictssolubilities within 10% relative at low pressure(at least up to 200 MPa). However, at higherpressure, the error of the model can be morethan 20%, especially at low temperatures. Fur-thermore, the temperature effect predicted forrhyolitic melts at 500 MPa is not consistent withthe experimental data (fig. 2). In addition, themodel does not reproduce the data for basalticmelt at 500 MPa. Although experimental dataare missing to test the model at pressures be-tween 200 and 500 MPa, we suppose that thedeviation of calculated data from realistic valuesincreases with pressure. The experimentaldatasets obtained at 500 MPa and above showincreasing non-ideal solubility behavior of C-O-H species with increasing pressure (illustratedby the pronounced curvature of the solubilitycurves, figs. 5 and 6). The change in shape ofthe solubility curves with pressure is not repro-duced in the model of N&L. This is a further in-dication that the ideal-mixing model of N&L isdifficult to apply at pressures above 200 MPa.
It can be noted that the model of Papale(1999) is better able to reproduce the experimen-tal data at 500 MPa and above, at least for rhy-olitic melts (e.g., see fig. 6 in Tamic et al., 2001).This can be attributed to the fact that the modeldoes not assume ideal mixing in the fluid andmelt phases but considers interaction betweencomponents. Furthermore, using the recentlypublished experimental data, the thermodynamicapproach used by Papale (1999) can be im-proved to predict accurately C-O-H volatile sol-ubilities in silicate melts. In particular, there is acrucial need for solubility data above 200 MPafor intermediate and mafic melt compositions tocalibrate the model of Papale (1999). However, adisadvantage of this model is that it is not avail-able as a program code.

642
given temperatures of 800 and 700°C. This dia-gram demonstrates clearly that the discussion ofCO2 and H2O solubilities in rhyolitic melt at675°C in the range 100-400 MPa (as done byLowenstern, 2000, 2001) has no physical mean-ing because at those conditions rhyolitic meltsexist only in a very small field of the diagram(P>200 MPa; X f
H2O>0.8 and melt H2O content>6 wt%). On the other hand, if cooling or de-compression processes are relatively rapid andcrystal nucleation and growth are relatively slow,the melt can be metastably preserved and localequilibria can be reached between gas bubblesand small batches of the melt. In this case, thelow-temperature solubility models can be ap-plied for such metastable phases but only on thelocal scale.
Acknowledgements
We very much appreciated the reviews of N.Metrich and A. Paonita that greatly improvedthe quality of this paper. P. Papale is acknowl-edged for editorial work.
Fig. 7. Limitations for application of solubility models imposed by properties of rhyolitic systems. The curvesof H2O-CO2 solubility (thick solid lines) are from Tamic et al. (2001) obtained at 800°C. The hatched area rep-resents the subsolidus region of the eutectic composition in Ab-Or-Qz system at 800°C. In this field, water ac-tivity is too low for melts to be stable (100% crystallization). The solidus as a function of P and X f
H2O at 800°Chas been drawn based on the data of Johannes and Holtz (1996). The area marked by the gray parallel lines andhatched area show the subsolidus field at 700°C.
Roman Botcharnikov, Marcus Freise, Francois Holtz and Harald Behrens
7. Limits for applications of the models
Recent studies have applied H2O-CO2 solu-bility models to discuss the role of volatiles inthe evolution of physical and chemical proper-ties of ascending and crystallizing magmas.For instance, model solubility plots for H2O-CO2-rhyolitic melt system at 675°C and differ-ent pressures are shown and discussed byLowenstern (2000: fig. 2; and 2001: fig. 3).However, the use of such models requires acareful definition of the prevailing conditionsand, in particular, kinetic aspects of cooling ordecompression in silicic systems. It is wellknown that solidus temperatures in aluminosil-icate systems depend upon water activity. At800°C, 200 MPa and equilibrium conditions,rhyolitic melts with compositions close to thethermal minimum in the ternary system Qz-Ab-Or crystallize if the mole fraction of waterin the fluid phase (X f
H2O) is below 0.4. This alsoexplains why the data of Tamic et al. (2001) ob-tained at 800°C are restricted to the water-richpart of the diagram in fig. 2. Figure 7 shows thefields in which rhyolitic melts can be stable at

Table A.I. Starting compositions (wt%).
Microprobe analysis of the starting glasses (a)
SC1 (b) σ OB93-190 (c) σ
SiO2 48.34 0.29 48.84 0.54TiO2 2.86 0.05 2.75 0.07Al2O3 14.61 0.13 16.14 0.26FeOtot 12.91 0.28 11.85 0.32MnO - - 0.17 0.05MgO 6.40 0.11 5.86 0.13CaO 10.87 0.15 9.76 0.16Na2O 2.60 0.11 3.12 0.15K2O 0.30 0.03 1.12 0.07
Total 98.89 - 99.60 -
(a) Glass compositions are average values from 10 measurements.(b) Synthetic analogue of parental liquid of the Skaergaard layered intrusion (Brooks and Nielsen, 1978).(c) Natural alkali basalt from the Mont Crozier on the Kerguelen Archipelago.
643
Solubility of C-O-H mixtures in natural melts: new experimental data and application range of recent models
Appendix A. Experimental setup.
A.1. Starting materials and preparation of charges
In this study, two basaltic compositions were used for experiments on the solubility of H-C-Omixtures in silicate melt. One starting composition (SC1) is a synthetic analogue of a ferrobasalt,which is assumed to be a parental magma of the Skaergaard intrusion (dike C, Brooks and Nielsen,1978). The starting powder was prepared from mixture of oxides (SiO2, TiO2, Al2O3, Fe2O3, MgO)and carbonates (CaCO3, Na2CO3, K2CO3). The other sample is a natural alkali basalt (OB93-190)from the Mont Crozier on the Courbet Peninsula of the Kerguelen Island. This basalt represents anevolved LIP magma derived from the Kerguelen Plume. A detailed description of the sample OB93-190 can be found in Damasceno et al. (2002).
Both starting materials were first ground in a ball mill to <100 µm, then loaded in a Pt crucibleand fused twice (with grinding in between) for 1 h at 1600°C and 1 atm. The major element composi-tions of the obtained homogeneous and crystal-free glasses were determined by electron microprobeand are given in table A.I. The powder was sieved to the grain sizes of <100 µm and 100-200 µm, andtwo fractions were mixed together in a ratio ∼1:1 to minimize the free volume between grains whenpowder is charged into the capsules. Capsules were cleaned in acetone and annealed for 1 h at 1000°Cat 1 atm before use. The capsules were welded shut at one side with an electric arc and filled withglass powder (ca. 20 mg), H2O and/or Ag2C2O4. The purity of Ag2C2O4 was tested using a gravimet-ric determination.
The observed weight loss was 90% of the expected value. Different H2O/CO2 ratios were adjust-ed by varying the amounts of H2O and Ag2C2O4. The total amount of fluid in the experiments was al-ways higher than the expected fluid-saturation values of the melt. The filled capsules were cooled inliquid nitrogen, welded shut and heated in a drying furnace for 120 min at 200°C to decompose theAg2C2O4 to Ag and CO2 and to test for possible leakage.
644
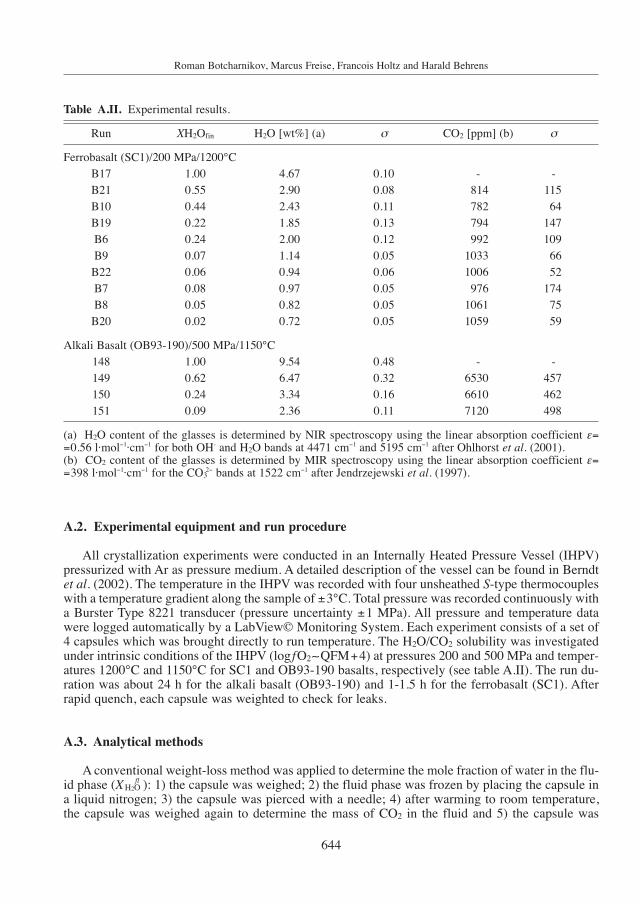
Table A.II. Experimental results.
Run XH2Ofin H2O [wt%] (a) σ CO2 [ppm] (b) σ
Ferrobasalt (SC1)/200 MPa/1200°C B17 1.00 4.67 0.10 - -B21 0.55 2.90 0.08 814 115B10 0.44 2.43 0.11 782 64B19 0.22 1.85 0.13 794 147B6 0.24 2.00 0.12 992 109B9 0.07 1.14 0.05 1033 66B22 0.06 0.94 0.06 1006 52B7 0.08 0.97 0.05 976 174B8 0.05 0.82 0.05 1061 75B20 0.02 0.72 0.05 1059 59
Alkali Basalt (OB93-190)/500 MPa/1150°C 148 1.00 9.54 0.48 - -149 0.62 6.47 0.32 6530 457150 0.24 3.34 0.16 6610 462151 0.09 2.36 0.11 7120 498
(a) H2O content of the glasses is determined by NIR spectroscopy using the linear absorption coefficient ε==0.56 l·mol−1·cm−1 for both OH- and H2O bands at 4471 cm−1 and 5195 cm−1 after Ohlhorst et al. (2001).(b) CO2 content of the glasses is determined by MIR spectroscopy using the linear absorption coefficient ε==398 l·mol−1·cm−1 for the CO3
2− bands at 1522 cm−1 after Jendrzejewski et al. (1997).
Roman Botcharnikov, Marcus Freise, Francois Holtz and Harald Behrens
A.2. Experimental equipment and run procedure
All crystallization experiments were conducted in an Internally Heated Pressure Vessel (IHPV)pressurized with Ar as pressure medium. A detailed description of the vessel can be found in Berndtet al. (2002). The temperature in the IHPV was recorded with four unsheathed S-type thermocoupleswith a temperature gradient along the sample of ±3°C. Total pressure was recorded continuously witha Burster Type 8221 transducer (pressure uncertainty ±1 MPa). All pressure and temperature datawere logged automatically by a LabView© Monitoring System. Each experiment consists of a set of4 capsules which was brought directly to run temperature. The H2O/CO2 solubility was investigatedunder intrinsic conditions of the IHPV (log fO2∼QFM+4) at pressures 200 and 500 MPa and temper-atures 1200°C and 1150°C for SC1 and OB93-190 basalts, respectively (see table A.II). The run du-ration was about 24 h for the alkali basalt (OB93-190) and 1-1.5 h for the ferrobasalt (SC1). Afterrapid quench, each capsule was weighted to check for leaks.
A.3. Analytical methods
A conventional weight-loss method was applied to determine the mole fraction of water in the flu-id phase (XH2O
fl ): 1) the capsule was weighed; 2) the fluid phase was frozen by placing the capsule ina liquid nitrogen; 3) the capsule was pierced with a needle; 4) after warming to room temperature,the capsule was weighed again to determine the mass of CO2 in the fluid and 5) the capsule was

in silicate melts at high pressures, Contrib. Mineral.Petrol., 57, 215-221.
BROOKER, R.A., S.C. KOHN, J.R. HOLLOWAY and P.F.MCMILLAN (2001): Structural controls on the solubili-ty of CO2 in silicate melts, Part I. Bulk solubility data,Chem. Geol., 174, 225-239.
BROOKS, C.K. and T.F.D. NIELSEN (1978): Early stages inthe differentiation of the Skaergaard magma as re-vealed by a closely related suite of dike rocks, Lithos,11, 1-14.
BURNHAM, C.W. and N.F. DAVIS (1971): The role of H2O in silicate melts, I. P-V-T relations in the system NaAl-Si3O8-H2O to 10 kilobar and 1000°C, Am. J. Sci., 270,45-79.
BURNHAM, C.W. and N.F. DAVIS (1974): The role of H2O insilicate melts, II. Thermodynamic and phase relationsin the system NaAlSi3O8-H2O to 10 kilobar, 700° to1000°C, Am. J. Sci., 274, 902-940.
DAMASCENO, D., J.S. SCOATES, D. WEIS, F.A. FREY and A.GIRET (2002): Mineral chemistry of mildly alkalicbasalts from the 25 Myr Mont Crozier section, Kergue-len Archipelago: constraints on phenocryst crystallisa-tion environments, J. Petrol., 43, 1389-1413.
DIXON, J.E. (1997): Degassing of alkalic basalts, Am. Min-eral., 82, 368-378.
DIXON, J.E. and E.M. STOLPER (1995): An experimentalstudy of water and carbon dioxide solubilities in mid-ocean ridge basaltic liquids, Part II. Applications to de-gassing, J. Petrol., 36, 1633-1646.
645
Solubility of C-O-H mixtures in natural melts: new experimental data and application range of recent models
placed in a drying oven at 110°C for 3-5 min and subsequently weighed to measure the mass of H2Olost from the capsule. An entrapment of atmospheric nitrogen in the experimental charge duringpreparation of the capsules was estimated to be quite low (Tamic et al., 2001) and was not consid-ered in the calculations.
H2O and CO2 contents in basaltic glasses were determined using infrared spectroscopy. Volatile-bearing glass slabs were ground and polished at both sides to a thickness of 150-200 µm for near-in-frared (NIR) and of 30-40 µm for mid-infrared (MIR) spectroscopic measurements. The samplethickness was determined with an accuracy of ±2 µm using a digital micrometer. IR absorption spec-tra were recorded using a Bruker IFS 88 spectrometer equipped with an IR-scope II microscope andan InSb-MCT sandwich detector (local resolution of 100×100 µm was adjusted with a slit aperture).Dried air was measured as reference and 100 scans for background and sample measurement were col-lected. NIR spectra in the range 6000-4000 cm−1 were recorded with a spectral resolution of 4 cm−1,using a tungsten lamp (NIR) and a CaF2 beam splitter. A globar light source and a KBr beam splitterwere used for measuring MIR spectra in the range 4000-1200 cm−1 with a spectral resolution of 2 cm−1.
The H2O concentrations in the basaltic glasses were determined using the absorption bands at 5200cm−1 and 4500 cm−1 for molecular H2O and OH-groups, respectively. Absorbances were determinedusing linear background corrections for each peak. The total H2O concentration was calculated usingLambert Beer’s Law as described by Ohlhorst et al. (2001). The CO2 concentration of the samples wasmeasured using the band system at 1300-1600 cm−1 due to distorted carbonate groups. The peak heightat 1522 cm−1 was determined after subtraction of a reference spectrum of a volatile-free sample nor-malized to same thickness. Calculation of CO2 concentration follows Jendrzejewski et al. (1997).
The results of analytical measurements are summarized in table A.II and presented in figs. 4(SC1; 200 MPa, 1200°C) and 5 (OB93-190; 500 MPa, 1150°C).
REFERENCES
BEHRENS, H., N. TAMIC and F. HOLTZ (2004a): Determina-tion of molar absorption coefficient for the IR absorp-tion band of CO2 in rhyolitic glasses, Am. Mineral., 89,301-306.
BEHRENS, H., S. OHLHORST, F. HOLTZ and M. CHAMPENOIS
(2004b): CO2 solubility in dacitic melts equilibratedwith H2O-CO2 fluids – Implications for modelling thesolubility of CO2 in silicic melts, Geochim. Cos-mochim. Acta, 68, 4687-4703.
BERNDT, J., C. LIEBSKE, F. HOLTZ, M. FREISE, M. NOWAK, D.ZIEGENBEIN, W. HURKUCK and J. KOEPKE (2002): Acombined rapid-quench and H2-membrane setup for in-ternally heated pressure vessels: Description and appli-cation for water solubility in basaltic melts, Am. Min-eral., 87, 1717-1730.
BLANK, J.G. (1993) An experimental investigation of thebehaviour of carbon dioxide in rhyolitic melt, Ph.D.Dissertation (California Institute of Technology,Pasadena, CA).
BLANK, J.G. and R.A. BROOKER (1994): Experimental stud-ies of carbon dioxide in silicate melts: solubility, speci-ation and stable isotope behavior, Rev. Mineral., 30,157-186.
BLANK, J.G., E.M. STOLPER and M.R. CARROLL (1993): Sol-ubilities of carbon dioxide and water in rhyolitic melt at850°C and 750 bar, Earth Planet. Sci. Lett., 119, 27- 36.
BREY, G. (1976): CO2 solubility and solubility mechanisms
646
Roman Botcharnikov, Marcus Freise, Francois Holtz and Harald Behrens
DIXON, J.E., E.M. STOLPER and J.R. HOLLOWAY (1995): An ex-perimental study of water and carbon dioxide solubilitiesin mid-ocean ridge basaltic liquids, Part I. Calibration andsolubility models, J. Petrol., 36, 1607-1631.
FOGEL, R.A. and M.J. RUTHERFORD (1990): The solubilityof carbon dioxide in rhyolitic melts: a quantitativeFTIR study, Am. Mineral., 75, 1311-1326.
HOLLOWAY, J.R. (1987): Igneous fluids, Rev. Mineral., 17,211-232.
HOLLOWAY, J.R. and J.G. BLANK (1994): Application of ex-perimental results to C-O-H species in natural melts,Rev. Mineral., 30, 187-230.
JAKOBSSON, S. (1997): Solubility of water and carbon diox-ide in an icelandite at 1400°C and 10 kilobar, Contrib.Mineral. Petrol., 127, 129-135.
JENDRZEJEWSKI, N., T.W. TRULL, F. PINEAU and M. JAVOY
(1997): Carbon solubility in Mid-Ocean Ridge basalticmelt at low pressures (250-1950 bar), Chem. Geol.,138, 81-92.
JOHANNES, W. and F. HOLTZ (1996): Petrogenesis and Expe-rimental Petrology of Granitic Rocks (Springer Ver-lag), pp. 335.
KING, P.L. and J.R. HOLLOWAY (2002): CO2 solubility andspeciation in intermediate (andesitic) melts: the role ofH2O and composition, Geochim. Cosmochim. Acta, 66,1627-1640.
LIU, Y., Y. ZHANG and H. BEHRENS (2004): Solubility ofH2O in rhyolitic melts at low pressures and a new em-pirical model to predict H2O and CO2 solubility in rhy-olitic melts, J. Volcanol. Geotherm. Res., 143, 219-235.
LOWENSTERN, J.B. (2000): A review of the contrasting be-havior of two magmatic volatiles: chlorine and carbondioxide, J. Geochem. Explor., 69-70, 287-290.
LOWENSTERN, J.B. (2001): Carbon dioxide in magmas andimplications for hydrothermal systems, Mineral. De-posita, 36, 490-502.
MORIZET, Y., R.A. BROOKER and S.C. KOHN (2002): CO2 inhaplophonolitic melt: solubility, speciation and carbon-ate complexation, Geochim. Cosmochim. Acta, 66,1809-1820.
MYSEN, B.O., D.H. EGGLER, M.G. SEITZ and J.R. HOLLO-WAY (1976): Carbon dioxide solubility in silicate meltsand crystals, Part I. Solubility measurements, Am. J.Sci., 276, 455-479.
NEWMAN, S. and J.B. LOWENSTERN (2002): VolatileCalc: asilicate melt-H2O-CO2 solution model written in Visu-al Basic for excel, Comput. Geosc., 28, 597-604.
NUCCIO, P.M. and A. PAONITA (2000): Investigation of no-
ble gas solubility in H2O-CO2 bearing silicate liquids atmoderate pressure, II. The Extended Ionic Porosity(EIP) model, Earth Planet. Sci. Lett., 183, 499-512.
OHLHORST, S., H. BEHRENS and F. HOLTZ (2001): Composi-tional dependence of molar absorptivities of near-infra-red OH- and H2O bands in rhyolitic to basaltic glasses,Chem. Geol., 174, 5-20.
PAN, V., J.R. HOLLOWAY and R.L. HERVIG (1991): The pres-sure and temperature dependence of carbon dioxidesolubility in tholeiitic basalt melts, Geochim. Cos-mochim. Acta, 55, 1587-1595.
PAONITA, A., G. GIGLI, D. GOZZI, P.M. NUCCIO and R.TRIGLIA (2000): Investigation of the He solubility inH2O-CO2 bearing silicate liquids at moderate pressure:a new experimental method, Earth Planet. Sci. Lett.,181, 595-604.
PAPALE, P. (1999): Modeling of the solubility of a two-com-ponent H2O+CO2 fluid in silicate liquids, Am. Miner-al., 84, 477-492.
PAWLEY, A.R., J.R. HOLLOWAY and P.F. MCMILLAN (1992):The effect of oxygen fugacity on the solubility of car-bon-oxygen fluids in basaltic melt, Earth Planet Sci.Lett., 110, 213-225.
RAI, C.S., S.K. SHARMA, D.W. MEUNOW, D.W. MATSON andC.D. BYERS (1983): Temperature dependence of CO2 sol-ubility in high pressure quenched glass of diopside com-position, Geochim. Cosmochim. Acta, 47, 953-958.
SILVER, L.A. (1988): Water in silicate glasses, Ph.D. Thesis(California Inst. Tech., Pasadena, CA).
SILVER, L.A. and E. STOLPER (1985): A thermodynamicmodel for hydrous silicate melts, J. Geol., 93, 161-177.
SILVER, L.A., P.D. IHINGER and E. STOLPER (1990): The in-fluence of bulk composition on the speciation of waterin silicate glasses, Contrib. Mineral. Petrol., 104, 142-162.
STOLPER, E. (1982): Water in silicate glasses: an infraredspectroscopic study, Contrib. Mineral. Petrol., 81, 1-17.
STOLPER, E., G. FINE, T. JOHNSON and S. NEWMAN (1987):Solubility of carbon dioxide in albitic melt, Am. Miner-al., 72, 1071-1085.
TAMIC, N., H. BEHRENS and F. HOLTZ (2001): The solubili-ty of H2O and CO2 in rhyolitic melts in equilibriumwith a mixed CO2-H2O fluid phase, Chem. Geol., 174,333-347.
THIBAULT, Y. and J.R. HOLLOWAY (1994): Solubility of CO2
in a Ca-rich leucitite: effects of pressure, temperatureand oxygen fugacity, Contrib. Mineral. Petrol., 116,216-224.