solubility and reactivity of hnco in water: insights … · solubility and reactivity of hnco in...
TRANSCRIPT
Atmos. Chem. Phys., 16, 703–714, 2016
www.atmos-chem-phys.net/16/703/2016/
doi:10.5194/acp-16-703-2016
© Author(s) 2016. CC Attribution 3.0 License.
Solubility and reactivity of HNCO in water: insights into HNCO’s
fate in the atmosphere
N. Borduas, B. Place, G. R. Wentworth, J. P. D. Abbatt, and J. G. Murphy
Department of Chemistry, University of Toronto, Toronto, Ontario, Canada
Correspondence to: J. G. Murphy ([email protected])
Received: 24 July 2015 – Published in Atmos. Chem. Phys. Discuss.: 7 September 2015
Revised: 2 December 2015 – Accepted: 7 December 2015 – Published: 21 January 2016
Abstract. A growing number of ambient measurements
of isocyanic acid (HNCO) are being made, yet little is
known about its fate in the atmosphere. To better understand
HNCO’s loss processes and particularly its atmospheric
partitioning behaviour, we measure its effective Henry’s
Law coefficient KeffH with a bubbler experiment using
chemical ionization mass spectrometry as the gas phase
analytical technique. By conducting experiments at different
pH values and temperature, a Henry’s Law coefficient KH
of 26± 2 M atm−1 is obtained, with an enthalpy of disso-
lution of −34± 2 kJ mol−1, which translates to a KeffH of
31 M atm−1 at 298 K and at pH 3. Our approach also allows
for the determination of HNCO’s acid dissociation con-
stant, which we determine to be Ka = 2.1± 0.2× 10⁻⁴ M at
298 K. Furthermore, by using ion chromatography to analyze
aqueous solution composition, we revisit the hydrolysis ki-
netics of HNCO at different pH and temperature conditions.
Three pH-dependent hydrolysis mechanisms are in play
and we determine the Arrhenius expressions for each rate
to be k1 = (4.4± 0.2)× 107 exp(−6000± 240/T ) M s−1,
k2 = (8.9± 0.9)× 106 exp(−6770± 450/T ) s−1 and
k3 = (7.2± 1.5)× 108 exp(−10 900± 1400/T ) s−1, where
k1 is for HNCO + H++ H2O → NH+4 + CO2, k2 is for
HNCO + H2O → NH3 + CO2 and k3 is for NCO−+ 2
H2O→ NH3+ HCO−3 . HNCO’s lifetime against hydrolysis
is therefore estimated to be 10 days to 28 years at pH
values, liquid water contents, and temperatures relevant to
tropospheric clouds, years in oceans and months in human
blood. In all, a better parameterized Henry’s Law coefficient
and hydrolysis rates of HNCO allow for more accurate
predictions of its concentration in the atmosphere and
consequently help define exposure of this toxic molecule.
1 Introduction
Until recently, the interest in studying HNCO was from a
fundamental science perspective with research conducted on
its structure, preparation and physical properties (Belson and
Strachan, 1982) and on its theoretical rovibrational spectra
(Mladenovic and Lewerenz, 2008). Both theoretical and ex-
perimental data indicate that HNCO is the most stable CHNO
isomer with a near-linear π -bond system (Hocking et al.,
1975; Jones et al., 1950; Poppinger et al., 1977). Roberts
et al. (2010) reported detection of HNCO using negative
ion proton transfer chemical ionization mass spectrometry
(CIMS) from laboratory biomass burning and later deter-
mined its emission factor to be 0.25–1.20 mmol per mol of
CO for different types of biomass fuels (Veres et al., 2010).
Shortly afterwards, the same authors reported the first ambi-
ent atmospheric measurements of HNCO in Pasadena, Cal-
ifornia, reaching 120 pptv and raising concerns of HNCO
exposure due to its toxicity (Roberts et al., 2011). Indeed,
HNCO has been observed to cause protein carbamylation
leading to cardiovascular disease, rheumatoid arthritis and
cataracts (Beswick and Harding, 1984; Lee and Manning,
1973; Mydel et al., 2010; Wang et al., 2007).
Since Roberts et al.’s initial measurements, ambient
HNCO has also been measured in Boulder and in Fort
Collins, Colorado, (Roberts et al., 2014), in Toronto, Ontario
(Wentzell et al., 2013) and in Calgary, Alberta (Woodward-
Massey et al., 2014). HNCO has also been detected simulta-
neously in the gas phase and in cloud water in La Jolla, Cal-
ifornia (Zhao et al., 2014). From these studies, typical urban
concentrations range from below detection limits to approxi-
mately 100 pptv, whereas concentrations as high as 1.2 ppbv,
enough to be of health concern, have been measured in air
Published by Copernicus Publications on behalf of the European Geosciences Union.
704 N. Borduas et al.: Solubility and reactivity of HNCO in water
masses impacted by biomass burning in Boulder, Colorado
(Roberts et al., 2011, 2014; Woodward-Massey et al., 2014).
HNCO has a variety of anthropogenic and biogenic
sources to the atmosphere. HNCO has been quantified from
diesel engine exhaust (Kroecher et al., 2005; Wentzell et al.,
2013) and light-duty vehicles (Brady et al., 2014) as well
as from biogenic sources such as biomass burning (Roberts
et al., 2010, 2011, 2014; Veres et al., 2010). There also ex-
ist secondary sources of HNCO to the atmosphere, including
the gas phase oxidation of amines and amides by OH radicals
producing HNCO via H-abstraction mechanisms (Barnes et
al., 2010; Borduas et al., 2013, 2015). Evidence of secondary
sources of HNCO has also been demonstrated in the field,
with peak HNCO concentrations occurring during daytime
(Roberts et al., 2011, 2014; Zhao et al., 2014).
The sinks of HNCO however remain poorly constrained.
HNCO has a lifetime of decades towards OH radicals in
the atmosphere as estimated by extrapolating high temper-
ature rate coefficients to atmospheric temperatures (Tsang,
1992; Mertens et al., 1992; Tully et al., 1989). It is also
not expected to photolyze in the actinic region since its first
UV absorption band is observed below 280 nm wavelengths
(Brownsword et al., 1996; Dixon and Kirby, 1968; Rabal-
ais et al., 1969). Nonetheless, HNCO has served as a bench-
mark system in understanding photodissociation decomposi-
tion pathways such as direct and indirect dissociation pro-
cesses and remains an area of active research (Yu et al.,
2013 and references therein). HNCO is most likely removed
from the atmosphere by wet and/or dry deposition. HNCO’s
gas-to-liquid partitioning is therefore an important thermo-
dynamic property that can be used to predict its atmospheric
fate. Specifically, the Henry’s Law coefficientKH for the sol-
ubility of HNCO represents the equilibrium ratio between its
gas phase and aqueous phase concentrations at infinite dilu-
tions according to Eq. (1) (Sander, 2015, 1999). The Henry’s
Law coefficient for HNCO has only recently been measured
by Roberts and coworkers but their experimental set up was
limited to a single pH measurement (Roberts et al., 2011).
As HNCO is a weak acid with a pKa of 3.7, its Henry’s Law
coefficient is expected to have a large pH dependence as de-
scribed in Eq. (2). Furthermore, the enthalpy of dissolution
for HNCO is currently unknown. In lieu of measurements,
modelling studies on HNCO have used formic acid’s en-
thalpy of dissolution to model the temperature dependence of
HNCO’s Henry’s Law coefficient (Barth et al., 2013; Young
et al., 2012). In our present study, we measure the effective
Henry’s Law coefficient of HNCO at a range of pH and tem-
peratures to determine its enthalpy of dissolution for the first
time.
4
importance of these mechanisms in evaluating the fate of HNCO in the atmosphere, we follow 1
up on the study by Jensen with our own experiments using ion chromatography to determine 2
the pH and temperature dependencies of the overall rate of hydrolysis of HNCO. Quantitative 3
knowledge of the ability of HNCO to partition to the aqueous phase and its subsequent reactions 4
with water allows for an accurate understanding of the chemical fate of HNCO in the 5
atmosphere (Fig. 1). In this study, we therefore provide laboratory measurements of HNCO’s 6
Henry’s Law coefficient and enthalpy of dissolution as well as its three rates of hydrolysis and 7
their respective activation energies. 8
9
Scheme 1: The three mechanisms involved in HNCO’s hydrolysis. 10
11
Figure 1: The fate of HNCO in the atmosphere includes its partitioning between the gas and 12
aqueous phases and its hydrolysis through three different mechanisms governed by k1, k2, and 13
k3. 14
2 Experimental Methods 15
2.1 Henry’s Law coefficient experiments 16
To measure the effective Henry’s Law coefficient 𝐾Heffof HNCO, we use a bubbler column 17
experimental set up and detect HNCO through chemical ionization mass spectrometry. 18
Scheme 1. The three mechanisms involved in HNCO’s hydrolysis.
KH = CHNCO/pHNCO (1)
KeffH =KH
(1+
Ka[H+]) . (2)
HNCO reacts irreversibly with water in the aqueous phase,
an unusual property for an atmospheric molecule. Once
HNCO partitions to the aqueous phase, three mechanisms for
its hydrolysis are possible. The first (Reaction R1) is acid-
catalyzed and is therefore termolecular, whereas the second
(Reaction R2) and third (Reaction R3) are bimolecular re-
actions involving either the protonated or deprotonated form
of HNCO (Scheme 1) (Amell, 1956; Belson and Strachan,
1982; Jensen, 1958). In 1958, Jensen determined the hydrol-
ysis rate of the three mechanisms through addition of AgNO3
to buffered solutions at different time points to precipitate un-
reacted isocyanate as AgNCO, followed by back titration of
excess AgNO3 with NH4SCN. Considering the importance
of these mechanisms in evaluating the fate of HNCO in the
atmosphere, we follow up on the study by Jensen with our
own experiments using ion chromatography to determine the
pH and temperature dependencies of the overall rate of hy-
drolysis of HNCO. Quantitative knowledge of the ability of
HNCO to partition to the aqueous phase and its subsequent
reactions with water allows for an accurate understanding of
the chemical fate of HNCO in the atmosphere (Fig. 1). In
this study, we therefore provide laboratory measurements of
HNCO’s Henry’s Law coefficient and enthalpy of dissolution
as well as its three rates of hydrolysis and their respective ac-
tivation energies.
2 Experimental methods
2.1 Henry’s Law coefficient experiments
To measure the effective Henry’s Law coefficient KeffH of
HNCO, we use a bubbler column experimental set up and
detect HNCO through chemical ionization mass spectrome-
try.
2.1.1 Acetate reagent ion CIMS
The quadrupole chemical ionization mass spectrometer
(CIMS) was built in house and is described in detail else-
where (Escorcia et al., 2010). We opted to use acetate as
Atmos. Chem. Phys., 16, 703–714, 2016 www.atmos-chem-phys.net/16/703/2016/

N. Borduas et al.: Solubility and reactivity of HNCO in water 705
Figure 1. The fate of HNCO in the atmosphere includes its par-
titioning between the gas and aqueous phases and its hydrolysis
through three different mechanisms governed by k1, k2, and k3.
the reagent ion which has been shown to be sensitive for the
detection of acids (Roberts et al., 2010; Veres et al., 2008).
For this experimental set up, the reagent ion was generated
by flowing 20 sccm of nitrogen over a glass tube containing
acetic anhydride (from Sigma-Aldrich and used as is) and
maintained at 30 ◦C. This flow was subsequently mixed with
a nitrogen dilution flow of 2 L min−1 and passed through a
polonium-210 radioactive source to generate acetate ions.
All flows were controlled using mass flow controllers. The
data acquisition was done under selected ion mode where 10
m/z ratios were monitored with dwell times of 0.2 s each
and each duty cycle was 4 s. Ions measured included m/z 59
(AcO−), m/z 119 ((AcOH)AcO−), m/z 51 (black counts),
m/z 35 (Cl−), m/z 42 (NCO−), m/z 45 (HCOO−), m/z 46
(ONO−),m/z 96,m/z 102 andm/z 113. The raw signals are
then normalized tom/z 59 and reported as normalized counts
per second (ncps). For the exception of m/z 42, none of the
ions were observed to change during the experiments. The in-
let flow of the CIMS is governed by a pin hole at 0.5 L min−1,
and a N2 dilution flow of 0.4 L min−1 into the inlet was used
to avoid depletion of the acetate reagent ion by high HNCO
concentrations. Previous work suggests there is no significant
role of water vapour in HNCO’s detection by acetate CIMS
(Roberts et al., 2010). With the CIMS’s inlet dilution, the RH
within the ion molecule region was < 20 %.
2.1.2 Experimental set-up for measurement of KH
To obtain the Henry’s Law coefficient,KH, we monitored the
decrease in gas phase HNCO exiting a buffered aqueous so-
lution for a range of volume flow rates. A bubbler column
experimental set up is used with online gas phase detection.
This method is employed to measure HNCO’s partitioning
and take into account the concurrent hydrolysis of HNCO
in the buffer solution at high time resolution. Our experi-
mental setup is based on previous work (Kames and Schu-
rath, 1995; Roberts, 2005; Roberts et al., 2011) and our ap-
paratus is comprised of one fritted bubbler with an approx-
imate volume of 70 mL which contained 15 mL of a citric
acid/Na2HPO4 buffer at varying pH. The 15 mL volume was
chosen to reduce HNCO equilibration times and to simul-
taneously ensure that the bubbler’s frit was submerged. Ex-
periments performed in 30 mL of buffer yielded identical re-
sults. The water lost to the gas phase during the experiments
(< 1 h) was at most 5 % of the original buffer volume and so
no corrections to the latter were required. The bubbler was
held in a temperature-controlled bath of approximately 1 : 1
mixture of deionized water and ethylene glycol. Upstream
of the bubbler, where the RH was measured to be ∼ 50 %,
was a valve and a tee connection where the dry HNCO flow
could be connected and disconnected during the experiments.
Downstream of the bubbler was another tee which connected
to both the exhaust and the acetate reagent ion CIMS. Con-
veniently, the absolute concentration of gas-phase HNCO is
not required in this approach since it relies on the decay of
the signal, [HNCO]t/ [HNCO]0 and not on the absolute gas
phase and aqueous phase concentrations.
HNCO was produced using a permeation source which
sublimes solid cyanuric acid at 250 ◦C in a flow of dry ni-
trogen and is described in detail elsewhere (Borduas et al.,
2015). This source is based on HNCO sublimation tech-
niques and on a similar source previously developed by
Roberts et al. (Belson and Strachan, 1982; Roberts et al.,
2010). The buffer solutions were made with solid citric acid,
disodium phosphate and deionized water with citric acid con-
centrations ranging from 0.02 to 0.0035 M to access a pH
range of 2.5–4.0.
Each experiment began with gaseous HNCO flowing
through a fresh buffer solution until a reasonably stable sig-
nal (> 0.01 ncps) was obtained by the CIMS (background
counts ∼ 5× 10⁻⁴ ncps). The solution did not need to reach
equilibrium for the experiment to proceed and so lower tem-
peratures and higher pHs (when the equilibration time is
longest and may reach over 4–5 h) were feasible. Once a
normalized signal (i.e. relative to the reagent ion signal) of
at least 0.025 for HNCO was obtained, the flow of HNCO
through the bubbler was turned off, and only pure nitro-
gen continued to flow through. The HNCO signal then de-
cayed exponentially as a function of time due to partition-
ing as well as hydrolysis. This decay was monitored until it
had decreased to less than one quarter of the original signal.
This method also has the advantage of extracting an effec-
tive Henry’s Law coefficient without needing to monitor the
aqueous phase HNCO concentration.
2.2 Hydrolysis rate experiments
HNCO in the aqueous phase was measured using ion chro-
matography at different pH and temperatures to determine its
rates of hydrolysis.
www.atmos-chem-phys.net/16/703/2016/ Atmos. Chem. Phys., 16, 703–714, 2016

706 N. Borduas et al.: Solubility and reactivity of HNCO in water
2.2.1 Ion chromatography
The measurements for the hydrolysis of HNCO were made
using a Dionex IC-2000 Ion Chromatography (IC) System.
An IonPac (AS19) anion column consisting of a quaternary
ammonium ion stationary phase with diameter and length
dimensions of 4 and 25 mm respectively was employed.
Sample runs used a concentration gradient of the eluent
KOH ranging from 2 to 20 mM. An optimized elution pro-
gram was written for each pH range measured (between 25–
60 min for each injection). Samples were injected using a
Dionex (AS40) automated sampler into a 25 µL loop for pre-
injection. The use of a loop rather than a concentrator was
important and ensured that the total HNCO /NCO− concen-
trations were being measured. The IC was calibrated using
matrix-matched standards of known HNCO /NCO− concen-
trations prepared from serial dilutions of KOCN (Sigma-
Aldrich, 96 % purity).
2.2.2 Hydrolysis kinetics experiments
The kinetics of the hydrolysis reactions in the pH range of 1–
2 are very fast; complete decays occurred in a matter of min-
utes. The decay of HNCO at these low pH values is therefore
too quick for the 25 min IC method to capture. To circum-
vent this issue we used a quenching method. Specifically, we
prepared an aqueous solution of 50 mL of sulphuric acid at
the desired pH. 5 mL of this acidic solution was subsequently
added to a 0.02 M solution of KOCN in eight different falcon
tubes to initiate the rapid hydrolysis reaction. Each reaction
was then quenched at different times by a 0.1 M aqueous so-
lution of KOH. Increasing the pH to more than 10 slowed
the hydrolysis kinetics by orders of magnitude and allowed
for subsequent IC measurements. Replacing sulphuric acid
by nitric acid and/or KOH by NaOH yielded identical hy-
drolysis rates and ensured the results were reproducible with
different acids and bases.
Buffer solutions in the pH range of 3–5 were prepared by
using appropriate molar ratios of citric acid and disodium
phosphate whereas buffer solutions in the pH range of 9–10
used sodium carbonate and sodium bicarbonate. All buffer
concentrations were< 0.002 M, and we assume that the ionic
strength of these solutions had minimal impact on the sol-
ubility of HNCO. For the room temperature set of kinetic
experiments, the experiment was initiated by the addition of
0.1 g of KOCN to 50 mL of the desired buffer solution. The
solution was further diluted by a factor of 500 and then split
into eight samples for analysis at succeeding intervals on the
anion IC.
Hydrolysis reactions were run at different temperatures to
assess the activation energies of each of the three hydrolysis
mechanisms. Room temperature reactions were conducted
inside the IC autosampler AS40 (with a cover) and moni-
tored by a temperature button (iButtons, Maxim Integrated,
San Jose, CA with 0.5 ◦C resolution). Colder temperature re-
Figure 2. (a) The concentration decay curves as a function of time
according to Eq. (4) for each flow rate shown; (b) the slopes of each
fit in (a) plotted as a function of the ratio of the flow rate to the
volume. The symbols in both figures represent the same flow rate
shown.
actions were done in a water ice bath and monitored by a
thermometer. Finally, warmer temperature reactions for high
pH samples were run in a temperature-controlled water bath.
These reactions took days to weeks to reach completion, and
so 5 mL samples from the reaction mixtures were taken out
of the water bath and measured on the IC at appropriate time
intervals.
3 Results and discussion
3.1 Henry’s Law coefficient KH
HNCO’s effective Henry’s Law solubility coefficientKeffH ex-
pressed in M atm−1 was determined based on the exponen-
tial decay of gaseous HNCO exiting a bubbler containing a
buffered solution. The observed decay of HNCO is caused
by its partitioning from the aqueous phase to the gas phase as
well as its competing hydrolysis reaction. Equation (3) rep-
resents the rate law for the disappearance of HNCO during
the experiment and Eq. (4) is the integrated rate law.
−d [HNCO]
dt= [HNCO]
ϕ
KeffH VRT
+ [HNCO]khyd (3)
ln[HNCO]t
[HNCO]0=−
[ϕ
KeffH VRT
+ khyd
]t, (4)
where [HNCO]t is the HNCO concentration at time t ,
[HNCO]0 is the initial HNCO concentration (at time t = 0),
[HNCO]t/ [HNCO]0 is the HNCO concentration in the gas
phase downstream of the bubbler measured by the CIMS, φ
is the volumetric flow rate (cm3 s−1), KeffH is the effective
Henry’s Law coefficient for solubility (mol L−1 atm−1), V is
the liquid volume of the buffer (cm3), R is the ideal gas con-
stant (8.21× 10⁻² L atm mol−1 K−1), T is the temperature
(K), khyd is HNCO’s overall rate of hydrolysis (s−1) and t is
the time (s). To extract the value ofKeffH from the experimen-
tal decay curves, we first plot the natural logarithm of change
Atmos. Chem. Phys., 16, 703–714, 2016 www.atmos-chem-phys.net/16/703/2016/
N. Borduas et al.: Solubility and reactivity of HNCO in water 707
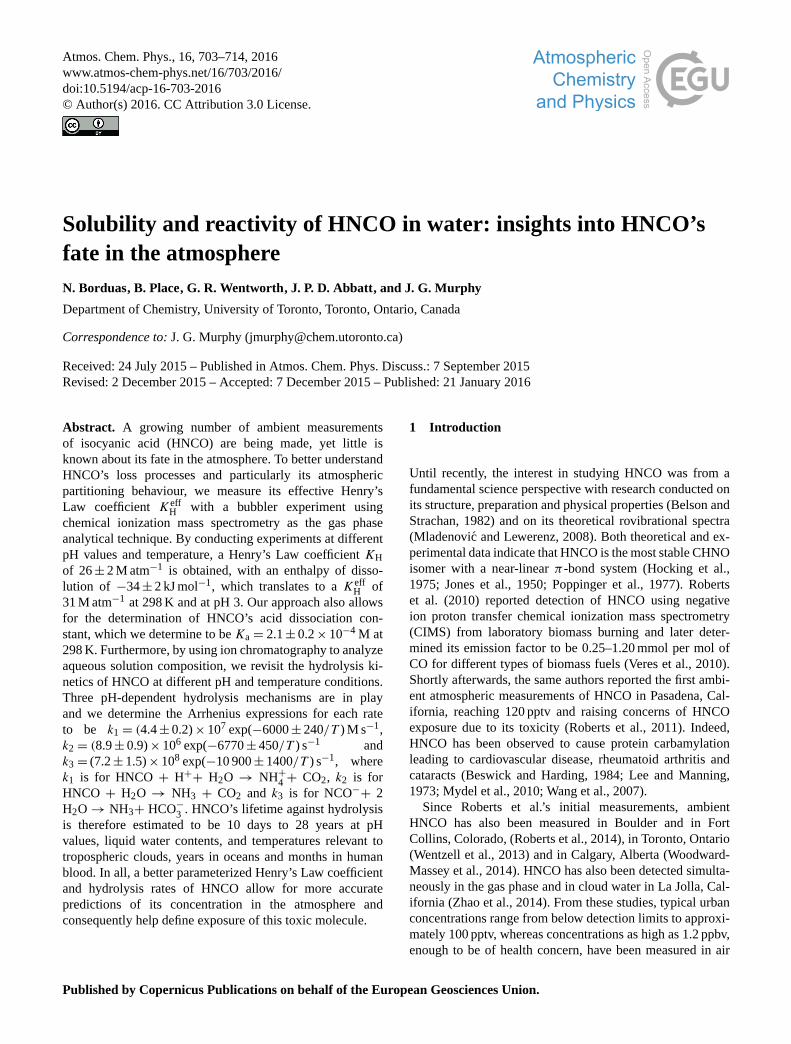
Figure 3. (a) The fit according to Eq. (2) of the experimental KeffH
values which allows for the determination of KH and Ka at 298 K.
(b) The experimental KeffH values as a function of pH at 298 K.
The black line is the modelled dependence of KeffH according to
Eq. (2) based on the determined value of KH and a value for Ka
of 2.1× 10⁻⁴ M. The inset shows the range of KeffH across the full
range of pH.
in HNCO concentration versus time for different flow rates
ranging from 175 to 800 sccm as shown in Fig. 2a. The slope
of each experiment is then plotted as function of the ratio of
the flow rate and volume depicted in Fig. 2b. The slope of
Fig. 2b leads to a value representing (KeffH RT)−1 and so Keff
H
can be calculated.
These dynamic experiments were repeated with a range of
buffer solutions ranging from pH 2.5 to 4.0 to determine the
pH-independent Henry’s Law coefficient,KH, of HNCO. Ex-
periments at temperatures of 273–298 K were also conducted
to determine HNCO’s enthalpy of dissolution, 1Hdiss.
3.1.1 pH dependence of KeffH
The pH dependence of the effective Henry’s Law coefficient
KeffH of a weak acid like HNCO depends on its pKa as well
as on the pH according to Eq. (2). Throughout our exper-
iments, we measure the value of KeffH and employ Eq. (2)
to plot KeffH as a function of the inverse of the proton con-
centration, [H+], and thus to extract HNCO’s Henry’s Law
coefficient for solubility, KH. Figure 3a depicts this linear
relationship and yields a value of 26± 2 M atm−1 for KH.
Our KH value compares well with the only other published
value of 21 M atm−1 determined solely at pH 3 (Roberts et
al., 2011). Figure 3b on the other hand shows experimen-
tally determinedKeffH at different pH values and at a constant
temperature of 298.0± 0.2 K. Error bars in both Fig. 3a and
b represent the percentage of the standard deviation of the
slope as in Fig. 2b. The slope in Fig. 3a also allows us to
determine HNCO’s acid dissociation constant, Ka, which at
298 K is 2.1± 0.2× 10⁻⁴ M. Our Ka value also agrees well
with previously reportedKa for HNCO (Amell, 1956; Belson
and Strachan, 1982).
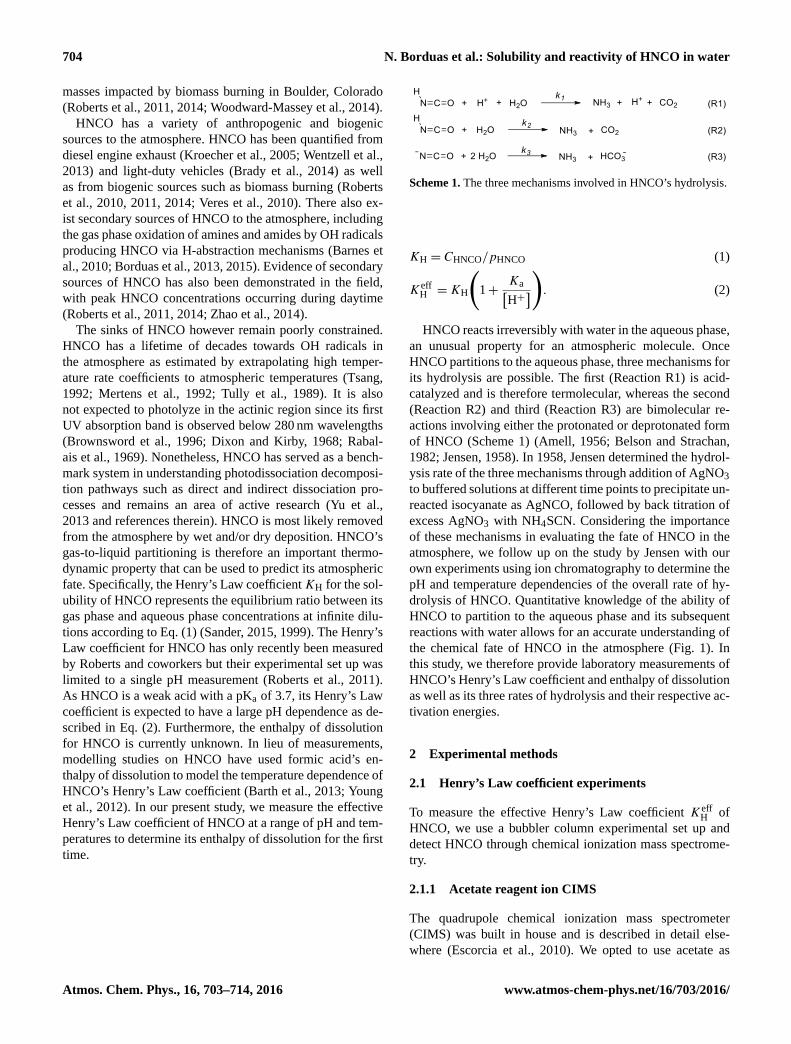
Figure 4. The temperature dependence of experimentally measured
KeffH at pH 3.08.
3.1.2 Temperature dependence
The temperature dependence of HNCO’s solubility was es-
tablished by running experiments at varying temperatures
from 273 to 298 K. Since KeffH is very sensitive to pH
changes, all experiments were conducted with a buffer solu-
tion from the same batch and same volumetric flask within
a few days. Plotting the natural logarithm of the effective
Henry’s Law coefficient as a function of the inverse of
temperature yields the ratio of the enthalpy of dissolution,
1Hdiss, to the gas constant, R (Fig. 4). We report a value
of −34± 2 kJ mol−1 for HNCO’s enthalpy of dissolution,
where the uncertainty stems from the deviation from the
slope depicted in Fig. 4. This value compares to similar weak
acids like HONO (−40 kJ mol−1) and HCN (−42 kJ mol−1),
but differs from the value of formic acid (−47 kJ mol−1)
which was the value assumed for HNCO in the Young et al.,
and the Barth et al., modelling studies (Barth et al., 2013;
Sander, 2015; Young et al., 2012).
3.2 Rate of hydrolysis khyd
There are three mechanisms by which HNCO can react with
water described in Scheme 1 Reaction (R1) to (R3) and de-
picted in Fig. 1. The disappearance of HNCO in the aqueous
phase can therefore be described by the rate law shown as
Eq. (5). The pH dependence of HNCO’s hydrolysis mani-
fests itself in the first term of Eq. (5) as the hydrogen ion
concentration as well as in the concentration of the dissoci-
ated and/or non-dissociated acid in each term.
−d [HNCO]t
dt=k1 [HNCO]
[H+]+ k2 [HNCO]
+ k3
[NCO−
]. (5)
To mathematically integrate this rate law, the concentra-
tion of HNCO needs to be expressed as the sum of undis-
www.atmos-chem-phys.net/16/703/2016/ Atmos. Chem. Phys., 16, 703–714, 2016

708 N. Borduas et al.: Solubility and reactivity of HNCO in water
sociated HNCO and of isocyanate ion NCO− in solution,
which is denoted in Eq. (6) as [HNCO]tot. HNCO’s acid dis-
sociation constantKa relates the concentration of HNCO and
NCO− as shown in Eq. (6). The Ka-dependant expression of
Eq. (6) is then substituted into the rate law of Eq. (5), and
subsequently integrated. The Ka value of HNCO has a slight
temperature dependence with a heat of dissociation previ-
ously measured to be 5.4 kJ mol−1, which for the tempera-
ture range of 273 to 298 K represents a 25 % change (Amell,
1956). We therefore use Amell’s heat of dissociation value
throughout our analysis to account for Ka’s temperature de-
pendence in the van’t Hoff equation. Furthermore, Belson et
al.’s evaluation of the Ka of HNCO literature recommends
2.0× 10⁻⁴ M at 298 K (Belson and Strachan, 1982). Finally,
our own work on the pH dependence of Henry’s Law coef-
ficient of HNCO, suggests a Ka value of 2.1± 0.2× 10⁻⁴ M
at 298 K, consistent with the recommended value (Fig. 3a).
[HNCO]=[HNCO]tot−[NCO−
]=
[H+][
NCO−]
Ka
=
[HNCO]tot[H+]
Ka+ [H+]. (6)
By integrating Eq. (5) with the appropriate substitutions,
the resulting expression is Eq. (7), where khyd represents the
observed first-order rate loss of hydrolysis of HNCO and de-
pends on the individual reaction rates k1, k2 and k3 according
to Eq. (8).
[HNCO]t
[HNCO]0= e−khydt (7)
khyd =k1[H
+]2+ k2
[H+]+ k3Ka
Ka+ [H+]. (8)
The aim of our hydrolysis experiments is to measure khyd
at different pH values to subsequently solve for the values of
the individual hydrolysis rate coefficients k1, k2 and k3. To
measure khyd, we employ ion chromatography (IC) which al-
lows for quantitative measurement of the total isocyanic acid
in solution as NCO− using an anion chromatography col-
umn. The key to making [HNCO]tot measurements was to
use a loop injection port for the IC instead of a concentrator
column, since the latter retains only ions and would not mea-
sure any protonated HNCO in solution. Appropriate buffer
solutions were made to conduct experiments over a range of
pH values from 1.7 to 10.4. The decay of [HNCO]tot was
monitored by IC over time and plotting the natural logarithm
of the decay as a function of time as in Fig. 5 yields the khyd
specific to that temperature and pH. Hydrolysis experiments
are listed in Table A1 in Appendix A.
3.2.1 Determining k1 and k2
At a pH below 3, the third hydrolysis mechanism (Scheme
1 (Reaction R3)) will contribute minimally to the overall
khyd. Indeed, the third term in Eq. (8), k3Ka/(Ka+ [H+])
Figure 5. Example of a hydrolysis experiment at pH 5.4 and at
25 ◦C where the [HNCO]tot is measured by loop injections on the
IC.
will become very small because [H+] �Ka. Furthermore,
very little of the HNCO is present as NCO− at low pH.
This assumption (which we verify retroactively) simplifies
the khyd expression to Eq. (9) with only two unknowns, k1
and k2. We can now solve for k1 and k2 from two khyd
values derived from experiments conducted at two differ-
ent pH values but at the same temperature. For example,
solving for k1 and k2 at 295 K using the khyd in Table A1,
we obtain a value of (6.73± 0.27)× 10−2 M s−1 for k1 and
of (1.04± 0.04)× 10−3 s−1 for k2. We do this calculation
once per temperature. The uncertainties associated with these
measurements come from the slope of decay of aqueous
phase HNCO measured by IC.
khyd@pH<2.7 =k1[H
+]2+ k2
[H+]
Ka+ [H+]. (9)
3.2.2 Temperature dependence of k1 and k2
Hydrolysis experiments of HNCO at three different temper-
atures further enables us to solve for the temperature depen-
dence of k1 and k2. We chose three temperatures relevant to
tropospheric air masses: 270, 283 and 295 K. Figure 6 repre-
sents the slope of the natural logarithm of the rate coefficient
of hydrolysis as a function of the inverse of the temperature
which according to the Arrhenius equation shown in Eq. (10)
yields the activation energy specific to each hydrolysis mech-
anism. We obtain activation energies of 50± 2 kJ mol−1 and
56± 4 kJ mol−1 for k1 and k2 respectively. Furthermore, the
y-intercept of these linear plots yields the value of ln(A)
in Eq. (10) and so the A factors of each hydrolysis mech-
anism can also be obtained, providing Arrhenius expres-
sions of k1 = (4.4± 0.2)× 107 exp(−6000± 240/T ) M s−1
and k2 = (8.9± 0.9)× 106 exp(−6770± 450/T ) s−1. The
uncertainties stem from the fit to the data points in Fig. 6 (and
their error bars come from the slope of the decay of aqueous
Atmos. Chem. Phys., 16, 703–714, 2016 www.atmos-chem-phys.net/16/703/2016/

N. Borduas et al.: Solubility and reactivity of HNCO in water 709
Figure 6. The linear plots of the natural logarithm of each hydrol-
ysis rate coefficient k1, k2 and k3 as a function of the inverse of
temperature to yield the activation energies of each mechanism.
phase HNCO measured by IC).
k = Ae−Ea/RT (10)
3.2.3 Determining k3 and its temperature dependence
At high pH levels, the third hydrolysis mechanism (Scheme
1 (Reaction R3)) will dominate the observed khyd, however,
the first two mechanisms may still have a non-negligible con-
tribution to khyd and can therefore not be disregarded. We can
solve for k3, knowing k1 and k2 and their respective temper-
ature dependencies, using Eq. (8). The khyd values measured
at pH above 9 and at 40 ◦C are used (Table A1), and k3 is
determined for each pH. The average of our three measure-
ments at 40 ◦C is (5.77± 0.35)× 10−7 s−1. The temperature
dependence of k3 is determined in an analogous way to k1
and k2 and is also depicted in Fig. 6. We obtain a value of
91± 12 kJ mol−1 which translates to an Arrhenius expres-
sion of k3 = (7.2± 1.5)× 108 exp(−10 900± 1400/T ) s−1.
Equipped with the values of k1, k2 and k3 and their tem-
perature dependencies, a map of the expected total hydrolysis
rate, khyd, as a function of temperature and pH can be gen-
erated using Eqs. (8) and (10) and is plotted as Fig. 7. For
reference, the colour scale of Fig. 7 also reads in hydrolysis
lifetime of HNCO in hours. It is clear that HNCO’s lifetime
in the aqueous phase has a large temperature and pH depen-
dence.
3.2.4 Comparing the rate of hydrolysis khyd through
different methods
The individual rate coefficients of the three hydrolysis mech-
anisms (Scheme 1, Reactions R1 to R3) have only been eval-
uated one other time in the literature (Jensen 1958). Our IC
experimental method differs substantially from Jensen’s back
titration method, and yet we obtain similar values for k1, k2
and k3 as well as for their respective activation energies. The
values are summarized in Table 1. Again, the colour scale of
Fig. 7 is generated from Eq. (8) using our obtained values for
k1, k2 and k3 and for Ea1, Ea2 and Ea3, and we superimpose
all our khyd measurements from Table A1 as circles. We fur-
ther add Jensen’s published raw data for comparison (Jensen,
1958) as triangles. The agreement is good and is consistently
within the same order of magnitude (Fig. 7).
In addition, our Henry’s Law coefficient experiment pro-
vides a complimentary way to determine khyd at different
temperatures and pH values. Indeed, the intercept of the line
which fit the data of dln(Ct/C0)/ dt vs. ϕ/V yields khyd, rep-
resenting the value for the loss process in the solution of the
bubbler column experiment (an example is given in Fig. 2b).
We show these values as squares in Fig. 7. Roberts et al., also
determined khyd through this method at pH 3 and at 25 ◦C
and this value is appended to Fig. 7 (Roberts et al., 2011) as
a diamond. The agreement is good from all four cases. We
can conclude that the lifetime of HNCO against hydrolysis
in dilute aqueous solutions spans seconds to years depending
on pH and temperature. The lifetime of HNCO against hy-
drolysis in cloud water of pH 3–6 will be shorter and range
from 10 h to∼ 20 days in the troposphere. On the other hand,
HNCO’s hydrolysis in ocean waters of pH∼ 8.1 and temper-
atures below 30 ◦C will be very slow, translating to a life-
time of 1–2 years if we assume no other reactive chemistry is
taking place. Finally, in the context of exposure, if HNCO is
present in human blood at physiological pH and temperature,
its lifetime to hydrolysis will be as high as several months.
On the other hand, if HNCO is present in the stomach, which
is more acidic, we would expect its lifetime to drop to min-
utes or hours.
4 Atmospheric implications
HNCO is a toxic molecule and can cause cardiovascu-
lar and cataract problems through protein carbamylation
(Beswick and Harding, 1984; Mydel et al., 2010; Wang et al.,
2007). Recently reported ambient measurements of HNCO
in North America raise concerns of exposure particularly
from biomass burning, diesel and gasoline exhaust and ur-
ban environments (Brady et al., 2014; Roberts et al., 2011,
2014; Wentzell et al., 2013; Woodward-Massey et al., 2014;
Zhao et al., 2014). With the values for HNCO’s Henry’s Law
coefficient and hydrolysis rates reported here, a better un-
derstanding of HNCO’s removal rate from the atmosphere
www.atmos-chem-phys.net/16/703/2016/ Atmos. Chem. Phys., 16, 703–714, 2016

710 N. Borduas et al.: Solubility and reactivity of HNCO in water
Table 1. HNCO’s Henry’s Law coefficient, acid dissociation constant and hydrolysis constants.
Physical parameter Value Energy Reference
Henry’s Law coefficient, KH 26± 2 M atm−1 1Hdiss =−34± 2 kJ mol−1 This work
21 M atm−1 – Roberts et al. (2011)
Acid dissociation constant, K∗a 2.1± 0.2× 10⁻⁴ M – This work
2.0× 10⁻⁴ M 1Hdiss =−5.4 kJ mol−1 Amell (1956)
Hydrolysis rate coefficient, k∗1
7.6± 0.3× 10⁻² s−1 Ea1 =+ 50± 2 kJ mol−1 This work
1.1× 10⁻¹ s−1 Ea1 =+ 63 kJ mol−1 Jensen (1958)
Hydrolysis rate coefficient, k∗2
1.4± 0.1× 10⁻³ s−1 Ea2 =+ 56± 4 kJ mol−1 This work
1.8× 10⁻³ s−1 Ea2 =+ 83 kJ mol−1 Jensen (1958)
Hydrolysis rate coefficient, k∗3
8.1± 1.7× 10⁻⁸ s−1 Ea3 =+ 91± 12 kJ mol−1 This work
1.2× 10⁻⁸ s−1 Ea3 =+ 100 kJ mol−1 Jensen (1958)
* at 298 K
Figure 7. khyd as function of temperature and pH generated from
Eq. (8) using our obtained values for k1, k2 and k3 and for Ea1, Ea2
and Ea3. All available khyd measurements for HNCO in the litera-
ture and from this work are superimposed and colour coded appro-
priately. As a guide, the colour scale also represents the lifetime in
hours for HNCO in dilute aqueous solutions.
can be determined, and hence HNCO’s atmospheric lifetime
can be estimated. Note however that our HNCO lifetime esti-
mates do not consider dry deposition and therefore represent
a higher limit, particularly since Young et al., found that dry
deposition can be significant for HNCO (Young et al., 2012).
Specifically, the lifetime of HNCO in the atmosphere will
depend on its partitioning to the aqueous phaseKeffH , the tem-
perature T , the pH and liquid water content (LWC) of the
aerosol and/or droplet and finally the hydrolysis of HNCO
khyd once in solution. We can calculate HNCO’s lifetime
against hydrolysis based on Eq. (11), where τ is the life-
time in seconds, L is the fraction of air volume occupied by
liquid water (dimensionless) and R is the gas constant. Fig-
ure 8a and b depict outputs of Eq. (11) with different fixed
variables. Figure 8a holds the LWC to 1 g m−3, a value rep-
resentative of cloud water, highlighting the dependence of
HNCO’s lifetime on temperature and pH (Ip et al., 2009).
Figure 8. (a) The lifetime of HNCO in days as a function of tem-
perature and pH at 1 g m−3 of LWC and (b) the lifetime of HNCO
in days as a function of temperature and LWC at pH 4.
At atmospherically relevant pH of 2 to 6 and at temperatures
below 30 ◦C, HNCO has a lifetime on the order of 10 days
to hundreds of years. Alternatively, Fig. 8b holds the pH at
4 and varies the LWC on the x axis. Water concentrations
relevant to wet aerosol (1–100 µg m−3) are too small to act
as a significant sink for gas phase HNCO. However, Fig. 8b
highlights the strong dependence of HNCO lifetime on LWC
in clouds, again ranging from days to hundreds of years. It
therefore appears that if HNCO is incorporated into cloud
water, it is more likely to be rained out or revolatilized than to
hydrolyze given typical times in clouds of minutes to hours.
There is also the possibility that HNCO has other currently
unknown sinks in cloud water that may be competitive with
its hydrolysis and further work on HNCO’s aqueous phase
chemistry with nucleophiles such as amines and alcohols is
currently underway in our laboratories. Finally, HNCO will
partition readily in oceans at pH∼ 8, but will take years to
hydrolyze.
τ = 1/KeffH RTLkhyd. (11)
Atmos. Chem. Phys., 16, 703–714, 2016 www.atmos-chem-phys.net/16/703/2016/
N. Borduas et al.: Solubility and reactivity of HNCO in water 711
Zhao et al. (2014) observed higher concentrations of
HNCO in the cloud water in La Jolla, California than pre-
dicted by its Henry’s Law coefficient at 298 K (Zhao et al.,
2014). This observation remains puzzling but may point to-
wards sources of HNCO within cloud water other than sim-
ple partitioning chemistry. The Barth et al. (2013) modelling
study concluded that fog, low-level stratus clouds or stratocu-
mulus clouds were the most efficient cloud conditions at re-
moving HNCO from the gas phase, particularly in polluted
scenarios where the cloud water was more acidic. The au-
thors highlighted the high dependence of HNCO’s fate on
liquid water pH and temperature, consistent with our find-
ings (Barth et al., 2013). The Young et al., 2012 study, which
modelled global HNCO budgets, assumed the aqueous loss
of the weak acid occurred only when the cloud liquid wa-
ter content was greater than 1 mg m−3. Based on Fig. 8b,
1 mg m−3 is low for HNCO to significantly partition into
the aqueous phase and rather requires water mass concen-
trations 1000 times greater for HNCO’s lifetime to drop to
days. The model may have overestimated the ability for LWC
to act as a sink for HNCO. HNCO may be a longer lived
species than previously thought and exposure of this toxic
molecule may pose a threat to regions with HNCO point
sources like biomass burning and engine exhaust, as pointed
out by Young et al. (2012) and Barth et al. (2013).
5 Conclusions
In summary, we provide laboratory measurements of
HNCO’s important thermochemical properties related to its
behavior in water. We measured its Henry’s Law coefficient
using a bubbler column experiment to be 26± 2 M atm−1
with an enthalpy of dissolution of −34± 2 kJ mol−1.
Using ion chromatography, we determined the Arrhe-
nius expression of HNCO’s three hydrolysis mecha-
nisms: k1 = (4.4± 0.2)× 107 exp(−6000± 240/T ) M s−1,
k2 = (8.9± 0.9)× 106 exp(−6770± 450/T ) s−1 and k3 =
(7.2± 1.5)× 108 exp(−10 900± 1400/T ) s−1. These values
will provide better constrains on the sinks and thus lifetime
of HNCO in the atmosphere with the aim of minimizing ex-
posure of this toxic molecule.
www.atmos-chem-phys.net/16/703/2016/ Atmos. Chem. Phys., 16, 703–714, 2016

712 N. Borduas et al.: Solubility and reactivity of HNCO in water
Appendix A
Table A1. Compilation of khyd experiments at different pH and temperatures.
pH T (K) khyd (S−1)
1.75 270 (8.30± 0.64)× 10−4
1.75 295 (2.22± 0.06)× 10−3
1.81 283 (1.17± 0.06)× 10−3
2.23 270 (1.92± 0.16)× 10−4
2.23 295 (1.39± 0.02)× 10−3
2.26 283 (5.13± 0.28)× 10−4
2.30 295 (1.09± 0.04)× 10−3
3.40 297 (9.90± 0.25)× 10−4
3.91 296 (3.74± 0.03)× 10−4
4.27 296 (2.99± 0.02)× 10−4
5.00 296 (6.55± 0.21)× 10−5
5.40 298 (2.10± 0.05)× 10−5
9.26 313 (5.39± 0.26)× 10−7
9.46 313 (6.07± 0.28)× 10−7
10.20 313 (6.03± 0.33)× 10−7
10.36 333 (4.84± 0.09)× 10−6
10.37 325 (1.70± 0.09)× 10−6
Atmos. Chem. Phys., 16, 703–714, 2016 www.atmos-chem-phys.net/16/703/2016/

N. Borduas et al.: Solubility and reactivity of HNCO in water 713
Author contributions. N. Borduas designed the experimental ap-
proach with critical input from J. P. D. Abbatt and J. G. Murphy
on the mass spectrometry method and from J. G. Murphy and G.
R. Wentworth on the ion chromatography method. N. Borduas un-
dertook the Henry’s Law experiments and B. Place conducted the
HNCO hydrolysis experiments. N. Borduas analyzed the data from
both sets of experiments and N. Borduas wrote the manuscript with
feedback from all co-authors.
Acknowledgements. The authors acknowledge Erin Evoy for early
work on the IC as well as Jim Roberts for help with interpreting
Jensen’s data. N. Borduas acknowledges funding from the Uni-
versity of Toronto Adel Sedra Graduate Fellowship. Operational
support has been provided by a grant from Environment Canada.
The authors also acknowledge funding from CFI and NSERC
Discovery.
Edited by: A. Laskin
References
Amell, A. R.: Kinetics of the hydrolysis of cyanic acid, J. Am.
Chem. Soc., 78, 6234–6238, 1956.
Barnes, I., Solignac, G., Mellouki, A., and Becker, K. H.: Aspects
of the atmospheric chemistry of amides, Chem. Phys. Chem., 11,
3844–3857, 2010.
Barth, M. C., Cochran, A. K., Fiddler, M. N., Roberts, J. M., and
Bililign, S.: Numerical modeling of cloud chemistry effects on
isocyanic acid (HNCO), J. Geophys. Res. Atmos., 118, 8688–
8701, 2013.
Belson, D. J. and Strachan, A. N.: Preparation and prop-
erties of isocyanic acid, Chem. Soc. Rev., 11, 41–56,
doi:10.1002/jgrd.50661, 1982.
Beswick, H. T. and Harding, J. J.: Conformational changes induced
in bovine lens a-crystallin by carbamylation, Biochem. J., 223,
221–227, 1984.
Borduas, N., Abbatt, J. P. D. and Murphy, J. G.: Gas phase oxidation
of monoethanolamine (MEA) with OH radical and ozone: kinet-
ics, products, and particles, Environ. Sci. Technol., 47, 6377–
6383, 2013.
Borduas, N., da Silva, G., Murphy, J. G., and Abbatt, J. P. D.: Exper-
imental and theoretical understanding of the gas phase oxidation
of atmospheric amides with OH radicals: kinetics, products, and
mechanisms, J. Phys. Chem. A, 119, 4298–4308, 2015.
Brady, J. M., Crisp, T. A., Collier, S., Kuwayama, T., Forestieri, S.
D., Perraud, V., Zhang, Q., Kleeman, M. J., Cappa, C. D., and
Bertram, T. H.: Real-time emission factor measurements of iso-
cyanic acid from light duty gasoline vehicles, Environ. Sci. Tech-
nol., 48, 11405–11412, 2014.
Brownsword, R. A., Laurent, T., Vatsa, R. K., Volpp, H., and
Wolfrum, J.: Photodissociation dynamics of HNCO at 248 nm,
Chem. Phys. Lett., 258, 164–170, 1996.
Dixon, R. N. and Kirby, G. H.: Ultra-violet absorption spectrum of
isocyanic acid, Trans. Faraday Soc., 64, 2002–2012, 1968.
Escorcia, E. N., Sjostedt, S. J. and Abbatt, J. P. D.: Kinetics of N2O5
hydrolysis on secondary organic aerosol and mixed ammonium
bisulfate secondary organic aerosol particles, J. Phys. Chem. A,
114, 13113–13121, 2010.
Hocking, W. H., Gerry, M. C. L. and Winnewisser, G.: The Mi-
crowave and Millimetre Wave Spectrum, Molecular Constants,
Dipole Moment, and Structure of Isocyanic Acid, HNCO, Can.
J. Phys., 53, 1869–1901, 1975.
Ip, H. S. S., Huang, X. H. H. and Yu, J. Z.: Effective Henry’s law
constants of glyoxal, glyoxylic acid, and glycolic acid, Geophys.
Res. Lett., 36, L01802, doi:10.1029/2008GL036212, 2009.
Jensen, M. B.: On the kinetics of the decomposition of cyanic acid,
Acta Chem. Scand., 12, 1657-1670, 1958.
Jones, L. H., Shoolery, J. N., Shulman, R. G., and Yost, D.
M.: The molecular structure of isocyanic acid from microwave
and infra-red absorption spectra, J. Chem. Phys., 18, 990–991,
doi:10.1063/1.1747827, 1950.
Kames, J. and Schurath, U.: Henry’s law and hydrolysis-rate con-
stants for peroxyacyl nitrates (PANs) using a homogeneous gas-
phase source, J. Atmos. Chem., 21, 151–164, 1995.
Kroecher, O., Elsener, M., and Koebel, M.: An ammonia and iso-
cyanic acid measuring method for soot containing exhaust gases,
Anal. Chim. Acta, 537, 393–400, 2005.
Lee, C. K. and Manning, J. M.: Kinetics of the carbamylation of
the amino groups of sickle cell hemoglobin by cyanate, J. Biol.
Chem., 248, 5861–5865, 1973.
Mertens, J. D., Chang, A. Y., Hanson, R. K., and Bowman, C. T.:
A shock tube study of reactions of atomic oxygen with isocyanic
acid, Int. J. Chem. Kinet., 24, 279–295, 1992.
Mladenovic, M. and Lewerenz, M.: Equilibrium structure and en-
ergetics of CHNO isomers: steps towards ab initio rovibrational
spectra of quasi-linear molecules, Chem. Phys., 343, 129–140,
2008.
Mydel, P., Wang, Z., Brisslert, M., Hellvard, A., Dahlberg, L. E.,
Hazen, S. L., and Bokarewa, M.: Carbamylation-dependent ac-
tivation of T cells: A novel mechanism in the pathogenesis of
autoimmune arthritis, J. Immunol., 184, 6882–6890, 2010.
Poppinger, D., Radom, L., and Pople, J. A.: A theoretical study of
the CHNO isomers, J. Am. Chem. Soc., 99, 7806–7816, 1977.
Rabalais, J. W., McDonald, J. R., and McGlynn, S. P.: Elec-
tronic states of HNCO, cyanate salts, and organic iso-
cyanates. II. Absorption studies, J. Chem. Phys., 51, 5103–5111,
doi:10.1063/1.1671908, 1969.
Roberts, J. M.: Measurement of the Henry’s law coefficient and
first order loss rate of PAN in n-octanol, Geophys. Res. Lett.,
32, L08803, doi:10.1029/2004GL022327, 2005.
Roberts, J. M., Veres, P., Warneke, C., Neuman, J. A., Washen-
felder, R. A., Brown, S. S., Baasandorj, M., Burkholder, J. B.,
Burling, I. R., Johnson, T. J., Yokelson, R. J., and de Gouw, J.:
Measurement of HONO, HNCO, and other inorganic acids by
negative-ion proton-transfer chemical-ionization mass spectrom-
etry (NI-PT-CIMS): application to biomass burning emissions,
Atmos. Meas. Tech., 3, 981–990, doi:10.5194/amt-3-981-2010,
2010.
Roberts, J. M., Veres, P. R., Cochran, A. K., Warneke, C., Burling, I.
R., Yokelson, R. J., Lerner, B., Gilman, J. B., Kuster, W. C., Fall,
R., and de Gouw, J.: Isocyanic acid in the atmosphere and its pos-
sible link to smoke-related health effects, Proc. Natl. Acad. Sci.
USA, 108, 8966–8971, doi:10.1073/pnas.1103352108, 2011.
Roberts, J. M., Veres, P. R., VandenBoer, T. C., Warneke, C.,
Graus, M., Williams, E. J., Lefer, B., Brock, C. A., Bahreini,
www.atmos-chem-phys.net/16/703/2016/ Atmos. Chem. Phys., 16, 703–714, 2016

714 N. Borduas et al.: Solubility and reactivity of HNCO in water
R., Öztürk, F., Middlebrook, A. M., Wagner, N. L., Dubé, W.
P., and de Gouw, J. A.: New insights into atmospheric sources
and sinks of isocyanic acid, HNCO, from recent urban and re-
gional observations, J. Geophys. Res. Atmos., 2013JD019931,
doi:10.1002/2013JD019931, 2014.
Sander, R.: Modeling atmospheric chemistry: interactions between
gas-phase species and liquid cloud/aerosol particles, Surv. Geo-
phys., 20, 1–31, 1999.
Sander, R.: Compilation of Henry’s law constants (version 4.0)
for water as solvent, Atmos. Chem. Phys., 15, 4399–4981,
doi:10.5194/acp-15-4399-2015, 2015.
Tsang, W.: Chemical kinetic data base for propellant combustion.
II. Reactions involving CN, NCO, and HNCO, J. Phys. Chem.
Ref. Data, 21, 753–791, doi:10.1063/1.555914, 1992.
Tully, F. P., Perry, R. A., Thorne, L. R., and Allendorf, M. D.:
Free-radical oxidation of isocyanic acid, Symp. Int. Combust.,
22, 1101–1106, 1989.
Veres, P., Roberts, J. M., Warneke, C., Welsh-Bon, D., Zahniser, M.,
Herndon, S., Fall, R., and de Gouw, J.: Development of negative-
ion proton-transfer chemical-ionization mass spectrometry (NI-
PT-CIMS) for the measurement of gas-phase organic acids in the
atmosphere, Int. J. Mass Spectrom., 274, 48–55, 2008.
Veres, P., Roberts, J. M., Burling, I. R., Warneke, C., de Gouw, J.,
and Yokelson, R. J.: Measurements of gas-phase inorganic and
organic acids from biomass fires by negative-ion proton-transfer
chemical-ionization mass spectrometry, J. Geophys. Res., 115,
D23302, doi:10.1029/2011JD017393, 2010.
Wang, Z., Nicholls, S. J., Rodriguez, E. R., Kummu, O., Horkko, S.,
Barnard, J., Reynolds, W. F., Topol, E. J., DiDonato, J. A., and
Hazen, S. L.: Protein carbamylation links inflammation, smok-
ing, uremia and atherogenesis, Nat. Med., 13, 1176–1184, 2007.
Wentzell, J. J. B., Liggio, J., Li, S., Vlasenko, A., Staebler, R., Lu,
G., Poitras, M., Chan, T., and Brook, J. R.: Measurements of gas
phase acids in diesel exhaust: a relevant source of HNCO?, Env-
iron. Sci. Technol., 47, 7663–7671, 2013.
Woodward-Massey, R., Taha, Y. M., Moussa, S. G., and Osthoff, H.
D.: Comparison of negative-ion proton-transfer with iodide ion
chemical ionization mass spectrometry for quantification of iso-
cyanic acid in ambient air, Atmos. Environ., 98, 693–703, 2014.
Young, P. J., Emmons, L. K., Roberts, J. M., Lamarque, J., Wied-
inmyer, C., Veres, P. and VandenBoer, T. C.: Isocyanic acid in a
global chemistry transport model: tropospheric distribution, bud-
get, and identification of regions with potential health impacts, J.
Geophys. Res., 117, D10308, doi:10.1029/2010JD014033, 2012.
Yu, S., Su, S., Dorenkamp, Y., Wodtke, A. M., Dai, D., Yuan, K.,
and Yang, X.: Competition between direct and indirect dissocia-
tion pathways in ultraviolet photodissociation of HNCO, J. Phys.
Chem. A, 117, 11673–11678, 2013.
Zhao, R., Lee, A. K. Y., Wentzell, J. J. B., Mcdonald, A. M., Toom-
Sauntry, D., Leaitch, W. R., Modini, R. L., Corrigan, A. L.,
Russell, L. M., Noone, K. J., Schroder, J. C., Bertram, A. K.,
Hawkins, L. N., Abbatt, J. P. D., and Liggio, J.: Cloud partition-
ing of isocyanic acid (HNCO) and evidence of secondary source
of HNCO in ambient air, Geophys. Res. Lett., 41, 6962–6969,
2014.
Atmos. Chem. Phys., 16, 703–714, 2016 www.atmos-chem-phys.net/16/703/2016/