solow’s growth model. solow’s economic growth model ‘the’ representative neo-classical...
TRANSCRIPT
Solow’s Growth Model
Solow’s Economic Growth Model
‘The’ representative Neo-Classical Growth Model: focusing on savings and investment.
It explains the long-run evolution of
economy quite well with all being held
Constant – Dynamic Model
Features
Focusing on capacity of Savings
to meet the demand for Investment
as Capital Requirements
and, beyond that, as Capital Accumulation for expansion of Production capacity;
Convergence is usual but possibility
of Technical Innovation for Sustained Economic Growth
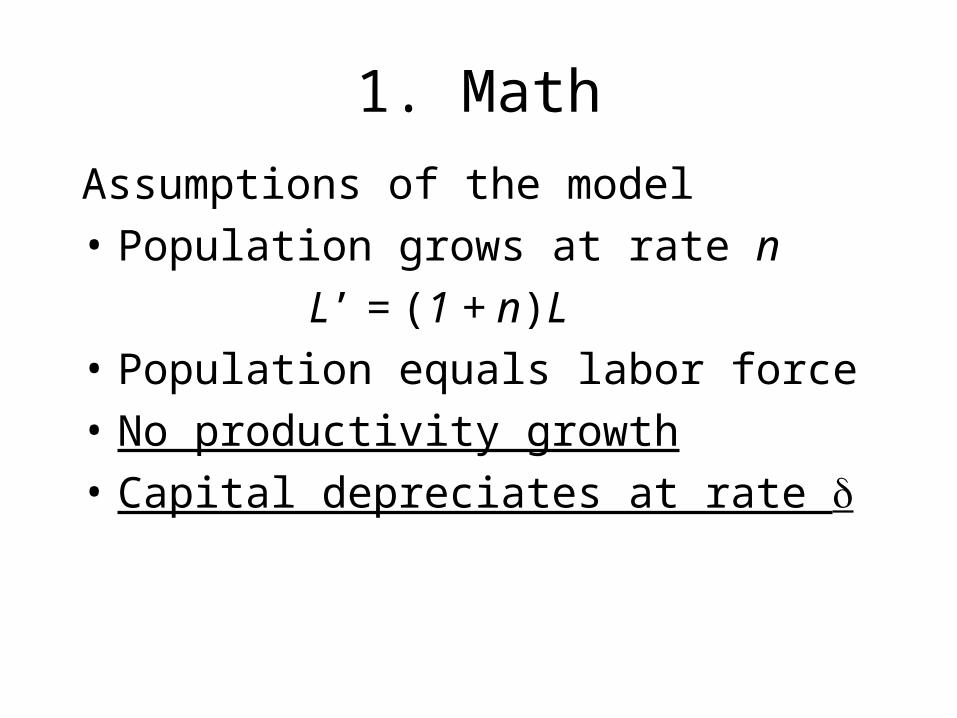
Assumptions of the model
• Population grows at rate n
L’ = (1 + n)L
• Population equals labor force
• No productivity growth
• Capital depreciates at rate
1. Math
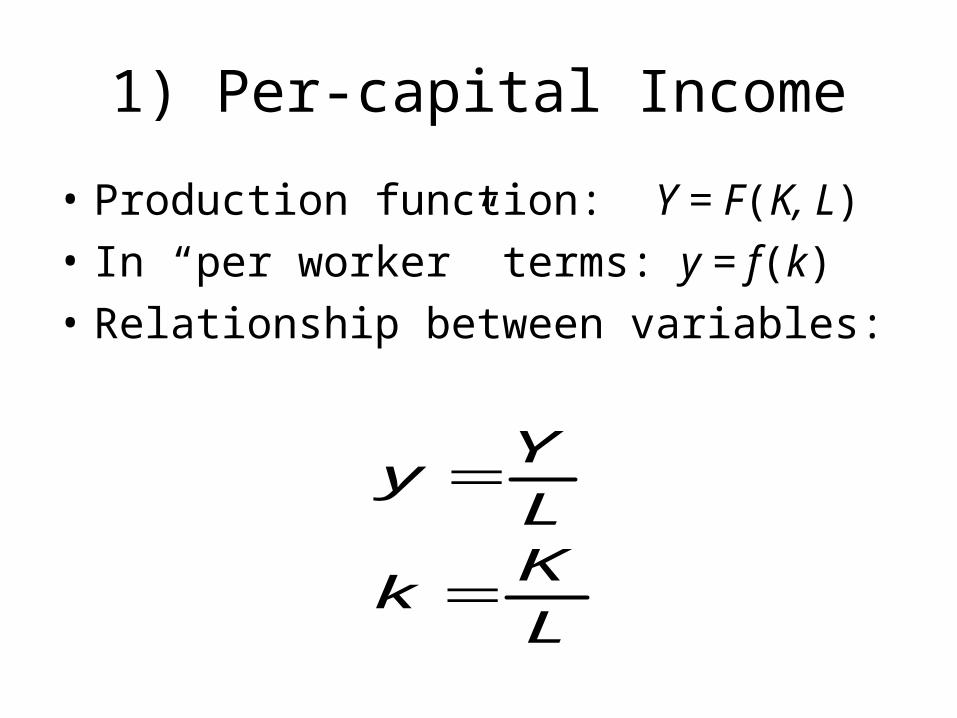
1) Per-capital Income
• Production function: Y = F(K, L)
• In “per worker” terms: y = f(k)
• Relationship between variables:
L
Kk
L
Yy

From the above we can get:
• Per-person or per-capita income level (y) depends on each worker’s capital equipment(k).
• y=f(k) shows DMR.
Can you draw the graph with y and k?
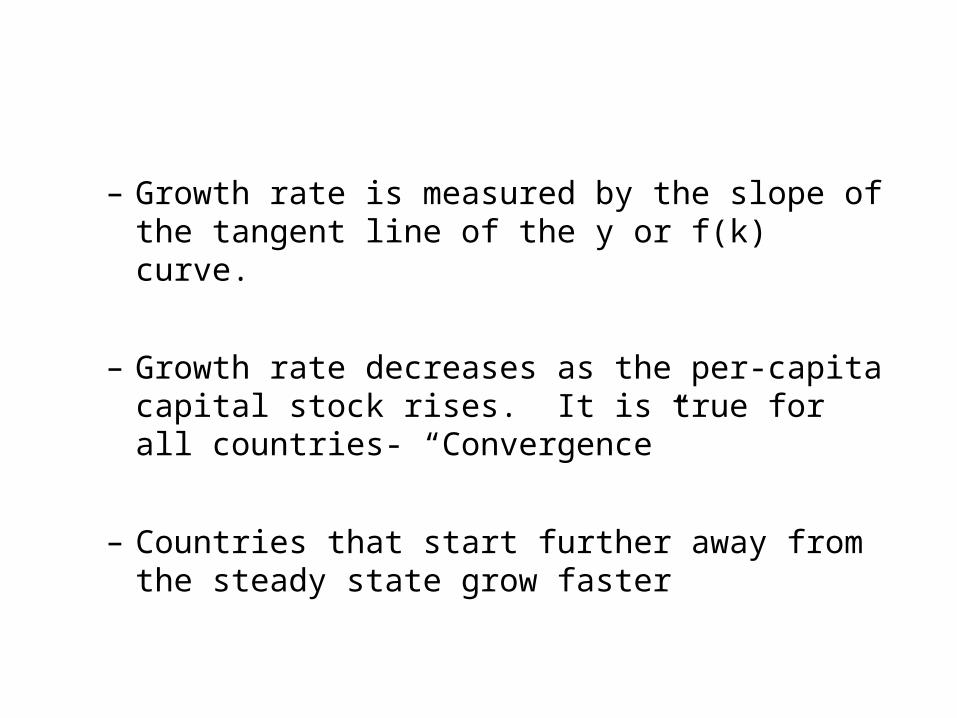
– Growth rate is measured by the slope of the tangent line of the y or f(k) curve.
– Growth rate decreases as the per-capita capital stock rises. It is true for all countries- “Convergence”
– Countries that start further away from the steady state grow faster
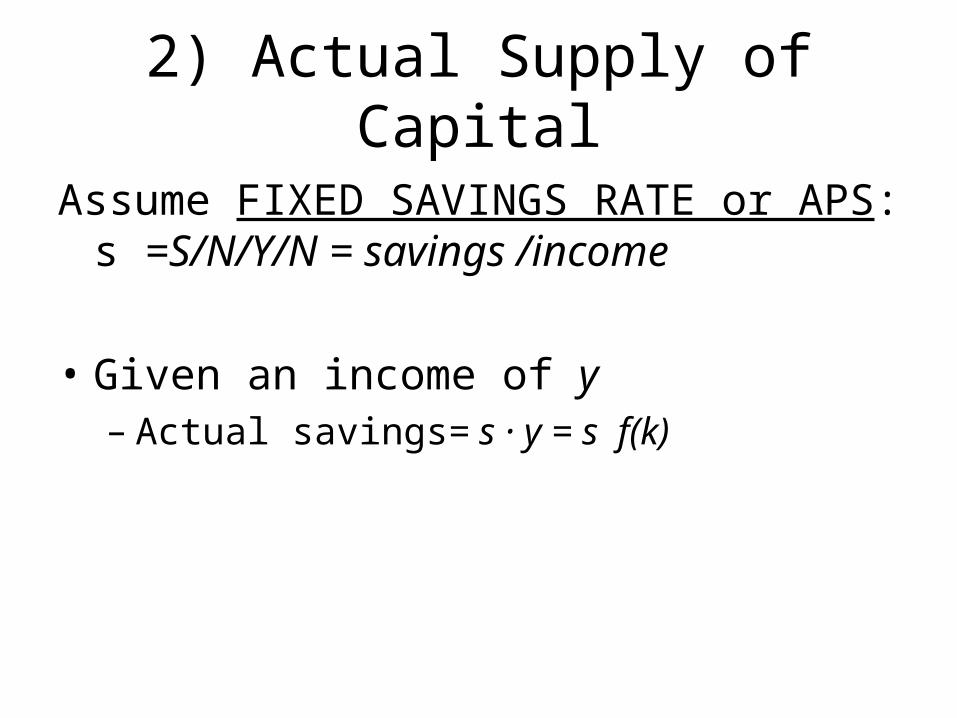
2) Actual Supply of Capital
Assume FIXED SAVINGS RATE or APS: s =S/N/Y/N = savings /income
• Given an income of y– Actual savings= s · y = s f(k)
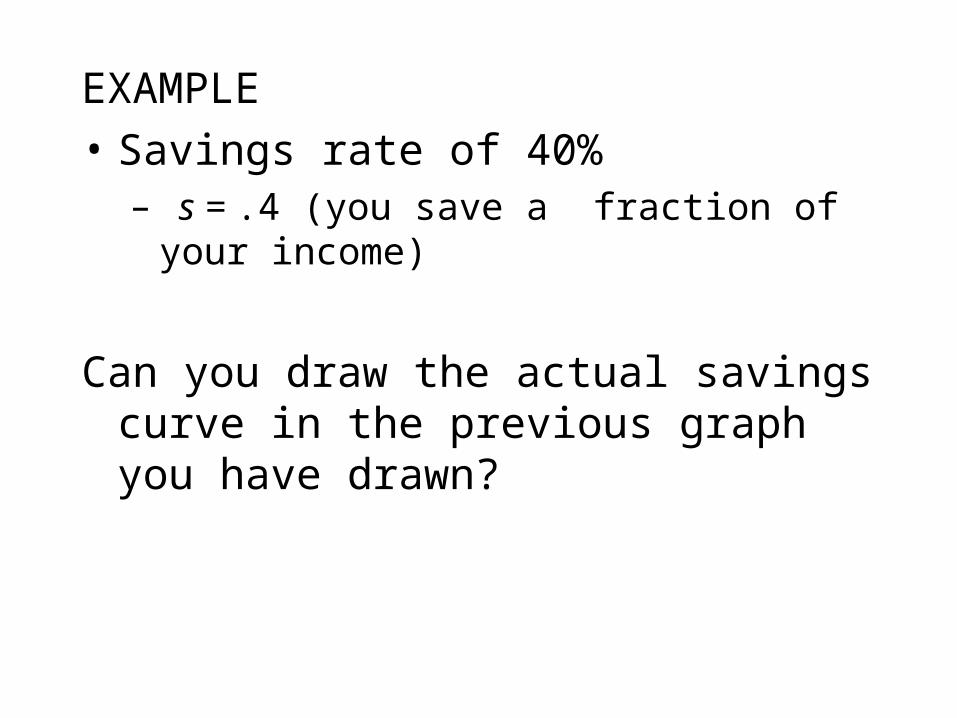
EXAMPLE
• Savings rate of 40%– s = .4 (you save a fraction of your income)
Can you draw the actual savings curve in the previous graph you have drawn?
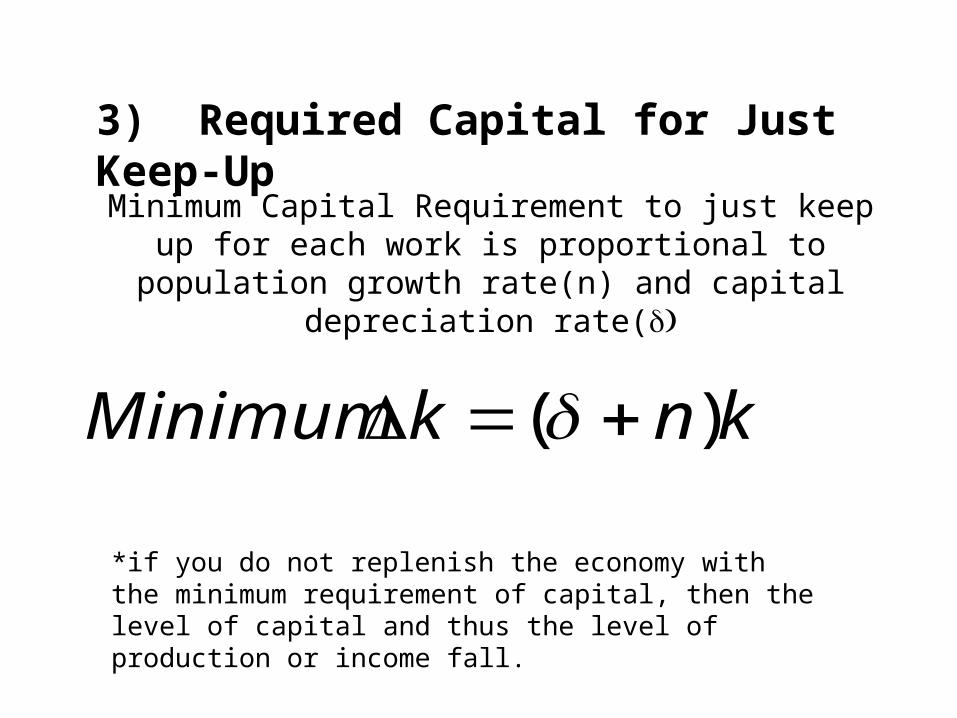
Minimum Capital Requirement to just keep up for each work is proportional to population growth rate(n) and capital
depreciation rate(
knkMinimum )(
*if you do not replenish the economy with the minimum requirement of capital, then the level of capital and thus the level of production or income fall.
3) Required Capital for Just Keep-Up
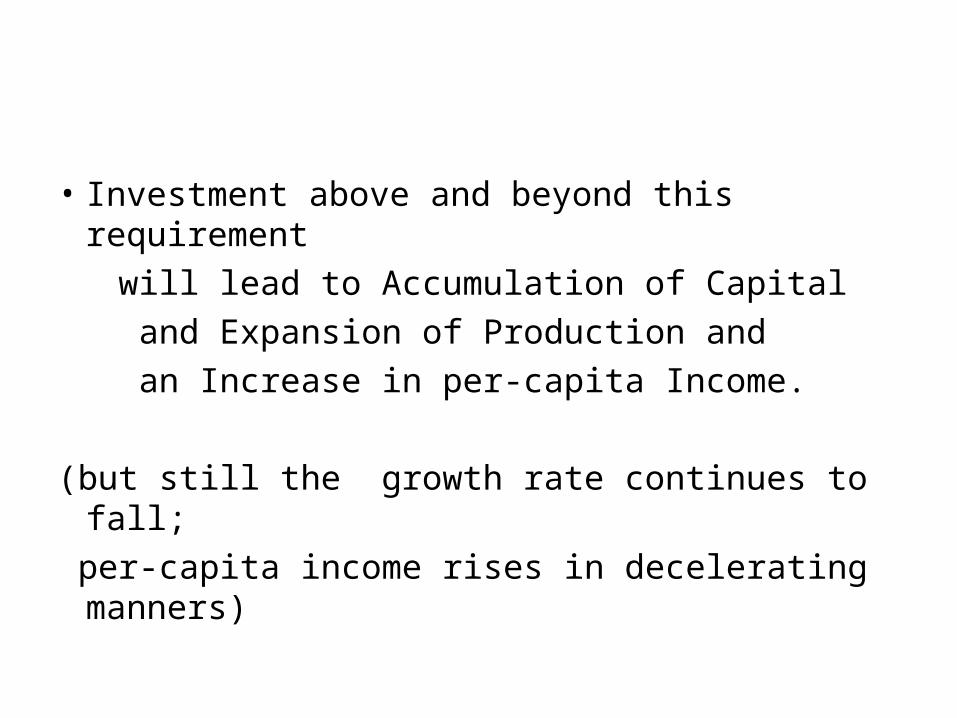
• Investment above and beyond this requirement
will lead to Accumulation of Capital
and Expansion of Production and
an Increase in per-capita Income.
(but still the growth rate continues to fall;
per-capita income rises in decelerating manners)
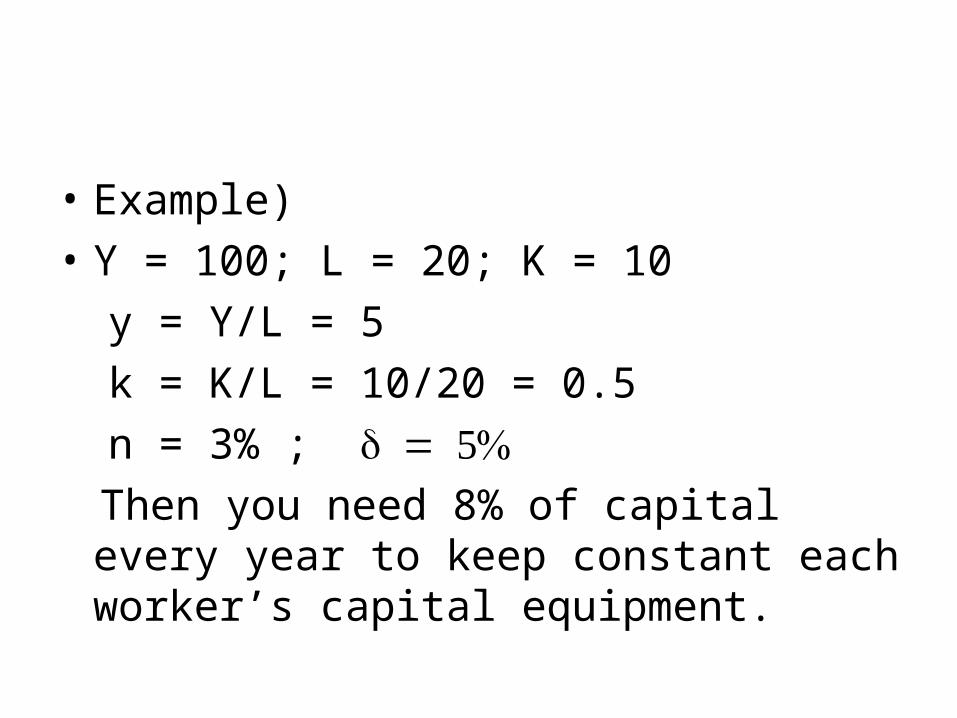
• Example)
• Y = 100; L = 20; K = 10
y = Y/L = 5
k = K/L = 10/20 = 0.5
n = 3% ; Then you need 8% of capital every year to
keep constant each worker’s capital equipment.
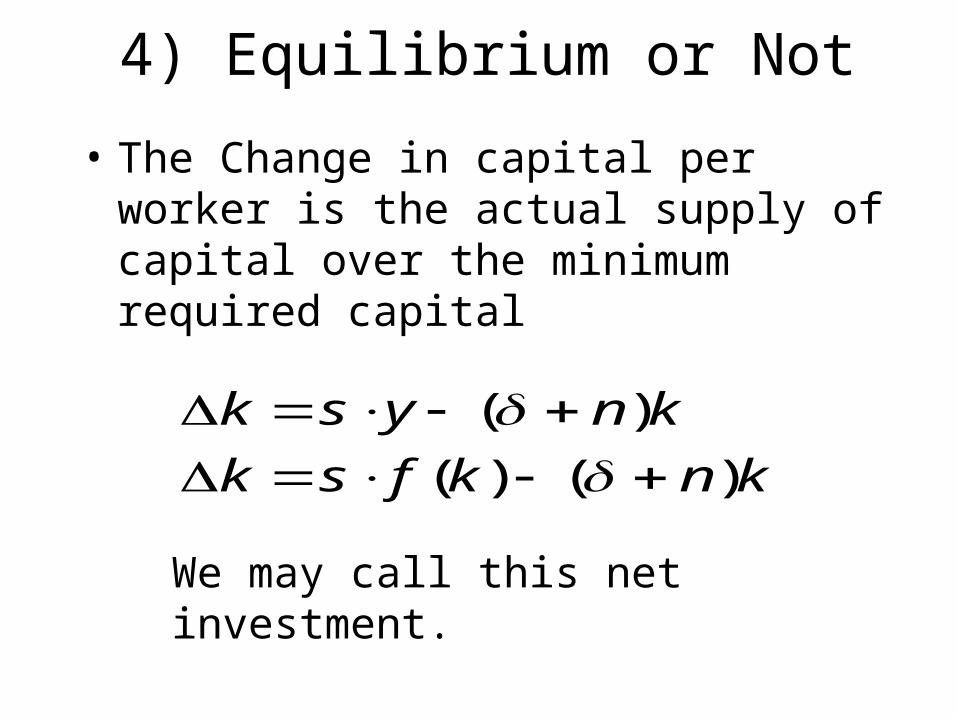
4) Equilibrium or Not
• The Change in capital per worker is the actual supply of capital over the minimum required capital
knkfsk
knysk
)()(
)(
We may call this net investment.
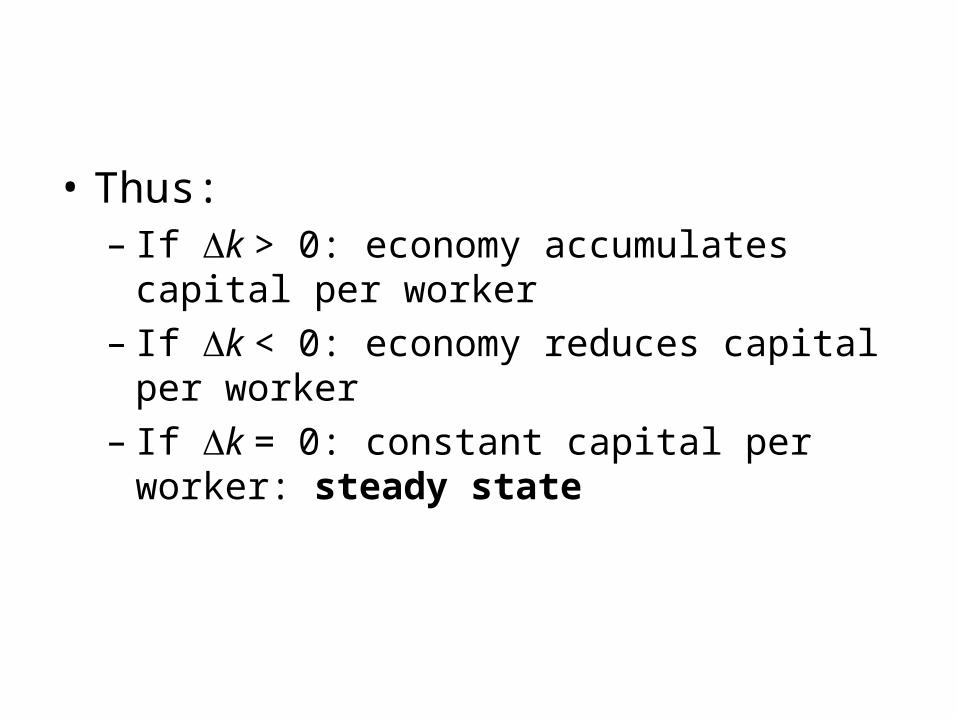
• Thus:– If k > 0: economy accumulates capital per worker– If k < 0: economy reduces capital per worker– If k = 0: constant capital per worker: steady state
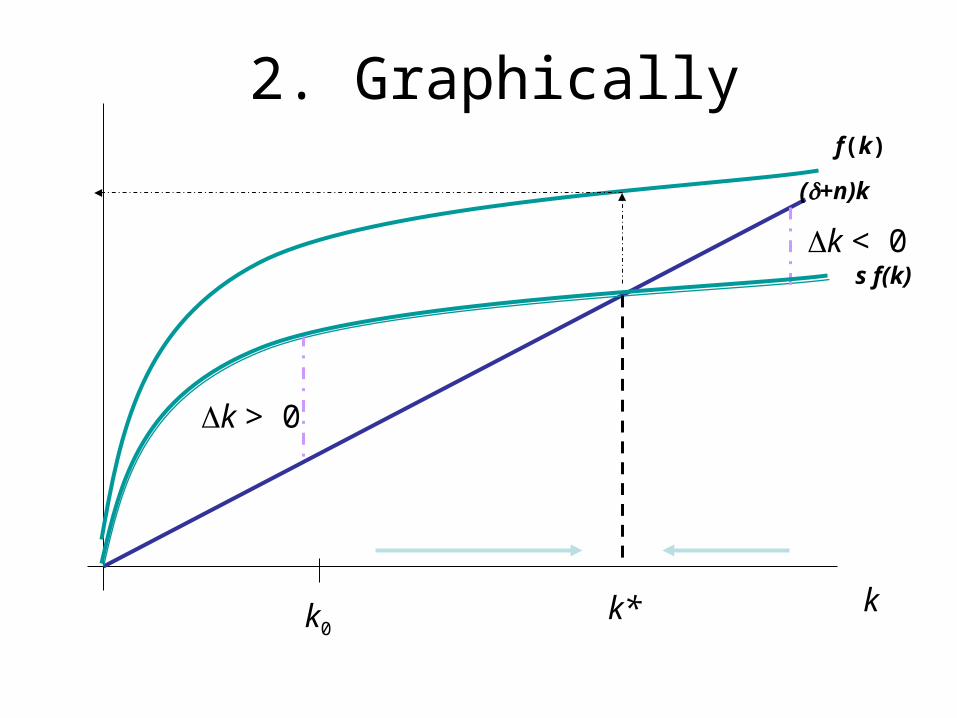
2. Graphically
k
(+n)k
s f(k)
k*k0
k > 0
k < 0
f(k)
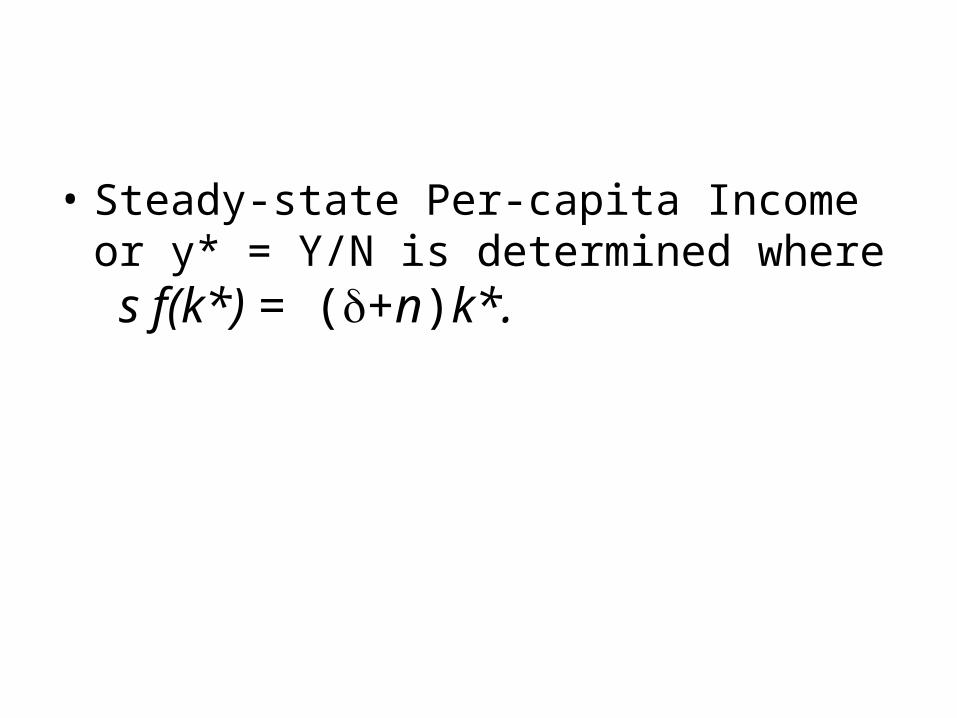
• Steady-state Per-capita Income or y* = Y/N is determined where s f(k*) = (+n)k*.
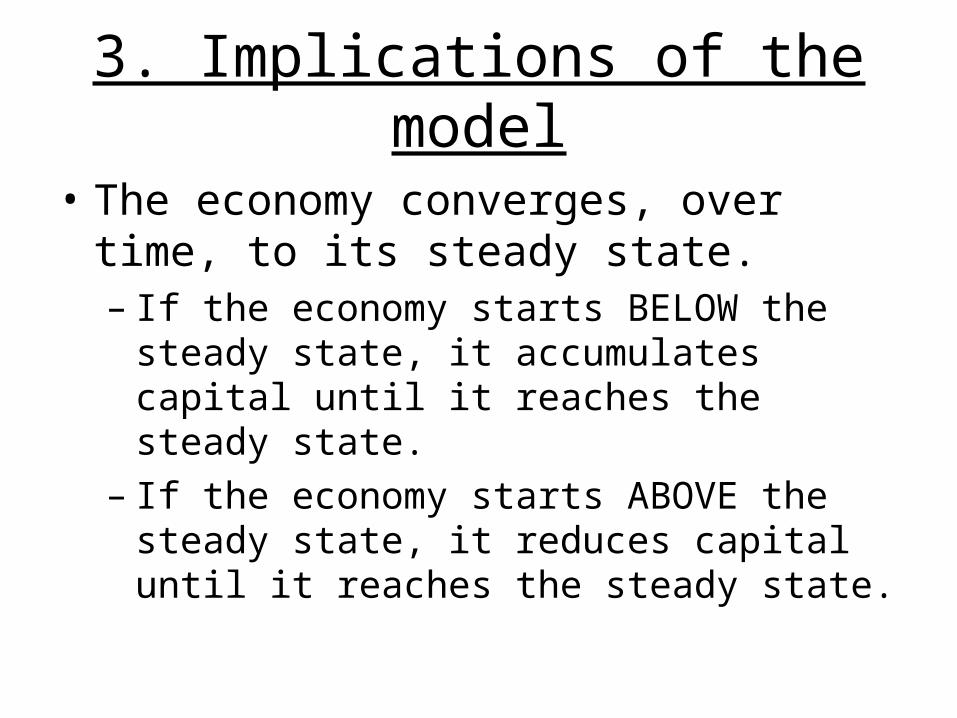
3. Implications of the model
• The economy converges, over time, to its steady state.– If the economy starts BELOW the steady state, it
accumulates capital until it reaches the steady state.
– If the economy starts ABOVE the steady state, it reduces capital until it reaches the steady state.
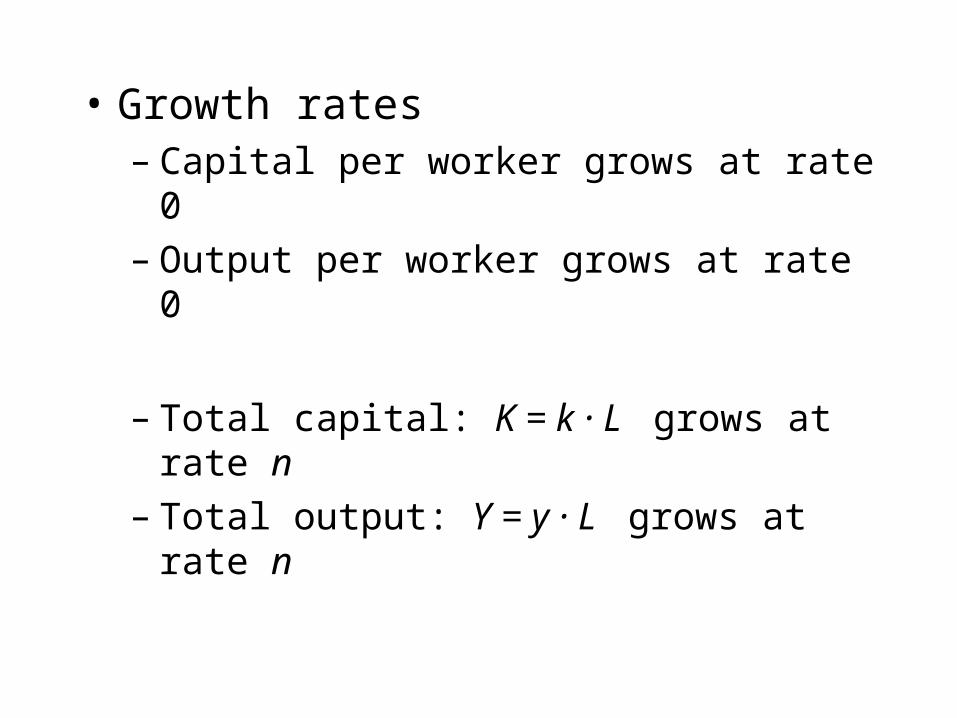
• Growth rates– Capital per worker grows at rate 0– Output per worker grows at rate 0
– Total capital: K = k · L grows at rate n– Total output: Y = y · L grows at rate n
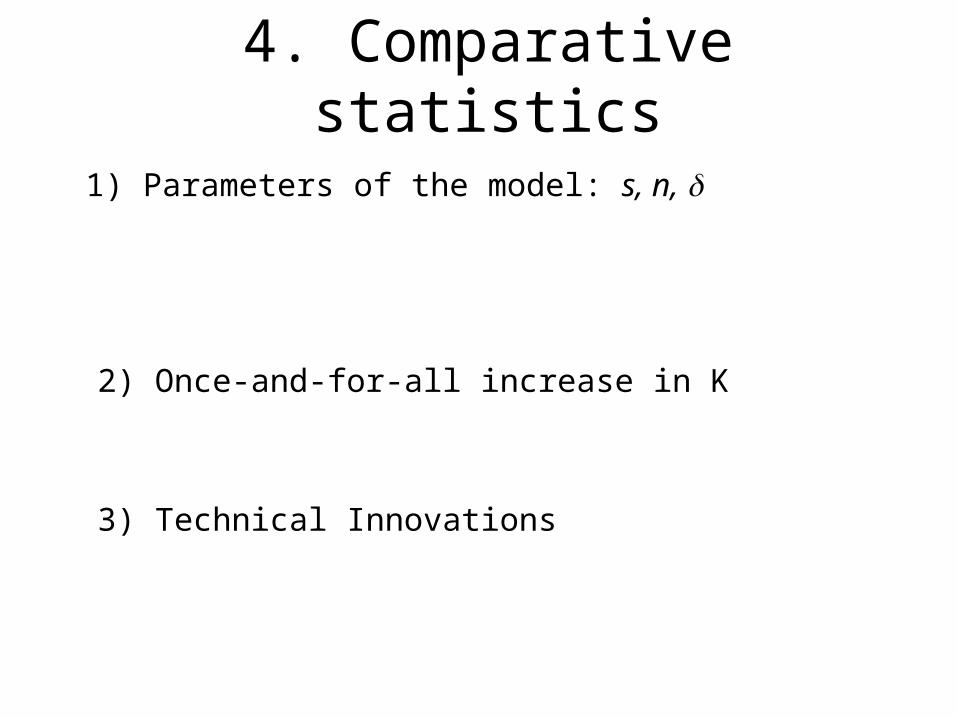
4. Comparative statistics
1) Parameters of the model: s, n,
2) Once-and-for-all increase in K
3) Technical Innovations
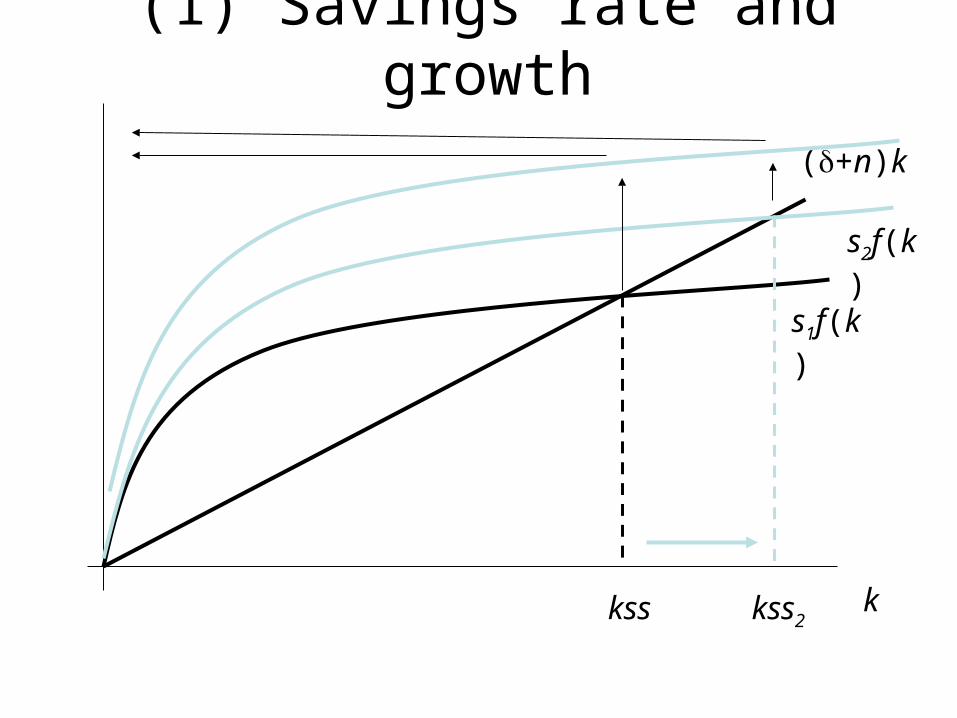
(1) Savings rate and growth
k
(+n)k
s1f(k)
kss
s2f(k)
kss2
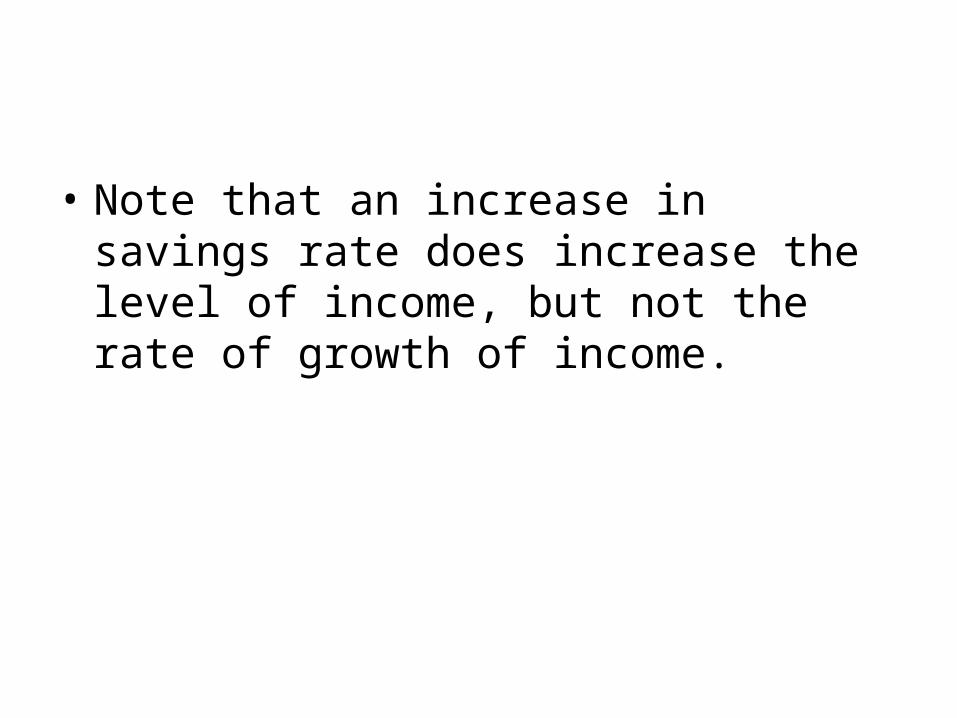
• Note that an increase in savings rate does increase the level of income, but not the rate of growth of income.
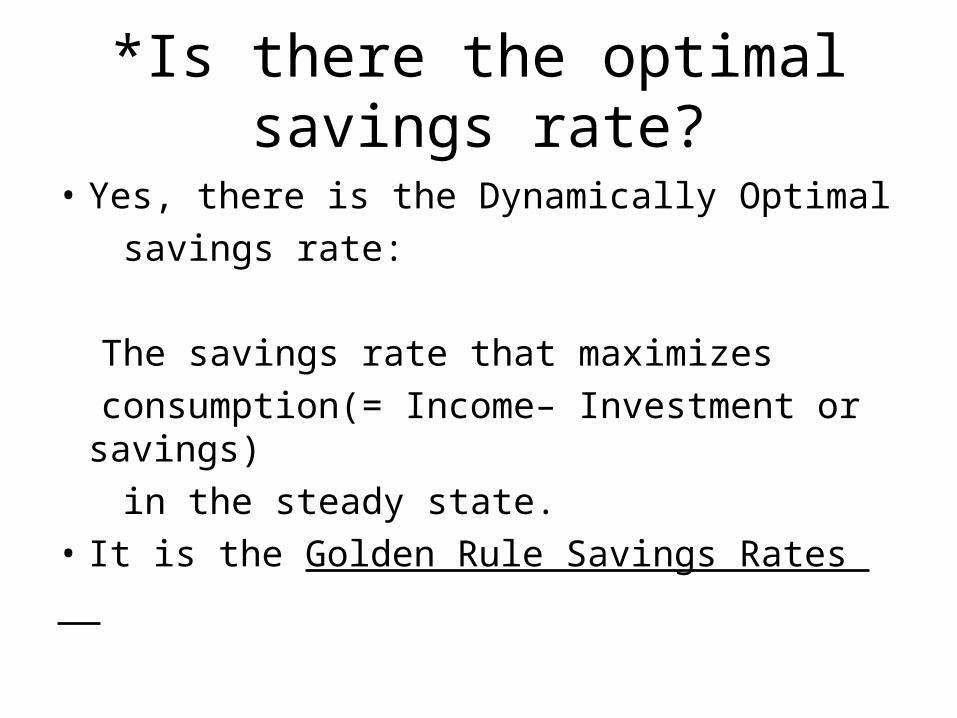
*Is there the optimal savings rate?
• Yes, there is the Dynamically Optimal
savings rate:
The savings rate that maximizes
consumption(= Income– Investment or savings)
in the steady state.
• It is the Golden Rule Savings Rates
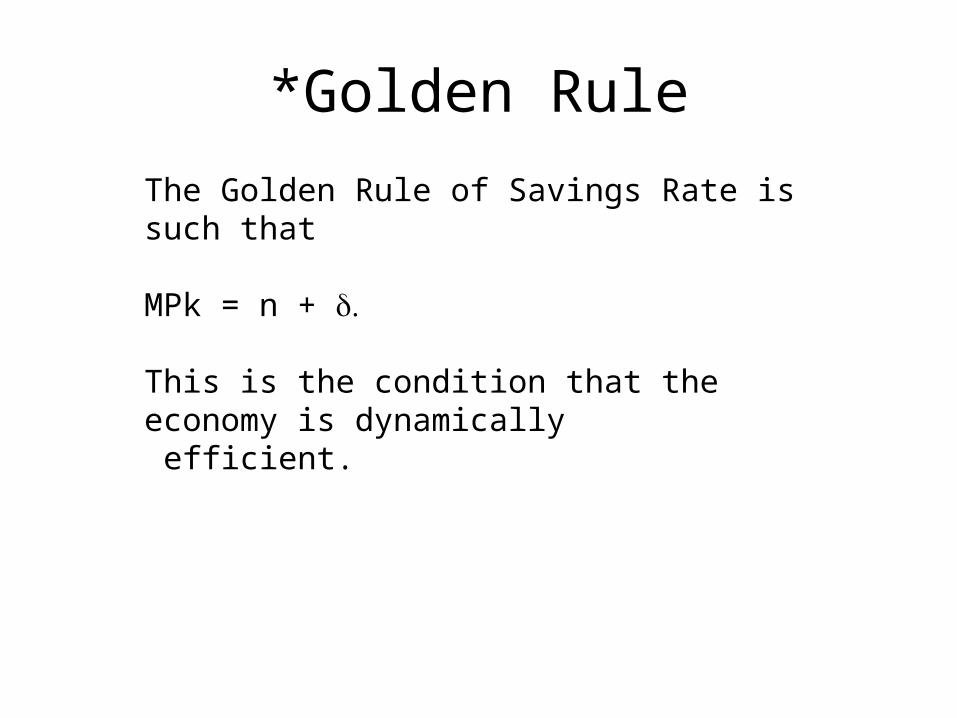
*Golden Rule
The Golden Rule of Savings Rate is such that
MPk = n +
This is the condition that the economy is dynamically efficient.
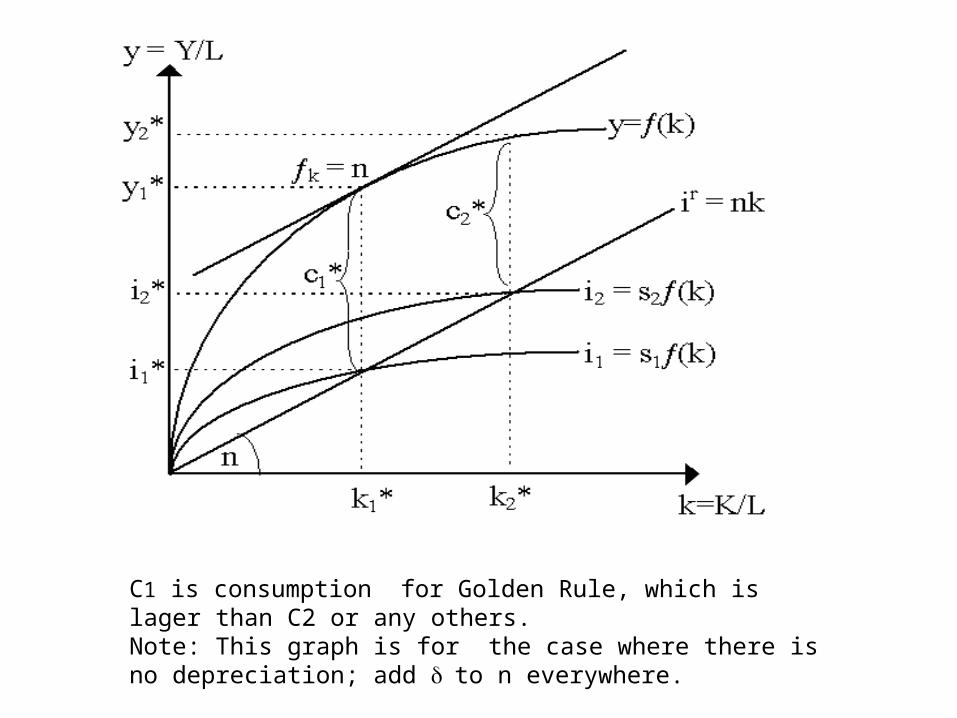
C1 is consumption for Golden Rule, which is lager than C2 or any others. Note: This graph is for the case where there is no depreciation; add to n everywhere.
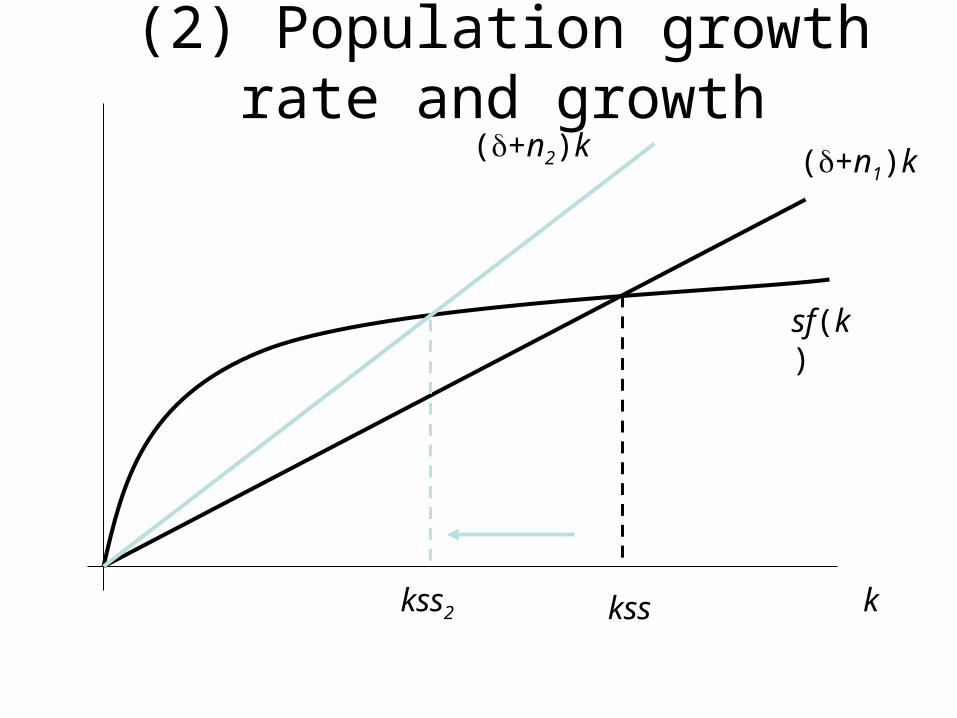
(2) Population growth rate and growth
k
(+n1)k
sf(k)
kss
(+n2)k
kss2
(3) An Injection of Capital
It really does not do anything for the economy and income in the long-run.
Try the llustration.
(4)Technical Innovations
• How is this different for the y curve from an increase in savings rate?
*Solow Model discounts the importance of Capital and carves up technical innovation in the long run.
• Technological development will be the only
motor of economic growth in the long run.
The bigger questions are:
What is technical innovation?
How does it happen?
How can we promote it?
These are not easy questions at all.
Practice
• Click here for Solow’s Model simulation for Economic Growth
Note: The production function used in the above illustration is not the original Solow model, but is an revised version with the later developed theory of Human Capital. Thus it is a hybrid of
Solow model and Endogenous Growth Model.