solid waste management in khartoum industrial area
TRANSCRIPT

1
SOLID WASTE MANAGEMENT IN KHARTOUM INDUSTRIAL AREA
By
Nazik Omer Ahmed El Sidig B.Sc. University of Khartoum
A Thesis Submitted In Partial Fulfillment of The Requirements
For The Degree of M.Sc in (Environmental Studies)
Institute of Environmental Studies University of Khartoum
May (2004)

i
Dedications
Dedicated to:-
My parents,
Brothers,
And my sister

ii
Acknowledgement
I would like to thank in particular, Mr. Antony Julu, Ehab
Sir Elkhatem, Hassan Elsheik, Control manager of Khartoum
Industrial Area and all those who supported and helped me during
this study.
Thank are also extended to my supervisor,
Dr. Basheer M. Elhassan
And to all members of the staff and colleagues of the Institute
of Environmental Studies, who offered me great assistance.
iii
Abstract
This study was conducted in Khartoum Industrial Area (KIA). The study
discusses solid waste generation issues in KIA as well as solid waste collection,
storage, transport and final disposal methods. A focus on environmental impact
resulting from the accumulation of solid waste was presented by reviewing solid
waste management in developed as well as developing countries starting from
generation to final disposal. Environmental health legislation in Sudan was
investigated.
The study covers all the (eight) industrial sub-sectors presented in KIA.
The main objective of the study is to assess the situation of solid waste in KIA.
To fulfill the objectives of the study the researcher deemed it necessary to
explore problems related to solid waste generation and solid waste arrangement with
special emphasis on final disposal methods.
Practically, 31 (thirty-one) factories representing the different industrial sub-
sectors in KIA were studied. This represents 25% of the total number of factories
located in KIA.
Data were obtained by, questionnaires, interviews and observations mainly
directed to concerned officials, solid waste workers, pickers and brokers.
Obtained data were stored, coded, tabulated and analyzed using the computer
systems (excel & SPSS programmes).

iv
The obtained results should clear deficiency in the management of solid waste
which led to great environmental deterioration in KIA and neighboring residential
areas.
The environment in studied area is continuously polluted due to high pollution
loads and unproved solid waste management.
In order to maintain health environment operating factories have to pretreated
their solid waste according to the recognized standards and waste minimization
techniques such as recycling and re use should be widely applied, moreover, running
crash programme for environmental sanitation in Khartoum state should be expanded
and improved to include special characteristics of solid waste from industries.
Finally, increase awareness among workers and solid waste pickers about
environmental and health hazards of solid waste is very important.

v
vi
لخالصــــــةا
.جريت هذه الدراسة في المنطقة الصناعية بالخرطومأ
ناقش هذه الدراسة قضايا تولد المخلفات الصلبة بالمنطقة الصناعية بالخرطوم وكذلك ت
. ترحيلها وطرق التخلص منها،قضايا جمع تلك المخلفات، تخزينها
ذلك باستعراض إدارة ركزت الدراسة علي األثر الناتج من تراكم المخلفات الصلبة وت
المخلفات الصلبة في البلدان النامية والبلدان المتقدمة علي حد السواء بدءاً من مرحلة تولد تلك
.المخلفات إلي مرحلة التخلص النهائي منها
البيئة بالسودان وتغطي هذه الدراسة كل القطاعات نحثت الدراسة تشريعات مب
.المنطقة الصناعية بالخرطومالصناعية الفرعية الثمانية الموجودة ب
لهدف األساسي لفكرة الدراسة أعتبر الباحث أنه من الضروري استكشاف المشاكل ا
ص لالمتعلقة بتولد المخلفات الصلبة وقضايا إدارة تلك المخلفات بتركيز خاص علي طرق التخ
.النهائي منها
الصناعية مصنع تمثل مختلف القطاعات) واحد وثالثون (31ملياً تمت دراسة ع
.الفرعية بالمنطقة الصناعية بالخرطوم
ثم . من جملة عدد المصانع الموجودة بالمنطقة الصناعية بالخرطوم% 25يمثل هذا و
حظات التي وجهت الالحصول علي معطيات الدراسة بواسطة االستبيانات، المقابالت والم
األطفال حول تلك المخلفات بصفة أساسية للمسئولين الحكوميين بمكان جمع المخلفات الصلبة،
.وسماسرة النفايات
لمعطيات التي تم الحصول عليها تم تخزينها، ترميمها، جدولتها وتحليلها بواسطة نظم ا
).SPSS وبرنامج Excelبرنامج ( الحاسوب

vii
وصل إليها قصوراً كبيراً في إدارة المخلفات مما أدي إلي تأوضحت النتائج التي تم ال
وغير أن البيئة . في المنطقة موضع الدراسة والمناطق السكنية المجاورةتدهور بيئي كبير
بالمنطقة موضع الدراسة في حالة تلوث مستمر بسبب اإلهمال البيئية الكبيرة واإلدارة غير
.السليمة للمخلفات الصلبة
ول علي بيئة صحيحة علي المصانع العاملة إن تقوم بمعالجات أولية صي سبيل الحف
الصلبة وذلك وفقاً للمواصفات المحددة هذا باإلضافة إلي ضرورة استخدام سبل الحد لمخلفاتها
.من التلوث وتقنيات التدوير و إعادة االستخدام
ضافة لذلك، هنالك ضرورة لتوسيع وتحسين أداء البرنامج اإلسعافي الجاري حالياً في إ
ات الخاصة بالمخلفات الصلبةوالية الخرطوم في مجال إدارة المخلفات الصلبة ليسع المواصف
أخيراً هناك أهمية بالغة لرفع الوعي وسط العاملين في مجال التعامل مع المخلفات و
.الصلبة، خاصة فيما يتعلق باألخطار الصحية والبيئية ذات الصلة بالمخلفات الصلبة
CONTENTS

viii
List of contents Dedication i
Acknowledgement ii
Abstract In English iii
Abstract In Arabic v
Contents vii
List of table xi
List of Figures xiii
Chapter One
1.1. INTRODUCTION ....................................................... 1
1.2. General................…..................................................... 2
1.3. Industrial liquid wastes................................................ 6
1.4. Industrial gaseous wastes............................................ 7
1.5. Industrial solid wastes..................…........................... 8
1.6. Statement of the problem........................................... 9
1.7. Hypothesis................................….............................. 9
1.8. Objectives of the study.............................................. 10
1.8.1. General objective................................................... 10
1.8.2. Specific objectives ................................................. 10
Chapter Two LITERATURE REVIEW
2.1 Definition of Solid waste.......................................…. 11
2.2. Classification of solid waste....................................... 12
2.3. Environmental Impact resulting from the accumulation of solid
waste.. …………………..…………………………………. 21

ix
2.4. Solid waste in developed countries ............................. 21
2.5. Solid waste in developing counteirs............................... 24
2.6. Solid waste in Khartoum province - Sudan ................... 26
2.6.1. Objectives of crash programme for environmental
sanitation …………………………...........…..................... 29
a) General Objectives ..................................................... 29
b) Specific objectives...........................……...................... 29
2.6.2. Notes about the crash programme ............................... 30
2.6.3 Environmental Health legislation in Sudan ................. 32
2.7. Waste management........................................................ 34
2.7.1. Background................................................................. 34
2.7.2. Solid waste management.............................................. 35
2.8. Solid waste generation.................................................... 36
2.9. Storage of solid waste .................................................... 37
2.10. Waste collection............................................................ 38
2.11. Transfer and transport................................................... 39
2.12. Refuse transfer station .................................................. 40
2.13. Disposal methods.......................................................... 43
2.13.1 Open dumping ............................................................ 43
2.13.2. Ocean dumping ......................................................... 44
2.13.3 Sanitary landfill.......................................................... 44
a) Site evaluation ........................……............................ 45
b) Benefits (Advantages of landfill)................................. 48
c) Disadvantages...............................................……....... 49
2-13.4 Composting................................................................. 51
2-13-5. Incineration............................................................... 53
a) Basic phases ........................................…................... 53
x
b) Advantages............................................…….............. 54
c) Disadvantages ........................................……............. 55
2.13.6. Pulverization ............................................................. 56
2.14. Recycling ....................................................…............ 57
2.14.1. Recycling - Techniques and technology ................... 58
a) Pevulcnizing......................................……................... 58
b) Pulping and converting to paper.................................. 59
2.15. Principles of waste avoidance and utilization .............. 61
2.15.1. Hierarchy of approaches ........................................... 62
2.15.2 Policy and Regulatory framework............................. 62
2.15.3 Producer and consumer ............................................. 63
2.15.4. complexity ................................................................ 63
Chapter Three MATERIAL & METHODS 3.2.Material & method …………………..……………….. 65
3.2. Material Used.................................................…............. 66
3.2.1. Methodology ..................................................…......... 67 3.2.2. visits to sites, ministries concerned, offices and households .... 67
3.2.3 Data collection.......................…................................... 68
3.2.3a. Primary data........................…................................... 69
3.2.3b. Secondary data ................…...................................... 69
3.2.3c. Data Analysis .........................…............................... 69
3.3. Study area (Khartoum Industrial area)............................ 70
3.3.1. Geographical Location................................................. 70
33.2 background..........................…....................................... 72
3.3.3. Obstacles of Khartoum industrial area ....................... 75
Chapter Four
xi
RESULTS AND DISCUSSION 4.1. Results...........................…........................................ 77
4.2. Discussion ................................................................ 99 4.3. Environmental Impact of Khartoum industrial area................. 106
Chapter Five CONCLUSIONS AND RECOMMENDATIONS 5.1. Conclusions................................................................. 109
5.2. Recommendations....................................................... 111
References...............................…....................................... 112
Appendices..........….........……................…..................... 116
Appendix I: Plates …………………………………… 116
Appendix II: Maps…………………………….……… 129
Appendix III: Questionnaires for data collection…….. 131
xii
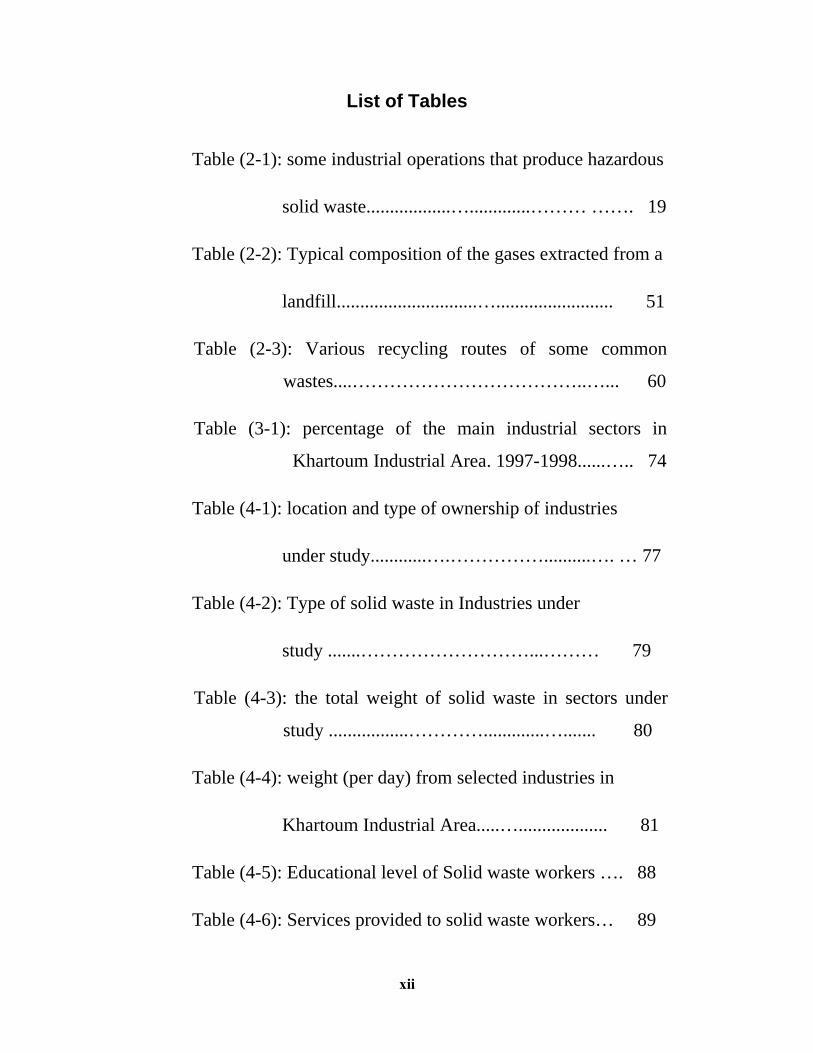
List of Tables
Table (2-1): some industrial operations that produce hazardous
solid waste..................….............……… ……. 19
Table (2-2): Typical composition of the gases extracted from a
landfill..............................…......................... 51
Table (2-3): Various recycling routes of some common
wastes....………………………………..…... 60
Table (3-1): percentage of the main industrial sectors in
Khartoum Industrial Area. 1997-1998......….. 74
Table (4-1): location and type of ownership of industries
under study............….……………..........…. … 77
Table (4-2): Type of solid waste in Industries under
study .......………………………...……… 79
Table (4-3): the total weight of solid waste in sectors under
study .................………….............…....... 80
Table (4-4): weight (per day) from selected industries in
Khartoum Industrial Area.....…................... 81
Table (4-5): Educational level of Solid waste workers …. 88
Table (4-6): Services provided to solid waste workers… 89

xiii
Table (4-7): type of solid waste collected by a solid Waste
picker, quantity, marketing place, price.......…... 96
Table(4-8): Solid waste brokers around the dumping area... 97
Table (4-9): Quantity of solid waste bought by solid Waste
brokers, marketing place and problems
encountered…………………………………... 98
Table (4-10): The residential quarter, the type of industry
neighboring it and the hazards resulting form
that………………………………………. 106
xiv
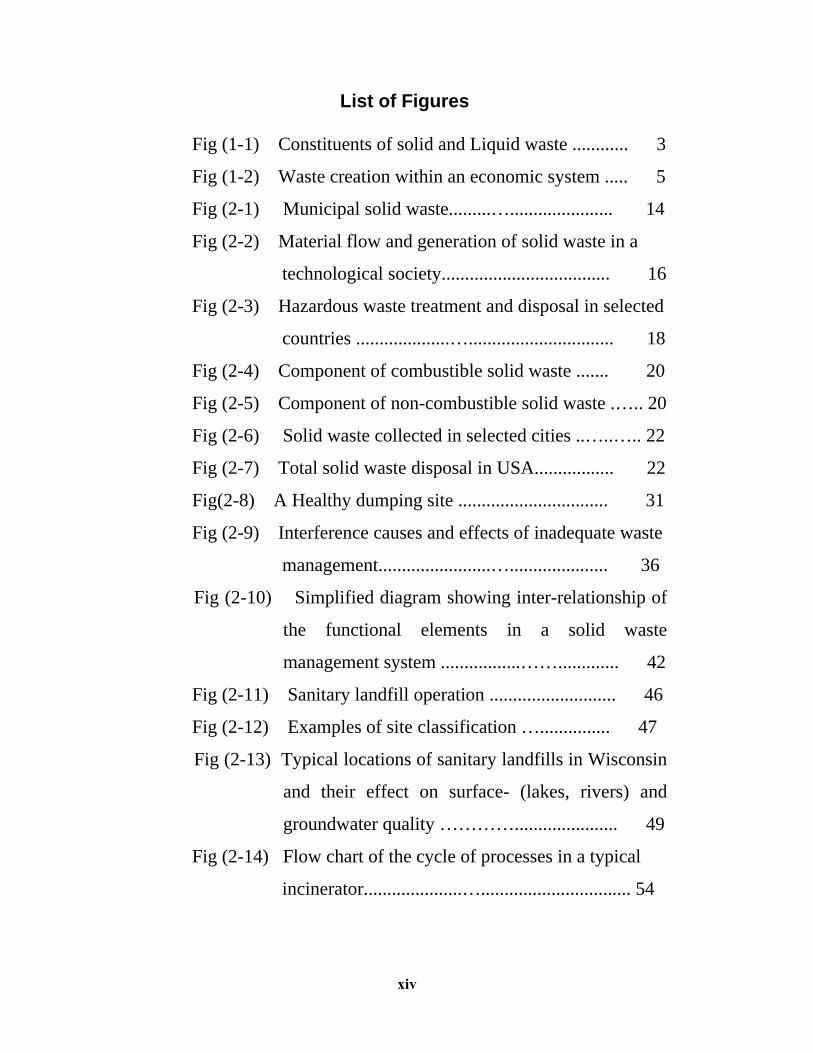
List of Figures
Fig (1-1) Constituents of solid and Liquid waste ............ 3
Fig (1-2) Waste creation within an economic system ..... 5
Fig (2-1) Municipal solid waste.........…...................... 14
Fig (2-2) Material flow and generation of solid waste in a
technological society.................................... 16
Fig (2-3) Hazardous waste treatment and disposal in selected
countries ....................…............................... 18
Fig (2-4) Component of combustible solid waste ....... 20
Fig (2-5) Component of non-combustible solid waste .….. 20
Fig (2-6) Solid waste collected in selected cities ..…..….. 22
Fig (2-7) Total solid waste disposal in USA................. 22
Fig(2-8) A Healthy dumping site ................................ 31
Fig (2-9) Interference causes and effects of inadequate waste
management........................…..................... 36
Fig (2-10) Simplified diagram showing inter-relationship of
the functional elements in a solid waste
management system .................……............. 42
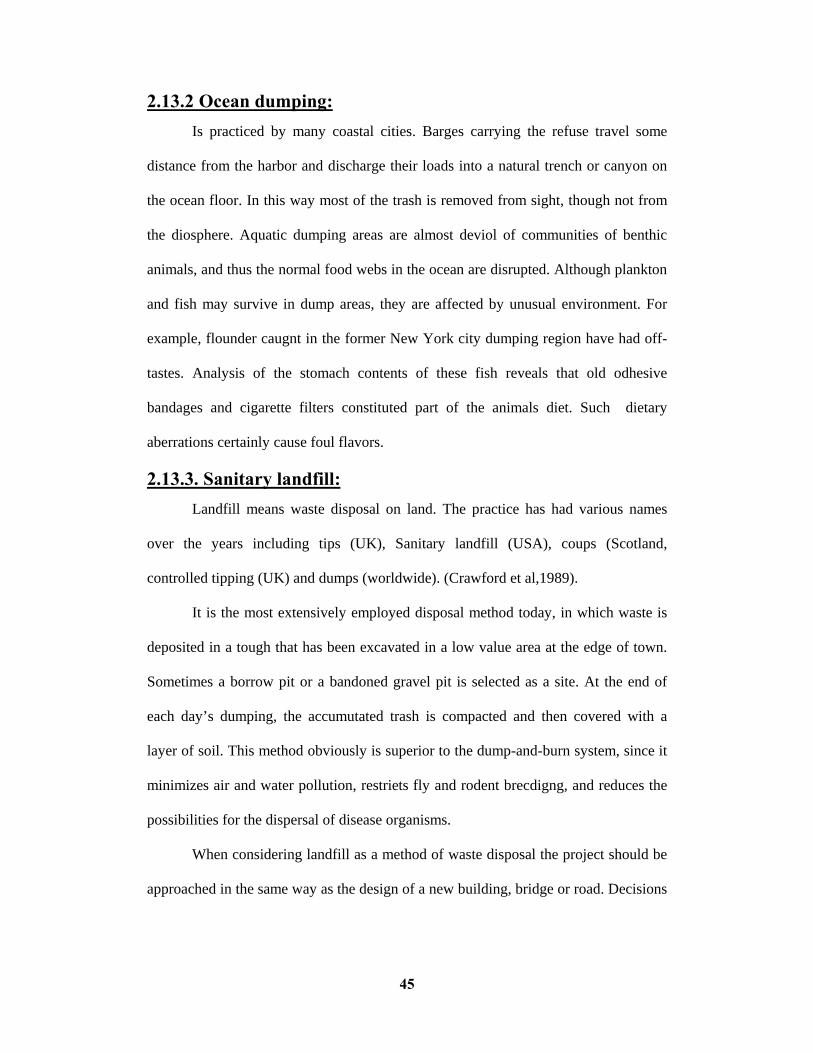
Fig (2-11) Sanitary landfill operation ........................... 46
Fig (2-12) Examples of site classification …............... 47
Fig (2-13) Typical locations of sanitary landfills in Wisconsin
and their effect on surface- (lakes, rivers) and
groundwater quality …………...................... 49
Fig (2-14) Flow chart of the cycle of processes in a typical
incinerator.....................…................................ 54

xv
Fig (4-1) The percentage of complaints in solid waste
management in industries under study........... 82
Fig (4-2) Seasonal effect on solid waste disposal in industries
under study……………......…....................... 83
Fig (4-3) Contract with crash program for environmental
sanitation....................................……............... 85
Fig (4-4) Unsatisfactory situation against the present adopted
way of collecting and disposing of solid waste.. 85
Fig (4-5) Visiting of Health inspectors.......................... 86
Fig (4-6) Recycling in industries under study......…...... 87
Fig (4-7) Insurance for solid waste workers....……....... 90
Fig (4-8) Health problems in solid waste workers...….... 91
Fig (4-9) Benefit from solid waste.................................. 92
Fig (4-10) Age of solid waste pickers Around the sanitary
land fill Area................................................. 93
Fig (4-11) Educational level of solid waste pickers Around
the sanitary landfill Area.............................. 94
Fig (4-14) Residence of solid waste pickers Around the
sanitary landfill Area.............................….. 95

xvi
Chapter One
1
Chapter 1 1-1 Introduction
Current problems associated with the collection and disposal of house, trade
and industrial wastes have combined to produce the most frustrating, complex and
challenging era this service has yet known.
Inadequate waste collection and waste management systems are the cause of
serious urban pollution and health hazards, especially in cities in developing
countries.
Cities industrialized countries are now also facing the consequences of past
environmentally damaging production techniques and inadequate waste disposal.
This has resulted in many different forms of pollution and in particular the
formation of brown fields: a abandoned, vacant or under used former industrial areas
where redevelopment is is hampered by environmental problems and lack of adequate
information on contaminated land management (UNEP 2001).
Another problem emerging in developed countries is the lack of suitable land
fill sites to cater for the increasing demand for solid waste disposal.
Over the past half century, Urbanization (the concentration of people and
activities into areas classified as Urban) is set to continue well into 21st century,
driving force include the opportunities and services offered in Urban areas.
In 1970s, a new phase of globalization started with the deregulation of labour
markets liberalization of financial markets, and privation of government functions.
One of the results of globalization (the new industrial revolution) was
increasing competition for foreign direct investment and employers found themselves
able to shift the location of their production facilities more easily, which lead to huge
quantities of industrial wastes with a wide rang in quality and forms.
2
1-2 General Industrial activates have been precipitating huge quantities of industrial wastes
with a wide range in quality and form. They may be in the form of solids, liquids,
gases, heat, noise, vibrations, etc.
Unless properly handled, industrial wastes may have collectively or
individually, serious impact on the Biosphere in general and on the immediate
environment in particular. This may jeopardize man’s health or may render his
existence within the Biosphere impossible.
Industrial wastes are normally heterogeneous and may vary seasonally and
because of this there may not be a uniform approach to the problems they create. Two
main classes of wastes are known. The first is the fermentable organic wastes, which
decompose radically and which arise from food manufacturing or processing industry.
The second type is the non-fermentable wastes which do not lend themselves to
decomposition, or decompose very slowly (who, 1971).
Wastes from factories are as varied as raw materials and products that enter
and leave those factories.
Usually these include packing off-cuts, spoiled material and unwanted by
products.(Fig1-1)
The fuel used in the factories for power or chemical incineration adds waste
residues.

3
Industrial wastes in the form of solids liquid and gaseous phases are directly
the by-products of industrial plants and power generation units and indirectly from the
consumption of industrial products. In most developed countries, industries have a
larger load of organic wastes than municipalities. Wastes with high BOD loads are
produced by textile industries, paper and pulp mills, rubber production and chemical
industries. Metal industries and mining contribute to a lesser degree to organic loads.
Fig (1-1) Constituents of solid and Liquied waste.
Source: Ibrahim, 1984
Chemicals Hazerdous Materials
Toxic Chemicals
Pathogenical Radiological
Residues
Wood & Paper Organics
Inorganic Residues
Minerals
Industrial waste (Solid & Liquid)

4
Industrial wastes mean differently to different people. The manufacturer
wants to dispose of industrial wastes with the least possible cost. But sometimes a
reasonable economic value may be found in industrial wastes i.e when the wastes is
used as raw material in the same plant or in satellite or other plants. For example,
molasses which is discharged into the river creating water pollution, may be used as
raw material for the manufacturing of different products like spirits.
Wastes may be recycled in one way or another or they may be used as food for
animals or fuel, when this is the case there will be no problem of waste disposal. The
community will be disturbed if industrial wastes create economic and social
problems to the immediate environment.
From the days of primitive societies, man and animal have used the resources
of the earth to support like and to dispose of waste. In early times, the disposal of
human and other wastes did not pose a significant problem, for the population was
small and the amount of land available for the assimilation of wastes was large.
Wastes are not pollutants until they are discharged to and cause damage in the
environment.
Furthermore, waste emitted at one point may be transmitted through various
media (e.g, air, water) to produce pollutants at different Locations and points in time
and different concentrations, often with alteration to their chemical and physical
charateristics.
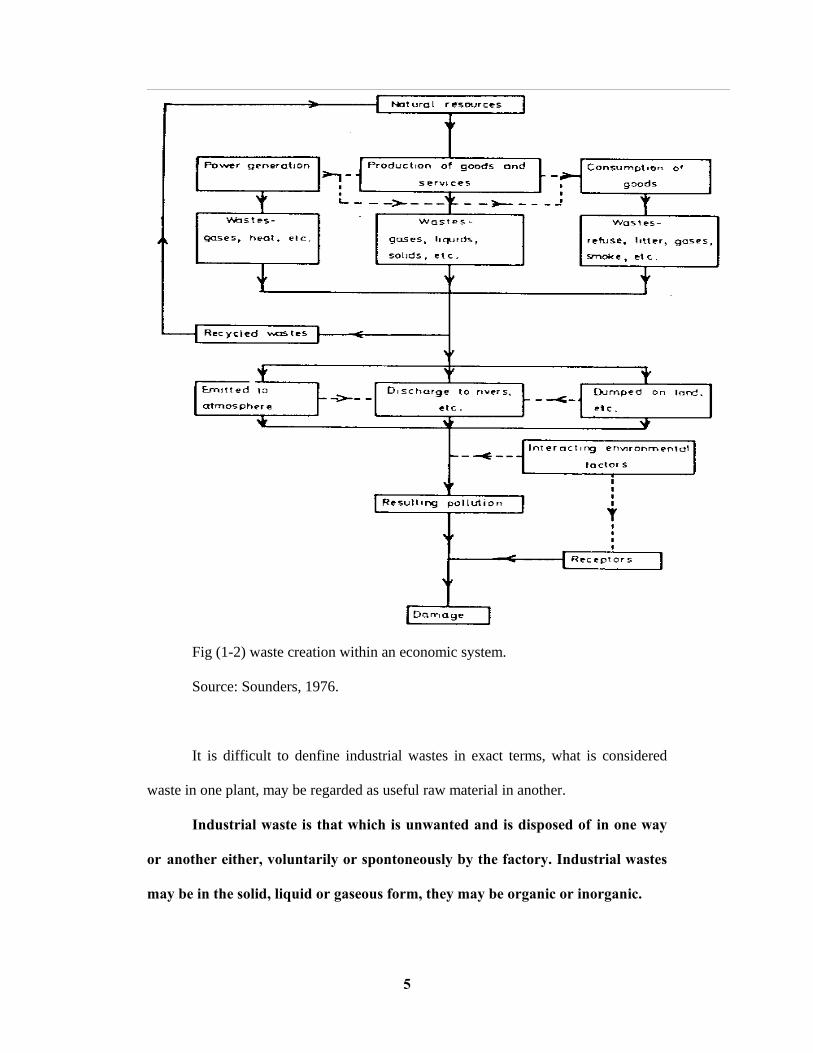
Accordingly, the effects of waste vary from one type to another. All wastes
have much the same initial effect, when disposed on land they occupy valuable space
and obliterate local fauna and flora. Fig “1-2”.
5
Fig (1-2) waste creation within an economic system.
Source: Sounders, 1976.
It is difficult to denfine industrial wastes in exact terms, what is considered
waste in one plant, may be regarded as useful raw material in another.
Industrial waste is that which is unwanted and is disposed of in one way
or another either, voluntarily or spontoneously by the factory. Industrial wastes
may be in the solid, liquid or gaseous form, they may be organic or inorganic.

6
1.3 Industrial liquid wastes Industrial liquid wastes may have serious impact on the environment if not
satisfactorily managed. They may lead to the deterioration of scwge systems, pollute
the environment and have negative impact on the aesthetic facet in a prticular
environment in some cases pre treatment will have to be done before releasing the
waste effluent into the sewer, as toxic material may be contained in it. e.g cyanide,
mercury, cadmium, etc….
Through sewer leakage, which is quite common nowadays, ground water may
be threatened. The effluent may be at a high temerature and this may create problems.
The PH of liquid waste, the suspended solids, grease, and oil, malodorous, gases, etc
may be above the allowable international standards and may thus cause trouble to
both man and his environment. What is going to happen to the sludge resulting from
the treatment process? Again if not properly handled, valuable land may be spoiled.
Dilute waste waters are often discharged into rivers, lakes, or streams after
appropriate treatment, but the proper dispersion of even treated water is an important
consideration. The location of the discharge point and the type of dispersion
equipment used are significant in their protection of other water sources and in
maintaining an overall desirable situation. Plants located near the ocean or large lake
or a large river may discharge their wastes through a pipe or ditch leading to the
shore, but if the discharge of the pipe occurs above the main body of water, the
formation of foam due to air entrainment, or in complete dilution because of a low
water condition may result, giving high concentrations near the point of dicharge. A
properly designed subsurface dispersion system, however, will permit the receiving
body to assimilate the waste properly.
7
This reduces treatment reguirements. Some of these submerged devices
include an open-end pipe with special nozzles or diffuser systems consisting of a
series of smaller pipes with hole or slots. Waste should be discharge at the best angle
to the flow of water in the main body to effect rapid dispersion.
Dispersion pipes should be located so that the discharge point is far enough
from the shoreline that it will protect plant or other water intake systems. It should be
directed so that existing current and tides tend to disperse the waste into the main
body rather than to bring it back to the shoreline. (LUND, 1971.)
1-4 Industrial gaseous waste. Industrial wastes are also given in the form of gases, e.g nitrogen compounds,
carbon monoxide, carbon dioxide, mineral fumes, smoke, etc. In addition to
particulates. All these have their adverse effect on man in the industrial envrionment
itself or in the immediate residential area. (Ibrahim, 1984).
These pollutants gases and particulate are diffused to the atmosphere from
many industries espeially the metal industry which had been found to be a major
source of particulate and acid gas emmission. (Abdel Magied, 1984).
As a result of this some occupational diseases may appear a mong the workers
involved and other citizens. This in turn will leads to lowering of productivity a mong
the working force.
In the developed countries it is found that the industrial process a ccounts for
the most deterioration of air quality resulted in a continuous poor air quality in some
areas.
8
1-5 Solid industrial wastes: The solid wastes include all unsellable factory wastes which comprise food
wastes, Off cut and spoiled material of metal, plastic, wood, textile, glass, paper,
packing material and others.
Refinaries also produce solid wastes much of it is bitumious. Some of these
wastes are highly toxic, if these wastes are not controlled, they will release a number
of pollutants.
Industrial solid wastes disposed create severe environmental problems: when
the waste is burnt it causes air pollution, when it is disposed of on a dumping area, it
will pollute and became a source of nuisance to the public. When water perculating
solid wastes deeper into the ground it could pollute the underground water. Beside the
aesthetical, economically and health effects caused by the uncontrolled disposal of
solid wastes.
Most of the solid wastes effects are summarized in a study carried out in the
United States of America in 1967 which can be cited out as follows:
“Hypothetically, solid wastes can produce undesirable effects by biological
chemical, physical, mechanical or psycholoical means. For example human pathogens
in feces provide a biological threat, industrial wastes create chemical hazards,
flammable materials provide a physical hazard of fires or explosion, and broken glass
and other sharp-edged wastes create mechanical hazards. These hazards, plus
unsightiness, costs of waste disposal, special interest and jurisdictional disputes, threat
properties and other factors provide a basis for potential psychological and behavioral
distrubances. Ahmed, 1982.
9
1-6 Statement of the problem Solid wastes present a many-faceted problem. The disposal of trash around the
country creates litter. Its accumulation in trash cans on city streets attracts rats and
flies, stimulates bacterial growth, and creates a collection problem. When large cities
run out of space to dump the collected trash, a disposal problem is created. Finnally,
the accumultion of rusty old car bodies, cans, botlles, and other recyclable sraps
hasten the depletion of non-renewable resources.
Litter is particularly vexing, because a small percentage of the population is
responsible for a large nuisance.
In this study, Khartoum industrial area is taken as a case study, because it is
one of the most important industrial areas in the Sudan.
The area between the Blue Nile and the White Nile is rich in small industries
and some large ones which include Khartoum tannery and the White Nile Tannery,
The Sudan Mit, cars workshops, asbestos factory……….. etc.
These industrial could create intensive waste problems of local nature. It
constitutes potential environmentally hazardous site in Khartoum and it may have
asignificat impact on well-being and health of the surrounding environment.
Solid wastes in Sudan are causing real environmental problem. No modern
waste treatment practices are applied and even the planning of existing dumping areas
is questionable.
1-7 Hypothesis Management failure results into accumulation of solid waste and
environmental degradation.

10
1.8 The Objectives of the Study:- 1-8-1 General objective:
To assess the situation of solid waste mangement in Khartoum industrial area.
1-8-2 Specific objectives: 1. To investigate various methods (systems) used in solid waste collection,
treatment and disposal.
2. To determine the quantity and composition of solid waste in the area.
3. To study the situation of solid waste workers (educational level, health,
services provided ….etc) and to high light on the solid pickers and brokers
phenomena (situation) a round the dumping area.
4. To identify the public health risks and ernvironmental impacts of the
industrial area.

11
Chapter
Two

11
Chapter II
Literature Review
2.1 Definition of Solid Waste: Solid waste is a terminology used world-wide. There are many
definitions of solid waste. According to sources, solid waste can be defined as:
Any garbage, trash, rubblish, waste tire, refuse, sludge from a waste treatment
plant, waste from supply treatment plant or pollution control facility and other
discarded materials, including solid. Liquid, semi solid or contained gaseous
material. (Internet).
The non-liquid wastes which result from various types of human activities
being domestic, professional, commercial, industrial, agricultural or mining.
A simplified definition of soild waste would include garbage, trash, recyclable
materials, yard waste, and from industrial and commercail sources. It does not
include hazardouss waste from businesses. (Internet).
(Adogjok, 1997) define solid waste as any solid matter which is discarded no
longer useful in economy, consisting of organic and Inorganic matter in a wide
variety of forms.
He also considered that solid waste involve all the waste arising from human
and animal activities that are usually solid and are discarded as useless or unwanted,
including and ecompassing the heterogeneous mass of throw aways from residences
and commercial activities as well as the more homogeneous accumulations of a single
agricultural or industrial activity.

12
2-2 Classification of solid waste: 2-2-1 According to American public works association soild
wastes can be classified according to type and sources as follows:
1. Home garbage: wastes resulting from preparation of food and different types of meals.
Homes, restuarants and hotles are considered as the main sources.
2. Rubbish : These comprise the combustible waste and include papers and carton and
material from which they are produced especially packaging bottles encasement,
wooden boxes and barrels, tree branches, wooden wastes and their products and
plastic materials in addition, non-commbustible wastes such as metal pieces metal
furniture, glass, and metal barrles.
3. Street refuse: These are dust, tree leaves and others that are collected from city venues and
streets.
4. Metals and abandoned vehicles: This include types of metal parts, like air conditioners and others and car.
Lorry, agricultural machinery junks and used spare parts.
5. Industrial wastes: Is all solid waste generated from industrial or manufacturing process and solid
waste generated from manufacuring activites such as service and commercial
establishments. Some are chemical in nature, others are very toxic. Other are organic
compounds of different structures or crude (petroleum) or artificial oil.

13
6. Waste of food industry. A bottarr and chicken farms: These are solid waste rich in organic substances that are biodegradable (easily
decomposed) like plant and animal remnants.
7. Demolition waste: From the processes of destruction and construction resulting into dusts, bricks,
stones and concrete parts.
• Special waste: Include types of wastes of particular specification like exploisives, radiation
from radioactive materials (wastes from scientific institutes and hospitals that use
radiation) and toxic wastes containing sprays, factories that use heavy metals, hospital
wastes containing disease germs.
These waste are termed toxic or hazardous wates.
2.2.2 Solid wastes can also be classified as follows:
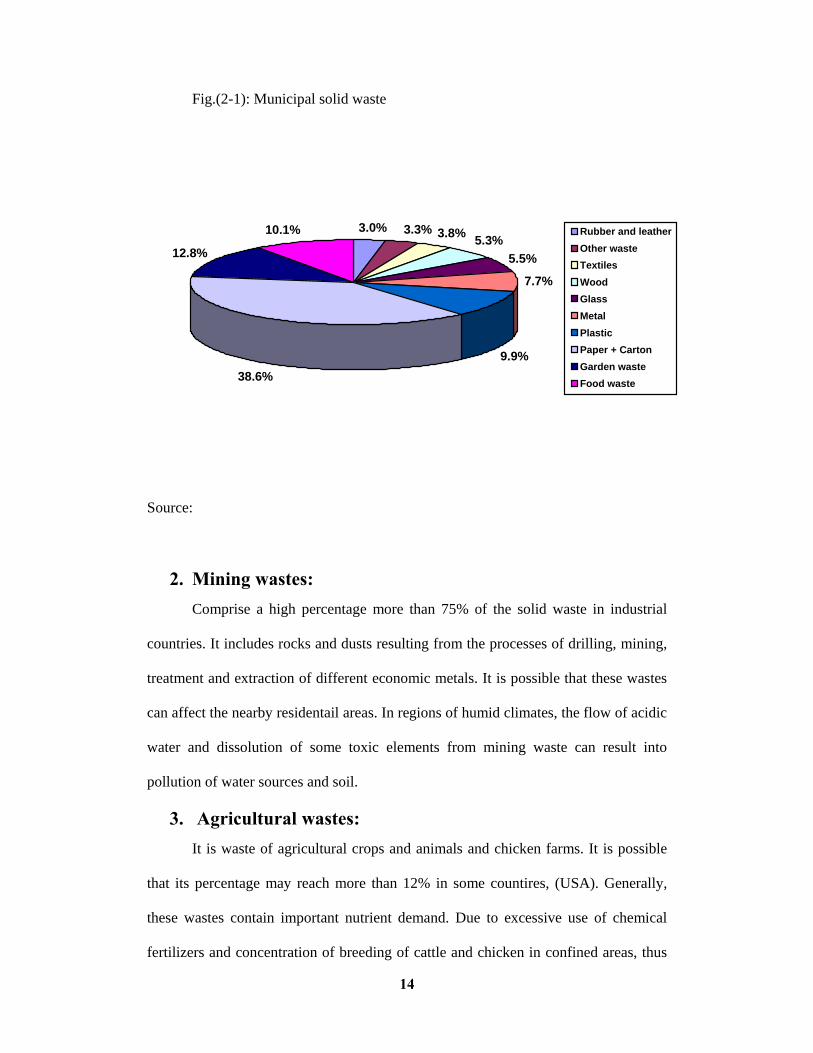
1. Municipal Solid Waste: Comprise about 13% of the solid waste that result from various residential
areas, companies and small industries. These waste comprise mixture of
heterogeneous paper, carton, fire wastes, glasses, rubber, textile, food waste and
plastics.
Figure(2-1) below shows municipal solid waste. It appears that paper waste
form a greater percentage.
14
Fig.(2-1): Municipal solid waste
3.0% 3.3% 3.8% 5.3%5.5%
7.7%
9.9%38.6%
12.8%
10.1% Rubber and leatherOther waste TextilesWoodGlassMetalPlasticPaper + CartonGarden wasteFood waste
Source:
2. Mining wastes: Comprise a high percentage more than 75% of the solid waste in industrial
countries. It includes rocks and dusts resulting from the processes of drilling, mining,
treatment and extraction of different economic metals. It is possible that these wastes
can affect the nearby residentail areas. In regions of humid climates, the flow of acidic
water and dissolution of some toxic elements from mining waste can result into
pollution of water sources and soil.
3. Agricultural wastes: It is waste of agricultural crops and animals and chicken farms. It is possible
that its percentage may reach more than 12% in some countires, (USA). Generally,
these wastes contain important nutrient demand. Due to excessive use of chemical
fertilizers and concentration of breeding of cattle and chicken in confined areas, thus

15
agricultural waste became enviromental problem, the process of soil erosion and
organic matter from fields have negative impact on environment, especially running
water cut pollution by pesticides and chemical fertilizers .
4. Industrial solid wastes: Industrial solid wastes differ according to the industry and production method
except the hazardous industrial solid wastes , industrial wastes include paper , carton ,
wood , glass , plastic and organic matter,metals, rubbercuboards and other wastes.
Solid industrial wastes are generally understood to be those wastes which arise
from inustrial process and legal definition may include all wastes produced on
industrial premises, wether those wastes are produced from a manufacturing process
or not. In either case they include the excess materials discarded by the mannfacturer
as non-reclaimable , or as being uneconomical to reclaim .
Industry ,especially the process industries, produced solid , semisolid ,
liquid or gaseous wastes which must be disposed of with in the framework of the law .
unfortunately the law is not all-embracing so far as it concerns the disposal of wastes.

16
Fig (2-2) the material flow and generation solid wastes in a technological society.
Raw Material
Manufacturing
Process and Recovery
Secondery Manufacturing
cousmuer
Final Disposal
Residentialwaste Material
Residual Debris
Source : Ahmed, 1982

17
2.2.3 Solid waste may also classified as Hazardous and Non-
hazardous.
1. Non-Hazorlous waste: These do not pose any substantial danger to living organisms immediatley or
oner period of time. Household refuse (or domestic solid waste may contain small
quantities of hazardous waste such as batteries and empty pesticicle contianers. These
small quantities of hazardous material in non-hazardous waste are of an increase in
many countries.
2. Hazardous wastes: Certain industrial and institutional wastes are categorized as hazardous or
toxic because of special care needed for their storage and disposal to ensure that they
are isolated from human environment. Most toxic wastes come from the chemical
industry but others, including the metal, petroleum, transport, electrical equipment,
and leather and tanning industries, also produce significant quantities of hazardous
waste. Sewage sludge and hospital wastes are also considered hazardous.
The nature of hazardous wastes varies consideredably. Some are highly
flammable, as are many solvent used in the chemical industry, reactive and can
explode or generate toxic gases on contact with water or another chemical; some,
such as sewage sludge or hospital waste, may contain disease-causing agents.
Some wastes are highly toixc, for instance cyanide, arsenic, and many heavy-
metal compounds, and many are carcingenic.
The nature, amount, and wide distribution of hazardous wastes and their
potential danger to health have been recoginzed only in the past 15 years. The United
States provides an example of the magnitude of the problem they create. Because little
consideration was given to the regulatory aspects of hazardous wastes during the

18
nineteenth and much of the twentith century, there are now some 5000 land sites in
that country where hazardous wastes may have been dumped with out control and
without provision to ensure that the wastes do not pollute the ground water.
The cost today of having to deal with the result of many years of inadequate
control runs into thousands of millions of dollars. The controlled disposal of
hazardous wastes cost US$ 19000 million in 1988. WHO, 1992.
Korea 1983 Sweeden 1985 UK 1986
Fig. (2-3) Hazardous waste treatment and disposal in selected countries.
Source: UNEP, (1989. 1990)
Landfill 22%
Landfill 82%
Re-usey recycle 25% Incineration
20%
Landfill 41%
Under ground 14%
Re- used recycle 69%
Incihertion 9%
Dumping at sea 8%
Phs/chem treatment 8%
Re- use recycle
Landfill 22%

19
Table (2-1): Some industrial operations that produce hazardous solid waste.
Natural gas production (mercury contianing sludge and filter material, sulphur
containing reisdues)
Production and application of zinc, production and zinc oride, (zinc ashes and slags,
jarosite)
Production and application of lead (lead ashes and slags, lead containing filter dust)
Production and application of arsene (arsene containing filter dust)
Production of cost iron (furnace dust)production of iron and steel with ozyconverters
or electro funrances (filter dust, fly as, other dusts)
Production of primary and secondary aluminium (filter dust, electrode residuses,
furnace bricks)
Production or application of photo – chemicals (residues of fixation, developing and
bleaching agents)
Production and application of asbestos and asbestos containing materials (asbestos
containing residues)
Removal of paint layers by means of blasting (paint residues)
Production and application of paint, lacquers, varnishes, inks and coating (resides of
paint lacquers, varnishesm inks and coating which have not fully hardend, sludge
from water treatment.
Production and allocation of glue, adhesives and resins (residues of glue, adhesives
and resins (not from animals) which have not full hardened, resins, oil residue)
Production and application of latex (residue of latex emulsion, not fully hardened)
Production and application of paint removers (residues)
Printing and photo –coping with liquidous inks (residues of ink, cleaning solvents,
etc)
Production and application of enamel (enamel sludge and residues)
Pruction of chlorine with the diaphragm-electro process (asbestos containing
residues)
Manufacture of metal products (selene containing metal waste, beryllium containing
metal waste, cooling liquid based on oil products, oil, water sludge mixture)
Source: UNEP, (2001)
20
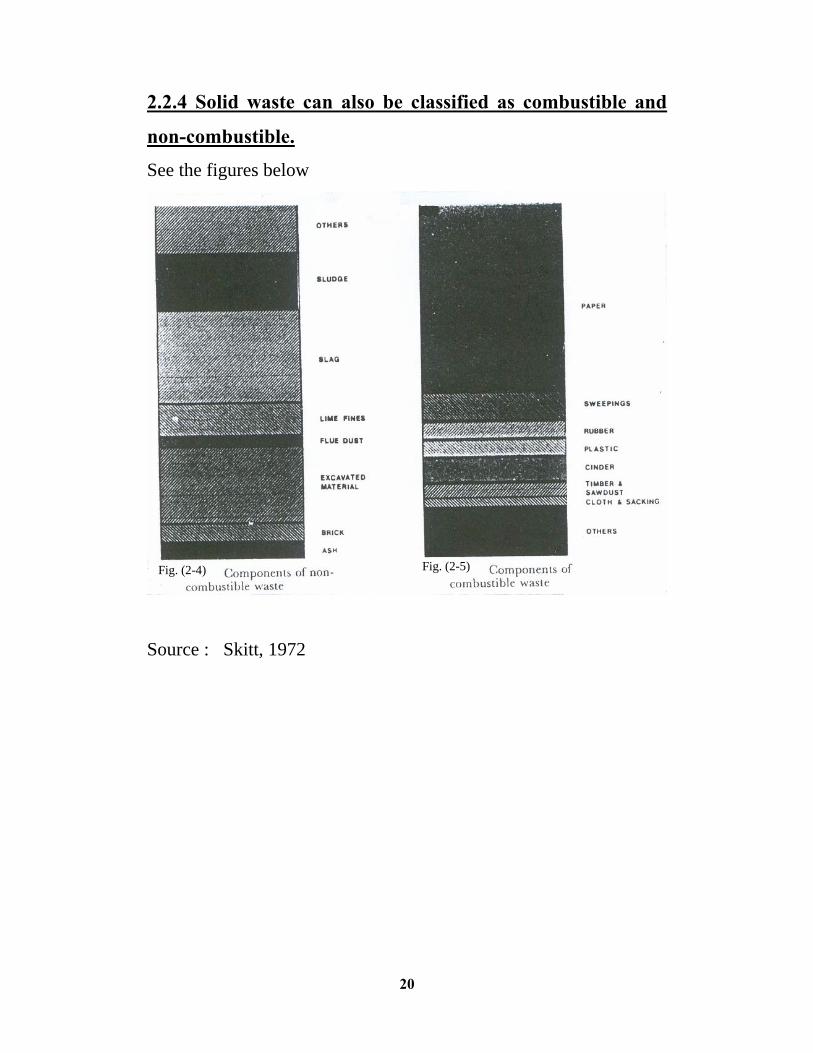
2.2.4 Solid waste can also be classified as combustible and
non-combustible.
See the figures below
Source : Skitt, 1972
Fig. (2-5) Fig. (2-4)
21
2.3 Enviromental Impact Resulting From The Accumulation
or solid Wastes: 1. Multiplication of bad odours.
2. Multiplication of flies and other disease vectors such as cockroach and
rodents.
3. Spread of harmful animals which transmits harmful diseases.
4. Jamming of traffic and hinderance of transportation.
5. Rise-up of dusts and the pollution of underground and surface waters.
6. fire Outbreak which leads of smoke and ashes.
7. Bad effects to beauty values of the area.
2.4 Solid waste in developed countries. Solid waste generation, both municipal and industrial, continues to increase
world wide in both absolute and per capita terms.
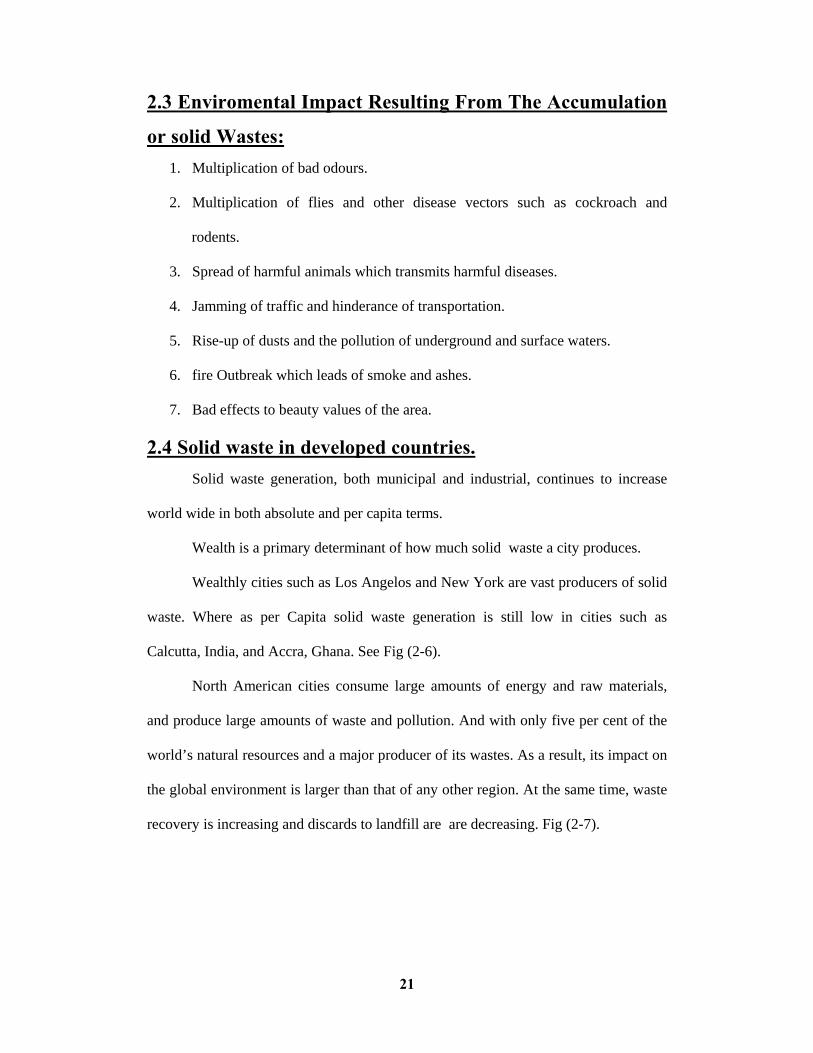
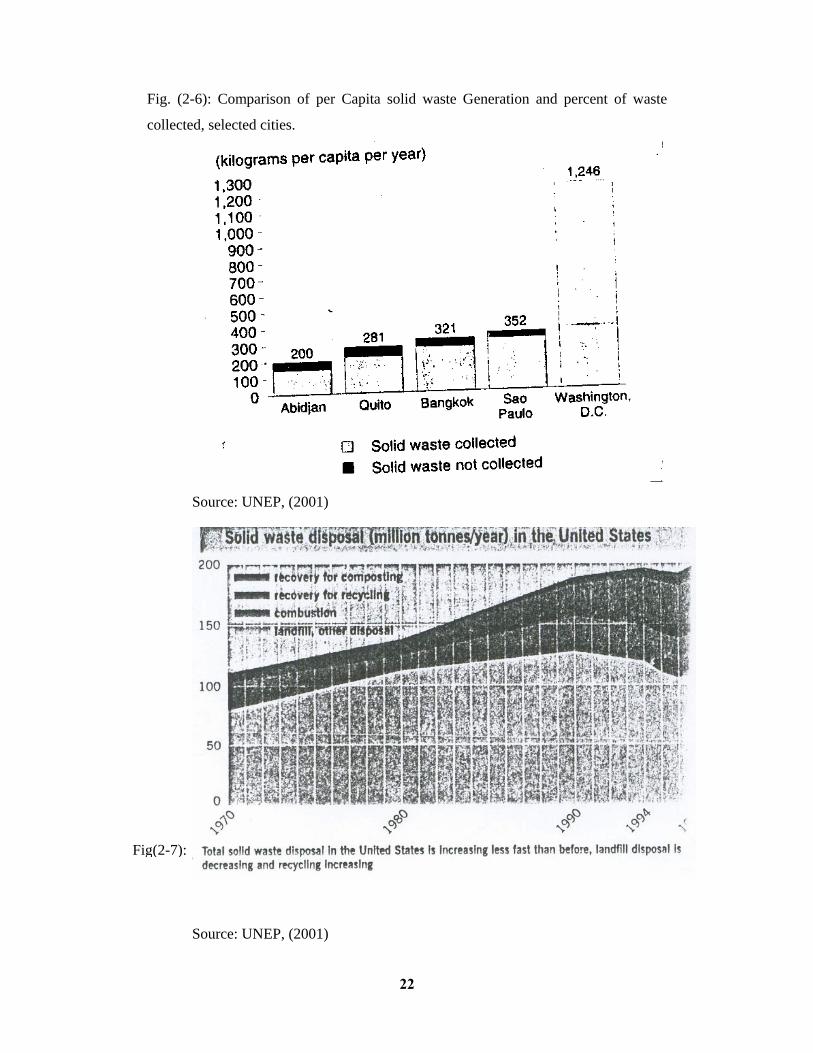
Wealth is a primary determinant of how much solid waste a city produces.
Wealthly cities such as Los Angelos and New York are vast producers of solid
waste. Where as per Capita solid waste generation is still low in cities such as
Calcutta, India, and Accra, Ghana. See Fig (2-6).
North American cities consume large amounts of energy and raw materials,
and produce large amounts of waste and pollution. And with only five per cent of the
world’s natural resources and a major producer of its wastes. As a result, its impact on
the global environment is larger than that of any other region. At the same time, waste
recovery is increasing and discards to landfill are are decreasing. Fig (2-7).
22
Fig. (2-6): Comparison of per Capita solid waste Generation and percent of waste
collected, selected cities.
Source: UNEP, (2001)
Source: UNEP, (2001)
Fig(2-7):

23
Light weight but high-volume materials such as paper and plastic are replacing
dense and heavy materials in waste stream which increases waste volumes.
The continued use of older technologies, coupled with a consumer life style
based on the desire for mobility, convenience and product disposalility, has limited
the further advancement of resource efficiency and waste reduction (UN 2001).
In the Europe, waste generation per capita from household and commercial
activties, which constitutes only part of the total amount of municiapal wate, already
exceeds the target of 300 Kg per capita per year set in the EU’s fifth environmnetal
actions plan (EEA 2001) by 100 Kg. Most European countries have recycling
schemes, particularly for paper and glass – athough this development has been only a
partial success because the generation of wast paper and glass has also increased.
Sludge from urban waste water treatment plants is estimated to have increased
in the EU from 5.2 to 7.2 million tonnes dry solids during 1992-98, and further
growth is expected. (EEA 2001).
Such vloumes are increasingly difficult to obsorb through incineration,
dumping in landfills and recycling in agriculture. The problem is being compounded
by the fact that sludge is often contaminated with heavy metals and other toxic
chemicals, which even in minute concentrations can affect human health.
In most European countries, landfilling is still the most common treatment
route for waste, even though there is an increasing shortage of avilable sites. This is
because, in both Western and Eastern Europe, recycling is rarely econonmically
viable. However, producer responsibility for the environmentally sound disposal of
packaging and products is achieving widespread acceptance. (UNEP 1996).
24
Different approaches have been adopted in different countries. Germany is
shifting responibility for managing packaging waste to industry as a mandate, while
in france agreements are mostly voluntary although stringent reporting is required.
In France, municipalities remain resposible for waste collection but industry
has been made responsible for recycling of only certain materials.
In the United Kingdom, all companies involved in the packaging chain are
required to meet a share of the total responsibility: 47 per cent for retailers, 36 per
cent for packers and fillers, 11 per cent for converters, and 6 per cent for raw material
manufacturers.
2.5 Solid Waste In Developing Countries In developing countries, the environmental impacts of improper solid waste
disposal are especially severe. In many cities, only 30 to 50 per cent solid waste is
collected the rest is either burned or dumped in unregulated landfills. Uncontrolled
disposal of urban waste into water bodies, open dumps, and poorly designed landfills
is a principal cause of surface water and groundwater contamination.
Many cities dispose of househlod waste along with industrial wastes,
exacerbating pollution problem. In China, for example, most toxic solid wastes are
disposed of in municipal waste stream without treatment, leading to contamination of
sources and water bodies with heavy metals such as mercury, chrumium, lead, and
arsenic. These toxic can threaten or destroy marine life.
A cross Africa, only 31 percent of solid wastes in urban areas are collected.
Inadequate urban infrastructure leads to untreated waste and waste remaining
uncollected or improperly disposed of.
Only 2 percent of Africa waste is recovered and recycled. (UNCH 2001) due
to lack of economic incentives and markets for recycled materials. The most
25
commonly recycled materials are paper, textiles, glass, plastic and metal. Composting
is carried out to some extent in Egypt, Morocco and Tunisia.
In Asia, much of the solid waste generated in urban centres remains
uncollected and either desposited in surface waters and empty lots, or burned in
streets. This problem has warsened over the past 30 years. Collected waste is mainly
disposed of in open dumps, many of which are neither property operated nor
maintained, and which pose a serious threat to public health.
Only a few Asian cities such as Hong Kong. Singapore and those in Japan,
have adequate solid waste disposal facilities, but even these cities have problems in
dealing with increasing volumes of waste.
The disposal and treatment of industrial, toxic and hazardous waste also
causes a serious problems. Dumping of hazardous waste is common in South and
South east Asia. Countries such as Bangladesh, India and Pakistan have become
dumping grounds for significant quantities of hazardous waste from industrialized
countries, and are facing growing protests about-related pollution.
The lack of emission standards or enforcement of regulation in many
developing nations compounds pollution problems. In addition, industrial activity in
developing world tends to be concentrated in relatively few locations, often close to
city centres.
Three quarters of all Thai factories delaing with hazardous chemicals are
located within Bankok’s metroplitan area and neighboring provinces. This includes
five of Thailand’s seven lead smelting plants and more than 90 percent of its
chemical, dry-cell battery, paint, pharmaceutical, and textile manufacturing plants.
The concentration of people close to these industries increases the risks of
exposure.
26
Disposal of solid waste in legal landfills, as is the norm throughout the united
states and Europ, a verts many of these problem. Recycling plays a large role in solid
waste management, especially in the cities in the developing countries, and should be
encouraged not only to reduce the need to dispose of vast amounts of waste but also to
protect new raw materials from extraction and use.
2.6 Solid Waste Management in Khartoum Province – Sudan Most of the studies carried out in the cities (Arabic or foreign) showed great
interest of the municipalities adminstration on environmental health because it is
essential for the life of humans and their socic-economic activites.
In Khartoum State, there was no system that matches the systems of solid
waste management in cities of the world, in which the management operations during
the past periods flactuate between political decrees and the capabilities available.
There were a number of decrees issued concerning the importance of waste
management, sometimes these decrees were issued by the localities, another time by
the ministry of health and once again by the lcoalities, until the decee of establishment
of the national council for the environment which was under the Ministry of Health
and again placed under the localities and the decrees for establishment of firms for
such matters.
All these resulted in the decline in the environmental health and the national
capital turned into dumping sites.
Thus, Khartoum became surrounded by wastes from all directions and the
spread of aimless dumping sites in all places resulting into heaps of wastes covering
the main streets and pavements.

27
And there became a number of unregulated sites of which the forest area and
the area south of central market and Shaggara dumping area and the the area south of
the green belt north of Mayo residential area and others . Plate (1).
In general, wastes in Khartoum province include domestic, commercial and
industrial wastes.
After independence, national governments adopted the philosophy of
promoting industry to diversity the economy of the country. The expansion of
industries and other activities has resulted in many urban solid waste (S.W) in
quantities and in qualities that exceed the capacity of cities and municipalities to
manage.
As for the industiral solid waste, there was no set system for their final
disposal, up to a recent time. Thus, most factories disposed of their waste by
themselves. This is because most of the factories own special means for the
transporting of their waste and disposing of it in the nearest random dumping site,
without any controls.
Also, other rented special cars from local councils for transporting their waste
to outside the industrial area. But; such system exposed them to punishments by the
ministry of Health, for their non-adherence to the health regulation in waste disposal.
There is no differentiation in the treatment of waste in the Sudan. Industrial
and municipal wastes are simply dumped in the same dumping site.
The medical waste are the most hazardous, until now there is no method for
initial treatment before final disposal. And this is one of the hazards confornting the
whole state not only the province.
Many laws, such as the local government Act 1957, peoples local Act 1981,
the administration of national capital 1983 and the local government Act 1993

28
empowered the inspection. Supervision and final waste disposal and others to local
council through environmental health authorities. And the diseases like malarya.
Bilhariza, dusentry from which cities of the state suffers is the result of environmental
conditions, on the other hand, the responsiblitiy of waste disposal became as
specialized scientific jobs through the supervision and welfare by the Ministry of
Health.
Both localities and Ministry of Health had failed in their trials (experiments)
of improving the capabilities and plans for execution. The failure was due to lack of
vehicles and lack of efficient labours provided by the localities and lack of funds.
All these were obstacles confronting the waste management. Also in addition,
lack of orientation of the available cadres as team Work including all the technical
cadres, management, health, engineering and accounting. All these were carried out
by health inspectors. Moreover, the responsiblitiy for informing the citizens about
health issues.
This lead to the state decree establishing “The crash programme for
environmental sanitation, in April 2001.
Technical cadres were formed comprising health, engineering and
administrative to manage waste in the programme responsible for cleaning as
fundamental (basic) work to manage the final waste disposal through specialized
bodies with less responsiblities as in the localities.

29
2.6.1 Objectives of crash programme
1) General objectives 1. Cleaning of localities of Khartoum Province in accordance with modern
methods and means in keeping, collecting, transporting and final disposal.
2. Minimize chances of multiplication of disease vectors.
3. Elimination of negative concepts (attitudes) or phenomena:
Specifc Objectives: 1. Adoption of the modern scientific techniques for treatment of hazardous waste
(Medical and industrial).
2. Submission of alternatives to methods of treatment (storage, transportation
and final disposal).
3. Formulation of Standards and references Specific for these roles.
4. Building of Discharging modern discaders in accordance with the Engineering
and health standards.
5. Formation of a modern scientific information system to open more horizons
of studies for promotion of the servies.
6. Coordination between the project and the related bodies (drainage sewage –
Town water- The Khartoum beautification company – Engineering
Administrations of the localities).
The crash Programme for environmental sanitation in Khartoum State has many
positives. It is considered a real addition to the public cleaning work and transporting
of the waste matter in the state. There also come a time when the state was in bad
need to such cleanliness, owing to the deteriorating situation because of the lack of
financing and meagre budgets. But the implementation of the crash programme which
carrys the name “Environmental sanitation came without the participation of the
30
ministry of Health, which is the only resposble, technically, about environmental
reform, according to specified scientific standards, measures and specifications. Even
if this matter was assigned to any other Department, it is seen very important that
there is a necessity for providing role for the Ministry of Health and its apparatuses in
the provinces and municipalities, through supervision, follow up and evaluation.
2.6.2 Notes about the crash programme: 1. The Ministry of Health has no role in this programme, whether in the stage of
preparation or through the planning, programming and implementation stages.
2. There is no coordination or mechanism which provide any information to the
Ministry of Health, or submit any report about the programmes. This confirms
the inability of the Ministry to perform the tasks of follow up, evalustion and
supervision
3. The presence of the Health inspectors and Health officers in the Programme
does not mean the existence of the Ministry of Health, as they were recruited
in their personal capacities, without reference to the Ministry of Health.
4. The programme was started in the heart of Khartoum, a way from the marginal
areas, such as, East of the Nile Region, Umbadda and the rural localties of the
province where the environmental degradation and the extended random
accumlations of waste matters, garbage, human waste matters and animal dung
had reach great heights.
5. There is no efficient control on the dumping site as a result some of the
residential areas particularly El-Gooz (about 2 km from sanitary lanfill area)
complaints of huge number of plastic bags and papers carried by the wind
containing pungent odour.

31
6. Landfill Operation is not a ccomplished via scientific method. Healthy
dumping site should include plastic layer, Fig.(2-8) that prevent infilteration of
toxic wastes contents into underground water. This is not available in Sudan
due to lack of resources.
Fig.(2-8): A Healthy dumping site.
Source:
Control well
Aeration Control well
Plastic layer
Water flow
Liquid collection Pipe
Layer of sand soil Solid waste
Surface and compact clay

32
2.6.3 The envrionmatal Health Legislation
The legislation dealing with resource use and human activities in the Sudan are
fragmented and do not contain adequate provisions for evironmental health protection.
The Environmental Health Act of 1975 deals with provisons dealing with pollution by
waste and the measures for their prevention and control. This act represents the
government’s degree of awarness and commitment to environmental health issues.
The intention of the central government in this legislation is to enable lower
institution at the state, provincial and district levels to protect the environmental
health. Unforunately these institutions are not delegated sufficient powers to lay down
regualtions necessary to implement the laws. It is as if these laws never existed since
they are continuously being viloated as reflected in the misuse of natural resources,
uncontrolled fires, environmental pollution from domestic wastes and human refuse,
industrial waste, spraying of chemicals and disorganized keeping of domestic animals.
The ineffectiveness of these laws is mainly due to the inefficiency of the law
enforcement machinery.
This law is not only fragmented but sometimes conflicts with it self. It is more
conservation and less developmentally oriented and does not take modern resource
management principles into consideration. Because of decentralization and the
limitations of state and district legislative activites, inconsistencis often prevail. The
following legal constraints related to these inconsistencies are identified.
The inadequacy of the present Environmental Health Proctection Act; penalties
and remedies for breach of Environmental Health Act are generally light and not
compatible with the offense and the resulting damage (i.e not based on both criminal
and civil laws to give adequate powers of punishment and restitution in providing to
payment of compensation.
33
• The legislation only deals with offenses and not with the obligation of the
persons towards the environmental health.
• Little reference is made to environmental health protection implemented by the
private sector such as in road construction, provision of drainage systems and
buildings and above all collection and disposal of solid wastes.
• Envrionmental health protection legislation is not adequately incorporated into
land use legislation and other relevant laws.
• Customary laws dealing with environmental health protection issues are not
adequately put into consideration.
• The 1975 envrionmental Health Act does not provide clear guidance on whether
the local authorities are under an obligation to remove injuries for which no one
can be identified as resposible to remove.
• The decisions of policy makers and executors are not based on valid
envrionmental health criteria. They are not free from extraneous or outside
influences from the government, business or commercial sectors. (adjgok, 1997)
34
2.7 Waste Management 2.7.1 Background
Waste management is an important part of the urban infrastructures as it
ensure the protection of the environment and of human health. It is not only a
technical environmental issue but also a highly political one. Waste management is
closely related to a number of issues such as urban life styles, resource consumption
patterns, jobs and income levels, and other socio-economic and cultural factors.
(Internet).
One charateristic feature of sustainable waste management is that it is
achieved by using the technical, organisational, and financial resources available in a
particluar locality.
The waste management situation in the countries around the world is by no
means uniform. The vast majority of countries are busy struggling with such basic
issues as ensuring sufficient collection services and implementing a minimal degree of
control at disposal sites at the same time as they are facing increasing waste amounts
due to the trend of urbanisation. They also lack the technical and financial resources
to safely manage solid wastes. Which includes adequate provisions for sorting the
waste at the point of generation as well as efficient and sufficient collection services.
Final disposal in those countries is usually a matter of transporting the collected waste
to the nearest available open space and then discharging them.
However, important progress has been made in the waste sector over the last
few years. The most improvement is the increased level of awarness among both the
public and politicans. This is the first step to ensure that action is taken and resources
are allocated accordingly. On the other hand, the availablitiy of resources is closely
connected to the economic situation and waste management still holds a weak
35
position in this context compared development is also closed linked to the generation
of waste, the last couple of years with strong economic development have resulted in
increasing waste quantities.
2.7.2 Solid waste management: Standards apply to all aspects of solid waste management including waste
storage, collection, transfer, resource recovery, and final disposal. They include
technical and operational standards, which apply to solid waste storage, collection,
transfer, and disposal as well as the management, operation, and maintenance of solid
waste facility. They also include regulations on waste reduction and recycling.
Bernstein, 1993.
Technical and operational standards relating to solid waste collection specify
types of storage bins, locations for pick-ups, and the amount or types of waste to be
collected. They also specify the frequency of collection (for example, one or twice a
week in residential areas) as well as requirements for the collection vehicles
themselves. Standards have included noise emmission requirements for truck chassis
and refuse body compaction mechanism as well as requirement for computerized
braking systems for air-barked trucks. Some jurisdictions require the collection
vehicle to be covered at all times except while loading and unloading. Other
jurisdictions require the vehicle to be maintained in good repair and emptied every
night.
36
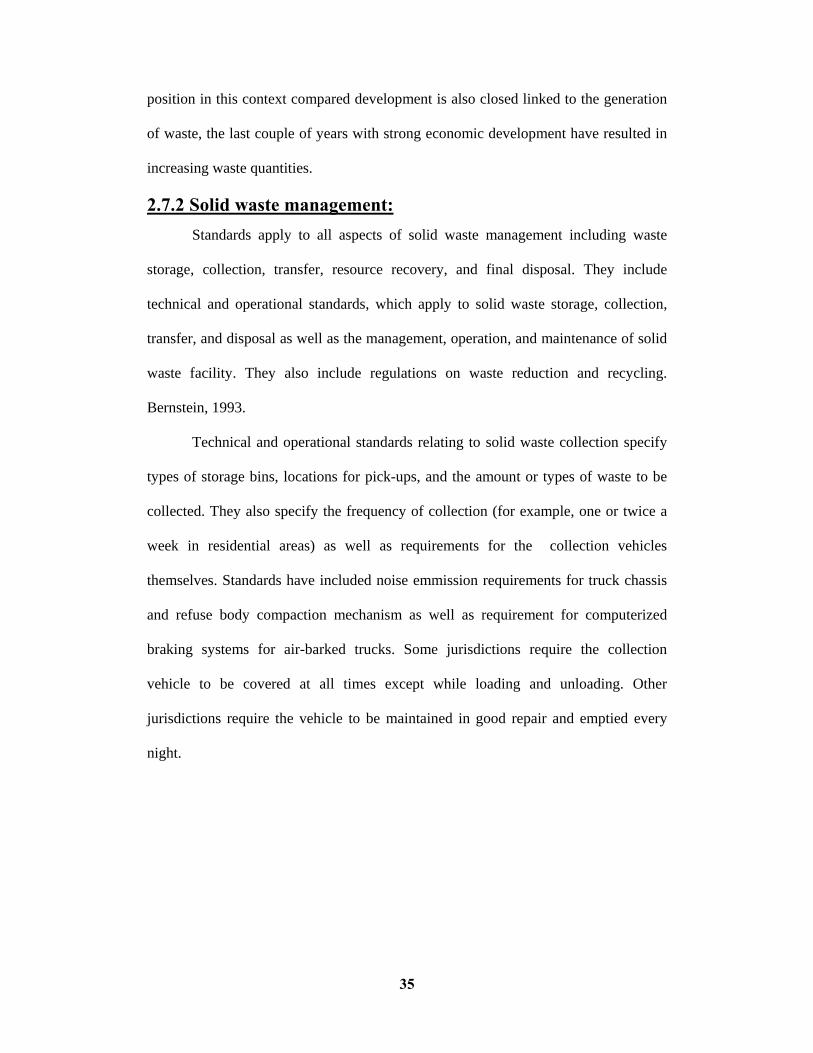
Fig.(2-9):Interference of causes and effects of inadequate waste management.
Source: Internet.
2.8 Solid Waste Generation: Solid waste generation rates do vary from one area to another, due to factors
such as economic status, social habits and season, as well as and extent of salvage and
recycle operations. Generation rates in the urban areas are generally higher than for
the rural areas. Nema, 1998.
In considering any waste management policy, it is necessary to consider the
nature and quantity of waste arising. This will allow policies to be formulated on the
type of storage facility provided, the type of collection method adopted, the type of
transport requried, and the options available for treatment and ultimate disposal.
(Crawford et al, 1989).
37
It is particularly important to indentify variations in the nature and quantity of
arising and attempt to project trends for the future. The most accurate method of
identifying the nature and quantity of arising is to carry out detailed surveys. It is
worth while here to consider the factors which will define whether waste materials
will require to be collected.
2.9 Storage of solid waste. Storage of solid waste can be devided into two categories, namely, primary (or
on-site) and secondary storage. Primary storage refers to the temporary holding of the
solid wastes at or close to their point of generation, and often involves use of
containers such as household and public bins, skips or open dumps.
Secondary storage refers to that occuring at an intermediate point between the
primary storage stage and the altimate disposal of the waste. Nema,1998.
The method of storing waste materials varies through out the world and will of
course depend very much on the nature and quantity of waste arising, the method of
collection and transport used.
Waste from industrial and commercial premises can be stored in much larger
containers. These are normally formed in mild steel and can lossely be classified as:
1. Demountable containers.
2. Non-demountable containers.
3. compaction containers.
Demountable container refer to containers which are located in position by
specialist vehicle which can also up lift a container, transport it to suitable disposal
site and empty it.
The most common example of this the “skip” regularly found near building or
demolition sites but larger containers range from 4.5 to 33 m3.

38
Non- demountable containers are designed for use with mobile compaction
collection vehicles. These containers remain on site and when full are emptied by a
visiting vehicle. The containers are designed for use with waste materials which can
be compected compaction containers are totally enclosed and are designed for use
with a static compaction mechanisom which is usually bolted to the ground. This
system is not suitable for use with waste that cannot be compacted. Containerized
system are generally only suitable for solid waste, if liquid storage has to be provided
then specially prepared storage tanks or lagoone are used.
2.10 Waste Collection : In most cases the solid waste problem begins with collection. In considering
the orgnanization of waste collection services the person responsible must take
account of the following:
1. The number and type of properties to be serviced.
2. The location of waste disposal sites.
3. The number and type of waste collection vehicles.
4. The number of personnel available.
5. Other factors such as collection policies.
At the oustset it is necessary to define the collection frequency. For domestic
collection services it is normal to provide one collection per household per week
while for trade and business premises (especially in busy high streets) a daily
collection may be required. The distance between the collection area and the disposal
sites is critical. If specialist collection vehicles are to be used, then the time spent
collecting waste should be maximized and the time travelling to disposal sites should
be minimized. In some cases refuse tranfer stations may be required.
39
The collection services which are provided for industrial and commercial
wastes vary some what from those which are required for municipal wastes. Much
depends on the form of contract which the contractor has with the customer. Contracts
range from a prescribed number of containers being emptied in a given time (e.g two
containers per week) for a weekly contract price, to the situation where container are
empited on request by the customer for an agreed charge. In many cases a container
rental charge is applicable. Where elemountable containers are used the contractor
tends to exchange the container. This means that his driver arrives with an empty
container, exchanges it for the full container which is then subsequently emptied and
used as the exchange for the next customer. This obviously saves drivers’ time and
running costs. The only drawback’s where one customer produces an obnoxious
waste. The residues of which adhere to container which is then sent of a customer
who has a high standard of housekeeing.
It should be obvious that a significant part of the success of any refuse
collection service (whether private or public sector) is based on vehicles. All vechiles
used in refuse collection must be subject to rigorous road traffic legislation requiring
annual testing, special driving licences for the operators, and rigorous examination by
the statutory authorities in addition to the attentions of the police. The nature of the
compaction mechanism requried to compress refuse is such that it regularly attracts
the attention of the Health and safety inspectorate. A considerable amount of the costs
of refuse collection is taken up by transport
2.11 Transfer and transport: There are two steps involved in the transfer of waste. Firstly, the transfer of
wastes from smaller collection vehciles to large transport equipment and secondly, the
subsequent transport of the wastes, usually over long distances to the disposal site.

40
The transfer usually takes place at a transfer station. The design of a transfer station
must include factors such as the type of transfer operation to be used, capacity
requirements, equipement and accessory requirements, as well as environmental
requirements.
There are three types of transfer stations depending on the methods used to
load the transport vehcile viz direct discharge, storage discharge and combined direct
and storage discharge. In a direct discharge transfer station, the wastes from the
collection vehicles are usually emptied directly into the vehcile used to transport them
to the place of final disposal. These are usually contructed in a two arrangement and
employ stationery compactors (Heeramun, 1993).
In a storage discharge trsanfer station, wastes are emptied either into a pit
storage or onto a platform from which they are loaded into the trasport vehciles by
various types of auxiliary equipment. Some transfer station use both direct discharge
and storage discharge methods as multi-purpose designed to serve a broader range of
users. These can also house a material salvage or solid wastes production area within
easy access to roads; where there will be minimum of public and environmental
objection; where construction and operation will be most enconmical.
2.12 Refuse transfer stations: Waste disposal sites have tended to become more distant from waste collection
centres. This is due to the most suitable sites being used up coupled with the increase
in size of many major towns. At the same time the general public has becaome more
enviromentally a ware of hazards of waste dispoal sites, and proposals for new sites
are generally met with strong opposition. Also refuse collection vehicles have become
far more sophisticated and have therefore become more expensive, when the vehicle
has to spend a considerable amount of its time travelling from the collection area to
41
the disposal sites and proposals for new sites are generally met with strong opposition.
Also refuse collection vehicles have become far more sophisticated and have therefore
become more expensive. When the vehicle has to spend a considerable amount of its
time travelling from the collection area to the disposal site the transport cost of refuse
collection then becomes significant. The problem is compounded by vehicles
travelling to the disposal site at the end of their collection period. In many cases this
may not coincide with the vehicles being completely filled.
One solution to the problem is to construct a refuse transfer station near the
heart of the collection area. In the station reufuse is transferred from sophisticated
collection vechicles into bulk transport vehicles which then travel to the disposal sites.
The bulk transport vehicles are normally fitted with some form of compaction and
there are documented cases where the railway net work has been used to good
advantage. The use of transfer station means that every trip to the disposal site is
made with the maximum payload. The collection vehicle’s time can be maximized
collecting and not travelling. The collection vehicles are kept a way from the disposal
site which means that there is no time lost with transporting crew. Where the disposal
site is a landfill, damage to collection vehicles, punctures, broken springs etc) is
reduced because these vehicles are never on the site. The station also allows storage of
half loads at the ened of a refuse collection period. The design and the capacity of the
transfer station will depened on the nature and quantity of waste arising in the
collection area but it will be obvious that.
Once the station has been established, it will be suitable for a number of
different disposal sites, the only variable being the distance between these sites and
the transfer station.

42
Waste Generation
Storage
Transfer and transport
Processing and recovery
Collection
Disposal
43
Fig.(2-10) Simplified diagram showing inter-relationship of the functional elements in
a solid waste management system.
Source: Heeramum, 1993.
2.13 Disposal Methods:
2.13.1 Open dumping: the most primitive waste repository is the open dump. Waste is collected and,
to save space and transportation costs, is compacted. The compacted waste is hauled
to the dumping site, usually in the morning, and spread on the ground, further
compaction sometimes being effected by bulldozing. Organiz matter rots or is
consumed by insects, by rats or, of permitted, by bags. Various salvaging operation
may go on during the day bottles, rags, knick-knacks, and especially metal scraps are
collected by junk dealers or by individuals for their own use.
In some communities, the accumulation is set a five in the evering (or ir may
ignite spontaneously) to reduce the total volume and to expose more metal scrap for
possible salvage of course, the organic degradation, the burning, and the salvaging are
recycling oprations.
However, there are serious detrimental features to the dump. Its biological
environment differs.
From those that have envolved in natural ecosysterns, and is not controlled by
effective regulatory mechanisms.
The result is that the organisms that multiply at dump are not likely to be the
type that are benign to people. The dump is apotential source of diseases, especially

44
those carried by files and rats. The fires, too, are uncontrolled and therefore always
smoky and polluting. Rainfall enters the dump and removes a quantity of dissolved
and suspended matter, including pathogenic microorganisms, that are water
pollutants. And of course the dumps are ugly. (Stuck et al, 1978).
45
2.13.2 Ocean dumping: Is practiced by many coastal cities. Barges carrying the refuse travel some
distance from the harbor and discharge their loads into a natural trench or canyon on
the ocean floor. In this way most of the trash is removed from sight, though not from
the diosphere. Aquatic dumping areas are almost deviol of communities of benthic
animals, and thus the normal food webs in the ocean are disrupted. Although plankton
and fish may survive in dump areas, they are affected by unusual environment. For
example, flounder caugnt in the former New York city dumping region have had off-
tastes. Analysis of the stomach contents of these fish reveals that old odhesive
bandages and cigarette filters constituted part of the animals diet. Such dietary
aberrations certainly cause foul flavors.
2.13.3. Sanitary landfill: Landfill means waste disposal on land. The practice has had various names
over the years including tips (UK), Sanitary landfill (USA), coups (Scotland,
controlled tipping (UK) and dumps (worldwide). (Crawford et al,1989).
It is the most extensively employed disposal method today, in which waste is
deposited in a tough that has been excavated in a low value area at the edge of town.
Sometimes a borrow pit or a bandoned gravel pit is selected as a site. At the end of
each day’s dumping, the accumutated trash is compacted and then covered with a
layer of soil. This method obviously is superior to the dump-and-burn system, since it
minimizes air and water pollution, restriets fly and rodent brecdigng, and reduces the
possibilities for the dispersal of disease organisms.
When considering landfill as a method of waste disposal the project should be
approached in the same way as the design of a new building, bridge or road. Decisions

46
have to be made on site selection, project extent, finance, construction materials,
method of opration and site rehabilitation.
a. Site evaluation : In considering the preliminary planning of a landfill, consideration should be
given to the following which indicates the ideal landfill site:
1. It should be hydrogeologicaly acceptable, posing no potential threat to water
quality when used for waste disposal.
2. It should be situated so as to give a short haulage distance.
3. It should be free from running or static water.
4. It should be situated at a distance of more than 200 m from any dwelling.
5. It should have good access from road systems and not interfere with existing
traffic patterns.
6. It should have electrical, water and sewage facilities near by.
7. It should have a sufficient store of materials suitable for covering each
individual layer of waste.
8. It should have an estimated life long enough to justify weigh bridge facilities.
In practice most sites cannot meet all these criteria and each site has to be
evaluated in detail and costs of engineering the site to a suitable standard calculated.
The study should take account of the following:
1. The nature and quantity of wastes which are proposed to be handled on site.
2. The compatibility of the landfill proposals with any planning constrains for the
area in which the site is located.
3. The hydrology of the site in terms of both net surplus precipitation and
geology.
4. The preparation works required.
47
5. The method of operation to be adopted.
6. The final reinstatement and subsequent use of the site.
Fig : (2-11) Sanitary landfill operation. The bulldozer spreads and compact solid
waste. The scraper (for ground) is used to houl the cover material at the end of the
days operations.
Note the portable fence catches any blowing debris.
Source: Owen, 1980.
The first stage in any survey of a site for a proposed landfill is to establish the annual
recorded level of precipitation for the site and to plot the monthly rainfall to obtain the
seasonal distribution. A long side this the annual recorded evaporation rates should be
calculated and compared with rainfall distribution on a monthly basis to obtain net
monthly and annual surpluses. The geology of the site is then examined and this
maybe undertaken either by consulting geological survey material or by undertaking
test burings or trial holes on the sites. This should give an indication of the nature and
type of strata surroundings and below the proposed site and may give some idea of the

48
location of aquifers together with flow rates and flow directions. In the development
of any landfill protection must be provided for equifers which contain potable water
supplies.
The site survey will indicate the classification of the site and examples of
classification are shown in Fig. Depending on the outcome of the site investigations
and the classification given to the site, the availability of the site for the proposed
wastes can then be evaluated. It shoul be remembered at this time that in attempting to
meet the criteria for the idea landfill site, various engineering works can imporve the
classification of sites. A good example is the case of the class three site which is lined
with an appropriate material which improves its calssification to either class two or
class one.
Fig. (2-12) Examples of site classification
Source: (Crawford, 1989).
49
b) There are also benefits that may accrue once the landfill sites use for solid-
waste disposal has ended. A few examples follow:
1. Some sites have been converted into recreational facilities. A prime example is
Mile-High studium in Denver, Colorado, where the Denver Broncos football
team now cavorts. Mount Trashmore, a recreational area in Evanston, Illinois,
was also built up from solid wastes. Untill 1965 it was used for disposal of
incinerated residue, at which time it had grown to height of 65 feet and
embraced 48 acres. It was then made available as a recreational area replets
with baseball fields, tennis courts, sled hills, and toboggan runs. During its
first year of operation, 15.000 people made use of the facility. Since it is
becoming progressively more difficult and expensive for municiplaities to
acquire suitable landfill sites, perhaps more trash hills, or even whole
“mountain ranges” may be built in the future.
2. Landfills have also had landscaping value. In England, for example, the “hills”
formed by the soil-and-vegetation-mantled waste have added interest to an
otherwise flat, monotonous terrian.
3. Landfills have been useful in spoil-bank rehabilitation in western Maryland,
where strip mining has left 2.000 ugly scars. According to wilfred shields,
chief of Maryland’s Division of solid wastes, a modified landfill operation will
be used to efface these scars. Waste will be transpoted from 87 roadside and
open burning dumps to a bandoned strip-mine site dissected by 50-foot gullies.
The waste will then be covered with soil from spoil piles left after strip-mining
operations. Not only will aesthetics be improved, but acid mine drainage will
be curbed because of soil compaction, proper grading, and the strategic
placement of drainage canals.
50
4. Former landfill sites on the edge of major cities have converted into
“educational parks” where urban youndsters are afforded a first-hand
opportunity to study wildlife and ecology.
C) Disadvantages : One big drawback to the landfills is that they require large a creages of land.
For example, a town of 10.000 people generates so much trash that a single year’s
production would cover a whole acre to a depth of 10 feet. Gravel pits. A bandoned
stone quarries, marshes and “waste” areas are rapidly being filled up in a major urban
areas such as New York city, philadelphia, and San Francisco. It was estimated that
over 50 percent of the cities operating municipal landfills in 1972 would be forced to
acquire new sites by 1978. Former landfill operations in San Francisco Bay has
caused reduction of bay area and attended disadvantages to shipping, aesthetics, and
marine life.
If the soil and / or rock below the compacted refuse is highly permeable to
water (if it were very sandy or composed of porous limestone, for example infectious
organisms in the refuse may be carried down ward through the soil and rock to a
quifers which provide drinking water for some nearby community. Such imporperly
sited landfills could be the cause of widescale epidemic of disease.
As the garbage and other organic refuse is decopmosed by bacterial activity a
potentially explosive gas, methane, is produced. Orelinarlly the amount of methane
produced is no cause for concern. Howvere, if large concentrations of the gas
accumulate, the possibility exists for an explosion which could be highly destructive
to homes built on the landfill site after it had been filled in.
Typical locations of sanitary landfills in Wisconsin and their effect on surface-
(lackes, rivers) and groundwater quality. Fig.(2-13) Rating of sites: A- Hgih potential
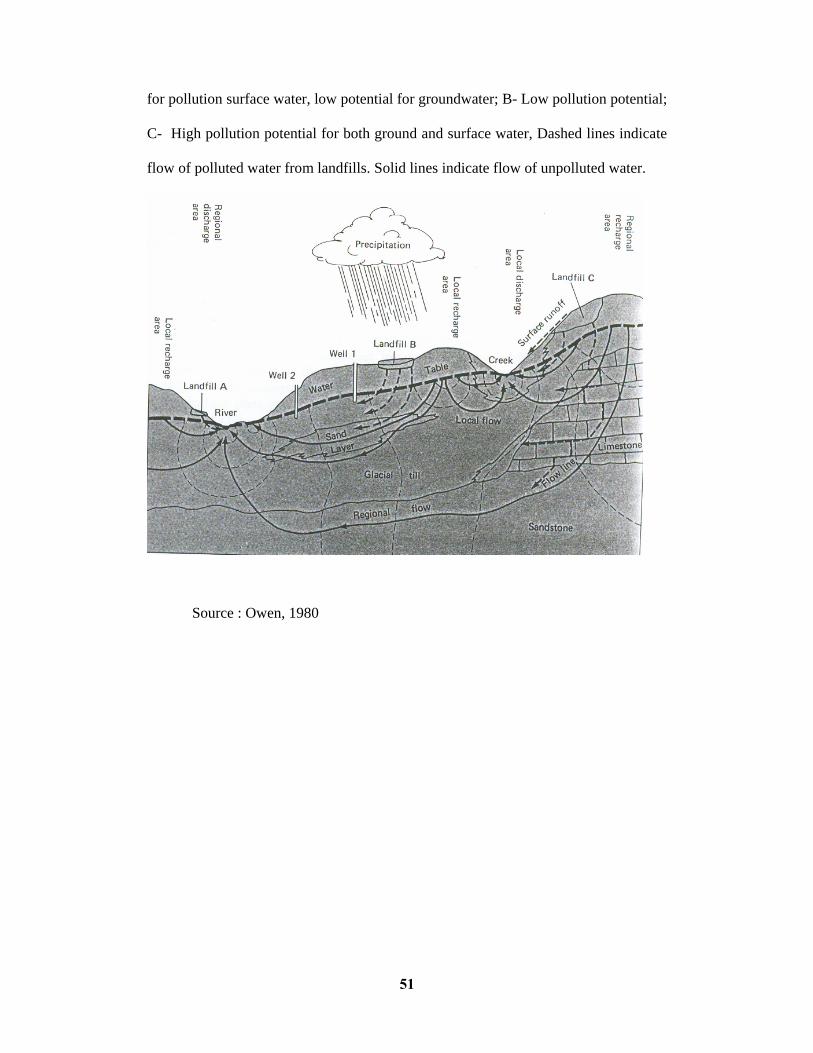
51
for pollution surface water, low potential for groundwater; B- Low pollution potential;
C- High pollution potential for both ground and surface water, Dashed lines indicate
flow of polluted water from landfills. Solid lines indicate flow of unpolluted water.
Source : Owen, 1980
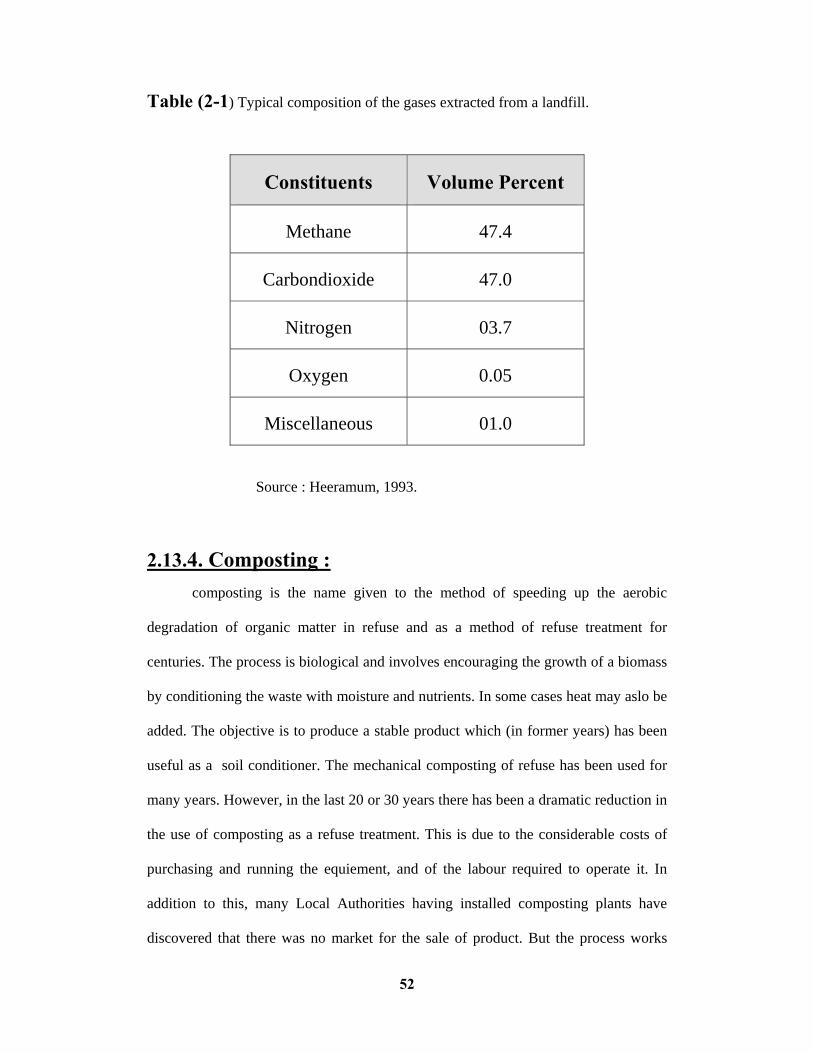
52
Table (2-1) Typical composition of the gases extracted from a landfill.
Constituents Volume Percent
Methane 47.4
Carbondioxide 47.0
Nitrogen 03.7
Oxygen 0.05
Miscellaneous 01.0
Source : Heeramum, 1993.
2.13.4. Composting : composting is the name given to the method of speeding up the aerobic
degradation of organic matter in refuse and as a method of refuse treatment for
centuries. The process is biological and involves encouraging the growth of a biomass
by conditioning the waste with moisture and nutrients. In some cases heat may aslo be
added. The objective is to produce a stable product which (in former years) has been
useful as a soil conditioner. The mechanical composting of refuse has been used for
many years. However, in the last 20 or 30 years there has been a dramatic reduction in
the use of composting as a refuse treatment. This is due to the considerable costs of
purchasing and running the equiement, and of the labour required to operate it. In
addition to this, many Local Authorities having installed composting plants have
discovered that there was no market for the sale of product. But the process works

53
well in some parts of the world. Particularly third countries where the composition of
refuse is significant different from European waste. Typically wastes suitable for
composting have a high moisture content and a high organic fraction, such wastes are
found in the Gulf States, Libya and South America.
The objective is to produce a compost which typically a brown peaty material
which consist mainly of humus. A good product should have the capacity to break
down heavy soil. Strengthen light sandy sort, increase the water retention capability of
the soil and encourage plant root mulch. In evaluating any particular waste for its
suitablitiy for composting, the main factors to be considered are the carbon: nitrogen
ratio, moisture content, and PH.
The carbon: nitorgen ratio governs the growth of the bacteria. The carbon is
used as an energy source and the nitrogen is used by the bacteria for building. And the
initial carbon: nitrogen ratio will affect the speed of decomposition. In the ideal
situation, the ratio should be between 30:1 and 35:1.
The moisture content also plays a significant factor in the aerobic degradation
of waste. If the moisture content falls below 20% the decomposition process will stop,
if it exceeds 55% the process will go anacerbic. This will cause the temperature to
drop and result in obnoxious odour.

54
2.13.5. Incineration : incineration is the name given to the practice of buring refuse under
controlled conditions.Crawford , et al, 1989.
This method of waste disposal has been used for over 100 years. Normally the
organic content of municipal waste is in excess of 50% therefore incineration offers
the opportunity of significant weight reduction. However the main benefit is the
volume reduction and reports of 95% volume reduction have been recorded.
a) Incineration has several basic phases: 1. The buring of waste in a specially designed furnace at temperatures a round
1.900. F.
2. The control and removal of atmospheric pollutants from the stack emissions.
3. The recovery and use of waste heat.
4. The removal as ash residure to a santiary landfill.
Some of the gaseous contaminants may be removed by consuming them in a
secondary combustion chamber.Up to 95 percent of the fly ash and other particulate
material can be removed from stack gases by an electrostatic precipitator.
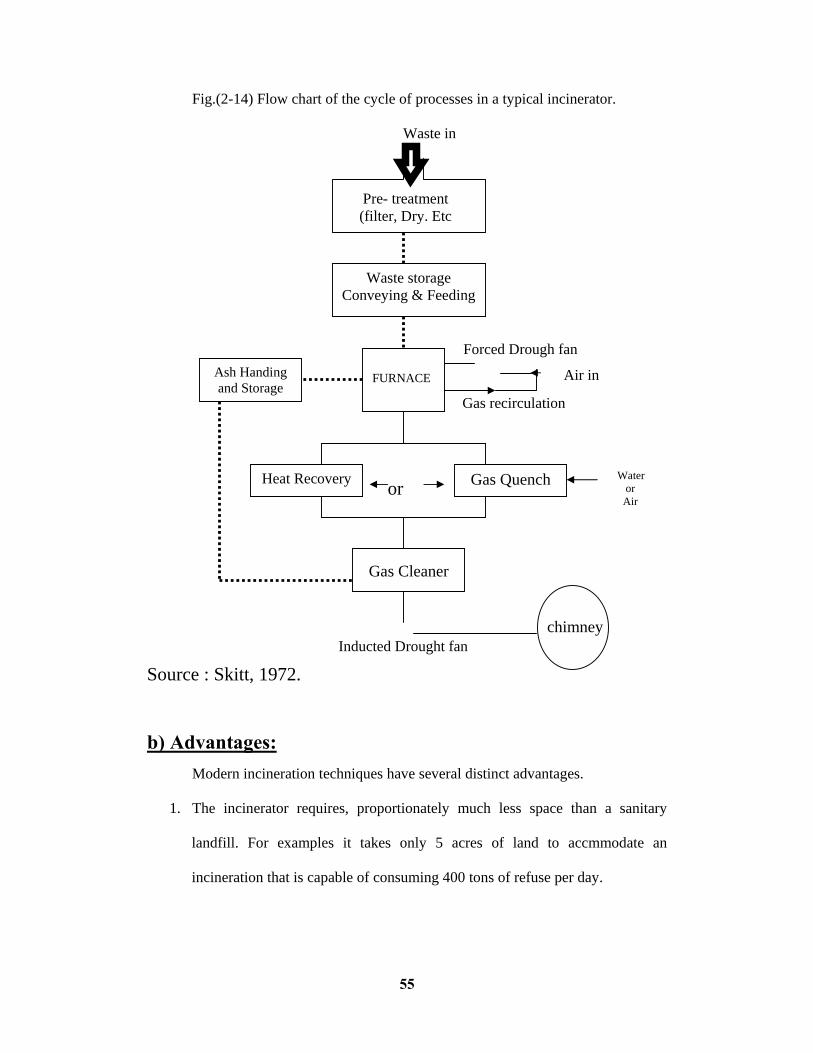
55
Fig.(2-14) Flow chart of the cycle of processes in a typical incinerator.
Waste in
Forced Drough fan
Air in
Gas recirculation Water or Air
Inducted Drought fan
Source : Skitt, 1972.
b) Advantages: Modern incineration techniques have several distinct advantages.
1. The incinerator requires, proportionately much less space than a sanitary
landfill. For examples it takes only 5 acres of land to accmmodate an
incineration that is capable of consuming 400 tons of refuse per day.
Waste storage Conveying & Feeding
FURNACE Ash Handing
and Storage
Gas Cleaner
Pre- treatment (filter, Dry. Etc
or Or Gas Quench Heat Recovery
chimney

56
2. The cost of waste collection for municipal incinerator is less costly than for a
landfill, because the incinerator may be located much closer to the point of
waste generation, in other words, within the town proper.
3. Incineration can dispose of both domestic garbage as well as rubbish
(furniture, tries, mattresses, waste paper, plastic toys) without a costly
separation process.
4. If the incinerator is provided with water-containing chambers in its wall, steam
can generated from the waste heat and sold for residential or industrial heating
purposes. The huge municipal incinerator in Chicago, which consumes 1.600
tons of refuse daily, generates 44.000 pounds of steam per hour. It is estimated
that in 1980 at least 80 American communities will be generating electricity by
using the steam produced from waste heat of their incinerators.
C) Disadvantages: Incineration is vexed with certain negative features:
1. Cost: A modern incinerator is not just a gigantic oil drum, as was used by
many families for burning domestic refuse back in the 1960s. It is a highly
sophisticated and product of intricate design and engineering skill. As a result,
it is costly. For example, in 1972 New York city decided to cancel an order for
an incinerator when the city fathers were informed that it would cost at least $
200 million. Not only this, but the consumption of a ton of waste by
incineration costs 6 to 12 dollars plus collection costs, or roughly twice the
cost of landfill disposal.
One reason for the high cost is that each incinerator must have a design “tailor
made” for specific type of solid waste which it is to receive.

57
An incinerator which will efficiently burn waste that is 60 percent combustible
simply will not work well if it is fed refuse with only 15- percent- combustibles.
Furthermore, the proper operation and maintenance of a municipal incinerator
requires the service of highly trained and therefore highly paid personnel.
2. Emission of corrosive gases. A variety of corrosive may be generated in an
incinerator, depending upon what type of waste is consumed. For example,
one of these highly desturctive gases is hydrogen chloride (HCI). This gas is
generated during the buring of plastic wastes, which contain the chemical
polyvinyi chlorid, or PVC, over a million tons of which is produced in the
United States annually. When PVC, present in such items as plastic toys,
garden hoses, shoe soles, and raincoats are burned, the HCI gas is released. If
the gas reacts with water it forms highly corrosive hydrochloric acid, which
can be highly damaging to some internal structures of the furnace. However
despite these disadvantages, It would seem that more and more communities
a cross the face of America, will be turning to incineration for at least a partial
answer to their waste-disposal problems. Certainly the increasing costs of
suitable landfill sites, as well as the rapidly decreasing availablility of such
sites in the edge of urban centers, will make incinceration a more and more
attractive disposal method.
2.13.6. Pulverization : Pulverization is the name given to the mechanical treatment of solid wastes to
break down the larger material and reduce the a varage particle size. Pulverization has
been in use as a form of refuse treatment since the beginning of the 20th century. It
has to be recorded that it is not a final treatment prior to some further process e.g
compositing, incineration, hydrolysis, recycling, refuse derived fuel, or landfill.
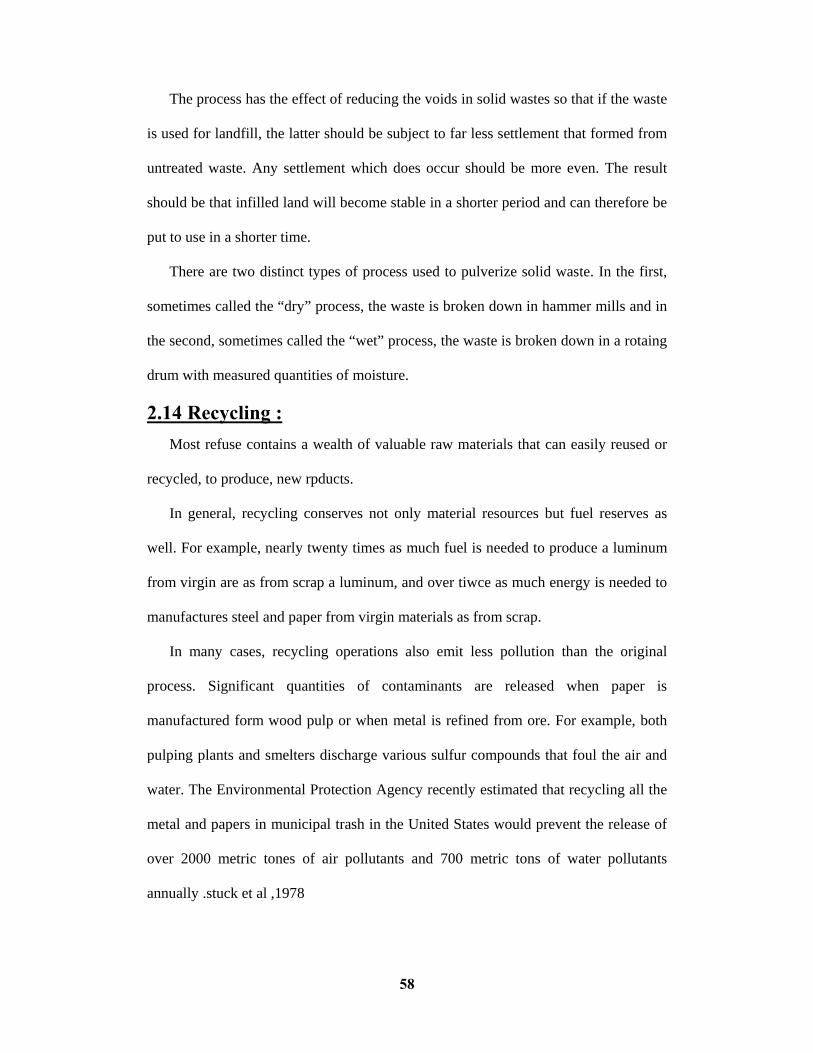
58
The process has the effect of reducing the voids in solid wastes so that if the waste
is used for landfill, the latter should be subject to far less settlement that formed from
untreated waste. Any settlement which does occur should be more even. The result
should be that infilled land will become stable in a shorter period and can therefore be
put to use in a shorter time.
There are two distinct types of process used to pulverize solid waste. In the first,
sometimes called the “dry” process, the waste is broken down in hammer mills and in
the second, sometimes called the “wet” process, the waste is broken down in a rotaing
drum with measured quantities of moisture.
2.14 Recycling : Most refuse contains a wealth of valuable raw materials that can easily reused or
recycled, to produce, new rpducts.
In general, recycling conserves not only material resources but fuel reserves as
well. For example, nearly twenty times as much fuel is needed to produce a luminum
from virgin are as from scrap a luminum, and over tiwce as much energy is needed to
manufactures steel and paper from virgin materials as from scrap.
In many cases, recycling operations also emit less pollution than the original
process. Significant quantities of contaminants are released when paper is
manufactured form wood pulp or when metal is refined from ore. For example, both
pulping plants and smelters discharge various sulfur compounds that foul the air and
water. The Environmental Protection Agency recently estimated that recycling all the
metal and papers in municipal trash in the United States would prevent the release of
over 2000 metric tones of air pollutants and 700 metric tons of water pollutants
annually .stuck et al ,1978

59
But not all items are reparable or reusable . Atire can be recapped only once with
saftey. Week –old newspapers and spoiled meat are useless to most people. When an
item cannot be in its present-condition, it must be destroyed and treated somehow to
extract its useful raw materials For. Example, used tires can be repulped and
converted to new papers can be rendered and converted to tallow and animal feed.
At best, recycling processes conserve both energy and materials. However, not
every item can be recycled efficiently. Recycling operations, despite their theoretical
appeal, lose their effectivesness if waste is widely dispersed.
2.14.1 Recycling – Techniques and Technology. Much municipal , industrial, and agricltural trash can neither, be reused nor
repaired, and concequently must be reused to raw materials suitable for
remanufactures. Several techniques are available for this type of recycling.
Melting :
Many materials such as metals, glass, and some plastics can be metled, purified,
and recast or remolded.
a) Pevulcnizing : Rubber is one plastic material that cannot simply be heated and remolded. Raw
rubber is gooey and formless and must be reacted with sulfur to bind individual
rubber molecules together in a cohesive form used rubber goods can be shredded,
broken down chemically, and then rebonded in a process known as revulcaniztion.
Recycled rubber manufactured in this manner lacks the strength and resiliency of
material made from virgin stock; therefore, for some aplications it is useful only when
mixed with more durable fibers.
60
b) Pulping and converting to paper. Any material containing natural celluose fiber such as wood, paper, cloth, sugar
cane stalks, and march reeds, can be beaten, pulped, and made into useful fiber. The
basic technology behind recycling of paper is an old as the technology of
manufacturing paper. The initial step in reclamation of fiber it to mix three parts of
waste paper with 97 parts of water in a hydropulping machine. Here the scrap is
stireed and beaten vigorously with a device similar to an egg beater until a slurry
forms. If paper from municipal sources is being pupled, de-inking chemicals are
added to the pulping mixture. The de-inked-pulp slurry is screened to remove large
objects, which might have contaminated the original stock and then rolled through
wringers to remove inky water.
Small impurities are removed in a centrifugal separator and the fibers are then
converted into paper by conventional procedures.
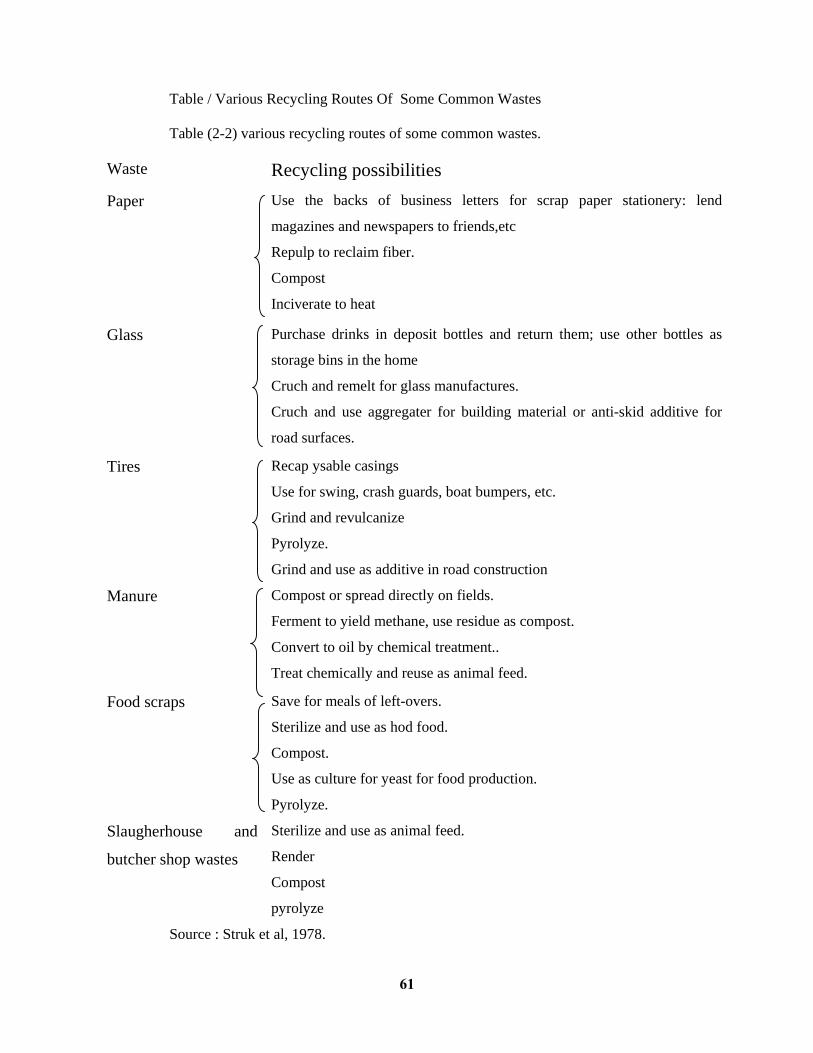
61
Table / Various Recycling Routes Of Some Common Wastes
Table (2-2) various recycling routes of some common wastes.
Waste Recycling possibilities Paper Use the backs of business letters for scrap paper stationery: lend
magazines and newspapers to friends,etc
Repulp to reclaim fiber.
Compost
Inciverate to heat
Glass Purchase drinks in deposit bottles and return them; use other bottles as
storage bins in the home
Cruch and remelt for glass manufactures.
Cruch and use aggregater for building material or anti-skid additive for
road surfaces.
Tires Recap ysable casings
Use for swing, crash guards, boat bumpers, etc.
Grind and revulcanize
Pyrolyze.
Grind and use as additive in road construction Manure Compost or spread directly on fields.
Ferment to yield methane, use residue as compost.
Convert to oil by chemical treatment..
Treat chemically and reuse as animal feed.
Food scraps Save for meals of left-overs.
Sterilize and use as hod food.
Compost.
Use as culture for yeast for food production.
Pyrolyze. Slaugherhouse and
butcher shop wastes
Sterilize and use as animal feed.
Render
Compost
pyrolyze Source : Struk et al, 1978.
62
2.15 Principle of waste avoidance and utilization The minimization of waste requiring disposal is increasingly important as
available disposal options become more and more constrained, and particualary as
more substances enter everyday use that are not readily decomposed in the natural
environment and that can present long term hazards.
The problem are typically associated with non biodgradable
or bioaccumulative substances such as waste pesticides, solvents, heavy metals, and
chemical sludges.
The need to avoid or minimize the release of complex organic or inorganic
substances into the environment is all the greater because of uncertainty about their
effects on human health and the natural environment and the very high costs of
retrofitting or cleanup.
Waste minimization comprises both avoidance and utilization. Avoidance refers to
actions by producer to avoid generating the waste. Utilization includes range of
actions that make the waste a useful input to other processes, eliminating the need for
disposal. Proceses that reduce the toxicity or potentially harmful impacts of a waste
can in some cases be regarded as minmization, although in other circumstances such
changes represent treatment before disposal.
Although the terminology used may vary, a number of important activities can be
distinguished. Reuse refers to the repeated use of a “waste” material in a process
(often after some treatment or makeup). Recycling refer to the use by one producer of
a waste generated by another. Recovery is the extraction from a waste of some
components that have value in other uses.
63
2.15.1 Hierarchy of Approaches. Waste avoidance and utilization can be seen as part of a broader hierarchy of
approaches to a chieving sustainable development. At the highest level are approaches
that seek to satisfy human needs and requirements in ways that do not waste resources
or generate harmful by products or residuals. These approaches include chanying
consumer behavior and reexaming the range and character of the products and
services produced lower level are efforts to redesign products and services and to raise
consumer’s a warness about the impact of their decisions. Applications of techniques
such as life cycle analysis (LCA) is part of the difficult analysis of the over all
impacts of products and services on the environment. Such approaches are at present
adopted mainly by more advanced organizations industrial countries.
More directly relevant to indutrial activity in developing countries are
approaches focused on improvements in production processes. These approaches
include cleaner production, pollution prevention, and waste minimization, all of which
are related, to a greater or lesser degree, to better management, improvements in
production processes, substitution of hazardous inputs, reuse and recycling of waste
and so on. The next step, which should be minimization but is not to be neglected, is
treatment and proper disposal of wastes. The lowest level in the hierarchy, and the one
that all the other levels strive wastes discharged to the environment. Cleanup is
costlier than prevention.
2.15.2 Policy and Regulatory framework A clear and effective governmental framework for waste management is
necessary. Such a framework should include the delegation of relevant powers to
lower levels of government that are typically responsible for implementation. It
should be based on clear and broadly accepted long-term policy and should include a
64
predictable and flexible regulatory regime and targeted economic incentives. At the
same time, programs should be put in place to increase a warness and education, with
the long-term objectives of changing the behavior of manufactures and consumers in
the direction of minimizing waste generation.
2.15.3 Producers and consumers Efforts must be made to involve both producers and consumers in waste
minimization and utilization. Producers can improve their performance through both
management changes and technological improvement, some producers in industrial
countries are now making serious efforts to examine the impacts not only of their
production processes but also of the products themselves. LCA it still an envolving
tool, but it does focus attention on the over all impact of the production, use, and
disposal of products.
Consumer in some of wealthier countries are moving toward a greater a
warness about the need for waste reduction, as shown by participation in recycling
schemes and some demand for environmentally friendlly products. However, progress
is often slow, and there is a need for on going education and a warness, as well as
careful analysis of options and incentives. In developing countries, the demand for
resources of ten loads to significant recycling of materials such as glass, metals, and
plastics. These recycling systems gave important social and economic consequences
at the local level, and their “improvement” must be approached with care.
2.15.4 Complexity: Waste management efforts are linked closely with income levels. There is a
broad progression from recycling of most materials in the poorest societies, through
increasing conuserism-often with little concern for waste problems-in low-and
middle-income countries, to the environmental activism of some rich countries. The

65
appropriate waste avoidance and utilization strategy for any situation must take into
account the level of the economy, and the environmental circustances. As with any
others environmental strategy, there is a need for public involvement and political
support in the indentification of priorities and the implementation of the necessary
enabling measures.

66
Chapter
Tree
65
Chapter III
Materials and Methods
The study has been conducted in Khartoum industrial area (south of
Khartoum).
It is worth mentioning that no such comprehensive study was carried out since
the establishment of the industries in this area.
The main purpose of this study is solid waste management. The study aims at
the major industries in the area responsible for the production of solid wastes.
According to the first industrial conference under the auspices of the general
administration of industries of the Ministry of Economic affair of Khartoum State
(1998), these industries are grouped (categorized) into eight
major industrial sub-sectors these include:
1. Food industries.
2. Spinning and textiles industries.
3. Wood and metal products industries.
4. Paper industries, paper product, printing press.
5. Chemicals industries.
6. Mining and non metalic products industries excluding petroleum and coal.
7. Basic metalic products industries.
8. Metalic products, machines and equipment industries.
The study comprise survey research through interviews and questionnaries.
The management staff of each industry were interviewed by the researcher on general
aspects such as establishment date, production stages, types of solid waste and others,

66
solid waste workers from each industry were also interviewed on collection and
disposal methods and their relationship with management staff.
Detailed survey was carried out by the researcher through four questionnaries.
Questionnaire [I] include questions to answered by the management staff of
the industries under study. Its components include questions such as name of industry,
type of ownership (private, public, company or coorperative), solid waste products
(type), quantity, collection and disposal methods, public health inspectors visits,
opinion on current collection and disposal methods and improvement if necessary.
Questionnaire [II] concentrated on questions about the status of solid waste
workers, the questionnaire included questions on, occupation, educational level,
employment record, impact of solid waste on health and benefits from the solid waste
if any.
Questionnaire [III] comprise questions on solid waste pickers and brokers
around the dumping sites. These include questions on the age, marital status,
residence, level of education, type of solid waste picked or sold, to whom sold, prices,
problems encountered during picking, opinion on the job, market place or places.
Questionnaire [IV] was concerned with questions about the effects of solid
waste disposal on the households at the vicinity of industrials under study. Questions
here include name of the residential area, name of the nearby industry, problems
encountered due to Industrial waste disposal.
3.2 Material used: For the purpose of quantifying the volume of solid wastes produced by each
industiral sector, the following material were purchased and used by the researcher
during the study period.

67
i. Graduated weighing machines.
ii. Grabage plastic bags.
iii. Hand gloves.
iv. Questionnare papers
v. Tray.
vi. Note book
3.2.1 Methodology: Include visits to sites (industries and dumping areas), Ministries concerned,
offices of crash program and households, interviews and then questionnaire filling,
quantifing the solid waste and data processing and analysis.
3.2.2 Visits to sites, ministries concerned, offices and households: Industries were visited for the purpose of the study. During the visits
interviews were conducted with the management staff and solid waste workers by the
researcher and questionnare were in issued to be filled respectively.
Questionnare were collected after been filled by the management staff and
solid waste workers after from the date issued.
In the dumping areas the researcher had the opportiunity to see the new cells
under construction. Also the methods of collection was observed. General overview of
the population of solid waste workers and the brokers were determine by the
interview. In addition, the researcher had a chance to visit the only transfer station in
the Sudan which was still under construction.
Three Ministries of concern were visited. These included, the Ministry of
Health. Industry and Investment and Ministry of Planning and Public Utilities.

68
It was found out by the researcher that the Ministry of Health is concerned
with setting of regualtions, guidelines on health and the follow up of their
implementation. The Ministry of Health also directed the researcher to the offices of
the crash programme for environmental sanitation-Khartoum State.
Historical background on the establishment date, total number of industries in
Khartoum industrial area and problems facing these industries were highlighted
during the visit to the Ministry of Industry and Investment-Khartoum State.
From the Ministry of Planning and Public Utilities two Maps were purchased.
During the visits to the offices of the crash programme for environmental
sanitation, the researcher was enlightened about the historical background and
objectives of the programme. Also in collaboration with the programme the researcher
paid visits to the unregulated dumping sites to assess the condition of solid waste
before and after the establishment of the crash programme. During the visits various
methods of solid waste collection were indentified and photographs from different
locations and sites were taken. Four residential areas were identified around the
industries under study. In each residential area five questionnares. Were issued to be
filled by each household head.
It is worth noting that during each of a fore mentioned visits interviews were
conducted by the researcher and questionnaire provided to be filled.
In each of the industries the different types of solid waste were measured using
the weighing machines.
Results were tabulated.
3.2.3 Data collection: during the study, the researcher applied two methods for data collection. These
include the primary and secondary data collection.

69
3.2.3 a. Primary data: These were obtained from interviews conducted by the researcher and
questionnare.
3.2.3 b. Secondary data: These comprise literature reviews of relevant references to augment the
finding of the theoretical and practical component of the research.
3.2.3 c. Data analysis procedures:-
After the completion of the survey the data were sorted, coded, the tabulated
using the computer system (Excel & SPPS programmes).

70
3.3 Study Area
The Industrial Area – Khartoum 3.3.1 Geographical Location:
1. The Old Industrial Area (Khartoum South): It is bordered northwards by Hurriya bridge up to White Nile, eastwards by the
Hurriya street and southward by the medical supplies administration.
This area is characterized by the following:
- The Khartoum central foundry.
- The Sudan Mint Co. L.T.D
- The currency printers.
- Saad Sweets Factory.
- The New Industries Company (King Cola).
- Looli food industries.
- And different types of industries and workshops.
2. The New Industrial Area:
It is bordered northwards by King Colla company up to the White Nile west,
eastwards by forest street up to Al-Rimeila cemetery, westwards by the white Nile
and southwards by Al-Rimeila area and Al-Qoaz market.
It is developed in the sixties, and this is represented by the Atlas Packing
Factories and the Sphinx Factory for macaroni and its last product was refrigerator (El
Madina Factory for Refrigerators).
This area also witnessed the introduction of new industrial workshops working in
furniture manufacturing, inpesticide, plastics, ice and cooling stores.
71
3. The Industrial area west of Horse race track:
It is bordered northwards by Shajara street from Abu-Hamama to Al-Rimaila
cemetery, southwards by the northern fence of the Armed Forces, Shajara, westwards
by the inlet passing by Shajara and eastwards by thee Horse race track.
It developed in the Nineties, this area is distinguished by the presence of
Moawia El Bireir Group Companies and Abu El Tayeb Sweet Factory. There are
factories for plastics, different food industries and also there is Saria Industrial
complex.
4. The Industrial Area of Shajara:
It is bordered northwards by Al-Rai Al-Masri residential area, southwards by
administration of Fisheries, west by White Nile and eastwards by the railway.
It developed at the beginning of the eighties. In this area, found the drug
industry and it is a joint of Sudanese and Korean Company for investment. There is an
Asbestos Factory and other fine sweets industry, flour mill and dried fish factory.
5. The Industrial Area south of Local Market, (Block 35) and
Southern of Sahafa:
It is bordered northwards by the local market, southwards by the Green Belt
area, eastwards by Al-Azhari city and westwards by the Reservoirs, Shajra and Jabra.
It is a newly developed area, lacking the fundamental infrastructure (roads,
electricity), but there is individual investments which erected some units economic
outputs to the country in terms of iron and steel, Zalal Slabs (floor tiles). It is also
distinguished by a huge factory for empty syringes which is the only factory in the
country.
72
6. The Soba Industrial area:
It is bordered northwards and westwards by Madani street, northwards by
Gazeera State boundries, westwards by the Blue Nile and eastwards by Soba East and
south Ma’moura.
Characterized by the following :
- Bule Nile for Milk products.
- Manara Biscuits.
- Bisfoor for Furniture.
3.3.2 Background:
The industrial area in Khartoum started in the fifies after independence. It was
mainly for small scale industries. There were foreign skills centred only in Hasuna
Company. This company contributed in training of technicians in the fields of
mechanics, electricity and Iron frames services. It expanded by time and reached to
1000 workshops termed as the industrial area-Khartoum. This area helped the
government of Khartoum, by then establishing a central workshop which helped to
service government vehicles. This workshop has a unit for cement works. It
manufacutures bridge tools which are used in the field of drainage in Khartoum
province. The workshop, also produces electrical cement poles.
Among these workshops prosperous industries emerged such as Saad Sweets.
Al Qadi ice Factory and Pepsi Cola Factory which was lately turned to King Cola.
In this area, also, found the Sudan Mint Co. L.T.D followed by the Khartoum
central foundry which considered as the state backbone in servicing and
manufacturing of spare parts and espeically for Sugar factories. Found in the
industrial area a unique factory of its kind especialized in manufacturing of human
extremities (lims) parts. (prosthetic and orthentic corperation).
73
During the sixties, there found the Khartoum tannery and the white Nile
tannery and the Nasr tannery in the eighties.
Lastly, the paints industry prospered by the shift of the Nile paints factory
from Omduraman to the industrial area – Khartoum.
There is a factory for Liquid Air, and this is the second factory in the country,
and is the first factory, to win the ISO certification.
Lately, the government, has established the so called “Currency printers).
They are owned by the state, and has a high quality and technology.
There is some stationeries under construction and have economic outcome
(revenue) to the area, when completed this area will be economically activated and
can provide new job opportunities in addition to its association with the local market.
This will facilitate very much the means of marketing and minimize the cost of
transportation and hence helps the reaching of goods to the consumer in reasonable
prices.

74
Table below shows present stage of the main industrial sub-sectors in Khartoum
Industrial Area. 1997-1998:
Table (3-1): Serial
No Sector Operational
Non-
operational
Under
construction
Not
constructed Total
1 Food Industries 40 19 17 11 87
2 Spinning and textiles
industries 2 6 ---- 50 58
3 Wood and metal
products industries 37 17 ---- 4 58
4 Paper industries,
Paper products,
Printing press
17 6 --- 13 36
5 Chemicals industries 6 3 1 48 58
6 Mining and non metalic
products industries 21 6 1 ------ 28
7 Basic metalic products
industries 1 ------- ------ ------ 1
8 Metalic products machines
and equipment industies ------ 1 1 ------ 1
Total 124 57 20 126 327
Source: The first industrial conference, 1997-1998
75
3.3.3 Obstacles of industry in Khartoum industrial Area
1. Funding: Funding is connected with the movetary and import policies and the provision of
foreign currecny. The liberalization policies has helped very much in provision of
manufacuring supplies (import inputs) but variables of exchange rate and the policies
adopted out the beginning of liberalization led to diminshing of operating capitals for
a period of time, and as a result some factories went out of function when they failled
to pay back their bills to funders due to the ubrupt rise in the constant value of
currencies.
Also, despite of large devation in the local currency the bodies concerned didn’t
put any consideration to the stationeries (Tools-machines) according to current value
of currency in their transaetion with the industrial sector.
2. Infrastructure and Services: Energy, Electricity If we totally forget about the off-functional factories, we will find the electrical
energy is the reason for the low production in the industrial sector followed by lack of
use (exploitation) to the resources (machines, workers) and freezing of stationeries of
industrialists.
All these affect the productivity a bundance and as such lead to increase in the
cost and (financial surdens) which leads to elevation of prices.
3. Petroleum : Increase in their prices, then increase rise, in cost of transportation and the
saphiyation which might seasonally happen.

76
4. Water : Water scarcity is still near to situation (Position) of electricity despite the fact that
many of the factories posseses their own reserve wells but this is affected with
electricity.
5. Roads: The roads of the industrial area are still very weak especailly in the season of
Autum. This effects transportation of supplies, Goods and workers.
6. Public Environment and Healthy drainage: Problems of Healthy drainage is clear in El Shaggera Industrial Area. Nothing
about its Healthy drainage is mentioned nor the roads no even waste size streams
which keep rain waters.
7. Training: Til now it is poor and lacking.
8. Marketing: Marketing is one of the biggest issues which confort the industrial sector, and here
consideration should be given to the external market not the internal a lone as we are
welcome the globalization which will be imposing to many things.
Marketing is collective responsibility between the producer and the state. We’ve
remained long without carring for the world demands of quality because we stood on
the domestic market with all means of protections, and now it’s invading use under
the umbrella of liberalization policy before the globlization could.

77
Chapter Four

77

78

79

80

81
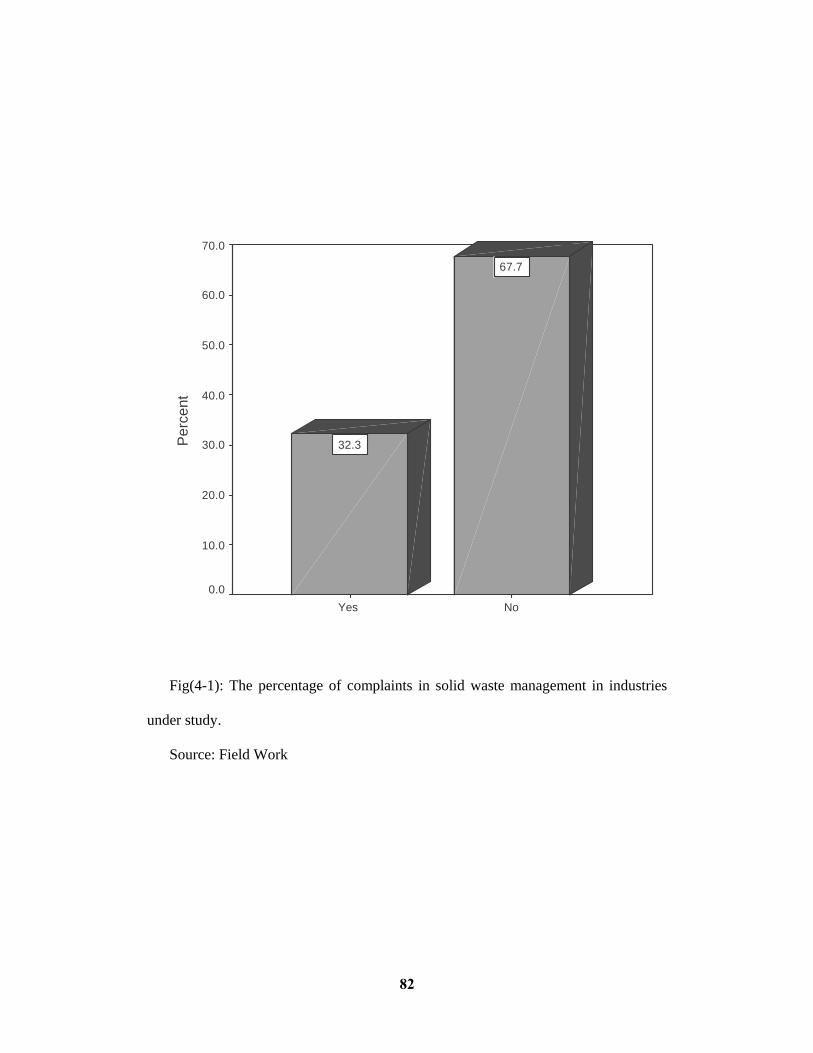
82
NoYes
Per
cent
70.0
60.0
50.0
40.0
30.0
20.0
10.0
0.0
67.7
32.3
Fig(4-1): The percentage of complaints in solid waste management in industries
under study.
Source: Field Work
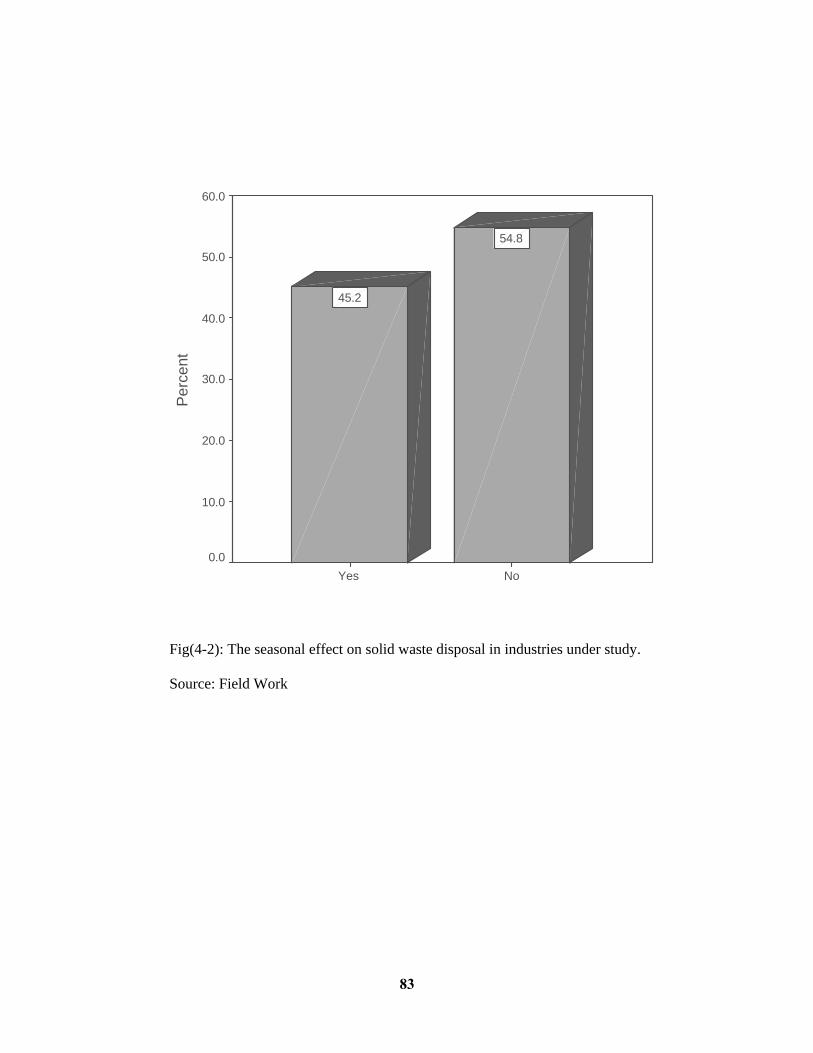
83
NoYes
Per
cent
60.0
50.0
40.0
30.0
20.0
10.0
0.0
54.8
45.2
Fig(4-2): The seasonal effect on solid waste disposal in industries under study.
Source: Field Work

84
NoYes
Per
cent
100.0
80.0
60.0
40.0
20.0
0.0
22.6
77.4
Fig(4-3): Contracts with crash programme for environmental sanitation.
Source: Field Work
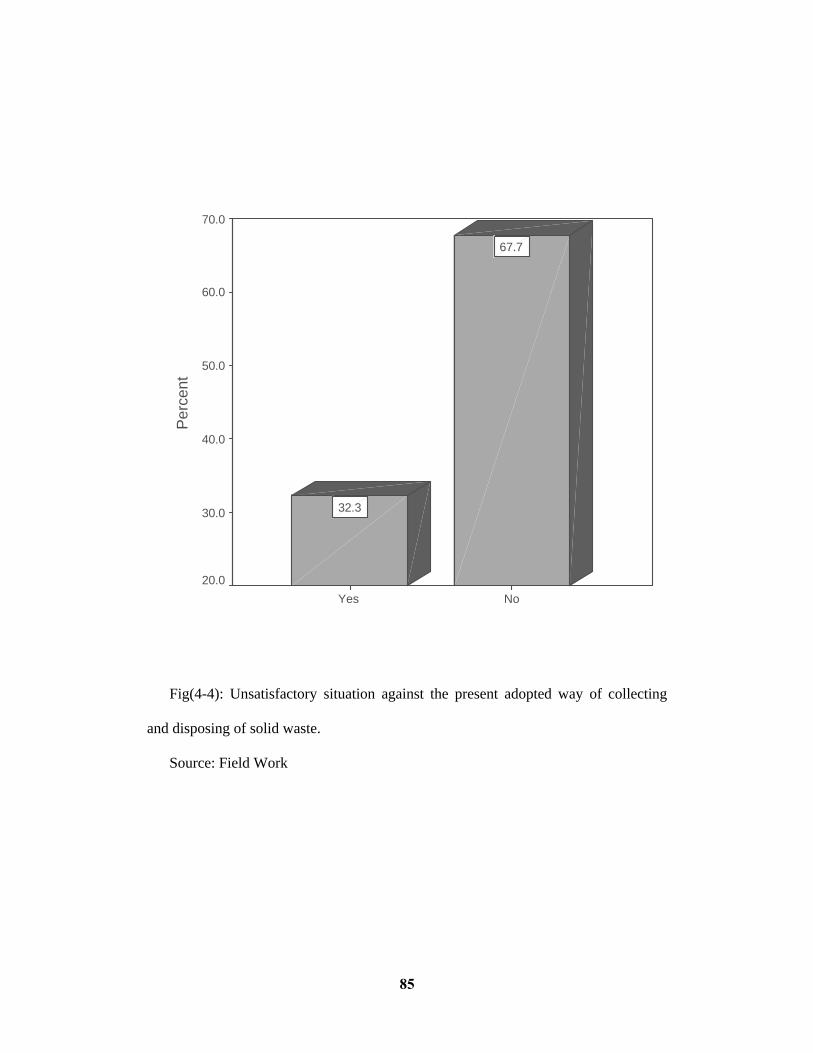
85
NoYes
Per
cent
70.0
60.0
50.0
40.0
30.0
20.0
67.7
32.3
Fig(4-4): Unsatisfactory situation against the present adopted way of collecting
and disposing of solid waste.
Source: Field Work

86
No32.3%
yes67.7%
Fig(4-5): Visiting of Health inspectors in industries under study.
Source: Field Work
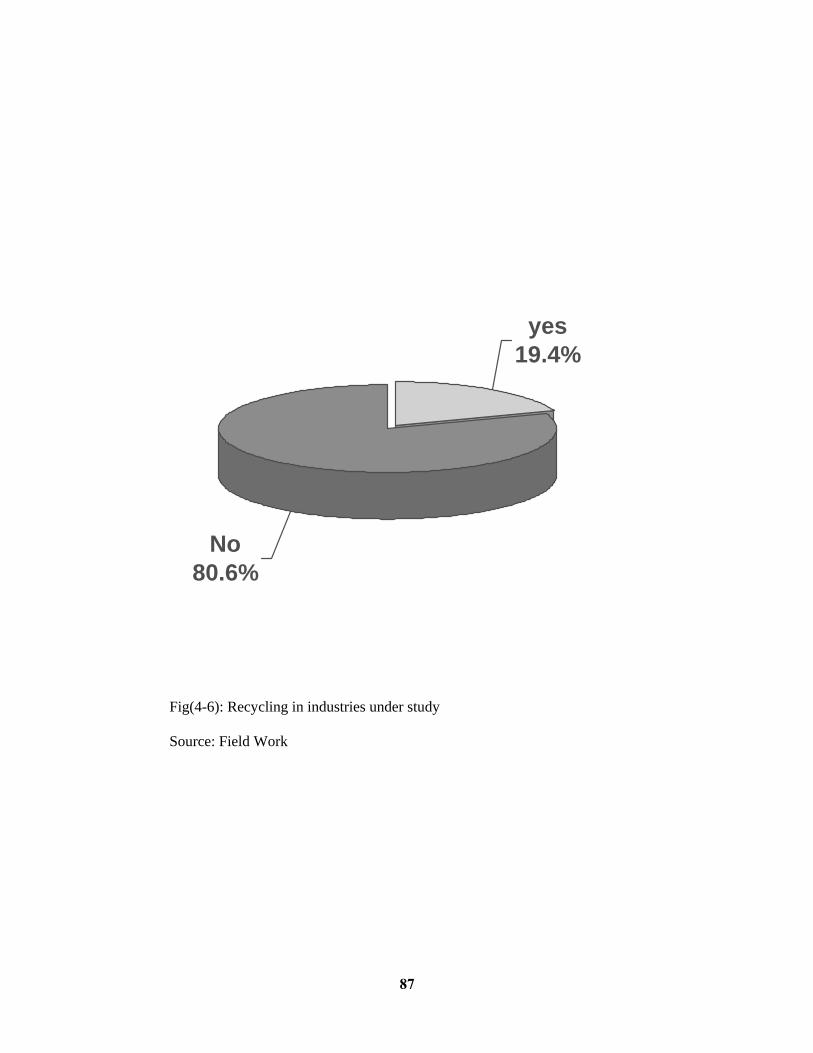
87
No80.6%
yes19.4%
Fig(4-6): Recycling in industries under study
Source: Field Work

88
Solid waste Workers in Khartoum Industrial Area Sample of study (31)
Table (4-5): Educational level of solid waste workers
Solid waste workers in Khartoum industrial
14 45.28 25.82 6.57 22.631 100.0
basicSecondaryUniversityNoneTotal
Frequency Percent
Source: Field Work
Educational level

89
Table (4-6): Services provided to solid waste workers
Services provided to solid waste workers
4 12.93 9.78 25.86 19.4
10 32.331 100.0
MaskGlassesClothesBoots and GlovesNo ServicesTotal
Frequency Percent
Source: Field Work
Protective Material
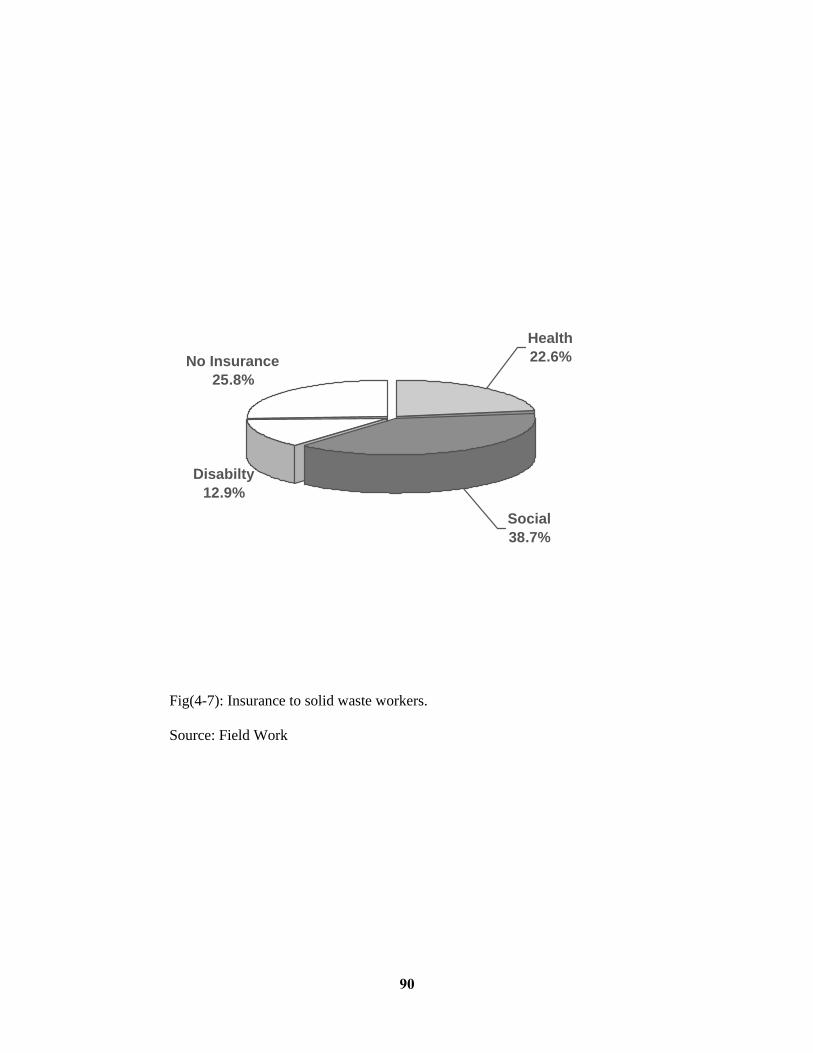
90
Disabilty12.9%
No Insurance25.8%
Health22.6%
Social38.7%
Fig(4-7): Insurance to solid waste workers.
Source: Field Work
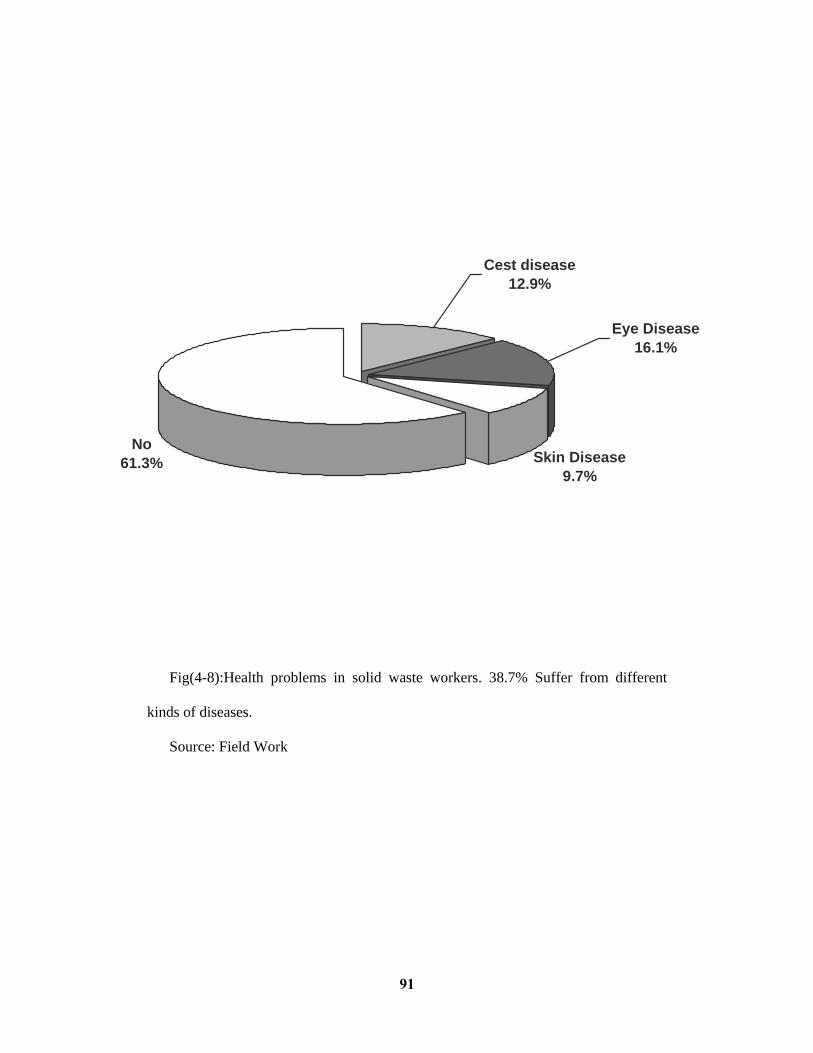
91
Skin Disease9.7%
No61.3%
Eye Disease16.1%
Cest disease12.9%
Fig(4-8):Health problems in solid waste workers. 38.7% Suffer from different
kinds of diseases.
Source: Field Work
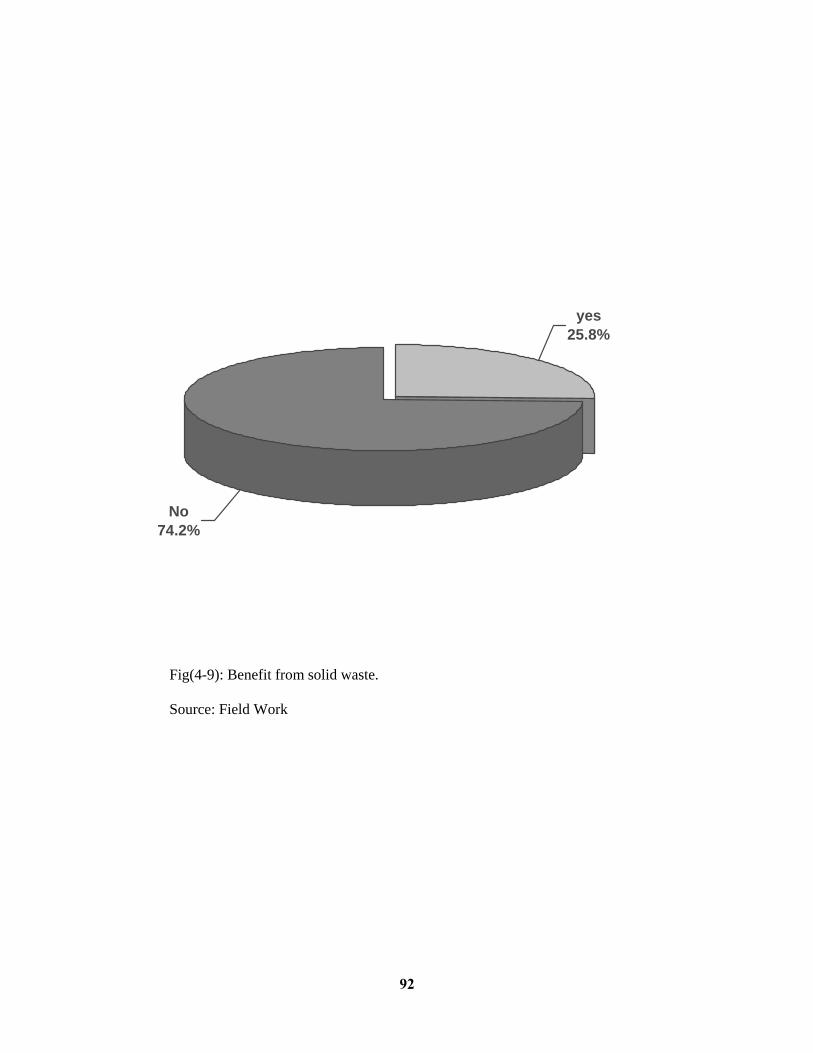
92
No74.2%
yes25.8%
Fig(4-9): Benefit from solid waste.
Source: Field Work

93
Solid waste Pickers Around the sanitary landfill Area Sample of study (30)
20-3010 - 20
Per
cent
100.0
80.0
60.0
40.0
20.0
0.0
20.0
80.0
Age
Fig.(4-10): Age of solid waste pickers Around the sanitary landfill Area.
Source: Field Work
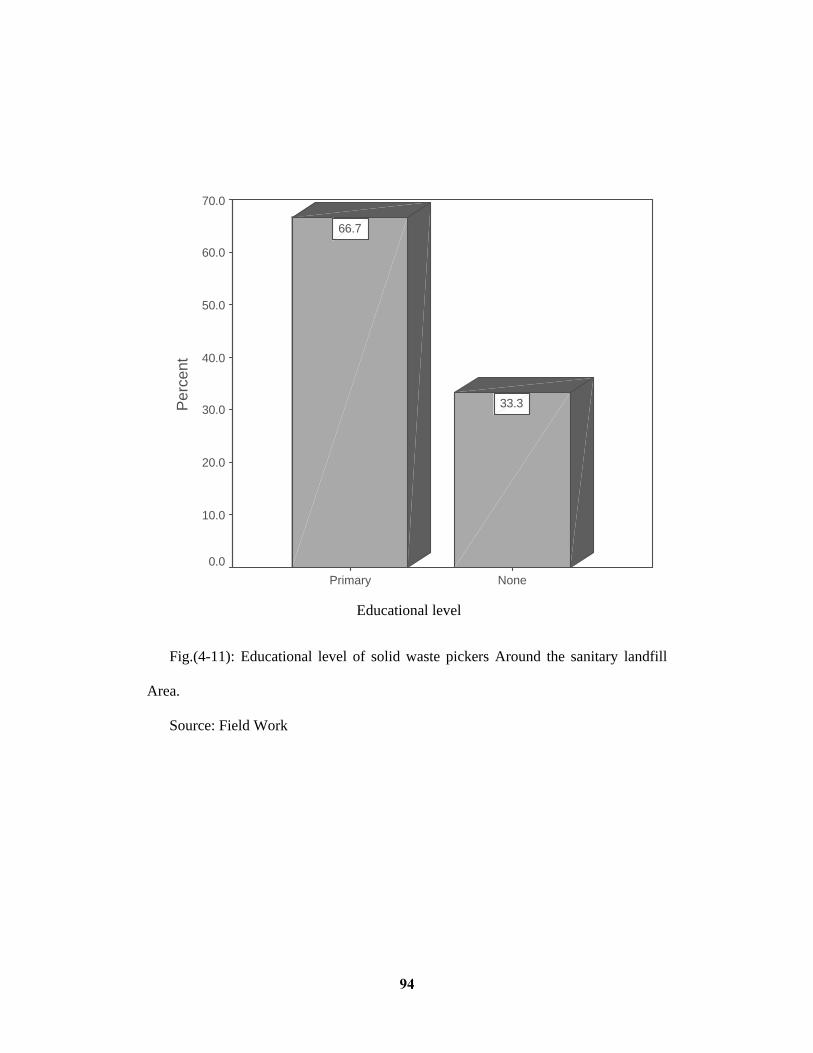
94
NonePrimary
Per
cent
70.0
60.0
50.0
40.0
30.0
20.0
10.0
0.0
33.3
66.7
Educational level
Fig.(4-11): Educational level of solid waste pickers Around the sanitary landfill
Area.
Source: Field Work

95
Hilla Algadeeda (OmdElgabal
IngazDumpinf Area
Horse Race AreaMayo
Per
cent
50.0
40.0
30.0
20.0
10.0
0.0 3.33.3
6.76.7
33.3
46.7
Residential Area
Fig.(4-12): Residence of solid waste pickers Around the sanitary landfill Area.
Source: Field Work
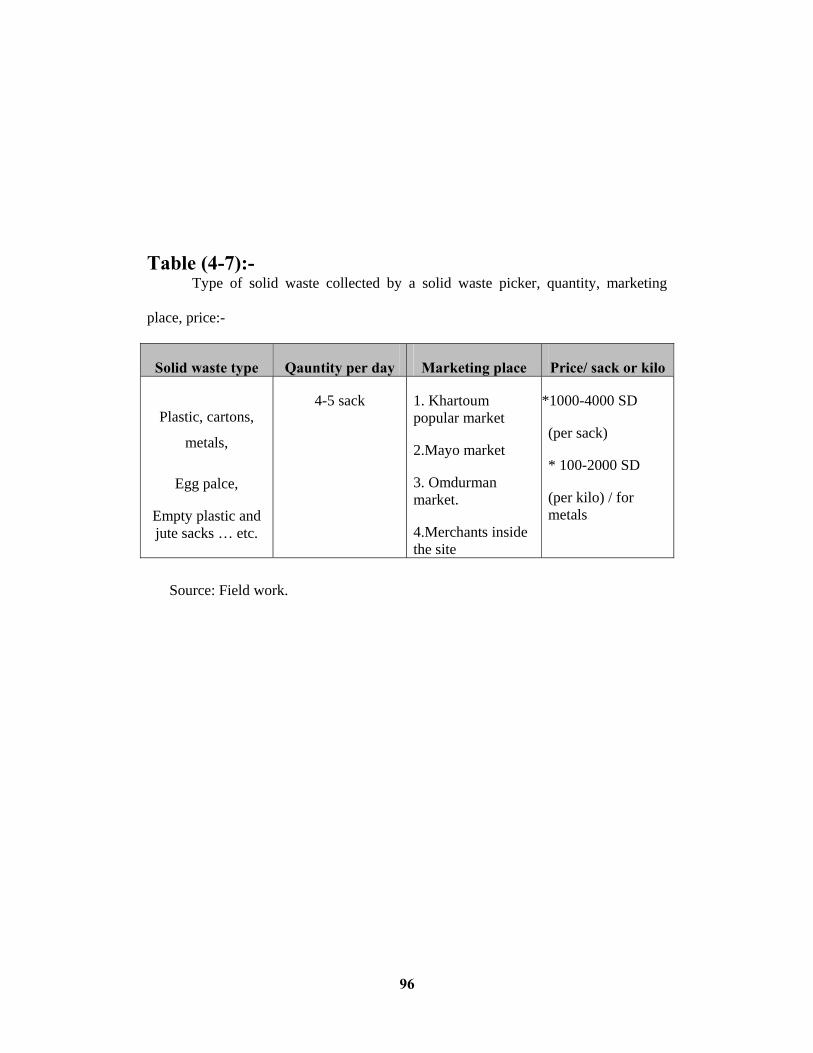
96
Table (4-7):-
Type of solid waste collected by a solid waste picker, quantity, marketing
place, price:-
Solid waste type Qauntity per day Marketing place Price/ sack or kilo
Plastic, cartons,
metals,
Egg palce,
Empty plastic and jute sacks … etc.
4-5 sack 1. Khartoum popular market
2.Mayo market
3. Omdurman market.
4.Merchants inside the site
*1000-4000 SD
(per sack)
* 100-2000 SD
(per kilo) / for metals
Source: Field work.
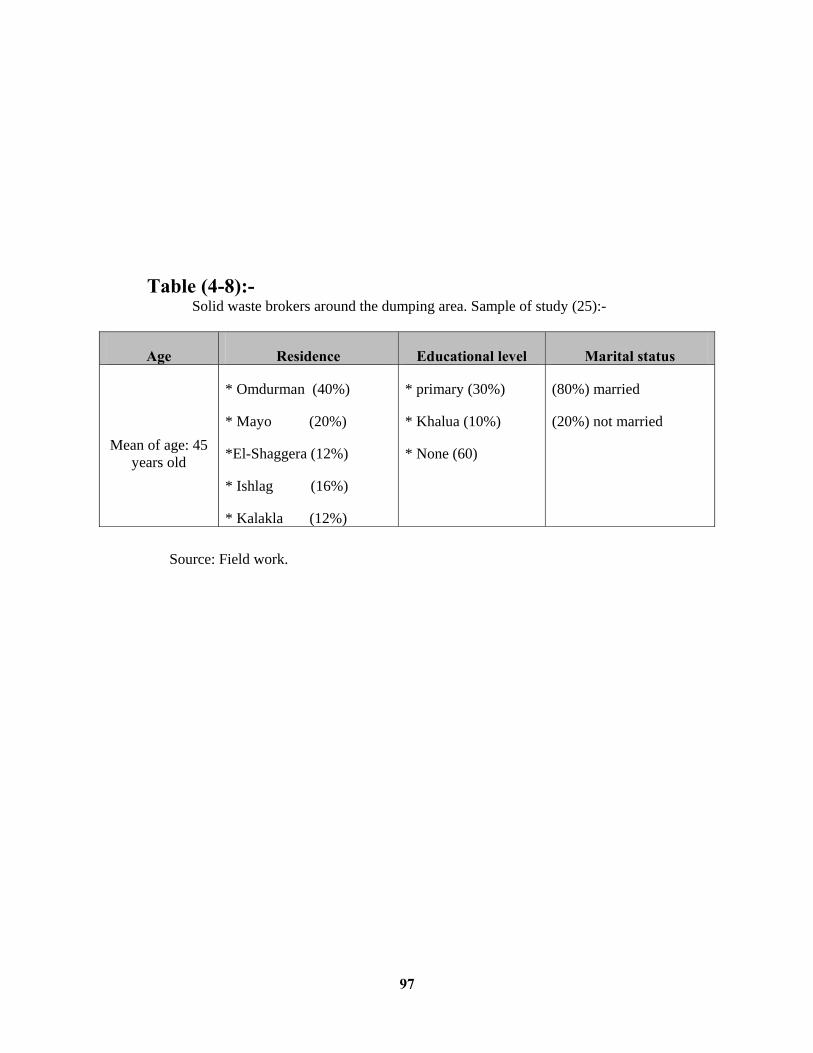
97
Table (4-8):-
Solid waste brokers around the dumping area. Sample of study (25):-
Age Residence Educational level Marital status
Mean of age: 45 years old
* Omdurman (40%)
* Mayo (20%)
*El-Shaggera (12%)
* Ishlag (16%)
* Kalakla (12%)
* primary (30%)
* Khalua (10%)
* None (60)
(80%) married
(20%) not married
Source: Field work.
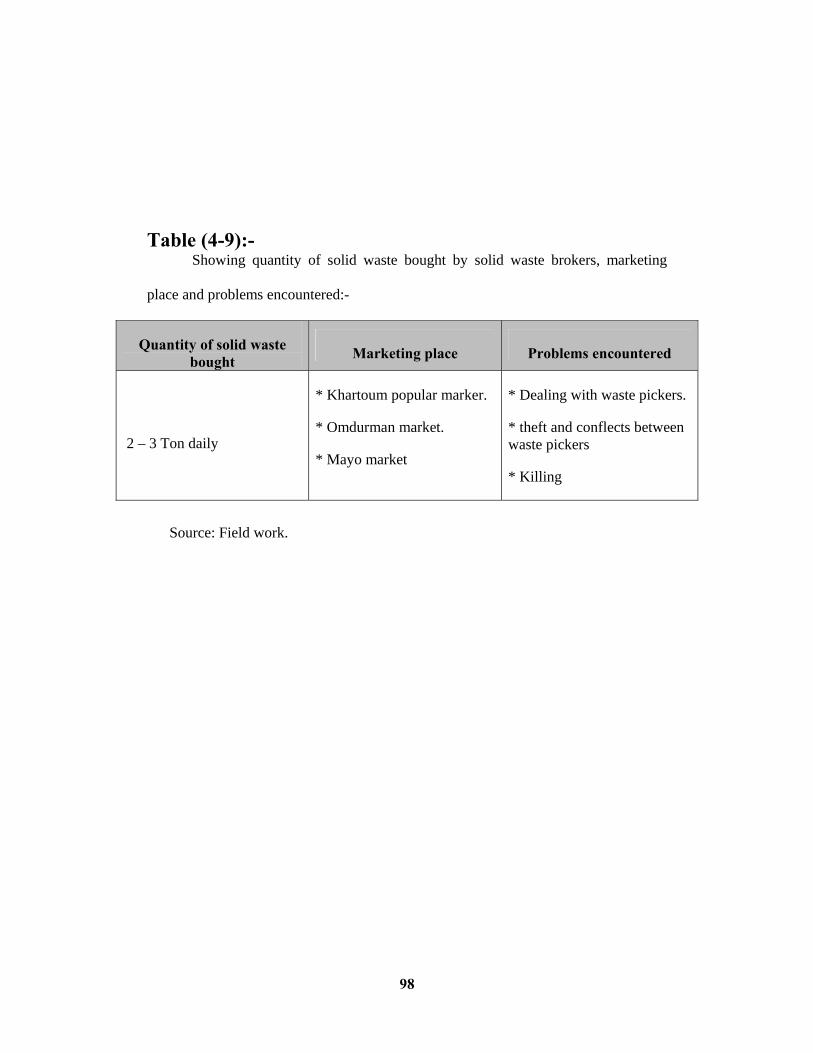
98
Table (4-9):-
Showing quantity of solid waste bought by solid waste brokers, marketing
place and problems encountered:-
Quantity of solid waste bought Marketing place Problems encountered
2 – 3 Ton daily
* Khartoum popular marker.
* Omdurman market.
* Mayo market
* Dealing with waste pickers.
* theft and conflects between waste pickers
* Killing
Source: Field work.

99
4-2:Discussion:-
This study covered the Industrial Area in Khartoum. Practically, 31 Factories were
studied comprising eight different sectors, i.e 25% of the total focatories in the area.
Through out these sectors, the management of solid waste was studied.
Table (3-1) shows the most important sectors operating in the area and the present
situation in the Industrial Area. Khartoum South.
Table (4-1) shows the names of Industries which were examined by the study,
their locations, and type of ownership. It is observed that the majority of the factories
are privately owned, while others are cooperative or public enterprises.
Table (4-2) shows the type of solid waste in the Industries under study in each of
the eight sector. So, representative samples were taken from each sector; (e.g in sector
of food industries, six factories were selected; while in the textile sector, five factories
were selected and six workshops were selected in the wooden and iron products
sector. It is noticed that packing materials, plastics and cartons of all types, produce a
high rotio of solid waste.
Likewise, the total volume of the solid waste was studied in total sample of the
sectors, table (4-3), shows that the highest ratio of solid waste is produced mining and
in the non-metalic products industrial sector (excluding petroleum and coal industrial
sector). These amounted to (5150 Kg per day).
Next comes the textile sector (4011.1 Kg); the wooden and iron products sector
(550.69 Kg per day); then the chemical industries (346.7 Kgs. Per day), then the
metalic products, machines and equipment industries solid waste (150 kg per day) and
Food Industries waste (150 kg per day) and the least ratio of solid waste was found in
dample of the Mint, which was (30 kg per day).
100
Table (4-4) shows the weight of the solid waste produced during the day in
selected samples of the factories. For example, in the food industries sector, solid
waste was studied in Saad Sweets Factory (Toffee and Sindbad sweets section – while
the “Tahniya” section is closed. The volume of waste amounted to (30 kg per day).
In the textile sector, the Sudanese company for leather industries (White Nile
Tannery) was secleted. Thus, the weight of the solid waste was found to be (2500 kgs
per day).
Meanwhile.The solid waste of Abdel Moniem Engineering Co., (which operates in
the field of producing shoe-laces and wax) was found to be (8.5 kgs per day).
In the paper products, printing and publishing industries, the solid waste of the
“printing House” amounted to (29.5 kg per day). Also in the Modern Sudan’s printing
press, solid waste amounted (100 kgs per day). Also, in the chemicals sectors, the
solid waste of the prosthetic and orthetic corperation amounted to (50 kg per day). In
the non-metalic products sector exculding petroleum and coal, the soild waste in the
sample of “Aina International Co. amounted to (2400 kgs per day); while the solid
waste of the Mint (The Sudan Mint Co. Ltd) amounted to (20.6 kg). Finally, in the
metalic Proudcts, machines and equipment industries, sector ( AL-Medina
Referigerators Factory), solid waste amounted to (150 kgs per day).
The two tables (4-3) and (4-4); shows that the volume of solid waste in the
industrial Area-Khartoum is less than recognized standars. The reason is that most of
the factories produce and operate at (15-20% of their designed actual productive
capacities. This is due to the weakness of financing, the competition of the imported
goods (which are cheaper and of better quality), the rise of the cost of electricity, high
taxes and others.

101
Despite the smallness of the volume of the produced solid waste, it is observed
that there is a clear deficiency in their mangement. It was found, in the field visits that
the Industrial area is surrounded by great amount of solid waste. Also, there is a
deficiency on the part of the factory owners in controlling such waste inside their
factories (plate (2,3) and plate (4)). This is due to the importer primary treatment of
such waste. So, some factories do not care to dispose properly of their waste; while all
the factories which were subjected to study, use the manual method in collecting solid
waste inside the factories, then carry all the accumulated waste to barrels or the open
disposal containers in which it stays, for more than two weeks for some of the
factories.
From the field work, it was found that there is a ratio of complaints (Fig (4-1) on
the management of solid waste, which often come from waste workers, and
sometimes from the households in the residential areas near the Inustrial Area.
Likewise, factories suffer from the deficiency of treatment. One of the reasons is
due to the determination of the “crash programme for environmental sanitation”
which is put into effect for two days per week for each factory to carry a way its solid
waste, in lieu of (SD 2000-3000) for workshops or (SD 15.000-25000) for some
factories. At the same time, the defeciency in the number of vehciles leads to the
reduction of specified period for each factory. Sometimes, in addition to above, the
truck for carrying a way solid waste is delayed because of the non-asphalt roads
which delay their access to the factories. This leads to more deterioration.
All this led to an unsatisfactory situation against the presently adopted way of
collecting and disposing of waste from most of the factories. Thus, it is found that
(67.7%) of factory owners are not satisfied of the present method, as it is less effective
in management of this process. Thus, the method needs to be reviewed and developed.
102
Meanwhile, some other factory owners (32.3%) (Fig 4-4) see that the method is
“Not Bad” as it is solved the problem, to some extent (as it reduced the amount of
fines they used to pay to the Ministry of Health); because, in the past, most of the
factories were individually responsible of disposing of their waste, by throwing in the
nearest random place for disposal. This used to expose them to fine.
It was found out that 19.4% of the total industries covered do recycle their waste
such as "the Sudan Mint, Prothetic and Orthetic Corporation, modern Sudan's Printing
Press, Aina International Co. Ltd. .....etc. Fig (4-6).
The study also exposed a clear deficiency by the Ministry of Health in following
up of the health aspects inside the factories. Yet, some waste materials capture the
interest of this ministry; such as, those of the food industries sector, while some others
are completely ignored.
Figure (4-5) shows that (67.7%) of the factories are regularly followed by the
Ministry (once or twice a month) and (32.3%) are not followed. The study also dealt
with the present situation of the solid waste workers in the factories. It took samples
of these workers and found that (45.2%) of the workers had some basic eduction. As
for others, they were as follows:
(25.8%) received their secondary education;
(6.4%) received university education; and
(22.6%) were illiterate. (see Table (4-5)).
Table (4-6), the services provided in this realm. Thus, (67.7%) of the factories
provided protection requirements, while the remaining (32.3%) do not-owing to the
degraded level of education amongst the waste workers; and their non understanding
of the use of the protection instruments, they do not use them. Evenmore, the factores
neglect this problem and do not oblige the workers to use them.

103
Clothes, also, are not provided for all the workers. Thus, only (19.4) of the
factories provide boots and gloves and (12.9%) provide muzzles and (9.7%) provide
glasses for workers. Thus, this negligence of the protection equipment had led to the
appearance of disease cases, such as, chest, eye and skin diseases. So, (38.7%) of the
workers suffer from these diseases, while (61.3%) are free from them (see fig 4-8).
In the field of “benefiting from the solid waste (74.2%) view that there is no
benefit from the solid waste and there is no use of them, while (25.8%) see that use
could be made of the cartoon, plastic bags and similar waste.
Such deficiency in the treatment of the solid waste and the non-provision of means
of reuse or recycling of solid waste in the area, led to the flourishing of the trade of
such waste and the emergence of solid waste pickers and solid waste brokers around
the sanitary landfill area, behind Al Gooz treatment plant in Khartoum. This is
because the cars of the crash programme come loaded with huge amounts of solid
waste, in a good condition which encourages their reuse. (plate (9). Shows the
assembly of the waste pickers around the waste materials trucks; waiting for emptying
it.
Through out the field work, it was clear that (80%) of the waste pickers around the
sanitary landfill area, are less than (20) years of age, (20%) are between (20-30 years)
fig (4-10). The educational level of these pickers is as follows:
Primary (66.7%)
None (33.3%)
These youngsters often live in the lower-income areas; such as Mayo, Ingaz, the
horse race area or even in the sanitary landfill area itself. This is exposed in details as
follows:
(46.7%) live in Mayo area.
104
(33.3%) live in the Horse Race Area.
(6.7%) live inside the sanitrary landfill area.
(3.3%) live in Al-Jebel
(3.3%) live in Hilla Al-Gadeeda in Omdurman. Fig (4-12)
These youngsters sort out all types of solid waste. Some are specialized in plactics
(empty plastic bottles of pepsi and fresh drinks (plate (15). Others are specialized in
cartons (plate (11). Egg plates (plate (12) and some others in empty plastic and jute
socks (plate (14). This occurs, also in addition to the various types of metals (iron,
copper and aluminum).
After the end of th sorting out operations, the solid waste is packed into sacks, to
facilitate their transport by the help of waste carrying trucks to the areas of their
marketing.
Each picker collects between (4-5 sacks per day) and market, them in “the Suq
Shaabi” in Khartoum, Mayo, Omdurman and inside the sanitary lanfill area itself; as
follows:
(43.3%) Khartoum. (Popular Market of Khartoum.
(26.7%) “Mayo market”
(16.7%) Omdurman market”.
(13.3) Merchants inside the site.
Most of these children have become accustomed to this type of life. They say they
have no alternative, as this place provides them with their daily bread.
The sock of solid waste is sold for (SD 100-200). In case of metals, it is sold for
(SD 10-100 per kg).
The most important problems from which these pickers suffer are the robbries and
thefts inside the site, by the adults who steel the children’s sacks by force and murders

105
because of the a bundance of all types of wines and spirits. Also, sometimes, the
police try to control these situations, which causes a lot of disruption for the pickers’
work.
The waste brokers amongst the elders found their way to trade, through trading in
the solid waste. Most of them found their happiness in this work because it is
luerative.
So, now, most of them have private cars which they use for transporting their
purchases from the solid waste pickers, at low prices. They also depend upon “Suq
Shaabi” for marketing.
Table (4-8) and (4-9) give information about the solid waste brokers.
Plate (13) show one of these brokers and around him some solid waste pickers.
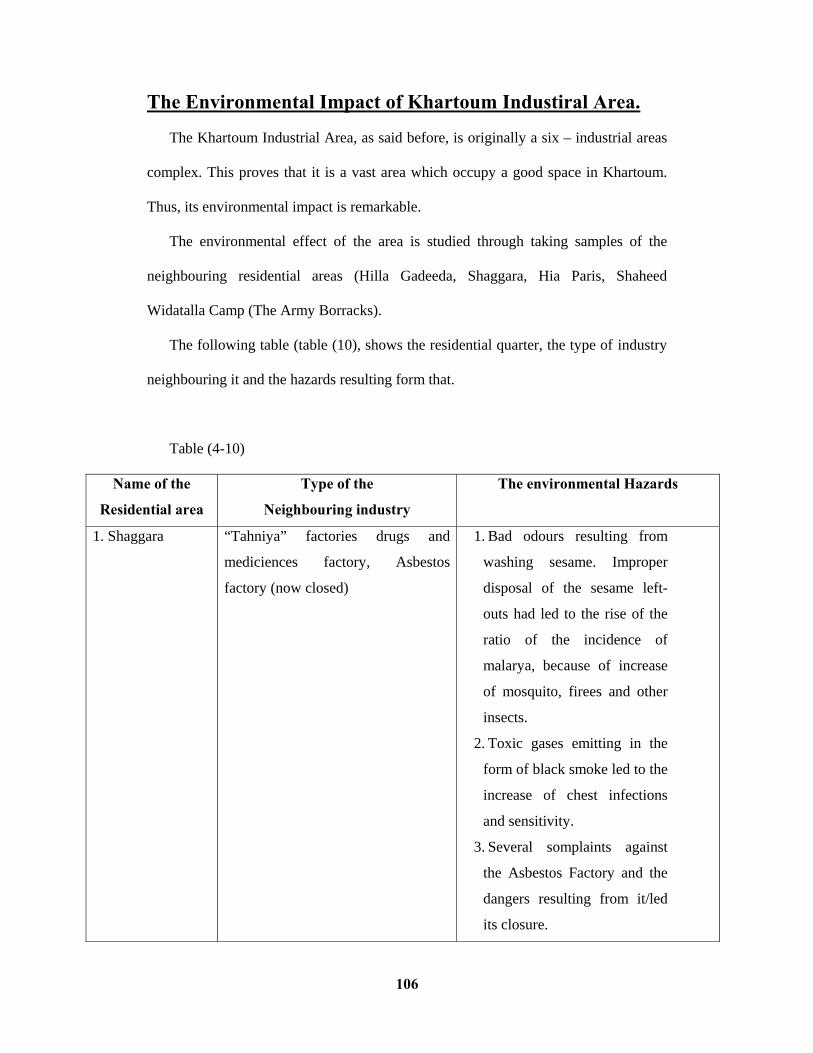
106
The Environmental Impact of Khartoum Industiral Area.
The Khartoum Industrial Area, as said before, is originally a six – industrial areas
complex. This proves that it is a vast area which occupy a good space in Khartoum.
Thus, its environmental impact is remarkable.
The environmental effect of the area is studied through taking samples of the
neighbouring residential areas (Hilla Gadeeda, Shaggara, Hia Paris, Shaheed
Widatalla Camp (The Army Borracks).
The following table (table (10), shows the residential quarter, the type of industry
neighbouring it and the hazards resulting form that.
Table (4-10)
Name of the
Residential area
Type of the
Neighbouring industry
The environmental Hazards
1. Shaggara “Tahniya” factories drugs and
mediciences factory, Asbestos
factory (now closed)
1. Bad odours resulting from
washing sesame. Improper
disposal of the sesame left-
outs had led to the rise of the
ratio of the incidence of
malarya, because of increase
of mosquito, firees and other
insects.
2. Toxic gases emitting in the
form of black smoke led to the
increase of chest infections
and sensitivity.
3. Several somplaints against
the Asbestos Factory and the
dangers resulting from it/led
its closure.

107
Name of the
Residential area
Type of the
Neighbouring industry The environmental Hazards
2. Hilla Gadeeda Industries based on metals e.g the
Mint and the central foundry
The gases emitting from forging metals
led to the rise of chest diseases and
sensitivity.
3. Shaheed
Widatalla Camp
(Army Borrocks)
The Tanneries (Khartoum tannery
and “the white Nile Tannery)”
The bad odurs which come out of the
processing of skin the increase Malarya
case because of the increas of
mosquitoes etc.
4. Hai Paris LooLI ice-cream factory + some
laboritories
Water drains do not operate in a good
way. Hazards in septic tanks. The area
cannot accommodate a factory because
of the houses syphons.
• The old industrial area (Khartoum South), have wide drains which flow to the
White Nile, but they are uncovered, which increases the probability of
environmental pollution.
• Also, Khartoum South area are full of workshops which work in iron and car
maintenance. Most of cars, thus are repaired there. So, since the 1950s, no
change was made to it and thus it suffers from the improper disposal of solid
waste, which cause many constraints to traffic in the area.
• The industrial area (Shaggara) is a new area; and there is no sanitary drainage
system. Some of the factories, especially those which produce “Tahnia” suffer
from the problem of “washing sesame” and the lack of a sanitary drainage
system. This had led to the accumulation of the sesame waste’ which had led
to environmental hazards (insects, bad odours etc).

108
• Also, the area has several factories operating in the field of plastic, yet, there is
deficiency in the treatment of its left-outs. This leads, in the long run, to major
harms to the environment.
The paints industry is considered of a major environmental effect; (such as, the
chemical mixes which result from the pastes etc)
• The liquid lime which results from some industries, such as liquid air
industry, sometimes it is sold to citizens and sometimes it is stored, which
forms a burden on the environment, because it contains blistering materials.
• Tanneries are also amongst the dangerous industries. Now they have become
in the heart of Khartoum, which forms a major environmental problem.
• In Soba, some factories dispose their waste directly in the Nile, this will lead
to water pollution and harmful effects to aquatic life.
• Also, some of factories which operate in the field of minerals and others,
dispose their waste inside the industrial area, a long the railway line which
divide the insutrial area into two parts-Eastern and Western this minerals affect
the nature of the agricultural land. This had led to harmful effect on plants in
the area. Most of these plants suffer from drought and others suffer from
dwarfness.

109
Chapter
Five
109
Chapter V
Conclusions and Recommendations
5.1 Conclusions:- Solid waste mangement is a threat in all countries of the world. In the Sudan it
is not an exception with Khartoum industrial area as a major contributor to the
problem.
The management of solid waste in Khartoum is uncoordinated and not subject
to any form of over all control. Management of solid wastes, wether from local
authorities or industrial sources need integrated use of management facilities.
Provided good management practice and any appropriate precautions are
adopted, risk to public heath is not likely to arise from refude disposal by existing
methods.
About 25% of the industries in the study area were examined, operating under
their calibrated capacity with low waste production.
Solid waste management is often haphazard because their dumping sites are
visited by both man and animals. Therefore easily communicated (transferred) within
the food chain.
Khartoum industrial area has a number of residential areas that are expanding
very fast hence the location of existing industries in the area may pose environmental
problem in the future. These industries should be located far from residential areas
and proper control over the management of the solid wastes must be emphasised by
the factories owners.
Most of the industries studied lack proper treatment methods moreover some
do not care to dispose their wastes properly. Accordingly, for effective management
110
of the solid wastes, effective management should be applied which include for
exmaple, daily collection of solid waste, storage and their transfer to dumping site.
Solid waste workers in the study area are inflicted by several occupational
diseases. These include chest eye and skin diseases as such protection equipment to be
availed to every worker to reduce or curb the incidence of these diseases. Moreover,
some solid workers are provided protective equipment whereas others are not, yet a
sizeable number who are provided do not use them.
Hence, there should be a strict law pertaining to the provision of safety
equipment to all solid waste workers and the benefits fully explain for the sake of
their health and objective of the industry.
In the Sudan in general and Khartoum industrial area in particular, there is
lack in the recycling of solid waste. This study show that of the industries covered
only 19.4% do recycle their solid waste. Therefore, the other industries should be
encouraged for recycle their wastes.
The study found out that in Khartoum Industrial Area there is no survey done
to formulate solid waste disposal policy. Therefore, running programme should be
maintained to ensure progressive availability of solid waste disposal facilities for ten
years a head.
111
5.2 Recommendations:-
1. Problems of sanitary drainage especially in El Shaggara industrial area to be
resolved.
2. Transport routes to the industrial area to be availed for easy communction.
3. Provision of protective equipment to solid waste workers and laws for strict
use of protective equipment to be emphasized to all solid waste workers.
4. Education and training of the solid waste workers on waste management to
encourage them take responsibility for the waste they generate.
5. Expansion and improvement of the “crash programme for Environmental
sanitation” and increase in the number of trucks involved in the project.
6. Industries should embark on the recycling of solid waste of reduce their effect
on the environment, and availability of markets for the recycled products.
7. Future Industries to be stablished far a way from residential areas i.e where
the raw material are found.
8. Sanitary landfill sites to be established in remote areas.
9. Education and Rehabilitation to be provided to the solid waste pickers
10. Management system should be found to follow up regulations of solid waste
problems.
112

113
114
115
مراجع عربية
–" دليل األثر البيئي فى المشروعات الصناعية والتنمية"، )م2000(. الحجار، صالح .1
.نهضة مصر للطباعة والنشر
. األردن– عمان –، دار وائل للنشر "لبيئيالتلوث ا"، )م2000. (العمر، مثني عبد الرازق .2
صالح، محمد الحسن، وآخرون دراسة لبرنامج نظافة والية الخرطوم، مشروع نظافة والية .3
. والية الخرطوم– مكتب المحافظ برئاسة الوالية –الخرطوم
، دار "أساسيات علم البيئة"، )2002(الطبعة األولى، . وسفاريني، غازي. عابد، عبد القادر .4
. عمان–وائل للطباعة والنشر
، محافظة الخرطوم، )م2002( البرنامج اإلسعافي إلصحاح البيئة، –مقدمة ورقة الصحة .5
.والية الخرطوم
، ) 1998(المؤتمر الصناعي األول المنعقد بقاعة المؤتمرات، منتزه المقرن العائلي، .6
.رطوماإلدارة العامة للصناعة، وزارة الشئون االقتصادية والية الخ

116
Appendices

116
Plate (1): Unregulated dumping site in the area southern of Shafa

117
Plate (2) and (3): shows the deficiency in solid waste management in the White Nile Tannery.

118
Plate (4): Improper management of solid waste, waste paper thrown randomly in side the 'printing house'

119
Plate (5): Solid waste produced during the day in 'Sindbad section' –in Saad Sweets factory.

120
Plate (6): A Worker in Saad Sweet factory weighs the solid waste of 'Toffee Section'.

121
Plate (7): Solid waste worker in the 'printing house' weighs solid waste produced during the day.
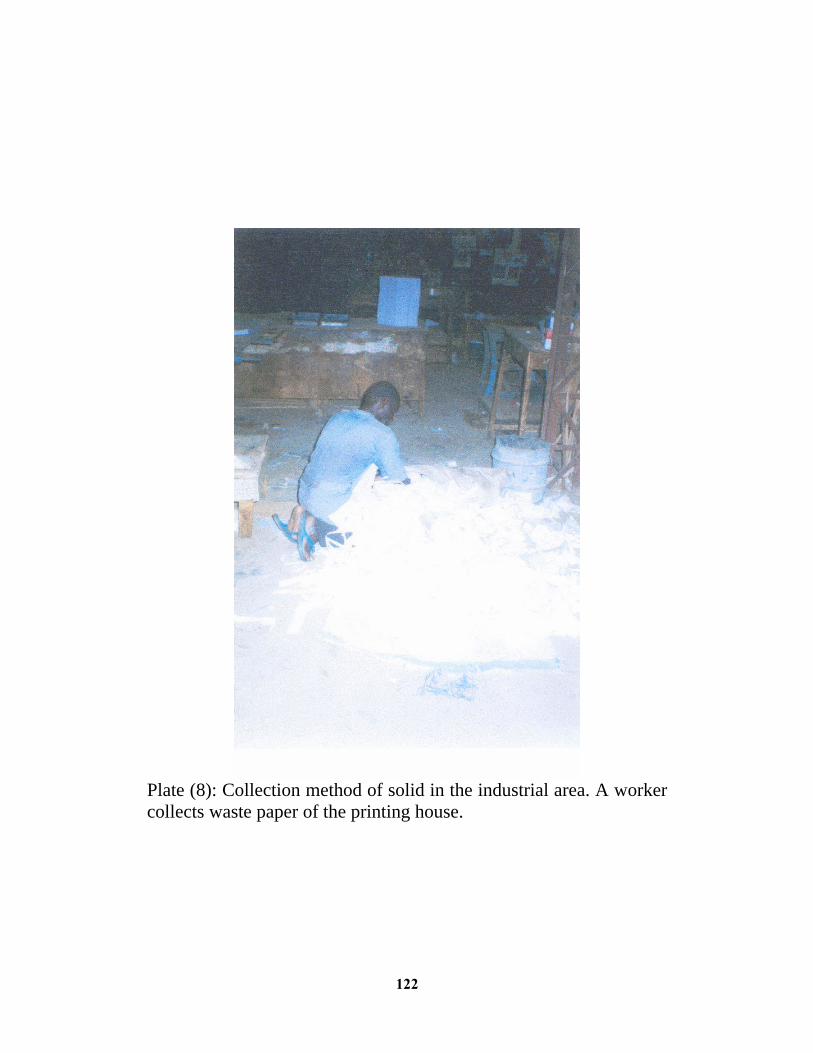
122
Plate (8): Collection method of solid in the industrial area. A worker collects waste paper of the printing house.
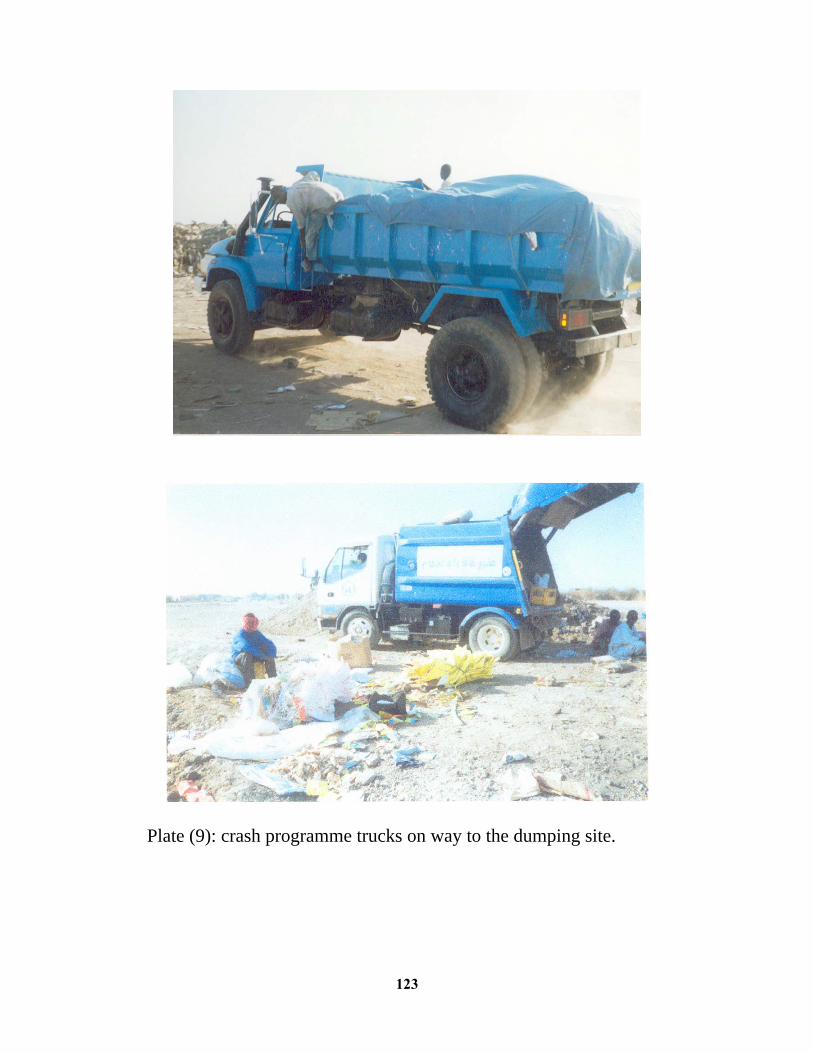
123
Plate (9): crash programme trucks on way to the dumping site.
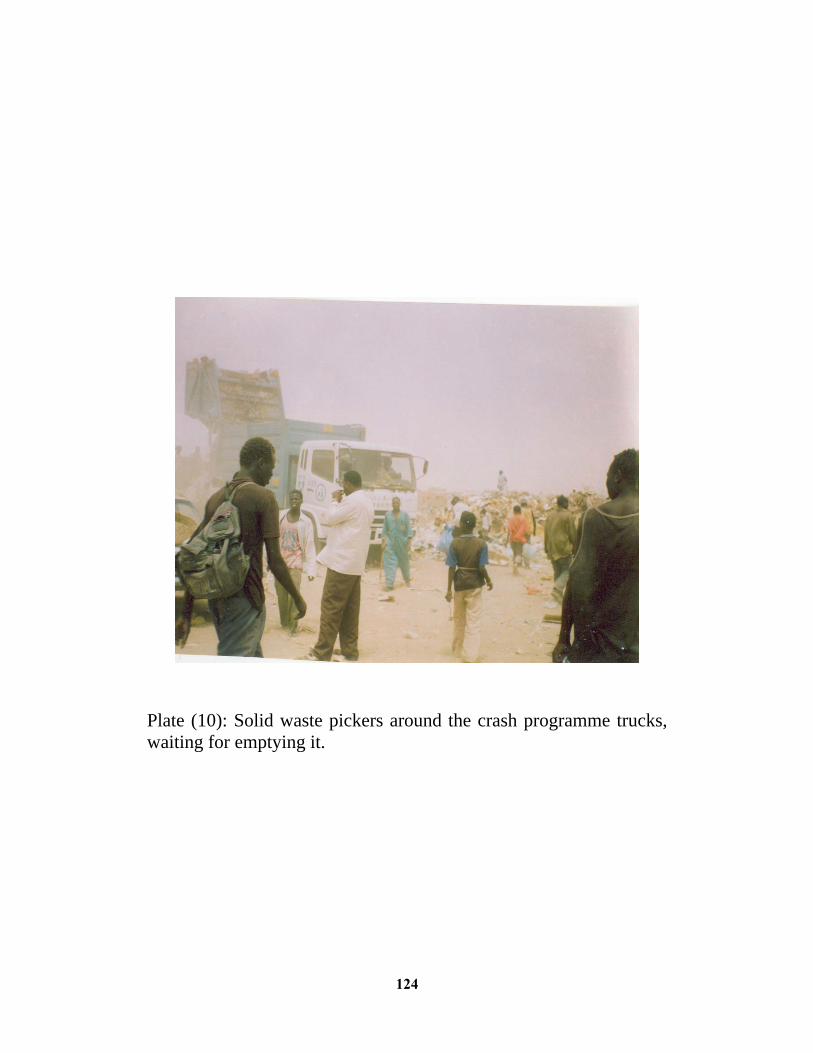
124
Plate (10): Solid waste pickers around the crash programme trucks, waiting for emptying it.

125
Plate (11) and (12): Solid waste pickers with different types of solid waste sorted around the sanitary.

126
Plate (13) and (14): A Solid waste broker around him solid waste pickers in sanitary landfill area.

127
Plate (15): A Solid waste pickers with the collected empty plastic bottles of Pepsi and fresh drinks.

128
Plate (16): Recycling of solid waste by a waste picker who made the table and the box from the solid waste of the dumping area.

129

130

131
(I)
Questionnaire form for Data Collection on the Management of
Solid Waste for Industries in Khartoum Industrial area
1. Serial No. ( )
2. Name of Industry .............................................
3. Location...............................……….................
4. Type of Ownership
(a) Private ( )
(b) Public ( )
(c) Cooperative ( )
5. Solid waste production:
(a) Type(s)
……………………………………………………………..
……………………………………………………………..
(b) Quantity
……………………………………………………………..
……………………………………………………………..
……………………………………………………………..
(c) Collection methods
……………………………………………………………..
……………………………………………………………..
……………………………………………………………..
(d) Disposal methods
Contract with crash program
(a) Yes (b) No
……………………………………………………………..
……………………………………………………………..
……………………………………………………………..
6. Seasonal effect on solid waste disposal
Yes( ) No ( )
……………………………………………………………..
……………………………………………………………..
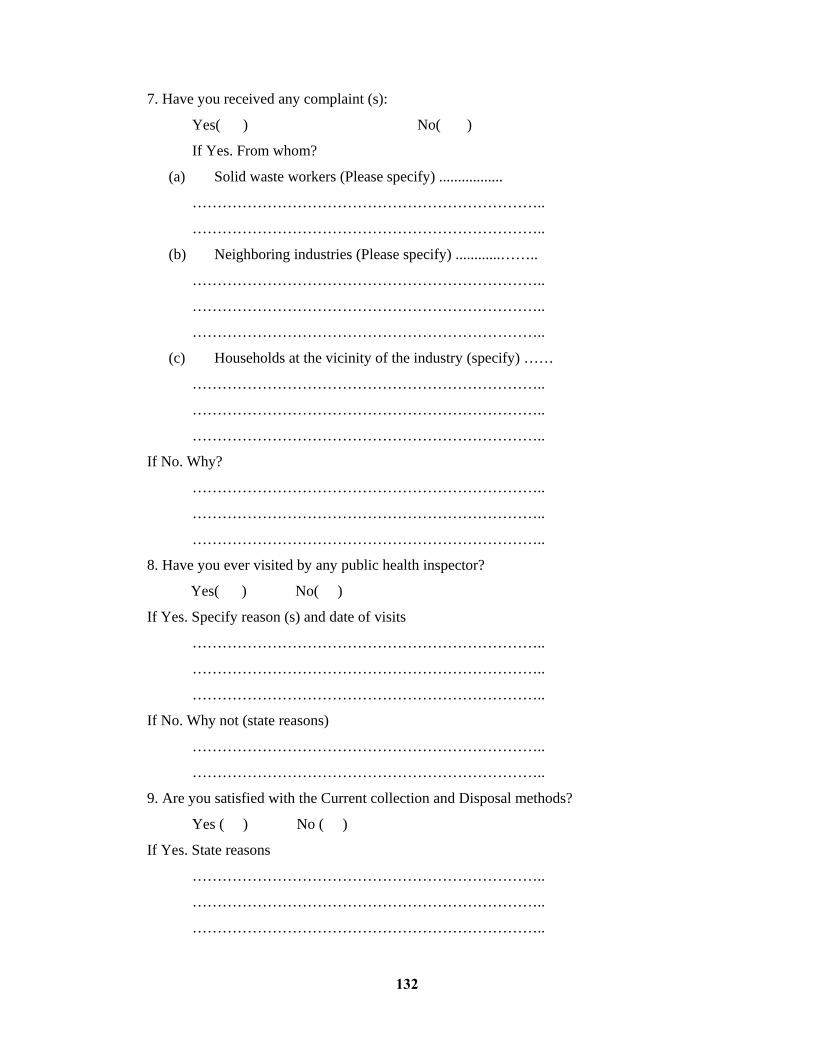
132
7. Have you received any complaint (s):
Yes( ) No( )
If Yes. From whom?
(a) Solid waste workers (Please specify) .................
……………………………………………………………..
……………………………………………………………..
(b) Neighboring industries (Please specify) ............……..
……………………………………………………………..
……………………………………………………………..
……………………………………………………………..
(c) Households at the vicinity of the industry (specify) ……
……………………………………………………………..
……………………………………………………………..
……………………………………………………………..
If No. Why?
……………………………………………………………..
……………………………………………………………..
……………………………………………………………..
8. Have you ever visited by any public health inspector?
Yes( ) No( )
If Yes. Specify reason (s) and date of visits
……………………………………………………………..
……………………………………………………………..
……………………………………………………………..
If No. Why not (state reasons)
……………………………………………………………..
……………………………………………………………..
9. Are you satisfied with the Current collection and Disposal methods?
Yes ( ) No ( )
If Yes. State reasons
……………………………………………………………..
……………………………………………………………..
……………………………………………………………..

133
If No. State reasons
……………………………………………………………..
……………………………………………………………..
……………………………………………………………..
10. What are the solid waste problems?
……………………………………………………………..
……………………………………………………………..
……………………………………………………………..
11. How would you improve the present disposal management methods. Give
suggestions and or recommendations
……………………………………………………………..
……………………………………………………………..
……………………………………………………………..

134
(II)
Questionnaire form for data Collection on Status of Solid Waste
for workers of Industrial Area
Date:
1. Age.....................................
2. Martial status:
Married ( ) Single ( )
3. Occupation...............................
4. Educational Level:
(a) Basic ( )
(b) Secondary ( )
(c) None ( )
If No. Why?
4. Services provided
(i) Protective material (Garments)
(a) Clothes ( ) (b) Boots ( ) (c) Gloves ( ) (d) mask
(e) gasses
5. Insurance:
(a) Health ( )
(b) Social ( )
(c) Disability ( )
(d) Others ( )
6. Any health complaints?:
Yes ( ) No ( )
If Yes. What?
……………………………………………………………..
……………………………………………………………..
……………………………………………………………..
7. Do you benefit from solid wastes in any from?
Yes ( ) No ( )
If Yes. (How?)
……………………………………………………………..
……………………………………………………………..
……………………………………………………………..

135
(Ill)
(a) Questionnaire form for data Collection on Solid for Waste
pickers a round the Dumping Area
Date: Serial No: ( )
1. Age .....................................
2. Martial status:
Married ( ) Single ( )
3. Residence ..................................................................
4. Educational level:
(a) Primary (b) Secondary (c) Other
5. Type of solid waste picked
……………………………………………………………..
……………………………………………………………..
……………………………………………………………..
6. Quantity collected?
……………………………………………………………..
……………………………………………………………..
……………………………………………………………..
7. To whom do you sell?
……………………………………………………………..
……………………………………………………………..
……………………………………………………………..
8. Price?
……………………………………………………………..
……………………………………………………………..
……………………………………………………………..
9. Problems encountered?
……………………………………………………………..
……………………………………………………………..
……………………………………………………………..
10. Are you Satisfied on the trade?
Yes( ) No( )

136
If Yes. How?
……………………………………………………………..
……………………………………………………………..
……………………………………………………………..
If No. Why not?
……………………………………………………………..
……………………………………………………………..
……………………………………………………………..
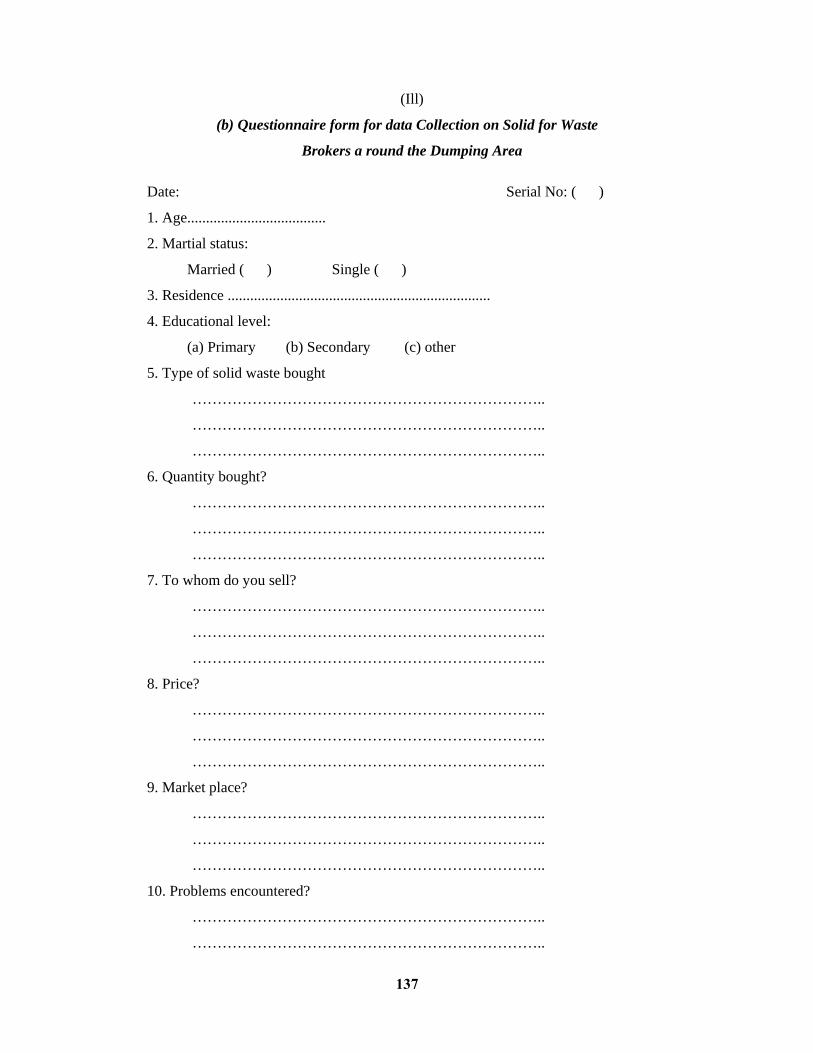
137
(Ill)
(b) Questionnaire form for data Collection on Solid for Waste
Brokers a round the Dumping Area
Date: Serial No: ( )
1. Age.....................................
2. Martial status:
Married ( ) Single ( )
3. Residence ......................................................................
4. Educational level:
(a) Primary (b) Secondary (c) other
5. Type of solid waste bought
……………………………………………………………..
……………………………………………………………..
……………………………………………………………..
6. Quantity bought?
……………………………………………………………..
……………………………………………………………..
……………………………………………………………..
7. To whom do you sell?
……………………………………………………………..
……………………………………………………………..
……………………………………………………………..
8. Price?
……………………………………………………………..
……………………………………………………………..
……………………………………………………………..
9. Market place?
……………………………………………………………..
……………………………………………………………..
……………………………………………………………..
10. Problems encountered?
……………………………………………………………..
……………………………………………………………..

138
11. Are you Satisfied with the business?
Yes( ) No( )
If Yes. How?
……………………………………………………………..
……………………………………………………………..
……………………………………………………………..
If No. Why not?
……………………………………………………………..
……………………………………………………………..
……………………………………………………………..

139
(IV)
^Questionnaire form for Data Collection on Solid Waste for The
Households at the Vicinity of Industries Under Study
Serial No:......................
1. Name of residential area …………………………………………
2. Name of nearby Industry ……………………………..………….
3. Type of wastes disposed by the Industry?
……………………………………………………………..
……………………………………………………………..
……………………………………………………………..
……………………………………………………………..
4. Quantity ……………………………………………………….
……………………………………………………………..
……………………………………………………………..
……………………………………………………………..
……………………………………………………………..
5. Problems due to industrial wastes disposal?
……………………………………………………………..
……………………………………………………………..
……………………………………………………………..
……………………………………………………………..