solid waste in washington state · pdf filedisposal of solid waste ... terry husseman...
TRANSCRIPT
Solid Waste InWashington State
Solid Waste and Financial Assistance ProgramDecember 2002
Publication #02-07-019


Solid Waste in Washington State
Eleventh Annual Status Report Prepared by: Washington State Department of Ecology
Solid Waste and Financial Assistance Program
December 2002 Publication No. 02-07-019

This report and the supporting database information can be accessed at:
http://www.ecy.wa.gov/programs/swfa/index.html Or for additional copies of this document, contact:
Department of Ecology
Publications Distribution Center PO Box 47600
Olympia, WA 98504-7600 Telephone: (360) 407-7472
The Department of Ecology is an equal opportunity agency and does not discriminate on the basis of race, creed, color, disability, age, religion, national origin, sex, marital status, disabled veteran's status, Vietnam Era veteran's status or sexual orientation. For more information or if you have special accommodation needs, please contact Ellen Caywood, Solid Waste and Financial Assistance Program, at (360) 407-6132 or [email protected].

Table of Contents
Table of Contents
Acronyms......................................................................................................................... vii
Acknowledgments ............................................................................................................ ix
Executive Summary......................................................................................................... xi
Summary of Findings ................................................................................................. xi Recycling ....................................................................................................... xi Litter Collection Efforts................................................................................. xi Partnering for the Environment .................................................................... xii Disposal of Solid Waste............................................................................... xiii Moderate Risk Waste................................................................................... xiii
Chapter I Issues Facing Solid Waste...............................................................................1
Revising the Standards For Solid Waste ......................................................................1 Diversion as a Measurement Option ............................................................................2 Beyond Waste--The State Solid Waste Strategic Plan .................................................4 Statewide Litter Prevention Strategy............................................................................5 Product Stewardship .....................................................................................................6 Information Technology and the Web..........................................................................8
Chapter II Solid Waste Handling Infrastructure ........................................................11
Landfill Classification ................................................................................................15 Ash Monofills ........................................................................................................15 Inert/Demolition Waste Landfills ..........................................................................16 Limited Purpose Waste Landfills...........................................................................17 Municipal Solid Waste Landfills ...........................................................................17 Woodwaste Landfills .............................................................................................18
Intermediate Classification .........................................................................................19 Bale Station............................................................................................................19 Compacting Station................................................................................................19 Compost Facilities .................................................................................................20 Drop Boxes ............................................................................................................20 Piles........................................................................................................................21 Recycling Facilities................................................................................................22 Surface Impoundments ..........................................................................................23 Transfer Stations ....................................................................................................24 Moderate Risk Waste Facilities .............................................................................25 Tire Piles ................................................................................................................25
Incineration Classification..........................................................................................26 Ancillary - Other Classification..................................................................................26
Landspreading Disposal Facilities .........................................................................27 Other Facilities.......................................................................................................27
Solid Waste in Washington State --Eleventh Annual Status Report i
Table of Contents
Chapter III Partnering for the Environment..........................................................................29
Partnering for the Environment through Local Planning .......................................................29 Partnering for the Environment through Financial Assistance...............................................31
Coordinated Prevention Grants (CPG) ..............................................................................31 Grants to Citizens - Public Participation Grants (PPG) .....................................................34
Partnering for the Environment through Public/Private Cooperation ....................................37 Cascadia Region Green Building Council .........................................................................37 Sustainable Housing Innovation Partnership .....................................................................37 Sustainable Design and Construction Seminar Series .......................................................38 Cooperative Composting Facility ......................................................................................39 Xeriscape Demonstration Garden ......................................................................................40 Fort Lewis Sustainability Initiative....................................................................................40 National Paint Dialogue.....................................................................................................41
Partnering for the Environment by Beneficial Use of Wastes................................................41 Biosolids ............................................................................................................................41 Composting ........................................................................................................................42
Partnering for the Environment by Focusing on Specific Problem Waste Streams ...............45 Electronic waste .................................................................................................................45 Tires - A Growing Waste Management Problem ..............................................................48 PBTs: Mercury and Certain Pesticides ..............................................................................50 Old Paint ............................................................................................................................51 Moderate Risk Waste.........................................................................................................52
Partnering for the Environment through Education and Information Sharing .......................53 The Closed-Loop Scoop Newsletter ..................................................................................53 Terry Husseman Sustainability in Public Schools Awards Program.................................53 Recycling Information Line...............................................................................................54 Washington State Recycling Association (WSRA)...........................................................55 Operator Certification Program .........................................................................................55
Ecology Walks Its Talk ..........................................................................................................57
Chapter IV Statewide Litter Prevention and Cleanup Programs..........................................59
State Launches Litter Prevention Campaign ..........................................................................59 Litter Program Funding ..........................................................................................................62 Litter Cleanup by Other State Agencies .................................................................................63
Department of Corrections.................................................................................................64 Department of Natural Resources......................................................................................64 Department of Transportation............................................................................................65 Parks and Recreation Commission ....................................................................................65
Ecology Youth Corps .............................................................................................................65 Community Litter Cleanup Program ......................................................................................66 Looking Ahead .......................................................................................................................67
ii Solid Waste in Washington State --Eleventh Annual Status Report

Table of Contents
Chapter V The 2001 Recycling Survey for Washington ........................................................69
Recycling Rates ......................................................................................................................69 2001 Recycling Survey Process and Results ..........................................................................71 Market Trends.........................................................................................................................75
Organic Materials...............................................................................................................76 Paper Products ...................................................................................................................77 Metals.................................................................................................................................78 Glass, Plastics, and Other Recyclable Materials................................................................79
Individual Waste Generation ..................................................................................................81 Benefits of Recycling .............................................................................................................82 Diversion as a Measurement Option.......................................................................................84
Chapter VI Disposal of Solid Waste in Washington................................................................89 Municipal Solid Waste Landfills ............................................................................................89
Amount of Waste Disposed in Municipal Solid Waste Landfills......................................89 Types of Waste Disposed in Municipal Solid Waste Landfills .........................................91
Waste-to-Energy/Incineration.................................................................................................92 Ash Monofill...........................................................................................................................92 Trends in Municipal Solid Waste Disposal Methods .............................................................93 Inert/Demolition, Limited Purpose and Woodwaste Landfills...............................................94 Movement of Solid Waste ......................................................................................................96
Movement of Waste Between Counties.............................................................................96 Waste Imported from Outside the State.............................................................................99 Waste Exported from the State ........................................................................................100 Trends in Interstate Waste Movement for Washington ...................................................100
Determining the Amount of Solid Waste Disposed .............................................................102 Waste Generated by Washington Citizens for Disposal at MSW Facilities....................102 Total Waste Disposed in Washington State.....................................................................105
Future Capacity at Municipal Solid Waste Landfills ...........................................................106
Chapter VII Moderate Risk Waste Collection System..........................................................111 Annual Reporting and Accuracy of Data Collection............................................................112 Year 2001 Data .....................................................................................................................112 MRW Collected ....................................................................................................................114
HHW (no UO sites) Pounds Per Participant by County Size ..........................................114 Household Hazardous Waste ...........................................................................................115 Conditionally Exempt Small Quantity Generator Waste.................................................116 Used Oil Sites ..................................................................................................................117
Statewide Level of Service ...................................................................................................117 Collection by Waste Category and Type ..............................................................................119 Trends in Collection .............................................................................................................119 Mercury Waste Streams and Other Waste Streams..............................................................120 References.............................................................................................................................121
Solid Waste in Washington State --Eleventh Annual Status Report iii

Table of Contents
Appendix A State Map With County Names............................................................................ A-1
Appendix B Washington State Recycling Rate .........................................................................B-1
Appendix C Facility Specific Disposal Data For 2001 .............................................................C-1
Appendix D Disposal Data Summaries .................................................................................... D-1
List of Tables Table 2.1 Classification Table ............................................................................................ 12 Table 2.2 Solid Waste Facilities in Washington ................................................................. 13 Table 2.3 Landfill Classification......................................................................................... 15 Table 3.1 Current Status of Solid Waste Plans in Washington........................................... 30 Table 3.2 Waste Management Activities Funded by CPG Program for 2002-2003........... 32 Table 4.1 Interagency Agreements between Ecology and Other State Agency for Litter
Activities ............................................................................................................. 63 Table 4.2 Department of Corrections Litter Removal Activity .......................................... 64 Table 4.3 Department of Natural Resources Litter Removal Activity ............................... 64 Table 4.4 Department of Transportation Litter Removal Activity ..................................... 65 Table 4.5 Statistics from the Community Litter Program................................................... 67 Table 5.1 Recycling Rate 1986 to 2001.............................................................................. 69 Table 5.2 State Tonnage by Commodity: 1998-2001 Washington State Recycling
Surveys................................................................................................................ 73 Table 5.3 Generation, Materials Recovery, Composting, Waste Diversion, and
Discards of Municipal Solid Waste .................................................................... 74 Table 5.4 Generation, Materials Recovery, Composting, Waste Diversion, and
Discards of Municipal Solid Waste .................................................................... 74 Table 5.5 Generation, Materials Recovery, Composting, Waste Diversion, and
Discards of Municipal Solid Waste .................................................................... 82 Table 5.6 Energy Savings and Greenhouse Gas Impacts from Recycling - 2001 .............. 83 Table 5.7 Reported Materials Not Included in the Recycling Survey ................................ 86 Table 6.1 Waste Disposed in MSW Landfills – Public/Private.......................................... 90 Table 6.2 Waste Types Reported Disposed in MSW Landfills .......................................... 92 Table 6.3 Waste Disposed in MSW Landfills and Incinerators in 2001............................ 94 Table 6.4 Waste Types and Amount Disposed at Inert/Demolition Landfills.................... 95 Table 6.5 Waste Types and Amount Disposed at Limited Purpose Landfills .................... 96 Table 6.6 Waste Types and Amount Disposed at Woodwaste Landfills............................ 96 Table 6.7 Out-of-State Waste Disposed in Washington ..................................................... 99 Table 6.8 Comparison of Imported-to-Exported Waste for all Solid Waste Facilities...... 100 Table 6.9 Washington State Population............................................................................. 104 Table 6.10 Per Capita Disposed, Recycled and Generated Numbers .................................. 105 Table 6.11 Total Amounts of Solid Waste Disposed in Washington .................................. 105 Table 6.12 Estimated Years to Closure for MSW Landfills ................................................ 106 Table 7.1 Individual County Population by Size ............................................................... 113
iv Solid Waste in Washington State --Eleventh Annual Status Report
Table of Contents
Table 7.2 Year 2001 Total Pounds Collected Per Waste Category ................................... 114 Table 7.3 Total Pounds per Waste Category for Years 1998, 1999, 2000, 2001............... 115 Table 7.4 HHW Dominant Waste Types Collected in 2001.............................................. 115 Table 7.5 High Collections of HHW (no UO Sites) .......................................................... 116 Table 7.6 CESQG by Waste Type Collected in 2001(top 20 types).................................. 116 Table 7.7 High Collection Counties, Used-Oil Sites Pounds Per Capita by County Size . 117 Table 7.8 Various Data by County..................................................................................... 118 Table 7.9 Total Pounds of MRW Collected by Waste Category ....................................... 119 Appendix B Table B.1 Washington State Recycling Rate 1986 to 2002................................................ B-1 Appendix C Table C.1 2001 Total Waste Disposed in Municipal Solid Waste Landfills...................... C-1 Table C.2 2001 Total Waste Disposed Energy Recovery/Incinerators .............................. C-1 Table C.3 2001 Total Waste Disposed Inert-Demolition Waste Landfills......................... C-2 Table C.4 2001 Total Waste Disposed Limited Purpose/Special Use Facilities................ C-3 Table C.5 2001 Total Waste Disposed for Woodwaste Landfills ...................................... C-3 Table C.6 2001 Total Waste Composted............................................................................ C-4 Appendix D Table D.1 Waste Types Reported Disposed in MSW Landfills 1992-2001...................... D-1 Table D.2 Waste Types and Amount Disposed at Inert/Demolition Landfills 1992-2001 D-1 Table D.3 Waste Types and Amount Disposed at Limited Purpose Landfills 1992-2001. D-2 Table D.4 Waste Types and Amount Disposed at Woodwaste Landfills 1992-2002 ........ D-2 Table D.5 Per Capita Disposed, Recycled and Generated Numbers .................................. D-3 Table D.6 Total Amounts of Solid Waste Disposed in Washington .................................. D-3 Table D.7 Solid Waste Imported for Disposal 1991-2001 ................................................. D-4 Table D.8 Waste Exported from Washington for Disposal 1993-2001.............................. D-4 List of Figures Figure 1.1 Alternative Recycling Rate Comparison 1999 to 2001 .................................3 Figure 1.2 Washington Waste Generation 1999 to 2001 ................................................4 Figure 4.1 Litter Hotline Calls .......................................................................................61 Figure 5.1 Washington State Recycling Rate 1986 to 2001..........................................70 Figure 5.2 Recycled Materials Stream - 2001................................................................76 Figure 5.3 Organics Recycled 1986 to 2001 Yard, Wood and Food Wastes................76 Figure 5.4 Organics Recycling 1989-2001....................................................................77 Figure 5.5 Paper Products 1986 to 2001 .......................................................................78 Figure 5.6 Metals Recycled 1986 to 2001.....................................................................79 Figure 5.7 Glass & Other Materials Recycled 1986 to 2001 ........................................80 Figure 5.8 Plastics Recycling 1986 to 2001..................................................................80 Figure 5.9 Six Major Recycling Categories 1986 to 2001............................................81 Figure 5.10 Pounds Disposed of, Recycled, and Generated (Per Person/Day)................82
Solid Waste in Washington State --Eleventh Annual Status Report v

Table of Contents
vi Solid Waste in Washington State --Eleventh Annual Status Report
Figure 5.11 Comparison of Energy Use through Recycling and Disposal & Virgin Manufacturing...............................................................................................83
Figure 5.12 Alternative Recycling Rate Comparison 1999 to 2001 ...............................85 Figure 5.13 Amount of Materials Recycled (x 1,000 tons)..............................................86 Figure 5.14 Washington Waste Generation .....................................................................87 Figure 6.1 MSW Landfill Size .......................................................................................90 Figure 6.2 Comparison of Waste Disposed for Public and Private Facilities (tons)......91 Figure 6.3 Comparison of Solid Waste Landfilled & Incinerated .................................94 Figure 6.4 trend of Imported/Exported Solid Waste ....................................................102 Figure 6.5 Washington State Trends in Solid Waste Generated, Recycled & Disposed (in tons) ...................................................................................103 Figure 6.6 Washington State Trends in Solid Waste Generated, Recycled &
Disposed (tons/person/year)........................................................................104 Figure 6.7 Comparison of Remaining Permitted Capacity 1993 and 2002..................108 Figure 6.8 Remaining Capacity MSW Landfills..........................................................108 Figure 7.1 Percent of State Population by County Size ...............................................113 Figure 7.2 Pounds Per Participant ................................................................................114 List of Maps Map A: Location of MSW Landfills & Energy Recover Facilities ................................. 93 Map B: 2001 Solid Waste to Roosevelt Regional Landfill (in Tons).............................. 98 Map C: Imported and Exported Waste (2001)................................................................ 101 Map D: Remaining Permitted MSW Landfill Capacity (as of April 2002) ................... 107 Appendix A State Map with County Names ............................................................................................... A-1
Acronyms
Acronyms
CESQG Conditionally exempt small quantity generator CDL Construction, Demolition and Landclearing CPG Coordinated Prevention Grants EPA Environmental Protection Agency ESSB Engrossed Substitute Senate Bill EYC Ecology Youth Corps GA Department of General Administration HDPE High-density polyethylene HHW Household Hazardous Waste LDPE Low-density polyethylene MFS Minimum Functional Standards MRW Moderate Risk Waste MSW Municipal Solid Waste PCS Petroleum Contaminated Soils PPG Public Participation Grants RCW Revised Code of Washington SQG Small quantity generator SSB Substitute Senate Bill SW&FAP Solid Waste & Financial Assistance Program WAC Washington Administrative Code WR/R Waste Reduction/Recycling
Solid Waste in Washington State --Eleventh Annual Status Report vii


Acknowledgments
Acknowledgments This is the eleventh annual status report prepared by the Solid Waste & Financial Assistance Program. I have had the lead responsibility for its preparation but could not have done it with out the help of the staff listed below. Special thanks go to the following Ecology staff for providing data and information for this annual report:
Headquarters Jim Bill Suzanne Crouch Kyle Dorsey Gloria Dreyer Annette Gregor Steve Loftness Randy Martin
Gretchen Newman Michelle Payne Cheryl Smith
Kathy Seel Megan Warfield Holly Wescott
Central Regional Office Tamera Archer Kip Eagles Shelly Smith Peter Severtson
Eastern Regional Office Marni Solheim Jim Wavada
Northwest Regional Office Peter Christiansen Kristen Dorwin Emmie Johnson
Southwest Regional Office Mike Drumright Chuck Matthews Shelly McClure Tami Morgan Ramsey David Nightingale Paige Sorensen
Final Document Preparation:
Joyce Lobe, Text Processing Sonya Kirkendall, Text Processing
The Solid Waste and Financial Assistance Program would also like to thank the many Recycling Coordinators in the counties who assisted Gretchen Newman with the preparation of the 2001 Recycling Survey. Thanks to all who contributed.
Ellen Caywood Environmental Planner Solid Waste & Financial Assistance Program
Solid Waste in Washington State --Eleventh Annual Status Report ix


Executive Summary
Executive Summary Summary of Findings
This annual solid waste report reflects conditions and activities in solid waste in Washington state. Chapter I discusses some emerging issues that the Solid Waste & Financial Assistance Program (SW&FAP) is dealing with in the coming year including the progress toward revising the State Solid Waste Management Plan, “Beyond Waste,” completion of revisions to the rule for solid waste facilities, chapter 173-350 WAC, Solid Waste Handling Standards, the litter prevention campaign, the move toward sustainability and new measurements for waste diversion. The remaining chapters of the annual report discuss the solid waste infrastructure in the state, partnering for the environment through grants to local governments and efforts on specific waste streams, litter collection efforts, the 2001 statewide recycling survey results, information on waste disposal and moderate risk waste. Some of the data is for 2001 (recycling and disposal information), while other data is current to late 2002 (litter pickup numbers and facility status). A brief summary of significant information is highlighted below.
Recycling
• The 2001 recycling rate increased to 37% after remaining fairly stagnant at
33-35% since 1997. This rate accounts for the “traditional recyclable materials. Increased recycled tonnage and a slight decrease in the disposed amount in municipal solid waste landfills and energy-recovery facilities helped to increase the recycling rate.
• In 2001, the Solid Waste & Financial Assistance Program (SW&FAP) began to include other types of materials in the recycling survey, and calculated a recycling rate parallel to the traditional one. This “alternative” recycling rate includes non-MSW recyclables and non-MSW waste types as inert, construction, demolition, woodwaste and tires. This rate is calculated using the disposed amounts from the traditional sources as well as woodwaste, inert/demolition and limited purpose landfills. For 2001, this “alternative” recycling rate was 41%.
Litter Collection Efforts
• For fiscal year 2002, litter collection efforts by Ecology Youth Corps (EYC)
picked up a total of 65,543 bags of litter over a total of 4,571 road miles and 1,280 acres. This is the equivalent of 492 tons, or 131,086 cubic feet. Of this total amount of litter 9,641 bags or 72 tons were recycled.
Solid Waste in Washington State --Eleventh Annual Status Report xi

Executive Summary
• Other state agency programs were coordinated by SW&FAP. During Fiscal Year 2002, 1,402,819 pounds of litter and illegally dumped materials were collected by Departments of Corrections and Natural Resources.
• The Community Litter Cleanup Program provides funds to local governments
through contracts for local litter collection programs. During the fourth cycle (July 2001 – June 2002) local governments partnered with volunteer groups and worked with state and local offender crews and cleaned 21,329 road miles and 2,644 illegal dump sites. A total of 3,810,540 pounds of litter and illegally dumped materials were collected, of which 515,043 pounds were recycled.
Partnering for the Environment
• Ecology provided over $17.4 million in Coordinated Prevention Grants to local governments for the 2002/03 cycle. These funds leveraged local matching funds to support over $23 million worth of solid and moderate risk waste projects.
• Ecology continues efforts with the building industry and local governments to promote a sustainable approach to building practices and the effects on the environment and human health.
• Changes continue in the way solid waste is managed. Organics are being
composted and land applied for beneficial use. The recycling of industrial by-products for beneficial uses is increasing and the revised Solid Waste Facility Standards, chapter 173-350 WAC, will address the new technologies through a Beneficial Use Exemption process.
• Efforts with local governments and other partners is focusing on emerging
problem waste streams including electronic waste, tires, old paint, moderate risk waste and persistent bioaccumulative toxins (PBTs) such as mercury and certain pesticides.
• For the past 14 years, schools have been recognized for their waste reduction and
recycling efforts, through the “Terry Husseman Outstanding Waste Reduction and Recycling in Public Schools Awards.” This program was redesigned in 2002 to focus more on Sustainability. Over the next several years, SW&FAP intends to reward schools that embrace the sustainability principles through the renamed “Terry Husseman Sustainability in Public School Awards Program.”
xii Solid Waste in Washington State --Eleventh Annual Status Report

Executive Summary
Disposal of Solid Waste
• In 2001, 20 municipal solid waste landfills accepted 4,525,019 tons of waste. This was a slight decrease from 4,659,582 tons in 2000. Two of those landfills closed in 2002.
• The total amount of waste disposed in all categories of landfills and incinerators rose slightly from 6,425,959 tons in 2000 to 6,453,904 tons in 2001
• Currently 15 of Washington’s 39 counties have an operating municipal solid waste landfill. Most counties without their own municipal solid waste landfills have long-haul contracts to either Roosevelt Regional Landfill in Klickitat County or one of three landfills in Oregon.
• Four incinerators burned 496,152 tons of waste in 2001, accounting for 10% of the waste disposed in state. Of the four operating incinerators, two burn municipal solid waste, the other two incinerator woodwaste.
• Both the amount of waste imported (172,696 tons) and exported (1,175,953 tons) decreased in 2001, with almost seven times as much waste exported as imported. The imported waste accounts for about 3% of the solid waste disposed and incinerated in Washington.
• The 18 operating municipal solid waste landfills reported in April 2002 a statewide permitted landfill capacity of 179 million tons, or approximately 39 years at the current rate of disposal. The majority of that permitted capacity (86%) is at private landfills, with Roosevelt Regional Landfill in Klickitat County accounting for 75% of the statewide capacity.
Moderate Risk Waste
• In Washington state there are 42 programs that manage moderate risk waste. All
39 counties have some kind of an MRW program.
• In 2001, Washington collected over 15.6 million pounds of household hazardous waste (HHW), over 11.3 million pounds of used oil (UO), and over 1.0 million pounds of conditionally exempt small quantity generator (CESQG) waste, for a total of nearly 27.9 million pounds.
Solid Waste in Washington State --Eleventh Annual Status Report xiii


Issues Facing Solid Waste
Chapter I Issues Facing Solid Waste
Revising the Standards for Solid Waste In January 2003, chapter 173-350 WAC, Solid Waste Handling Standards, will be adopted. This rule will essentially replace the requirements of chapter 173-304 WAC, Minimum Functional Standards for Solid Waste Handling (MFS). The revised Solid Waste Handling Standards include the requirements for most of the solid waste facilities in Washington, excluding municipal solid waste landfills which are regulated under chapter 173-351 WAC, Criteria for Municipal Solid Waste Landfills. While there are similarities with the MFS, there have also been some significant changes and modifications:
• Beneficial Use Exemption – the legislature, through ESSB 6203, directed Ecology to develop a process to exempt from permit requirements activities that beneficially use solid waste and pose little threat to human health and the environment. Requirements to obtain this permit exemption are contained in WAC 173-350-200.
• Permit Deferrals – the legislature, also through ESSB 6203, directed Ecology to
explore methods for deferring solid waste permits to other environmental permits. This procedure can be found in WAC 173-350-710.
• Limited Purpose and Inert Waste Landfills – these are the only two types of
solid waste landfills regulated under chapter 173-350 WAC (municipal solid waste landfills are regulated under chapter 173-351 WAC). There are no longer inert/demolition, woodwaste or problem waste landfill classifications. The two landfill types, limited purpose and inert landfills have similar requirements to the MFS. One significant change is that inert waste landfills cannot accept demolition waste. Inert waste management requires a permit only when being disposed of or used as fill in quantities greater than 250 cubic yards. For limited purpose landfills design requirements are based on the level of risk posed by the type of waste and the site characterization. Financial assurance and ground water monitoring are required for limited purpose landfills.
• Inert materials – these are defined in rule and criteria for classifying waste is
found in WAC 173-350-990.
• Ground Water Monitoring Requirements – each section of the rule indicates whether monitoring is required for that type of facility. Testing methods and parameters and site characterization are clarified in WAC 173-350-500. More flexibility is allowed under the rule. There is also improved coordination with chapter 173-200 WAC, Ground Water Quality Standards.
Solid Waste in Washington State --Eleventh Annual Status Report 1
Chapter I
• Waste Recycling Facilities – the definition of recycling comes from chapter 70.95 RCW, the Solid Waste Management Act. The act of recycling is categorically exempt with the conditions that it complies with local solid waste management plans and that Ecology and the jurisdictional health department are notified of the intent to operate. Storage for the purpose of recycling is subject to appropriate regulation under chapter 173-350 WAC.
• Compost Facilities – compost meeting certain quality standards is no longer a
solid waste under this rule and is considered “composted material.” Testing parameters and frequency are identified in WAC 173-350-220. Some specific exemptions are included in the rule. For permitted facilities, pads are required; storm water and leachate must be controlled. Other requirements can be found in WAC 173-350-220.
• Moderate Risk Waste – requirements for household hazardous waste facilities
and events and for conditionally exempt small quantity generators are included in WAC 173-350-360. Financial assurance will be required for fixed MRW facilities that store more than five hundred and fifty gallons of MRW on-site.
• Waste Tire Storage – requirements for waste tire storage and transportation are
included in WAC 173-350-350. Requirements of chapter 173-314, Waste Tire Carrier and Storage Site Licenses, are being incorporated in that section. Financial assurance will be required for waste tire storage facilities permitted under this rule.
Additional information and link to Chapter 173-350 WAC, Solid Waste Handling Standards, can be found at http://www.ecy.wa.gov/programs/swfa/facilities/350.html.
Diversion as a Measurement Option Ecology’s annual recycling survey has measured a very specific part of the solid waste stream since 1986. It is roughly the part of the waste stream defined as municipal solid waste by the Environmental Protection Agency.1 However, Ecology has noted very large increases of recovery or beneficial use in “non-MSW” waste streams; most notable are the growing industries in recycling asphalt, concrete, and other construction, demolition, and landclearing debris.
Increasingly, Washington counties and cities have been putting efforts into waste streams outside of the traditional municipal solid waste stream. The best example is the construction and demolition waste stream. Many of these materials, including asphalt, concrete, roofing materials, dimensional lumber, and more, are now being recycled.
2 Solid Waste in Washington State --Eleventh Annual Status Report
1 The recyclable portion of the waste stream is municipal solid waste as defined by the Environmental Protection Agency in the Characterization of Municipal Solid Waste in The United States: 1996 Update. This includes durable goods, nondurable goods, containers and packaging, food wastes, and yard trimmings. It does not include industrial waste, inert debris, asbestos, biosolids, petroleum contaminated soils, or construction, demolition, and landclearing debris disposed of at municipal solid waste landfills and incinerators.

Issues Facing Solid Waste
Knowledge of this waste stream is increasing and local governments and businesses are
er
ood, and tires. If these materials are included, ashington shows an “alternative” recycling rate of 41 percent in 2001 (see Figure 1.1
and Chapter V, Figures 5.10 and 5.11).
setting up the infrastructure for recycling, reuse, or beneficial use of these items.
The Solid Waste & Financial Assistance Program (SW&FAP) has begun to include othtypes of materials in the recycling survey, and is calculating a recycling rate parallel to the traditional one, which includes non-MSW recyclables and non-MSW waste types such as inert, construction, demolition, wW
Figure 1.1 Alternative Recycling Rate Comparison 1999 to 2001
MSW versus All Waste Types2
41%41%37%
28%
33% 35%
37%37%
28%
33% 35%
37%
5%
10%
15%
20%
25%
30%
35%
40%
45%
AlternativeRecyclingRate
RecyclingRate (MSWonly)
0%1999 2000 2001
Materials which require minimal or no processing for reuse, resale, or land applicatio(in the case of organic materials) historically have been excluded from the definition of recycling for purposes of determining the recycling rate. The new solid waste rule, chapter 173-350 WAC, Solid Waste Handling Standards, once adopted in January 200will allow waste generators to apply for relief from solid waste permitting for the use of a waste as a substitute feedstock in a manufacturing or other industrial process or when used as a soil amendment. Until a new definition of recycling is adopted, these actiwhich provide a benef
n
3,
vities icial use over landfill disposal or incineration, or perhaps even over
cycling, will be counted as “diverted” material and calculated into an alternative
ing rate for many of these materials because either we do not know the total amount of waste
rerecycling rate only. SW&FAP maintains, however, that these wastes are not well characterized and there is no definitive information on the total volume of waste generated, especially in the industrial sector. The reporting requirement for solid waste recyclables does not include these beneficial use activities; therefore, respondents choose on a voluntary basis to report quantities handled. This lack of information makes it difficult to figure a recycl
Solid Waste in Washington State --Eleventh Annual Status Report 3
2 Includes Municipal, Demolition, Inert, Commercial, Wood, Tires, Medical, and Other Wastes. Excludes Industrial Wastes, AsbesSludges, and Petroleum Contaminated Soils.
tos,

Chapter I
generated or the beneficial use does not meet the state’s definition of recycling.3 See Figure 1.2 for a comparison of Washington waste generation using all waste types.4 See Chapter V, Table 5.7, for a list of the quantities of reported materials from 1999 to 2001.
shington
t an exhaustive list, neither are the bers complete for these material categories.
Washington Waste Generation 1999 to 2001
SW&FAP will continue to collect more of this information on future surveys. For the most part, these materials are collected and processed outside of the traditional residentialand commercial waste stream and were not well addressed in the Waste Not WaAct of 1989. Still, the creative efforts of local governments and businesses are recognized in addressing these wastes. This is nonum
Figure 1.2
Including Waste “Diversion”
0
2,000,000
4,000,000
6,000,000
8,000,000
10,000,000
12,000,000
Tons
1999 2000 2001
Other Waste TypesDisposedMSW & CommercialWastes DisposedTotal Diversion
Total Recycled
Beyvise
ne of the agency’s top priorities. We expect
acts
ted. liminating wastes will contribute to environmental, economic and social vitality.
ond Waste--The State Solid Waste Strategic Plan The Solid Waste and Assistance Program (SW&FAP) is continuing in its efforts to rethe state solid waste plan pursuant to state law (RCW 70.95.260). The plan is being revised in concert with the state hazardous waste plan revision. Together, the two plans comprise Ecology’s Beyond Waste project, oto complete a draft plan in the Fall of 2003.
While wastes in Washington are being managed better than ever before, we are generating more waste than ever before. In fact, the generation of solid wastes is growing at an even faster pace than population growth. Reducing wastes, toxic substances, and their impis important for our state’s future. Washington can transition to a society that views wastes as inefficient uses of resources and believes that most wastes can be eliminaE
3 Revised Code of Washington 70.95.030 (18) "Recycling" means transforming or remanufacturing waste materials into usable or marketable materials for use other than landfill disposal or incineration.
4 Solid Waste in Washington State --Eleventh Annual Status Report
4 Other waste types includes demolition, inert, wood, tires, medical wastes and other wastes. It excludes industrial wastes, asbestos, sludges, and petroleum contaminated soils.
Issues Facing Solid Waste
Ecology is committed to continuing to work collaboratively with people and
in e
consumer and corporate behaviors, re-use more materials, and improve technologies. Moving beyond waste to re-use and reduction of materials will
ng handling systems must be maintained or
StatThe Solid Waste and Financial Assistance Program (SW&FAP) launched its “Litter and
y
on and radio
advertisements during the summer months, a year-round litter hotline, increased
organizations interested in waste-related issues. Combined public meetings on proposedactions for both the solid waste and hazardous waste plans will be held as policy optionsare developed.
In the short-term, the solid waste plan will position Washington to be more effective reducing wastes through revised policies and programs, including better service to thpublic, business and government. In the long-term, the Beyond Waste project will guide Washington in a new direction, from containing and managing wastes to preventing wastes from being generated in the first place. This transition will take place as we redesign processes, change
take many years. In the interim, the existiimproved where needed.
ewide Litter Prevention Strategy
it will hurt” campaign in April 2002, aimed at reducing litter on Washington roadways bletting people know littering can lead to fines that hurt financially.
The campaign uses multiple strategies over a three-year period to raise awareness, alterbeliefs and change behaviors. Elements include humorous televisi
enforcement, roadway and retail signs, a Web site (http://www.ecy.wa.gov/programs/ swfa/litter/, and distribution of litterbags and campaign materials.
In a Sept chmark study, results showed:
• or heard the slogan “Litter and it will hurt” (up from 14 percent in the benchmark study).
• oad signs, posters or a slogan
•
• cent).
• ot likely to get caught and fined. This is down from 27 percent in April who believed they were not likely to get caught.
At the end of the three years, SW&FAP will conduct a full survey of the quantity and types of litter in Washington to measure the effects of the campaign.
ember 2002, comparison to an April 2002, ben
51 percent of respondents had seen
70 percent of respondents remembered seeing rabout litter (up from 57 percent).
32 percent remembered seeing or hearing advertising, news or public service messages about littering (up from 23 percent).
28 percent were aware of a toll-free number to report littering (up from 20 per
17 percent believed they are n
• 42 percent of respondents would say that fines for littering are very severe or severe (up from 31 percent).
Solid Waste in Washington State --Eleventh Annual Status Report 5
Chapter I
The ad campaign will start again in the spring of 2003, but the toll-free litter hotline still operating. Citizens may report the license-plate numbers of litterers by calling 866-LITTER-1. The regist
is
ered owner of the vehicle then receives a stern letter from Washington State Patrol.
, and then decreasing slightly 1,027 in September, when the ad campaign ended.
May
hose citations were for “lit-debris” (e.g., a lit cigarette butt), which carries a 950 fine.
cts
ing the life
There were 55 calls in April, increasing to 941 in July, 1,129 in August
The Washington State Patrol is playing a key role in the new litter campaign. Fromto August 2002, 1,755 litter citations were issued by patrol officers. Twenty-three percent of t$
Product Stewardship Waste management programs in Washington State have improved greatly over time. Our landfills are more protective of human health and the environment and more materials are being recovered for recycling. However, despite enormous efforts to increase recycling rates, we continue to fall short of our goals and waste generation continues to rise. It is understood that waste disposal contributes to air, water and land pollution. What is not well understood is that environmental impacts begin long before we discard the many products we use each day. Waste and pollution occur throughout the lifecycle of a product. Impacts from resource extraction, product development, distribution and product use can actually dwarf pollution resulting from waste disposal at the end of a product’s useful life. It is becoming evident that traditional waste reduction and recycling programs aren’t enough to relieve these full life-cycle impacts. Waste reduction programs as they are now employed cannot compete with the increase in the quantity and complexity of consumer products produced and discarded in Washington. The current situations place unnecessary economic burden on governments and tax payers alike. As we look to the future, it is important to keep in mind that both population and waste generation in Washington State are projected to increase substantially. Additionally, the composition of the waste stream will continue to grow in complexity as new technologies emerge in product development and manufacture. In light of these forecasts, it is equally important that state and local governments alike support and assist in development of innovative approaches focused on reducing the adverse health and environmental impaof consumer products. The waste reduction strategies we choose must continue to take into consideration a wide array of public policy issues, including those relating to publichealth and safety, natural resource management, environmental protection and solid and hazardous waste management, while ensuring a healthy and competitive economy. To achieve this result, many government agencies have begun promoting product stewardship strategies that aim to encourage manufacturers and others influenccycle of a product to take increasing responsibility to reduce the impacts of that product.
6 Solid Waste in Washington State --Eleventh Annual Status Report
Issues Facing Solid Waste
Product stewardship is an environmental management strategy in which responsibility for minimizing a product’s environmental impact throughout all stages of the product’s life cycle falls on those who design, produce, sell, or use that product. Product stewardship encourages manufacturers to take increasing responsibility for all of the impacts associated with a product and its packaging – including energy and materials consumption, air and water emissions, worker safety, and waste disposal – including the end-of-life management of the products they produce. This shifting of responsibility for product impacts creates incentives for manufacturers to design products with fewer toxics, and to make them more durable, reusable, and recyclable. These strategies can pay off for the manufacturer in the form of reduced production costs, reduced toxics handling and waste disposal, less regulatory burden and market advantage as consumers begin specifying products based on their environmental performance. (Note: This shift does not relieve consumers, government, and others from their responsibility to be stewards. Rather, it recognizes that many of the processes are under primary control of manufacturers.) Product stewardship strategies and initiatives are already underway in the United States and abroad and appear in many different forms, tailored to address specific issues and needs. Examples of product stewardship practices include:
• Design for the Environment - Product manufacturers reduce environmental impacts by using materials and processes that result in the least environmental impacts. Examples include designing products that contain recycled and/or recyclable materials, designing products to be easily disassembled to reuse parts, using low or no toxicity materials and using production methods that conserve energy and resources.
• Product Take-Back - A system whereby consumers can return used products for reuse and/or recycling. This system could be funded through a stakeholder partnership or solely by the manufacturer. When the manufacturer shares in the costs of managing the products, they are more likely to consider design and materials changes that will reduce recovery costs and reduce environmental impacts.
• Offering the Product as a Service (Leasing) - In many cases the consumer may not be interested in owning a product, but wants the service the product provides. For example, consumers may not want to own the plastics and glass in a television set; rather, they want the service--viewing of TV programs--that the television set provides. Companies that lease their products have a greater incentive to design more durable, lasting products that can be reused or recycled cheaply and efficiently.
Solid Waste in Washington State --Eleventh Annual Status Report 7
Ecology recognizes the need for industry, government, and consumers to jointly promote the development and use of consumer products that pose no–or increasingly fewer–health and environmental impacts. Ecology is currently working with other government agencies, both regionally and nationally, in a coordinated effort to promote product stewardship. The primary approach has been to identify specific products that pose the

Chapter I
most substantial lifecycle impacts and to work directly with manufacturers to develop product stewardship initiatives focusing on those products. In large part, government agencies responsible for solid and hazardous waste management are initiating these programs. As a result, products that pose serious disposal problems, because of their volume, toxicity or because they are difficult to recycle, tend to gain focus. Products of interest currently include: electronics (such as computers and televisions), products containing mercury, paint, pesticides, carpet and tires. Some of the initiatives that the Solid Waste & Financial Assistance Program are working on with its partners are outlined in Chapter III Partnering for the Environment.
Information Technology and the Web The past year has been significant for the Solid Waste & Financial Assistance Program (SW&FAP) in terms of progress on Information Technology initiatives. Staff have drafted the following vision statement for the role of Information Technology in implementing program elements:
Staff are comfortable with the use of information technology. All stakeholders - the public and regulated community, and other government agencies - are familiar with and accepting of providing and obtaining real - time information in a paperless fashion. Automation and integration of tasks through the use of information technology is a primary front-end consideration in implementing program activities.
Continued pressure on agency and program operating budgets, as well as pressures at the local level, clearly call for as many efficiencies as can possibly be had. The ability to provide and convey information over the Internet represents a huge gain in efficiency and accessibility of resources. At the same time, we are cognizant that not all of our stakeholders have the same access to information technology, or even where access is available, the same level of comfort. Therefore our approach must be thoughtful of those constraints. One of the easiest efficiencies to be found via the Internet is dissemination of publications. The Program incurs substantial costs in printing, processing requests for, and mailing publications. Program publications are now routinely available in PDF format on the agency web site http://www.ecy.wa.gov/pubs.shtm allowing users instant access to information. This approach is also in keeping with the concept of sustainability as it reduces consumption of our natural resources. Limitations remain even with this approach, however. In some cases a hard copy of the document is wanted, and in other cases documents can be large, and user access speeds slow enough that downloading them over the Internet is not practical. In those cases it is often feasible to mail electronic copies on disk or provide a hardcopy publication.
8 Solid Waste in Washington State --Eleventh Annual Status Report

Issues Facing Solid Waste
The Internet site for the SW&FAP has been completely revised over the past year. We have taken a different approach in guiding visitors through our site. On the main page at http://www.ecy.wa.gov/programs/swfa/index.html visitors encounter three questions: What do we do? What type of waste? and Where can I get more information? There is also a Who we are prompt? which leads to directories of program staff and outside contacts, and a What’s new in solid waste? feature so that visitors can see the latest news and information from the Program. Visitors can also click on a list of website topics. A significant shift in our use of information technology is a transition to Active Server Pages. Many web pages found on the Internet are static pages – that is, what you see is what there is. The information provided is only as good as the last update. SW&FAP is moving toward pages that provide something closer to real-time information. An increasing number of pages will be linked to data bases, and as those data bases are updated the available information will change for users. We will use the same kind of technology to begin collecting information from stakeholders as well. In the not too distant future users will be able to submit reports through on-line forms, add their name to the list of persons interested in a particular subject area. Our goal is a two-way exchange of information. SW&FAP encourages readers to visit our web pages at http://www.ecy.wa.gov/programs/ swfa/index.html and explore the information and resources available there. The Program is committed to expanding our web presence and providing the most efficient possible service delivery. Where applicable, web sites are identified throughout this report.
Solid Waste in Washington State --Eleventh Annual Status Report 9


Solid Waste Handling Infrastructure
Chapter II Solid Waste Handling Infrastructure This chapter describes the basic facilities making up the solid waste management infrastructure within Washington state. While disposal and recycling information is from 2001, the lists of facilities are current as of September 2002. Once solid waste is generated, its handling can be categorized into three distinct classifications. Solid waste can either be: (1) landfilled; (2) intermediately handled - stored, transferred, processed; or, (3) incinerated. A fourth category, Ancillary-Other, explains anomalies to the three basic classifications of solid waste handling. Biosolids landspreading sites are not included in the total number of facilities. Moderate risk waste is, by definition, excluded from regulation as dangerous waste, even though it may have the characteristics of dangerous waste. Moderate risk waste fixed facilities are regulated as interim solid waste handling sites. Regulated solid waste facilities in the state are covered by three rules developed by Ecology. The first rule, chapter 173-304 WAC, the Minimum Functional Standards (MFS) identifies 16 distinct solid waste facility types, each with its own set of permitting criteria. The solid waste facility standards have been revised in chapter 173-350 WAC, Solid Waste Handling Standards (planned adoption January 2003). There will be some changes to the facility types, most notably the elimination of woodwaste landfills and inert/demolition landfills. There will continue to be a limited purpose landfill category and an inert landfill category, which will take only waste identified in rule as “inert.” There will be a transitioning time for currently facilities to either be permitted under the new rule or to close under the MFS. The second rule pertains to municipal solid waste landfills, chapter 173-351 WAC, Criteria for Municipal Solid Waste Landfills. The third rule regulating solid waste handling facilities is chapter 173-306 WAC, Special Incinerator Ash Management Standards, which sets permitting, construction and operating standards for MSW incinerator ash monofills. In this report, Ecology has identified 406 solid waste handling facilities in Table 2.1 (MRW facilities are not included in the number). Facility ownership in this chapter is categorized as either PUBLIC for those facilities owned by a recognized jurisdiction of government - a city, county or special purpose district - or as PRIVATE, for those acilities owned by corporations, partnerships or private individuals. f
Solid Waste in Washington State --Eleventh Annual Status Report 11

Chapter II
Table 2.1
Classification Table Classification Facility Type
Statewide Total
Landfills 72 Ash Monofills 1 Inert/Demolition Waste Landfills 32 Limited Purpose Waste Landfills 15 Municipal Solid Waste Landfills 19 * Woodwaste Landfills 5 Intermediate Classification 311 Compacting Stations 7 Compost Facilities 40 Drop Boxes 70 Piles 12 Recycling Facilities 83 Surface Impoundments 5 Transfer Stations 92 Tire Piles 2 Incineration 4
Ancillary/Other 19 Landspreading Disposal Facilities 13 Other Facilities 6 Total All Facilities 406 * Includes one MSW landfill constructed but not operating.
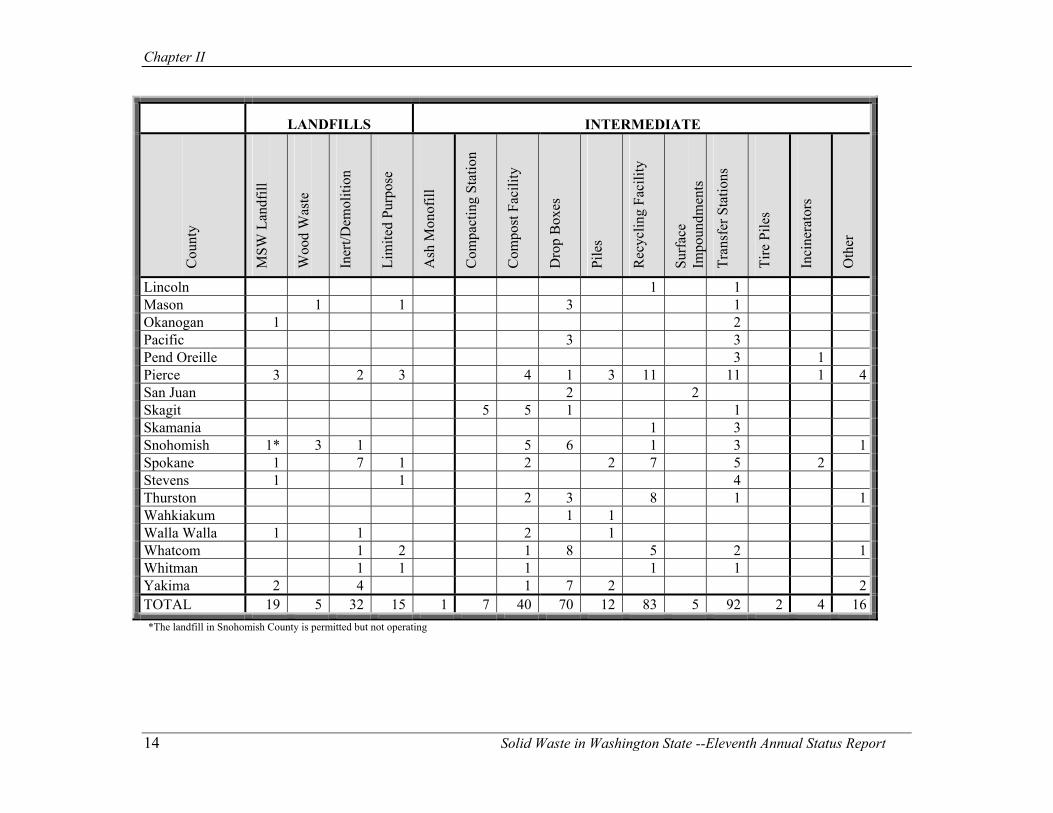
As an overview of the solid waste facilities in the state, Table 2.2 identifies the types and number of facilities and the county in which they are located. This table includes only those facilities that are separately permitted in chapter 173-304 WAC or chapter 173-351 WAC. Several other “facility types” exist but are co-located at another permitted facility. This is especially true for composting and MRW facilities. Future reports will identify all of the facility types, whether they are separately permitted or co-located with other facilities. For a greater understanding of Washington’s solid waste infrastructure, a closer examination of each solid waste infrastructure classification and applicable “type” sub-category follows. Maps showing the counties where the facilities are located are included for each category. See Appendix A for a map identifying counties.
12 Solid Waste in Washington State --Eleventh Annual Status Report

Solid Waste Handling Infrastructure
Table 2.2 Solid Waste Facilities in Washington
(as of September 2002)
LANDFILLS INTERMEDIATE
Cou
nty
MSW
Lan
dfill
Woo
d W
aste
Iner
t/Dem
oliti
on
Lim
ited
Purp
ose
Ash
Mon
ofill
Com
pact
ing
Stat
ion
Com
post
Fac
ility
Dro
p B
oxes
Pile
s
Rec
yclin
g Fa
cilit
y
Surf
ace
Impo
undm
ents
Tran
sfer
Sta
tions
Tire
Pile
s
Inci
nera
tors
Oth
er
Adams 1 2 2Asotin 1 1 Benton 5 11 2 1 3 Chelan 3 1 3Clallam 1 31 1 1Clark 2 8 2 1 2 Columbia 1 11 Cowlitz 1 1 1 3 11 Douglas 1 11 2 Ferry 1Franklin 1 3 11Garfield 1Grant 1 1 152 3Grays Harbor 1 1 1 9 2 6 1Island 1 2 1 10 1 3Jefferson 1 1 2 1 1 1King 1 1 121 4 2 Kitsap 1 1 5 2 Kittitas 1 21 Klickitat 1 2 3 11 Lewis 1 1 91 8 3 Solid Waste in Washington State --Eleventh Annual Status Report 13
Chapter II
LANDFILLS INTERMEDIATE
Cou
nty
MSW
Lan
dfill
Woo
d W
aste
Iner
t/Dem
oliti
on
Lim
ited
Purp
ose
Ash
Mon
ofill
Com
pact
ing
Stat
ion
Com
post
Fac
ility
Dro
p B
oxes
Pile
s
Rec
yclin
g Fa
cilit
y
Surf
ace
Impo
undm
ents
Tran
sfer
Sta
tions
Tire
Pile
s
Inci
nera
tors
Oth
er
Lincoln 1 1Mason 1 1 3 1Okanogan 1 2Pacific 3 3Pend Oreille 3 1Pierce 2 3 4 1 3 11 11 1 43 San Juan 2 2Skagit 5 5 1 1Skamania 1 3Snohomish 1 3 11* 3 1 5 6 Spokane 1 7 51 7 2 2 2Stevens 1 1 4Thurston 2 3 8 1 1 Wahkiakum 1 1 Walla Walla 1 1 1 2Whatcom 1 2 1 8 5 2 1 Whitman 1 1 1 1 1 Yakima 4 1 7 2 22 TOTAL 19 5 32 15 1 7 40 70 12 83 5 92 2 4 16 *The landfill in Snohomish County is permitted but not operating
14 Solid Waste in Washington State --Eleventh Annual Status Report

Solid Waste Handling Infrastructure
Landfill Classification The regulated permanent disposal of solid wastes in landfills in Washington occurs in five types of facilities: (1) ash monofills; (2) inert/demolition landfills; (3) limited purpose landfills; (4) municipal solid waste landfills; and (5) woodwaste landfills. (See Table 2.3.) A short discussion of each landfill classification “facility type” and its relationship to the state’s overall infrastructure follows. A more detailed discussion of waste types and amount disposed and incinerated, movement of waste into and out of state, as well as trends in waste management, is found in Chapter VI.
Table 2.3
Landfill Classification TOTAL # STATEWIDE TOTAL BY OWNERSHIP DESIGNATION
FACILITY TYPE Active Active Public Private 2001 2002 2001 2002 2001 2002 Ash Monofill 1 1 0 1 1 Inert/demolition 31 32 11 10 20 22 Limited Purpose 16 15 1 1 15 14 Municipal solid waste 21 19* 15 15 6 4 Woodwaste 4 5 0 0 4 5 TOTAL 73 72 27 26 46 46
A landfill in Snohomish County is permitted but not operating. *
Ash Monofills Ash monofills are landfill units that receive ash residue generated by municipal solid waste incinerator/energy-recovery facilities. The Incinerator Ash Residue Act, chapter 70.138 RCW, gave direct permitting authority to Ecology, as well as giving the department the authority to develop rules to regulate the disposal of this ash. Under chapter 173-306 WAC, Special Incinerator Ash Management Standards, incinerators which burn more than 12 tons per day of municipal solid waste are required to have a Generator (Ash) Management Plan, approved by Ecology, in place prior to operation of a facility. The ash management plan identifies the location of ash monofills to be used for ash disposal.
Solid Waste in Washington State --Eleventh Annual Status Report 15

Chapter II
Location of Ash Monofill
Public 0
Total 1Private 1
1
In 2002, there was only one permitted ash monofill in Washington, located at the Roosevelt Regional Landfill in Klickitat County. The monofill operates under a permit issued by Ecology, and received 76,523 tons of special incinerator ash in 2001. Inert/Demolition Waste Landfills Inert/Demolition Waste landfills are facilities which receive “more than two thousand cubic yards of inert wastes and demolition wastes.”5 These facilities are regulated under WAC 173-304-461. Thirty-three of the inert/demolition landfills reported 733,843 tons of waste in 2001. In 2002, there were 32 inert/demolition landfills listed for the state. Most (65%) of the inert/demolition landfills are privately owned and operated. Public inert/ demolition landfills make up 35% of this facility type.
Location of Inert/Demolition Waste Landfills
Public 10
Total 32Private 22
1
1
3
1
1
1
12
1
7
1
1
42
12
1
16 Solid Waste in Washington State --Eleventh Annual Status Report
5 WAC 173-304-461(1)

Solid Waste Handling Infrastructure
Limited Purpose Waste Landfills Limited purpose landfills are facilities that receive “solid wastes of limited types, known and consistent composition, other than woodwaste, garbage, inert waste and demolition waste.”6 These facilities are regulated under WAC 173-304-460(5). Limited purpose landfills are identified by the type of waste. In other words, the waste associated with a limited purpose landfill is unique to that facility. Thirteen limited purpose landfills that reported in 2001, accepted 645,592 tons of waste. The waste disposed in these facilities is usually generated by the owner of the landfill. Only one limited purpose landfill is publicly owned.
Limited Purpose Landfills
1
1
Public 1
Total 15Private 14
1
1
1
1 1
1
2
3
2
Municipal Solid Waste Landfills In 2001, 20 MSW landfills accepted 4,525,019 tons of waste. (See Chapter VI for additional discussion of waste types, amounts and sources.) In 2002, of the 18 operating MSW landfills, the majority, 79%, of MSW landfills are operated by public entities. This has historically been true in Washington. Private MSW landfills constitute only 21% of this facility type. Even though most of the landfills are owned by public entities, the majority of landfill capacity (87%) is under the control of the private sector. (See the discussion on landfill capacity, in Chapter VI.)
Solid Waste in Washington State --Eleventh Annual Status Report 17
6 WAC 173-304-100(98)

Chapter II
11
1
1
1
211
1
1
3
1
1
12
Public 15
Total 19Private 4
Location of MSW Landfills
1
1
* Includes landfill in Snohomish County that is permitted, but not operating.
Woodwaste Landfills Woodwaste landfills are those facilities which landfill “more than 2,000 cubic yards of woodwaste, including facilities that use woodwaste as a component of fill.”7 These facilities are regulated under WAC 173-304-462.
The MFS defines woodwaste as “solid waste consisting of wood pieces or particles generated as a by-product or waste from the manufacturing of wood products, handling and storage of raw materials and trees and stumps. This includes, but is not limited to, sawdust, chips, shavings, bark, pulp, hog fuel, and log sort yard waste, but does not include wood pieces or particles containing chemical preservatives such as creosote, pentachlorophenol, or copper-chrome-arsenate.”8
In 2001, one woodwaste landfills reported 53,298 tons of waste (the remaining permitted woodwaste landfills were either inactive or were actually removing waste). In 2002, five woodwaste landfills were listed in the state list, all privately owned.
Location of Woodwaste Landfills
Public 0
Total 5Private 5
1 1
3
7 WAC 173-304-462(1)
8 WAC 173-304-100(91)
18 Solid Waste in Washington State --Eleventh Annual Status Report

Solid Waste Handling Infrastructure
Intermediate Classification Solid waste, prior to its final disposal or incineration, is often accumulated at a storage facility, consolidated at a transfer station, converted into a useful product, or prepared for recycling or disposal at a processing center. The storage, transfer or processing of solid wastes are regulated by the MFS and fall under the interim9 or intermediate classification of solid waste handling facilities. Some moderate risk waste fixed facilities are regulated as interim solid waste handling sites.
Specifically, a storage facility primarily holds “solid waste materials for a temporary period”10 while a processing center is in the operation of converting “solid waste into a useful product or to prepare it for disposal.”11 A transfer station, on the other hand, is a “permanent, fixed, supplemental collection and transportation facility, used by persons and route collection vehicles to deposit collected solid waste from off-site into a larger transfer vehicle for transport to a solid waste handling facility.”12
The distinguishing characteristic of all interim or intermediate classification solid waste handling facilities is that they are not designed for final disposal. There are 10 types of intermediate facilities: (1) baling stations; (2) compacting stations; (3) composting facilities; (4) drop boxes; (5) moderate risk waste fixed facilities; (See Chapter VII) (6) piles; (7) recycling centers; (8) surface impoundments; (9) transfer stations; and (10) tire piles. Bale Station A bale station is a facility that processes loose solid waste into large bound bundles. The purpose of binding waste in this fashion is to place the bundles into lifts at a landfill. These facilities are regulated under WAC 173-304-410. Because this technology is often confused with compacting stations, and since bale stations are regulated under the same section of the MFS, to date no bale stations have been permitted as separate facilities. Compacting Station A compacting station is a facility which employs mechanical compactors to compress solid wastes into dense packets of material for shipment. These facilities are regulated under WAC 173-304-410.
Ecology identified seven compacting stations statewide in 2002. All compacting facilities are under public ownership and are affiliated with recycling operations. Compacting stations are located in the more urban, northwestern counties of the state. Larger urban centers are more inclined to use this technology to process large amounts of recyclables for shipment. Compactors are also used at transfer stations, though they are not permitted separately. 9 WAC 173-304-100(38)
10 WAC 173-304-100(76)
11 WAC 173-304-100(62)
12 WAC 173-304-100(82)
Solid Waste in Washington State --Eleventh Annual Status Report 19
Chapter II
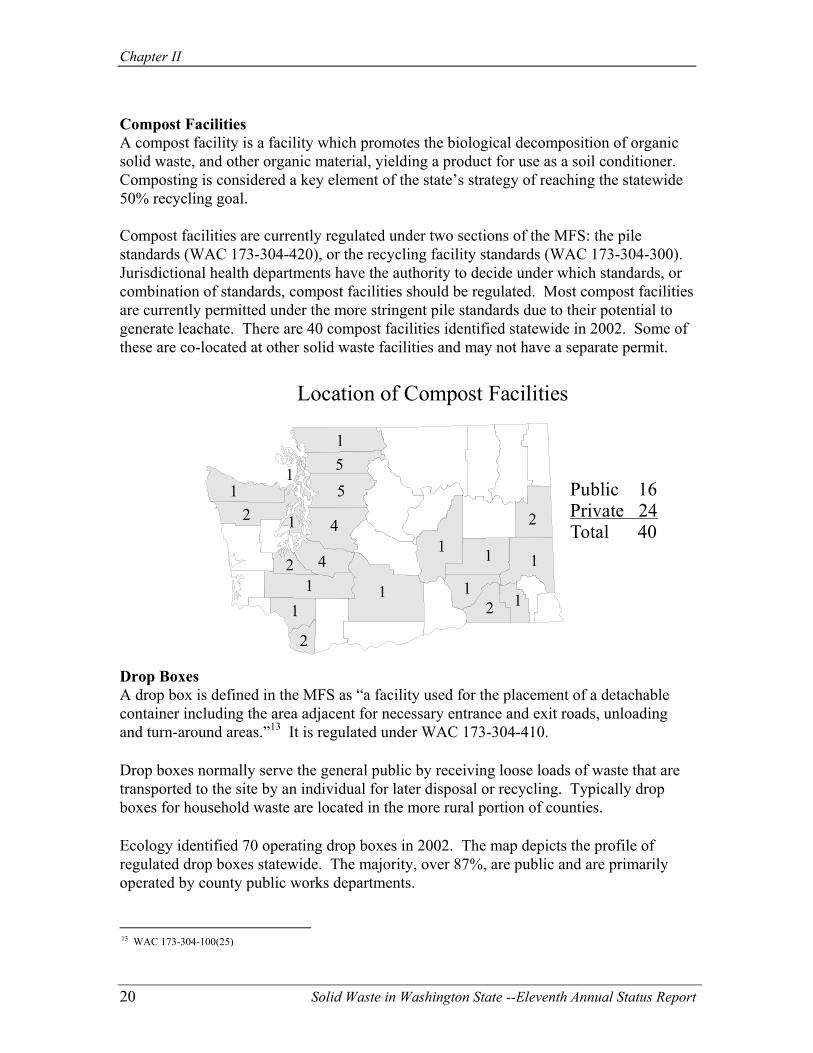
Compost Facilities A compost facility is a facility which promotes the biological decomposition of organic solid waste, and other organic material, yielding a product for use as a soil conditioner. Composting is considered a key element of the state’s strategy of reaching the statewide 50% recycling goal. Compost facilities are currently regulated under two sections of the MFS: the pile standards (WAC 173-304-420), or the recycling facility standards (WAC 173-304-300). Jurisdictional health departments have the authority to decide under which standards, or combination of standards, compost facilities should be regulated. Most compost facilities are currently permitted under the more stringent pile standards due to their potential to generate leachate. There are 40 compost facilities identified statewide in 2002. Some of these are co-located at other solid waste facilities and may not have a separate permit.
Location of Compost Facilities
Public 16
Total 40Private 24
1
1
41
2
55
2
2
2
1
1
1
2
1
11 1
14
1
Drop Boxes A drop box is defined in the MFS as “a facility used for the placement of a detachable container including the area adjacent for necessary entrance and exit roads, unloading and turn-around areas.”13 It is regulated under WAC 173-304-410. Drop boxes normally serve the general public by receiving loose loads of waste that are transported to the site by an individual for later disposal or recycling. Typically drop boxes for household waste are located in the more rural portion of counties. Ecology identified 70 operating drop boxes in 2002. The map depicts the profile of regulated drop boxes statewide. The majority, over 87%, are public and are primarily operated by county public works departments.
20 Solid Waste in Washington State --Eleventh Annual Status Report
13 WAC 173-304-100(25)

Solid Waste Handling Infrastructure
Location of Drop Boxes
21
Public 61
Total 70Private 9
2
3
8
6
2
18
33
5
17
15
1
1
1
Piles A solid waste pile is described in the MFS as any “non-containerized accumulation of solid waste that is used for treatment or storage.”14 Pile storage/treatment areas are usually associated with the storage and processing of wastes requiring remedial actions, such as petroleum-contaminated soils. Pile facilities or areas used for storage and treatment are regulated by WAC 173-304-420. (Compost facilities can also be regulated under this section as discussed above.) Twelve privately owned piles (non-composting) were identified in 2002.
Location of Piles
Public 1
Total 12Private 112
2
1
1
3
11
1
Solid Waste in Washington State --Eleventh Annual Status Report 21
14 WAC 173-304-100(56)
Chapter II
Location of Recycling Facilities
Public 4
Total 54Private 50
10
5
1
11
3
18
2
1
8
3
7
1
11
1
61
2
Recycling Facilities
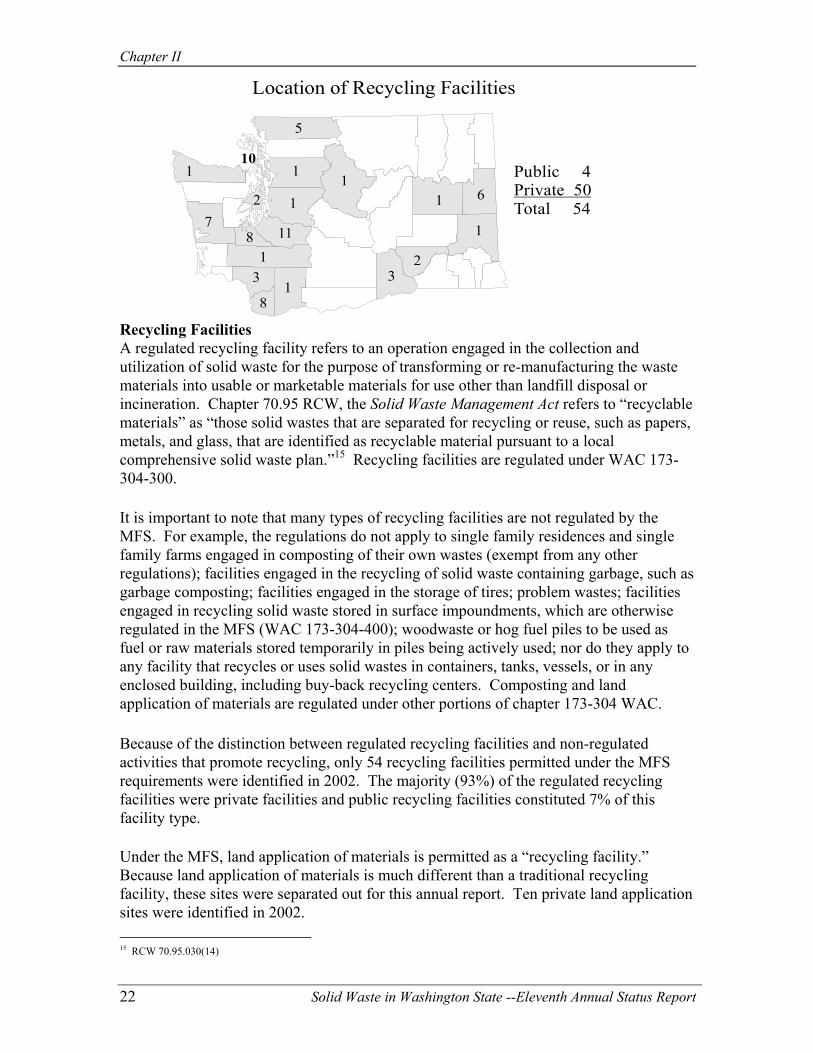
recycling facility refers to an operation engaged in the collection and aste
clable
AC 173-
is important to note that many types of recycling facilities are not regulated by the e
such as
to
AC.
ecause of the distinction between regulated recycling facilities and non-regulated S
nder the MFS, land application of materials is permitted as a “recycling facility.”
ation sites were identified in 2002.
A regulatedutilization of solid waste for the purpose of transforming or re-manufacturing the wmaterials into usable or marketable materials for use other than landfill disposal or incineration. Chapter 70.95 RCW, the Solid Waste Management Act refers to “recymaterials” as “those solid wastes that are separated for recycling or reuse, such as papers, metals, and glass, that are identified as recyclable material pursuant to a local comprehensive solid waste plan.”15 Recycling facilities are regulated under W304-300. ItMFS. For example, the regulations do not apply to single family residences and singlfamily farms engaged in composting of their own wastes (exempt from any other regulations); facilities engaged in the recycling of solid waste containing garbage, garbage composting; facilities engaged in the storage of tires; problem wastes; facilities engaged in recycling solid waste stored in surface impoundments, which are otherwise regulated in the MFS (WAC 173-304-400); woodwaste or hog fuel piles to be used as fuel or raw materials stored temporarily in piles being actively used; nor do they apply any facility that recycles or uses solid wastes in containers, tanks, vessels, or in any enclosed building, including buy-back recycling centers. Composting and land application of materials are regulated under other portions of chapter 173-304 W Bactivities that promote recycling, only 54 recycling facilities permitted under the MFrequirements were identified in 2002. The majority (93%) of the regulated recycling facilities were private facilities and public recycling facilities constituted 7% of this facility type. UBecause land application of materials is much different than a traditional recycling facility, these sites were separated out for this annual report. Ten private land applic
15 RCW 70.95.030(14)
22 Solid Waste in Washington State --Eleventh Annual Status Report

Solid Waste Handling Infrastructure
Location of Land Applications
Surface Impoundments poundment refers to “a facility or part of a facility which is a natural
Public 0
Total 10Private 10
2
11
31
2
A surface imn-made excavation, or diked area formed primarily of earthen
ection
ce impoundments are regulated under WAC 173-304-430. Ecology identified ains in the intermediate classification
topographic depression, mamaterials (although it may be lined with man-made materials), and which is designed to hold an accumulation of liquids or sludges. The term includes holding, storage, settling, and aeration pits, ponds, or lagoons, but does not include injwells.”16
Some surfa 17
five regulated facilities in 2002. The category rempending interpretation or clarification under the biosolids rule. Four of the regulated surfaceimpoundment facilities are publicly-owned and one is privately owned.
Location of Surface Impoundments
Public 4
Total 5Private 1
2
12
16 WAC 173-304-100(80)
17 Surface impoundment facilities permitted under federal, state or local water pollution control laws are excluded from regulation under WAC 173-304-430.
Solid Waste in Washington State --Eleventh Annual Status Report 23

Chapter II
Transfer Stations A transfer station is defined as “permanent, fixed, supplemental collection and transportation facility, used by persons and route collection vehicles to deposit collected solid waste from off-site into a larger transfer vehicle for transport to a solid waste handling facility.”18 The regulations applicable to transfer stations are contained in WAC 173-304-410. Typically, transfer stations are areas where individual collection vehicles can be off-loaded, the waste stored for a short period of time and reloaded onto larger vehicles for transfer to the disposal facility. In the past, transfer stations were generally located in larger, urban areas; however, with the new federal regulations applicable to municipal solid waste landfills, jurisdictions are now viewing transfer stations as an option to operating a landfill. Wastes can be collected at these centers for long-hauling to regional MSW landfills. Transfer stations often have areas where the public can bring waste for disposal. Many also have recycling facilities and/or household hazardous waste collection areas. There were 92 regulated transfer stations operating in 2002. The profile map shows that 61% of the transfer stations continue to be publicly operated entities.
Location of Transfer Stations
Public 56
Total 92Private 36
34
5
11
5
3
2 2
13
2
1
21
3
12
113
32
1
6 11
33
1
1
31 1
24 Solid Waste in Washington State --Eleventh Annual Status Report
18 WAC 173-304-100(82)

Solid Waste Handling Infrastructure
Moderate Risk Waste Facilities Moderate risk waste is, by definition, excluded from regulation as dangerous waste, even though it has the characteristic of dangerous waste. Moderate risk waste fixed facilities
are regulated as interim solid waste handling sites. Some of these facilities are co-located at other types of permitted facilities, such as transfer stations and landfills, and do not receive a separate permit. See Chapter VII Moderate Risk Waste Collection System for additional information.
Location of MRW Sites
Public 42
Total 45Private 3
11
4
11
4
2
2 2
1
1
21
1
6
11
3
11 1
1
4
1
1
11
1
111 1
Tire Piles In Washington state, about 5.5 million used tires are generated each year. The used tires may be taken to tire pile storage facilities. A regulated tire pile facility in Washington is any tire pile that temporarily stores or accumulates more than 800 tires. Tire pile standards are contained in WAC 173-304-420.
A major problem with used tires has been illegal tire piles. This section, however, deals specifically with regulated tire piles. Ecology identified two permitted tire piles in the state in 2002, both privately owned.
Location of Permitted Tire Piles
Public 0
Total 2Private 2
1
1
Solid Waste in Washington State --Eleventh Annual Status Report 25
Chapter II
Incineration Classification An energy recovery facility is considered a combustion plant which specializes in the “recovery of energy in a useable form from mass burning or refuse-derived fuel incineration, pyrolysis or any other means of using the heat of combustion of solid waste that involves high temperature (above twelve hundred degrees Fahrenheit) processing.”19 By definition, incineration as it applies to solid waste materials means “reducing the volume of solid wastes by use of an enclosed device using controlled flame combustion.”20 Energy recovery and incinerator facilities are regulated under WAC 173-304-440 applies to “all facilities designed to burn more than twelve tons of solid waste per day, except for facilities burning woodwaste or gases recovered at a landfill.”21 In 2001, Ecology identified four regulated solid waste incinerator facilities that burned a total of 496,152 tons of waste. In addition to solid waste handling permit requirements under the MFS, solid waste incinerators may be subject to regulations under chapter 70.138 RCW, the Incinerator Ash Residue Act. The rules implementing this, chapter 173-306 WAC, Special Incinerator Ash Management Standards, require certain solid waste incinerators to prepare generator (ash) management plans. These rules do not apply to the operation of incineration or energy recovery facilities that burn only tires, woodwaste, infectious waste, sewage sludge or any other single type of refuse, other than municipal solid waste. They also do not apply to facilities which burn less than 12 tons of municipal solid waste per day Of the four solid waste incinerators permitted in 2002, only one, the Spokane Regional Waste-to-Energy Facility, is subject to both the requirements of chapter 173-304 WAC and chapter 173-306 WAC. It is required to have a generator ash management plan, approved by Ecology, which discusses the handling, storage, transportation and disposal of the incinerator ash. Currently the City of Tacoma Steam Plant is inactive.
Ancillary - Other Classification The classification of Ancillary - Other, is not covered or spelled out in regulation but is included here to explain certain anomalies discovered in the reporting process that may have an effect in subsequent reporting years. To qualify for inclusion in this category, a facility type must be either under regulatory modification, be exempted from regulation, or determined to be an obscure facility type needing reclassification or elimination
utright. o
19 WAC 173-304-100(26)
20 WAC 273-304-100(37)
21 WAC 173-304-440(1)
26 Solid Waste in Washington State --Eleventh Annual Status Report
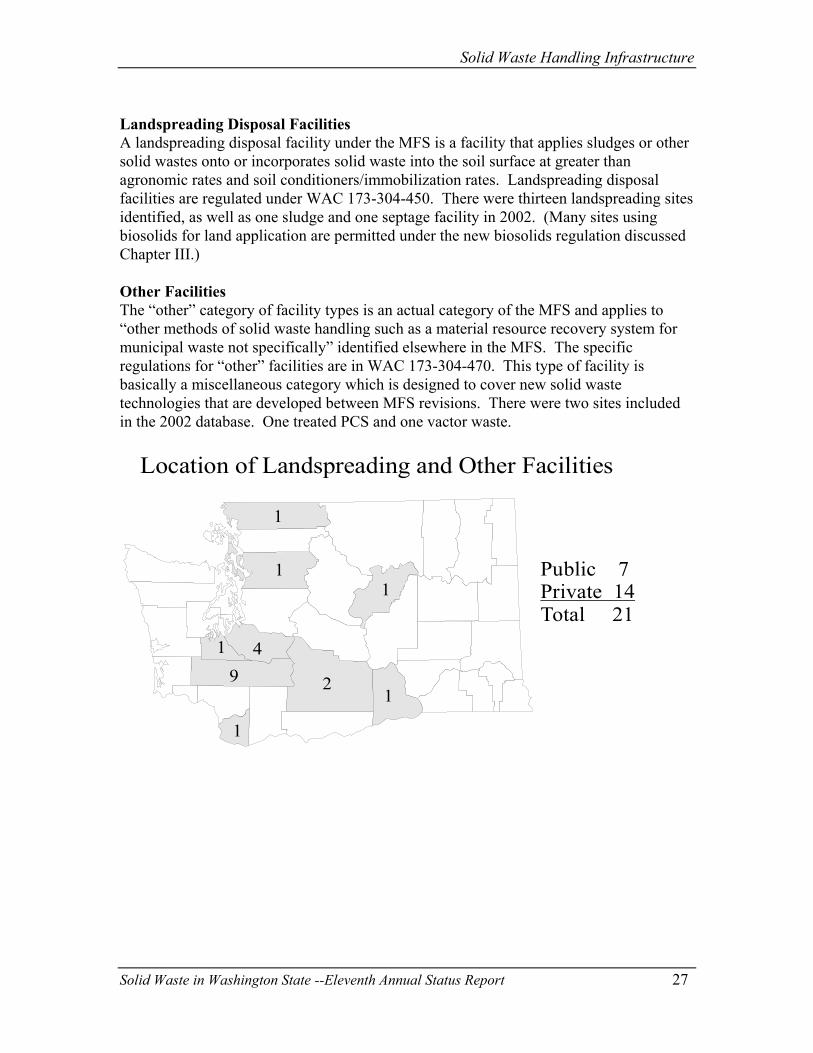
Solid Waste Handling Infrastructure
Landspreading Disposal Facilities A landspreading disposal facility under the MFS is a facility that applies sludges solid wastes onto or incorporates solid waste into the soil surface at greater than agronomic rates and soil conditioners/immobilization rates. Landspreading disposal facilities are regulated under WAC 173-304-450. There were thirteen landspreading identified, as well as one sludge and one septage facility in 2002. (Many sites using biosolids for l
Solid Waste in Washington State --Eleventh Annual Status Report 27
Location of Landspreading and Other Facilities
Public 7
Total 21Private 14
1
21
1
1
1
49
1
in the 2002 database. One treated PCS and one vactor waste.
or other
sites
and application are permitted under the new biosolids regulation discussed hapter III.)
m for
is
e were two sites included
C Other Facilities The “other” category of facility types is an actual category of the MFS and applies to “other methods of solid waste handling such as a material resource recovery systemunicipal waste not specifically” identified elsewhere in the MFS. The specific regulations for “other” facilities are in WAC 173-304-470. This type of facilitybasically a miscellaneous category which is designed to cover new solid waste technologies that are developed between MFS revisions. Ther

Partnering for the Environment
Chapter III Partnering for the E
nvironment
cology’s Solid Waste and Financial Assistance Program (SW&FAP) is preparing itself
sults and tremendous
rovided technical and financial assistance to help local governments ent
ss
,
local government and businesses has begun
.
Partnering for the Environment through Local Planning ement in Washington
lans detail and inventory all existing solid waste handling ste
e
Eto participate in the “Next Industrial Revolution” by forging working partnerships with public and private sector organizations who are or will be the leaders of that revolution. SW&FAP has been reaching out to offer financial assistance, technical expertise, task force leadership, educational and planning assistance, and moral support to old and newfriends in business, industry, agriculture and local government. Already this outreach has produced significant environmental repromise for fundamental and progressive shifts in our relationships with the natural environment. SW&FAP has psupport these management programs and to permit and regulate solid waste managemfacilities. Over the last several years, government funding has become tighter while waste generation has increased and many solid and moderate risk waste issues have become more complex. As recognized by many government, community, and busineleaders, pioneering new ways to solve these problems and making progress toward implementing more sustainable resource management practices is the key to the state’s environmental, economic, and social well-being. These solutions require the participation and cooperation of many people who bring with them a variety of expertiseperspectives, creative ideas, and resources. This change in the way we do business withwith a clear-eyed assessment of what can and should be done to help us all move toward a sustainable world. The first step has been a recognition that we are all partners in the work ahead. To that end, a team of specialists assigned to work on building the relationships to foster sustainability has set to the work described in the following pages
Local solid waste planning is the cornerstone of solid waste managstate. The state Legislature asks counties and cities to make sound solid waste handling decisions based on approved and “current” comprehensive solid waste management plans(RCW 70.95.110(1)). These comprehensive pfacilities within a county and provide an estimate of long-range needs for solid wafacilities projected over a 20-year period. The plans are intended to serve as a guidingdocument for a county to develop its infrastructure. Since 1989, counties and cities havbeen required to provide detailed information on waste reduction strategies and recycling programs and schedules for program implementation in the plans.
Solid Waste in Washington State --Eleventh Annual Status Report 29

Chapter III
Ecology provides technical assistance to local governments in preparing and
plementing their plans. Ecology also approves the plans. Table 3.1 identifies the local dividual
Current Status of Solid Waste Plans in Washington COUNTY PLANNING STATUS BY PHASES (as September 2002)
imsolid waste plans for each county and two cities, Seattle and Everett, that do inplans. This table shows the status of each local comprehensive solid waste management plan for each county, organized by planning phases, the year the plans were last approved, the waste reduction/recycling goals and comments concerning future planning.
Table 3.1
COUNTY CS
ENTS URRENT WR/R GOAL COMMTATUS
(date last approved)
es - 2002
years as new data becomes available from waste monitoring studies.
Recycle or compost:
Kitsap Yes - 2000 Supports the state goal of cycling. reaching 50% re
Pierce Yes - 1993 50% WRR by 1995 C50% recycling goal to be reached approximate
recycling potential assesscombines two approaches to reaching 50%a blend of education/ programs and a regulatory approach.
Spokane Yes - 1998 50% Recycling by 2008
Clallam Yes – 2000 20% by 1996 40% long range goal
Implementation
Clark Yes - 1994 50% WRR by 1995 an Currently updating pl50% WRR by 1995
Grays Harbor Yes - 2001 50% WRR by 1995 Implementation Island Yes - 2000 Assist the State in achieving r 7, 2000.
its goal of 50% Latest plan approved Decembe
Jefferson Yes - 2000 Minimum 29% long range Implementation 18% WRR by 19
Mason Yes - 1998 35% WRR by 1998 Implementation Pacific Yes – 2000 32% WRR by 1996 Implementation San Juan Yes - 1996 50% by 1995
Skagit Yes - 1994 50% or better by 1995 urrently updating the plan with draft xpected late 2002/early 2003.
Ce
Skamania 50% long range goal
Yes - 1992 40% WRR by 1998
Currently updating plan
PHASE I King Y 50% residential by 2006
43% non-residential by 2006 Latest plan approved May 10, 2002. Plan calls for targets to be evaluated every 3
Seattle Yes - 1999 60% by 2008
urrently updating plan Snohomish Yes - 1990
ly 2008 Latest plan approved July 11, 2001. The
ment (RPA) -
Everett Yes - 1996 35% recycling by 2005 3% to 5% WR
PHASE II
Cowlitz Yes - 1993 Probably write an amendment
Lewis Yes - 1993 95 Currently updating plan
30 Solid Waste in Washington State --Eleventh Annual Status Report

Partnering for the Environment
COUNTY PLANNING STATUS BY PHASES (as September 2002) COUNTY CURRENT
STATUS (date last approved)
WR/R GOAL COMMENTS
Increase recycling rate2
Wahkiakum Yes - 1994 20% WRR by 1996
50% diversion PHASE III Adams Yes - 1993 50% WR/R BY 2012 urrently updating plan CAsotin Yes - 1998 26% by 1997 Benton Yes - 1994 35% by 1995 Currently updating plan Chelan Yes - 1995 26% by 1995 Beginning plan update Columbia 1996 first draft complete Yes - 1994 20% WR/R by Currently updating Plan, Douglas Yes - 2002 25% by 1995 Update complete Ferry Yes - 1993 35% WR/R by 1995
50% WR/R by 2013 Preparing to update plan
Franklin Yes - 1994 35% R by 1995 5% WR by 1998
Currently updating plan
Garfield Yes - 1993 26% WR/R by 1997 first draft complete Currently updating Plan, 22% WR/R by 20
Kittitas Yes - 1999 50% by 2006 (in update) Klickitat Yes - 2000 50% diversion Lincoln Yes - 1992 35% WR/R by 1997 Amended plan 1999 Okanogan urrently updating plan Yes - 1993 30% by 2000 CPend Oreille Yes - 2002 45% WR/R by 2015 Stevens Yes - 1994 36% WR/R by 2012 Currently updating plan Walla Walla Yes - 1994 40% by 2002 Currently updating plan Whitman Yes - 1997 40% WR/R by 2001 Currently updating plan Yakima Yes - 1994 35% by 1995 Currently updating plan
Thurston Yes - 2001 by .5% by 2005
Update complete and approved 2001, waiting for City sign-off (issues)
Whatcom Yes - 1999
Grant Yes - 1995 00 Amended plan 1999
Partnering for the Environment through Financial Assistance
Ecology launched the Coordinated Prevention Grant (CPG) Program in 1992. The CPG ants distributed to local governments for waste
ts
ents to work together to xamine their waste management needs and decide the activities they will propose for
base
Coordinated Prevention Grants (CPG)
is a consolidated program of prevention grmanagement programs and activities. Most of the local solid and moderate risk waste projects supported by state grants are funded through this Coordinated Prevention Grant Program. Since 1992, local governments have received over $116 million in CPG granto support their solid and moderate risk waste activities. The coordinated grant structure encourages local governmegrant funding. Ecology allocates the available funds for countywide areas, using a amount for each county plus a per capita amount. Local governments must apply and meet eligibility requirements to receive CPG grants and they must provide a cash match of 25 percent of the total eligible costs of their projects.
Solid Waste in Washington State --Eleventh Annual Status Report 31
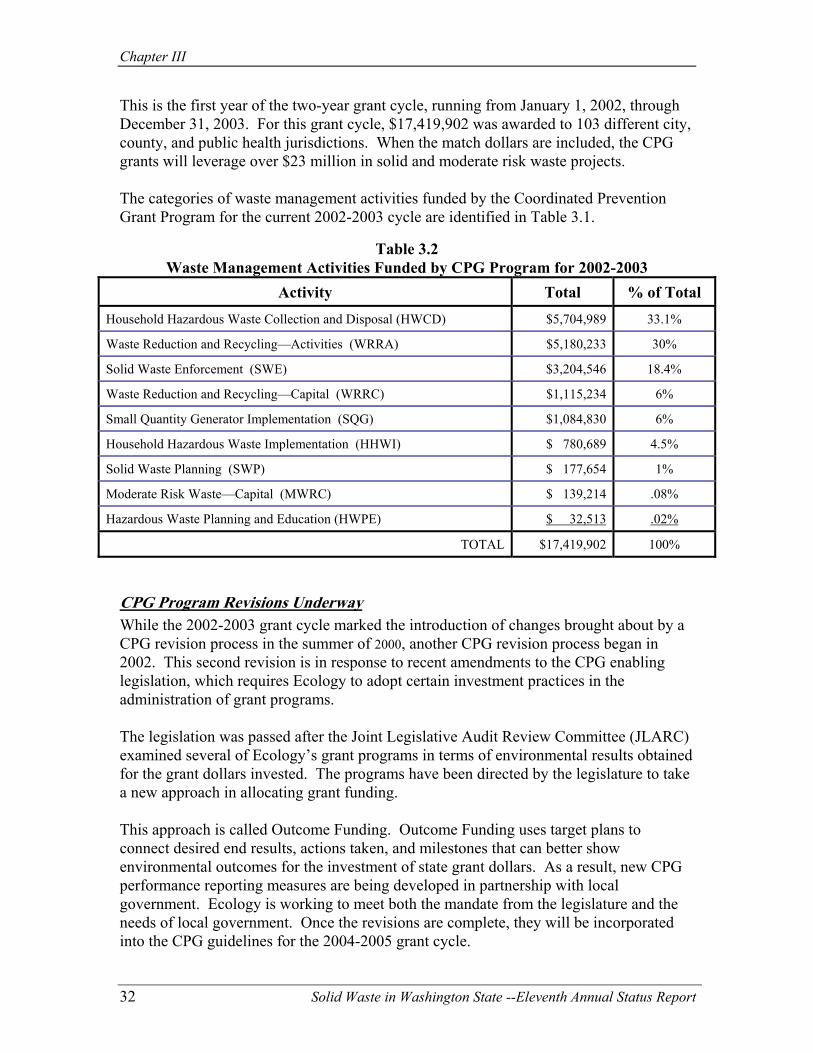
Chapter III
This is the first year of the two-year grant cycle, running from January 1, 2002, through ,
he categories of waste management activities funded by the Coordinated Prevention
Table 3.2 Waste Management Activities Funded by CPG Program for 2002-2003
December 31, 2003. For this grant cycle, $17,419,902 was awarded to 103 different citycounty, and public health jurisdictions. When the match dollars are included, the CPG grants will leverage over $23 million in solid and moderate risk waste projects. TGrant Program for the current 2002-2003 cycle are identified in Table 3.1.
Activity Total % of Total Household Hazardous Waste Collection and Disposal (HWCD) $5,704,989 33.1%
Waste Reduction and Recycling—Activities (WRRA) $5,180,233 30%
Solid Waste Enforcement (SWE) $3,204,546 18.4%
Waste Reduction and Recycling—Capital (WRRC) $1,115,234 6%
Small Quantity Generator Implementation (SQG) $1,084,830 6%
Household Hazardous Waste Implementation (HHWI) $ 780,689 4.5%
Solid Waste Planning (SWP) $ 177,654 1%
Moderate Risk Waste—Capital (MWRC) $ 139,214 .08%
Hazardous Waste Planning and Education (HWPE) $ 32,513 .02%
TOTAL $17,419,902 100%
CPG Program Revisions Underway W d the introduction of changes brought about by a
he legislation was passed after the Joint Legislative Audit Review Committee (JLARC)
his approach is called Outcome Funding. Outcome Funding uses target plans to
ew CPG
and the
into the CPG guidelines for the 2004-2005 grant cycle.
hile the 2002-2003 grant cycle markeCPG revision process in the summer of 2000, another CPG revision process began in 2002. This second revision is in response to recent amendments to the CPG enablinglegislation, which requires Ecology to adopt certain investment practices in the administration of grant programs. Texamined several of Ecology’s grant programs in terms of environmental results obtained for the grant dollars invested. The programs have been directed by the legislature to take a new approach in allocating grant funding. Tconnect desired end results, actions taken, and milestones that can better show environmental outcomes for the investment of state grant dollars. As a result, nperformance reporting measures are being developed in partnership with local government. Ecology is working to meet both the mandate from the legislatureneeds of local government. Once the revisions are complete, they will be incorporated
32 Solid Waste in Washington State --Eleventh Annual Status Report

Partnering for the Environment
CPG Pilot Project Tests Outcome Funding To test the Outcome Funding investment strategy recommended by JLARC, the Solid W FAP) offered $2 million in additional
er ty,
breakdown of the pilot grants according to the focus of the activities is
Figure 3.1 Amounts Awarded To Pilot Grant Projects During 2002-2003(By Activity Type)
aste and Financial Assistance Program (SW&CPG funding for pilot grant projects in the winter and spring of 2002. The goal was twofold: to learn more about grants as investments, and to help local governments furthimplement their solid waste plans. The focus of the pilot projects was on sustainabilidefined as waste reduction, pollution prevention, materials reuse, and energy or resource conservation. After an experimental application process, 30 grants were written to 22 different local
overnments. Agfound in Figure 3.1.
CPG Funded Pilot Projects By Activity Type(2 Million Dollars Total)
$678,23034%
$135,6637%
$288,39514%
$198,52310%
$597,38030%
Electronics Recycling
Waste Reduction & Recycling
MercuryRecovery
Sustainability
Waste Characterization
Organics Recycling
$97,500 5%
Solid Waste in Washington State --Eleventh Annual Status Report 33

Chapter III
Examples of Pilot funded activities include:
Waste Characterization: Clallam County received $37,500 to study quantities and types of waste generated countywide. The results will be crucial in planning for the transport system necessary after the Port Angeles landfill closes in 2006. Mercury Collection: Kitsap County received $11,000 to promote a thermometer exchange program that will assist residents wanting to exchange mercury fever thermometers with less toxic alternatives. Organics Management: In Pierce County, the city of Tacoma received $18,750 to test a new organics composting facility that will combine food and yard wastes from single-family homes, apartment complexes, florists, restaurants and grocery stores. Implementing Sustainability: In King County, the city of Bellevue is getting $185,000 to implement sustainable building concepts at a local greenbelt ranger station. The city of Seattle will use $89,300 for food-composting and environmental-purchasing studies. King County Solid Waste will receive $89,200 to convert diesel trucks to run on biodiesel fuel derived from waste oil.
Electronics Recycling: In Benton County, the city of Richland is getting $14,000 to sponsor a collection event for televisions, computer monitors, and other electronic waste. Collected materials will be recycled. Waste Reduction and Recycling: San Juan County will use its grant of $435,985 to construct a reuse and recycling facility in Friday Harbor.
For additional examples of the activities occurring under each of these pilot project categories, or more detailed information about the Coordinated Prevention Grants Program, please contact Steve Loftness, CPG Program Coordinator, at (360) 407-6060 or email at [email protected]. Grants to Citizens - Public Participation Grants (PPG) Washington’s chapter 170.105D RCW, Hazardous Waste Cleanup - Model Toxics Control Act, provides for a Public Participation Grant program. These grants make it easier for people (groups of three or more unrelated individuals or not-for-profit public interest organizations) to be involved in two types of waste grant issues:
• The cleanup of hazardous waste sites. • Carrying out the state’s solid and hazardous waste management priorities.
Public Participation Grant projects motivate people to change their behavior and take action that will improve the environment. These projects create awareness of the causes and the costs of pollution. They provide strategies and methods for solving environmental problems. This highly competitive program applies strict criteria to
34 Solid Waste in Washington State --Eleventh Annual Status Report

Partnering for the Environment
applications, awarding grants to projects that prevent pollution and produce measurable benefits to the environment. The PPG program writes grants for either one year or two years. All Hazardous Substance Release Site grants are automatically written for the biennium (2 years). The Pollution Prevention Education/Technical Assistance grants may be written for one or two years. The most a grant recipient may receive for a one year grant is $60,000; a two year grant recipient may receive up to $120,000. For the July 1, 2001 through June 30, 2003 grant period, Ecology initially offered 27 groups/organizations Public Participation grants. One grant recipient declined the grant offer due to changes in their organizational focus and another declined due to lack of someone to take leadership for the project. This left 25 entities accepting the grant offers for a total of $903,000 for the biennium. These funds provided sixteen (16) grants for cleanup of hazardous waste sites and nine (9) grants for carrying out solid/hazardous waste pollution prevention education management priorities. Moving Toward Sustainability: The Solid Waste & Financial Assistance Program is turning its focus more toward sustainability initiatives, initiatives that are more efficient and effective because they prevent waste rather than manage it. The PPG program has been providing support to projects that are focused toward various levels of Sustainability. The following grants issued in the 2001-2003 biennium provided support to projects that were moving toward sustainability in their community or a specific business/industry. Toxics Reduction Initiatives
• Puget Soundkeeper Alliance – Initiate and facilitate meetings with Jefferson, Skagit, Island & Clallum counties with the EnviroStars Cooperative to identify needs and/or limitations to participating in the Cooperative’s autobody shop waste audits. Also to implement the last phase (year 3) of the pilot project with the Puget Sound Clean Air Agency (PSCAA) and the Autobody Crafters Association (ACA) to reduce the cost of the air permit to autobody shops that have attained the four or five star level.
• WA Toxics Coalition – Provide up-to-date health care information on how to
protect the residents of the state and their environment. Their focus is to persuade and enable the residents to use safe or less toxic indoor and outdoor home care products in order to reduce toxic exposures to salmon, wildlife and humans.
Solid Waste in Washington State --Eleventh Annual Status Report 35

Chapter III
Sustainability & Public Education
• Community Services Work Group – Coordinated education/outreach events on waste prevention and energy conservation for Earth Day.
• Lake Roosevelt Forum – Create an arena where diverse interests can come to
express their concerns and ideas and build a dialog based on trust and respect for each others’ interests and needs. Through this diverse group, common ways to protect and/or preserve the quality of the environment Lake Roosevelt will be developed.
Business Redesign
• Automotive Recyclers of Washington – Seminars to be held on Best Management Practices for hazardous waste and stormwater management for auto wrecking yard site cleanup; also to educate auto recyclers about new regulatory changes and proposed changes including the Mercury Recycling Plan due in December of 2002.
• Washington State Recycling Association – Plan and hold statewide commercial
recycling roundtables. The focus is to bring local community businesses and commercial waste haulers and/or recyclers together to discuss opportunities to initiate or increase commercial recycling.
Past Grants Supporting Sustainability: Although there is an increased focus on sustainability, in the past, Public Participation Grants have also supported Sustainability projects. Below are only a few of the projects funded by past grants. Toxics Reductions Initiatives Fremont Neighborhood Council 1992 WA State Pest Control Association 1995 The Green Zone 1999 Clark County Hazardous Waste Citizen Task Force 2001
Sustainability and Public Education The Latona School United Parents 1993 WA Toxics Coalition 1996 Inland Empire Public Lands Council 1997 Lake Roosevelt Forum 2000
Business Redesign Washington Citizens for Recycling 1993 Economic Development Association of Skagit Co. 1994 Associated Industries of the Inland Northwest 1995 Cascadia Revolving Fund 1995 CDL/LEED Certification
36 Solid Waste in Washington State --Eleventh Annual Status Report

Partnering for the Environment
Sustainable Design Council 1993 Sustainable Building Collaborative 1993 Energy Outreach Center 1997 Resource Efficient Building & Remodeling Council 1999
Partnering for the Environment through Public/Private Cooperation Many partnerships between government, business, and the community have already been developed to better address these challenges on the local, state, or national level. The Solid Waste and Financial Assistance Program (SW&FAP) remains committed to supporting these existing partnerships. In addition, staff are identifying and helping to create new public/private partnerships to address current solid waste management challenges and to implement sustainability. By pooling resources and talents, these partnerships are identifying creative solutions to current solid waste management problems, converting waste to product, taking advantage of opportunities that might otherwise be lost, and sharing information to help others succeed. Examples of some of the partnerships supported by SW&FAP staff are discussed below. Cascadia Region Green Building Council Cascadia Regional Green Building Council is a chapter of the national organization, United States Green Building Council. It is a regional partnership of entities from Oregon, Washington, and British Columbia. Members include the private sector (contractors, architects, vendors, engineering firms, utilities, etc.), local and state government (Ecology, Office of General Administration, Seattle, King County, Portland, Vancouver, B.C.) and not-for-profit organizations. The partnership works together to accomplish the following goals:
• Promote the design, construction, and operation of buildings that are environmentally responsible, profitable, and healthy places to live and work.
• Serve the Cascadia members and their communities through development of industry standards, design practices and tools, policy advocacy, information exchange, and education.
• Encourage widespread acceptance of LEED (Leadership in Energy and Environmental Design) certification as the regional standard for building and communities.
Sustainable Housing Innovation Partnership SW&FAP staff has been working for two years with Spokane Neighborhood Actions Program (SNAP) to design and build up to 150 low-income housing units for larger families, using sustainable design and construction principles, techniques, and materials. SNAP’s property developers formed an unprecedented partnership of national and local public and private organizations whose roles varied from funding to technical consulting to user feedback. Organizations as diverse as Housing and Urban Development, Avista Utilities, the Northwest EcoBuilding Guild, the Pomegranate Center, and Spokane
Solid Waste in Washington State --Eleventh Annual Status Report 37

Chapter III
County Community Development joined hands with SNAP and Department of Ecology to help make the idea of sustainability built low-income housing a reality in Spokane. The first 53 units of Riverwalk Point are now under construction. SW&FAP staff helped the SNAP development staff understand sustainable design benefits and costs, select a green building design guideline to follow, screen and select architects and general contractor, and develop a method to document environmental performance of the project once it’s constructed. The public and partners are invited to track the progress of Riverwalk Point through a quarterly newsletter and a Web site: http://ship.snapwa.org. (NOTE: no www, please). Sustainable Design and Construction Seminar Series SW&FAP is partnering with Washington State University’s Interdisciplinary Design Institute (IDI) at the WSU-Spokane campus to offer a unique two-semester course in sustainable design and construction. A staff member from Ecology’s Eastern Regional Office organizes this unique combination of academic coursework and training for working professionals. The course entered its second year as an offering in WSU’s catalog in September 2002. The Seminars in Sustainable Design feature lectures on specific aspects of sustainable design and construction by recognized experts who are for the most part working professionals from throughout the Pacific Northwest. All classes are organized into topical units covering such technical areas as energy systems and the building envelope, indoor air quality, lighting alternatives, water conservation and stormwater management, green building materials, and others. Most students are upper division architecture, landscape architecture, interior design and construction management students at WSU-Spokane, however, the class sessions are also open to working professionals in design and construction who want to develop their green design and construction skills as part of their professional development. In 2002, the Seminars are being added to the Washington Higher Education Telecommunications Service (WHETS) system, which allows real-time classroom participation from multiple WSU remote campuses throughout Washington. In 2002, professionals from WSU’s environmental services office and physical plant will participate via WHETS from Pullman. Another group of professionals was planning to participate in selected units from WHETS classrooms in the Tri-Cities, and Vancouver, Washington. This partnership enables Ecology to promote sustainability in design and construction by giving new architects, interior designers, and construction managers the skill-set needed to be effective at advocating for sustainable design and construction practices and executing sustainable design plans.
38 Solid Waste in Washington State --Eleventh Annual Status Report

Partnering for the Environment
Students attending a hands-on workshops with alternative building materials like straw In 2001, 25 students enrolled in at least one semester of the Seminars and eight working professionals enrolled in at least one of the technical units that make up the Seminars. Enrollment of full-time students in fall 2002 was 20 with 13 working professionals planning to participate by WHETS from Pullman and Tri-Cities. The seminar series also uses a commercially offered Web site (www.sdacteam.intranets.com) to share homework assignments, required and suggested readings, conduct on-line topical forums amongst guest lecturers, faculty, and students, and list important educational events in sustainable design with hyperlinks to more information on course topics. Cooperative Composting Facility SW&FAP is partnering with the City of Leavenworth, the City of Cashmere, Chelan County, and Tree Top Inc. to site, permit, finance, and operate a composting facility. By pooling resources and working together, the project will provide specific benefits to the participants and will establish an organics recycling facility in the upper Wenatchee Valley. The facility will:
• Establish a “beneficial use” alternative for City of Leavenworth biosolids.
• Develop an alternative market for fruit pomace produced by Tree Top, Inc.
• Provide a yard waste recycling option for Chelan County and an alternative to burning.
• Augment the City of Cashmere’s yard waste collection program and develop a revenue source for its Solid Waste Program.
• Divert organic wastes from landfill.
Solid Waste in Washington State --Eleventh Annual Status Report 39

Chapter III
Xeriscape Demonstration Garden The mission of the Yakima Area Arboretum is to create and share a living museum of botanical specimens in order to cultivate a greater knowledge and appreciation of trees and plants from around the world in an atmosphere of beauty, relaxation, and inspiration. SW&FAP is partnering with the Arboretum and Yakima County Solid Waste to design and create a xeriscape garden at the Arboretum. SW&FAP staff secured a $4,000 Environmental Protection Agency Region 10 grant to help fund the project and Yakima County Solid Waste is contributing $3,000 from a Pilot Coordinated Prevention Grant.
Construction of the Xeriscape Demonstration Garden
The garden will be part of a series of newly established topic gardens and will be designed to educate Yakima Valley residents on the value of water conservation, use of compost and recycled materials, reduced use of chemicals, and the value and beauty of landscaping with native and xeriscape plants. In addition to being used as a learning center, the Native Plant Society will propagate native plants for sale with the proceeds going to support the arboretum. Volunteers at the arboretum will maintain the garden. Fort Lewis Sustainability Initiative Fort Lewis, in Pierce County, has embraced the concepts of sustainability and is now examining how to implement selected goals in certain key areas during the next five years. This effort began with a multiday conference held at the Tacoma Convention Center where various natural resource agencies, health departments, and military personnel met and created a long-term set of strategies and possible goals for Fort Lewis commanders to consider. SW&FAP staff is helping the materials procurement and materials workgroup in examining the systems and planning effective strategies for sustainability for the coming five-year period.
40 Solid Waste in Washington State --Eleventh Annual Status Report
Partnering for the Environment
National Paint Dialogue The Northwest Product Stewardship Council (NPSC) is a group of government agencies working with businesses and nonprofit organizations to integrate product stewardship principles into the policy and economic structures of the Pacific Northwest. The Northwest Product Stewardship Council and the Product Stewardship Institute (http://www.productstewardshipinstitute.org/), on the national level, are working on product stewardship initiatives for several priority waste streams, one of these being old paint. There are industrial, consumer, and energy markets for old paint, and at the local level, costs are significant for management of those same materials. Consequently, local communities are striving to find ways to move the management of old paint toward these markets as well as encourage the paint industry to become more actively involved in waste avoidance and end-of-life management. It is a push toward more sustainable practices for old paint. SW&FAP staff represent the interests of Washington and providing an active liaison function for the Northwest Product Stewardship Council by serving as a member of the national dialogue on paint sponsored by the Product Stewardship Institute.
Partnering for the Environment by Beneficial Use of Wastes Biosolids In the spring of 1998, Ecology issued a new rule, chapter 173-308 WAC, Biosolids Management, and a new statewide General Permit for Biosolids Management. In the past four years staff have been focusing on three workload areas:
• State program delegation to local health departments • Permit program implementation • Technical assistance
Local Delegation By late 2002, eleven health jurisdictions had accepted some degree of delegation and were actively partnering with Ecology towards implementation of the state biosolids program. Other health jurisdictions are also working with Ecology but have not authorized a formal delegation arrangement. Local funding and workload issues have been barriers to delegation. An unanticipated barrier has been continued concern regarding implementation of the septage management portion of the state program. Ecology is convening an advisory committee to evaluate the current septage management elements of the state biosolids program and make recommendations for improvements. A resolution of those concerns may encourage further delegation at the local level. At the same time, budgets continue to tighten and are expected to be an on-going barrier to delegation efforts.
Solid Waste in Washington State --Eleventh Annual Status Report 41

Chapter III
Permit Program Ecology estimates there are about 375 Treatment Works Treating Domestic Sewage (TWTDS) statewide (these are the facilities which are subject to permitting under the state biosolids program). This number includes federal and state facilities, as well as Beneficial Use Facilities, composting facilities, and some septage management facilities. Most TWTDS, however, are publicly owned treatment works (municipal sewage treatment plants). All facilities are obligated to comply with any applicable requirements of the state rule, regardless of their status under the permit system. Treatment works come under the biosolids permit system in two phases. The first phase, called “provisional approval,” obligates a facility to comply with all applicable requirements of the statewide general permit. The second phase – final approval – is the process whereby facility specific requirements beyond those required under the rule or basic general permit are developed and put in place. This process is necessarily slower due to the complexity of reviewing individual permit applications with limited staff resources. Virtually all facilities are now under provisional approval, and about forty final approvals of coverage under the statewide permit have been granted as of October 2002. Permitting of septage land application sites and beneficial use facilities has consumed a disproportionate amount of staff time. Resolution of difficulties encountered in permitting these types of facilities would speed the overall permit issuance process.
Septage Management The 2002 Legislature approved a supplemental budget request for SW&FAP to pursue an assessment and potential revisions to the current septage management elements of the state biosolids program. A fifteen person inter-agency advisory committee has been assembled, including representatives from the regulated community. The committee held its first meeting in September 2002. The committee will identify goals, evaluate options and recommend a course(s) of action. Final recommendations are due by June 30, 2003. Resources permitting, the agency may begin work on the recommended actions. Composting Composting continues to be a key element of the state’s strategy of reaching statewide 50 percent recycling goal. Thirty-five compost facilities actively recycled organic material in Washington in 2002. Collectively they transformed over a million cubic yards of organic waste, which included (in order of quantity recycled): yard debris, miscellaneous material including food waste, wood waste and sawdust, manure, and biosolids. From this organic waste material approximately 600,000 cubic yards of finished compost were produced and sold. (This quantity includes updated information from a telephone survey in November 2002.)
42 Solid Waste in Washington State --Eleventh Annual Status Report

Partnering for the Environment
Since 1985, compost facilities have been primarily permitted under the Minimum Functional Standards for Solid Waste Handling, chapter 173-304 WAC. Two guidance documents have helped clarify the requirements for composting and compost quality over the past several years (Compost Facility Resource Handbook, #97-502; Interim Guidelines for Compost Quality, #94-38.) Ecology has incorporated many of the facility designs and operating standards from the compost facility handbook into the revised rule chapter 173-350 WAC, Solid Waste Handling Standards. The new rule has a section that deals specifically with compost facilities and should provide increased clarity and consistency for permitting. In addition, the new section includes compost quality criteria. Finished product must meet the criteria in order to be considered “composted material,” and no longer subject to solid waste handling requirements. The rule should be in place in early 2003. (See Chapter 1 for more information on the new solid waste rule.) The Solid Waste and Financial Assistance Program (SW&FAP) continues to support composting and compost use through a number of collaborative activities: training compost facility operators promoting compost use for erosion control and stormwater management, and meeting the challenges of herbicide contamination in compost.
Compost Facility Operator Training SW&FAP views training as an essential component of a successful composting industry. Staff have been involved in administering a well-received workshop offered by the Washington Organic Recycling Council (WORC) for the past several years. In 2001 and 2002, WORC revised the 5-day curriculum to focus on the biology of composting, reinforced with hands-on field activities. The new format has received enthusiastic reviews by workshop participants. It helps to strengthen the composting industry by focusing attention on the underlying reasons for both regulatory and market-driven requirements.
Erosion Control and Stormwater Management SW&FAP recognizes the potential for compost and organic mulches to reduce soil erosion and protect water quality. Use of compost in roadside improvements has steadily increased over the past several years. In September 2002, the Washington State Department of Transportation reported using 20 percent of all compost produced in the state from permitted compost facilities. SW&FAP anticipates future collaboration to document the benefits of compost used in erosion control blankets and filter berms. Ecology continues to promote the concepts of the “Soil for Salmon” initiative, a program started by WORC in 1999. “Soils for Salmon” gained national recognition as an education program for raising public awareness about the link between soil quality in developed landscapes, water quality, and salmon recovery. In keeping with the soil quality/water quality link, Ecology incorporated voluntary BMPs into the Stormwater Management Manual for Western Washington. The BMPs call for preserving native soils as the best strategy for protecting site hydrology and preventing negative impacts to stormwater. Where soils must be disturbed during development, the BMPs call for increasing organic matter to a depth of 12 inches in order to improve infiltration and water holding capacities of the soil.
Solid Waste in Washington State --Eleventh Annual Status Report 43

Chapter III
Clopyralid The herbicide ingredient, Clopyralid, has been a significant issue affecting compost in Washington for almost three years. Ecology is working with the Washington State Department of Agriculture (WSDA) and several stakeholder groups to develop a strategy for keeping Clopyralid out of composting feedstocks. Manufactured by DOW AgroSciences, Clopyralid is marked in a number of formulations designed to kill broadleaf weeds such as clover, thistle, and dandelion. Clopyralid (clo-peer-ra-lid) persists through the composting process and has been shown to damage sensitive plants at concentrations as low as one to three parts per billion in finished compost. Concerns about the herbicide first appeared in eastern Washington in 2000, when growers in Spokane and Pullman experienced crop damage that was later traced to Clopyralid. WSDA investigated the herbicide complaints, finding high use rates of Clopyralid on lawns in the Spokane area. Although grass clippings are not the only composting feedstock likely to contain Clopyralid, yard debris appeared to carry the highest potential for negative impacts to the state’s successful recycling systems. In response, WSDA convened a technical advisory committee in the Fall 2001. WSDA issued an emergency rule on March 1, 2002, prohibiting use of Clopyralid-containing herbicides on all lawns and turf in Washington State, except golf courses. The emergency rule was followed by a permanent rule which became effective on June 28, 2002. Ecology continues to work with WSDA, research institutes, composters, local governments and consultants to formalize a low-cost bioassay to identify herbicide damage in susceptible plants grown in compost-amended soil. Research will continue to evaluate the effectiveness of the state rule prohibiting use of Clopyralid on lawns and turf. Unfortunately, the Spokane Regional Compost Facility stopped processing yard debris early in 2002, as a result of the Clopyralid issue. Although the problems with herbicide contamination have not been completely solved, composting in Washington State is a successful industry. Organic materials comprise over half the solid waste generated in Washington and the recycling of these materials are key to reducing the volume of material placed in landfills. Compost provides a variety of benefits including the improvement of soil, water conservation, reduction of erosion and the need for fertilizers and pesticides. Due to the collaborative efforts of government, private industry, and researchers, composting has taken progressive, positive steps in dealing with adversity while encouraging continued recycling and beneficial use of organic waste streams in Washington.
44 Solid Waste in Washington State --Eleventh Annual Status Report

Partnering for the Environment
Partnering for the Environment by Focusing on Specific Problem Waste Streams
Effective and proper management of Washington’s solid and moderate risk waste streams, and biosolids including programs designed to reduce, reuse, beneficially use and recycle many of those wastes, relies on the coordinated efforts of local, state, and federal governments in conjunction with private businesses and the general public. Past efforts of the Solid Waste & Financial Assistance Program (SW&FAP) have focused on the organic waste streams and the construction and demolition waste stream. The focus is now shifting to other specific waste streams including electronic waste, old paint, tires, and persistent bioaccumulative toxins (PBTs) mercury and certain pesticides.
Electronic waste Electronic waste refers to unwanted computers and peripherals, TVs, VCRs, and other devices that are common consumer items for business and personal use. Technological innovation currently requires upgrades on an average of every 18 months, a pace which continues to accelerate. It is estimated that there are about 315 to 680 million obsolete computers in the United States today. 1 However, a large percentage of these units have not entered the solid waste system—yet. Each consumer household is estimated to have two to three unwanted computers stockpiled in its basement, garage, or storage unit.2 As technology saturates the market through inventions such as high definition television (HDTV), the number of obsolete units per household will increase. Experts predict that a consumer threshold is readily approaching and people will want to dispose of their old electronic products to make room for new ones.
The solid waste system is now faced with a massive new electronic waste stream which contains dangerous heavy metals, such as lead, mercury, or cadmium. The plastics used in computers and TVs contain brominated flame-retardants, polyvinyl chloride (PVC), and (in older capacitors and transformers) polychlorinated biphenyls (PCBs). Cathode ray tubes (CRTs) found in standard computer and TV monitors are one of the more problematic elements of these units due to the amount of lead used in the units. If these toxic components were to be disposed of in a landfill, there would be little guarantee the landfill could contain these chemicals and metals over its lifetime. At less stringently operated landfills or incinerators, environmental problems may be much worse. For instance, burning halogenated flame retardant products found in computers releases dioxins and furans. Massachusetts recently banned all electronic waste from their disposal system to prevent incineration of these items. 1 Silicon Valley Toxics Coalition. 2002 “Poison PCs and Toxic TVs: California’s biggest environmental crisis that you’ve never heard of.” P. 2
Solid Waste in Washington State --Eleventh Annual Status Report 45
2 Ibid.
Chapter III
Washington State regulation deems computers containing CRTs as dangerous waste under the Dangerous Waste Regulations, chapter 173-303 WAC. In light of the perceived logistical burdens which would ensue from this designation, Ecology developed an interim enforcement policy for conditional exclusion of CRTs. (See http://www.ecy.wa.gov/pubs/0204017.pdf for the full document.) The policy excludes monitors containing CRTs from dangerous waste rules if recycled by a legitimate recycler. Individuals are not required (at the state level) to recycle their personal monitors. Due to the impacts on the Solid Waste and Financial Assistance Program (SW&FAP) and the Hazardous Waste and Toxics Reduction Program, staff from both programs are collaborating to implement this policy. It is important to note that state regulation is not the only level of regulation applied to CRTs. County governments may have different requirements for handling materials classified as “universal waste.” Due to stricter regulation of universal waste, some counties are facing a total landfill ban in their county. While a landfill ban may seem like the best environmental policy, local governments may not have enough (or any) alternatives in place for their constituents, such as accessible recycling facilities or collection sites. This could lead to a dramatic increase in the rates of illegal dumping or could result in residents taking computers to neighboring counties (or states) without complete landfill bans. However, it violates federal RCRA rules to dispose of commercial waste that designates as a hazardous waste into typical solid waste landfills. The interim enforcement policy aims to encourage recycling rather than disposal. However, electronics recycling is not the sole answer to this complex problem. In the recent past, much of the e-waste “recycled” has been sent to Asian countries for disassembly and recovery of the valuable materials. Few, if any, environmental or labor protections exist for these recycling operations. If this practice continues, the toxic legacy of electronics products will be merely displaced from U.S. soil to communities abroad. The interim enforcement policy requires companies that export CRTs to document the shipment and use a legitimate recycler. One of the primary reasons these computers are exported to other countries is that few domestic recyclers exist for certain components of electronic products. Additionally, computers are not designed for easy or safe recycling, reuse, or disassembly. Many products are so expensive to upgrade or repair that it is easier to purchase a brand new unit. Alternative products, such as LCD monitors, have been proposed as a possible solution to CRTs, but their environmental impact may be as large as CRTs. Another consideration in handling the electronic waste stream is that cost is a significant barrier for efforts to safely reuse, recycle, and collect electronic waste. As an example, the typical recycling cost for an obsolete monitor is approximately $20-$30 (depending on staff and transportation costs). In order to collect and recycle 10,000 computers, it would cost $200,000-$300,000. Municipalities are not prepared to bear these costs exclusively.
46 Solid Waste in Washington State --Eleventh Annual Status Report

Partnering for the Environment
Information on the volume of electronic devices is also limited and this impedes planning efforts for governments. Since it is estimated that a large percentage of unwanted electronics are simply being stored, traditional waste composition studies cannot accurately account for the volume of this waste. Ecology can play an important role in acquiring needed data to anticipate the volume of electronic waste. Ecology can also assist with sharing information and appropriate strategies that will help to coordinate efforts between governments as they prepare to handle this waste stream. The Solid Waste and Financial Assistance Program (SW&FAP) is working with the Hazardous Waste and Toxics Reduction Program to assess electronic waste issues in Eastern Washington. Data will be compiled and analyzed by December 31, 2002. Questions being addressed through surveys of both the public and private sectors include:
1. How much e-waste exists and will be generated in the future? 2. What existing facilities handle e-waste? 3. Can the current and projected wastes be collected and handled, given the existing
infrastructure? If not, what new services or facilities are needed? 4. Can these wastes be processed and reused in an environmentally sound and
sustainable manner? 5. What next steps should Ecology and other northwest jurisdictions take to manage
these wastes? What opportunities exist for development of local small business? SW&FAP staff are working with solid waste directors in Douglas and Kittitas Counties to assess how much electronic waste exists in both businesses and residences. A questionnaire will be sent out to businesses and handed out at local grocery stores addressing how many computers/televisions are being stored in both homes and businesses and the cost people will be willing to pay associated with recycling. Data will be compiled and analyzed by March 2003.
While electronics collection events are becoming commonplace, they may simply perpetuate the assumption that someone will take care of dangerous electronic waste when the product is no longer wanted. A more sustainable strategy is to assess the full cost of the computer from cradle to grave and look farther “upstream” to avoid expensive and dangerous disposal costs. Multiple environmental, health, and energy costs also exist throughout the product’s life cycle. Typically, many of these costs are paid without reference to producer or consumer responsibility. A “product stewardship” approach advocates that the costs of electronic products should be fully accounted for, understood by, and appropriately assigned to the creators and manufacturers of their design. Additionally, the consumers of these products need to understand (through incentives and economic barriers) the costs of their consumer choices. A product stewardship model requires the participation of government, consumers, tax payers, and industry groups. Currently, Ecology, along with other local government representatives, is participating in a national set of negotiations that will attempt to provide a product stewardship solution to electronic waste. The negotiations, called the
Solid Waste in Washington State --Eleventh Annual Status Report 47

Chapter III
National Electronics Product Stewardship Initiative (NEPSI), will help state and local governments nationally coordinate their programs to safely collect, reuse, and recycle electronic waste with an appropriate funding mechanism. However, the increasing difficulties at the NEPSI negotiations may require local legislation if a final decision is not reached. For more information on product stewardship, please see http://www.productstewardship.net/productsElectronics.html. Tires - A Growing Waste Management Problem Washington state is working to address our growing scrap tire problem. This is depicted in the recent passage of House Bill 2308 in 2002 (http://www.leg.wa.gov/pub/billinfo/2001-02/House/2300-2324/2308-s_sl_04082002.txt). One section of the act created by this bill directs Ecology to investigate and draw conclusions on the following by December 31, 2002:
(1) The use of scrap tires as alternative daily cover for landfills. (2) The feasibility of establishing and maintaining an incentive program for market
development for scrap tires. Another section of this act directs Ecology, in conjunction with the appropriate private sector stakeholders, to track and report annually to the legislature the total increase or reduction of tire recycling or reuse rates in the state for each calendar year. Scrap tires have been problematic for this state before. In fact, during the early 1990s, Washington was heavily focused on cleanup of tire piles. This effort was funded by the Vehicle Tire Recycling Account (VTRA), which was created in 1989 and supported by monies collected from a one dollar per tire fee on the retail sale of new replacement vehicle tires. While the VTRA did sunset in 1994, this account ultimately cleaned up more than 8 million tires in 27 large illegal tire piles throughout Washington. Specifically, the cleanup effort included ten tire piles in Pierce County, seven tire piles in Thurston County, three tire piles in Spokane County, two piles in Clark County, and one each in Lewis, Kittitas, Stevens, Asotin, and Yakima counties. Ecology estimates that approximately 5.5 million scrap tires, or 75,000 tons, were generated in Washington in 2001. This large volume is beginning to overwhelm Washington’s scrap tire management system despite tire collector, seller, hauler, processor, storage, and disposal regulations. Thus, just a few years after the last VTRA monies were spent on tire pile cleanup, scrap tires are once more a growing problem in Washington State. Illegal piles are cropping up again in Washington and with them come the characteristic associated hazards of mosquito and rodent refuge, as well as fire susceptibility from arson, lightning strikes, and spontaneous combustion. Illegal tire piles are not managed to be fire resistant. According the United States Fire Administration’s Special Report 93, titled “Scrap and Shredded Tire Fires,” published in 1998:
48 Solid Waste in Washington State --Eleventh Annual Status Report

Partnering for the Environment
“Tires burn with a higher per-pound heat output than most coal, and the high heat production of tire rubber makes extinguishment difficult. Tire pile fires yield large amounts of oil that is both flammable and a threat to the environment. Such fires become hazardous materials incidents that may affect entire communities, often requiring neighborhood evacuations, protracted fire operations, and causing contamination of the air, waterways, and water table.” (Page 5) http://www.usfa.fema.gov/downloads/pdf/publications/tr-093.pdf
The scrap tire problem in Washington may be due largely to the fact that new markets and economically viable recycling/reuse technologies which use this commodity have been slow to emerge in our state. This slow emergence, in turn, may be due to general misconceptions regarding the magnitude of the scrap tire problem. Additionally, from a leadership perspective, state and local governments may not have been able to focus on scrap tire matters due to other pressing issues.
End-of-life management has been the traditional approach taken with tire products. This means that the primary focus is on what use, if any, will the tire be put to once it is initially removed from its manufacturer’s intended use. The tire could be: retreaded and put back to the manufacturer’s intended use; reused in its current condition for another purpose; dismantled in some way and put to another use; incinerated for energy production; stored for future reuse or recycling; or the tire could simply be disposed of. Some of these options lead to more complete employment of the valuable resources required to produce the tire in the first place. Other options lead to loss of these resources all together. Scientists, entrepreneurs, and government agencies have done much research and development in the scrap tire recycling/reuse arena. A few of the many innovative “downstream” uses for scrap tires that have been identified and recently employed in the United States include:
• Scrap tire bales used as a road subgrade. • Playground rubber safety surfacing made from recycled tires. • Landfill leachate collection systems made from three- to six-inch tire shreds. • Tire chips as a replacement for stone in septic system leach fields. • Crumb rubber for playground surface. • Crumb rubber top dressing applied to turf in high foot-traffic areas. • Rubber modified asphalt. • Tire chips used in street repair. (Note: See articles on the above topics at http://www.scraptirenews.com/archive.html.)
While this downstream management of tires is quite necessary, focusing on this management strategy alone does little to address upstream impacts to air, water, and land from the manufacture and use of tires. Additionally, downstream management of tires can be costly and unfairly burdensome on tax payers. To head off the tire problem we must address all life cycle impacts of tires and involve the organizations that have the most ability to effect change: tire manufacturers. Solid Waste in Washington State --Eleventh Annual Status Report 49

Chapter III
Some government agencies are looking at product stewardship as a management tool to focus on life cycle product impacts. The United States Environmental Protection Agency (EPA) is one such agency (http://www.epa.gov/epr/index.htm). Product stewardship is a term used to describe a product-centered approach to environmental protection. It calls on all participants in the product life cycle—designers, manufacturers, retailers, consumers, waste managers, and disposers—to share responsibility for reducing the environmental impacts of products. These participants can undertake a number of initiatives which will help to decrease life cycle impacts of tires. Some examples include:
• Designing new tires to have greater life expectancy and durability. • Manufacturing of retread tires. • Use of recycled content in production of new tires. • Passing legislation designed to support the incorporation of the principles of
product stewardship in a tire’s life cycle. • Purchasing tires manufactured to decrease life cycle impacts.
Many companies, organizations, and individuals have already begun to research and incorporate some of these life cycle focused initiatives. The EPA has identified examples of such initiatives put forth by all levels of stakeholders (these can be viewed at http://www.epa.gov/epr/products/tires.html). SW&FAP, too, is focusing on life cycle management of tires through fulfillment of legislative directives, research and technical assistance, and continued support of the Northwest Product Stewardship Council (http://www.productstewardship.net/productsTires.html). The legislative report can be found at www.ecy.wa.gov/programs/swfa/index.html.
PBTs: Mercury and Certain Pesticides Persistent bioaccumulative toxins (PBTs) are emerging as an important issue across the state. PBTs are toxic substances that build up to harmful levels in tissues of organisms and do not break down easily in the environment. Bioaccumulation is the increase in concentration of chemicals/toxins in organisms, and is the result of the organism’s inability to metabolize a chemical/toxin as fast as it is absorbed. Human exposure to PBTs can result in adverse impacts to the nervous system and the reproductive system, as well as causing cancer and a range of developmental and genetic problems. Known PBTs include mercury, lead, polychlorinated biphenyls (PCBs), dioxin, furan, and some pesticides. PBTs such as mercury and some pesticides can be released to the environment through spills or improper disposal. Further, mercury disposed in landfills often is transformed into a gaseous form that escapes. State and local governments have recognized the risks associated with PBTs, and are taking steps to reduce improper use and disposal of these substances. Ecology’s PBT Initiative has selected mercury as the state priority PBT. A chemical action plan for mercury has been drafted, and can be found at www.ecy.wa.gov/programs/eap/pbt/pbtfaq.html. Ecology is also participating in a mercury advisory committee with local governments, businesses, citizen groups, and other interest groups.
50 Solid Waste in Washington State --Eleventh Annual Status Report

Partnering for the Environment
In June 2002, local governments working with household hazardous waste and conditionally exempt small quantity generator waste (HHW/CESQG, in Washington known collectively as moderate risk waste) met for the Pacific Northwest HHW/CESQG Strategy Meeting to identify regional priorities. Mercury and pesticides were identified as focus areas for the region. As a result, several groups established during this meeting have started working on coordinated efforts to deal with these PBTs and to educate the public about the potential impacts of mercury and certain pesticides. Many local governments have already begun these efforts, which include education programs and collection of mercury thermometers from residents, many of them funded through Coordinated Prevention Grants. While mercury can be recycled, the removal of mercury from many products will result in the need for a disposal solution. Some state and local governments are considering a product stewardship approach to address the problems associated with PBTs. With product stewardship, all groups and individuals, from the manufacturer to the consumer, that benefit from the use of the PBT would be responsible for making sure it is managed and disposed of correctly. As this issue continues to emerge in the state, each organization should be aware that they are not alone in their efforts. Coordinating with other jurisdictions and other states will lead to a more effective program for the elimination of this threat to human health and the environment. Those interested in joining this important discussion are encouraged to visit the new Pacific Northwest discussion forums on mercury and pesticides located on the North American Hazardous Materials Management Association website (www.nahmma.org). These forums are being actively supported by the Northwest Product Stewardship Council. Ecology is also sponsoring a list serve for professionals dealing with HHW/CESQG (http://listserv.wa.gov/archives/hhw-cesqg.html). Old Paint Old paint is collected from residents in every county by local moderate risk waste (MRW) programs, many funded by Coordinated Prevention Grants. The combination of latex and oil-based paints from households is the largest category of waste collected at household hazardous waste collection events and fixed facilities. In the year 2000, over 3.3 million pounds of old paint was collected from households. Only used oil, from the used oil collection system plus HHW collections and facilities, contributes more to MRW amounts, at 10.5 million pounds in 2000. The paint collected was about 65 percent oil-based and 45 percent latex based. It is expected that latex will become a larger proportion of the MRW waste stream as it represents the majority of paints currently sold.
Solid Waste in Washington State --Eleventh Annual Status Report 51
In 2000, approximately eight percent of all Washington households participated in HHW collection activities, each bringing in approximately 66 pounds of HHW. Total quantities of MRW are conservatively projected to increase 69 percent by 2015 from 1999 levels (http://www.ecy.wa.gov/pubs/0007041.pdf). Based on 1999 cost information, the cost per participant can be assumed to be in the range of $40 to $65. The OFM estimate of households (http://www.ofm.wa.gov/poptrends/poptrends01.pdf) in Washington as of April 2001 is 2,490,000. If we combine this number of households with the recent eight

Chapter III
percent participation rate and a cost of $50 per household, the total HHW collection and disposal cost to local and state government can be estimated at about $10 million for the year 2001. If this cost is increased by anywhere near the 69 percent estimate volume increase for MRW from 1999 to the year 2015, there is a looming financial problem associated with continuing HHW collection using the current paradigm. The used oil from households is relatively inexpensive to manage compared to paint. The majority of latex paint is recyclable as it in received at HHW collection points. Some communities such as Pacific County, Yakima County, and Seattle are among those actively recycling latex paint. There are significant added costs of equipment, building, and labor costs to recycle latex paint. Clark and Cowlitz Counties send their latex paints to Portland where it is processed at a dedicated one-of-a-kind latex recycling building. Because of the large volume and cost of managing old paint, some local programs have discouraged households from bringing it into HHW collection sites. Ultimately, most paint can be recycled or used as a feedstock for industrial products or used as an alternative fuel. A minority of it requires solidification for landfill disposal. There are industrial, consumer, and energy markets for old paint, and at the local level costs are significant for management of those same materials. Consequently, local communities are striving to find ways to move the management of old paint toward these markets as well as encourage the paint industry to become more actively involved in waste avoidance and end-of-life management. It is a push toward more sustainable practices for old paint. This is being done regionally through the Northwest Product Stewardship Council (http://www.govlink.org/nwpsc/) as well as through the national organization, Product Stewardship Institute (http://www.productstewardshipinstitute.org/) in which staff of SW&FAP and other Ecology staff participate. Moderate Risk Waste In early June 2002, local and state government staff met to discuss what strategic direction MRW programs should be taking. Since most programs are about a decade old, it was time to examine what has happened and, more importantly, to map out the best next steps and areas on which to focus attention. Because waste does not respect political boundaries, the conference included state and local representatives from Oregon and Idaho as well as the occasional Montana and British Columbia representative. It was organized by local state officials in collaboration with the North American Hazardous Materials Management Association (NAHMMA). The strategic meeting was professionally facilitated and evaluations gave the event high marks in every category. Staff from SW&FAP moderated some of the workgroups. Results from the 50 participants included:
• Formation of issue specific workgroups on the following topics hosted on the NAHMMA website (http://www.nahmma.org/cgi-bin/ubbdiscuss/forumdisplay.cgi):
• Creation of a new regional HHW-CESQG professionals list serve sponsored by
Ecology at http://listserv.wa.gov/archives/hhw-cesqg.html.
52 Solid Waste in Washington State --Eleventh Annual Status Report

Partnering for the Environment
• Clear direction from the group to continue holding annual HHW/CESQG
meetings to include presentations, training opportunities, and workgroups. On many issues discussed at the strategic meeting a clear connection was made to the Northwest Product Stewardship Council (http://www.govlink.org/nwpsc/) and ties were strengthened with that group through the meeting and subsequent workgroup activities. (See Chapter VII Moderate Risk Waste Management for a summary of 2001 MRW collection programs.)
Partnering for the Environment through Education and Information Sharing
The Closed-Loop Scoop Newsletter The Solid Waste and Financial Assistance Program (SW&FAP) combined its four regional newsletters into one statewide quarterly newsletter with the debut of The Closed-LoopScoop in January 2001. The newsletter provides a mechanism to relay important information to public works departments, health districts, private recyclers and other clients and stakeholders. All SW&FAP staff and local government personnel are encouraged to contribute articles to help readers stay current on legislative matters, share program successes and ideas, and announce upcoming meetings. The newsletter is sent to over 800 individuals and organizations across the state; those parties with e-mail addresses receive their copy electronically. The Closed-Loop Scoop can also be found on the Ecology SW&FAP Homepage, http://www.ecy.wa.gov/programs/swfa/index.html. Terry Husseman Sustainability in Public Schools Awards Program The Terry Husseman Outstanding Waste Reduction and Recycling in Public Schools Awards Program was on hiatus this past year. During this time, SW&FAP staff reviewed and revised the program so that it focuses more on Sustainability. Ecology realizes that one of the most critical issues that will face the children we teach will be the quality of the world they inherit. A school that both teaches and practices environmentally sustainable behavior will offer children and the local community important role models. In practice, however, other education priorities have made it very difficult for teachers and schools to take on these responsibilities. Sometimes there may only be one teacher willing to take on the extra tasks and responsibilities. Without further support these teachers often find the process a losing battle. Teaching sustainability principles need not be a separate course. In fact, it might work better if they were treated as overriding principles incorporated into all studies. Over the next several years, SW&FAP intends to reward schools that embrace these principles through the “Terry Husseman Sustainability in Public School Awards Program.” This award program replaces the 14-year old Terry Husseman Outstanding Waste Reduction and Recycling in Public Schools Award program.
Solid Waste in Washington State --Eleventh Annual Status Report 53
Chapter III
A sustainable school program would have elements including, but not limited to, the following five areas:
1. Resource/Energy Conservation 2. Biological Diversity 3. Waste & Toxicity Reduction 4. Social Harmony 5. Health & Wellness
There are three categories of awards:
1. Seed Award This award is to encourage schools to take steps necessary to embrace the five areas of sustainability, and to assist schools with costs involved in initial start-up of basic sustainability programs or improvements of programs or projects that move them closer to sustainability.
2. Sustainable School Award This award recognizes schools that are implementing elements of the five areas.
3. Creative Environmental Curriculum Award This award recognizes curriculum that:
• Introduces students, teachers, staff, and administrators to the concepts of sustainability including its social, economic, and environmental relevance; and/or
• Strives to instill sense of environmental stewardship in the students through curriculum.
SW&FAP also has staff across the state prepared to assist schools with their sustainability principles and waste reduction and recycling programs. Staff can help schools perform waste audits and find the resources to develop school or district-wide sustainability programs. The award cycle begins with the start of the 2002-2003 school year. Announcements will be sent in October and December 2002, applications will be due in February 2003, the judging and selection will occur in March, with notification of the chosen applicants April and an award ceremony held May 2003. (For more information on the Sustainability in Public Schools Awards program, Contact Michelle Payne at(360) 407-6129 or email: [email protected] or check for updates on the Awards web site http://www.ecy.wa.gov/programs/swfa /terryhusseman.html) Recycling Information Line The Solid Waste & Financial Assistance Program (SW&FAP) operates 1-800-RECYCLE to help citizens find ways to reduce waste and recycle. In 2001, over 10,000 callers were assisted. While many callers simply want to know where and how to recycle common items (those taken by recycling centers and local curbside programs), others have
54 Solid Waste in Washington State --Eleventh Annual Status Report

Partnering for the Environment
questions of a more complex nature. The information line can suggest alternatives to hazardous household products, and direct callers to locations for the safe disposal of household hazardous waste. Information on used oil recycling and used oil haulers is provided, along with information on locations for the recycling of construction, demolition and landclearing debris. Referrals are made to companies that offer commercial pickup for business recycling. Targeted waste streams, such as electronic scrap, continue to offer the information line increased opportunities. While many local governments operate information lines within their own areas, the statewide information line continues to serve as a first contact for many. Ecology’s statewide information line can also provide callers with information on specialized recycling opportunities beyond their own city or county. A database is maintained by periodically contacting all recyclers to determine commodities accepted, fees if any, and hours. The database has recently been expanded to include recyclable electronic items, and also lists vendors of products made from recycled construction waste. Links to local government and recycling company Web sites are now listed. Basic household recycling information from the database can be found at the information line’s own Web site: http://1800recycle.wa.gov. Other specific databases on the SW&FAP homepage provide information on using recycled content building materials and sustainable building materials (http://www.ecy.wa.gov/programs/swfa/cdl/index.html) and information about solid waste facilities and disposal data http://www.ecy.wa.gov/programs/swfa/solidwastedata/ . The 1-800-RECYCLE Web site also includes a Web page developed for kids of all ages. “Fun with Recycling” has neat links to other environmental education sites and fun environmental games to play. It also has interesting trivia facts on different recyclable materials. Check it out at http://1800recycle.wa.gov/kids/index.htm. Washington State Recycling Association (WSRA) WSRA is a trade association whose goal is to provide leadership and education to foster the expansion, diversity, and economic vitality of recycling as part of integrated resource management. SW&FAP is a GOLD sponsoring member and supports WSRA through representation on its board of directors. Benefits and services of this organization include networking opportunities, a bimonthly newsletter, annual conference and trade show, and workshops. The education committee developed a series of four fact sheets that connect recycling to current issues such as the economy, energy, fuel and water. These “Hot Topics” fact sheets were developed as tools for recycling educators and can be viewed at http://www.wsra.net/b4_hottopics.asp. Operator Certification Program
Solid Waste in Washington State --Eleventh Annual Status Report 55
In Washington state, solid waste landfills and incinerators are required to have certified operators on site at all times, per chapter 70.95D RCW, Solid Waste Incinerator and Landfill Operators. The Landfill and Incinerator Operator Certification program was created by the legislature in 1989, through the “Waste Not Washington Act”. The

Chapter III
implementation rule was adopted in June 1991, chapter 173-300 WAC, Certification of Operators of Solid Waste Incinerators and Landfill Facilities. The requirements for having certified operators on site at all times apply to the following types of facilities: municipal solid waste landfills; inert and demolition landfills; limited and special purpose landfills; and all incinerators that burn solid waste. The law also requires that any person inspecting an applicable solid waste facility must be certified. Course offerings began in 1992, with those taking the course and passing the test receiving certifications of competency for 3 years. Yearly training courses were held on landfill and incinerator operations until 1995. Direct funding for implementing this program in SW&FAP is not available. Because of reduced staffing, a home study course was instituted. This not only reduced the level of effort for SW&FAP, it provided a cost savings to those who took the course. The certification training however no longer focuses on Washington specific issues for both operators and inspectors. SW&FAP is currently evaluating the operator certification program to determine if there is a better way to implement the program. Over 1,000 persons have taken one or both courses since the programs inception. To date, a total of 547 people have been certified for landfill operations and 380 have been certified for incinerator operations. Certification renewals began in 1994. In 2002, 69 certificates were up for renewal (50 landfill and 19 incinerator). Notices were sent out in September. Re-certification requests must be submitted to Ecology by years’ end. There continues to be a significant decrease in the number of persons taking the landfill course since 1995. The reduction in the number of certified landfill operators can be attributed to a reduction in the number of landfills since the program began. The number of persons taking the incinerator course has stayed fairly stable.
56 Solid Waste in Washington State --Eleventh Annual Status Report

Partnering for the Environment
Ecology Walks Its Talk In 1999, Ecology formed an internal Waste Reduction and Recycling Committee. SW&FAP staff are actively involved with this committee. The mission of the committee is “To communicate goals and educate staff and managers so that all Ecology building tenants adopt resource conservation and recycling practices aligned with sustainability principles—especially as they relate to the materials we use, to the waste we generate, and to reducing our environmental impacts at work.” To accomplish this mission the committee developed a work plan called the Model Waste Reduction and Recycling Plan. This document was developed as a tool to help guide our sustainability efforts, especially as they pertain to Ecology’s waste reduction and recycling (WRR) practices. It includes a brief description of previous waste reduction and recycling efforts at Ecology. The committee’s focus over the past year was the development of an Environmentally Preferable Purchasing Policy (Ecology Policy 8-19) and guidelines. The purpose of the policy is to eliminate the waste of resources by reusing goods and to increase the percentage of purchases of environmentally preferable products. It says that Ecology will consider the environmentally preferable option when it meets performance and price needs, gives the purchasing office authority to direct purchase decisions toward reuse or the environmentally preferable option, allows the purchasing office to reject purchase requests that do not follow the policy, and enables Ecology to use purchase authority to buy products with more environmental attributes than available through the Department of General Administration (GA). Committee members have also been working with GA to make environmentally preferable products available and easier to identify. One major accomplishment this year was our analysis of our building recycling programs. By looking at the costs, we were able to find an alternate vendor who saves us nearly $10,000 per year.
Solid Waste in Washington State --Eleventh Annual Status Report 57


Statewide Litter Prevention and Cleanup Programs
Chapter IV Statewide Litter Prevention and Cleanup Programs Chapter 70.93 RCW, the Waste Reduction Recycling and Model Litter Control Act, places Ecology in the leadership role of managing statewide litter programs. Work during 2001 and throughout 2002 focused on planning and implementing the first statewide litter prevention campaign in over ten years while maintaining significant levels of litter and illegal dump cleanup. Core elements of statewide litter program are:
• Administering allocations from the Litter Account; • Strengthening partnerships with other state agencies and local government; • Facilitating communication and coordination of litter control and prevention
activities; • Administering the Community Litter Cleanup Program (CLCP); • Implementing a litter prevention campaign; and, • Deploying the Ecology Youth Corps (EYC).
State Launches Litter Prevention Campaign The most significant work in 2001 involved planning a comprehensive litter prevention strategy to change the behavior of litterers. Based on research conducted in 1999, the campaign focuses on roadside litter deposited through the following behaviors: deliberate tossing of cigarette butts, beverage containers, and other packaging; uncovered and unsecured loads; and failure to clean out the beds of pickup trucks. Based on focus group research the campaign messages have an enforcement-theme with information about littering fines and penalties. The “Litter and it will hurt” campaign is a social marketing campaign aimed at reducing litter on Washington roadways. The campaign uses multiple strategies over a three-year period to first raise awareness, then alter beliefs, and ultimately change behaviors. Key elements include a media campaign (television, print, and radio); operation of a litter hotline; a roadway and retail signage program; a website; ongoing public relations; distribution of litterbags and campaign materials; and an enforcement plan. The Solid Waste & Financial Assistance Program (SW&FAP) launched the “Litter and it will hurt” campaign with a series of news conferences in April 2002. News conferences held in Seattle, Spokane, Richland and Vancouver, generated significant media attention to the litter problem and the campaign. The objectives of this first year of the campaign were to raise awareness of the fines associated with littering and about the toll-free litter hotline. The impact of the campaign will be measured when SW&FAP repeats the litter survey in 2004, to measure the quantity and types of litter in Washington. However, the campaign was designed to include interim measures to track our progress.
Solid Waste in Washington State --Eleventh Annual Status Report 59

Chapter IV
Data suggest that the State made good progress towards achieving the first year objectives of raising awareness. Telephone survey results provided to Ecology by Belo Marketing Solutions and Survey U.S.A. are presented in the table below. More specific information about the main campaign strategies follows.
Comparison of Benchmark and Tracking for the Litter Campaign April – September 2002
51% of respondents have seen or heard the slogan “Litter and it will hurt.” Up from 14% in the benchmark study.
70% of respondents remember seeing road signs, posters or a slogan about litter. Up from 57% in the benchmark study.
32% of respondents remember seeing or hearing advertising, news or public service messages about littering. Up from 23% in the benchmark study.
28% of respondents are aware of a toll free number to report littering. Up from 20% in the benchmark.
17% believe that they are not at all likely to get caught and fined. This is down from 27% who believe they are not at all likely to get caught in the benchmark study.
42% of respondents would say that fines for littering are very severe or severe. Up from 31% in the benchmark.
Media: Humorous television and radio commercials that focus on the fines for littering were broadcast statewide over a 16-week period. They feature Torquemada, the Grand Inquisitor from the 15th century, arguing for stiffer punishments for litterers. Several sponsors produced their own commercials with the campaign litter message, adding depth and breadth to the media buy. On television, 2,843 spots were aired, not including “free time,” creating an estimated 53 million gross impressions. Litter Hotline: In conjunction with the campaign launch, SW&FAP started a litter hotline. By dialing 1-866-LITTER-1, people can report the license plate number of vehicles they see litter coming from. The license plate is cross-referenced with the registered owner of the vehicle, who will get a stern letter from Washington State Patrol. The hotline is available 7 days a week, 24 hours a day. Calls have steadily increased since April 2002, as presented in the Figure 4.1.
60 Solid Waste in Washington State --Eleventh Annual Status Report

Statewide Litter Prevention and Cleanup Programs
Figure 4.1 Litter Hotline Calls
Litter Hotline Calls
55
359
604
9411129
1027888
0200400600800
10001200
April
MayJu
ne July
Augus
t
Septem
ber
Octobe
r
5,003 Calls Total
# of
Cal
ls
Signage: The Washington State Department of Transportation posted 136 new “Litter and it will hurt” road signs statewide. The signs feature the campaign slogan and the litter hotline phone number. Sign specifications were also provided to local governments, some of whom opted to post the signs on county roads and local streets.
Website: A website with information about statewide litter programs and the “Litter and it will hurt campaign” was launched in conjunction with the campaign. It contains information about litter laws, fines, publications, various litter pickup program, and statistics, with separate pages dedicated to information about the campaign. In September 2002, over 10,312 people visited the new website. The address is: www.ecy.wa.gov/programs/swfa/litter Enforcement: Washington State Patrol (WSP) was Ecology’s primary partner on enforcement issues. In addition to helping manage the litter hotline, WSP helped the campaign by reinforcing the campaign message through issuance of tickets, and written and verbal warnings. At the time of this writing, statistics from 2002 were not yet available, but in 2001, WSP issued 4,351 litter citations.
Solid Waste in Washington State --Eleventh Annual Status Report 61
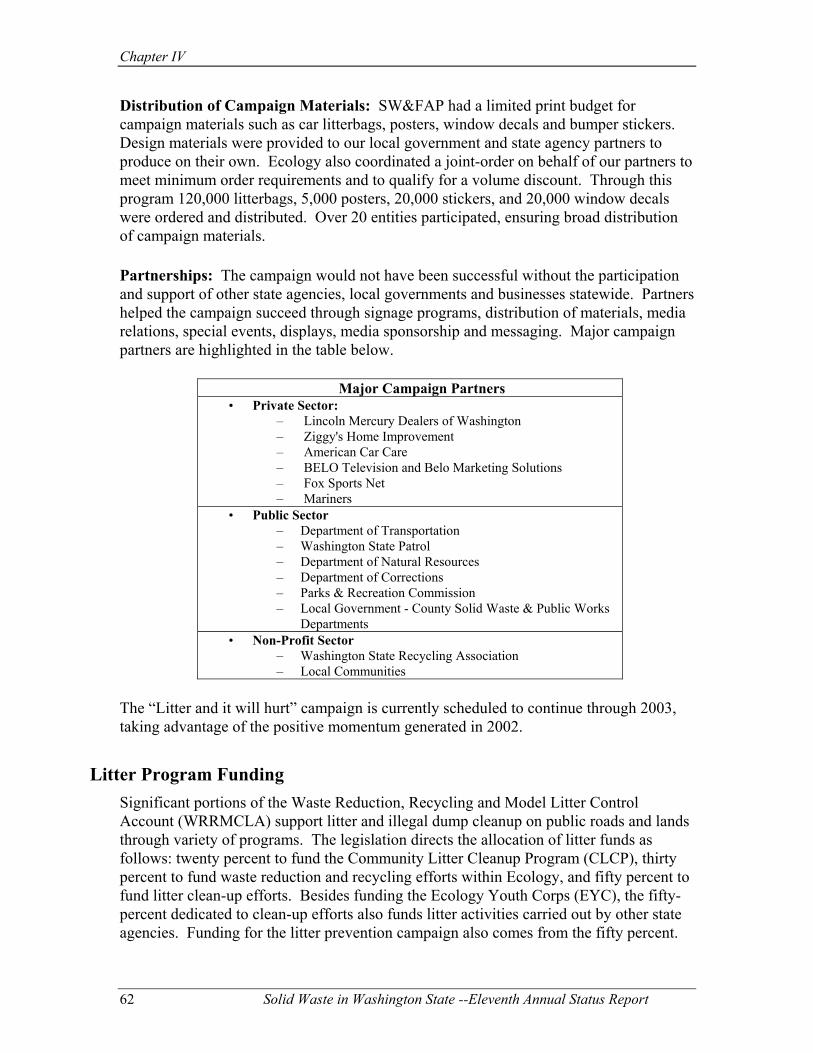
Chapter IV
Distribution of Campaign Materials: SW&FAP had a limited print budget for campaign materials such as car litterbags, posters, window decals and bumper stickers. Design materials were provided to our local government and state agency partners to produce on their own. Ecology also coordinated a joint-order on behalf of our partners to meet minimum order requirements and to qualify for a volume discount. Through this program 120,000 litterbags, 5,000 posters, 20,000 stickers, and 20,000 window decals were ordered and distributed. Over 20 entities participated, ensuring broad distribution of campaign materials. Partnerships: The campaign would not have been successful without the participation and support of other state agencies, local governments and businesses statewide. Partners helped the campaign succeed through signage programs, distribution of materials, media relations, special events, displays, media sponsorship and messaging. Major campaign partners are highlighted in the table below.
Major Campaign Partners • Private Sector:
– Lincoln Mercury Dealers of Washington – Ziggy's Home Improvement – American Car Care – BELO Television and Belo Marketing Solutions – Fox Sports Net – Mariners
• Public Sector – Department of Transportation – Washington State Patrol – Department of Natural Resources – Department of Corrections – Parks & Recreation Commission – Local Government - County Solid Waste & Public Works
Departments • Non-Profit Sector
– Washington State Recycling Association – Local Communities
The “Litter and it will hurt” campaign is currently scheduled to continue through 2003, taking advantage of the positive momentum generated in 2002.
Litter Program Funding Significant portions of the Waste Reduction, Recycling and Model Litter Control Account (WRRMCLA) support litter and illegal dump cleanup on public roads and lands through variety of programs. The legislation directs the allocation of litter funds as follows: twenty percent to fund the Community Litter Cleanup Program (CLCP), thirty percent to fund waste reduction and recycling efforts within Ecology, and fifty percent to fund litter clean-up efforts. Besides funding the Ecology Youth Corps (EYC), the fifty- percent dedicated to clean-up efforts also funds litter activities carried out by other state agencies. Funding for the litter prevention campaign also comes from the fifty percent.
62 Solid Waste in Washington State --Eleventh Annual Status Report

Statewide Litter Prevention and Cleanup Programs
This biennium (July 2001 – June 2003), the appropriation from the WRRMLCA was
12.43 million divided as directed by the legislation into 3 main categories:
Ac vities
OTAL $12.43 million
percent dedicated to clean-up efforts and prevention was broken down as follows
TOTAL $6.03 million
ter ram and an additional $500,000 went to the Department of Natural
Resources.
$
Community Litter Cleanup Program 20% $2.86 million Waste Reduction & Recycling ti 30% $3.54 million
Litter Cleanup & Prevention 50% $6.03 million T
The fifty :
Other state agencies $1.03 million Prevention campaign $0.70 million Administration & coordination $2.00 million
Operation of Ecology Youth Corps $2.30 million
During the 2002 session, the Legislature directed Ecology to disburse supplemental funding from the WRRLCA. An additional $250,000 went to the Community LitCleanup Prog
Litt
is
cess,
rrent
ows the funding provided through teragency agreements for each biennium.
Int d Other State Agency for Litter Activities
y 1, 1999– June 30, 2FY00/ FY02/
er Cleanup by Other State Agencies The state agency litter workgroup continues to function, meeting several times a year toreview activities, improve coordination, and discuss future funding. The workgroupcomprised of representatives from Departments of Corrections, Natural Resources, Transportation, and the Parks and Recreation Commission. Using a consensus prothe workgroup negotiated $1.097 million in interagency agreements to fund litter activities carried out by the state agencies during the '99 - '01 biennium, and $1.030 forthe '01-'03 biennium. Supplemental funding appropriated in 2002 brought the cubiennium total to $1.53 million. Table 4.1 shin
Table 4.1 eragency Agreements between Ecology an
Jul 003 Agency 01 03
Dept. of Corrections $492,000 $466,000 Dept. of Natural Resources $497,000 $468,000 Dept. of Natural Resources $(supplemental)
$0 500,000
Dept. of Transportation $78,000 $70,000 Parks & Recreation $30,000 $26,000 TOTAL $1,097,000 $1,530,000
Solid Waste in Washington State --Eleventh Annual Status Report 63

Chapter IV
Department of Corrections The Department of Corrections (DOC) receives funding through Ecology to run community based correctional litter crews. These crews pickup litter on state roads, on state lands, and in local communities, providing valuable cleanup service. The '01-'03 interagency agreement between Ecology and DOC provided funding ($452,000) for year-round correctional crews in Spokane, Ellensburg, Wenatchee, an administrative position in Seattle, and half-year crews in Pasco and Walla Walla. The remaining $14,000 was used to support litter campaign activities, such as displaying campaign posters in all DOC offices, putting campaign window decals on DOC vehicles, and distributing car litterbags at DOC offices. Table 4.2 summarizes activity of DOC crews.
Table 4.2 Department of Corrections Litter Removal Activity
Last Biennium and Fiscal Year 2002 FY00 FY01 FY02 Hours of Work (supervisor and offender) 50,719 54,296 44,086 Pounds of Litter & Illegally Dumped Materials Removed 621,062 833,549 682,029 # of illegal dump sites cleaned 345 553 406 Miles of road cleaned 6,185 5,537 2,969 Acres cleaned 2,203 3,088 1,463 Department of Natural Resources The Department of Natural Resources Camps Program, in partnership with Department of Corrections, puts offender crews to work on state lands. As illustrated by the data in Table 4.3, this program continues to have a tremendous impact on the cleanup of litter and illegally dumped materials on state-owned forests. The '01-'03 interagency agreement between Ecology and DNR provides funding ($468,000) for part time crews at the following camps: Naselle, Larch, Cedar Creek, Mission Creek (program ended spring 2002), Monroe, Olympic, Airway Heights and the Washington Correction Center for Women (program began summer 2002). In March 2002, Ecology received direction from the Legislature to pass an additional $500,000 of supplemental budget dollars to DNR, bringing the biennial total to $968,000. Funding for cleanup crews was expanded to include contracted and volunteer crew activities as well as some enforcement activities.
Table 4.3 Department of Natural Resources Litter Removal Activity
Last Biennium and Fiscal Year 2002 FY00 FY01 FY02 Hours of Work (supervisor and offender) 22,114 33,493 41,992 Pounds of Litter Removed 104,603 143,189 168,539 Pounds of Illegally Dumped Materials Removed 192,116 399,087 552,251 # of illegal dump sites cleaned 174 535 516 Miles of road cleaned 1,282 3,269 2,554
cres cleaned 161 122 107 A
64 Solid Waste in Washington State --Eleventh Annual Status Report

Statewide Litter Prevention and Cleanup Programs
Department of Transportation The Department of Transportation (DOT) is responsible for picking up litter along state roads including the bags of litter collected by Ecology Youth Corps, Department of Corrections, and Adopt-a-Highway groups. The '01-'03 interagency agreement between Ecology and Transportation provides funding ($70,000) to offset the costs of disposal. Table 4.4 summarizes the litter work accomplished by Transportation crews.
Table 4.4 Department of Transportation Litter Removal Activity
Last Biennium and Fiscal Year 2002
DOT Region Amount of Litter Disposed (Cubic Yards)
Total Pickup Costs (Labor/Equipment)*
FY00 FY01 FY02 FY00 FY01 FY02 Northwest 4,017 5,281 5,983 $261,921 $417,879 $360,032 North Central 1,084 1,013 1,107 $76,660 $65,134 $80,197 Olympic 642 1,627 1,412 $189,859 $256,784 $242,169 Southwest 751 4,456 1,106 $251,613 $271,301 $286,228 South Central 2,163 4,994 2,715 $182,705 $223,486 $243,720 Eastern 1,692 2,367 1,434 $194,939 $237,035 $270,244 Total 10,349 19,738 13,757 $1,157,697 $1,471,619 $1,482,590 *Does not include disposal costs
Parks and Recreation Commission The Parks and Recreation Commission (Parks) traditionally uses litter funds on waste reduction and recycling efforts as well as litter control. Most litter collection is done by park rangers, park users, and volunteers. Parks used the $30,000 provided through the '99-'01 interagency agreement to purchase recycling equipment and signage at two state parks and to buy litter cleanup supplies. For the '01-'03 agreement, Ecology has set aside $26,000 to fund activities including disposal of illegally dumped materials, continued recycling programs in parks, distribution of campaign litterbags and support of a pet waste disposal program.
Ecology Youth Corps Fiscal year 2002 marked the 27th year of operation for the Ecology Youth Corps (EYC). Under chapter 70.93 RCW, the Waste Reduction, Recycling, and Model Litter Control Act, the EYC operates as a “…litter patrol program to employ youth from the state to remove litter from places and areas that are most visible to the public…” EYC operates two types of crews, median crews and youth crews. Median crews are composed of young adults 18 years and older who clean complex and challenging areas such as highway median strips, interchanges, and other high traffic areas. Some median crews begin operation as early as spring and run through the end of fall, while others work solely in the spring or fall.
Solid Waste in Washington State --Eleventh Annual Status Report 65

Chapter IV
The EYC Youth crews consist of 14–17 year old youth who clean shoulder areas and interchanges of major state and interstate highways as well as city and county roads, public access areas, school grounds and other public areas. Summer Youth crew members work one four-week session at the beginning of summer, with a complete turnover of crews occurring mid-summer. Weekend crews work weekends in the Eastern region at various times during the year. Crews were based in the following counties: NWRO: King, Kitsap, Skagit, Snohomish, and Whatcom. SWRO: Clark, Grays Harbor, Lewis, Mason, Pacific, Pierce, Thurston. ERO: Adams, Asotin, Grant, Ferry, Franklin, Garfield, Spokane, Stevens, and Whitman. CRO: Benton, Chelan, Kittitas, Klickitat, Okanogan, and Yakima. This fiscal year crews were responsible for picking up a grand total of 65,543 bags of litter over a total of 4,571 road miles and 1,280 acres. This is the equivalent of 492 tons of litter, or 131,086 cubic feet. Of this total amount of litter 9,641 bags were recycled, representing approximately 72 tons. The Ecology Youth Corps also ensures that youth learn about the environment. Crews learn about waste reduction, litter abatement, recycling, composting, and other environmental issues such as global warming, water quality, salmon recovery and the principles of sustainability.
Community Litter Cleanup Program The Community Litter Cleanup Program (CLCP) was developed and implemented in 1998 with the goal of providing help to local government with the growing problems of litter and illegal dumps. Now in its 4th cycle, the CLCP continues to be a key element of statewide litter cleanup programs. CLCP Program Cycles 1st Cycle April 1998 - December 1998 2nd Cycle January – December 1999 3rd Cycle January 2000 – June 2001 4th Cycle July 2001 – June 2003
During the fourth cycle, 41 out of the 41 eligible jurisdictions participated.1 In the fourth cycle, $2.73 million was dedicated to the program, with each recipient eligible to receive approximately $66,600. In the spring of 2002, the Legislature directed another $250,000 to the CLCP program, bringing the biennial total to $2.98 million. Not all eligible jurisdictions applied for the supplemental funding. Table 4.5 below highlights the work accomplished during the first half of the fourth cycle. 1 Solid waste planning jurisdictions are eligible to participate in the program. This includes the 39 counties plus the cities of Seattle and Everett. .
66 Solid Waste in Washington State --Eleventh Annual Status Report
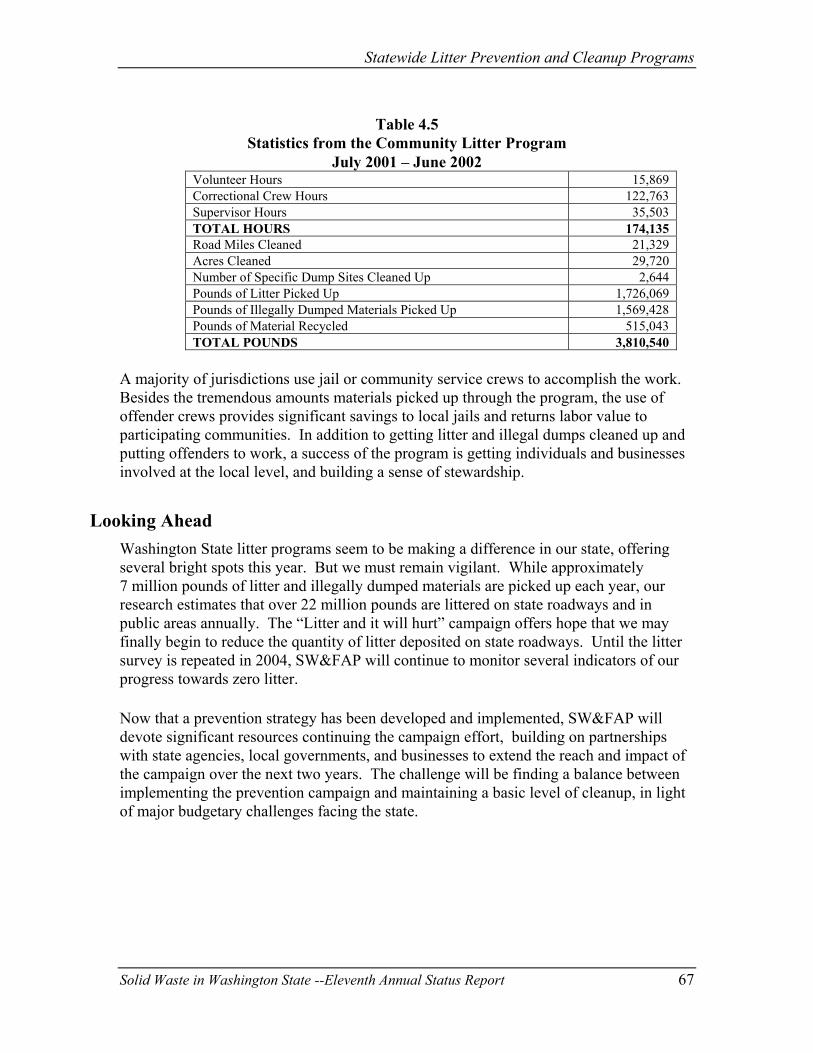
Statewide Litter Prevention and Cleanup Programs
Table 4.5
Statistics from the Community Litter Program July 2001 – June 2002
Volunteer Hours 15,869 Correctional Crew Hours 122,763 Supervisor Hours 35,503 TOTAL HOURS 174,135 Road Miles Cleaned 21,329 Acres Cleaned 29,720 Number of Specific Dump Sites Cleaned Up 2,644 Pounds of Litter Picked Up 1,726,069 Pounds of Illegally Dumped Materials Picked Up 1,569,428 Pounds of Material Recycled 515,043 TOTAL POUNDS 3,810,540
A majority of jurisdictions use jail or community service crews to accomplish the work. Besides the tremendous amounts materials picked up through the program, the use of offender crews provides significant savings to local jails and returns labor value to participating communities. In addition to getting litter and illegal dumps cleaned up and putting offenders to work, a success of the program is getting individuals and businesses involved at the local level, and building a sense of stewardship.
Looking Ahead Washington State litter programs seem to be making a difference in our state, offering several bright spots this year. But we must remain vigilant. While approximately 7 million pounds of litter and illegally dumped materials are picked up each year, our research estimates that over 22 million pounds are littered on state roadways and in public areas annually. The “Litter and it will hurt” campaign offers hope that we may finally begin to reduce the quantity of litter deposited on state roadways. Until the litter survey is repeated in 2004, SW&FAP will continue to monitor several indicators of our progress towards zero litter. Now that a prevention strategy has been developed and implemented, SW&FAP will devote significant resources continuing the campaign effort, building on partnerships with state agencies, local governments, and businesses to extend the reach and impact of the campaign over the next two years. The challenge will be finding a balance between implementing the prevention campaign and maintaining a basic level of cleanup, in light of major budgetary challenges facing the state.
Solid Waste in Washington State --Eleventh Annual Status Report 67


The 2001 Recycling Survey for Washington
Chapter V The 2001 Recycling Survey for W
ashington
1989, the Legislature, in amending the Solid Waste Management Act (chapter 70.95 RCW)
ing 1,
ercial
espite all the efforts made by citizens, was not
oal to
,
aste
me
Recycling Rate 1986 to 2001
Inset a state recycling goal of 50%, to be achieved by 1995. They also stated that recycling should be made at least as affordable and convenient to citizens as garbage disposal.
In response, local governments began putting in place various forms of recycling rangfrom drop boxes to curbside collection of a variety of recyclable materials. In the year 200over 150 cities and counties offered curbside collection of recyclable materials such as glass, paper, and metals while about two-thirds of those cities and counties offered curbside collection of yard waste. The availability of recycling collection programs in the commsector (both publicly and privately operated) is also increasing, and the amount of materials collected on these programs far outweighs what is collected in the residential sector.
Table 5.1 Dgovernment, and industry, the 50% goal attained by 1995 (see Table 5.1), and in 2002, theLegislature amended the state goal to be achieved by 2007. They also set a state gestablish programs to eliminate yard waste in landfills by 2012. With these goals in mind, aswell as the “Beyond Waste” vision of zero wastewe must reaffirm our commitment to an accurate measure of our performance in the area of recycling and waste reduction. The Solid W& Financial Assistance Program (SW&FAP) continues to operate the Annual Recycling Survey, and is concurrently preparing for sochanges in the way the survey is conducted in years to come. These changes will take into consideration the state solid waste plan of “Beyond Waste” and the goals laid out in thatplan.
1986 15% 1988 28% 1989 27% 1990 34% 1991 33% 1992 35% 1993 38% 1994 38% 1995 39% 1996 38% 1997 33% 1998 35% 1999 33% 2000 35% 2001 37%
Recycling Rates 87, Ecology has conducted a survey to measure the statewide ormation is provided by local governments, haulers, recyclers, brokers
hat are
Each year since 19recycling rate. Infand other handlers of materials from the recyclable portion2 of the waste stream tcollected for recycling. 2 The recyclable portion of the waste stream is municipal solid waste as defined by the Environmental Protection Agency in the Characterization of Municipal Solid Waste in The United States: 1996 Update. This includes durable goods, nondurable goods,
, nd
Solid Waste in Washington State --Eleventh Annual Status Report 69
containers and packaging, food wastes, and yard trimmings. It does not include industrial waste, inert debris, asbestos, biosolidspetroleum contaminated soils, or construction, demolition, and landclearing debris disposed of at municipal solid waste landfills aincinerators.
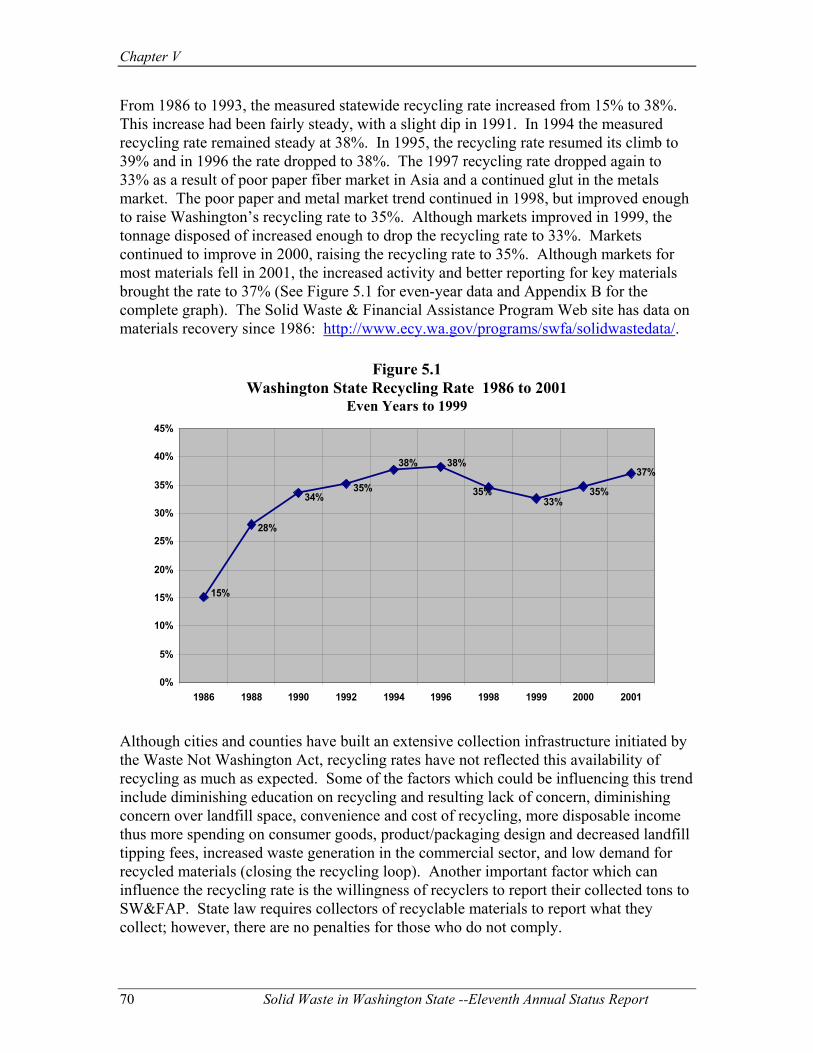
Chapter V
From 1986 to 1993, the measured statewide recycling rate increased from 15% to 38%.
o
ugh
for
ta on
This increase had been fairly steady, with a slight dip in 1991. In 1994 the measured recycling rate remained steady at 38%. In 1995, the recycling rate resumed its climb t39% and in 1996 the rate dropped to 38%. The 1997 recycling rate dropped again to 33% as a result of poor paper fiber market in Asia and a continued glut in the metals market. The poor paper and metal market trend continued in 1998, but improved enoto raise Washington’s recycling rate to 35%. Although markets improved in 1999, the tonnage disposed of increased enough to drop the recycling rate to 33%. Markets continued to improve in 2000, raising the recycling rate to 35%. Although marketsmost materials fell in 2001, the increased activity and better reporting for key materials brought the rate to 37% (See Figure 5.1 for even-year data and Appendix B for the complete graph). The Solid Waste & Financial Assistance Program Web site has damaterials recovery since 1986: http://www.ecy.wa.gov/programs/swfa/solidwastedata/.
Figure 5.1
Washington State Recycling Rate 1986 to 2001 Even Years to 1999
37%
35%33%
35%
38%38%
35%
15%
28%
34%
0%
5%
10%
15%
20%
25%
30%
35%
40%
45%
1986 1988 1990 1992 1994 1996 1998 1999 2000 2001
Although cities and counties have built an extensive collection infrastructure initiated by
end
s to
collect; however, there are no penalties for those who do not comply.
the Waste Not Washington Act, recycling rates have not reflected this availability of recycling as much as expected. Some of the factors which could be influencing this trinclude diminishing education on recycling and resulting lack of concern, diminishing concern over landfill space, convenience and cost of recycling, more disposable incomethus more spending on consumer goods, product/packaging design and decreased landfilltipping fees, increased waste generation in the commercial sector, and low demand for recycled materials (closing the recycling loop). Another important factor which can influence the recycling rate is the willingness of recyclers to report their collected tonSW&FAP. State law requires collectors of recyclable materials to report what they
70 Solid Waste in Washington State --Eleventh Annual Status Report

The 2001 Recycling Survey for Washington
As of this writing, 82.4% of the state’s population now has access to curbside recyclservices, which are intended to be as convenient as disposal. Most of th
ing e people who do
t have curbside services do have access to drop-box recycling. The state’s population s
own opportunities for significant increases in customer base and fficiency in their refuse and recycling collection. Education efforts in the Olympia and
rvice,
.
arbage prices to dispose of this material. Cities can normally afford to offer yard waste
ttributes drop in the tons recovered on their curbside programs in 2000 and 2001 partly to the
nt
ures reported by recyclers who provide service to the nonresidential ctors, these programs seem to be highly successful in diverting large volumes of
200enges in obtaining all of the information needed to prepare a
ndated by the Legislature, SW&FAP AP
nois growing, with about half a million new people since 1995. SW&FAP believes that thigroup may not participate as much in recycling programs since they were not exposed to the waste reduction and recycling outreach programs run by Ecology and the counties in the early 1990s. Recent studies and changes in Olympia, Tacoma, Seattle, and Spokane collection programs have sheTacoma curbside programs, which went along with recent changes in collection sebrought significant increases in participation rates for curbside as well as drop-off collection centers. The apparent affect of these educational efforts tapered off within a year to show much less significant increases in growth for 2000, and a drop in per capita recovery rates for 2001 (and in some cases an actual decrease in tonnage collected) Yard waste collection, however, increased from 2000 to 2001 in these cities. This could be attributed to the low cost to participate in curbside yard waste as opposed to payinggcollection at lower prices than curbside collection of other recyclables, providing an economic incentive which is helping these programs to achieve great success. Frequency of collection (weekly, biweekly) has also been shown to be an important determinate of the amount collected on curbside programs. The City of Seattle aachange in collection from weekly to biweekly. As more cities implement less frequecollection on curbside as an efficiency measure, without the corresponding education needed to offset the decline in participation, we could see a decline in tonnage collectedon these programs. Commercial recycling (or nonresidential sector recycling) increased by 16% in 2001.
ased on tonnage figBsematerials away from disposal with minimal government regulation or oversight. Businesses are encouraged by the economic incentive to reduce their waste output through recycling.
1 Recycling Survey Process and Results There are many challcomplete and accurate recycling survey. As is macarries this out every year, reporting the results to appropriate stakeholders. SW&Fbelieves the results are fairly reliable to most counties based on review of draft numberssent to local governments, and comparisons to waste characterization, disposal data, andcommodity end-user information.
Solid Waste in Washington State --Eleventh Annual Status Report 71
Chapter V
Recycling survey forms are sent to recycling firms, haulers, and local governments to
btain information about types and quantities of recyclable materials collected. t
ures for each material in the 1998-2001 recycling surveys. ee Tables 5.3 and 5.4 for a comparison of generation, materials recovery, composting,
oHowever, since there is no penalty for not returning the information, some firms do norespond. Other firms respond with estimates of the amount and origin of the materials, which can call into question the accuracy of the survey. These factors make it very difficult to compile good recycling information for specific counties. The difficulties also create the need for intensive cross-checking of the data, which is done through aprocess of communication with the end-users of recyclable materials and local governments to develop aggregate figures for each commodity, which are compared tothe survey results collected. Table 5.2 provides tonnage figSwaste diversion, and discards of municipal solid waste from 1986 to 2001.
72 Solid Waste in Washington State --Eleventh Annual Status Report

The 2001 Recycling Survey for Washington
Table 5.2 State Tonnage by Commodity: 1998-2001 Washington State Recycling Surveys3
Commodity 1998 1999 2000 2001
Newspaper 200,448 168,832 219,716 176,392Corrugated Paper 344,886 478,074 495,470 491,230High Grade 69,436 61,212 59,976 58,538Mixed Waste Paper 207,225 253,428 273,494 231,302Aluminum Cans 12,716 14,357 17,945 12,540Tin Cans 13,003 12,340 22,632 11,483Ferrous Metals 225,373 241,367 357,220 254,104Nonferrous Metals 55,385 30,956 51,273 41,615White Goods 12,233 28,524 35,427 39,180Computers N/A 9 255 317Refillable Beer Bottles 261 63 0 0Container Glass 113,077 58,517 84,062 81,632PET Bottles 3,031 2,911 5,100 4,661LDPE Plastics 1,342 2,225 4,032 6,603HDPE Containers 3,889 3,253 5,491 4,841Other Recyclable Plastics 1,609 3,971 6,512 4,067Aseptic Packaging N/A N/A 98 69Other Rubber Materials N/A N/A 55 374Vehicle Batteries 7,738 15,142 10,757 16,297Tires 2,106 1,514 12,218 10,306Used Oil 41,162 6,352 8,353 38,288Yard Waste 608,128 525,454 450,761 448,222Food Waste 92,392 72,646 73,895 193,0244
Wood Waste 115,289 142,787 215,211 538,2425
Textiles (Rags, clothing, etc.) 3,979 12,525 15,961 10,127Fluorescent Light Bulbs N/A 167 160 346Gypsum 31,062 29,897 36,692 29,883Photographic Films 0 81 6 87Total Recycled 2,165,770 2,166,608 2,462,772 2,703,772Total Disposal6 4,088,100 4,480,761 4,610,914 4,583,253Total Generated 6,253,870 6,647,369 7,073,686 7,287,025Recycling Rate 35% 33% 35% 37%
3 Detail may not add due to rounding. 4 Increase attributed to a combination of actual increase in food waste collection and increased reporting from recyclers. 5 Increase attributed to a combination of actual increase in wood waste collection and increased reporting from recyclers.
Solid Waste in Washington State --Eleventh Annual Status Report 73
6 The amount of material disposed of represents only the quantity defined “recyclable portion” of the waste stream and excludes industrial, inert, asbestos, biosolids, petroleum contaminated soils, and construction, demolition and landclearing debris disposed of at municipal solid waste landfills and incinerators.

Chapter V
Table 5.3
Generation, Materials Recovery, Composting, Waste Diversion, and Discards of Municipal Solid Waste
(millions of ton) 1986-2001
Millions of tons7 1986 1988 1990 1992 1994 1996 1998 1999 2000 2001 Generation 3.0 5.1 5.6 6.1 6.6 6.5 6.3 6.6 7.1 7.3 Recovery for Recycling 0.5 1.4 1.8 2.0 2.2 2.1 1.6 1.6 2.0 2.3 Recovery for Composting Na Na 0.1 0.2 0.3 0.3 0.6 0.5 0.5 0.4 Recovery for Diversion8 Na Na Na Na Na Na Na 0.2 1.4 1.6 Total Materials Recovery 0.5 1.4 1.9 2.2 2.5 2.5 2.2 2.2 2.5 2.7 Discards After Recovery 2.5 3.7 3.7 3.9 4.1 4.0 4.1 4.5 4.6 4.6
Table 5.4 Generation, Materials Recovery, Composting,
Waste Diversion, and Discards of Municipal Solid Waste (percent of total generation)
1986-2001 Percent of total generation
1986 1988 1990 1992 1994 1996 1998 1999 2000 2001 Generation 100% 100% 100% 100% 100% 100% 100% 100% 100% 100% Recovery for Recycling 15.2% 28.0% 31.9% 32.7% 32.9% 33.0% 24.9% 24.7% 28.4% 31.0% Recovery for Composting Na Na 1.7% 2.6% 4.8% 5.2% 9.7% 7.9% 6.4% 6.2% Recovery for Diversion9 Na Na Na Na Na Na Na 2.9% 16.4% 17.7% Total Materials Recovery 15.2% 28.0% 33.6% 35.3% 37.8% 38.2% 34.6% 32.6% 34.8% 37.1% Discards After Recovery 84.8% 72.0% 66.4% 64.7% 62.2% 61.8% 65.4% 67.4% 65.2% 62.9%
In 2001, SW&FAP piloted a Web-based reporting system, which was encouraged by several survey stakeholders and promised to provide a faster, more efficient way for respondents to enter their tonnage information. SW&FAP was hoping that this service would help get the information faster and allow the finalizing of a recycling rate earlier in the year. Even with the detailed instructions provided on the Web site, there is a possibility for error in entering each survey, which is greatly reduced when there is one person designated for the data entry. Giving reporters the possibility to directly enter the data greatly increased the amount of errors and time required to double-check the data. Less than 5% of reporters used the Internet system, which is far less than expectations. With the piloting of this system, SW&FAP discovered that the majority of survey respondents who would use such a system are the ones who were already highly likely to complete their survey forms correctly, and in whatever form it was required. One of the intentions
7 Detail may not add due to rounding. 8 Not included in Total Materials Recovery or Generation – shown for comparison only. 9 Not included in Total Materials Recovery or Generation shown in table – shown for comparison only. Comparison calculated as follows: Recovery for Diversion/(Recovery for Diversion + Generation).
74 Solid Waste in Washington State --Eleventh Annual Status Report

The 2001 Recycling Survey for Washington
with the on-line data entry form was to encourage the non-reporters or late reporters to comply. It was determined that the system would not meet its original intentions, would ven hinder the accuracy and timeliness of the survey, and therefore it was abandoned.
n-
essful.
data se. This step provides a crucial double check in
aintaining integrity of the data.
Ma
grams ls have made a great impact on the actual tonnage being
iverted from disposal.
s
ices for
of virgin and recycled commodities reflect their actual environmental and societal costs.
e Beginning in January of 2002, for the 2001 reporting year, the survey form along with instructions was available on the Internet to print and complete manually, or to type oline and e-mail to Ecology. This system provided a possibility to access the form by computer, for participants who were interested. The system proved to be very succIt provided the crucial and time-saving computer access to the survey, which was necessary for some respondents. It also allowed SW&FAP staff to check the forms and follow up on errors or calculate conversion (pounds to tons, for example) before the was entered into the off-line databam
rket Trends The slight climb in the recycling rate since 1999’s ten-year low, unfortunately is not anindication that the markets in general are on their way to recovering, and the rate will resume its upward trend of the early to mid-1990s. The actual downturns in collected amounts of the traditional recyclables would instead indicate that the markets are still poor for the Washington area. The fact that the rate increased despite these downturns is an indication that the recycling environment is changing, and the new recycling profor nontraditional materiad The lag in the actual amounts collected for the “traditional” recyclable materials, such asaluminum, glass, and cardboard, would show that economic and environmental policieare not yet in full alignment with regard to recycling. For example, market prboth virgin and recycled materials do not always reflect the full societal and environmental costs associated with obtaining and processing those materials. Distortions such as subsidies can affect the economic competitiveness of recycling. Government policies and regulations can play a significant role in ensuring that the prices
Solid Waste in Washington State --Eleventh Annual Status Report 75
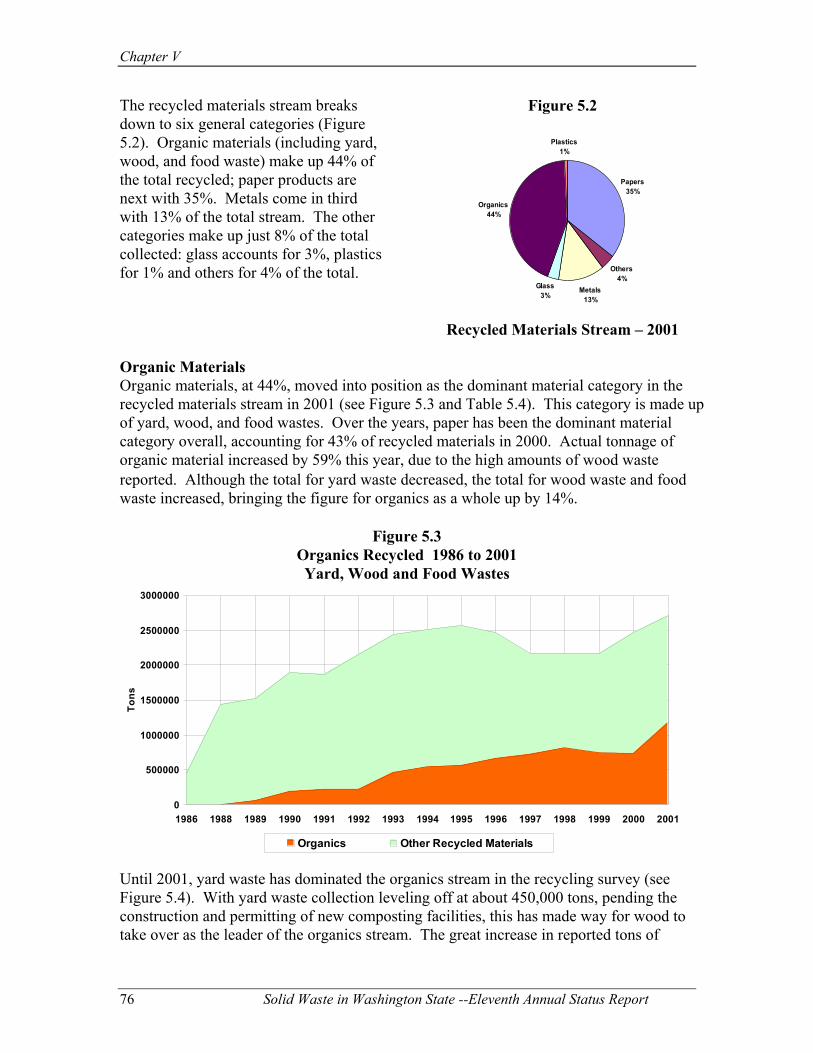
Chapter V
76 Solid Waste in Washington State --Eleventh Annual Status Report
Papers35%
Others4%
Glass3%
Organics44%
Plastics1%
Metals13%
Figure 5.2
Recycled Materials Stream – 2001
The recycled materials stream breaks down to six general categories (Figure 5.2). Organic materials (including yard, wood, and food waste) make up 44% of the total recycled; paper products are next with 35%. Metals come in third with 13% of the total stream. The other categories make up just 8% of the total collected: glass accounts for 3%, plastics for 1% and others for 4% of the total.
Organic Materials Organic materials, at 44%, moved into position as the dominant material category in the recycled materials stream in 2001 (see Figure 5.3 and Table 5.4). This category is made up of yard, wood, and food wastes. Over the years, paper has been the dominant material category overall, accounting for 43% of recycled materials in 2000. Actual tonnage of organic material increased by 59% this year, due to the high amounts of wood waste reported. Although the total for yard waste decreased, the total for wood waste and food waste increased, bringing the figure for organics as a whole up by 14%.
Figure 5.3 Organics Recycled 1986 to 2001 Yard, Wood and Food Wastes
0
500000
1000000
1500000
2000000
2500000
3000000
1986 1988 1989 1990 1991 1992 1993 1994 1995 1996 1997 1998 1999 2000 2001
Tons
Organics Other Recycled Materials
Until 2001, yard waste has dominated the organics stream in the recycling survey (see Figure 5.4). With yard waste collection leveling off at about 450,000 tons, pending the construction and permitting of new composting facilities, this has made way for wood to take over as the leader of the organics stream. The great increase in reported tons of

The 2000 Recycling Survey for Washington
wood collected for recycling is due both to an actual increase in the activity in the area of wood recycling, and to better capturing the data on the high amounts of wood which are traditionally recycled in Washington State. Even though the recycling survey has tracked wood in the past, greater emphasis is now being placed on the importance of including this data, which has resulted in better reporting.
Figure 5.4 Organics Recycling 1989-2001
-
100,000.00
200,000.00
300,000.00
400,000.00
500,000.00
600,000.00
700,000.00
1989 1990 1991 1992 1993 1994 1995 1996 1997 1998 1999 2000 2001
Tons
Yard Waste
Food Waste
Wood Waste
The food waste category, which has rendering of fats and oils as its greatest contributor, has also increased greatly, with an actual increase of over 100,000 tons. There are some additional collection programs which started in 2001; however, most of the increase in food waste collection can be attributed to an increase in reporting of this commodity.
Paper Products For the first time since 1997, the markets for all the paper categories have fallen, due to continued low production at domestic mills and corresponding low demand (see Figure 5.5). The Asian markets, however, have an increasing demand and have kept the paper markets from falling out completely.
Solid Waste in Washington State --Eleventh Annual Status Report 77

Chapter V
Figure 5.5 Paper Products 1986 to 2001
-
100,000
200,000
300,000
400,000
500,000
600,000
700,000
1986 1988 1989 1990 1991 1992 1993 1994 1995 1996 1997 1998 1999 2000 2001
Tons
Newspaper
CorrugatedPaperHigh Grade
Mixed WastePaper
The market for corrugated paper started to drop in mid-2000 and continued through 2001 for a slight decrease in actual tonnage collected. Mixed waste paper dropped by 15% to offset the slight increase in 2000 from the 1998 and 1999 figures. High grade paper continued its steady decline, falling 2% in 2001. Newspaper collection has fluctuated after an all-time high in 1996. In 2001, newspaper decreased by 19%, the biggest fall of any paper product. This decrease followed suit with the drop in production of newsprint at North American mills.
Metals The general category of metals, including ferrous, nonferrous, white goods, and aluminum and tin cans, dropped from its 20% of recycled materials share in 2000, to 13% in the year 2001 (see Figure 5.2). All categories of metals decreased from 2000 to 2001, except white goods which did increase slightly. Aluminum cans fell by 30%, tin cans by 50%, and nonferrous metals by 19%. Reported tons of ferrous metals fell 29% from last year, consistent with a low trend that started after a sharp drop in 1996, when the Asian markets fell and recyclers started showing more reluctance to report their tonnage to SW&FAP (see Figure 5.7). If there was complete and correct reporting of ferrous metals collection, it is thought that Washington could see an increase in the total recycling rate of about 5%.
78 Solid Waste in Washington State --Eleventh Annual Status Report
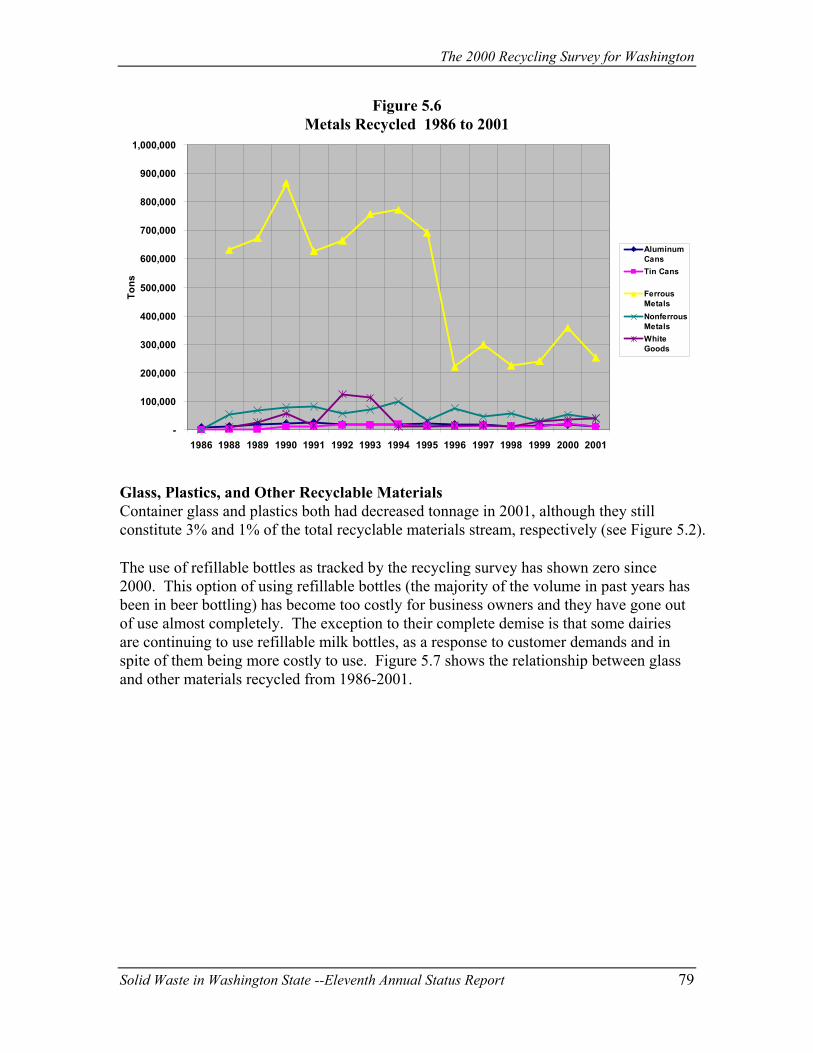
The 2000 Recycling Survey for Washington
Figure 5.6 Metals Recycled 1986 to 2001
-
100,000
200,000
300,000
400,000
500,000
600,000
700,000
800,000
900,000
1,000,000
1986 1988 1989 1990 1991 1992 1993 1994 1995 1996 1997 1998 1999 2000 2001
Tons
AluminumCansTin Cans
FerrousMetalsNonferrousMetalsWhiteGoods
Glass, Plastics, and Other Recyclable Materials Container glass and plastics both had decreased tonnage in 2001, although they still constitute 3% and 1% of the total recyclable materials stream, respectively (see Figure 5.2). The use of refillable bottles as tracked by the recycling survey has shown zero since 2000. This option of using refillable bottles (the majority of the volume in past years has been in beer bottling) has become too costly for business owners and they have gone out of use almost completely. The exception to their complete demise is that some dairies are continuing to use refillable milk bottles, as a response to customer demands and in spite of them being more costly to use. Figure 5.7 shows the relationship between glass and other materials recycled from 1986-2001.
Solid Waste in Washington State --Eleventh Annual Status Report 79

Chapter V
Figure 5.7 Glass & Other Materials Recycled 1986 to 2001
0
20000
40000
60000
80000
100000
120000
140000
1986 1988 1989 1990 1991 1992 1993 1994 1995 1996 1997 1998 1999 2000 2001
Glass
Others
For plastics, the only type which showed increased tonnage collection for 2001 was LDPE (see Figure 5.8).
Figure 5.8 Plastics Recycling 1986 to 2001
-
2,000
4,000
6,000
8,000
10,000
12,000
14,000
16,000
1986 1988 1989 1990 1991 1992 1993 1994 1995 1996 1997 1998 1999 2000 2001
Tons
PET Bottles
LDPEPlastics
HDPEPlastics
OtherRecyclablePlastics
80 Solid Waste in Washington State --Eleventh Annual Status Report

The 2000 Recycling Survey for Washington
Figure 5.9 shows the relationship of the six major recycling categories discussed above from 1986-2001.
Figure 5.9
Six Major Recycling Categories 1986 to 2001
0
500000
1000000
1500000
2000000
2500000
3000000
1986 1988 1989 1990 1991 1992 1993 1994 1995 1996 1997 1998 1999 2000 2001
Tons
Others
Glass
Plastics
Organics
Metals
Papers
New commodities, which were included in the recycling rate for the first time in 2000, include aseptic packaging and computers. Aseptic packaging has been added as a commodity to several curbside programs, including the City of Seattle, in recent years. The commercial collection of computers and parts (or electronics recycling) is a rapidly growing industry in the urban areas. The industry will likely continue to grow as we see an increase in the awareness of how these products are disposed of and as the length of their useful life decreases due to changes in technology.
Individual Waste Generation Figure 5.10 illustrates an average of how each person in the state contributes to the municipal solid waste stream. These numbers are about 2 pounds per person above the national averages for the categories of disposal, recycling, and generation. The difference is accounted for by a different ferrous metal measurement by Washington and the relatively larger amounts of yard and wood waste than the national average. Along with county review and end-use information these numbers provide a good check for the state’s recycling numbers. In 2001, each resident of the state generated 6.7 pounds of solid waste per day—4.2 pounds were disposed of, 2.1 pounds were recovered for recycling, and 0.4 pounds were recovered for composting (See Table 5.5).
Solid Waste in Washington State --Eleventh Annual Status Report 81

Chapter V
Figure 5.10 Pounds Disposed of, Recycled, and Generated (Per Person/Day)
0
1
2
3
4
5
6
7
8
1986 1988 1989 1990 1991 1992 1993 1994 1995 1996 1997 1998 1999 2000 2001
DisposedRecycledGenerated
Table 5.5
Generation, Materials Recovery, Composting, Waste Diversion, and Discards of Municipal Solid Waste
1986-2001 Pounds per person per day10
1986 1988 1990 1992 1994 1996 1998 1999 2000 2001 Generation 3.6 6.1 6.3 6.5 6.7 6.4 6.0 6.3 6.6 6.7 Recovery for Recycling 0.5 1.7 2.0 2.1 2.2 2.1 1.5 1.5 1.9 2.1 Recovery for Composting Na Na 0.1 0.2 0.3 0.3 0.6 0.5 0.4 .4 Recovery for Diversion11 Na Na Na Na Na Na Na 0.2 1.3 1.4 Total Materials Recovery 0.5 1.7 2.1 2.3 2.5 2.4 2.1 2.0 2.3 2.5 Discards After Recovery 3.1 4.4 4.2 4.2 4.2 3.9 3.9 4.2 4.3 4.2 Population (millions) 4.5 4.6 4.9 5.1 5.4 5.6 5.7 5.8 5.9 6.0
Benefits of Recycling The public and media attention that issues such as energy conservation and greenhouse gas emissions have recently received has been much greater than the attention given to recycling. There are many parallels with how recycling relates to other environmental issues, and the goal in focusing on each one leads to a single desired outcome. Thus, we can hope to draw more attention to the necessity of recycling and how it contributes to a sustainable future by linking it with other issues of concern. For example, Figure 5.11 shows the energy savings from recycling as compared to disposal in landfills and virgin material production.
10 Totals may not add due to rounding. 11 Not included in Total Materials Recovery or Generation – shown for comparison only.
82 Solid Waste in Washington State --Eleventh Annual Status Report

The 2000 Recycling Survey for Washington
Figure 5.11 Comparison of Energy Use through Recycling and
Disposal & Virgin Manufacturing (mil. Btu)12
0
10,000,000
20,000,000
30,000,000
40,000,000
50,000,000
RecyclingCollection &Manufacture
Disposal &Virgin
Manufacture
EnergySavings from
Recycling
Table 5.6 shows some of the environmental benefits of recycling based on the actual tonnage of commodities diverted from Washington’s waste stream in the year 2001 (as compared to using virgin materials). The energy saved from actual tons of material recycled in the state totaled 17,816,305 BTUs. The amount of greenhouse gases going into the atmosphere was reduced by 1,005,732 tons (MTCE). Please visit the Solid Waste & Financial Assistance Web site (topics related to sustainability) at http://www.ecy.wa.gov/programs/swfa/nav/sust.html for a link to the full document.
Table 5.6 Energy Savings and Greenhouse Gas Impacts from Recycling - 2001
Relative to energy required for virgin production13 Material/Grade Tons Recovered14 BTUs Saved
(in millions) Tons Greenhouse Gases Reduced (MTCE)
Aluminum 12,540 1,900,687 49,007 Newsprint 176,392 1,693,021 111,369 Mixed Waste Paper 289,840 3,125,400 273,442 Cardboard 491,230 3,537,507 353,777 Glass 81,632 294,315 8,697 Steel Cans 11,483 256,882 6,426 Ferrous Metals 293,284 6,560,909 164,120 PET 4,661 133,123 3,122 HDPE 4,841 83,215 1,977 LDPE 6,603 161,332 3,553 Other Plastics 4,067 69,914 1,661 Food Scraps 86,226 N/A 1,815 Yard Waste 448,222 N/A 8,978 Other Organics15 887,999 N/A 17,788 Total 2,799,020 17,816,305 1,005,732
12 Based on the NERC Environmental Benefits Model and the Washington State Department of Ecology 2001 Recycling Survey. 13 Based on the NERC Environmental Benefits Model and the Washington State Department of Ecology 2001 Recycling Survey. 14 This is a partial list of recyclables collected in 2001.
Solid Waste in Washington State --Eleventh Annual Status Report 83
15 Includes wood wastes, other wastes destined for composting and rendering.

Chapter V
In addition to greenhouse gases, recycling can reduce a range of pollutants from entering the air and water. This benefit accrues again because of reduced fossil fuel use and because recycled materials have already been processed once. The environmental impact of recycling on the amount of wastes diverted from landfills and incinerators is a direct benefit for Washington state, in reducing the amount of leachate introduced into groundwater systems and reducing the amount of pollutants released into the air and water. Recycling diverted 4,266,773 tons of material from landfills and incinerators in 2001. This figure includes traditionally recycled materials, as well as those that have not been traditionally included, such as asphalt, concrete, and used oil burned for fuel. Recycling has been shown to produce less of 27 different types of air and water pollutants, compared with using virgin materials in manufacturing and disposing of wastes.16 And, by substituting scrap materials for the use of trees, metal ores, minerals, oil, and other virgin materials, recycling reduces the pressure to expand forestry and mining production.
Diversion as a Measurement Option Ecology has measured a very specific part of the solid waste stream since 1986. It is roughly the part of the waste stream defined as municipal solid waste by the Environmental Protection Agency.17 However, Ecology has noted very large increases of recovery or beneficial use in “non-MSW” waste streams, most notable are the growing industries in recycling asphalt, concrete, and other construction, demolition, and landclearing debris.
Increasingly, Washington counties and cities have been putting efforts into waste streams outside of the traditional municipal solid waste stream. The best example is for the construction and demolition waste streams. Many of these materials are now being recycled including asphalt, asphalt roofing shingles, concrete, road asphalt, dimensional lumber, various metals, and more. Knowledge of this waste stream is increasing. King County18, the City of Seattle, and Clark County have all done sampling of this waste stream and have comparable results. Wood is another large waste stream in Washington and an increasing percentage of it is being used in new wood and paper products and as a feedstock in composting operations and as mulch. In agriculture, waste materials are being composted and processed for land application as soil amendments. All of these uses of waste materials avoid disposal for more beneficial use.
16 Based on information from sources including U.S. EPA, the Environmental Defense Fund, Franklin Associates, Ltd., the Tellus Institute, and the Steel Recycling Institute (Northeast Recycling Council). 17 The recyclable portion of the waste stream is municipal solid waste as defined by the Environmental Protection Agency in the Characterization of Municipal Solid Waste in The United States: 1996 Update. This includes durable goods, nondurable goods, containers and packaging, food wastes, and yard trimmings. It does not include industrial waste, inert debris, asbestos, biosolids, petroleum contaminated soils, or construction, demolition, and landclearing debris disposed of at municipal solid waste landfills and incinerators. 18 Waste Monitoring Program: Construction, Demolition & Land Clearing Waste, King County Solid Waste Division, January 1995.
84 Solid Waste in Washington State --Eleventh Annual Status Report
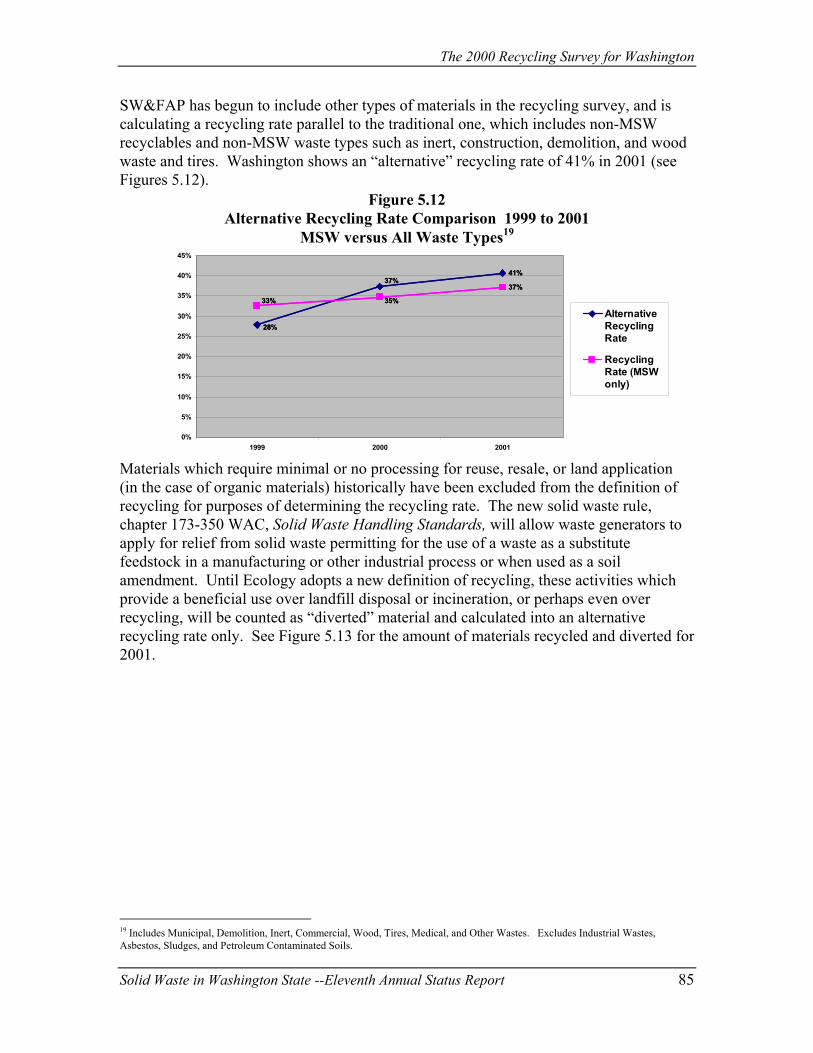
The 2000 Recycling Survey for Washington
SW&FAP has begun to include other types of materials in the recycling survey, and is calculating a recycling rate parallel to the traditional one, which includes non-MSW recyclables and non-MSW waste types such as inert, construction, demolition, and wood waste and tires. Washington shows an “alternative” recycling rate of 41% in 2001 (see Figures 5.12).
Figure 5.12 Alternative Recycling Rate Comparison 1999 to 2001
MSW versus All Waste Types19
41%41%37%
28%
33% 35%
37%37%
28%
33% 35%
37%
0%
5%
10%
15%
20%
25%
30%
35%
40%
45%
1999 2000 2001
AlternativeRecyclingRate
RecyclingRate (MSWonly)
Materials which require minimal or no processing for reuse, resale, or land application (in the case of organic materials) historically have been excluded from the definition of recycling for purposes of determining the recycling rate. The new solid waste rule, chapter 173-350 WAC, Solid Waste Handling Standards, will allow waste generators to apply for relief from solid waste permitting for the use of a waste as a substitute feedstock in a manufacturing or other industrial process or when used as a soil amendment. Until Ecology adopts a new definition of recycling, these activities which provide a beneficial use over landfill disposal or incineration, or perhaps even over recycling, will be counted as “diverted” material and calculated into an alternative recycling rate only. See Figure 5.13 for the amount of materials recycled and diverted for 2001.
Solid Waste in Washington State --Eleventh Annual Status Report 85
19 Includes Municipal, Demolition, Inert, Commercial, Wood, Tires, Medical, and Other Wastes. Excludes Industrial Wastes, Asbestos, Sludges, and Petroleum Contaminated Soils.

Chapter V
Figure 5.13 Amount of Materials Recycled (x 1,000 tons)
Including Recycling and Waste Diversion
958
82
317
20
1,422 1,458
Paper Glass Metals Plastic Organics Other
SW&FAP maintains, however, that these wastes are not well characterized and there is no definitive information on the total volume of waste generated, especially in the industrial sector. The reporting requirement for solid waste recyclables does not include these beneficial use activities; therefore, respondents choose on a voluntary basis to report quantities handled. This lack of information makes it difficult to figure a recycling rate for many of these materials because either we don’t know the total amount of waste generated or the beneficial use does not meet the state’s definition of recycling.20 For 1999, 2000, and 2001, the materials in Table 5.7 were reported.
Table 5.7 Reported Materials Not Included in the Recycling Survey
“Diverted” Materials Material 1999 Tons 2000 Tons 2001 Tons
Antifreeze 1,329 2,475 4,157 Asphalt and Concrete 49,136 893,218 1,116,871 Asphalt Roofing Shingles 10,334 14,412 11,727 Bricks 12 N/A N/A Composting Furnish N/A 89,678 91,495 Construction & Demolition Debris21 145,593 376,684 131,922 Household Batteries 23 39 38 Incinerator Ash N/A N/A 12,015 Industrial Batteries 41 738 N/A Landclearing Debris N/A N/A 151,464 Miscellaneous N/A 374 16 Oil Filters 1.4 835 5,942 Oyster Shells 1,563 N/A N/A Paint N/A 40 87 Railroad Ties N/A 121 12,460 Rebound Carpet Pad 18 97 820 Reuse - Clothing & Household Items N/A 524 601 Reuse - Construction & Demolition Items N/A 1,257 1,975
20 Revised Code of Washington 70.95.030 (16) "Recycling" means transforming or remanufacturing waste materials into usable or marketable materials for use other than landfill disposal or incineration 21 Includes landclearing debris in 1999 and 2000.
86 Solid Waste in Washington State --Eleventh Annual Status Report

The 2000 Recycling Survey for Washington
Material 1999 Tons 2000 Tons 2001 Tons Reuse - Miscellaneous N/A 198 334 Sweepings and Grit Used in Asphalt N/A 10,000 318 Tires (reused, retread or burned for fuel) N/A N/A 1,009 Topsoil N/A 22,812 N/A Used Oil for Energy Recovery 6 19,256 33,021 ,786 Total Diverted 44,306 46,522 63,035 214,306 1,446,522 1,563,035
ethodology for measuring these diverted materials is as simple as collecting the y
urveys.
list,
ashington state waste generation rate as calculated from the
l
Figure 5.14 Washington Waste Generation22
The mnumber of tons of material that are going to beneficial use as opposed to disposal. Manrecycling survey respondents have voluntarily listed this information on the recycling survey in the past, and beginning in 2000, the information was more specifically requested. SW&FAP will continue to collect more of this information on future sFor the most part, these materials are collected and processed outside of the traditional residential and commercial waste stream and were not well addressed in the Waste Not Washington Act of 1989. Still, SW&FAP recognizes the creative efforts of local governments and businesses in addressing these wastes. This is not an exhaustiveneither are the numbers complete for these material categories.
Figure 5.14 illustrates the Wamount of waste recycled, diverted and disposed. As better reporting of information for recycling, diversion and disposal occurs in the next few years, the generation number wilbecome more accurate.
Including Waste “Diversion”
1999 to 2001
0
2,000,000
4,000,000
6,000,000
8,000,000
10,000,000
1999 2000 2001
Tons
12,000,000
Other Waste TypesDisposedMSW & CommercialWastes DisposedTotal Diversion
Total Recycled
Solid Waste in Washington State --Eleventh Annual Status Report 87
22 Other waste types includes demolition, inert, wood, tires, medical waste and other wastes. It excludes industrial wastes, asbestos, sludges, petroleum contaminated soils.


Disposal of Solid Waste in Washington
Chapter VI. Disposal of Solid Waste in Washington One of the goals of this report is to identify the types and quantities of solid waste disposed in the various types of landfills and energy recovery facilities in the state. This includes waste imported into the state for disposal and waste exported to Oregon. Landfilling is the basic method of final disposal and includes five types of landfills - municipal solid waste landfills, woodwaste landfills, limited purpose landfills, inert/demolition landfills and ash monofills.
As part of the annual reporting requirements of chapter 173-304 WAC, the Minimum Functional Standards (MFS) and chapter 173-351, Criteria for Municipal Solid Waste Landfills, forms were sent to the various types of landfills for them to report the types and quantities of waste they received for disposal. The categories of solid waste specified on the form were municipal, demolition, industrial, inert, commercial, woodwaste, sewage sludge, asbestos, petroleum contaminated soils, tires, special waste and other. The facilities were also asked to report the source of their waste: out-of-county, out-of-state or out-of-country. In addition, three landfills in Oregon accept waste from Washington, Finley Butte, Wasco and Columbia Ridge. Waste information from each facility is used in preparing this report. The other method of waste disposal in Washington is energy-recovery facilities. Annual report forms were also sent to these facilities. The same type of waste information was requested.
Municipal Solid Waste Landfills Amount of Waste Disposed in Municipal Solid Waste Landfills In 2001, 20 municipal solid waste landfill accepted waste totaling 4,525,019 tons.23 Of the 20 landfills, 14 were publicly owned, and six were privately owned. Six of the 20 landfills received over 100,000 tons of waste in 2001. The two largest landfills in Washington, Cedar Hills in King County and Roosevelt Regional Landfill in Klickitat County received 939,506 tons and 1,836,114 tons, respectively. In 2001, only one landfill received less than 10,000 tons, compared with 12 MSW landfills in 1994. This trend (Figure 6.1) indicates that the smaller facilities have been closing in response 23 Throughout this report, different disposal amounts are discussed. These numbers vary based on the types of facilities being discussed, the source of the waste and the purpose of the discussion. For example, the recycling survey only accounts for “traditional” municipal waste in the disposed amount used to calculate the statewide recycling rate. See discussions in Chapter V and this chapter for further information.
Solid Waste in Washington State --Eleventh Annual Status Report 89

Chapter VI
to more stringent regulations and some are reaching the limits of their capacity and are not planning on expanding.
Figure 6.1 MSW Landfill Size
(Number of Landfills Based on Disposed Tons Per Year)
0
5
10
15
20
25
30
35
40
45
1992 1993 1994 1995 1996 1997 1998 1999 2000 2001
>100,000 tons per year
10,000 - 100,000 tons per year<10,000 tons per year
Table 6.1 shows the relationship of waste disposed to public/private ownership. As the table illustrates, 1,637,203 tons of solid waste disposed went to publicly owned facilities (36%), with the remaining 2,887,816 tons going to private facilities (64%).
Table 6.1 Waste Disposed in MSW Landfills – Public/Private
OWNERSHIP NUMBER OF
MSW LANDFILLS AMOUNT OF WASTE
DISPOSED (Tons) % TOTAL WASTE
DISPOSED 1991 2000 1991 2001 1991 2001
PUBLIC 36 14 2,696,885 1,637,203 69 36 PRIVATE 9 6 1,192,207 2,887,816 31 64 TOTAL 45 2 3,889,092 4,525,019 100 100
The amount of waste disposed in MSW landfills shows movement from the publicly owned facilities to those owned by the private sector (see Figure 6.2). The trend has continued since 1991, when the state first started tracking this type of information. The amount of waste disposed in the private facilities has increased from 31% since 1991 to 64% in 2001. The majority of this increased amount can be accounted for by the private Roosevelt Regional Landfill in Klickitat County.
90 Solid Waste in Washington State --Eleventh Annual Status Report

Disposal of Solid Waste in Washington
Figure 6.2 Comparison of Waste Disposed for Public and Private Facilities (tons)
0500,000
1,000,0001,500,0002,000,0002,500,0003,000,0003,500,0004,000,0004,500,0005,000,000
1992 1993 1994 1995 1996 1997 1998 1999 2000 2001
Public
Private
Types of Waste Disposed in Municipal Solid Waste Landfills Traditionally, many people think of the waste disposed in MSW landfills as being mostly household waste.24 Annual facility reports show that a much wider variety of waste is disposed of in the MSW landfills. These wastes need to be considered in terms of remaining available capacity. Fourteen of the 20 landfills reported a significant amount of solid waste disposed, other than municipal solid waste. Demolition, industrial, inert, commercial, woodwaste, sludge, asbestos, petroleum contaminated soils (PCS) and tires were the major waste streams. (A few landfills report all types of waste under the general “municipal” category so exact amounts cannot be determined.) Table 6.2 shows changes in waste, types and amounts disposed in MSW landfills from 1995 through 2001. (See Appendix C, Table C.1 for specific 2001 MSW facility data and Appendix D, Table D.1 for MSW landfill data from 1992-2001).
24 "Household waste" as defined in chapter 173-351 WAC, Criteria for Municipal Solid Waste Landfills, means any solid waste (including garbage, trash, and sanitary waste in septic tanks) derived from households (including single and multiple residences, hotels and motels, bunkhouses, ranger stations, crew quarters, campgrounds, picnic grounds, and day-use recreation areas).
Solid Waste in Washington State --Eleventh Annual Status Report 91

Chapter VI
Table 6.2 Waste Types Reported Disposed in MSW Landfills
WASTE TYPES 1995
(Tons) 1996
(Tons) 1997
(Tons) 1998
(Tons) 1999
(Tons) 2000
(Tons) 2001
(Tons) Municipal Solid Waste* 2,777,030 2,807,998 3,083,286 3,222,639 3,421,415 3,336,745 3,432,359 Demolition Waste 382,513 375,412 385,412 446,172 437,005 569,239 373,254 Industrial Waste 161,779 145,617 163,431 159,781 232,905 88,841 201,198 Inert Waste 5,154 30,061 117,512 107,452 23,875 19,349 26,376 Commercial Waste 142,258 109,093 173,863 158,256 129,070 93,752 66,391 Woodwaste 37,850 57,667 57,128 60,383 68,889 47,087 34,254 Sewage Sludge 66,728 49,205 72,741 67,419 62,920 47,783 1,473 Asbestos 7,859 7,965 9,558 10,684 9,666 7,922 5,991 Petroleum Contaminated Soils
255,288 254,414 444,260 288,407 312,247 231,290 217,721
Tires 28,712 12,787 14,912 19,130 12,581 43,188 8,567 Special na 10 6 904 0 437 917 na na na na na 239 387 Other** 136,644 233,526 10,809 40,880 28,235 173,711 156,131 TOTAL 4,001,815 4,083,755 4,532,918 4,582,107 4,738,808 4,659,582 4,525,019
* Some facilities include demolition, industrial, inert, commercial and other small amounts of waste types in the MSW total.
** Some of the “other” types of waste reported include non-municipal ash, auto fluff and white goods. In reviewing the types of waste that were disposed in the MSW landfills in 2001, increased amounts were reported for the categories of municipal solid waste, industrial waste and inert waste. There was a decrease in demolition, PCS, tires and the “other” categories.
Waste-to-Energy/Incineration Four waste-to-energy facilities/incinerators statewide burned 496,152 tons of solid waste. Of that amount, 9,072 tons were identified as woodwaste at the Inland Empire Paper facility in Spokane and 3,938 tons of woodwaste at the Ponderay Newsprint Company in Pend Oreille County. These two incinerators do not burn municipal solid waste. In 2001, almost 10% of solid waste was incinerated statewide. The highest percent of waste incinerated in the state was 12% in 1995. (See Appendix C, Table C.2 for facility specific 2001 energy recovery/incinerator data.)
Ash Monofill For waste-to-energy facilities or incinerators that are regulated by chapter 173-304 WAC, the Minimum Functional Standards for Solid Waste Facilities, and chapter 173-306 WAC, Special Incinerator Ash Management Standards (see in Chapter II), the ash generated must be disposed in a properly constructed ash monofill. In 2001, there was one energy recovery/ incinerator that met this criteria. The municipal solid waste incinerator ash (76,523 tons) was disposed at the ash monofill at the Roosevelt Regional Landfill in Klickitat County.
92 Solid Waste in Washington State --Eleventh Annual Status Report

Disposal of Solid Waste in Washington
Trends in Municipal Solid Waste Disposal Methods The two basic ways to dispose of solid waste are landfilling and burning. (See Map A for the location of MSW landfills and energy recovery facilities.)
Map A: Location of MSW Landfills & Energy Recovery Facilities (as of October 2002)
A comparison of the amount of solid waste disposed in municipal solid waste landfills and waste-to-energy facilities and incinerators in 2001 is shown in Table 6.3.
Solid Waste in Washington State --Eleventh Annual Status Report 93

Chapter VI
Table 6.3 Waste Disposed in MSW Landfills
and Incinerators in 2001 FACILITY TYPE TONS PERCENT (%)MSW Landfills 4,525,019 90% Incinerators 496,152 10% TOTAL 5,021,171 100%
The largest change in disposal methods over the past few years has been between landfilling and energy recovery/incineration. In 1991, 98% of the waste was disposed in MSW landfills and 2% was incinerated. The highest percent of incinerated waste in the state, 12%, occurred in 1995. The rate has varied between 9 and 11% since 1998. (See Figure 6.3)
Figure 6.3
Comparison of Solid Waste Landfilled & Incinerated 1991 through 2001 (in tons)
0
500,000
1,000,000
1,500,000
2,000,0002,500,000
3,000,000
3,500,000
4,000,000
4,500,000
5,000,000
1992 1993 1994 1995 1996 1997 1998 1999 2000 2001
MSW LandFills Incinerators
The amount of waste incinerated will likely remain fairly stable, with only one operating municipal solid waste energy-recovery facilities, one energy recovery facility inactive at this time and no new facilities planned.
Inert/Demolition, Limited Purpose and Woodwaste Landfills In addition to municipal solid waste landfills, there are currently three other types of landfill types in the state: inert/demolition, limited purpose, and woodwaste. These are regulated under chapter 173-304 WAC, the Minimum Functional Standards for Solid
94 Solid Waste in Washington State --Eleventh Annual Status Report

Disposal of Solid Waste in Washington
Waste Handling (MFS). With the completion of chapter 173-350 WAC, Solid Waste Handling Standards in January 2003, the classification and requirements for these types of landfills will change. There will no longer be woodwaste landfill or inert/demolition landfill categories. Inert waste will be narrowly defined for disposal in an inert landfill. Demolition waste will no longer be accepted at an inert landfill. The limited purpose landfill category will remain with increased design and monitoring requirements.
For 2001, annual report forms were received from the inert/demolition, limited purpose and woodwaste landfills. Tables 6.4 - 6.6 identify the types and quantities of waste received at these landfills.
Table 6.4 includes the waste types and amounts reported by 33 inert/demolition landfills for 2001. There was a large increase in petroleum contaminated soils. Some facilities may be over-reporting disposal numbers since much of the material coming on-site is being recycled, for example as aggregate. SW&FAP will be gathering additional information in the future to better distinguish disposal versus recycling tonnages at some of these facilities. (See Appendix C, Table C.3 for 2001 facility specific inert/demolition landfill data and Appendix D Table D.2 for inert/demolition landfill data from 1992-2001).
Table 6.4 Waste Types and Amount Disposed at Inert/Demolition Landfills
WASTE TYPES 1995 1996 1997 1998 1999 2000 2001 Municipal 0 0 0 0 0 0 0 Demolition 103,903 133,469 262,793 180,268 173,088 259,255 211,901 Industrial 0 0 121 0 0 0 0 Inert 121,943 226,362 326,331 252,506 344,444 180,337 199,256 Commercial 0 0 0 0 0 0 0 Wood 167 39 0 156 336 536 167 Sludge 0 0 0 0 0 0 0 Asbestos 0 0 0 4 0 3 3 PCS 18,295 846 10,285 60,545 17,265 34,742 319,105 Tires 0 33 618 449 414 471 765 Other 33,125 58,953 1 600 605 2,039 2,646 TOTAL (tons) 277,433 419,702 600,149 494,528 536,155 477,383 733,843
Table 6.5 includes the types and amounts of waste reported disposed at 13 limited purpose landfills for 2001. There were increases in demolition, industrial, PCS, wood and tires and a small decrease in inert, asbestos, other and the overall total. (See Appendix C, Table C.4 for 2001 facility specific limited purpose landfill information data and Appendix D Table D.3 for limited purpose landfill data from 1992-2001).
Solid Waste in Washington State --Eleventh Annual Status Report 95

Chapter VI
Table 6.5
Waste Types and Amount Disposed at Limited Purpose Landfills WASTE TYPES 1995 1996 1997 1998 1999 2000 2001 Municipal 0 0 0 0 0 0 0 Demolition 151,230 180,529 85,916 98,072 84,140 71,203 71,817 Industrial 315,930 371,496 277,419 225,779 262,021 278,224 325,114 Inert 138,577 141,759 109,174 112,714 136,352 205,902 202,577 Commercial 0 0 0 0 0 0 0 Wood 58,628 22,660 14,589 7,700 8,853 3,205 6,841 Sludge 0 0 2,275 0 1,103 0 0 Asbestos 797 512 1,310 1,058 1,549 1,654 1,282 PCS 148,932 98,221 121,066 56,407 8,837 7,159 13,222 Tires 0 29,227 434 559 59 25 41 Other 40,797 65,675 83,600 124,607 66,833 79,291 24,698 TOTAL (tons) 874,116 910,078 695,783 628,896 569,747 646,662 645,592
Table 6.6 includes the waste types and amounts reported at one woodwaste landfill for 2001. Most woodwaste landfills have closed. A high demand for wood products has increased the reuse and recycling of woodwastes that had been disposed in the past. Some woodwaste landfills are actually “mining” materials disposed in the past. These operations will be evaluated further to determine how to more accurately determine the amount of material disposed. With only one woodwaste landfill still operating, there was a decrease all categories. (See Appendix C, Table C.5 for 2001 facility specific woodwaste landfill data and Appendix D Table D.4 for woodwaste landfill data from 1992-2001).
Table 6.6 Waste Types and Amount Disposed at Woodwaste Landfills
WASTE TYPES
1995 1996 1997 1998 1999 2000 2001
Municipal 0 0 0 0 0 0 0 Demolition 8,600 18,780 17,718 21,313 25,121 32,182 31,559 Industrial 0 0 0 0 0 15,120 0 Inert 0 0 0 0 0 0 0 Commercial 0 0 0 0 0 0 0 Wood 105,080 81,886 69,498 36,777 75,668 33,452 21,739 Sludge 0 0 0 0 0 0 0 Asbestos 0 0 0 0 0 0 0 PCS 0 0 0 0 0 0 0 Tires 0 0 0 0 0 0 0 Other 2,079 2,031 8,109 1,320 1,695 622 0 TOTAL (tons) 115,759 102,697 95,325 59,410 102,484 87,552 53,298
Movement of Solid Waste Movement of Waste Between Counties All landfills and incinerators were asked to report the source, types and amounts of waste they received from out-of-county. Seven of the 20 active MSW landfills reported receiving over 1.8 million tons of solid waste from other counties in 2001.
96 Solid Waste in Washington State --Eleventh Annual Status Report

Disposal of Solid Waste in Washington
Some of the municipal solid waste movement was because of closer proximity to a neighboring county’s landfill, especially for the smaller landfills which received municipal waste from other counties without there own landfills. Some of the waste
isposed from other counties was non-municipal waste such as PCS, demolition and
y,
l
oosevelt. Six counties and the City of Seattle send the majority of eir MSW waste to Oregon facilities. Two other counties send a significant amount of
lls received 27,359 tons of waste (asbestos, inert, demolition and PCS) from other counties. One woodwaste landfill received 3,800 tons of demolition waste from other counties.
dasbestos. With the closure of many local landfills, Roosevelt Regional Landfill in Klickitat Countand to a lesser extent, Oregon’s regional landfills, have become the chosen disposal option. The Roosevelt Regional Landfill received some type of solid waste from 32 of the 39 Washington counties and also from out-of-state and out-of-country (see Map B). For many counties that still have operating MSW landfills, Roosevelt Regional Landfilhas become an option to dispose of some of their non-municipal waste, thus saving local landfill capacity for future need. Thirteen of the 32 counties rely on Roosevelt for themajority of their MSW waste disposal and four other counties send a significant portion of their MSW to Rthwaste to Oregon. In addition to waste movement to MSW landfills, two of the waste-to-energy facilities received 9,722 tons of waste (MSW and demolition) from beyond their home county. Sixinert/demolition landfills received 224,766 tons of waste (inert, demolition and PCS) and three limited purpose landfi
Solid Waste in Washington State --Eleventh Annual Status Report 97
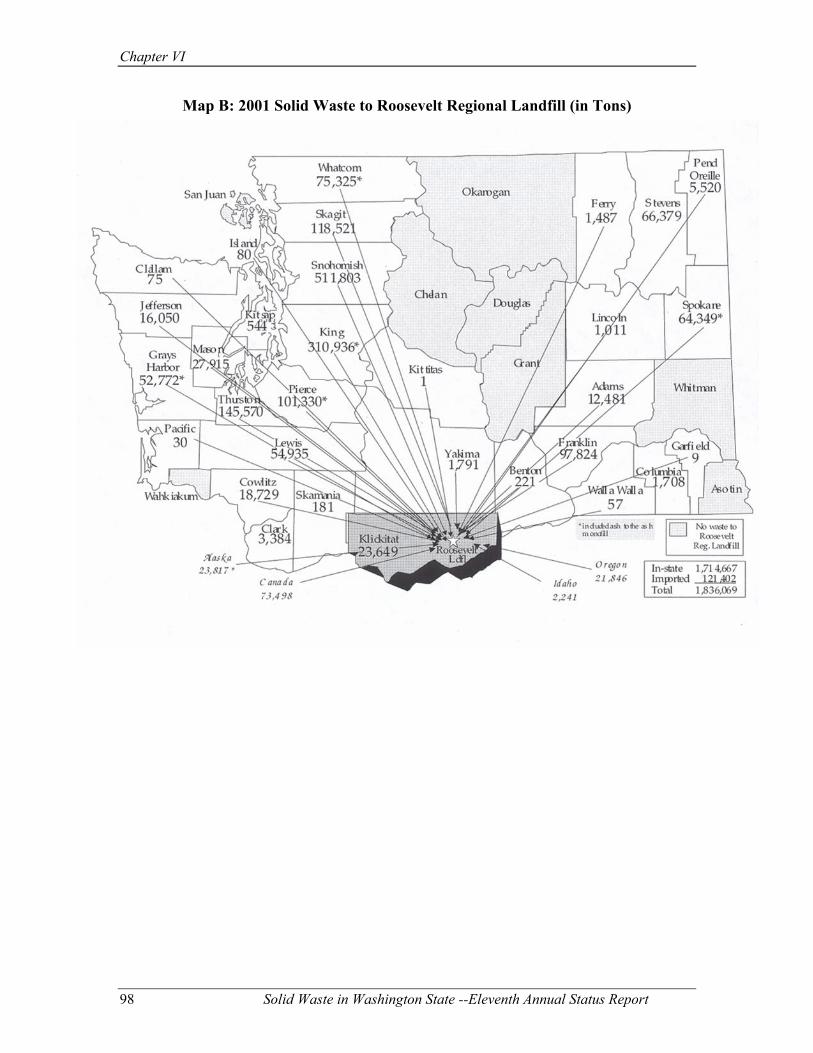
Chapter VI
Map B: 2001 Solid Waste to Roosevelt Regional Landfill (in Tons)
98 Solid Waste in Washington State --Eleventh Annual Status Report
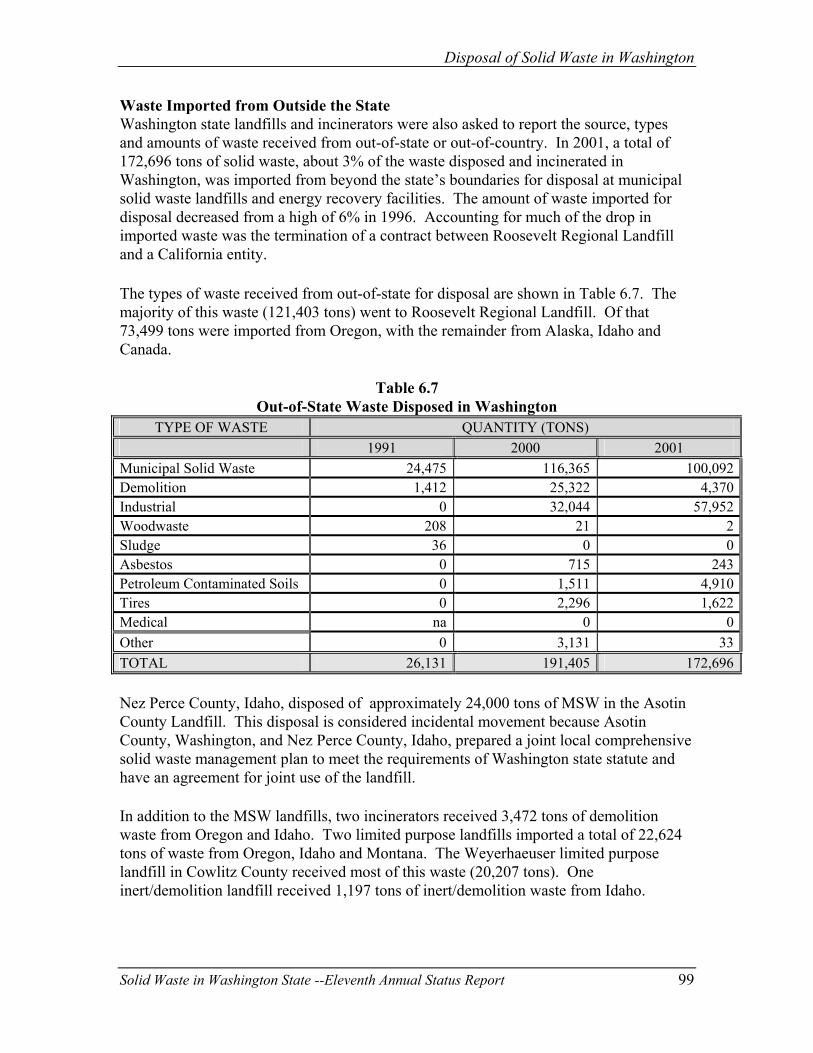
Disposal of Solid Waste in Washington
Waste Imported from Outside the State Washington state landfills and incinerators were also asked to report the source, types and amounts of waste received from out-of-state or out-of-country. In 2001, a total of 172,696 tons of solid waste, about 3% of the waste disposed and incinerated in Washington, was imported from beyond the state’s boundaries for disposal at municipal solid waste landfills and energy recovery facilities. The amount of waste imported for disposal decreased from a high of 6% in 1996. Accounting for much of the drop in imported waste was the termination of a contract between Roosevelt Regional Landfill and a California entity. The types of waste received from out-of-state for disposal are shown in Table 6.7. The majority of this waste (121,403 tons) went to Roosevelt Regional Landfill. Of that 73,499 tons were imported from Oregon, with the remainder from Alaska, Idaho and Canada.
Table 6.7 Out-of-State Waste Disposed in Washington
TYPE OF WASTE QUANTITY (TONS) 1991 2000 2001 Municipal Solid Waste 24,475 116,365 100,092Demolition 1,412 25,322 4,370Industrial 0 32,044 57,952Woodwaste 208 21 2Sludge 36 0 0Asbestos 0 715 243Petroleum Contaminated Soils 0 1,511 4,910Tires 0 2,296 1,622Medical na 0 0Other 0 3,131 33TOTAL 26,131 191,405 172,696 Nez Perce County, Idaho, disposed of approximately 24,000 tons of MSW in the Asotin County Landfill. This disposal is considered incidental movement because Asotin County, Washington, and Nez Perce County, Idaho, prepared a joint local comprehensive solid waste management plan to meet the requirements of Washington state statute and
ave an agreement for joint use of the landfill. h In addition to the MSW landfills, two incinerators received 3,472 tons of demolition waste from Oregon and Idaho. Two limited purpose landfills imported a total of 22,624 tons of waste from Oregon, Idaho and Montana. The Weyerhaeuser limited purpose landfill in Cowlitz County received most of this waste (20,207 tons). One nert/demolition landfill received 1,197 tons of inert/demolition waste from Idaho. i
Solid Waste in Washington State --Eleventh Annual Status Report 99
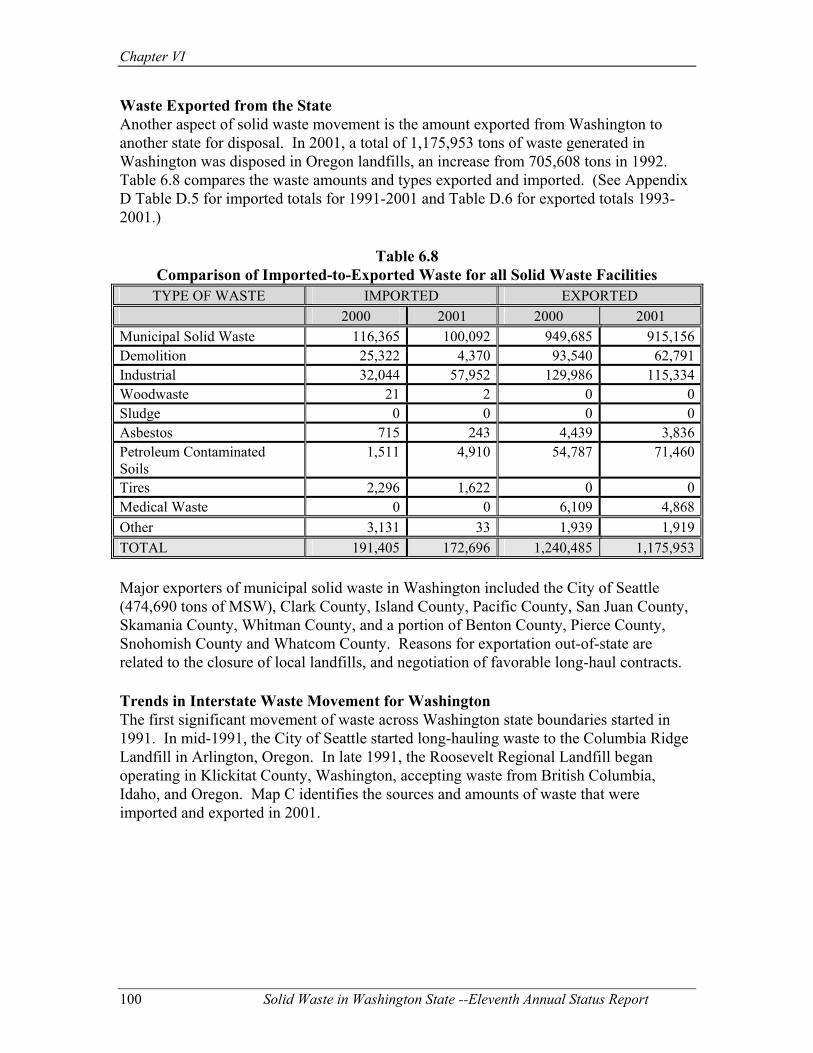
Chapter VI
Waste Exported from the State Another aspect of solid waste movement is the amount exported from Washington to another state for disposal. In 2001, a total of 1,175,953 tons of waste generated in Washington was disposed in Oregon landfills, an increase from 705,608 tons in 1992. Table 6.8 compares the waste amounts and types exported and imported. (See Appendix D Table D.5 for imported totals for 1991-2001 and Table D.6 for exported totals 1993-2001.)
Table 6.8 Comparison of Imported-to-Exported Waste for all Solid Waste Facilities
TYPE OF WASTE IMPORTED EXPORTED 2000 2001 2000 2001 Municipal Solid Waste 116,365 100,092 949,685 915,156Demolition 25,322 4,370 93,540 62,791Industrial 32,044 57,952 129,986 115,334Woodwaste 21 2 0 0Sludge 0 0 0 0Asbestos 715 243 4,439 3,836Petroleum Contaminated Soils
1,511 4,910 54,787 71,460
Tires 2,296 1,622 0 0Medical Waste 0 0 6,109 4,868Other 3,131 33 1,939 1,919TOTAL 191,405 172,696 1,240,485 1,175,953 Major exporters of municipal solid waste in Washington included the City of Seattle (474,690 tons of MSW), Clark County, Island County, Pacific County, San Juan County, Skamania County, Whitman County, and a portion of Benton County, Pierce County, Snohomish County and Whatcom County. Reasons for exportation out-of-state are related to the closure of local landfills, and negotiation of favorable long-haul contracts. Trends in Interstate Waste Movement for Washington The first significant movement of waste across Washington state boundaries started in 1991. In mid-1991, the City of Seattle started long-hauling waste to the Columbia Ridge Landfill in Arlington, Oregon. In late 1991, the Roosevelt Regional Landfill began operating in Klickitat County, Washington, accepting waste from British Columbia, Idaho, and Oregon. Map C identifies the sources and amounts of waste that were imported and exported in 2001.
100 Solid Waste in Washington State --Eleventh Annual Status Report

Disposal of Solid Waste in Washington
Map C: Imported and Exported Waste (2001)
As can be seen in Figure 6.4, Washington exports have been much higher than imports since 1991. With the loss of the California contract at Roosevelt Regional Landfill, waste imports dropped from a high of 307,850 in 1998, to 172,696 tons in 2001. Exported waste amounts decreased slightly in 2001, with almost seven times as much waste being exported to Oregon’s landfills, Columbia Ridge, Wasco and Finley Buttes, than is imported to Washington for incineration or disposal.
Solid Waste in Washington State --Eleventh Annual Status Report 101

Chapter VI
Figure 6.4
Trend of Imported/Exported Solid Waste
0
200,000
400,000
600,000
800,000
1,000,000
1,200,000
1,400,000
1992 1993 1994 1995 1996 1997 1998 1999 2000 2001
Import Export
Determining the Amount of Solid Waste Disposed The figure arrived at for the amount of solid waste disposed varies depending upon the types of wastes included, the source of waste generation or the types of facilities included in the calculation. Waste Generated by Washington Citizens for Disposal at MSW Facilities Since 1987, Ecology has conducted a recycling survey that has reported the amount of waste generated, recycled and disposed each year. This waste stream was the “recyclable waste stream” made up of waste types included in the recycling categories, but not including sludge, asbestos, petroleum contaminated soils, construction and demolition, or industrial waste (when it could be specifically identified25). It was also typically the waste stream generated and reported by municipalities (cities and counties). The report for the recycling survey included waste that was disposed of outside of Washington, but excluded imported waste. Figure 6.5 shows the amount of waste recycled, disposed and generated in Washington. It is based on waste disposed at MSW landfills and incinerators in Washington and Oregon, excluding imported waste. All types of waste are included in the disposal 25 Some facilities and government entities that report information for the annual recycling survey on waste generated and disposed include other waste in with the total for municipal solid waste. These waste types are typically inert, demolition, industrial, and commercial.
102 Solid Waste in Washington State --Eleventh Annual Status Report

Disposal of Solid Waste in Washington
numbers. The trend until 1997 showed an increase in the amounts generated, recycled, and disposed. The recycling rate remained fairly flat from 1997 to 1999. In 2001, there was an increase in the recycling rate, along with a decrease in the disposal rate.
Figure 6.5 Washington State Trends in Solid Waste Generated, Recycled & Disposed (in tons)
0
1,000,000
2,000,000
3,000,000
4,000,000
5,000,000
6,000,000
7,000,000
8,000,000
9,000,000
10,000,000
1991 1992 1993 1994 1995 1996 1997 1998 1999 2000 2001
Tons Generated Tons Disposed Tons Recycled
Washington State’s population has continued to grow since disposal numbers were tracked in 1991 (see Table 6.9). The increased population has had a correlated increase in waste disposed. In 1995, the per capita disposal rates (0.93 tons/person/year) decreased from the 1994 level (0.94 tons/person/year). The rate began to rise in 1997 to a high of 1.09 tons in 2000. There was also a significant decrease in the recycling rate per person, from 0.47 tons/person/year in 1995 to 0.38 tons/person/year in 1997. In 2001, there was a decrease in the per capita disposal rate to 1.01 tons/person/year. There was also an increase in the recycling rate to 0.45 tons/person/year.
Solid Waste in Washington State --Eleventh Annual Status Report 103

Chapter VI
Table 6.9 Washington State Population
1991 5,000,385 1992 5,116,685 1993 5,240,900 1994 5,334,400 1995 5,429,900 1996 5,516,800 1997 5,606,800 1998 5,685,300 1999 5,757,400 2000 5,803,400 2001 5,974,900
Figure 6.6 analyzes the trends in per capita generation, recycling and disposal. This looks at the number of tons per year generated, recycled and disposed by each person. The total is not what each person produces at each household, but includes all residential, business, commercial and industrial waste generated in the state that is disposed of in municipal solid waste landfills and incinerators. Table 6.10 shows the per capita numbers (pounds/person/day) from 1995 through 2001. (See Appendix D Table D.7 for per capital numbers from 1991-2001.)
Figure 6.6 Washington State Trends in Solid Waste
Generated, Recycled & Disposed (tons/person/year)
0
0.2
0.4
0.6
0.8
1
1.2
1.4
1.6
1991 1992 1993 1994 1995 1996 1997 1998 1999 2000 2001
Tons Per Capita GeneratedTons Per Capita DisposedTons Per Capita Recycled
104 Solid Waste in Washington State --Eleventh Annual Status Report

Disposal of Solid Waste in Washington
Table 6.10
Per Capita Disposed, Recycled and Generated Numbers (pounds/person/day)
Per Capita 1995 1996 1997 1998 1999 2000 2001 Disposed26 5.12 5.16 5.66 5.45 5.73 5.96 5.55 Recycled 2.56 2.51 2.10 2.05 2.05 2.33 2.48 Generated 7.68 7.67 7.76 7.50 7.78 8.28 8.03
While the overall total of waste has decreased, the municipal solid waste portion of the waste stream has increased. Traditional recycling commodities (glass, paper, etc.) have decreased while the recycling of wood has shown an increase. There was a corresponding decrease in the amount of wood reported disposed at the various landfill types. The revised state solid waste plan, Beyond Waste, a draft to be completed in Fall 2003, will provide the vision for reducing the amount and impact of waste and will focus efforts on waste prevention and reduction by state and local government, the private sector, and citizens of the state. Total Waste Disposed in Washington State The three other categories of landfills for which information was obtained this year include woodwaste, inert/demolition and limited purpose. The waste disposed in these facilities is more typically generated by the private sector (business and industry). There is a significant amount of waste that is disposed of in-state that is not included in the disposal numbers discussed above. To gain a more complete picture of solid waste disposal in the state, it is necessary to include all categories of waste that are disposed or incinerated in Washington state landfills and incinerators. This includes waste imported from out-of-state, but does not include exported waste. When all categories are included, 6,453,904 tons of waste were disposed of in all types of landfills and incinerators in Washington in 2001 (see Table 6.11). (See Appendix D Table D.8 for total solid waste disposed from 1993-2001.)
Table 6.11 Total Amounts of Solid Waste Disposed in Washington
DISPOSAL METHOD 1995 1996 1997 1998 1999 2000 2001
Municipal Solid Waste Landfills
4,001,815 4,083,755 4,532,918 4,582,107 4,738,808 4,659,582 4,525,019
Incinerated Waste 397,588 365,464 551,006 369,778 461,684 554,780 496,152 fills 115,759 102,697 95,325 59,410 102,484 87,552 53,298
Landfills 479,638 873,195 600,149 494,528 536,155 477,383 733,843
Limited Purpose Landfills
874,116 910,078 695,783 628,896 569,747 646,662 645,592
TOTAL 5,868,916 6,335,189 6,475,181 6,134,719 6,408,878 6,425,959 6,453,904
Woodwaste LandInert/Demolition
26 Disposed amounts include all waste generated from Washington disposed in MSW landfills and incinerators, both instate and exported.
Solid Waste in Washington State --Eleventh Annual Status Report 105

Chapter VI
Future Capacity at Municipal Solid Waste Landfills There are currently 18 municipal solid waste landfills operating as of September 2001. (See Map A for the location of operating MSW landfills and incinerators.) The amount of remaining capacity for the 18 MSW landfills was determined by asking the facilities to report remaining permitted capacity, as well as the expected closure date. In 2002, the facilities estimated about 179 million tons, or about 39 years, of capacity at the current disposal rate.27 In 1994, facilities reported approximately 181 million tons of remaining capacity, about 49 years of remaining capacity statewide.28 Changes in permit conditions, early landfill closures and projections of fewer expansions, and changing volumes affect remaining capacity, which has fluctuated the past several years. Of the 18 currently operating landfills, only 10 have greater than 10 years of remaining permitted capacity. (See Table 6.12 for an estimated number of facilities with specified remaining years of life.) Map D shows the counties and the remaining years of capacity of their MSW landfills.
Table 6.12 Estimated Years to Closure for MSW Landfills
YEARS TO CLOSURE
% OF TOTAL REMAINING CAPACITY
NUMBER OF FACILITIES PUBLIC PRIVATE
Less than 5 years 1% 3 2 1 5 to 10 years 10% 5 5 0 Greater than 10 years 89% 10 7 3 TOTALS 100% 18 14 4
27 This does not include a site in Adams County that has been permitted for 90,000,000 tons. Construction start of this facility is undecided at this time. 28 Solid Waste in Washington State - Third Annual Status Report, Department of Ecology, Publication #94-194, December 1994.
106 Solid Waste in Washington State --Eleventh Annual Status Report

Disposal of Solid Waste in Washington
Map D: Remaining Permitted MSW Landfill Capacity (as of April 2002)
<5 Years Capacity
>10 Years Capacity
No Landfill in County
Whatcom
Skagit
Snohomish
King
PierceThurston
KitsapMason
Clallam
Island
San Juan
Jefferson
GraysHarbor
Pacific Lewis
Wahkiakum Cowlitz Skamania
ClarkKlickitat
Kittitas
Chelan
Okanogan
Douglas
Grant
Ferry
Lincoln
Adams
Stevens
PendOreille
Spokane
Whitman
Franklin
Walla WallaColumbia
Garfield
Asotin
5-10 Years Capacity
Yakima
Benton
2002 capacity numbers indicated that 89% of the remaining capacity was at landfills with greater than 10 years to closure. Fourteen of the 18 operating MSW landfills are publicly owned with 13% of the remaining capacity (23.5 million tons). About 87% of the remaining permitted capacity (156 million tons) is at the four privately-owned facilities, compared to 73% in 1993. The majority of the capacity, about 75% of the total statewide capacity, is at the privately owned Roosevelt Regional Landfill in Klickitat County. Another 12% of the statewide total capacity is at newly constructed, privately owned landfill in Pierce County, 6% at the publicly owned Cedar Hills landfill in King County, with the remaining 7% of capacity spread among the remaining 15 landfills in the state (see Figure 6.7).
Solid Waste in Washington State --Eleventh Annual Status Report 107
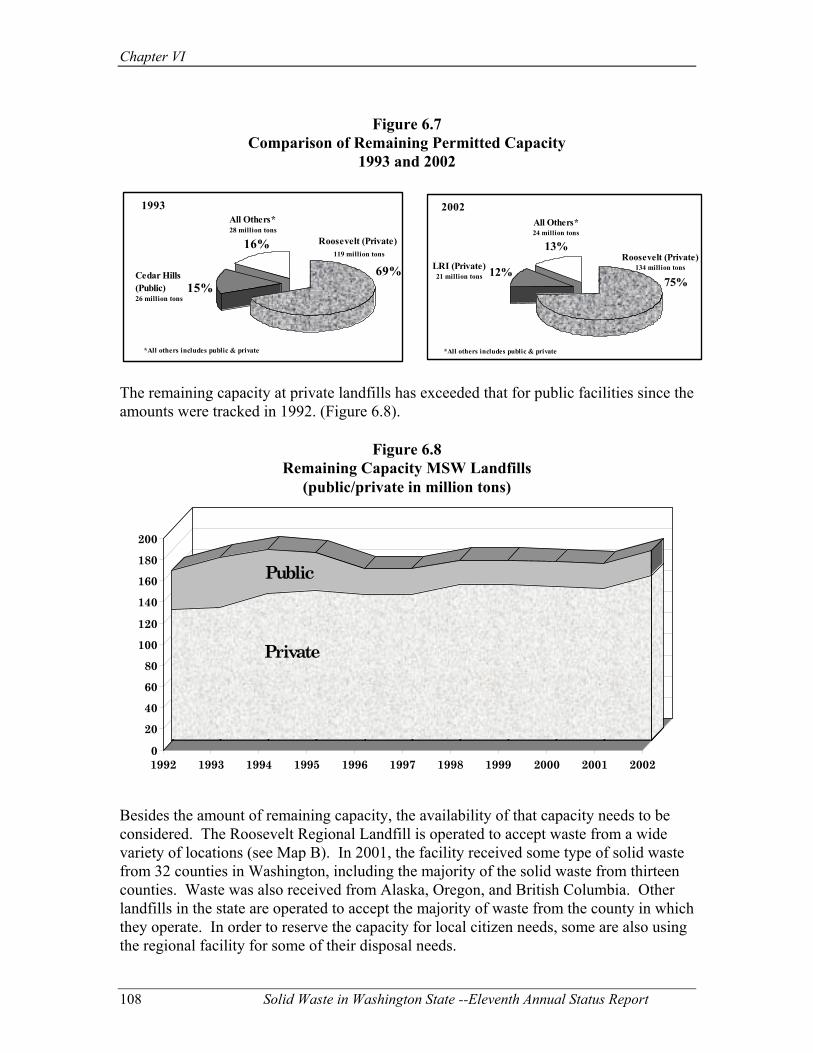
Chapter VI
Figure 6.7
Comparison of Remaining Permitted Capacity 1993 and 2002
69%15%
16%
All Others*28 million tons
Cedar Hills (Public) 26 million tons
Roosevelt (Private) 119 million tons
*All others includes public & private
1993
12%
13%
75%
All Others*24 million tons
LRI (Private)21 million tons
Roosevelt (Private) 134 million tons
*All others includes public & private
2002
The remaining capacity at private landfills has exceeded that for public facilities since the amounts were tracked in 1992. (Figure 6.8).
Figure 6.8 Remaining Capacity MSW Landfills
(public/private in million tons)
0
20406080
100120
140160180200
1992 1993 1994 1995 1996 1997 1998 1999 2000 2001 2002
Private
Public
Besides the amount of remaining capacity, the availability of that capacity needs to be considered. The Roosevelt Regional Landfill is operated to accept waste from a wide variety of locations (see Map B). In 2001, the facility received some type of solid waste from 32 counties in Washington, including the majority of the solid waste from thirteen counties. Waste was also received from Alaska, Oregon, and British Columbia. Other landfills in the state are operated to accept the majority of waste from the county in which they operate. In order to reserve the capacity for local citizen needs, some are also using the regional facility for some of their disposal needs.
108 Solid Waste in Washington State --Eleventh Annual Status Report
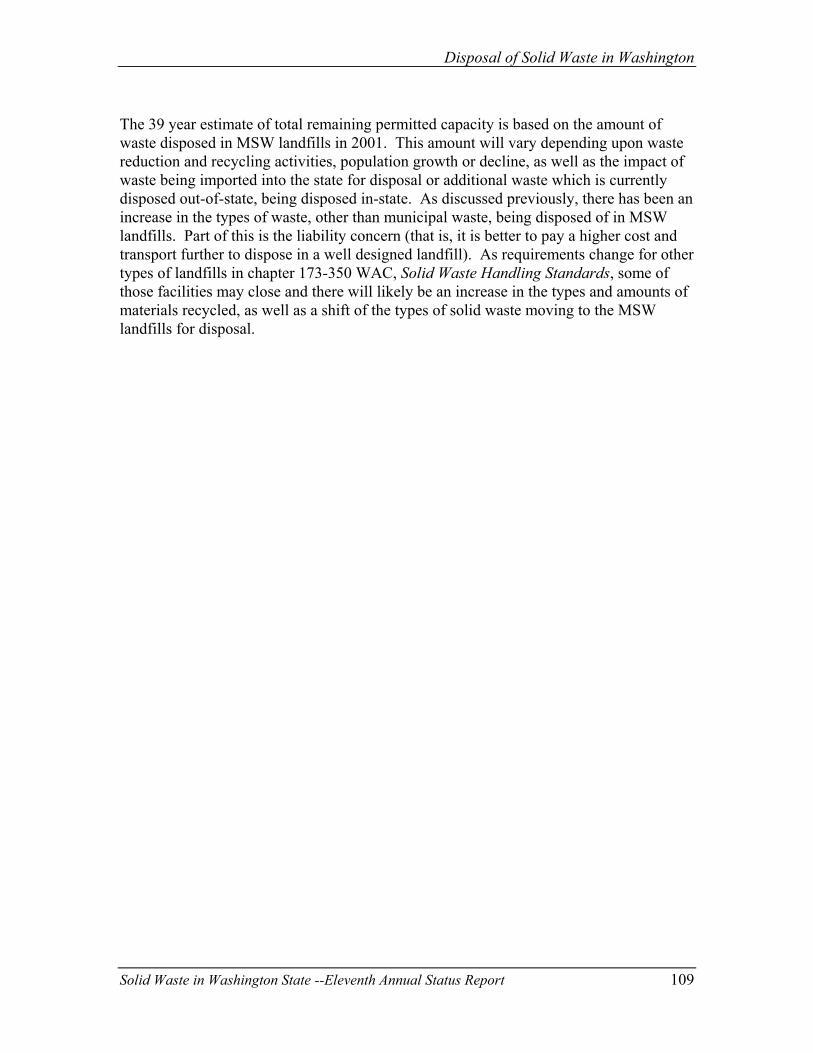
Disposal of Solid Waste in Washington
The 39 year estimate of total remaining permitted capacity is based on the amount of waste disposed in MSW landfills in 2001. This amount will vary depending upon waste reduction and recycling activities, population growth or decline, as well as the impact of waste being imported into the state for disposal or additional waste which is currently disposed out-of-state, being disposed in-state. As discussed previously, there has been an increase in the types of waste, other than municipal waste, being disposed of in MSW landfills. Part of this is the liability concern (that is, it is better to pay a higher cost and transport further to dispose in a well designed landfill). As requirements change for other types of landfills in chapter 173-350 WAC, Solid Waste Handling Standards, some of those facilities may close and there will likely be an increase in the types and amounts of materials recycled, as well as a shift of the types of solid waste moving to the MSW landfills for disposal.
Solid Waste in Washington State --Eleventh Annual Status Report 109


Moderate Risk Waste Collection System
FLAMMABLE
3CORROSIVE
8
Chapter VII. Moderate Risk Waste Collection System
Solid Waste in Wash
The term “Moderate Risk Waste” was created by revisions to chapter 70.105 RCW, Hazardous Waste Management. MRW is a combination of household hazardous waste (HHW) and conditionally exempt small quantity generator (CESQG) waste. HHW is considered waste that was generated in the home, while CESQG is small quantities of business or non-household waste. Both HHW and CESQG waste are exempt from
hazardous waste regulations.
Total MRW cpounds.
The average a
all householdsfixed facility
The counties
were Yakima, The counties
Housing Unit Cowlitz, and M
The counties
participation facilities werJefferson, Is
The counties
most MRW pe
MRW collections started in the early 1980s primarily as HHW-only events, also known as “round-ups.” These events usually transpired once or twice a year. In the late 1980s permanent collection facilities, now known as fixed facilities, began to replace the collection events in order to fulfill the need for year-round collection. These efforts resulted in a larger number of customers served, decreased costs, and increased reuse and recycling of MRW. HHW has been the primary focus of MRW collection
Efforts are beginnifacilities. Currentl Chapter 70.105D Rfor a large part of tplanning and implein each local jurisd By 1991, all local glocal MRW plan arMRW Enforcemen
MRW FACTOIDS ollection in 2001 was over 28 million
mount of HHW disposed by the 6% of that used a HHW collection event or was 103 pounds.
that had the most SQG waste per capita Kittitas, Grays Harbor, and Asotin.
that collected the most used oil per were Adams, King, Stevens, Franklin, ason.
that had the largest percentage of per housing unit at HHW events or e Grays Harbor, Spokane, Benton, land, Asotin, Walla Walla, and Thurston.
that properly disposed or recycled the r capita were Cowlitz, Kittitas, Mason,
ington State --Eleventh Annual Status Report 111
programs until recently. ng to produce an increase in the collection of CESQG waste at y there are twenty public MRW programs that collect CESQG waste.
CW, Hazardous Waste Cleanup – Model Toxics Control Act provides he funding for public MRW programs. Funds are used to meet the mentation requirements for local hazardous waste (MRW) programs iction.
overnments had submitted MRW plans. Aspects included in every e CESQG Technical & Disposal Assistance, MRW Public Education, t and HHW Collection.

Chapter VII
Annual Reporting and Accuracy of Data Collection Local programs are required to submit MRW report forms annually. For the past few years, the Solid Waste & Financial Assistance Program (SW&FAP) has requested annual reports be received by March for previous calendar year collections. The information received from local programs through the MRW annual reports provides data on MRW infrastructure, collection trends, costs, waste types received by collection events and fixed facilities, and the final disposition of MRW. This data contained here is specifically designed to be useful to those who operate or work MRW programs within Washington State. Although SW&FAP has created and does circulate a standard reporting form to all MRW programs, the reported data can vary depending on a program’s collection process, how the data is reported, and how the reported data is interpreted. For the 2001 reporting year a few programs failed to submit the required annual reports. In addition, not every program reported all the required information. Data not received for 2001 was replaced with a flat line data entry from the year 2000 data to maintain county, regional, and state estimates. This report will note key areas where there is unusual data or anomalies.
Year 2001 Data This year’s report focuses on year 2001 data with some comparisons to the data published in last year’s report. In an attempt to provide useful information for individual programs, it was determined that data would be presented in categories by county size. Figure 7.1 and Table 7.1 indicates a distinction between counties with a population of less than 50 thousand, 50 thousand to 100 thousand, and populations greater than 100 thousand.
112 Solid Waste in Washington State --Eleventh Annual Status Report

Moderate Risk Waste Collection System
Figure 7.1 Percent of State Population by County Size
8%
82%
10%
<50K 50K-100K >100KCounty Size
Table 7.1 Individual County Population by Size
<50K 50K-100K >100K Adams 16,600 Chelan 67,100 Benton 144,800
Asotin* 23,100 Clallam 64,454 Clark 352,600
Douglas 32,800 Cowlitz* 97,700 King* 1,190,200
Ferry 7,300 Grant 75,900 Kitsap 233,400
Franklin 50,400 Grays H 68,500 Pierce 713,400
Jefferson 26,446 Island 72,400 Skagit 104,100
Kittitas 34,000 Lewis 69,500 Snohomish 618,600
Klickitat 19,300 Walla Walla* 59,300 Spokane 422,400
Lincoln 10,200 50K-100K total
575,854 Thurston 210,200
Mason 49,600 Whatcom 170,600
Okanogan 39,700 Yakima 224,500
Pacific 21,000 Seattle SWU 568,100
Pend Oreille 11,800 >100K total 4,950,729
San Juan 14,400
Skamania 9,900
Stevens 40,300
Whitman 40,300
<50K total 443,664
Populations were combined: Garfield w/ Asotin; Wahkiakum w/ Cowlitz; Columbia w/ Walla Walla
King excludes Seattle Seattle SWU is Seattle only
In Washington there are 42 programs that manage MRW. All programs are required to provide individual MRW reports. These programs include all 39 counties. King County generates four reports: King County Waste Mobile and Used Oil Collection System, Seattle Solid Waste Utility (HHW), Port of Seattle (HHW) and Seattle City Light (CESQG). King County data is segregated from Seattle data in the form of Seattle Solid Waste Utility, Port of
Solid Waste in Washington State --Eleventh Annual Status Report 113
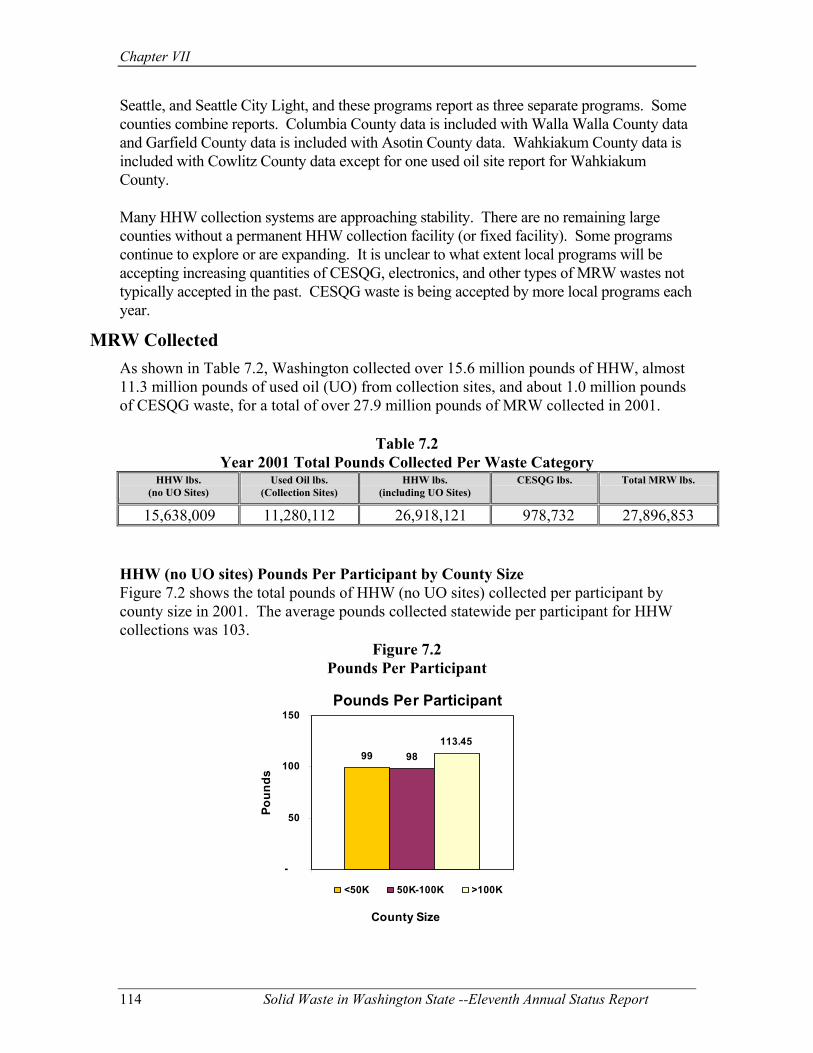
Chapter VII
Seattle, and Seattle City Light, and these programs report as three separate programs. Some counties combine reports. Columbia County data is included with Walla Walla County data and Garfield County data is included with Asotin County data. Wahkiakum County data is included with Cowlitz County data except for one used oil site report for Wahkiakum County. Many HHW collection systems are approaching stability. There are no remaining large counties without a permanent HHW collection facility (or fixed facility). Some programs continue to explore or are expanding. It is unclear to what extent local programs will be accepting increasing quantities of CESQG, electronics, and other types of MRW wastes not typically accepted in the past. CESQG waste is being accepted by more local programs each year.
MRW Collected As shown in Table 7.2, Washington collected over 15.6 million pounds of HHW, almost 11.3 million pounds of used oil (UO) from collection sites, and about 1.0 million pounds of CESQG waste, for a total of over 27.9 million pounds of MRW collected in 2001.
Table 7.2 Year 2001 Total Pounds Collected Per Waste Category
HHW lbs. (no UO Sites)
Used Oil lbs. (Collection Sites)
HHW lbs. (including UO Sites)
CESQG lbs. Total MRW lbs.
15,638,009 11,280,112 26,918,121 978,732 27,896,853
HHW (no UO sites) Pounds Per Participant by County Size Figure 7.2 shows the total pounds of HHW (no UO sites) collected per participant by county size in 2001. The average pounds collected statewide per participant for HHW collections was 103.
Figure 7.2 Pounds Per Participant
Pounds Per Participant
99 98113.45
-
50
100
150
County Size
Poun
ds
<50K 50K-100K >100K
114 Solid Waste in Washington State --Eleventh Annual Status Report

Moderate Risk Waste Collection System
The totals in Table 7.2 reflect a significant increase from an estimated 19.8 million pounds of MRW collected in 2000. This increase as shown in Table 7.3 is because of increased collection of HHW, principally used oil, paints and lead acid batteries.
Table 7.3 Total Pounds per Waste Category for Years 1998, 1999, 2000, 2001
Collection Year HHW lbs. (no UO Sites)
Used Oil lbs. (Collection Sites)
CESQG lbs. Total MRW lbs.
1998 ~9.6M ~9.2 ~500K ~19.3M 1999 ~9.9M ~9.3M ~637K ~20.4M
2000
~10.5M
~8.3M
~1.1M
~19.8M
2001 15.6M 11.3M 1.0M 27.9M
Household Hazardous Waste As shown in Table 7.4, the dominant types of HHW collected in 2001 were Lead Acid Batteries, latex and oil-based paint, non-contaminated used oil, and flammable liquids. These specific waste types accounted for 90% of the estimated 15.8 million pounds of HHW collected in 2001. These are the same top five HHW types as in 1998, 1999 and 2000.
Table 7.4 HHW Dominant Waste Types Collected in 2001
Waste Type Total Lbs. Lead Acid Batteries 5,467,759 Latex Paint 2,936,810 Oil Based Paint 2,521,531 Oil Non-contaminated 1,662,269 Flammable Liquids 1,591,521
Total 14,179,890
Solid Waste in Washington State --Eleventh Annual Status Report 115

Chapter VII
Table 7.5 shows the top five counties with the highest collections of HHW in pounds per capita (not participant) for 1999, 2000, 2001.
Table 7.5 High Collections of HHW (no Used Oil Sites) Pounds Per Capita by County in 1999-2001
HHW 1999 HHW 2000 HHW 2001 County Size Lbs./Capita County Size Lbs./Capita County Size Lbs./Capita Skamania <50K 4.14 Klickitat <50K 5.96 Cowlitz 50K-
100K 9.46
Yakima <100K 4.00 Pend Oreille >50K 4.78 Pend Oreille <50K 7.16 Kittitas <50K 3.97 Benton <100K 3.97 Mason <50K 6.26 Lewis 50K-100K 3.62 Yakima >100K 3.82 King >100K 4.65 Klickitat >50K 3.02 Kittitas <50K 3.61 Whatcom >100K 4.62
Conditionally Exempt Small Quantity Generator Waste There are twenty local MRW programs that collect CESQG waste from the public. Counties that sponsor CESQG waste collections are Asotin, Benton, Clallam, Clark, Cowlitz, Douglas, Grant, Grays Harbor, Island, Jefferson, Kitsap, Kittitas, San Juan, Skagit, Snohomish, Thurston, Whatcom, and Yakima. Also Included in CESQG waste totals for year 2001 are data from Philip Services. Philip Services primarily serves CESQG’s in three counties: King, Pierce and Clark.
As shown in Table 7.6 the dominant 20 types of CESQG waste collected in 2001 were non-contaminated oil, oil based paint and flammable liquids. These 3 specific waste types accounted for 65% of the 1.2 million pounds of CESQG waste collected in 2001.
Table 7.6 CESQG by Waste Type Collected in 2001(top 20 types)
Waste Type Total lbs. CESQG Oil Non-Contaminated 291,022
Oil Based Paint 140,807 Flammable Liquids 210,847
Latex Paint 54,460 Antifreeze 82,336
Lead Acid Batteries 70,863 Oil Filters, crushed 24,575
Bases 19,815 Oil, contaminated 6,457
Acids 16,625 Flammable Liquids 12,552
Other Dangerous Waste 11,205 Pesticide/Poison Liq 7,911
Oil, PCB 6,781 Flam. Liq. aerosols 5,728 Dry Cell Batteries 5,920
Oxidizers 2,813 Chlorinated Solvents 1,491 Pesticide/Poison Sol 1,651
N/NIMH/LITH Batteries 2,070 All other types 3,803
TOTALS 978,732
116 Solid Waste in Washington State --Eleventh Annual Status Report

Moderate Risk Waste Collection System
Used Oil Sites In 2001, reported used oil collection sites yielded 11,280,112 pounds of used oil. Used oil collection by county size showed variability in pounds per capita. For example, Stevens County with a population of 40,300 collected 160,543 pounds of used oil from 12 sites (about 4.0 lbs/capita), while Clark County with a population of 352,600 collected 535,619 pounds of used oil from 11 sites (or about 1.5 lbs/capita). See Table 7.7 for the six highest collections in pounds per capita by county size for 1999, 2000 and 2001.
Table 7.7 High Collection Counties, Used-Oil Sites Pounds Per Capita by County Size
Used Oil Sites - 1999 Used Oil Sites - 2000 Used Oil Sites - 2001 County Size Lbs./Capita County Size Lbs./Capita County Size Lbs./Capit
a San Juan <50K 6.1 Stevens <50K 3.9 Mason <50K 4.0 Asotin <50K 4.2 Cowlitz 50K-100K 3.7 Stevens <50K 4.0 Stevens <50K 4.0 Pacific <50K 3.6 King >100K 3.9 Klickitat <50K 3.7 Douglas <50K 2.9 Cowlitz 50K-100K 3.5 Cowlitz 50K-100K 3.1 Lewis 50K-100K 2.8 Skamania <50K 3.2 Jefferson <50K 3.0 Franklin <50K 2.7 San Juan <50K 3.0
Statewide Level of Service The US Census Bureau reports that as of 2001 there were an estimated 2,511,054 Housing Units29 in Washington State. MRW Annual Reports revealed there were 150,795 participants in HHW collection in 2001 excluding numbers for Adams, Klickitat, Pend Oreille and Skagit counties because this information was not provided. The actual number of households served is much larger due to the fact that most used oil sites do not record or report numbers of participants (Spokane is the exception). Because some participants that are counted at events or by facilities bring HHW from multiple households, the number of households served can be estimated by adding ten percent to the participant values for an estimated 165,875 households served in 2001. This number represents 6.6% of all households in Washington State. This is a decrease from 2000 when an estimated 7.8% of Washington households were served.
Solid Waste in Washington State --Eleventh Annual Status Report 117
29 This information was downloaded from Website http://quickfacts.census.gov/hunits/states/53cty.html.

Chapter VII
Table 7.8 shows participant levels and amounts of HHW and total MRW collected by county.
Table 7.8 Various Data by County
COUNTY HHW lbs. w/o (no UO sites)
UO lbs.1 CESQG lbs. MRW lbs. County
H.U.2 MRW lbs./H.U.
HHW Participants %Partic.
HHW Cost/ Participant
Adams - 82,162 - 82,162 5842 14.06 N.R. N.R3. N.A.4 Asotin 72,991 - 5,439 78,430 10476 7.49 860 0.08 61.45 Benton 297,138 63,470 17,043 377,651 56971 6.63 6116 0.11 29.84 Chelan 50,078 52,910 5,303 108,291 30683 3.53 735 0.02 85.5 Clallam 71,276 153,321 6,520 231,117 30927 7.47 799 0.03 70.55 Clark 1,131,087 535,619 - 1,666,706 137161 12.15 3498 0.03 84.67 Cowlitz 924,363 342,687 14,506 1,281,556 40999 31.26 1669 0.04 89.25 Douglas 38,071 45,510 1,159 84,740 13077 6.48 540 0.04 55.54 Ferry 1,347 3,700 - 5,047 3832 1.32 26 0.01 72.92 Franklin 8,892 134,438 - 143,330 16457 8.71 150 0.01 132.50 Grant 83,802 9,220 1,007 94,029 29545 3.18 534 0.02 86.16 Grays H 90,820 - 19,998 110,818 32623 3.40 10776 0.33 12.63 Island 248,777 145,499 9,465 403,741 32959 12.25 3304 0.10 49.14 Jefferson 32,870 54,434 5,923 93,227 14424 6.46 1495 0.10 56.08 Seattle 1,062,104 222,817 - 1,284,921 273342 4.70 13242 0.05 45.37 King 5,530,471 4,723,954 192,733 10,447,158 480251 21.75 21012 0.04 89.87 Kitsap 404,899 371,310 40,030 816,239 93731 8.71 4320 0.05 185.09 Kittitas 86,265 - 103,055 189,320 16728 11.32 204 0.01 54.65 Klickitat 70,605 51,378 - 121,983 8757 13.93 N.R. N.R. N.A. Lewis 133,245 174,344 - 307,589 30041 10.24 1062 0.04 71.52 Lincoln - - - - 5325 - 150 0.03 73.33 Mason 310,474 199,127 - 509,601 25875 19.69 746 0.03 78.37 Okanogan 65,585 31,265 - 96,850 19274 5.02 175 0.01 130.47 Pacific 50,088 - 11,911 61,999 14106 4.40 296 0.02 136.76 Pend Oreille 84,502 15,614 - 100,116 8729 11.47 N.R. N.R. N.A. Pierce 379,988 353,054 - 733,042 282156 2.60 9294 0.03 35.00 San Juan 19,338 43,364 4,844 67,546 10099 6.69 150 0.01 135.75 Skagit 246,631 169,090 15,174 430,895 43346 9.94 N.R. N.R, N.A. Skamania 22,265 31,968 - 54,233 5254 10.32 128 0.02 N.A. Snohomish 1,564,211 1,366,025 79,545 3,009,781 241463 12.46 11657 0.05 44.87 Spokane* 443,600 682,280 - 1,125,880 176853 6.37 37251 0.21 17.29 Stevens 58,751 160,543 - 219,294 17829 12.30 520 0.03 58.42 Thurston 348,345 390,587 11,669 750,601 87821 8.55 6673 0.08 39.11 Walla Walla 82,485 72,268 - 154,753 23236 6.66 1796 0.08 73.61 Whatcom 788,001 74,622 55,127 917,750 75603 12.14 4481 0.06 44.63 Whitman 48,084 18,108 - 66,192 16740 3.95 520 0.03 84.91 Yakima 895,489 532,482 436,465 1,864,436 80028 23.30 4518 0.06 57.61 Statewide 15,638,009 11,280,112 978,732 27,896,853 2,492,563 148,697 Footnotes: 1 US lbs - used oil collected at specific used oil sits 2 H.U. Housing Units equals number of households taken from Office of Financial Management, 2001 Data Book 3 NR - Not Reported 4 NA - Not applicable because data not reported
118 Solid Waste in Washington State --Eleventh Annual Status Report
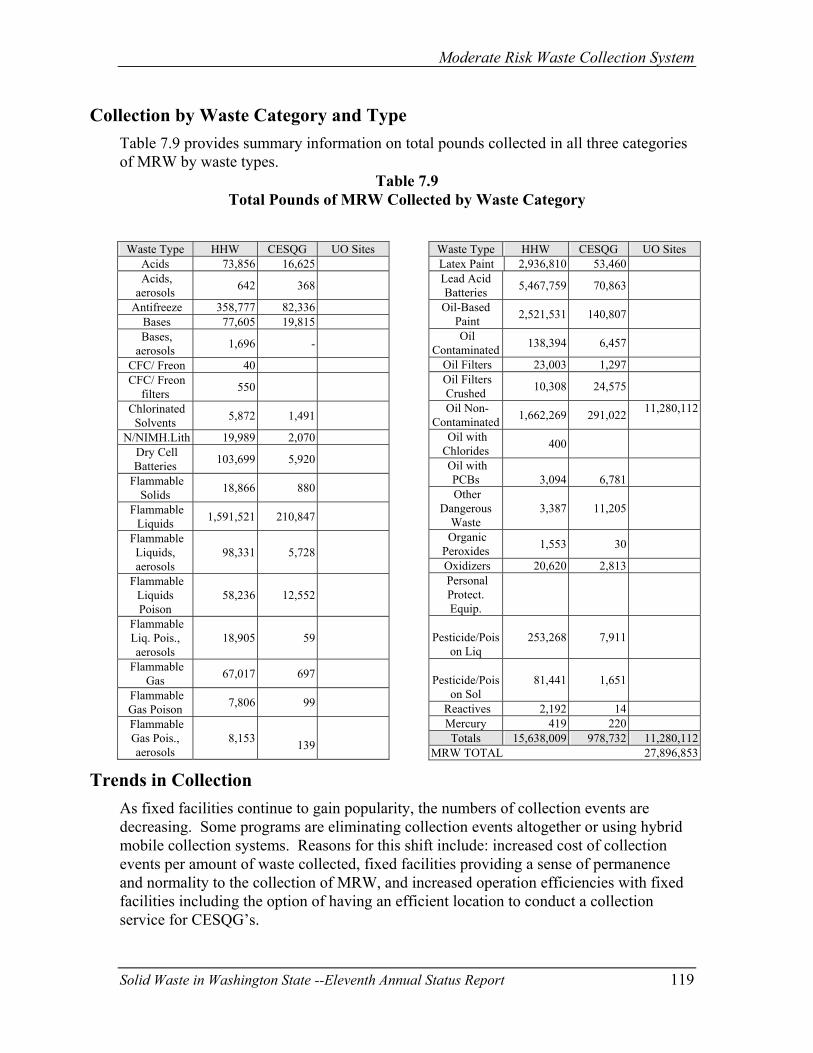
Moderate Risk Waste Collection System
Collection by Waste Category and Type Table 7.9 provides summary information on total pounds collected in all three categories of MRW by waste types.
Table 7.9 Total Pounds of MRW Collected by Waste Category
Waste Type HHW CESQG UO Sites Acids 73,856 16,625
Acids, aerosols 642 368
Antifreeze 358,777 82,336 Bases 77,605 19,815 Bases, aerosols 1,696 -
CFC/ Freon 40 CFC/ Freon
filters 550
Chlorinated Solvents 5,872 1,491
N/NIMH.Lith 19,989 2,070 Dry Cell Batteries 103,699 5,920
Flammable Solids 18,866 880
Flammable Liquids 1,591,521 210,847
Flammable Liquids, aerosols
98,331 5,728
Flammable Liquids Poison
58,236 12,552
Flammable Liq. Pois., aerosols
18,905 59
Flammable Gas 67,017 697
Flammable Gas Poison 7,806 99
Flammable Gas Pois., aerosols
8,153 139
Waste Type HHW CESQG UO Sites Latex Paint 2,936,810 53,460 Lead Acid Batteries 5,467,759 70,863
Oil-Based Paint 2,521,531 140,807
Oil Contaminated 138,394 6,457
Oil Filters 23,003 1,297 Oil Filters
Crushed 10,308 24,575
Oil Non-Contaminated 1,662,269 291,022 11,280,112
Oil with Chlorides 400
Oil with PCBs 3,094
6,781
Other Dangerous
Waste 3,387 11,205
Organic Peroxides 1,553 30
Oxidizers 20,620 2,813 Personal Protect. Equip.
Pesticide/Pois
on Liq 253,268 7,911
Pesticide/Pois
on Sol 81,441 1,651
Reactives 2,192 14 Mercury 419 220 Totals 15,638,009 978,732 11,280,112
MRW TOTAL 27,896,853
Trends in Collection As fixed facilities continue to gain popularity, the numbers of collection events are decreasing. Some programs are eliminating collection events altogether or using hybrid mobile collection systems. Reasons for this shift include: increased cost of collection events per amount of waste collected, fixed facilities providing a sense of permanence and normality to the collection of MRW, and increased operation efficiencies with fixed facilities including the option of having an efficient location to conduct a collection service for CESQG’s. Solid Waste in Washington State --Eleventh Annual Status Report 119

Chapter VII
Mercury Waste Streams and Other Waste Streams MRW collection programs are well established statewide. Many of these programs are exploring management of various other components of municipal solid waste. Mercury-containing lamps and electronic wastes are two of these emerging waste types. There is a need to pay attention to the collection of mercury waste streams. Fluorescent and high intensity lamps contain small amounts of mercury. There will be an estimated 35 tons of mercury discharged into the atmosphere from the 550 million lamps currently in use by Americans (Greskovich 1997). Used electronics are also of concern. Components in a number of electrical and electronic products are known to contain one or more of the following substances: mercury, lead; cadmium; embedded batteries; and polychlorinated biphenyls (PCBs). As technology continues to lead to better electronic products, and as more people become financially able to obtain these popular commodities, disposal of the leftovers as well as their components becomes a concern for Ecology and local solid waste managers. For example, in the European Union an estimated four percent of their municipal solid waste stream is electronics, other electrical devices and appliances as of 1999. By the year 2010, predictions for this waste sub-stream will double (Ecology 1999).
120 Solid Waste in Washington State --Eleventh Annual Status Report

Moderate Risk Waste Collection System
References - Chapter 7
Greskovich, James A. 1997. Recycling waste fluorescent and HID lamps containing mercury. Located at: http://www.facilitiesnet.com/NS/NS3a7ae.html. Accessed 22 August 2000. Solid Waste and Financial Assistance Program. 1999. Solid Waste in Washington State, Eighth Annual Status Report. Publication #99-509. State of Washington. 2000. Office of Financial Management. Forecast of the State Population by Age and Sex: 1990 to 2020 http://www.ofm.wa.gov/demographics.htm. Accessed 1 October 2000. U.S. Census Bureau. 2000. Geographic Area: Washington State. Population by County. Located at:
http://www.quickfacts.census.gov/hunits/states/states/53cty.html. Accessed 27 September 2001.
U.S. Census Bureau. 2000. Housing Unit Count. Geographic Area: Washington by County. Located at:
http://www.quickfacts.census.gov/hunits/states/states/53cty.html. Accessed 27 September 2001.
U.S. Census Bureau. 2000. Profile of General Demographic Characteristics. Geographic Area: Seattle city, Washington. Located at:
http://www.factfinder.census.g…_lang=en_vt_name=DEC_2000_SF1_U_DP1_geo_id=16000US5363000.htm. Accessed 9 November 2001.
Solid Waste in Washington State --Eleventh Annual Status Report 121

APPENDIX A STATE MAP WITH COUNTY NAMES


State Map with County Names
A-1


APPENDIX B WASHINGTON STATE RECYCLING RATE
1986 - 2001


Table B.1 Washington State Recycling Rate 1986 to 2002
33%
15%
28%27%
34%
38% 38%39% 38%
33%
35%
33%
35%
37%
35%
0%
5%
10%
15%
20%
25%
30%
35%
40%
45%
1986 1988 1989 1990 1991 1992 1993 1994 1995 1996 1997 1998 1999 2000 2001
B-1


APPENDIX C FACILITY SPECIFIC DISPOSAL DATA FOR 2001

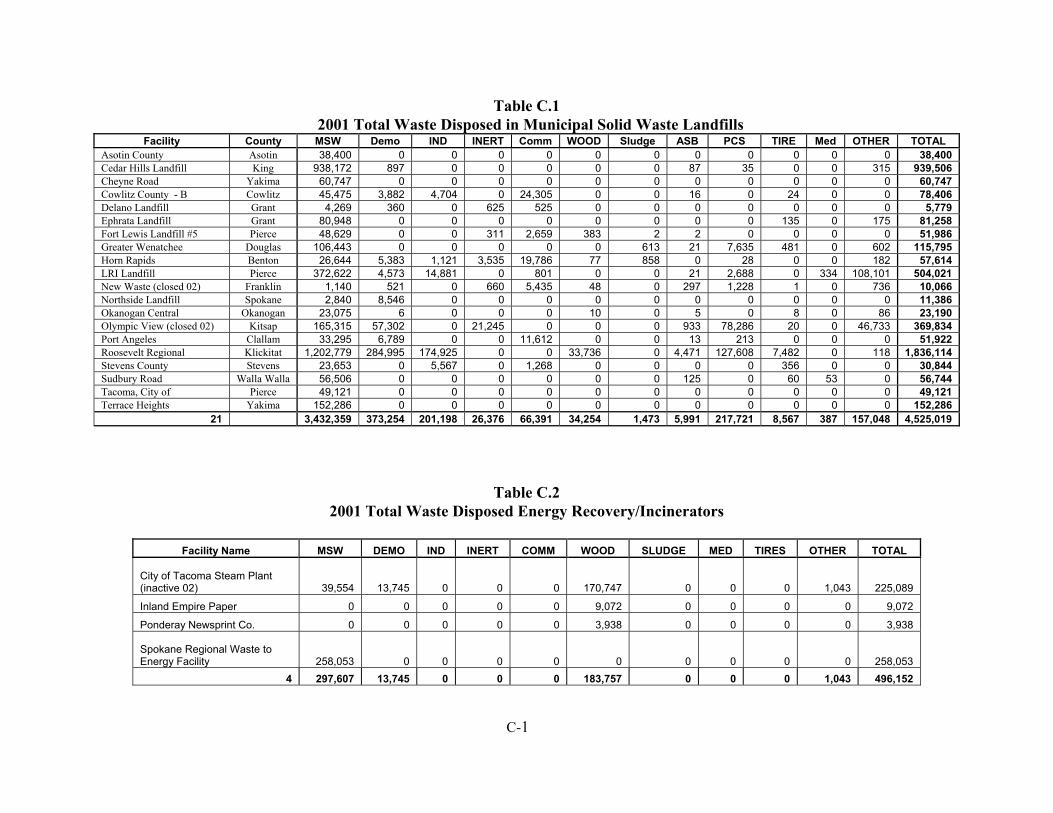
Table C.1 2001 Total Waste Disposed in Municipal Solid Waste Landfills
Facility County MSW Demo IND INERT Comm WOOD Sludge ASB PCS TIRE Med OTHER TOTAL Asotin County Asotin 38,400 0 0 0 0 0 0 0 0 0 0 0 38,400 Cedar Hills Landfill King 938,172 897 0 0 0 0 0 87 35 0 0 315 939,506 Cheyne Road Yakima 60,747 0 0 0 0 0 0 0 0 0 0 0 60,747 Cowlitz County - B Cowlitz 45,475 3,882 4,704 0 24,305 0 0 16 0 24 0 0 78,406 Delano Landfill Grant 4,269 360 0 625 525 0 0 0 0 0 0 0 5,779 Ephrata Landfill Grant 80,948 0 0 0 0 0 0 0 0 135 0 175 81,258 Fort Lewis Landfill #5 Pierce 48,629 0 0 311 2,659 383 2 2 0 0 0 0 51,986 Greater Wenatchee Douglas 106,443 0 0 0 0 0 613 21 7,635 481 0 602 115,795 Horn Rapids Benton 26,644 5,383 1,121 3,535 19,786 77 858 0 28 0 0 182 57,614 LRI Landfill Pierce 372,622 4,573 14,881 0 801 0 0 21 2,688 0 334 108,101 504,021 New Waste (closed 02) Franklin 1,140 521 0 660 5,435 48 0 297 1,228 1 0 736 10,066 Northside Landfill Spokane 2,840 8,546 0 0 0 0 0 0 0 0 0 0 11,386 Okanogan Central Okanogan 23,075 6 0 0 0 10 0 5 0 8 0 86 23,190 Olympic View (closed 02) Kitsap 165,315 57,302 0 21,245 0 0 0 933 78,286 20 0 46,733 369,834 Port Angeles Clallam 33,295 6,789 0 0 11,612 0 0 13 213 0 0 0 51,922 Roosevelt Regional Klickitat 1,202,779 284,995 174,925 0 0 33,736 0 4,471 127,608 7,482 0 118 1,836,114 Stevens County Stevens 23,653 0 5,567 0 1,268 0 0 0 0 356 0 0 30,844 Sudbury Road Walla Walla 56,506 0 0 0 0 0 0 125 0 60 53 0 56,744 Tacoma, City of Pierce 49,121 0 0 0 0 0 0 0 0 0 0 0 49,121 Terrace Heights Yakima 152,286 0 0 0 0 0 0 0 0 0 0 0 152,286
21 3,432,359 373,254 201,198 26,376 66,391 34,254 1,473 5,991 217,721 8,567 387 157,048 4,525,019
Table C.2 2001 Total Waste Disposed Energy Recovery/Incinerators
Facility Name MSW DEMO IND INERT COMM WOOD SLUDGE MED TIRES OTHER TOTAL
City of Tacoma Steam Plant (inactive 02) 39,554 13,745 0 0 0 170,747 0 0 0 1,043 225,089
Inland Empire Paper 0 0 0 0 0 9,072 0 0 0 0 9,072
Ponderay Newsprint Co. 0 0 0 0 0 3,938 0 0 0 0 3,938
Spokane Regional Waste to Energy Facility 258,053 0 0 0 0 0 0 0 0 0 258,053
4 297,607 13,745 0 0 0 183,757 0 0 0 1,043 496,152
C-1

Table C.3 2001 Total Waste Disposed Inert-Demolition Waste Landfills
Facility Name DEMO IND INERT COMM WOOD SLUDGE ASB PCS TIRES OTHER TOTALAdams Street Inert Waste Disposal Site 0 0 1,461 0 0 0 0 0 0 0 1,461ALCOA Inert Waste/Demolition Landfill 0 0 2,093 0 0 0 3 0 0 0 2,096Anderson Demolition Site 29,139 0 0 0 0 0 0 1,037 0 2,646 32,822Asotin County I & D Landfill 2,394 0 0 0 0 0 0 0 0 0 2,394Asphalt & Gravel Products, Inc. Demo Landfill 17,299 0 376 0 0 0 0 0 0 0 17,675Box Canyon Site 0 0 12,225 0 0 0 0 0 0 0 12,225Busy Bee Landfill 6,858 0 5,891 0 0 0 0 0 0 0 12,749Caton Inert & Demo Landfill 8,995 0 533 0 167 0 0 0 0 0 9,695Central Pre-Mix Site (Fort Wright) 0 0 10,000 0 0 0 0 0 0 0 10,000Centralia Mining CDL 0 0 400 0 0 0 0 0 765 0 1,165Chester Landfill 34,051 0 4,468 0 0 0 0 0 0 0 38,519City of Kennewick Inert/Demo Landfill 2,348 0 1,695 0 0 0 0 0 0 0 4,043County Construction Recyclers, Inc. 28,936 0 1,725 0 0 0 0 0 0 0 30,661Coupeville Demolition LF 478 0 204 0 0 0 0 0 0 0 682Douglas County Lux Pit (Nile-99.1) 320 0 850 0 0 0 0 0 0 0 1,170Fillion Inert/Demo Site 2,300 0 0 0 0 0 0 0 0 0 2,300Humbert Demolition Landfill 0 0 4,032 0 0 0 0 0 0 0 4,032Indian Island CDL Landfill 36 0 0 0 0 0 0 0 0 0 36Inland Asphalt Landfill 0 0 50,000 0 0 0 0 0 0 0 50,000Inland Crestline Recycling 0 0 51,250 0 0 0 0 0 0 0 51,250Kaiser-Mead Inert & Demolition Site 100 0 806 0 0 0 0 0 0 0 906Kittitas County Inert & Demo Landfill 7,766 0 0 0 0 0 0 0 0 0 7,766Marine View North, LLC 0 0 34,295 0 0 0 0 0 0 0 34,295McChord Inert Waste Landfill 0 0 1,363 0 0 0 0 0 0 0 1,363Pipkin/Handley Landfill 0 0 7,889 0 0 0 0 0 0 0 7,889Prosser Inert/Demo Landfill 0 0 325 0 0 0 0 0 0 0 325Rinker Materials 41,289 0 0 0 0 0 0 318,068 0 0 359,357Steve Clark Demolition Waste Landfill 45 0 0 0 0 0 0 0 0 0 45Whitman College Site 28,277 0 0 0 0 0 0 0 0 0 28,277Yakima Training Center Inert/Demo Landfill 0 0 2,875 0 0 0 0 0 0 0 2,875 210,631 0 194,756 0 167 0 3 319,105 765 2,646 728,073
C-2

Table C.4
2001 Total Waste Disposed Limited Purpose/Special Use Facilities
Facility Name DEMO IND INERT COMM WOOD SLUDGE ASB PCS TIRES OTHER TOTAL BP Cherry Point Refinery 0 2,873 0 0 0 0 0 535 0 0 3,408 Dickson - CDL - So 50th & Tyler St 0 0 18,788 0 0 0 0 0 0 0 18,788 Dickson -East 48th & Waller Road Fill Site 0 0 150,118 0 0 0 0 0 0 0 150,118 Graham Road Recycling & Disp 46,228 2,853 19,173 0 1,429 0 1,242 11,996 41 20,800 103,762 Intalco Aluminum Corp 182 4,016 1,526 0 0 0 0 600 0 0 6,324 Kettle Falls Generating Station Wood Ash Landfill 0 26,959 0 0 0 0 0 0 0 0 26,959 Lady Island Limited Purpose Landfill 0 0 8,217 0 2,524 0 0 0 0 0 10,741 Lawson Limited Purpose Site 0 22,824 0 0 0 0 0 0 0 0 22,824 Port Townsend Paper 0 13,100 0 0 0 0 0 0 0 0 13,100 Rayonier Inc. (Mt. Pleasant) (closed 01) 0 979 4,755 0 2,845 0 0 0 0 1,398 9,977 Simpson Dayton Landfill 0 18,117 0 0 0 0 0 0 0 2,500 20,617 Weyerhaeuser Regional Landfill 23,004 233,393 0 0 43 0 0 91 0 0 256,531 Whitman Co. Limited Purpose Landfill & Transfer St 2,403 0 0 0 0 0 40 0 0 0 2,443
71,817 325,114 202,577 0 6,841 0 1,282 13,222 41 24,698645,59
2
Table C.5 2001 Total Waste Disposed for Woodwaste Landfills
Facility Name DEMO IND INERT COMM WOOD SLUDGE ASB PCS TIRES OTHER TOTALStafford Creek Woodwaste Landfill 31,559 0 0 0 21,739 0 0 0 0 0 53,298 31,559 0 0 0 21,739 0 0 0 0 0 53,298
C-3

Table C.6 2001 Total Waste Composted
Company County Yard
waste
Other wood waste Sawdust Biosolids
Vegetative food
waste Manure
Post consumer food waste Other TOTAL
Bailand Farms YW Composting Snohomish 17,000 0 0 0 0 8,000 0 0 25,000 Cedar Grove Composting, Inc. King 133,954 2,468 0 0 15,323 0 44 19,852 171,641 City of Cheney - Wastewater Division Spokane 2,200 1,200 0 240 0 0 0 0 3,640 City of Port Townsend Jefferson 3,741 0 0 254 0 0 0 0 3,995 Columbia Compost Columbia 149 0 0 0 0 0 0 1 150 Cowlitz County Public Works Cowlitz 1,200 3,175 0 5,680 0 0 0 0 10,055 Dykstra Composting Facility Skagit 0 0 0 0 0 0 0 758 758 GROCO King 0 7,0000 6,000 0 0 0 13,000 0H&H Wood Recyclers Clark 1,250 0 0 0 0 0 0 0 1,250 Hi Q Compost Facility Skagit 0 0 0 0 0 120 0 0 120 Hilltop Emu Ranch Kitsap 2 0 0 0 0 245 0 3,007 3,254 Johnson Agriprises Adams 0 0 0 0 0 990 0 950 1,940 LaConner, Town of WWTP Skagit 31 0 2,310 166 0 0 0 0 2,507 Lamb-Weston, Inc. Franklin 0 0 0 0 0 0 0 1,302 1,302 Langley City Water & Wastewater Services Island 250 0 90 21 0 0 0 0 361 Little Hanaford Farms Lewis 225 253 6,160 0 0 0 0 354 6,992 LRI Pierce 11,094 0241 0 00 0 11,334 0Lynden, City of WWTP Whatcom 75 2,520 4,032 507 0 0 0 0 7,134 Miller Creek Compost Facility King 0 0 0 480 0 0 0 230 710 Monroe, City of WWTP Snohomish 0 0 2,200 3,000 0 0 0 0 5,200 Natural Selection Farms, Inc. Yakima 1,300 600 0 3,000 0 1,600 0 5,552 12,052 Norcal Waste Systems of Spokane, Inc. Spokane 37,867 0 5,004 0 0 0 0 0 42,871 Pacific Topsoils Snohomish 46,107 0 0 0 0 8,336 0 21,141 75,584 Pierce County Recycling Composting & Disposal, LLC dba LRI Pierce 55,312 1,991 0 0 0 0 0 2,438 59,741 Quincy Compost Grant 1,350 45 0 0 0 0 0 0 1,395 Skagit Soils Skagit 8,975 0 0 0 0 0 0 0 8,975 Soil Life Systems, Inc Walla Walla 0 0 0 0 0 5,680 0 21,012 26,692 Soos Creek Organics, Inc. King 30,053 3,521 528 0 2,754 2,297 0 781 39,934 South Sound Soils, LLC Thurston 600 13,200 0 10,598 0 0 0 0 24,398 Thurston County Water & Waste Management Thurston 5,262 5,262 0 0 0 0 0 0 10,524 WADOC Jefferson 1 170 1 316 0 0 0 14 502 Walla Walla Compost Walla Walla 1,895 0 0 0 0 0 0 0 1,895 Washington State University Whitman 0 0 0 0 32 9,553 128 3,942 13,655 West Van Materials Recovery Facility Clark 3,071 0 0 0 0 0 0 0 3,071 Wilcox Farms, Inc. Pierce 0 12,000 0 0 0 5,086 0 0 17,086
35 362,963 46,646 27,325 30,263 18,109 41,906 172 81,334 608,719
C-4

APPENDIX D DISPOSAL DATA SUMMARIES
1992 - 2001

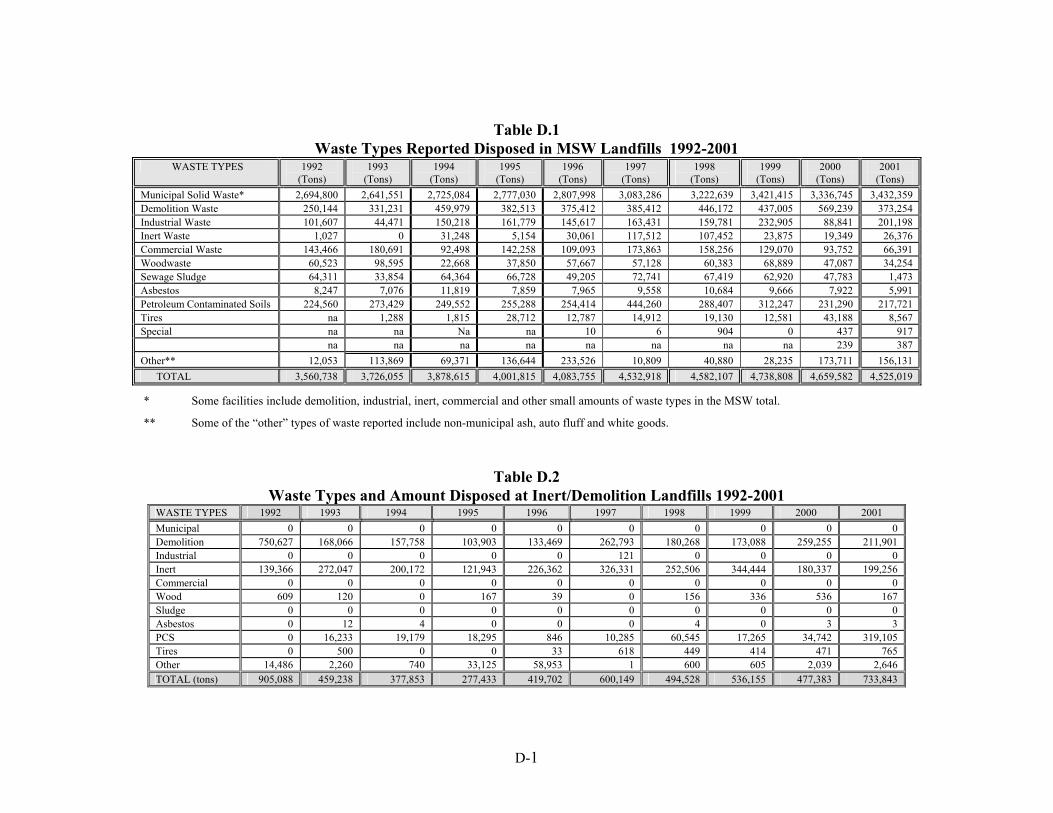
Table D.1 Waste Types Reported Disposed in MSW Landfills 1992-2001
WASTE TYPES 1992 (Tons)
1993 (Tons)
1994 (Tons)
1995 (Tons)
1996 (Tons)
1997 (Tons)
1998 (Tons)
1999 (Tons)
2000 (Tons)
2001 (Tons)
Municipal Solid Waste* 2,694,800 2,641,551 2,725,084 2,777,030 2,807,998 3,083,286 3,222,639 3,421,415 3,336,745 3,432,359Demolition Waste 250,144 331,231 459,979 382,513 375,412 385,412 446,172 437,005 569,239 373,254Industrial Waste 101,607 44,471 150,218 161,779 145,617 163,431 159,781 232,905 88,841 201,198Inert Waste 1,027 0 31,248 5,154 30,061 117,512 107,452 23,875 19,349 26,376Commercial Waste 143,466 180,691 92,498 142,258 109,093 173,863 158,256 129,070 93,752 66,391Woodwaste 60,523 98,595 22,668 37,850 57,667 57,128 60,383 68,889 47,087 34,254Sewage Sludge 64,311 33,854 64,364 66,728 49,205 72,741 67,419 62,920 47,783 1,473Asbestos 8,247 7,076 11,819 7,859 7,965 9,558 10,684 9,666 7,922 5,991Petroleum Contaminated Soils 224,560 273,429 249,552 255,288 254,414 444,260 288,407 312,247 231,290 217,721Tires na 1,288 1,815 28,712 12,787 14,912 19,130 12,581 43,188 8,567Special na na Na na 10 6 904 0 437 917 na na na na na na na na 239 387Other** 12,053 113,869 69,371 136,644 233,526 10,809 40,880 28,235 173,711 156,131 TOTAL 3,560,738 3,726,055 3,878,615 4,001,815 4,083,755 4,532,918 4,582,107 4,738,808 4,659,582 4,525,019
* Some facilities include demolition, industrial, inert, commercial and other small amounts of waste types in the MSW total.
** Some of the “other” types of waste reported include non-municipal ash, auto fluff and white goods.
Table D.2 Waste Types and Amount Disposed at Inert/Demolition Landfills 1992-2001
WASTE TYPES 1992 1993 1994 1995 1996 1997 1998 1999 2000 2001 Municipal 0 0 0 0 0 0 0 0 0 0Demolition 750,627 168,066 157,758 103,903 133,469 262,793 180,268 173,088 259,255 211,901Industrial 0 0 0 0 0 121 0 0 0 0Inert 139,366 272,047 200,172 121,943 226,362 326,331 252,506 344,444 180,337 199,256Commercial 0 0 0 0 0 0 0 0 0 0Wood 609 120 0 167 39 0 156 336 536 167Sludge 0 0 0 0 0 0 0 0 0 0Asbestos 0 12 4 0 0 0 4 0 3 3PCS 0 16,233 19,179 18,295 846 10,285 60,545 17,265 34,742 319,105Tires 0 500 0 0 33 618 449 414 471 765Other 14,486 2,260 740 33,125 58,953 1 600 605 2,039 2,646TOTAL (tons) 905,088 459,238 377,853 277,433 419,702 600,149 494,528 536,155 477,383 733,843
D-1

Table D.3
Waste Types and Amount Disposed at Limited Purpose Landfills 1992-2001 WASTE TYPES 1992 1993 1994 1995 1996 1997 1998 1999 2000 2001 Municipal 0 0 0 0 0 0 0 0 0 0 Demolition 13,698 12,894 95,568 151,230 180,529 85,916 98,072 84,140 71,203 71,817Industrial 194,689 17,680 212,008 315,930 371,496 277,419 225,779 262,021 278,224 325,114Inert 44,572 37,274 104,419 138,577 141,759 109,174 112,714 136,352 205,902 202,577Commercial 0 25,019 0 0 0 0 0 0 0 0Wood 94,541 156,261 86,088 58,628 22,660 14,589 7,700 8,853 3,205 6,841Sludge 0 0 21 0 0 2,275 0 1,103 0 0Asbestos 0 0 226 797 512 1,310 1,058 1,549 1,654 1,282PCS 0 99,360 82,279 148,932 98,221 121,066 56,407 8,837 7,159 13,222Tires 0 0 0 0 29,227 434 559 59 25 41Other 35,615 59,259 60,642 40,797 65,675 83,600 124,607 66,833 79,291 24,698TOTAL (tons) 383,115 407,747 642,251 874,116 910,078 695,783 628,896 569,747 646,662 645,592
Table D.4 Waste Types and Amount Disposed at Woodwaste Landfills 1992-2002
WASTE TYPES
1992 1993 1994 1995 1996 1997 1998 1999 2000 2001
Municipal 0 0 0 0 0 0 0 0 0 0 Demolition 57,328 20,775 0 8,600 18,780 17,718 21,313 25,121 32,182 31,559 Industrial 0 0 0 0 0 0 0 0 15,120 0 Inert 0 0 0 0 0 0 0 0 0 0 Commercial 0 0 0 0 0 0 0 0 0 0 Wood 122,381 96,708 93,310 105,080 81,886 69,498 36,777 75,668 33,452 21,739 Sludge 0 0 0 0 0 0 0 0 0 0 Asbestos 0 0 0 0 0 0 0 0 0 0 PCS 0 0 0 0 0 0 0 0 0 0 Tires 0 0 0 0 0 0 0 0 0 0 Other 1,785 4,614 3,213 2,079 2,031 8,109 1,320 1,695 622 0 TOTAL (tons) 181,494 122,097 96,523 115,759 102,697 95,325 59,410 102,484 87,552 53,298
D-2

Table D.5 Per Capita Disposed, Recycled and Generated Numbers
(pounds/person/day) Per Capita 1991 1992 1993 1994 1995 1996 1997 1998 1999 2000 2001
Disposed1 4.67 4.96 5.07 5.16 5.12 5.16 5.66 5.45 5.73 5.96 5.55Recycled 2.05 2.30 2.58 2.56 2.56 2.51 2.10 2.05 2.05 2.33 2.48Generated 6.72 7.26 7.65 7.72 7.68 7.67 7.76 7.50 7.78 8.28 8.03
Table D.6 Total Amounts of Solid Waste Disposed in Washington
DISPOSAL METHOD 1993 1994 1995 1996 1997 1998 1999 2000 2001 Municipal Solid Waste Landfills 3,726,055 3,878,615 4,001,815 4,083,755 4,532,918 4,582,107 4,738,808 4,659,582 4,525,019Incinerated Waste 431,928 421,626 397,588 365,464 551,006 369,778 461,684 554,780 496,152Woodwaste Landfills 122,097 32,625 115,759 102,697 95,325 59,410 102,484 87,552 53,298Inert/Demolition Landfills 834,238 657,614 479,638 873,195 600,149 494,528 536,155 477,383 733,843Limited Purpose Landfills 407,747 642,251 874,116 910,078 695,783 628,896 569,747 646,662 645,592TOTAL 5,522,065 5,632,731 5,868,916 6,335,189 6,475,181 6,134,719 6,408,878 6,425,959 6,453,904
1 Disposed amounts include all waste generated from Washington disposed in MSW landfills and incinerators, both instate and exported.
D-3

D-4
Table D.7 Solid Waste Imported for Disposal 1991-2001
1991 1992 1993 1994 1995 1996 1997 1998 1999 2000 2001 Municipal Solid Waste 24,475 27,114 26,933 27,330 111,395 203,180 213,322 235,408 243,292 116,365 100,092Demolition 1,412 0 147 1,095 6,643 9,904 12,264 14,245 11,529 25,322 4,370Industrial 0 0 0 4,269 39,990 39,272 358 28,032 39,547 32,044 57,952Woodwaste 208 27,492 24,486 120 1,897 71 0 207 21 21 2Sludge 36 34,457 0 33 0 14 1,413 23 0 0 0Asbestos 0 41 735 206 401 422 39,517 637 478 715 243Petroleum Contaminated Soils
0 12,388 16,698 33,136 54,839 13,706 12,127 19,831 3,652 1,511 4,910
Tires 0 0 0 0 3,594 7,605 7,895 7,202 2.,228 2,296 1,622Medical na na Na Na Na na 1,300 1,432 0 0 0Other 0 0 0 924 210 941 0 828 0 3,131 33TOTAL 26,131 101,492 69,059 67,113 218,970 275,115 288,196 307,850 300,747 191,405 172,696
Table D.8 Solid Waste Exported from Washington for Disposal 1993-2001
1993 1994 1995 1996 1997 1998 1999 2000 2001 Municipal Solid Waste 710,515 737,309 709,133 778,107 785,741 801,663 832,421 949,685 915,156Demolition 2,245 11,130 113,097 137,314 94,905 94,546 92,768 93,540 62,791Industrial 864 3,034 6,773 20,949 50,158 57,556 112,735 129,986 115,334Woodwaste 0 0 0 0 0 0 0 0 0Sludge 0 2,834 5,212 7,062 0 0 0 0 0Asbestos 1,623 2,709 3,031 2,564 5,440 2,856 3,778 4,439 3,836Petroleum Contaminated Soils
22,308 7,555 9,760 29,574 39,112 24,999 62,015 54,787 71,460
Tires Na Na 0 0 0 0 0 0 0Medical Na Na Na 5,209 0 5,204 5,474 6,109 4,868Other 18,512 5,943 4,879 8,394 0 0 0 1,939 1,919TOTAL 756,067 770,514 851,885 989,173 975,356 986,824 1,109,191 1,240,485 1,175,953