solid transformation progress in 2016 · pdf fileabb 800xa dcs applications to identify...
TRANSCRIPT

ABB LTD, ZURICH, SWITZERLAND, MARCH 10, 2017, FULL-YEAR AND Q4 2016 RESULTS (RESTATED)
ABB delivers growth in fourth quarterSolid transformation progress in 2016Ulrich Spiesshofer, CEO; Eric Elzvik, CFO

This presentation includes forward-looking information and statements including statements concerning the outlook for ourbusinesses. These statements are based on current expectations, estimates and projections about the factors that may affectour future performance, including global economic conditions, and the economic conditions of the regions and industries thatare major markets for ABB Ltd. These expectations, estimates and projections are generally identifiable by statementscontaining words such as “expects,” “believes,” “estimates,” “targets,” “plans,” “outlook” or similar expressions.
There are numerous risks and uncertainties, many of which are beyond our control, that could cause our actual results to differmaterially from the forward-looking information and statements made in this presentation and which could affect our ability toachieve any or all of our stated targets. The important factors that could cause such differences include, among others:
– business risks associated with the volatile global economic environment and political conditions– costs associated with compliance activities– market acceptance of new products and services– changes in governmental regulations and currency exchange rates, and– such other factors as may be discussed from time to time in ABB Ltd’s filings with the U.S. Securities and Exchange
Commission, including its Annual Reports on Form 20-F.
Although ABB Ltd believes that its expectations reflected in any such forward-looking statement are based upon reasonableassumptions, it can give no assurance that those expectations will be achieved.
This presentation contains non-GAAP measures of performance. Definitions of these measures and reconciliations betweenthese measures and their US GAAP counterparts can be found in the ‘Supplemental reconciliations and definitions’ section of“Financial Information” under “Quarterly results and annual reports” on our website at www.abb.com/investorrelations
Important notices
March 10, 2017 Slide 2

Q4 and full-year 2016 performance
Next Level transformation
Outlook and priorities 2017
March 10, 2017 Slide 3
Agenda

Full-year and Q4 2016
March 10, 20171On a comparable basis; 2Operational EPS growth is in constant currency (2014 foreign exchange rates) ; 3Excluding unique events operational EBITA margin improved 10 bpsSlide 4
FY 2
016
Operational EPS
$1.29+4%2
$3.1 bn+2%
Revenues Free cash flow
$33.4 bn-5%1
$33.8 bn-1%1
12.4 %+50 bps
Operational EBITA margin
Orders
Q4
2016
Operational EBITA margin
11.7 %-20 bps3
Base orders Revenues
$8.3 bn+3%1
$6.9 bn-1%1
$9.0 bn+1%1
Orders

Q4 2016: ABB delivers growth
March 10, 20171On a comparable basis; 2WCP: White Collar Productivity; 3NWC: Net Working Capital Slide 5
Stage 3 of Next Level Strategy launched – committed to unlocking value
Profitable Growth
Relentless Execution
Business-led Collaboration
+3%1 order growth reflects strong orders in Power Grids, strong growth in US & China +9%1
Revenues grew1; positive contribution by Power Grids and Electrification Products
Launched ABB AbilityTM – significant interest, momentum building
Op. EBITA impacted ~30 bps by default of a large distributor and foreign currency losses
Process Automation op. EBITA margin up 130 bps and Power Grids up 90 bps
WCP2 on track to meet $1.3 bn savings; NWC3 as % of revenues reduced 160 bps
Improved country and account collaboration
Global business service centers operational; ramped up >2,500 people
Successful launch of ABB brand campaign
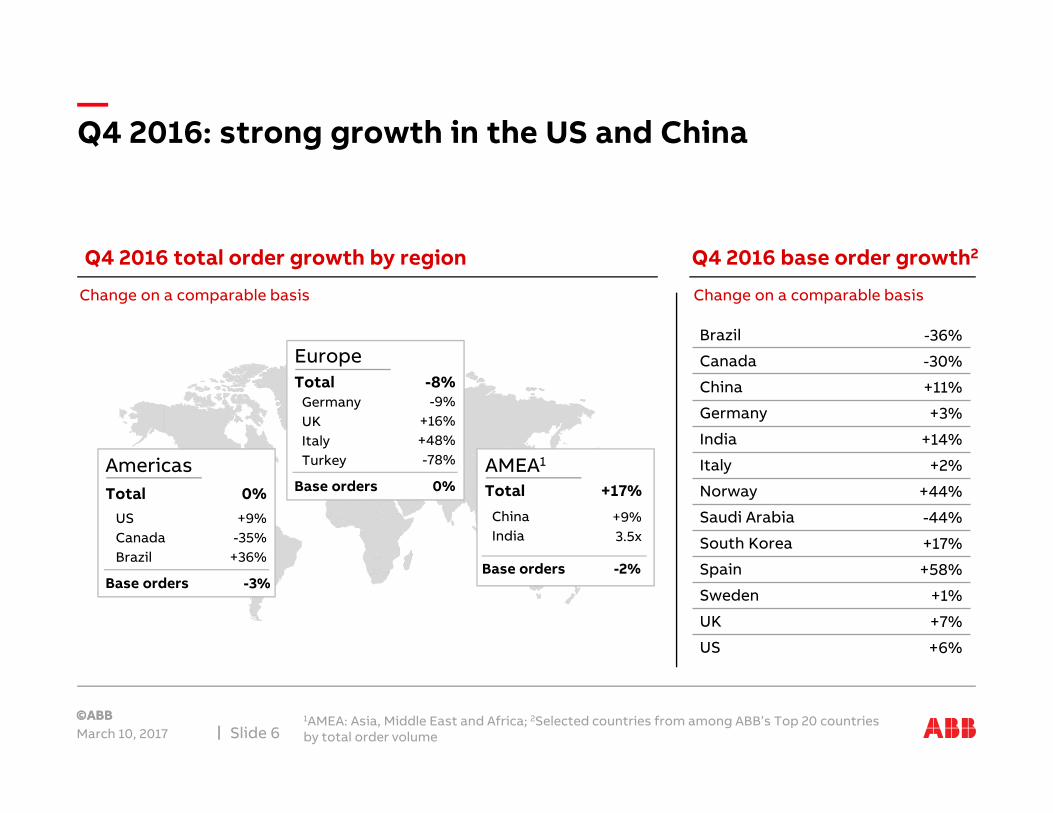
Q4 2016: strong growth in the US and China
March 10, 20171AMEA: Asia, Middle East and Africa; 2Selected countries from among ABB’s Top 20 countries by total order volume Slide 6
Q4 2016 total order growth by region Q4 2016 base order growth2
Change on a comparable basis
Brazil -36%
Canada -30%
China +11%
Germany +3%
India +14%
Italy +2%
Norway +44%
Saudi Arabia -44%
South Korea +17%
Spain +58%
Sweden +1%
UK +7%
US +6%
Change on a comparable basis
Americas
Base orders
USCanadaBrazil
Total+9%
-35%+36%
ChinaIndia
+9%3.5x
Europe
Base orders
GermanyUKItalyTurkey
Total-9%
+16%+48%-78%
-3%
0%
AMEA1
0%
-8%
Base orders
Total
-2%
+17%

Q4 2016: Power Grids orders
March 10, 2017 UHVDC: Ultra-High-Voltage Direct Current; HVDC: High-Voltage Direct CurrentSlide 7
>$840 million, 3 continents
India USA Brazil Philippines
Raigarh-Pugalur 800kV Sylmar converter station Pacific Intertie power link
National Grid Corp of Philippines
Belo Monte
UHVDC system India
Integrate renewable & conventional power over long distances at low losses
Upgrade HVDC station includes ABB AbilityTM to monitor, control & protect
Advanced fault registration & remote control
Design, supply & commission transformers
Support power infrastructure upgrade
800kV ultra-high voltage converter transformers
Integrate clean power from hydro over long distance
Reliable, efficient electricity to 80 mn people
Improves operational efficiency and reliability
Improve grid reliability and increase power capacity
Efficient and safe UHVDC conversion with low losses
$75 mn$640 mn $100 mn $27 mn
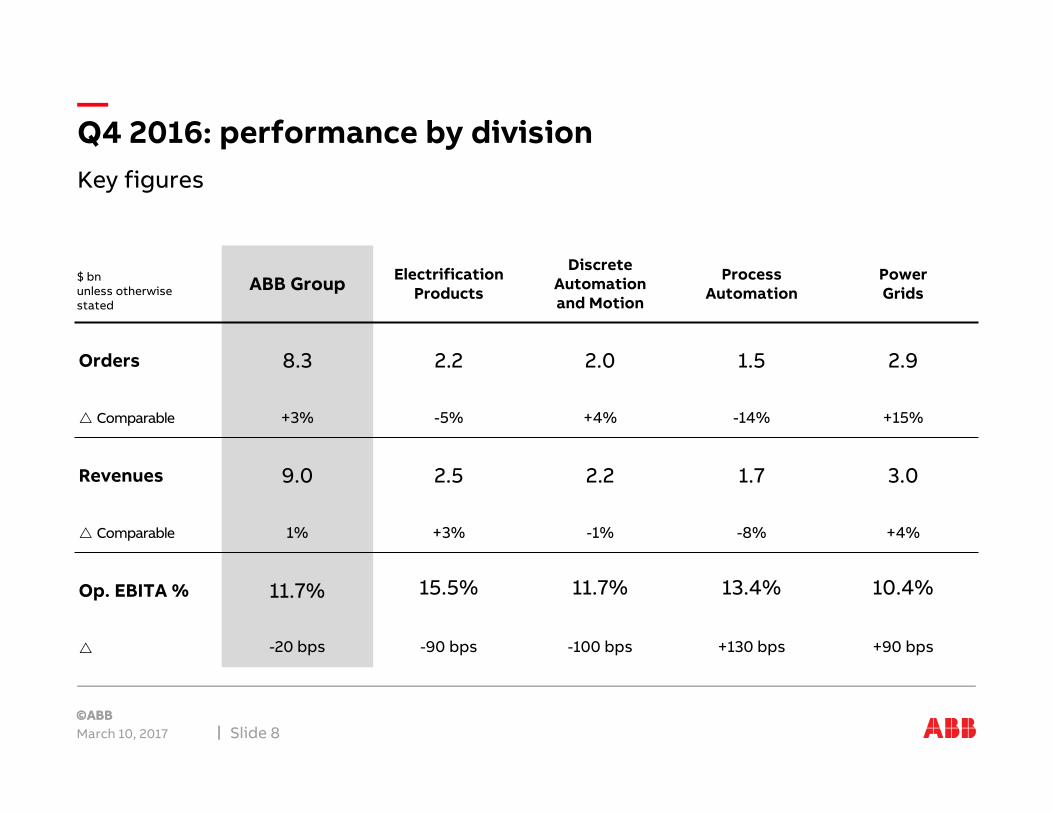
Key figures
Q4 2016: performance by division
March 10, 2017 Slide 8
ABB Group Electrification Products
Discrete Automation and Motion
Process Automation
Power Grids
Orders 8.3 2.2 2.0 1.5 2.9
Comparable +3% -5% +4% -14% +15%
Revenues 9.0 2.5 2.2 1.7 3.0
Comparable 1% +3% -1% -8% +4%
Op. EBITA % 11.7% 15.5% 11.7% 13.4% 10.4%
-20 bps -90 bps -100 bps +130 bps +90 bps
$ bnunless otherwise stated

Net savings
Net volume
OtherProject margins
Mix ForexOp. EBITAQ4 2015
Op. EBITAQ4 2016
Q4 2016: Operational EBITA margin bridge
March 10, 2017 Slide 9
Operational EBITA bridge Q4 2015 to Q4 2016, $ mn
11.9% op. EBITA margin
11.7% op. EBITA margin
1,057
+32-21
-8 -132+111 -26
(e.g. Distributor
default; operational
currency losses)
1,0571,101
Large distributor default and Egyptian currency losses impacted op. EBITA margin ~30 bps

Q4 2016: Operational EBITA to net income bridge
March 10, 2017 = indicating against expectationsSlide 10
Q4
2016
1,057
Q4
2015
425
-68-38
-67
-92-73
+13-54 -12
-47
-194
PPA amortization
Op. EBITA
Restructuring related
Changes in pre-acquisition
estimates
Non-operational
Pension
South Korea
Finance netOther Disc. ops & minority interest
Net income
FX/ timing
differences
Tax
1,101
204
-531-73
-8 -12-54
-76-42 -35-66
0
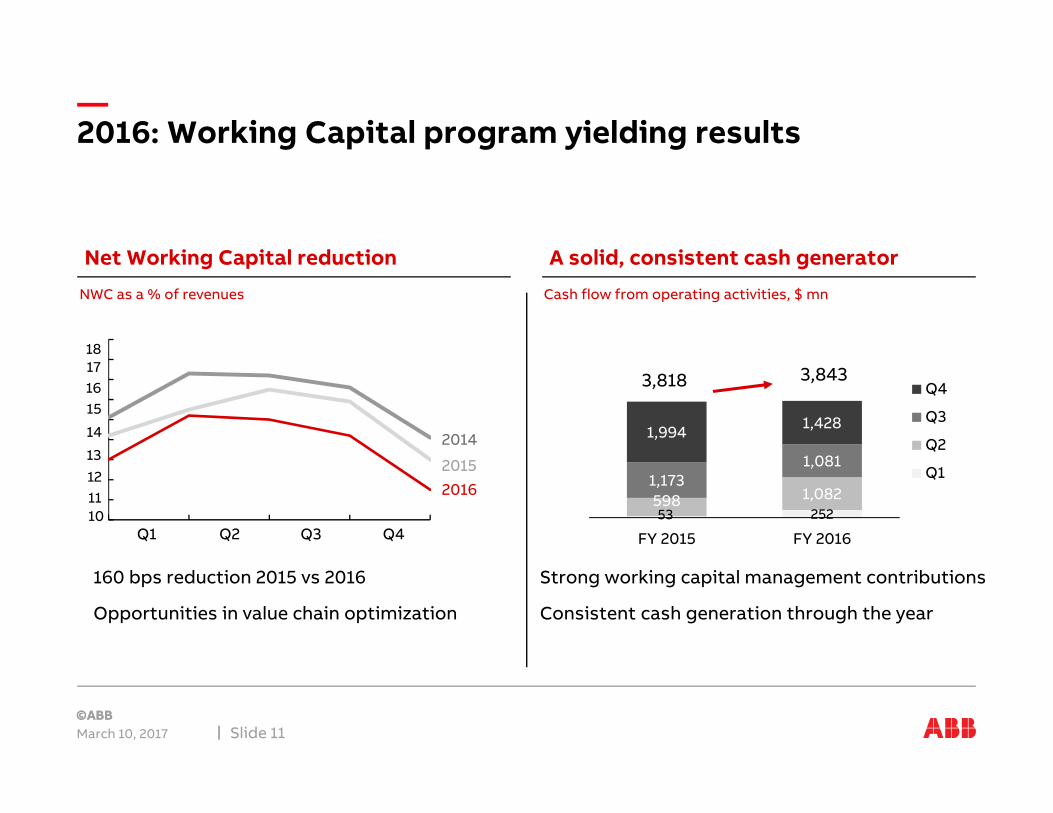
2016: Working Capital program yielding results
March 10, 2017 Slide 11
Net Working Capital reduction A solid, consistent cash generator
15
14
13
181716
101112
Q2 Q3 Q4
2014
20152016
Q1
NWC as a % of revenues
53 252598 1,082
1,1731,081
1,994 1,428
0
1000
2000
3000
4000
5000
FY 2015 FY 2016
Q4
Q3
Q2
Q1
Strong working capital management contributions
Consistent cash generation through the year
Cash flow from operating activities, $ mn
3,8433,818
160 bps reduction 2015 vs 2016
Opportunities in value chain optimization

Next Level transformation
March 10, 20171PIE: Penetration, Innovation, Expansion; 2F&B: Food and BeverageSlide 12
Growth momentum building (i.e. PIE1) in key markets
Double digit growth in F&B2, robotics
Launch of ABB AbilityTM, 3 partnerships
Strategic portfolio review Power Grids completed
Power Grids transformation delivered
Delivered +$1 bn normal cost savings
Delivered ~$550 mn of WCP gross savings
Reduced working capital ~$550 mn
>70k people on performance / compensation system
Simpler, customer-focused organization
Unified brand and brand migration
Lack of organic growth focus
Underperforming units
Fat, inefficient white collar organization
Inadequate cash culture
Static, lack of accountability
Complex organizational setup
Fragmented brand landscape
Starting point 2013 2016 achievements
Profitable Growth
Relentless Execution
Business-led Collaboration
ABB ready to deliver on growth – Next Level Stage 3

Four actions
Next Level Stage 3 – committed to unlocking value
March 10, 2017 Slide 13
Delivering attractive shareholder returns
Business-led Collaboration
2
4
Profitable Growth
Accelerating momentum in operational excellence
1
Relentless Execution 3
Strengthening the global ABB brand
Driving growth in four market-leading entrepreneurial divisions
Quantum leap in digital
ANNOUNCED OCTOBER 4TH, 2016

Operational as of January 1, 2017
Four market-leading entrepreneurial divisions
March 10, 2017 Slide 14
1
Electrification Products
g g
Robotics and Motion
Industrial Automation
Power Grids
…electrification of all consumption points
…robotics and intelligent motion solutions
…industrial automation
…a stronger, smarter and greener grid
Partner of choice for… Actions ….
Combine all electrification components Investment in growth platforms (renewables, EV charging, power quality)
Simplified and focused portfolio Driving growth in robotics
Driving digitalization across industry sectorsDriving service offering
Focus on high growth, digitalization, “Power Up” transformationPrune niche non-core & grow with de-risked business model
Position
#2 in electrification
#1 in motion
#2 in robotics
#1 in process control
#1 in T&D
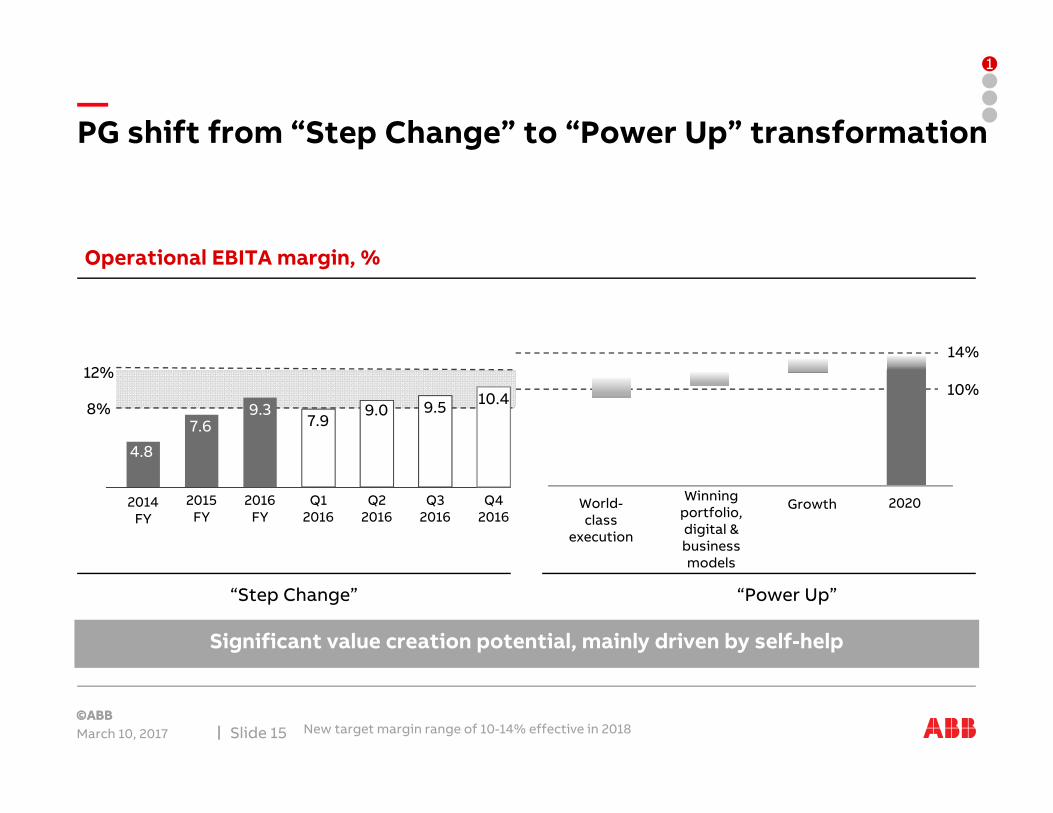
PG shift from “Step Change” to “Power Up” transformation
March 10, 2017 New target margin range of 10-14% effective in 2018Slide 15
Significant value creation potential, mainly driven by self-help
2020Growth2015 FY
Q1 2016
Winning portfolio, digital & business models
World-class
execution
Q22016
Q32016
Q42016
Operational EBITA margin, %
2016 FY
“Step Change” “Power Up”
1
10%12%
8%7.6
9.07.9
9.5 10.49.3
2014 FY
4.8
14%

One common offering for digital end-to-end solutions
Quantum leap in digital: launch of ABB AbilityTM
March 10, 2017 Slide 16
Digital ABB offering across all businesses
2
Driving growth by:
Integrating
Penetrating
Replicating

ABB AbilityTM – creating value for customers
March 10, 2017 Slide 17
2
Leading robot simulation & offline programming software
Virtual commissioning
Discrete manufacturing processes across major verticals
Reduced risk, shorter installation time,
elimination of down-time
ABB 800xA DCS
Applications to identify problems, adapt software
& control strategy
Identify mechanical issues
Extensive O&G domain expertise with control system
Faster commissioning and operational efficiency
Wireless communication network aggregating multiple
applications through an integrated digital
distribution system
Global market leader in grids
Deliver safe, reliable power and reduce end customers’
energy consumption
Robot Studio (14,000 users/week)
Ormen Lange gas field, Norske Shell
Central Hudson Gas & Electric Distribution Grid, USA
Digital solution
Domain expertise
Customer value
Plan / design Build Operate
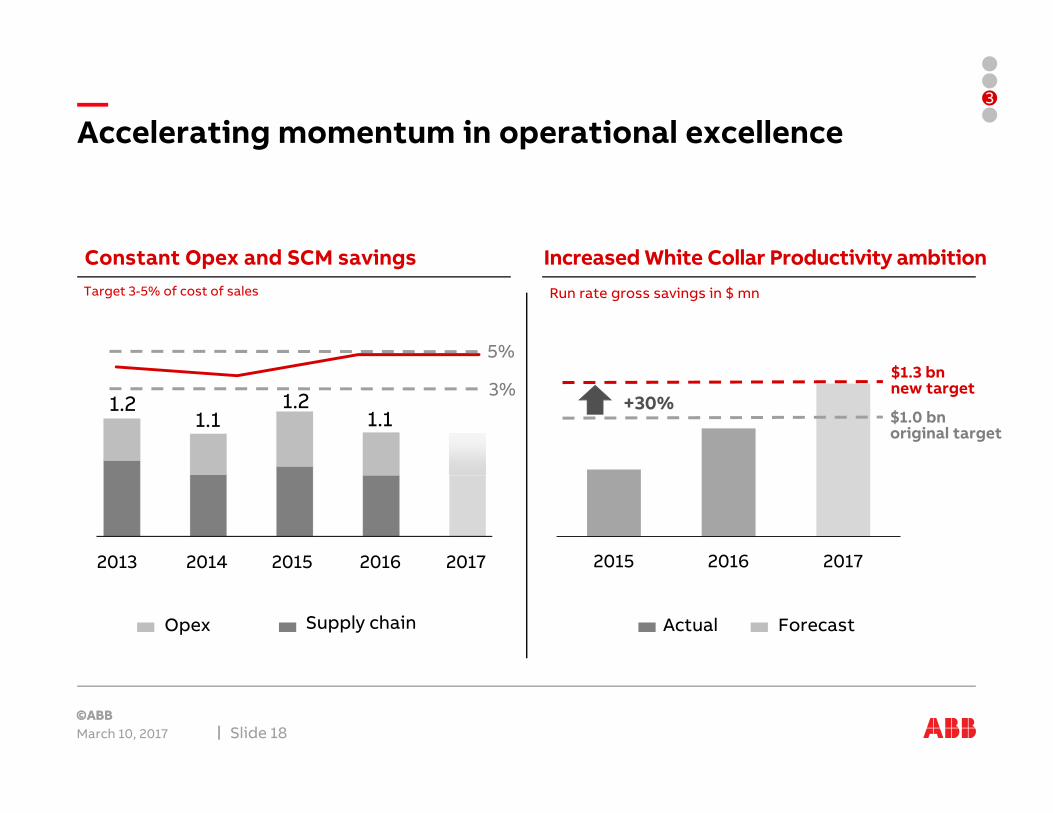
Accelerating momentum in operational excellence
March 10, 2017 Slide 18
3
Run rate gross savings in $ mn
Constant Opex and SCM savings Increased White Collar Productivity ambition
1.2
Supply chainOpex
1.21.1
2013 2014 2015 2016
1.1
2015 2016 2017
$1.0 bnoriginal target
$1.3 bnnew target
+30%
Actual Forecast
3%
5%
Target 3-5% of cost of sales
2017

0.71.5 1.3
3.0
2014 2015 2016 2017-201
11.6%
12.7%13.4%
13.8%
2013 2014 2015 2016
Returned $2.9 bn of cash to shareholders in 2016
Committed to delivering attractive shareholder returns
March 10, 20171Planned; 2Dividend divided by year end share priceSlide 19
in $ bn
Improved free cash flow, strong cash conversion
Share repurchase volume
2.6 2.9
94% 110%156% 161%
2013 2014 2015 2016
Dividend per share (CHF)
Dividend yield2
0.73.7% 3.6% 3.0% 3.4% 4.1%
2011 2012 2013 2014 2015 2016
0.7
4
0.7
2
0.7
0
0.6
8
0.6
5 0.7
6
3.5%
3.0 3.1
Jan’16 Mar’17
Share price
Improving cash return on investment
15
20
25

Outlook – short term market conditions
March 10, 20171Including automotive, food & beverage, machinerySlide 20
Pioneering technology
Utilities Industry Transport & Infrastructure
Globally
T&D: positive drivers, policy support
Solar and Wind: continued growth
Conventional Power: fewer coal capacity additions, gas stable
Discrete & hybrid industries1: investment remains positiveOil & Gas: bottoming onshore, further decline offshoreMining & metals: persistent overcapacity, bulk metal capacity clean-up
Transportation: rail growing, specialty ships strong, cargo vessels challenged
Construction: solid with downside risk
China: growth in T&D, robotics and buildings, process difficult
India: growth across sectors
Middle East: political instability. Infrastructure challenges
US: T&D positive, industrials remain mixed, political uncertainty
Canada: stable; O&G bottoming
Brazil: Flat off of severe contraction
Northern & Central Europe: moderate growth overall, impact of Brexit 2017
Southern Europe: mixed, strong growth in Spain, Italy slow, Turkey affected by political events
Africa, Middle East and Asia Americas Europe

2017 priorities
March 10, 2017 Slide 21
Profitable Growth
Relentless Execution
Business-led Collaboration
Drive organic growth through PIE, expand technology leadership
Drive ABB AbilityTM momentum through customer base and within every business unit
Ready for disciplined inorganic moves and partnerships
Deliver White Collar Productivity and Working Capital programs
Drive Leading Operating Model, Supply Chain Management and Quality programs
Live new performance culture and performance systems
Tap “growth collaboration” opportunities in countries and accounts
Drive high performance culture with newly shaped organization and leadership team
Continue strengthening the global ABB brand

Why own ABB
March 10, 2017 Slide 22
Pioneering technology leader
Strong positions in attractive markets
Efficient balance sheet; generating attractive returns for shareholders
Clear transformation agenda driving operational EPS and CROI
Committed to unlocking value


Key figures Q4 2016
March 10, 2017 Slide 24
Q4 2016 Q4 2015 Change
$ mn unless otherwise indicated $ Local currency Comparable
Orders 8,277 8,262 0% +2% +3%Order backlog (end December) 22,981 24,121 -5% -2% -1%
Revenues 8,993 9,242 -3% 0% +1%
Operational EBITA 1,057 1,101 -4% -2%
as % of operational revenues
11.7% 11.9% -0.2 pts.
Income from operations 678 347 +95%
as % of revenues 7.5% 3.8% +3.7 pts
Net income 425 204 +108%Basic earnings per share ($) 0.20 0.09 +115%
Cash flow from operating activities 1,428 1,994 -28%

Key figures 2016
March 10, 2017 Slide 25
FY 2016 FY 2015 Change
$ mn unless otherwise indicated $ Local currency Comparable
Orders 33,379 36,429 -8% -5% -5%Order backlog (end December) 22,981 24,121 -5% -2% -1%
Revenues 33,828 35,481 -5% -2% -1%
Operational EBITA 4,191 4,209 0% +2%
as % of operational revenues
12.4% 11.9% +0.5 pts.
Income from operations 2,897 3,049 -2%
as % of revenues 8.8% 8.6% +0.2 pts
Net income 1,899 1,933 -2%Basic earnings per share ($) 0.88 0.87 +2%
Cash flow from operating activities 3,843 3,818 +1%

Third party base orders by division
March 10, 2017 Slide 26
Q4 2016 Q4 2015 % Change
Third-party base orders $ mn Comparable
Electrification Products 2,051 2,158 -2%
Discrete Automation and Motion 1,820 1,779 +5%
Process Automation 1,285 1,309 0%
Power Grids 1,692 1,864 -7%
Corporate and Other 12 12
Total Group 6,860 7,122 -1%

Order backlog by division
March 10, 2017 Slide 27
Q4 2016 Q4 2015 Change
Order backlog (end December) $ mn $ Comparable
Electrification Products 2,612 2,872 -9% -5%
Discrete Automation and Motion 4,078 4,232 -4% 0%
Process Automation 5,258 6,036 -13% -10%
Power Grids 12,437 12,502 -1% +4%
Corporate and Other(incl. Inter-division eliminations)
-1,404 -1,521
Total Group 22,981 24,121 -5% -1%
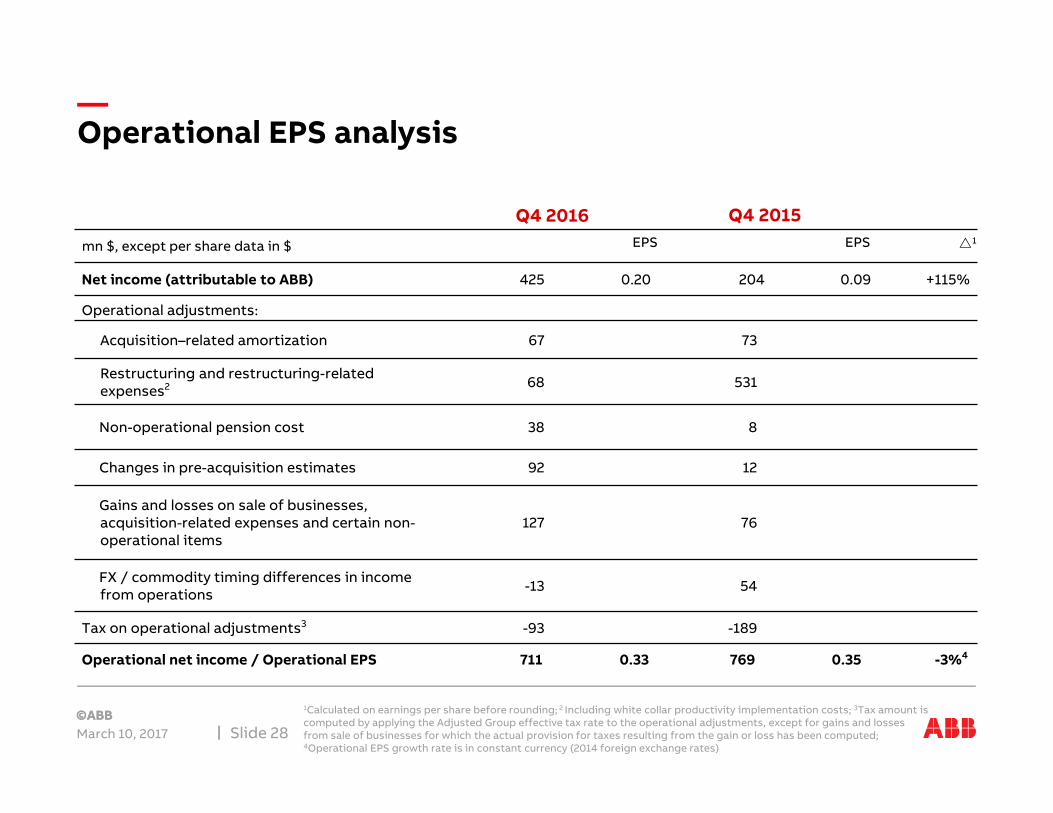
Operational EPS analysis
March 10, 2017
1Calculated on earnings per share before rounding; 2 Including white collar productivity implementation costs; 3Tax amount is computed by applying the Adjusted Group effective tax rate to the operational adjustments, except for gains and losses from sale of businesses for which the actual provision for taxes resulting from the gain or loss has been computed; 4Operational EPS growth rate is in constant currency (2014 foreign exchange rates)
Slide 28
Q4 2016 Q4 2015mn $, except per share data in $ EPS EPS 1
Net income (attributable to ABB) 425 0.20 204 0.09 +115%
Operational adjustments:
Acquisition–related amortization 67 73
Restructuring and restructuring-related expenses2 68 531
Non-operational pension cost 38 8
Changes in pre-acquisition estimates 92 12
Gains and losses on sale of businesses, acquisition-related expenses and certain non-operational items
127 76
FX / commodity timing differences in income from operations -13 54
Tax on operational adjustments3 -93 -189
Operational net income / Operational EPS 711 0.33 769 0.35 -3%4

Operational EPS analysis – full year
March 10, 2017
1Calculated on earnings per share before rounding; 2 Including white collar productivity implementation costs; 3Tax amount is computed by applying the Adjusted Group effective tax rate to the operational adjustments, except for gains and losses from sale of businesses for which the actual provision for taxes resulting from the gain or loss has been computed; 4Operational EPS growth rate is in constant currency (2014 foreign exchange rates)
Slide 29
FY 2016 FY 2015mn $, except per share data in $ EPS EPS 1
Net income (attributable to ABB) 1,899 0.88 1,933 0.87 +2%
Operational adjustments:
Acquisition–related amortization 279 310
Restructuring and restructuring-related expenses2 543 674
Non-operational pension cost 38 19
Changes in pre-acquisition estimates 131 21
Gains and losses on sale of businesses, acquisition-related expenses and certain non-operational items
173 120
FX / commodity timing differences in income from operations 40 16
Tax on operational adjustments3 -320 -295
Operational net income / Operational EPS 2,783 1.29 2,798 1.26 +4%4
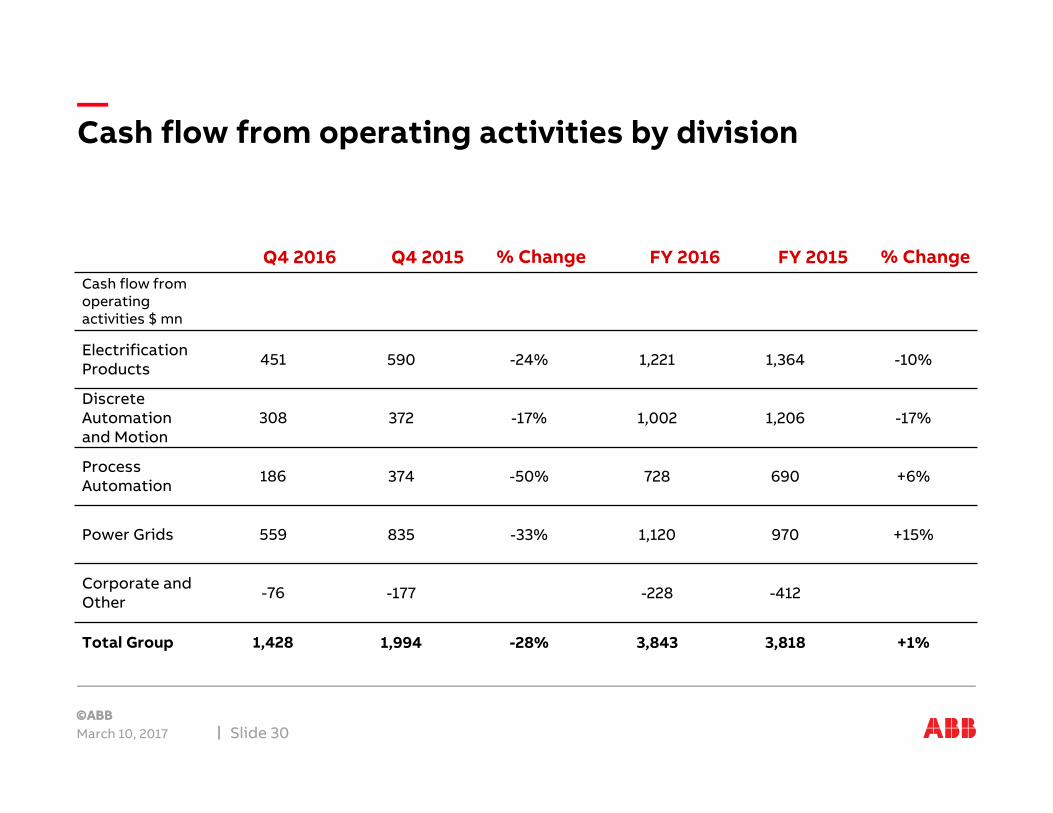
Cash flow from operating activities by division
March 10, 2017 Slide 30
Q4 2016 Q4 2015 % Change FY 2016 FY 2015 % ChangeCash flow from operating activities $ mn
Electrification Products 451 590 -24% 1,221 1,364 -10%
Discrete Automation and Motion
308 372 -17% 1,002 1,206 -17%
Process Automation 186 374 -50% 728 690 +6%
Power Grids 559 835 -33% 1,120 970 +15%
Corporate and Other -76 -177 -228 -412
Total Group 1,428 1,994 -28% 3,843 3,818 +1%

Status 2015 – 2020 financial targets
Group Targets
March 10, 2017
1Average annual revenue growth on a like-for-like basis over 6 years, base year 2014; 2Target is on a full-year basis; 3CAGR = Compound annual growth rate, base year is 2014 and assuming constant exchange rates; 4Temporary reduction possible in the event of larger acquisitions
Slide 31
Status as of December 2016 unless otherwise stated Group Status
Revenue growth1 3 – 6% 0%
Operational EBITA %2 11 – 16% 12.4%
Operational EPS growth CAGR3 10 – 15% 4%
FCF conversion to net income >90% 161%
CROI %4 Mid-teens 14.1%

White Collar Productivity program costs
March 10, 2017 Slide 32
$ mn
Originalguidance
New guidance 2015 2016 2017
Total Cost 1,200-1,250
1,020-1,070 420 370 ~230
Restructuring and related expenses 850-900 ~520 370 140 ~10
Program implementation 350 500 50 230 220
$ mn Original target
New target 2015 2016 2017 2018
Gross savings (run rate end of 2017) 1,000 1,300
Gross savings (incremental y-o-y) ~25 >550 450 300
Q4 2016
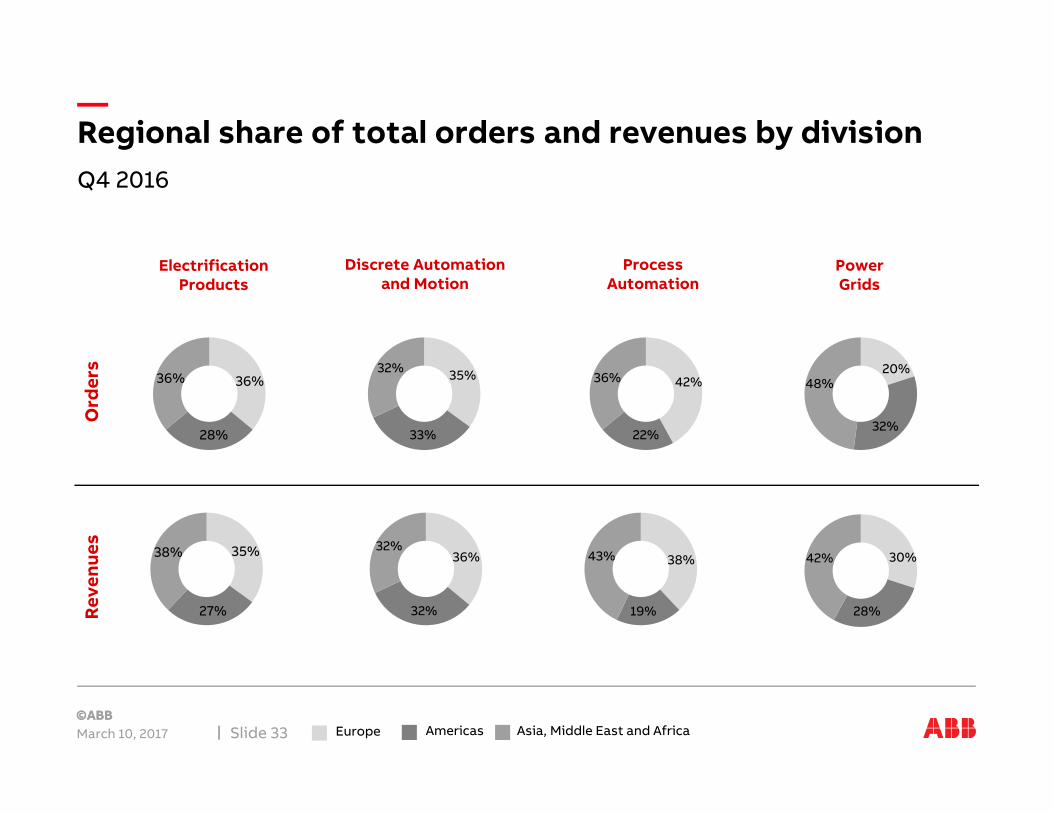
Regional share of total orders and revenues by division
March 10, 2017 Slide 33
Ord
ers
Reve
nues
Electrification Products
36% 36%
28%
38% 35%
27%
Discrete Automation and Motion
32% 35%
33%
32%36%
32%
Process Automation
36% 42%
22%
43% 38%
19%
Power Grids
48%20%
32%
42% 30%
28%
Europe Americas Asia, Middle East and Africa

Q4 2016
Electrification Products
March 10, 2017 Slide 34
Ord
ers
Total orders reflects lower large orders in the systems business compared with the same period a year ago. Positive order development in China and India could not offset declines in the US, Canada and the United Kingdom.
Op.
EB
ITA
&
mar
gin
Operational EBITA margin was impacted by the default of a Turkish distributor and Egyptian operational currency losses resulting collectively in a 90 basis points decline to 15.5 percent. Excluding these charge operational EBITA margin would have been steady in the quarter.
Reve
nues
Revenues grew 3 percent in the quarter as a result of the execution of the systems backlog and higher demand in building products.
In $ mn, y-o-y change comparable
1 2
-5%
2,340 2,157
Q4 2015 Q4 2016
1 2
+3%
2,459 2,462
Q4 2015 Q4 2016
1 2
15.5%
403 382
16.4%
Q4 2015 Q4 2016

Q4 2016
Discrete Automation & Motion
March 10, 2017 Slide 35
Total orders grew 4 percent as continued strong demand patterns in robotics and light industry more than offset the impacts from capex declines in process industries such as oil and gas.
Operational EBITA margin declined 100 basis points compared with the same quarter a year ago mainly impacted by lower margins in solar, unfavorable mix and low capacity utilization.
Revenues were steady reflecting order execution and strong demand from light industries.
In $ mn, y-o-y change comparable
1 2
+4%
1,984 2,013
Q4 2015 Q4 2016
1 2
-1%
2,288 2,211
Q4 2015 Q4 2016
1 2
11.7%
291 260
12.7%
Q4 2015 Q4 2016
Ord
ers
Op.
EB
ITA
&
mar
gin
Reve
nues

Q4 2016
Process Automation
March 10, 2017 Slide 36
Total orders were 14 percent lower as a result of continued capital expenditure reduction in the process industries.
Operational EBITA margin increased 130 basis points to 13.4 percent due to positive mix and successfully implemented cost reduction and productivity measures.
Revenues declined 8 percent as higher service revenues could not offset declines in mining and oil and gas.
In $ mn, y-o-y change comparable
1 2
-14%
1,796 1,520
Q4 2015 Q4 2016
1 2
-8%
1,926 1,737
Q4 2015 Q4 2016
1 2
13.4%
235 231
12.1%
Q4 2015 Q4 2016
Ord
ers
Op.
EB
ITA
&
mar
gin
Reve
nues

Q4 2016
Power Grids
March 10, 2017 Slide 37
Total orders were 15 percent higher compared with the same quarter a year ago due to a significant increase in large contract awards.
Operational EBITA margin increased by 90 basis points to 10.4 percent, mainly driven by higher revenues, improved productivity, solid project execution and continued cost savings.
Revenues increased 4 percent due to steady execution of a healthy order backlog.
In $ mn, y-o-y change comparable
1 2
+15%
2,628 2,879
Q4 2015 Q4 2016
1 2
+4%
3,107 3,042
Q4 2015 Q4 2016
1 2
10.4%
293 318
9.5%
Q4 2015 Q4 2016
Ord
ers
Op.
EB
ITA
&
mar
gin
Reve
nues

Q1 2016 Proforma – new structure
March 10, 2017 Note: best estimate, subject to changeSlide 38
ABB Group Electrification Products
Roboticsand Motion
Industrial Automation
Power Grids
Orders($ mn) 9,253 2,506 2,088 1,838 3,307
Revenues($ mn) 7,903 2,289 1,873 1,664 2,518
Operational EBITA($ mn)
951 307 286 202 198
Operational EBITA margin (%)
12.1% 13.5% 15.3% 12.0% 7.9%

FY 2016 Proforma – new structure
March 10, 2017 Note: best estimate, subject to changeSlide 39
ABB Group Electrification Products
Roboticsand Motion
Industrial Automation
Power Grids
Orders($ mn) 33,379 9,775 7,868 6,041 11,232
Revenues($ mn) 33,828 9,916 7,915 6,778 10,975
Operational EBITA($ mn)
4,191 1,458 1,224 865 1,021
Operational EBITA margin (%)
12.4% 14.7% 15.4% 12.7% 9.3%

FY 2015 Proforma – new structure
March 10, 2017 Note: best estimate, subject to changeSlide 40
ABB Group Electrification Products
Roboticsand Motion
Industrial Automation
Power Grids
Orders($ mn) 36,429 10,606 8,285 7,525 12,205
Revenues($ mn) 35,481 10,272 8,201 7,431 11,621
Operational EBITA($ mn)
4,209 1,519 1,290 908 877
Operational EBITA margin (%)
11.9% 14.8% 15.7% 12.2% 7,6%

More information available at ABB Investor Relations
March 10, 2017 Slide 41
Name Telephone E-Mail
Alanna AbrahamsonHead of Investor Relations +41 43 317 3804 [email protected]
Beat Fueglistaller +41 43 317 4144 [email protected]
Ruth Jaeger +41 43 317 3808 [email protected]