solid state nuclear magnetic resonance - connecting ... predicting the evolution of nuclear...
TRANSCRIPT
Simulating spin dynamics in organic solidsunder heteronuclear decoupling
Ilya Frantsuzov a,1, Matthias Ernst b, Steven P. Brown c, Paul Hodgkinson a,n
a Department of Chemistry, Durham University, South Road, Durham DH1 3LE, United Kingdomb Laboratory of Physical Chemistry, ETH Zürich, Wolfgang-Pauli-Strasse 10, 8093 Zürich, Switzerlandc Department of Physics, University of Warwick, Coventry CV4 7AL, United Kingdom
a r t i c l e i n f o
Article history:Received 9 December 2014Received in revised form14 April 2015Available online 15 May 2015
Keywords:DecouplingMagic-angle spinningNumerical simulationSolid-state NMR
a b s t r a c t
Although considerable progress has been made in simulating the dynamics of multiple coupled nuclearspins, predicting the evolution of nuclear magnetisation in the presence of radio-frequency decouplingremains challenging. We use exact numerical simulations of the spin dynamics under simultaneousmagic-angle spinning and RF decoupling to determine the extent to which numerical simulations can beused to predict the experimental performance of heteronuclear decoupling for the CW, TPPM and XiXsequences, using the methylene group of glycine as a model system. The signal decay times are shown tobe strongly dependent on the largest spin order simulated. Unexpectedly large differences are observedbetween the dynamics with and without spin echoes. Qualitative trends are well reproduced bymodestly sized spin system simulations, and the effects of finite spin-system size can, in favourablecases, be mitigated by extrapolation. Quantitative prediction of the behaviour in complex parameterspaces is found, however, to be very challenging, suggesting that there are significant limits to the role ofnumerical simulations in RF decoupling problems, even when specialist techniques, such as state-spacerestriction, are used.& 2015 The Authors. Published by Elsevier Inc. This is an open access article under the CC BY license
(http://creativecommons.org/licenses/by/4.0/).
1. Introduction
Effective decoupling of the 1H nuclear spins is essential forachieving high resolution 13C NMR spectra from typical organicmolecules. Such heteronuclear decoupling is particularly difficultin the solid state due to the strong dipolar interactions betweenthe different magnetic nuclei, which are not averaged out bymolecular motion as they are in the solution state. While con-siderable progress has been made in developing approaches todecoupling and understanding how they work [1,2], there is not acomprehensive theory that allows decoupling performance to bepredicted.
In principle, exact numerical simulation of nuclear spin systems[3–5] ought to allow the prediction of decoupling performance.The multi-spin nature of the dipolar-coupled network in solidsystems is not necessarily an obstacle; we have, for example,shown that simulations on modest numbers (9–10) of spins aresufficient to predict exactly the 1H spin dynamics under magic-
angle spinning (MAS) [6,7], and numerical solutions have provedinvaluable in understanding how decoupling sequences work[8–15]. We show here, however, that predicting the performanceof decoupling sequences, particularly in regions of interest aroundoptimal conditions, would require very large numbers of spins tobe included to obtain quantitative agreement with experiment.This number is larger than the practical limit for exact simulation,which is typically less than 12 spins (although this can beextended using artificial model geometries with additional sym-metry [16]).
Recently a number of groups have demonstrated simulations ofmuch larger numbers of coupled nuclear spins by restricting thesize of the state space used for the simulations [17–21]. Differentresearchers have used slightly different methods for restricting theevolution of the spin system to coherences below a certain order,but it is argued that the success of such calculations relies on thepopulations of higher spin orders (i.e. the number of correlatedspins involved in a coherence) remaining relatively small [22]. Thisis clearly the case in solution-state NMR, where high spin ordercoherences relax relatively quickly, and some promising resultshave also been obtained for simulations of 1H spin-diffusion inpowder samples under MAS [23–25]. It is not obvious, however,that state-space restriction is generally appropriate in the solid
Contents lists available at ScienceDirect
journal homepage: www.elsevier.com/locate/ssnmr
Solid State Nuclear Magnetic Resonance
http://dx.doi.org/10.1016/j.ssnmr.2015.05.0030926-2040/& 2015 The Authors. Published by Elsevier Inc. This is an open access article under the CC BY license (http://creativecommons.org/licenses/by/4.0/).
n Corresponding author.E-mail address: [email protected] (P. Hodgkinson).1 Current address:Department of Chemistry, Kansas State University,
Manhattan, KS 66506-0401, USA.
Solid State Nuclear Magnetic Resonance 70 (2015) 28–37

state, where very high spin orders can be observed amongst 1Hnuclei [26–28], and so we also investigate the role of higher spinorders in heteronuclear decoupling.
2. Methods
The decoupling performance is quantified experimentally bymeasuring the ‘T 0
2’ decay constant of the 13C magnetisation, that is,the time constant for the decay of 13C magnetisation where a 1801pulse is applied on 13C at the mid-point of the decay period [29,30].The spin-echo refocuses decay due to inhomogeneous effects, such asB0 inhomogeneity and magnetic susceptibility broadenings [31]. As aresult, T 0
2 is much more sensitive to decoupling quality than Tn
2values obtained from measured linewidths; linewidths are often notparticularly sensitive to changes in decoupling quality [30,32]. T 0
2values continue to increase as the RF decoupling power is increased,tending towards the fundamental limit set by true T2 relaxation [33],well after the limiting linewidth is observed. We use Tc
2 here to referto the coherent decay of 13C magnetisation in the absence of a spin-echo, to distinguish it from true (incoherent) T2 relaxation and theoverall time constant for magnetisation decay, Tn
2, which includesinhomogeneous contributions associated with the sample and anyinstrumental factors. The mechanisms for the decay of 13C magne-tisation are different for Tc
2 and T2, but they both result in loss of theoriginal coherence which cannot be readily refocussed. Decoherenceis used here to refer to this magnetisation decay. In contrast to T 0
2 andTn
2, Tc2 is not directly measurable, while both T 0
2 and Tc2 can, in
principle, be directly observed in numerical simulations of magneti-sation decay with or without a spin echo. It is important to note,however, that all the T2 values used here are phenomenologicalquantities obtained by fitting experimental or simulated magnetisa-tion decays to exponential functions. The absence of moleculartumbling in the solid state means that the magnetisation decays willgenerally be orientation dependent, and their powdered-averagedsum may not fit well to a single exponential.
2.1. Experimental
Experimental measurements of T 02 were performed on a poly-
crystalline sample of glycine-2-13C,15N (99% 13C, 98% 15N) pur-chased from CortecNet. The sample was confirmed to be α-glycinebased on the 13C carbonyl peak at 176.5 ppm, which is sensitive topolymorphic changes [34,35]. As expected from the stability rangeof this form, 5–500 K [36], no transformations were observedduring experiments. For measurements of TPPM [37] and CWperformance, the sample was packed into a Bruker 2.5 mm o.d.MAS rotor and data obtained at a 1H Larmor frequency ofνH0 ¼ 600 MHz and MAS frequency of νr ¼ 12 kHz on a BrukerAvance IIþ console. The XiX [32,63] measurements were per-formed at νH0 ¼ 500 MHz on an InfinityPlus console using a Bruker1.3 mm o.d. rotor spinning at νr ¼ 25 kHz. 13C magnetisation wascreated using cross-polarisation ramped on the 1H RF power usingeither the centreband matching condition with a contact time of1:2 ms, for νr ¼ 12 kHz, or the νH1 �νC1 ¼ νr sideband with a contacttime of 2:7 ms for νr ¼ 25 kHz. These represent typical conditionsfor acquiring 13C spectra of natural abundance samples underTPPM and XiX decoupling. The 13C magnetisation was thenmeasured after a spin-echo period, τ–π–τ, during which eitherCW, TPPM or XiX proton decoupling was applied, as shown inFig. 1. For both the CW and TPPM experiments, the acquisition andrecycle delay times were 30:77 ms and 4 s respectively, whileunder XiX decoupling they were 25:6 ms and 5 s respectively. Notethat the TPPM pulse width, τp, is generally parameterised below interms of the corresponding nutation angle, θ¼ τpν13601.
The same 1H decoupling was used in both spin-echo andacquisition periods. Although using a fixed decoupling sequencefor acquisition would lead to reasonably consistent line-shapes inthe acquired spectra, significant mismatches between spin-echoand acquisition decoupling were observed to distort fitted T 0
2values via the orientation dependence of decoupling efficiency[38]; magnetisation that has been preserved by efficient decou-pling during the spin-echo period may rapidly decohere under theacquisition decoupling, leading to an underestimate of intensity atlonger spin-echo times and hence an underestimation of T 0
2. Thevariation of the orientation dependence of Tc
2 with decouplingparameters is illustrated in the Supplementary Information,Fig. S2. The 1H decoupling nutation rate, ν1, was measured usingthe same sequence with a zero-length spin-echo period, incre-menting the initial 1H pulse width to acquire a 1H nutationspectrum and taking the peak position as the nominal ν1.
Full decay curves were obtained at selected decoupling condi-tions by incrementing the evolution time, 2τ, linearly in 41 stepsfrom zero to approximately twice the maximum expected T 0
2. Thefree induction decays were zero-filled and Fourier transformed(without apodisation) using matNMR [39]. The decay of themethylene 13C peak height as a function of 2τ was fitted to adecaying exponential to obtain T 0
2 using MATLABs [40]. Wheredetailed parameter maps as a function of the parameters of adecoupling sequence were acquired, T 0
2 values were inferred froma pair of experiments at 2τ¼0 and 2τ� T 0
2;max, assuming simpleexponential decay of the peak height between these points.Discrepancies between the T 0
2 values obtained by this quick, butapproximate, approach and those obtained from full decays werereduced by re-scaling the approximate values using a quadraticfunction fitted to approximate vs. accurate T 0
2 values at betweenthree and five characteristic points in the parameter space. Asillustrated in the SI, Fig. S1, this rescaling resulted in relativelymodest changes in the T 0
2 values (up to 20% at maxima and 30%around minima), and allowed good T 0
2 estimates to be measuredefficiently for a wide parameter space.
2.2. Numerical simulations
To explore how the spin dynamics change as a function of spin-system size, spin-systems containing different numbers of protonsat increasing distance from a selected methylene C atom werecreated, based on the room temperature neutron structure of α-
Fig. 1. (a) Spin-echo pulse sequence using the same decoupling during the 2τ andacquisition periods. Phases (combining spin-temperature inversion and EXOR-CYCLE): ϕ1¼01, 1801, 01, 1801; ϕ2¼ϕ3¼901; ϕ4¼01, 01, 901, 901; ϕrec¼901, 2701,2701, 901. (b) TPPM decoupling element, with phase excursion ϕ and pulse width τp.(c) XiX decoupling element.
I. Frantsuzov et al. / Solid State Nuclear Magnetic Resonance 70 (2015) 28–37 29
glycine (CSD refcode GLYCIN20 [41]). These spin systems arelabelled as CHn, with n indicating the number of protons in thesystem. CASTEP version 6.0 [42] was used to optimise the 1Hpositions in the unit cell using a planewave cut-off energy of600 eV. Brillouin zone integrals used a minimum sampling densityof 0:1˚ A �1 apart with the sampling grid offset by 0.25, 0.25,and 0.25 in fractional coordinates of the reciprocal lattice.The exchange-correlation functional was approximated at thegeneralised-gradient level, specifically that of Perdew, Burke andErnzerhof (PBE) [43]. Ultrasoft pseudopotentials [44] consistentwith the PBE approximation were generated by CASTEP on-the-fly.Shielding tensors were subsequently calculated using the GIPAWmethod [45–47].
The effects of dynamics on the dipolar and shielding tensors ofprotons of the NH3
þ groups, which are in rapid exchange at ambienttemperature, were accounted for by averaging the chemical shift anddipolar coupling tensors over the three H positions and diagonalisingto obtain the new principal components and mean tensor orienta-tion. Dipolar coupling tensors between the spins of the NH3
þ werereconstructed by re-orienting the averaged dipolar tensor along theC–NH3
þ bond vector and scaling by P2ð cos 901Þ ¼ 1=2. This task ofcombining shielding tensor information from CASTEP and dipolarcouplings determined from the geometry was handled with in-housesoftware (available with the pNMRsim simulation program [48]). Thedynamics of 1H coupled networks are strongly determined by theroot-sum-square of the 1H dipolar couplings, drss, at a given site [6],and so the contributions of neglected protons outside the extracted‘cluster’ of spins to drss were compensated for by scaling the 1Hhomonuclear dipolar couplings so that the drss at one of themethylene 1H sites (H5 in GLYCIN20) of the reduced spin-systemmatched that of the extended lattice. This drss value converges to27:8 kHz when sufficient unit cells are considered (the value for theother methylene proton, H4, is very similar, 27:3 kHz). Note that drssfor H5 without motional averaging is 30:2 kHz. The heteronucleardipolar couplings were not scaled since the heteronuclear couplingsbetween Cα and non-methylene protons have a negligible effect onthe heteronuclear drss values. Spin systems with unscaled 1H homo-nuclear couplings were also created and used in indicated cases. The1H chemical shift referencing was chosen to bring the methyleneprotons on resonance by subtracting the calculated chemical shield-ing values from 26:56 ppm. The 13C chemical shift and the negligibleJ couplings were not included in the spin systems. The resulting 13C,(1H)n spin systems are given the labels CHn below.
Simulations of RF decoupling under magic-angle spinning wereperformed in Hilbert space with pNMRsim [48], using a minimumtime-step for propagator calculation of 1 μs. The theoretical
background to such simulations has been extensively described else-where [49–52]. The simulations started with a state of 13C x magne-tisation and measured the remaining x magnetisation as a function ofthe duration of the decoupling period to create a simulated free-induction decay (FID) or spin-echo decay. In spin-echo simulations, anideal refocusing π-pulse [53] was applied at the mid-point of therotation-synchronised decay time. Unless otherwise indicated, powderaverages were performed over all three Euler angles describing thecrystallite orientation, using 150 orientations distributed over a hemi-sphere generated with the ZCW algorithm [54–56]. Where the cycletimes of the RF pulse sequence and sample spinning are not toodissimilar, it is generally possible to find a common time base for boththe timing of the RF pulse sequence and MAS period. For phase-modulated RF pulse sequences, this allows the evolution of the densitymatrix to be determined from a limited number of propagatorsevaluated over a single period of rotation [11], greatly reducing thesimulation time, usually by an order of magnitude or more. T2relaxation can be safely omitted from these simulations by notingthat at room temperature the relaxation of the Cα site of glycine is inthe extreme narrowing limit where T1 ¼ T1ρ ¼ T2; relaxation timeconstants on the order of seconds have been observed experimentally[57], much longer than the maximum T 0
2 observed for this site [33].Although the 1H T1 is somewhat shorter (about 0.5–1 s), this is alsoorders of magnitude longer than the time constants for decay of the1H magnetisation due to “spin diffusion”. The fast dynamics of themethyl group is helpful in shortening T1 without contributing sig-nificantly to T1ρ. When comparing time constants for coherent decayfrom simulation, Tc
2, with experimental T 02 values, it is important to
take into account the inhomogeneity of the RF (B1) field in typicalNMR probes. The incorporation of RF inhomogeneity into the simula-tions is discussed in the SI.
Calculation times for the 10-spin CH9 system required onaverage about one hour per orientation. As an example, the resultsfor CH9 data set shown in Fig. 7 were acquired on an institutionalHPC cluster with the calculations for each powder orientation runin parallel on separate processors and required about 33,000 CPUhours. In contrast, the corresponding calculation times per orien-tation for the CH6 systems were about three seconds. This isconsistent with calculation times scaling as OðN3Þ, where N is thesize of the Hilbert space.
3. Simulation results
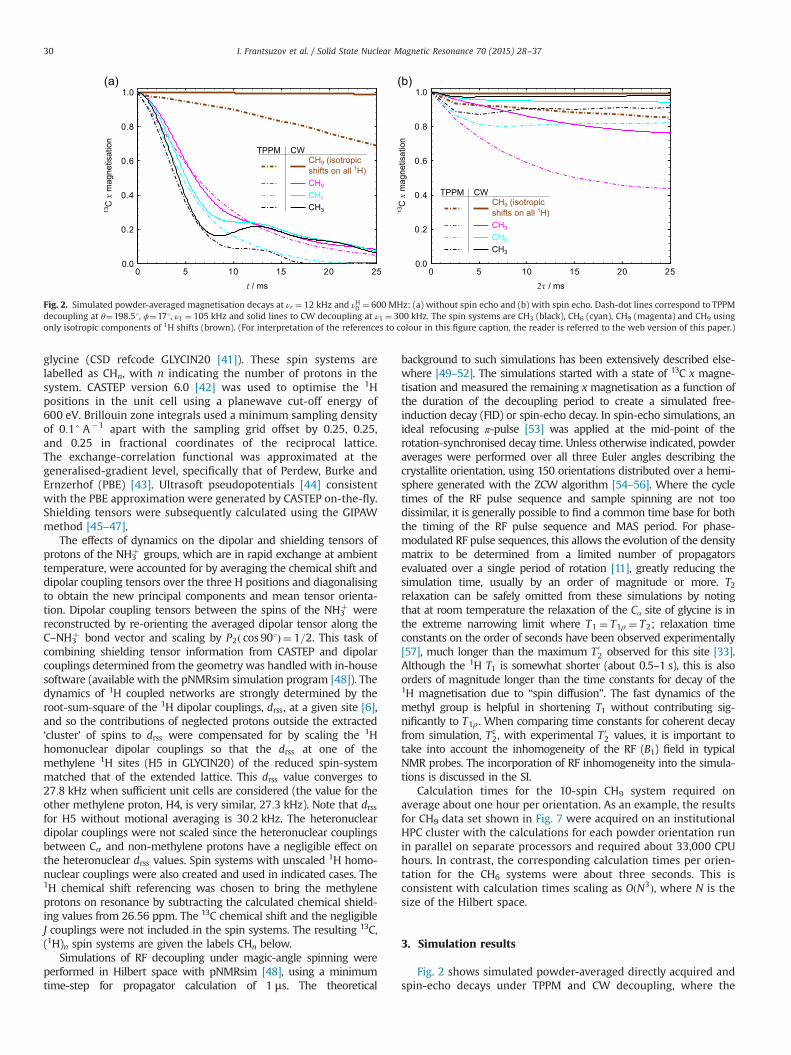
Fig. 2 shows simulated powder-averaged directly acquired andspin-echo decays under TPPM and CW decoupling, where the
Fig. 2. Simulated powder-averaged magnetisation decays at νr ¼ 12 kHz and νH0 ¼ 600 MHz: (a) without spin echo and (b) with spin echo. Dash-dot lines correspond to TPPMdecoupling at θ¼198.51, ϕ¼171, ν1 ¼ 105 kHz and solid lines to CW decoupling at ν1 ¼ 300 kHz. The spin systems are CH3 (black), CH6 (cyan), CH9 (magenta) and CH9 usingonly isotropic components of 1H shifts (brown). (For interpretation of the references to colour in this figure caption, the reader is referred to the web version of this paper.)
I. Frantsuzov et al. / Solid State Nuclear Magnetic Resonance 70 (2015) 28–3730

decoupling parameters have been chosen to result in similar ratesof decay. It can be seen in Fig. 2(a) that physically reasonabledecoherence is observed only when 1H CSA parameters areincluded. This contrasts to the observation that the decay of 1Hmagnetisation under simple MAS is essentially independent of theCSA parameters [7], but is consistent with the behaviour beinglargely determined by the second-order cross-terms between theheteronuclear dipolar couplings and 1H CSA tensors [58,59,13].The dynamics beyond the first few milliseconds depend on thesize of the spin system; both the monoexponentiality of the decaysand the observed Tc
2 tend to increase and converge to size-independent limits as the number of spins increases. The increasein Tc
2 with increasing spin-system size is consistent with increased“self-decoupling” in a larger dipolar-coupled network [60]. Thesetrends are similar for the two sequences.
Fig. 2(b) shows the decay of 13C magnetisation as a function ofthe spin-echo time 2τ, but with otherwise identical simulationconditions. The behaviour observed is markedly different, withincomplete decoherence of the starting magnetisation that tendstowards a plateau rather than decaying to zero. Although thisunphysical behaviour is reduced in the larger spin systems, theconvergence is much slower than observed without the spin echo.Simulations with a spin-echo pulse of varying tip angle showedbehaviour which evolved smoothly between the limits of no spin-echo and a full 1801 refocusing pulse, providing some reassurancethat the effects observed are not artifacts of an over-idealisedsimulation. The possible origins of this unexpected behaviour,which was also observed in test simulations of static samples, arediscussed below.
Analogous decay curves under XiX decoupling are shown inFig. 3. As for CW and TPPM, the Tc
2 tends to increase withincreasing spin-system size, with the larger spin-systems showingclearly monoexponential decays. In this case, neglecting the CSA of1H shift tensors (dashed lines) has a much smaller effect, which isconsistent with cross-terms between the heteronuclear and thehomonuclear dipolar couplings being the limiting factor for XiXdecoupling away from resonance conditions [61]. The spin-echodecays under XiX, Fig. 3(b), show similar unphysical incomp-lete decoherence, which is gradually reduced as more spinsare included in the simulation, as previously observed for CWand TPPM.
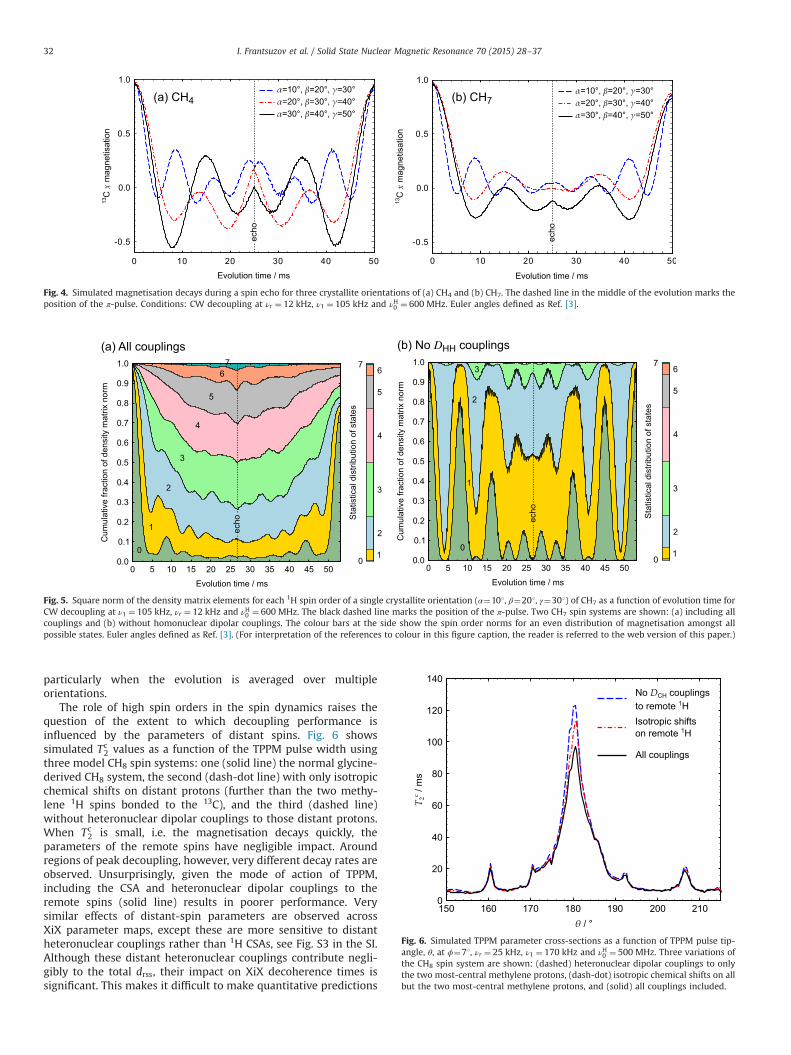
The failure of the simulated spin-echo curves to decay to zerowith increasing echo time is investigated in Fig. 4 using decaycurves for CH4 and CH7 spin systems under CW decoupling forthree non-special crystallite orientations. The first half, up to the πpulse at τ¼ 25 ms, shows the 13C magnetisation decaying towards
zero as expected, although there is still significant oscillatorybehaviour in the curves for individual orientations. These oscilla-tions, associated with the finite size of the spin systems, are afunction of the crystallite orientation, and so are effectivelydisguised by powder averaging, i.e. the success of the small spin-system simulations in reproducing realistic magnetisation decaysshould not be overplayed. As can be seen from the individualcurves, the π pulse has the effect of largely reversing the oscillatoryevolution, and the final amplitude, which corresponds to the2τ¼ 50 ms point in the spin-echo simulations shown in Fig. 2(b),is almost completely refocused.
Further insight is provided by analysing the evolution of thedensity matrix during the spin-echo simulations. Fig. 5 shows thedistribution of the matrix norm between the different 1H spinorders as a function of time for a sample crystallite orientationunder CW decoupling. The 1H spin order for a given element of thedensity matrix, ⟨ijσ j j⟩, corresponds to the number of 1H spins thatneed to be flipped to convert the bra i to the match the ket j.
Fig. 5(a) shows that the populated states initially all have a 1Hspin order of zero (corresponding to the starting state of pure 13Cmagnetisation), but the higher spin orders are quickly populateddue to “spin-diffusion” driven by the homonuclear 1H couplings.The distribution of magnetisation immediately before the π pulseis close to statistical (i.e. reflecting the relative numbers of states ofgiven order), but this evolution is mostly reversed by the π pulse.This behaviour is much more marked in the artificial system,Fig. 5(b), in which homonuclear couplings have been removed.Although the initial decay of spin order 0, due to the cross-termbetween the heteronuclear dipolar coupling and 1H CSA, is thesame in (a) and (b), the subsequent evolution shows muchstronger oscillations, with the higher spin orders being populatedmuch more slowly, and the starting 13C magnetisation is fullyrefocussed. It is clear that the homonuclear couplings have asignificant impact on the dynamics, but the underlying behaviouris still driven by the dipolar/CSA cross-term.
The unphysical refocusing of the magnetisation can only be anartifact of the finite size of the spin system, and has a significantimpact on the utility of simulations based on finite spin-systems.Such simulations can only be guaranteed to reflect experimentalobservations at short timescales before the higher spin orders arepopulated and the “phase space” of the simulations has been filled.In the real spin-system, the density matrix norm can spreadindefinitely into an infinite phase space, and a refocusing π pulseis unable to reverse this evolution. The essentially coherent natureof the evolution is less obvious in the absence of a refocusing pulseand the small system simulations are surprisingly effective [7],
Fig. 3. Simulated powder-averaged magnetisation decays under XiX decoupling at τp=τr ¼ 2:85, ν1 ¼ 170 kHz, νr ¼ 25 kHz and νH0 ¼ 500 MHz: (a) without spin echo and(b) with spin echo. The spin systems are CH3 (black), CH5 (green), CH7 (cyan), CH9 (magenta) and CH9 using only isotropic components of 1H shifts (dashed magenta). (Forinterpretation of the references to colour in this figure caption, the reader is referred to the web version of this paper.)
I. Frantsuzov et al. / Solid State Nuclear Magnetic Resonance 70 (2015) 28–37 31
particularly when the evolution is averaged over multipleorientations.
The role of high spin orders in the spin dynamics raises thequestion of the extent to which decoupling performance isinfluenced by the parameters of distant spins. Fig. 6 showssimulated Tc
2 values as a function of the TPPM pulse width usingthree model CH8 spin systems: one (solid line) the normal glycine-derived CH8 system, the second (dash-dot line) with only isotropicchemical shifts on distant protons (further than the two methy-lene 1H spins bonded to the 13C), and the third (dashed line)without heteronuclear dipolar couplings to those distant protons.When Tc
2 is small, i.e. the magnetisation decays quickly, theparameters of the remote spins have negligible impact. Aroundregions of peak decoupling, however, very different decay rates areobserved. Unsurprisingly, given the mode of action of TPPM,including the CSA and heteronuclear dipolar couplings to theremote spins (solid line) results in poorer performance. Verysimilar effects of distant-spin parameters are observed acrossXiX parameter maps, except these are more sensitive to distantheteronuclear couplings rather than 1H CSAs, see Fig. S3 in the SI.Although these distant heteronuclear couplings contribute negli-gibly to the total drss, their impact on XiX decoherence times issignificant. This makes it difficult to make quantitative predictions
(a) CH4 (b) CH7
Fig. 4. Simulated magnetisation decays during a spin echo for three crystallite orientations of (a) CH4 and (b) CH7. The dashed line in the middle of the evolution marks theposition of the π-pulse. Conditions: CW decoupling at νr ¼ 12 kHz, ν1 ¼ 105 kHz and νH0 ¼ 600 MHz. Euler angles defined as Ref. [3].
(a) All couplings (b) No DHH couplings
Fig. 5. Square norm of the density matrix elements for each 1H spin order of a single crystallite orientation (α¼101, β¼201, γ¼301) of CH7 as a function of evolution time forCW decoupling at ν1 ¼ 105 kHz, νr ¼ 12 kHz and νH0 ¼ 600 MHz. The black dashed line marks the position of the π-pulse. Two CH7 spin systems are shown: (a) including allcouplings and (b) without homonuclear dipolar couplings. The colour bars at the side show the spin order norms for an even distribution of magnetisation amongst allpossible states. Euler angles defined as Ref. [3]. (For interpretation of the references to colour in this figure caption, the reader is referred to the web version of this paper.)
Fig. 6. Simulated TPPM parameter cross-sections as a function of TPPM pulse tip-angle, θ, at ϕ¼71, νr ¼ 25 kHz, ν1 ¼ 170 kHz and νH0 ¼ 500 MHz. Three variations ofthe CH8 spin system are shown: (dashed) heteronuclear dipolar couplings to onlythe two most-central methylene protons, (dash-dot) isotropic chemical shifts on allbut the two most-central methylene protons, and (solid) all couplings included.
I. Frantsuzov et al. / Solid State Nuclear Magnetic Resonance 70 (2015) 28–3732

of peak decoupling since the dynamics clearly depend on both alarge number of spin parameters and having a large numbers ofspins i.e. it is not sufficient to ‘rescale’ the parameters of a smallspin-system simulation.
4. Can decoupling performance be predicted?
These results demonstrate that decay of nuclear spin magne-tisation under heteronuclear decoupling can only be effectivelysimulated using small spin-systems in a relatively narrow set ofcircumstances, for example, simulations of magnetisation decaysunder poor TPPM decoupling, Fig. 6, while simulating T 0
2 decays iseven more challenging due to unphysical refocusing effects. Asdiscussed in the introduction, state-space restriction methods[17,18,21,20,25] have recently been developed that allow muchlarger numbers of spins to be simulated, at the expense ofneglecting higher spin orders. This is effective in solution-stateNMR where the spin–spin couplings are relatively weak and high-order coherences relax quickly [22] — the high order coherencesdo not build up sufficient population to have much impact on thespin dynamics. However, in general, this approach is not suitablefor solids due to the strong couplings and slower relaxation. Forglycine in the solid state we can infer that T2 ¼ T1 ¼ 5 s, asdiscussed previously. Given that 12-spins are about the limit forHilbert-space simulation, we can estimate the maximum spin–spin couplings that would allow accurate simulation of the spindynamics for this relaxation rate. Following the procedure ofRef. [22], the couplings would have to be no more than 2.1 Hz if
the relaxation rates are proportional to the coherence order, n, asin solution-state. This value is at least an order of magnitudesmaller than the effective couplings observed in typical organicsolids under MAS, as shown by the time constants for decay of the13C magnetisation of 1–2 ms observed in Fig. 5. We assume thatthe scaling of the relaxation rate with coherence order is the samein molecular solids and liquids based on experimental observa-tions that relaxation in glycine is in the fast-motion limit [57], andnoting that the dynamics in the solid state are not dissimilar tothose in the solution state but just without translational degreesof freedom that are irrelevant to relaxation (with plastic crystalssuch as adamantane being an extreme example). If, however, weassume as Karabanov et al. [22] that the relaxation rates areproportional to
ffiffiffi
np
, then even smaller spin–spin couplings of lessthan 0.7 Hz would be needed for a realistic 12-spin simulation. Seethe SI for further discussion of relaxation in solids.
Nevertheless, restricted state-space simulations have had somesuccess for solid-state simulations in the absence of RF decoupling[23,24]. Similarly “effective field” approaches have been used [60]to describe the effects of decay of coherence into the 1H bath, butat the expense of introducing additional empirical parameters. Wecan somewhat crudely mimic these Liouville space simulationswithin the confines of a classical Hilbert space calculation byrepeatedly nulling the amplitudes of higher spin orders in thedensity matrix, e.g. every rotor period. This might approximate thebehaviour of an extended spin-system, with the magnetisationquickly evolving to higher spin orders and never returning.However, it was found (results not shown) that periodicallynulling just the highest spin order had little effect on the
Fig. 7. (a) Simulated TPPM parameter cross-sections as a function of spin-system size and TPPM pulse tip-angle, θ, at ϕ¼61, νr ¼ 12 kHz, ν1 ¼ 105 kHz and νH0 ¼ 600 MHz.(b, c) An example of two transfer functions between two pairs of spin systems, with the dashed lines representing fits to y¼ γx. Each circle corresponds to one of the 201 datapoints in (a). The correlation coefficients squared, r2, for the fits are indicated in parentheses.
I. Frantsuzov et al. / Solid State Nuclear Magnetic Resonance 70 (2015) 28–37 33

unphysical refocusing. Nulling more spin orders progressivelyreduced the amount of refocusing, but, by effectively introducingrelaxation to the decoherence, this artificially shortened the decayand so failed to reproduce the long-term evolution.
It is evident from previous literature [32,59,13] and the resultsabove that simulations involving relatively few spins, 2–4, canreproduce the qualitative performance of decoupling sequenceswith respect to their parameters. However, the quantitative valuesof decay rates obtained from simulation depend strongly on thesize of the spin system and the various parameters involved.Fig. 7(a) shows a cross-section of the TPPM parameter space at afixed phase excursion as a function of spin system size. Larger thanabout CH4, the patterns are more-or-less consistent, which sug-gests it might be possible to “rescale” the results from calculationson a small system onto those obtained from much costlier multi-spin calculations. This is illustrated in Fig. 7(b) and (c), whichplot the fitted Tc
2 values from simulations of one spin-systemagainst corresponding ones obtained using a different spin-system. Although the decoherence times observed in CH2 bearlittle correlation to those in CH9, there is a close-to-linear relation-ship between the results obtained from CH6 and CH9 systems.Given that each additional spin reduces the calculation efficiencyby close to an order of magnitude, there seems little value inperforming a calculation on a CH9 system if very similar resultscan be obtained by rescaling (by a factor of γ¼1.58) resultsobtained on simulations of a CH6 system. In principle, morecomplex analytical “transfer functions” could be used to performthis rescaling, but simple linear functions are adequate here.
Fig. 8(a) show the results of plotting the correlations illustratedin Fig. 7(b) and (c), and extracting a transfer function gradient, γ,for different pairs of spin systems. Trivially, the gradient tendstowards unity as the difference in the number of spins betweenthe two systems decreases to zero. Simulations using fewer thansix spins correlate poorly with larger simulations. On the otherhand, when more distant 1H spins are added, the transfer functiongradients and correlation coefficients both steadily tend towardsunity. The CH5 system corresponds to the methylene carbon plusall the hydrogen atoms of a single glycine molecule, but it is notsafe to assume that this explains the strong vs. erratic degree ofcorrelation for spin systems that are larger vs. smaller than five 1Hspins. The number of spins necessary to start seeing simulationresults representative of bulk behaviour is expected to depend onthe decoupling performance in that region of the parameter space,with smaller numbers of spins needed to reproduce the Tc
2 decayin regions of poor decoupling. The dashed line in Fig. 8(a) showsthe mapping onto the CH9 results where the homonuclear drss hasnot been scaled to match the limit of an infinitely large system.Although the scaling factors are slightly different, the trends arethe same, and so there is little advantage, in this case, of scalingthe strength of the homonuclear couplings to match the extendedlattice. It is worth noting that the transfer gradient increases as thehomonuclear coupling network is strengthened in going from theunscaled to the scaled drss, whereas it decreases when the size ofthe spin system increases. This suggests that it is the increased sizeof the Hilbert space, rather than the couplings themselves, that areresponsible for the trends with increasing spin system size. Thecomparison of transfer function gradients for XiX, Fig. 8(b), showsthe same overall trends as for TPPM, although there is a noticeableeven–odd alternation of the gradient values, which is slowlydamped as the size of the space increases. This has somesimilarities with the observation by Halse et al. of very strongeven–odd alternation when varying the maximum allowed spinorder in simulations of 1H spin diffusion in a static solid [25].
Fig. 9(a) compares fitted Tc2 values obtained from the five
largest spin-system simulations of Fig. 7(a), and the experimentalT 02 recorded under the same conditions, as described in the
Experimental section. The good agreement between the shape ofthe simulated and experimental parameter maps is reflected inFig. 9(c), which shows the mapping between the simulated Tc
2decay constants to corresponding experimental T 0
2 values. Notehow the very strong linear correlation between experimental T 0
2and simulated Tc
2 weakens as Tc2 increases beyond about 8 ms.
Comparison with Fig. 5(a) suggests that this corresponds to thepoint where the finite size of the spin system has an increasingimpact. The fact that the slope at smaller Tc
2 is close to unity,however, is of limited significance; other slices through theparameter surfaces show the same trends, but with differentslopes observed.
The comparison as a function of TPPM pulse phase, along a linepassing through several local optima close to the theoreticaloptimum θ¼ 1801= cos ðϕÞ [13], Fig. 9(b) and (d), is much poorer.Both sets of transfer functions in Fig. 9(c) and (d) show the samepattern of convergence towards the experimental results, withlargest deviations being observed for the longest decoherencetimes. The much weaker correlation observed in Fig. 9(d) isassociated with the significantly greater complexity of this cross-section through the parameter surface; it includes regions of verypoor decoupling, which are not well characterised by the choice ofsampling point for the T 0
2 decays, combined with regions of goodperformance which require large spin-systems to be accuratelydescribed. Note that the corrections for RF inhomogeneity havelittle impact on the depth of the minima around ϕ¼101 and 201,and so the discrepancies in this region are more likely to beassociated with inaccurate measurements of very short T 0
2 valuesrather than deficiencies of the calculations. Similarly poor correla-tions when multiple resonance conditions are involved are alsoobserved for XiX decoupling (Fig. S5 in the SupplementaryInformation).
It is worth considering whether the disagreement in Fig. 9(d) isrelated to the differences between the experiments and thesimulations. Firstly the experiments measure T 0
2, using a spin-echo to refocus inhomogeneous contributions to the decay rate(which are not present in simulation), but are compared tosimulated Tc
2 values, since T 02 simulations are complicated by
unphysical behaviour, cf. Fig. 2. All the experimental evidencesuggests that the positions of Tc
2 and T 02 optima are the same [62].
This was confirmed in correlation plots using experimental peakheight as the metric of experimental performance (Figs. S6 and S7in the Supplementary Information), which show the same beha-viour observed in Fig. 9. The simulations also assume that theinitial 13C magnetisation is uniform across all crystallite orienta-tions. Simulations of the orientation-dependence of the CP effi-ciency, however, show that 1H spin-diffusion during the contacttimes used (1.2 ms and 2.7 ms) results in close to uniform excita-tion. The final point of difference is that the simulations samplethe total remaining 13C magnetisation at the end of the decayperiod, but before acquisition, while the experimental measure-ment is based on the peak height of the methylene signal. Asdiscussed in the Experimental section, using the same decouplingduring spin-echo and acquisition periods minimises cases wheremagnetisation that has been retained during the decay periodrapidly dephases and is not observed in acquisition period.
5. Concluding remarks
We have tested the fundamental limitations of exact simula-tions of the heteronuclear decoherence times Tc
2 (directly observedFID) and T 0
2 (under a spin-echo) in the solid state under simulta-neous MAS and RF decoupling. Counterintuitively, a spin-echopulse on the observed nucleus is found to largely refocus the decayof 13C magnetisation. Increasing the size of the spin system
I. Frantsuzov et al. / Solid State Nuclear Magnetic Resonance 70 (2015) 28–3734

reduces the degree of refocusing, but it is not possible toreproduce experimental T 0
2 decays using the largest number ofcoupled spins that can be simulated exactly. Attempts to eliminatethis unphysical refocusing by suppressing higher order coherences(mimicking simulations in which the state space is restricted tolower spin orders) were unsuccessful. Turning this around, how-ever, we predict that liquid-crystalline materials, where the spinsystems are limited to the liquid crystal molecules, would showthis refocusing effect in spin-echo experiments.
In contrast, physically realistic Tc2 decays are obtained in
simulation, but the nuclear spin decoherence around regions ofgood decoupling is found to be very sensitive to the size of the spinsystem and the details of the various spin-system parameters,including 1H CSA parameters and/or dipolar couplings of distantspins. This makes quantitative prediction of peak decouplingperformance particularly problematic. High spin-order coherencesare rapidly populated, and while the experimental behaviour canbe qualitatively reproduced by mimicking the effects of 1H spindiffusion [1], it seems unlikely that simulations within a smallHilbert or Liouville space can quantitatively reproduce experi-mental behaviour without invoking adjustable and purely empiri-cal parameters. This contrasts to earlier work that found thatmodest numbers (9–10) of 1H spins were sufficient to predict theevolution of 1H magnetisation under MAS [7] without the need foradjustable parameters. The difference is presumably related to theshorter timescales for the decoherence of the 1H spin ordercompared to the much slower decay of 13C magnetisation underRF decoupling.
Investigating the dependence of Tc2 decays on spin-system size,
we find that the results for simulations in systems of 6–7 spins canoften be usefully mapped on to those from larger, costlier calcula-tions. Further increasing the size of the system leads to a mono-tonic rescaling of the decoherence times, and allows longerdecoherence times to be observed at decoupling optima, butwithout significantly altering the map of performance vs. decou-pling parameters. This confirms that an important determiningfactor in decoherence times is the size of “spin space” into whichthe magnetisation can spread. However, these ‘transfer functions’tend to vary between different parts of the parameter space andbetween decoupling sequences, limiting their applicability topredict quantitatively the performance of arbitrary sequences.This also implies that state-space restriction techniques willsimilarly struggle to reproduce the quantitative behaviour ofmany-spin systems under RF decoupling.
Mapping of simulation results onto experimental behaviour issignificantly less successful than mapping between simulationresults in differently sized spin systems. As seen in Fig. 9, simula-tions correlate very well with experimental behaviour in smoothlyvarying regions of the parameter space (subject to the limitationsof a finite simulation space discussed above). In regions where theparameter space is rapidly changing, however, there is not astraightforward mapping between experimental results and simu-lation. Considering Fig. 6, it is reasonable to suppose that thebehaviour in rapidly changing regions of the parameter space ishighly dependent on both long- and short-range NMR parametersas well as instrumental factors, such as RF inhomogeneity. In the
0.8
0.9
1.0
1.1
1.2
1.3
1.4
1.5
1.6
1.7
1.8
CH2 CH3 CH4 CH5 CH6 CH7 CH8 CH9
Map from
Tran
sfer
func
tion
grad
ient
, γMap to CH9
Map to CH9(no 1H drss scaling)
Map to CH8
Map to CH7
Map to CH6
Map to CH5
1.9
CH9CH8CH7CH6Map to: CH5
0.2
0.4
0.6
0.8
1.0
1.2
1.4
1.6
1.8
Tran
sfer
func
tion
grad
ient
, γ
Map to CH9
Map to CH8
Map to CH7
Map to CH6
Map to CH5
CH2 CH3 CH4 CH5 CH6 CH7 CH8 CH9
Map from
CH9CH8CH7CH6
Map toCH5
(a) TPPM (b) XiX
Fig. 8. Transfer function gradients for pairs of spin systems for (a) TPPM decoupling (conditions as Fig. 7) and (b) XiX decoupling (νr ¼ 25 kHz, ν1 ¼ 170 kHz andνH0 ¼ 500 MHz). The shaded regions indicate the linearity of the transfer functions, as measured by r2, as a pseudo-error bar, 7 ϵ where ϵ¼ 1�r2. The dashed line in(a) corresponds to spin systems where the homonuclear dipolar couplings were not scaled to match the drss of the extended structure.
I. Frantsuzov et al. / Solid State Nuclear Magnetic Resonance 70 (2015) 28–37 35

case of sequences such as XiX, the optimum decoupling conditionsresult from the interaction of multiple resonance conditions;quantitative prediction of decoupling performance in this situationis likely to be extremely challenging.
On the other hand, the optimum decoupling parameters arerobustly reproduced using a modest number of spins, and thestructure of the parameter maps is not sensitive to the parametersof remote spins. This is consistent with the routine experimentalpractice of optimising decoupling on a set-up system and using thesame decoupling sequence parameters for the sample under study; itwould not be possible to optimise experiments in this way if thepositions of decoupling optima were strongly dependent on theparameters of multiple spins. Similarly, it is quite practical to performmulti-variable parametrisations of the performance of a decouplingsequence using a 6–7 spin system under different conditions byexploiting the efficient simulation techniques used here. Whilequantitative prediction of the performance of different local optimawill remain a major challenge, this can be avoided in experimentalpractice by direct optimisation of the decoupling parameters [30].
Acknowledgments
This work was funded by Engineering and Physical SciencesResearch Council grant EP/H023291/1, and benefitted from dis-cussions within the context of the EPSRC-funded collaborativecomputational project for NMR crystallography (CCPNC).
Appendix A. Supplementary data
Supplementary information associated with this paper can befound in the online version at http://dx.doi.org/10.1016/j.ssnmr.2015.05.003. Supporting data allowing the reproduction of theresults presented can be found at http://dx.doi.org/10.15128/kk91fk96d.
References
[1] M. Ernst, J. Magn. Reson. 162 (1) (2003) 1–34. http://dx.doi.org/10.1016/S1090-7807(03)00074-0.
[2] P. Hodgkinson, Prog. Nucl. Magn. Reson. Spectrosc. 46 (2005) 197–222. http://dx.doi.org/10.1016/j.pnmrs.2005.04.002.
[3] P. Hodgkinson, L. Emsley, Prog. Nucl. Magn. Reson. Spectrosc. 36 (2000)201–239. http://dx.doi.org/10.1016/S0079-6565(99)00019-9.
[4] M. Bak, J.T. Rasmussen, N.C. Nielsen, J. Magn. Reson. 147 (2) (2000) 296–330.http://dx.doi.org/10.1006/jmre.2000.2179.
[5] M. Veshtort, R.G. Griffin, J. Magn. Reson. 178 (2) (2006) 248–282. http://dx.doi.org/10.1016/j.jmr.2005.07.018.
[6] V.E. Zorin, S.P. Brown, P. Hodgkinson, Mol. Phys. 104 (2) (2006) 293–304. http://dx.doi.org/10.1080/00268970500351052.
[7] V.E. Zorin, S.P. Brown, P. Hodgkinson, J. Chem. Phys. 125 (2006) 144508.[8] G. de Paëpe, D. Sakellariou, P. Hodgkinson, S. Hediger, L. Emsley, Chem. Phys.
Lett. 368 (2003) 511–522.[9] M. Leskes, R.S. Thakur, P.K. Madhu, N.D. Kurur, S. Vega, J. Chem. Phys. 127 (2)
(2007) 024501. http://dx.doi.org/10.1063/1.2746039.[10] J.M. Griffin, C. Tripon, A. Samoson, C. Filip, S.P. Brown, Magn. Reson. Chem. 45
(S1) (2007) S198–S208. http://dx.doi.org/10.1002/mrc.2145.[11] V.E. Zorin, M. Ernst, S.P. Brown, P. Hodgkinson, J. Magn. Reson. 192 (2) (2008)
183–196. http://dx.doi.org/10.1016/j.jmr.2008.02.012.
Fig. 9. Cross-sections through the TPPM parameter map as a function of spin system size and TPPM pulse tip-angle, θ, at νr ¼ 12 kHz, ν1 ¼ 105 kHz and νH0 ¼ 600 MHz: (a)ϕ¼61 and a range of pulse widths, (b) θ¼ 178:51= cos ðϕ=1:2Þ and a range of pulse phases. The vertical grey line marks the intersection of the two cross-sections. ApproximateT 02 values inferred from parameter map points at 2τ¼ 0;15 ms and 2τ¼ 0;20 ms for (a) and (b) respectively. The impact of ν1 inhomogeneity has been taken into account in
the simulated results using a quick, approximate method and more exactly in (a) and (b) respectively. Full T 02 decays were measured at the points marked with � and the
parameter map scaled to fit. Transfer functions mapping some of the simulations onto the experimental results are shown in (c) and (d) for the results in (a) and(b) respectively. The straight line in (c) marks Tc
2 ¼ T 02 as a guide to the eye.
I. Frantsuzov et al. / Solid State Nuclear Magnetic Resonance 70 (2015) 28–3736
[12] R.S. Thakur, N.D. Kurur, P.K. Madhu, J. Magn. Reson. 193 (1) (2008) 77–88.http://dx.doi.org/10.1016/j.jmr.2008.04.024.
[13] I. Scholz, P. Hodgkinson, B.H. Meier, M. Ernst, J. Chem. Phys. 130 (2009) 114510.[14] A.S. Tatton, I. Frantsuzov, S.P. Brown, P. Hodgkinson, J. Chem. Phys. 136 (2012)
084503. http://dx.doi.org/10.1063/1.3684879.[15] V.S. Mithu, P.K. Madhu, Chem. Phys. Lett. 556 (2013) 325–329. http://dx.doi.
org/10.1016/j.cplett.2012.11.016.[16] P. Hodgkinson, D. Sakellariou, L. Emsley, Chem. Phys. Lett. 326 (5–6) (2000)
515–522. http://dx.doi.org/10.1016/S0009-2614(00)00801-0.[17] I. Kuprov, N. Wagner-Rundell, P.J. Hore, J. Magn. Reson. 189 (2) (2007)
241–250. http://dx.doi.org/10.1016/j.jmr.2007.09.014.[18] I. Kuprov, J. Magn. Reson. 195 (1) (2008) 45–51. http://dx.doi.org/10.1016/j.
jmr.2008.08.008.[19] M.C. Butler, J.-N. Dumez, L. Emsley, Chem. Phys. Lett. 477 (2009) 377–381.[20] J.-N. Dumez, M.C. Butler, L. Emsley, J. Chem. Phys. 133 (2010) 224501. http:
//dx.doi.org/10.1063/1.3505455.[21] H.J. Hogben, P.J. Hore, I. Kuprov, J. Chem. Phys. 132 (17) (2010) 174101. http:
//dx.doi.org/10.1063/1.3398146.[22] A. Karabanov, I. Kuprov, G.T.P. Charnock, A. van der Drift, L.J. Edwards,
W. Kockenberger, J. Chem. Phys. 135 (8) (2011) 084106. http://dx.doi.org/10.1063/1.3624564.
[23] J.-N. Dumez, M.C. Butler, E. Salager, B. Elena-Herrmann, L. Emsley, Phys. Chem.Chem. Phys. 12 (2010) 9172–9175. http://dx.doi.org/10.1039/C0CP00050G.
[24] J.-N. Dumez, M.E. Halse, M.C. Butler, L. Emsley, Phys. Chem. Chem. Phys. 14(2012) 86–89. http://dx.doi.org/10.1039/C1CP22662B.
[25] M.E. Halse, J.-N. Dumez, L. Emsley, J. Chem. Phys. 136 (2012) 224511. http://dx.doi.org/10.1063/1.4726162.
[26] H. Geen, R. Graf, A.S. Heindrichs, B.S. Hickman, I. Schnell, H.W. Spiess,J.J. Titman, J. Magn. Reson. 138 (1) (1999) 167–172. http://dx.doi.org/10.1006/jmre.1999.1711.
[27] C.E. Hughes, Prog. Nucl. Magn. Reson. Spectrosc. 45 (3–4) (2004) 301–313.http://dx.doi.org/10.1016/j.pnmrs.2004.08.002.
[28] H.G. Krojanski, D. Suter, Phys. Rev. A 74 (2006) 062319. http://dx.doi.org/10.1103/PhysRevA.74.062319.
[29] A. Lesage, C. Auger, S. Caldarelli, L. Emsley, J. Am. Chem. Soc. 119 (33) (1997)7867–7868.
[30] G. de Paëpe, N. Giraud, A. Lesage, P. Hodgkinson, A. Böckmann, L. EmsleyJ. Am. Chem. Soc. 125 (46) (2003) 13938–13939. http://dx.doi.org/10.1021/ja037213j PMID:14611212.
[31] D.C. Apperley, R.K. Harris, P. Hodgkinson, Solid-State NMR: Basic Principles &Practice, Momentum Press, New York (2012) 109–140 (Chapter 5).
[32] A. Detken, E.H. Hardy, M. Ernst, B.H. Meier, Chem. Phys. Lett. 356 (3–4) (2002)298–304. http://dx.doi.org/10.1016/S0009-2614(02)00335-4.
[33] S.K. Vasa, H. Janssen, E.R.H. Van Eck, A.P.M. Kentgens, Phys. Chem. Chem. Phys.13 (2010) 104–106. http://dx.doi.org/10.1039/C0CP01929A.
[34] R.E. Taylor, Concepts Magn. Reson. A 22 (2) (2004) 79–89. http://dx.doi.org/10.1002/cmr.a.20015.
[35] C.E. Hughes, K.D.M. Harris, Chem. Commun. 46 (2010) 4982–4984. http://dx.doi.org/10.1039/C0CC01007C.
[36] E.V. Boldyreva, V.A. Drebushchak, T.N. Drebushchak, I.E. Paukov,Y.A. Kovalevskaya, E.S. Shutova, J. Therm. Anal. Calorim. 73 (2) (2003) 419–428.http://dx.doi.org/10.1023/A:1025457524874.
[37] A.E. Bennett, C.M. Rienstra, M. Auger, K.V. Lakshmi, R.G. Griffin, J. Chem. Phys.103 (16) (1995) 6951–6958. http://dx.doi.org/10.1063/1.470372.
[38] V.E. Zorin, B. Elena, A. Lesage, L. Emsley, P. Hodgkinson, Magn. Reson. Chem.45 (S1) (2007) S93–S100. http://dx.doi.org/10.1002/mrc.2108.
[39] J.D. van Beek, J. Magn. Reson. 187 (1) (2007) 19–26. http://dx.doi.org/10.1016/j.jmr.2007.03.017.
[40] MATLAB Release R2013b, The MathWorks Inc., Natick, MA, USA.[41] P. Langan, S.A. Mason, D. Myles, B.P. Schoenborn, Acta Crystallogr. B 58 (4)
(2002) 728–733. http://dx.doi.org/10.1107/S0108768102004263.[42] S.J. Clark, M.D. Segall, C.J. Pickard, P.J. Hasnip, M.I.J. Probert, K. Refson,
M.C. Payne, Z. Kristallogr. 220 (2005) 567–570. http://dx.doi.org/10.1524/zkri.220.5.567.65075.
[43] J.P. Perdew, K. Burke, M. Ernzerhof, Phys. Rev. Lett. 77 (1996) 3865–3868. http://dx.doi.org/10.1103/PhysRevLett.77.3865.
[44] D. Vanderbilt, Phys. Rev. B 41 (1990) 7892–7895. http://dx.doi.org/10.1103/PhysRevB.41.7892.
[45] C.J. Pickard, F. Mauri, Phys. Rev. B 63 (2001) 245101. http://dx.doi.org/10.1103/PhysRevB.63.245101.
[46] R.K. Harris, P. Hodgkinson, C.J. Pickard, J.R. Yates, V. Zorin, Magn. Reson. Chem.45 (S1) (2007) S174–S186. http://dx.doi.org/10.1002/mrc.2132.
[47] C. Bonhomme, C. Gervais, F. Babonneau, C. Coelho, F. Pourpoint, T. Azaïs,S.E. Ashbrook, J.M. Griffin, J.R. Yates, F. Mauri, C.J. Pickard, Chem. Rev. 112 (11)(2012) 5733–5779. http://dx.doi.org/10.1021/cr300108a.
[48] P. Hodgkinson, pNMRsim: A General Simulation Program for Large Problemsin Solid-State NMR, URL: ⟨http://www.durham.ac.uk/paul.hodgkinson/pNMRsim⟩.
[49] P. Hodgkinson, L. Emsley, Prog. Nucl. Magn. Reson. Spectrosc 36 (3) (2000)201–239.
[50] M. Bak, J.T. Rasmussen, N.C. Nielsen, J. Magn. Reson. 147 (2000) 296–330.[51] M. Edén, Concepts Magn. Reson. 17A (2003) 117–154.[52] M. Veshtort, R.G. Griffin, J. Magn. Reson. 178 (2006) 248–282.[53] N.S. Barrow, J.R. Yates, S.A. Feller, D. Holland, S.E. Ashbrook, P. Hodgkinson,
S.P. Brown, Phys. Chem. Chem. Phys. 13 (2011) 5778–5789. http://dx.doi.org/10.1039/C0CP02343D.
[54] S.K. Zaremba, Ann. Mat. Pura Appl. 73 (1966) 293–317. http://dx.doi.org/10.1007/BF02415091.
[55] H. Conroy, J. Chem. Phys. 47 (12) (1967) 5307–5318. http://dx.doi.org/10.1063/1.1701795.
[56] V.B. Cheng, H.H. Suzukawa Jr., M. Wolfsberg, J. Chem. Phys. 59 (8) (1973)3992–3999. http://dx.doi.org/10.1063/1.1680590.
[57] A. Krushelnitsky, R. Kurbanov, D. Reichert, G. Hempel, H. Schneider,V. Fedotov, Solid State Nucl. Magn. Reson. 22 (4) (2002) 423–438. http://dx.doi.org/10.1006/snmr.2002.0071.
[58] M. Ernst, S. Bush, A.C. Kolbert, A. Pines, J. Chem. Phys. 105 (9) (1996)3387–3397. http://dx.doi.org/10.1063/1.472224.
[59] M. Ernst, A. Samoson, B.H. Meier, J. Chem. Phys. 123 (6) (2005) 064102. http://dx.doi.org/10.1063/1.1944291.
[60] M. Ernst, A. Verhoeven, B.H. Meier, J. Magn. Reson. 130 (1998) 176–185.[61] M. Ernst, H. Geen, B.H. Meier, Solid State Nucl. Magn. Reson. 29 (1–3) (2006)
2–21. http://dx.doi.org/10.1016/j.ssnmr.2005.08.004.[62] G. de Paëpe, B. Elena, L. Emsley, J. Chem. Phys. 121 (7) (2004) 3165–3180.[63] P. Tekely, P. Palmas, D. Canet, J. Magn. Reson. Ser. A 107 (1994) 129–133. http:
//dx.doi.org/10.1006/jmra.1994.1059.
I. Frantsuzov et al. / Solid State Nuclear Magnetic Resonance 70 (2015) 28–37 37