solid-state nmr spectroscopy of human …€¦ · · 2008-04-18niques including infrared,...
TRANSCRIPT
Solid-State NMR Spectroscopy of Human ImmunodeficiencyVirus Fusion Peptides Associated with Host-Cell-Like
Membranes: 2D Correlation Spectra and DistanceMeasurements Support a Fully Extended Conformation and
Models for Specific Antiparallel Strand Registries
Wei Qiang, Michele L. Bodner, and David P. Weliky*
Department of Chemistry, Michigan State UniVersity, East Lansing, Michigan 48824
Received September 20, 2007; E-mail: [email protected]
Abstract: The human immunodeficiency virus (HIV) is “enveloped” by a membrane, and infection of ahost cell begins with fusion between viral and target cell membranes. Fusion is catalyzed by the HIV gp41protein which contains a functionally critical ∼20-residue apolar “fusion peptide” (HFP) that associateswith target cell membranes. In this study, chemically synthesized HFPs were associated with host-cell-likemembranes and had “scatter-uniform” labeling (SUL), that is, only one residue of each amino acid typewas U-13C, 15N labeled. For the first sixteen HFP residues, an unambiguous 13C chemical shift assignmentwas derived from 2D 13C/13C correlation spectra with short mixing times, and the shifts were consistentwith continuous �-strand conformation. 13C-13C contacts between residues on adjacent strands werederived from correlation spectra with long mixing times and suggested close proximity of the followingresidues: Ala-6/Gly-10, Ala-6/Phe-11, and Ile-4/Gly-13. Specific antiparallel �-strand registries were furthertested using a set of HFPs that were 13CO-labeled at Ala-14 and 15N-labeled at either Val-2, Gly-3, Ile-4,or Gly-5. The solid-state NMR data were fit with 50–60% population of antiparallel HFP with either Ala-14/Gly-3 or Ala-14/Ile-4 registries and 40–50% population of structures not specified by the NMRexperiments. The first two registries correlated with intermolecular hydrogen bonding of 15–16 apolarN-terminal residues and this hydrogen-bonding pattern would be consistent with a predominant location ofthese residues in the hydrophobic membrane interior. To our knowledge, these results provide the firstresidue-specific structural models for membrane-associated HFP in its �-strand conformation.
1. Introduction
Many viruses important in disease including human immu-nodeficiency virus (HIV) are “enveloped” by a membrane whichis obtained after budding from a host cell. Infection of a newcell is accomplished by fusion between viral and target cellmembranes with the end result of release of the viral nucleo-capsid into the host cell cytoplasm. Fusion is catalyzed by thegp41 integral membrane protein of HIV that contains a ∼170-residue “ectodomain” which lies outside the virus and has a∼20-residue apolar “fusion peptide” (HFP) at its N-terminus.1,2
The HFP is believed to bind to the host cell membrane and toplay an important role in fusion catalysis.3–6 Peptides with theHFP sequence catalyze fusion between unilamellar lipid vesiclesand the experimental correlation between the mutation/fusion
activity relationships of HIV, and HFP-induced fusion providesevidence that the HFP is a useful model fusion system.3–5,7–9
X-ray and liquid-state nuclear magnetic resonance (NMR)structures have been determined for the “soluble ectodomain”which lacked the HFP and was soluble in nondetergentcontaining aqueous solution. Residues 30–147 of this domainhad a trimeric bundle structure.1,10,11 The structure of monomericHFP in detergent micelles has been determined using liquid-state NMR and showed R helical structure which may becontinuous between Ile-4 and Met-19.12–15 Biophysical tech-
(1) Eckert, D. M.; Kim, P. S. Annu. ReV. Biochem. 2001, 70, 777–810.(2) Jahn, R.; Lang, T.; Sudhof, T. C. Cell 2003, 112, 519–533.(3) Freed, E. O.; Myers, D. J.; Risser, R. Proc. Natl. Acad. Sci. U.S.A.
1990, 87, 4650–4654.(4) Freed, E. O.; Delwart, E. L.; Buchschacher, G. L., Jr.; Panganiban,
A. T. Proc. Natl. Acad. Sci. U.S.A. 1992, 89, 70–74.(5) Schaal, H.; Klein, M.; Gehrmann, P.; Adams, O.; Scheid, A. J. Virol.
1995, 69, 3308–3314.(6) Delahunty, M. D.; Rhee, I.; Freed, E. O.; Bonifacino, J. S. Virology
1996, 218, 94–102.
(7) Durell, S. R.; Martin, I.; Ruysschaert, J. M.; Shai, Y.; Blumenthal, R.Mol. Membr. Biol. 1997, 14, 97–112.
(8) Pereira, F. B.; Goni, F. M.; Muga, A.; Nieva, J. L. Biophys. J. 1997,73, 1977–1986.
(9) Kliger, Y.; Aharoni, A.; Rapaport, D.; Jones, P.; Blumenthal, R.; Shai,Y. J. Biol. Chem. 1997, 272, 13496–13505.
(10) Tan, K.; Liu, J.; Wang, J.; Shen, S.; Lu, M. Proc. Natl. Acad. Sci.U.S.A. 1997, 94, 12303–12308.
(11) Caffrey, M.; Cai, M.; Kaufman, J.; Stahl, S. J.; Wingfield, P. T.; Covell,D. G.; Gronenborn, A. M.; Clore, G. M. EMBO J. 1998, 17, 4572–4584.
(12) Chang, D. K.; Cheng, S. F.; Chien, W. J. J. Virol. 1997, 71, 6593–6602.
(13) Morris, K. F.; Gao, X. F.; Wong, T. C. Biochim. Biophys. Acta 2004,1667, 67–81.
(14) Jaroniec, C. P.; Kaufman, J. D.; Stahl, S. J.; Viard, M.; Blumenthal,R.; Wingfield, P. T.; Bax, A. Biochemistry 2005, 44, 16167–16180.
(15) Li, Y. L.; Tamm, L. K. Biophys. J. 2007, 93, 876–885.
Published on Web 03/28/2008
10.1021/ja077302m CCC: $40.75 2008 American Chemical Society J. AM. CHEM. SOC. 2008, 130, 5459–5471 9 5459

niques including infrared, circular dichroism, and solid-stateNMR spectroscopies have been used to investigate the confor-mation of membrane-associated HFP.8,16,17 Distinct populationsof HFP were observed with either predominant R helical or�-strand conformations, and the relative ratio of these twopopulations was dependent on the peptide/lipid ratio, themembrane composition, and the concentrations of ions such asCa2+.16,17 As one specific example, R helical conformation wasfavored in membranes lacking cholesterol and �-strand confor-mation was favored in membranes containing the ∼30 mol%cholesterol typical for host cells of HIV.18–21
For peptides and proteins, solid-state NMR has had greatutility in developing and testing local structural models primarilythrough incorporation of a few specific isotopic labels andmeasurement of a few distances or torsion angles.22–26 In a fewcases, analysis of many differently labeled samples has led tomore global structures.27,28 During the past ten years, there hasbeen a significant progress in the study of U-15N, andU-13C,15N-labeled solid peptides and proteins with the goalof sequential 13C, 15N, and possibly 1H assignments and thegoal of three-dimensional structures based on chemical shiftsand internuclear distance and torsion angle constraints. Forexample, there have been backbone structures of 20–60 residuepeptides and proteins which were membrane-associated andstrongly aligned in the NMR field.29 In addition, there have beenunambiguous sequential assignments of U-13C,15N solid pep-tides and small proteins determined from 2D and 3D magicangle spinning (MAS) correlation spectra as well as a few 3Dstructures based on these types of spectra.30–40 In many cases,the peptides and proteins were in microcrystalline form with
high structural homogeneity and narrow linewidths (e.g., ∼0.5ppm) and high concentrations (e.g., ∼100 mM).41 In a few cases,the peptides or proteins were in well-ordered fibrillar forms orwere tightly bound to other proteins. For one case, the 52-residuemembrane protein phospholamban was incorporated into mem-branes at protein/lipid of ∼0.05.42 The solid-state NMR structurecontained a helical C-terminal transmembrane domain and adisordered N-terminal domain and differed from the liquid-stateNMR structure in micelles for which the N-terminal domainwas helical and at right angles to the C-terminal helix.43
Analysis of 2D 13C/13C and 15N/13C spectra for membrane-associated HFP which was uniformly labeled yielded aminoacid-type rather than sequential assignment because of largespectral overlap of different crosspeaks.44 This overlap was dueto the 1–3 ppm spectral linewidths and to the redundancy ofamino acid types in the sequence, for example, six glycines andfive alanines. Similar linewidths were observed in the spectraof the 40-residue � amyloid peptide in its fibrillar form and anunambiguous assignment was achieved with peptides synthe-sized with “scatter-uniform” labeling (SUL) in which only oneresidue of each amino acid type was U-13C,15N labeled.45 Theassignment was based in large part on 13C/13C correlation spectrawith short (e10 ms) mixing times that yielded only intraresiduecrosspeaks whose chemical shifts could be assigned from thecharacteristic shifts of each amino acid. The chemical shifts werethen correlated with residue-specific conformation, and �-strandand non-�-strand regions of the �-amyloid sequence wereidentified. The structural arrangements of adjacent SUL �-amy-loid peptides were also determined in part from 13C/13C spectrawith long (g500 ms) mixing times for which crosspeaks couldbe observed between 13C separated by up to 7 Å.46 A similarapproach was applied to membrane-associated SUL peptidesrepresenting the transmembrane domain of the HIV Vpu ionchannel.47
In the present study, 13C/13C correlation spectra were obtainedfor SUL-HFPs associated with host-cell-like membranes andan unambiguous 13C assignment was achieved for all of thelabeled residues. In addition, interpeptide contacts were deter-mined from SUL spectra and led to specific tertiary structuremodels which were subsequently tested and validated withinternuclear distance measurements on specifically labeled HFPs.To our knowledge, these results provide the first residue-specific
(16) Rafalski, M.; Lear, J. D.; DeGrado, W. F. Biochemistry 1990, 29,7917–7922.
(17) Nieva, J. L.; Nir, S.; Muga, A.; Goni, F. M.; Wilschut, J. Biochemistry1994, 33, 3201–3209.
(18) Aloia, R. C.; Tian, H.; Jensen, F. C. Proc. Natl. Acad. Sci. U.S.A.1993, 90, 5181–5185.
(19) Wasniewski, C. M.; Parkanzky, P. D.; Bodner, M. L.; Weliky, D. P.Chem. Phys. Lipids 2004, 132, 89–100.
(20) Zheng, Z.; Yang, R.; Bodner, M. L.; Weliky, D. P. Biochemistry 2006,45, 12960–12975.
(21) Brugger, B.; Glass, B.; Haberkant, P.; Leibrecht, I.; Wieland, F. T.;Krasslich, H. G. Proc. Natl. Acad. Sci. U.S.A. 2006, 103, 2641–2646.
(22) Long, J. R.; Shaw, W. J.; Stayton, P. S.; Drobny, G. P. Biochemistry2001, 40, 15451–15455.
(23) Murphy, O. J., III; Kovacs, F. A.; Sicard, E. L.; Thompson, L. K.Biochemistry 2001, 40, 1358–1366.
(24) Smith, S. O.; Eilers, M.; Song, D.; Crocker, E.; Ying, W. W.;Groesbeek, M.; Metz, G.; Ziliox, M.; Aimoto, S. Biophys. J. 2002,82, 2476–2486.
(25) Toke, O.; Maloy, W. L.; Kim, S. J.; Blazyk, J.; Schaefer, J. Biophys.J. 2004, 87, 662–674.
(26) Abu-Baker, S.; Lorigan, G. A. Biochemistry 2006, 45, 13312–13322.(27) Ketchem, R. R.; Hu, W.; Cross, T. A. Science 1993, 261, 1457–60.(28) Lansbury, P. T., Jr.; Costa, P. R.; Griffiths, J. M.; Simon, E. J.; Auger,
M.; Halverson, K. J.; Kocisko, D. A.; Hendsch, Z. S.; Ashburn, T. T.;Spencer, R. G.; Tidor, B.; Griffin, R. G. Nat. Struct. Biol. 1995, 2,990–998.
(29) Marassi, F. M.; Opella, S. J. Protein Sci. 2003, 12, 403–411.(30) Pauli, J.; Baldus, M.; van Rossum, B.; de Groot, H.; Oschkinat, H.
Chembiochem 2001, 2, 272–281.(31) Castellani, F.; van Rossum, B.; Diehl, A.; Schubert, M.; Rehbein, K.;
Oschkinat, H. Nature 2002, 420, 98–102.(32) Bockmann, A.; Lange, A.; Galinier, A.; Luca, S.; Giraud, N.; Juy,
M.; Heise, H.; Montserret, R.; Penin, F.; Baldus, M. J. Biomol. NMR2003, 27, 323–339.
(33) Zech, S. G.; Wand, A. D.; McDermott, A. E. J. Am. Chem. Soc. 2005,127, 8618–8626.
(34) Marulanda, D.; Tasayco, M. L.; Cataldi, M.; Arriaran, V.; Polenova,T. J. Phys. Chem. B 2005, 109, 18135–18145.
(35) Franks, W. T.; Zhou, D. H.; Wylie, B. J.; Money, B. G.; Graesser,D. T.; Frericks, H. L.; Sahota, G.; Rienstra, C. M. J. Am. Chem. Soc.2005, 127, 12291–12305.
(36) Lange, A.; Giller, K.; Hornig, S.; Martin-Eauclaire, M. F.; Pongs, O.;Becker, S.; Baldus, M. Nature 2006, 440, 959–962.
(37) Reuther, G.; Tan, K. T.; Kohler, J.; Nowak, C.; Pampel, A.; Arnold,K.; Kuhlmann, J.; Waldmann, H.; Huster, D. Angew. Chem. Intl. Ed.2006, 45, 5387–5390.
(38) Jaroniec, C. P.; MacPhee, C. E.; Astrof, N. S.; Dobson, C. M.; Griffin,R. G. Proc. Natl. Acad. Sci. U.S.A. 2002, 99, 16748–16753.
(39) van Gammeren, A. J.; Hulsbergen, F. B.; Hollander, J. G.; de Groot,H. J. M. J. Biomol. NMR 2005, 31, 279–293.
(40) Todokoro, Y.; Yumen, I.; Fukushima, K.; Kang, S. W.; Park, J. S.;Kohno, T.; Wakamatsu, K.; Akutsu, H.; Fujiwara, T. Biophys. J. 2006,91, 1368–1379.
(41) Andersson, K. M.; Hovmöller, S. Acta Crystallogr. D 2000, 56, 789–790.
(42) Andronesi, O. C.; Becker, S.; Seidel, K.; Heise, H.; Young, H. S.;Baldus, M. J. Am. Chem. Soc. 2005, 127, 12965–12974.
(43) Zamoon, J.; Mascioni, A.; Thomas, D. D.; Veglia, G. Biophys. J. 2003,85, 2589–2598.
(44) Bodner, M. L.; Gabrys, C. M.; Struppe, J. O.; Weliky, D. P. J. Chem.Phys. 2008, 128, 052319.
(45) Petkova, A. T.; Ishii, Y.; Balbach, J. J.; Antzutkin, O. N.; Leapman,R. D.; Delaglio, F.; Tycko, R. Proc. Natl. Acad. Sci. U.S.A. 2002, 99,16742–16747.
(46) Paravastu, A. K.; Petkova, A. T.; Tycko, R. Biophys. J. 2006, 90,4618–4629.
(47) Sharpe, S.; Yau, W. M.; Tycko, R. Biochemistry 2006, 45, 918–933.
5460 J. AM. CHEM. SOC. 9 VOL. 130, NO. 16, 2008
A R T I C L E S Qiang et al.
structural model for HFP in its �-strand form conformationwhich is dominant when HFP associates with membranes whoselipid and headgroup composition is comparable to that of hostcells of the virus.18–21,48,49 There have been previous measure-ments of some of the backbone 13CO (carbonyl) chemical shiftsof specifically labeled HFPs but these data did not distinguishbetween the fully extended and hairpin structural models whichhave been proposed in the literature.48,50,51 There are severalconserved glycines in the sequence and either hairpin or fullyextended conformations are plausible. In addition, there has beendetection of distance proximity between 13CO nuclei on onestrand and 15N nuclei on an adjacent strand in samplescontaining a HFP with 13CO labeling at three consecutiveresidues and a HFP with 15N labeling at three consecutiveresidues.52 This study suggested a mixture of parallel andantiparallel arrangements but the registries were not clearlydefined in part because of the multiple labels.
The number or number distribution of HFPs in the �-strandoligomer is not known although there is evidence that thenumber is small (<100). Evidence supporting the small sizeincludes narrower linewidths in unfrozen samples relative tofrozen samples and the 5–6 Å distances between the 31Ps inthe lipid headgroups and the 13COs of the Ala-14 to Gly-16residues.53,54 In larger aggregates, thermally induced motionalnarrowing effects will be minimized and most of the HFPswould be segregated from the membrane lipids. The biologicalrelevance of small HFP aggregates is supported by experimentaland modeling evidence that there are clusters of gp41 trimersat the fusion site.4,55
2. Experimental Methods
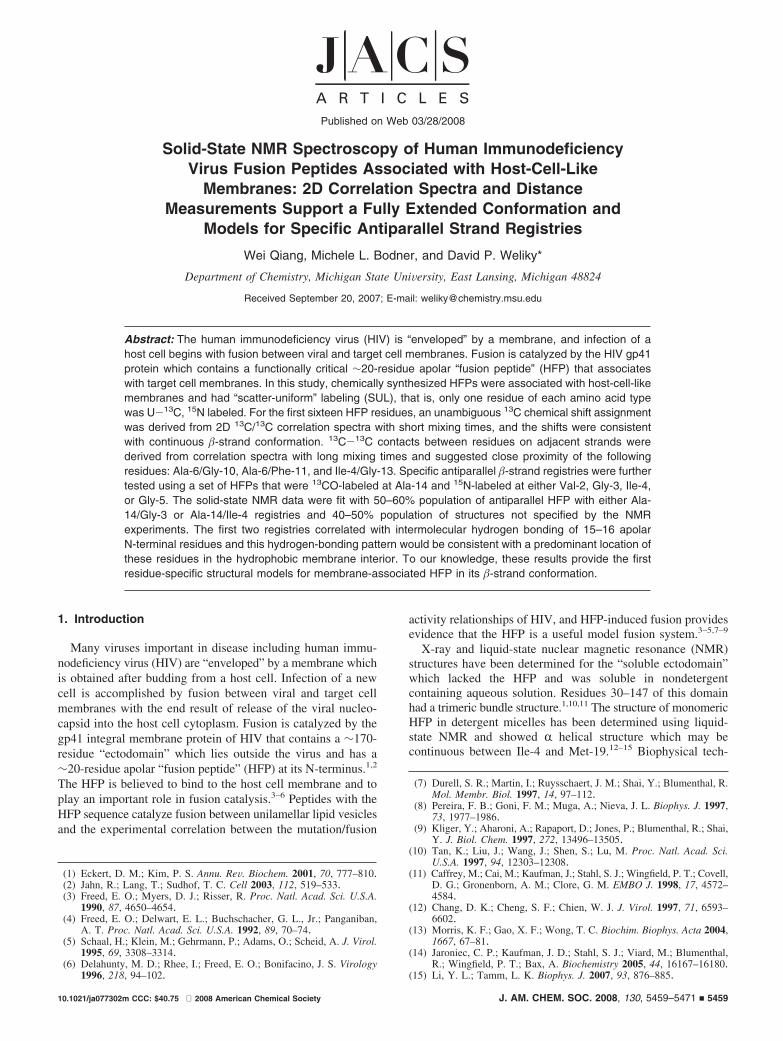
Peptides. Resins and 9-fluorenylmethoxycarbonyl (FMOC)protected amino acids were purchased from Peptides InternationalInc. (Louisville, KY). Labeled amino acids were obtained fromCambridge Isotope Laboratories (Andover, MA) and were FMOC-protected using literature methods.56 Peptide sequences and labelingare listed in Figure 1. All peptides began with the 23-residueN-terminal residues of gp41 (AVGIGALFLGFLGAAGSTMGARS)followed by a non-native C-terminal sequence that contained lysinesto improve HFP aqueous solubility and tryptophan as a A280
chromophore. Although some HFPs contained a cysteine, they werepredominantly non-cross-linked as judged by monomeric molecularweight in analysis of ultracentrifugation data.57,58 HFP-A,B,C,D,E,Fhad SUL and HFP-G,H,I,J,K had selective 13CO and 15N labeling.
HFP-A,B,C,D,E were made with a peptide synthesizer (AppliedBiosystems 431A, Foster City, CA), and HFP-F,G,H,I,J,K were
synthesized using a 15 mL manual reaction vessel (PeptidesInternational, Louisville, KY) and FMOC chemistry. Peptides werecleaved from the resin for 2–3 h using either a mixture oftrifluoroacetic acid (TFA)/water/phenol/thioanisole/ethanedithiol/water in a 33:2:2:2:1 volume ratio or a mixture of TFA/thioanisole/ethanedithiol/anisole in a 90:5:3:2 volume ratio. TFA was removedfrom the cleavage filtrate with nitrogen gas and peptides wereprecipitated with cold tert-butyl methyl ether. Peptides were purifiedby reversed-phased high performance liquid chromatography(HPLC) using a semipreparative C18 column and a water-acetonitrilegradient containing 0.1% TFA. Mass spectroscopy was used forpeptide identification.
Preparation of Solid-State NMR Samples. HFP was incorpo-rated into membranes in a manner comparable to that of functionalfusion assays.57 The samples were made with lipid and cholesterolmixtures reflecting the approximate lipid headgroup and choles-terol content of host cells infected by the HIV virus.18 ForHFP-A,B,C,D,E, the “LM3” mixture contained 1-palmitoyl-2-oleoyl-sn-glycero-3-phosphocholine (POPC), 1-palmitoyl-2-oleoyl-sn-glycero-3-phosphoethanolamine (POPE), 1-palmitoyl-2-oleoyl-sn-glycero-3-[phospho-L-serine] (POPS), phosphatidylinositol (PI),sphingomyelin, and cholesterol in a 10:5:2:1:2:10 molar ratio. LM3contained the approximate lipid headgroup and cholesterol com-position of membranes of host cells of HIV.18,21 For HFP-F,G,H,I,J,K the “PC/PG/CHOL” mixture consisted of 1,2-di-O-tetradecyl-sn-glycero-3-phosphocholine (DTPC), 1,2-di-O-tetradecyl-sn-glycero-3-[phospho-rac-(1-glycerol)] (DTPG), and cholesterolin a 8:2:5 molar ratio. Use of the ether-linked lipids DTPC andDTPG eliminated natural abundance lipid 13CO signals andprovided for more straightforward NMR analysis. Peptide confor-mation was not affected by the substitution.20 Each samplepreparation began with dissolution in chloroform of 30 total µmolof lipid and cholesterol. The chloroform was removed under astream of nitrogen followed by overnight vacuum pumping. Thelipid film was suspended in 2 mL of 5 mM N-(2-hydroxy-ethyl)piperazine-N′-2-ethanesulfonic acid (HEPES) buffer with pH) 7.0 and 0.01% NaN3 and was homogenized with ten freeze–thawcycles. Large unilamellar vesicles were formed by extrusion througha 100 nm diameter polycarbonate filter (Avestin, Ottawa, ON). Formost samples, a 0.8 µmol aliquot of HFP (as determined using ε280
) 5700 cm-1 M-1) was dissolved in 2 mL of HEPES buffer, andthe HFP and vesicle solutions were then gently vortexed together.The mixture was refrigerated overnight and ultracentrifuged at∼150000g for five hours. The membrane pellet with associatedbound HFP was transferred to a 4 mm diameter MAS NMR rotor.The unbound HFP does not pellet under these conditions.48
Previous studies have shown that HFP forms �-strand oligomersor aggregates when associated with cholesterol-containing mem-branes.52,59 Although HFP can aggregate in aqueous bufferedsolution under certain conditions, it is more biologically relevantthat HFP be monomeric in solution prior to membrane binding so
(48) Yang, J.; Gabrys, C. M.; Weliky, D. P. Biochemistry 2001, 40, 8126–8137.
(49) Yang, J.; Parkanzky, P. D.; Bodner, M. L.; Duskin, C. G.; Weliky,D. P. J. Magn. Reson. 2002, 159, 101–110.
(50) Taylor, S. E.; Desbat, B.; Blaudez, D.; Jacobi, S.; Chi, L. F.; Fuchs,H.; Schwarz, G. Biophys. Chem. 2000, 87, 63–72.
(51) Haque, M. E.; Koppaka, V.; Axelsen, P. H.; Lentz, B. R. Biophys. J.2005, 89, 3183–3194.
(52) Yang, J.; Weliky, D. P. Biochemistry 2003, 42, 11879–11890.(53) Bodner, M. L.; Gabrys, C. M.; Parkanzky, P. D.; Yang, J.; Duskin,
C. A.; Weliky, D. P. Magn. Reson. Chem. 2004, 42, 187–194.(54) Qiang, W.; Yang, J.; Weliky, D. P. Biochemistry 2007, 46, 4997–
5008.(55) Munoz-Barroso, I.; Durell, S.; Sakaguchi, K.; Appella, E.; Blumenthal,
R. J. Cell Biol. 1998, 140, 315–323.(56) Lapatsanis, L.; Milias, G.; Froussios, K.; Kolovos, M. Synthesis
(Stuttgart) 1983, 8, 671–673.(57) Yang, R.; Prorok, M.; Castellino, F. J.; Weliky, D. P. J. Am. Chem.
Soc. 2004, 126, 14722–14723.(58) Bodner, M. L. Ph.D. Dissertation. Michigan State University, East
Lansing, MI, 2006.(59) Yang, J.; Prorok, M.; Castellino, F. J.; Weliky, D. P. Biophys. J. 2004,
87, 1951–1963.
Figure 1. Peptide sequences and labeling with blue, green, and redrespectively, corresponding to 13CO, 15N, and U-13C, 15N labeling.
J. AM. CHEM. SOC. 9 VOL. 130, NO. 16, 2008 5461
NMR Spectroscopy of HIV Fusion Peptides A R T I C L E S

that the oligomeric structure is a result of membrane binding.48,60
A HFP construct containing three C-terminal lysines is predomi-nantly monomeric in HEPES buffer with [HFP] ≈ 100 µM.57 TheHFP constructs of the present paper contained six lysines and shouldbe monomeric at even higher concentrations. Most samples weremade with [HFP]initial ≈ 400 µM but the effect of concentrationwas probed in a few selectively labeled samples by first dissolvingthe peptide in ∼30 mL of buffer so that [HFP]initial ≈ 25 µM.
NMR Experiments. Experiments were done on a 9.4 T solid-state NMR spectrometer (Varian Infinity Plus, Palo Alto, CA) witha temperature of –50 °C to enhance 13C signal and to reducemotional averaging of dipolar couplings. It has previously beenshown that HFP chemical shifts vary little as a function oftemperature.53 13C shifts were externally referenced to the meth-ylene resonance of adamantane at 40.5 ppm.61
Proton-Driven Spin Diffusion (PDSD) Experiments. The probehad a double resonance configuration with 13C and 1H frequenciesof 100.8 and 400.8 MHz, respectively. The PDSD pulse sequencecontained an initial 1H π/2 pulse followed by a 1H-13C crosspolarization (CP), an evolution period t1, a 13C π/2 pulse that rotatedthe 13C transverse magnetization to the longitudinal axis, a spindiffusion period τ during which 13C magnetization was mixedamong nearby 13C nuclei, a second 13C π/2 pulse that rotated the13C magnetization back to the transverse plane, and a detectionperiod t2. A 100 kHz 1H decoupling field with two-pulse phasemodulation (TPPM) was applied during t1 and t2, but not duringτ.62 The following parameters were typical for PDSD experiments:6.8 kHz MAS frequency, 44–64 kHz ramp on the 13C CP rf field;62.5 kHz 1H CP rf field; 2 ms CP contact time; 50 kHz 13C π/2pulse rf field; 25 µs t1 dwell time; 200 t1 values; 20 µs t2 dwelltime; and 1 s recycle delay. Hypercomplex data were obtained byacquiring two individual FIDs for each t1 point with either a 13C(π/2)x or (π/2)y pulse at the end of the t1 evolution period.
Rotational-Echo Double-Resonance (REDOR) Experimentsand Simulations. The triple resonance MAS probe was tuned to13C, 1H, and 15N frequencies of 100.8, 400.8, and 40.6 MHz,respectively, and the 13C transmitter was at 152.4 ppm. The REDORsequence contained in sequence: (1) a 44 kHz 1H π/2 pulse; (2)2.2 ms cross-polarization with 63 kHz 1H field and 76–84 kHzramped 13C field; (3) a dephasing period of duration τ for whichthe “S0” and “S1” acquisitions contained 62 kHz 13C π pulses atthe end of each rotor cycle except the last cycle and for which theS1 acquisition contained 27 kHz 15N π pulses in the middle of rotorcycles; and (4) 13C detection.20,52,63–65 XY-8 phase cycling wasapplied to the 13C and 15N pulses during the dephasing period,TPPM 1H decoupling of ∼95 kHz was applied during the dephasingand detection periods, the recycle delay was 1 s, and the MASfrequency was 8000 ( 2 Hz. REDOR experiments were cali-brated using a lyophilized “I4” peptide with sequence AcAE-AAAKEAAAKEAAAKA-NH2 and a 13CO label at Ala-9 and a15N label at Ala-13. For the predominant R helical conformationof I4, the labeled 13CO-15N distance is ∼4.1 Å.20,66
The S0 REDOR spectrum contained all 13C signals while the S1
spectrum had reduced signals from 13C with proximal 15N andtherefore appreciable 13C-15N dipolar coupling (d). The equationd ) 3100/r3 expresses the relation between d in Hz and 13C-15Ndistance (r) in Å. The data analysis focused on integrated S0 andS1 intensities in the labeled 13CO region that were denoted as “S0”
and “S1”, respectively. An experimental fractional dephasing (∆S/S0)exp ) (S0
exp - S1exp)/S0
exp was calculated for each τ. The (∆S/S0)exp provided the experimental basis for determination of dand r. The σexp uncertainty in (∆S/S0)exp was calculated by
σexp )√(S0
2 × σS1
2) + (S12 × σS0
2)S0
2(1)
where σS0 and σS1 are the experimental root-mean-squared noise ofthe S0 and S1 spectra, respectively.67 All of the (∆S/S0) in this paperwere calculated using integration over 1 ppm which was the regionof maximum peak intensity. The effect of integration width wasassessed by also doing integration over 3 ppm which representedthe approximate full-width at half-maximum line width. There wasa typical difference of 0.01 between the (∆S/S0)exp determined with3 ppm integration and the (∆S/S0)exp determined with 1 ppmintegration and for all data, the difference was less than the σexp
determined with 1 ppm integration.Calculations of (∆S/S0) as a function of spin geometry were
denoted (∆S/S0)sim and were made using the SIMPSON program.68
The calculations were based on two or three spins where one ofthe spins was the Ala-14 13CO in a central � strand and the otherone or two spins were labeled 15N on adjacent strands. To makemeaningful comparison between the (∆S/S0)sim which were basedonly on labeled nuclei and experimental data which includedcontributions from both labeled and natural abundance nuclei, (∆S/S0)cor values were calculated from the (∆S/S0)exp and reflectedremoval of the natural abundance contribution. This contributionwas estimated using the fractional natural abundances and knownlocal 13CO-15N distances and associated dipolar couplings ofpeptides.20 For each (∆S/S0)cor, a σcor was calculated and σcor were≈ 1.4 × σexp. A detailed description of the calculation of (∆S/S0)cor and σcor is provided in the Supporting Information.
There is experimental evidence from a previous study that thenatural abundance correction factors are accurate. REDOR data wereanalyzed for a membrane-associated HIV fusion peptide with a13CO label at Leu-7 and a 15N label at Phe-11.20 Unlike themembranes used in the present study, the model membranes in theearlier study did not contain cholesterol and the Leu-7 13COchemical shift was consistent with helical rather than strandconformation. It was also shown that the (∆S/S0)cor derived fromthe REDOR data could be fitted well to a 4.1 ( 0.1 Å 13CO···15Ndistance which is the expected distance between the Leu-7 and Phe-11 nuclei in an R helix. The natural abundance correction factorused in the earlier study is almost identical to the correction factorused in the present study. In addition, the earlier study includedanalysis of REDOR (∆S/S0)cor values of the I4 model helical peptidewhich had a 13CO label at residue 9 and a 15N label at residue 13.The best-fit 13CO···15N distance was 4.11 ( 0.01 Å and wasconsistent with the expected distance between these nuclei in an Rhelix. The correction factor for this model peptide was very similarto the one used in the present study.
Input parameters to the SIMPSON program included the13CO-15N dipolar couplings, the Ala-14 13CO chemical shift andchemical shift anisotropy (CSA) principal values, and sets of Eulerangles which reflected the orientations of 13CO-15N dipolarcoupling and 13CO CSA principal axis systems (PASs) in the fixedcrystal frame. The 13CO chemical shift was 175 ppm and CSAprincipal values were set to 241, 179, and 93 ppm, respectively.69
Determination of Euler angles was based on atomic coordinates ofthe labeled nuclei and these coordinates were taken from crystalstructure coordinates of outer membrane protein G (OMPG) (PDB
(60) Slepushkin, V. A.; Andreev, S. M.; Sidorova, M. V.; Melikyan, G. B.;Grigoriev, V. B.; Chumakov, V. M.; Grinfeldt, A. E.; Manukyan,R. A.; Karamov, E. V. AIDS Res. Hum. RetroViruses 1992, 8, 9–18.
(61) Morcombe, C. R.; Zilm, K. W. J. Magn. Reson. 2003, 162, 479–486.(62) Bennett, A. E.; Rienstra, C. M.; Auger, M.; Lakshmi, K. V.; Griffin,
R. G. J. Chem. Phys. 1995, 103, 6951–6958.(63) McDowell, L. M.; Holl, S. M.; Qian, S. J.; Li, E.; Schaefer, J.
Biochemistry 1993, 32, 4560–4563.(64) Anderson, R. C.; Gullion, T.; Joers, J. M.; Shapiro, M.; Villhauer,
E. B.; Weber, H. P. J. Am. Chem. Soc. 1995, 117, 10546–10550.(65) Gullion, T. Concepts Magn. Reson. 1998, 10, 277–289.(66) Long, H. W.; Tycko, R. J. Am. Chem. Soc. 1998, 120, 7039–7048.
(67) Bevington, P. R.; Robinson, D. K. Data Reduction and Error Analysisfor the Physical Sciences, 2nd ed.; McGraw-Hill: Boston, MA, 1992.
(68) Bak, M.; Rasmussen, J. T.; Nielsen, N. C. J. Magn. Reson. 2000, 147,296–330.
(69) Gabrys, C. M.; Yang, J.; Weliky, D. P. J. Biomol. NMR 2003, 26,49–68.
5462 J. AM. CHEM. SOC. 9 VOL. 130, NO. 16, 2008
A R T I C L E S Qiang et al.

file 2IWW).70,71 OMPG was chosen because the REDOR experi-ments probed antiparallel �-strand structure in HFP and this wasthe predominant OMPG structural motif. After the 13CO coordinateswere obtained from a specific residue in OMPG, 15N coordinateswere obtained from nearby residues in the two adjacent strands.The Results section includes more detail about the specific choicesof these nearby residues. For the two-spin simulations, the (R, �,γ) Euler angles of the dipolar coupling PAS were (0, 0, 0) and forthe three-spin simulations, the angles for one dipolar PAS was (0,0, 0) and for the other PAS were (0, θ, 0) where θ was the anglebetween two 13CO-15N vectors. The Euler angles for the 13COCSA PAS were calculated using the known orientation of the PASrelative to the 13CO chemical bonds and the OMPG-derivedorientation of these chemical bonds relative to the crystal frame.72
3. Results
PDSD Spectra and Chemical Shift Assignment. For the HFP-A,B,C,D,E,F samples, 2D PDSD spectra were obtained withexchange time τ ) 10, 100, 500, and 1000 ms. Figure 2 displaysexample PDSD spectra for (a, c) HFP-C and (b, d) HFP-D withτ ) (a, b) 10, and (c, d) 1000 ms and Figure S2 in theSupporting Information contains representative slices from thesefour spectra. For spectra with τ ) 10 or 100 ms, (1) mostpossible intraresidue 13C crosspeaks for labeled residues wereobserved and (2) no inter-residue 13C crosspeaks were detected.Observation 1 was consistent with rapid exchange of 13Cmagnetization within the intraresidue networks of directlybonded 13C backbone and side chain nuclei which had 13C-13Cdipole couplings >2 kHz. Observation 2 was due to the presenceof at least one unlabeled residue between each pair of labeledresidues in the SUL samples.53 The resulting inter-residue13C-13C distances were >4.5 Å and correlated with <100 Hzdipolar couplings and slow exchange of 13C magnetizationbetween labeled residues. Each group of crosspeaks which
(70) Yildiz, O.; Vinothkumar, K. R.; Goswami, P.; Kuhlbrandt, W. EMBOJ. 2006, 25, 3702–3713.
(71) Mehring, M. Principles of high-resolution NMR in solids, 2nd ed.;Springer: Berlin, 1983.
(72) Oas, T. G.; Hartzell, C. J.; McMahon, T. J.; Drobny, G. P.; Dahlquist,F. W. J. Am. Chem. Soc. 1987, 109, 5956–5962.
Figure 2. 2D 13C-13C PDSD spectra of membrane-associated (a, c) HFP-C and (b, d) HFP-D. The magnetization exchange time was either (a, b) 10 msor (c, d) 1000 ms. All spectra were processed with 100 Hz Gaussian line broadening and baseline correction in the f2 (horizontal) and f1 (vertical) dimensions.The total numbers of scans were (a, b) 102400 and (c, d) 204800. Some of the (a, b) intraresidue and (c, d) inter-residue peak assignments are listed usingthe convention of assignment in f2 - assignment in f1.
J. AM. CHEM. SOC. 9 VOL. 130, NO. 16, 2008 5463
NMR Spectroscopy of HIV Fusion Peptides A R T I C L E S
shared common chemical shifts was assigned to a specificlabeled amino acid type (e.g., Ala CO/CR, CO/C�, CR/C�).The assignment was facilitated by knowledge of the typicalchemical shift of each 13C in a particular amino acid.73 Becauseof SUL, the resulting 13C chemical shift assignments wereunambiguous (cf. Figure 2a,b and Table 1).
The assignment in Table 1 was based on crosspeaks in thespectra of LM3-associated HFP-A, HFP-B, HFP-C, HFP-D, andHFP-E. Analysis of the PC:PG:CHOL-associated HFP-F samplespectra yielded the following assignments (in ppm): Ile-4, CR59.6, C� 43.2, Cγ 28.5/18.1, Cδ 15.4, CO 174.4; Ala-6, CR51.4, C� 24.3, CO 175.0; Phe-11, CR 56.7, C� 45.3, C1 138.2,C2–6 131.4, CO 174.0; Gly-13, CR 45.4, CO 171.9. Theseresidues were also labeled in the HFP-B, HFP-C, and HFP-Dsamples and the typical variation between an HFP-F shift andthe corresponding shift in the other samples was 0.5 ppm andshowed that there was little difference in shifts and presumablypeptide structure between peptides with different C-terminal tagsor between peptides associated with either LM3 or with PC:PG:CHOL membranes. After taking into account differentchemical shift referencing, the 13CO shifts in Table 1 were alsoconsistent with earlier measurements using selectively labeledHFPs bound to LM3.48
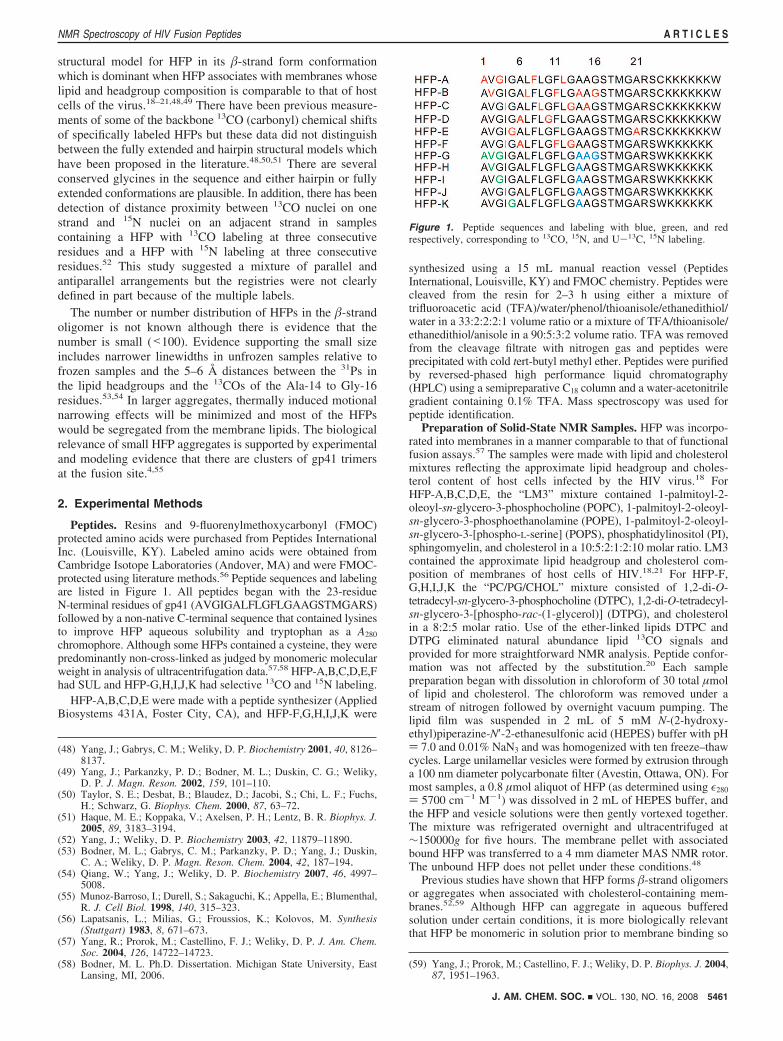
Within the range of shifts for each amino acid-type CR, C�,and CO, there are additional narrower subranges of shifts forhelical and �-strand conformations. These ranges were first notedin spectra of solid homopolymers of amino acids of definedconformation and were defined with better precision by cor-relation of liquid-state 13C chemical shifts and local conforma-tion in proteins of known structure.74,75 Further corroborationhas been obtained with the close agreement between the 13Cchemical shifts of the same protein in soluble or microcrystallineform.32,34,35,76 Figure 3 displays the differences between theexperimental 13C shifts and the consensus 13C shifts expectedfor helical or �-strand conformations. For residues between
Ala-1 and Gly-16, there were much smaller differences with�-strand shifts and particularly good agreement with �-strand13CR shifts. Table 2 lists the dihedral angles derived from aTALOS program comparison between the experimental shiftsand a large database of shifts of proteins of known structure.77
For the residues between Val-2 and Gly-16, the angles wereconsistent with �-strand conformation. Table 2 also includesdatabase distributions of angles for non-Gly residues in paralleland antiparallel � strands obtained from analysis of a largenumber of high-resolution protein structures. There is betteroverall agreement between the HFP angles and the antiparalleldistributions. This analysis does not rule out the parallel structurebut is interesting in the context of the subsequent experimentsto determine the antiparallel registry.
The 13C shifts of Ala-21 were different from the shifts ofother HFP alanines such as Ala-6. For example, the Ala-21 C�and CO shifts were, respectively, 4.0 and 2.5 ppm higher thanthose of Ala-6. The TALOS-derived � ) –76° for Ala-21 was
(73) Evans, J. N. S. Biomolecular NMR Spectroscopy; Oxford Press: NewYork, 1995.
(74) Zhang, H. Y.; Neal, S.; Wishart, D. S. J. Biomol. NMR 2003, 25,173–195.
(75) Kricheldorf, H. R.; Muller, D. Macromolecules 1983, 16, 615–623.(76) Igumenova, T. I.; McDermott, A. E.; Zilm, K. W.; Martin, R. W.;
Paulson, E. K.; Wand, A. J. J. Am. Chem. Soc. 2004, 126, 6720–6727.
(77) Cornilescu, G.; Delaglio, F.; Bax, A. J. Biomol. NMR 1999, 13, 289–302.
Table 1. 13C Chemical Shifts of LM3-Associated HFPa
residue CR C� Cγ Cδ C1 C2–6 CO
Ala-1 52.0 21.3 173.5Val-2 60.5 36.2 22.3 174.7Gly-3 45.5 171.5Ile-4 59.6 42.9 28.7/18.8b 15.8 174.5Gly-5 45.6 170.3Ala-6 51.0 23.9 174.2Leu-7 53.8 47.5 27.8 24.4 174.2Phe-8 56.0 44.3 139.7 131.1 173.8Leu-9 53.6 47.1 27.6 24.9 174.7Gly-10 44.8 170.7Phe-11 56.5 44.6 140.0 131.2 173.3Leu-12 53.7 47.1 27.6 174.4Gly-13 45.6 171.4Ala-14 51.8 24.3 174.9Ala-15 52.0 24.6 175.6Gly-16 45.5 172.4Ala-21 52.3 18.9 176.7
a Shifts are reported in ppm units with ( 0.5 ppm uncertainty. b Thechemical shift of C(γ)H2 is 28.7 ppm and the chemical shift of C(γ)H3
is 18.8 ppm.
Figure 3. Differences in chemical shift (∆δ) between experimental 13Cchemical shifts for membrane-associated HFP and characteristic helical (top)or �-strand (bottom) 13C shifts.74 Each bar in the legend represents 3 ppm.There appears to be better agreement with the �-strand shifts.
Table 2. Comparison of TALOS-Derived Dihedral Angles forLM3-Associated HFP and Distributions of Dihedral Angles in �Strands in Protein Structures
TALOS anglesa parallel � strandb antiparallel � strandb
residue � ψ � ψ � ψ
Val-2 -130(9) 143(15) -118(13) 128(12) -121(14) 133(15)Gly-3 -146(16) 152(31)Ile-4 -135(14) 154(16) -115(13) 126(12) -119(14) 131(14)Gly-5 -149(13) 159(21)Ala-6 -136(14) 150(15) -122(22) 137(17) -130(21) 144(15)Leu-7 -133(16) 143(11) -112(16) 125(13) -115(16) 132(14)Phe-8 -127(15) 143(14) -114(19) 129(17) -124(19) 141(17)Leu-9 -142(11) 147(18) -112(16) 125(13) -115(16) 132(14)Gly-10 -150(12) 160(21)Phe-11 -137(10) 152(13) -114(19) 129(17) -124(19) 141(17)Leu-12 -143(10) 148(18) -112(16) 125(13) -115(16) 132(14)Gly-13 -149(13) 159(21)Ala-14 -141(9) 149(13) -122(22) 137(17) -130(21) 144(15)Ala-15 -145(8) 149(12) -122(22) 137(17) -130(21) 144(15)Gly-16 -130(26) 154(16)Ala-21 -76(9) 146(9) -122(22) 137(17) -130(21) 144(15)
a Best-fit angles and uncertainties in parentheses are reported indegrees and were determined using the g5 best-fit matches from theTALOS database. b Distributions with average angle and standarddeviations in parentheses were determined from 1042 X-ray structures inthe Protein Data Bank with resolutions e2.0 Å.92
5464 J. AM. CHEM. SOC. 9 VOL. 130, NO. 16, 2008
A R T I C L E S Qiang et al.
∼70° lower than the values of � derived for Val-2 through Gly-16 and the Ala-21 linewidths were also broader than those ofthe more N-terminal residues.48 All these data suggested thatthe conformational distribution of Ala-21 was different and lesswell-defined than the conformations of the more N-terminalresidues. These conclusions were consistent with a HFP modelcomposed of (1) an apolar N-terminal HFP region (ap-proximately Ala-1 to Gly-16) which has regular secondarystructure because it is predominantly located in the membraneinterior and must form intra or interpeptide hydrogen bonds inthis low water concentration environment; and (2) a polarC-terminal HFP region (approximately Ser-17 to Ser-23) whichis more disordered because it is located at the membrane/waterinterface or in water and can adopt irregular secondary structureswith hydrogen-bonding to water.48,54
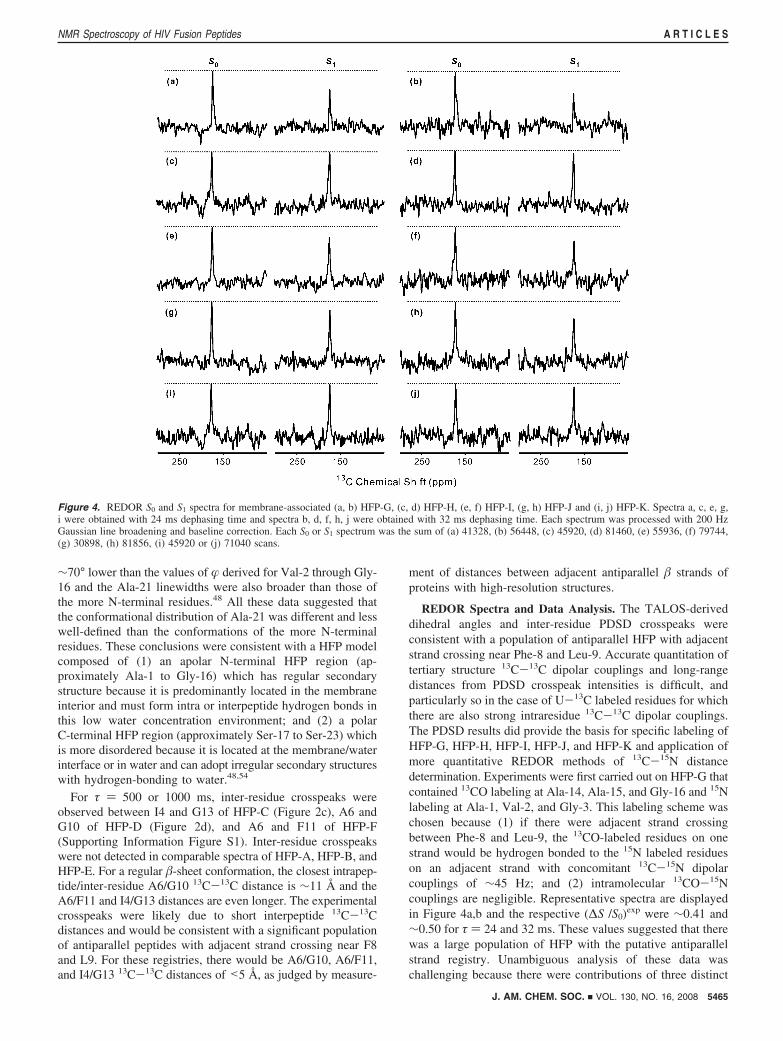
For τ ) 500 or 1000 ms, inter-residue crosspeaks wereobserved between I4 and G13 of HFP-C (Figure 2c), A6 andG10 of HFP-D (Figure 2d), and A6 and F11 of HFP-F(Supporting Information Figure S1). Inter-residue crosspeakswere not detected in comparable spectra of HFP-A, HFP-B, andHFP-E. For a regular �-sheet conformation, the closest intrapep-tide/inter-residue A6/G10 13C-13C distance is ∼11 Å and theA6/F11 and I4/G13 distances are even longer. The experimentalcrosspeaks were likely due to short interpeptide 13C-13Cdistances and would be consistent with a significant populationof antiparallel peptides with adjacent strand crossing near F8and L9. For these registries, there would be A6/G10, A6/F11,and I4/G13 13C-13C distances of <5 Å, as judged by measure-
ment of distances between adjacent antiparallel � strands ofproteins with high-resolution structures.
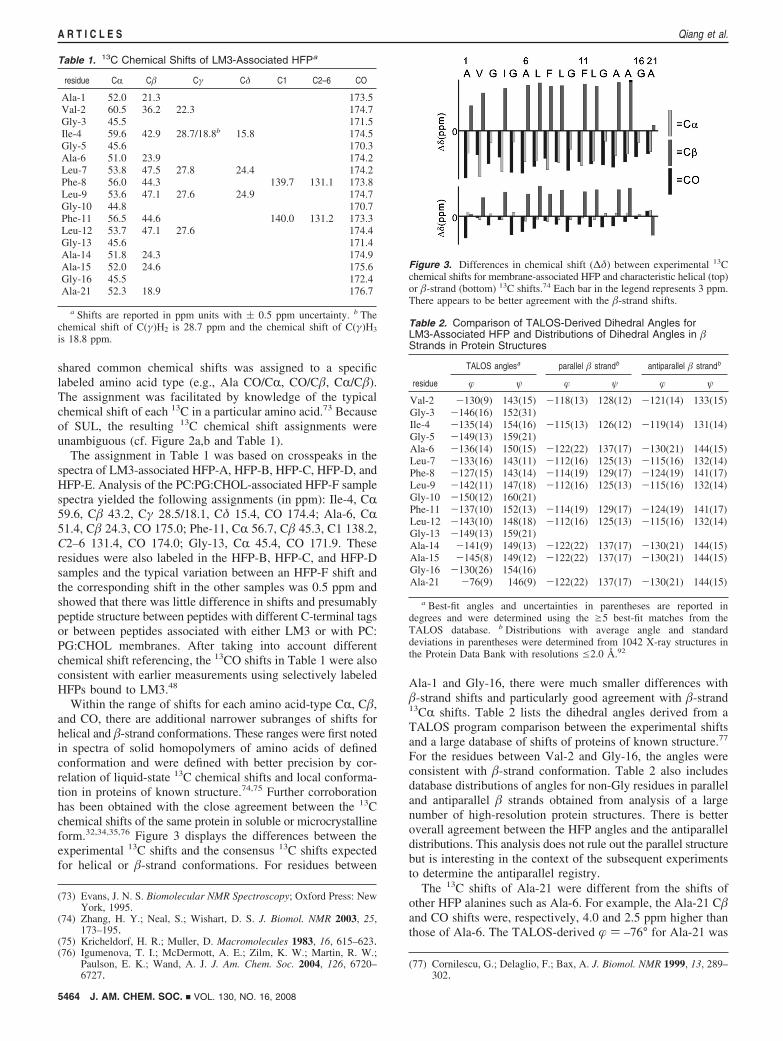
REDOR Spectra and Data Analysis. The TALOS-deriveddihedral angles and inter-residue PDSD crosspeaks wereconsistent with a population of antiparallel HFP with adjacentstrand crossing near Phe-8 and Leu-9. Accurate quantitation oftertiary structure 13C-13C dipolar couplings and long-rangedistances from PDSD crosspeak intensities is difficult, andparticularly so in the case of U-13C labeled residues for whichthere are also strong intraresidue 13C-13C dipolar couplings.The PDSD results did provide the basis for specific labeling ofHFP-G, HFP-H, HFP-I, HFP-J, and HFP-K and application ofmore quantitative REDOR methods of 13C-15N distancedetermination. Experiments were first carried out on HFP-G thatcontained 13CO labeling at Ala-14, Ala-15, and Gly-16 and 15Nlabeling at Ala-1, Val-2, and Gly-3. This labeling scheme waschosen because (1) if there were adjacent strand crossingbetween Phe-8 and Leu-9, the 13CO-labeled residues on onestrand would be hydrogen bonded to the 15N labeled residueson an adjacent strand with concomitant 13C-15N dipolarcouplings of ∼45 Hz; and (2) intramolecular 13CO-15Ncouplings are negligible. Representative spectra are displayedin Figure 4a,b and the respective (∆S /S0)exp were ∼0.41 and∼0.50 for τ ) 24 and 32 ms. These values suggested that therewas a large population of HFP with the putative antiparallelstrand registry. Unambiguous analysis of these data waschallenging because there were contributions of three distinct
Figure 4. REDOR S0 and S1 spectra for membrane-associated (a, b) HFP-G, (c, d) HFP-H, (e, f) HFP-I, (g, h) HFP-J and (i, j) HFP-K. Spectra a, c, e, g,i were obtained with 24 ms dephasing time and spectra b, d, f, h, j were obtained with 32 ms dephasing time. Each spectrum was processed with 200 HzGaussian line broadening and baseline correction. Each S0 or S1 spectrum was the sum of (a) 41328, (b) 56448, (c) 45920, (d) 81460, (e) 55936, (f) 79744,(g) 30898, (h) 81856, (i) 45920 or (j) 71040 scans.
J. AM. CHEM. SOC. 9 VOL. 130, NO. 16, 2008 5465
NMR Spectroscopy of HIV Fusion Peptides A R T I C L E S

13COs and because different combinations of antiparallel strandregistries could fit the data.
Ambiguity was reduced by studying samples for which HFPhad only a single 13CO and a single 15N label. Four HFPs wereprepared and all had a 13CO label at Ala-14. This residue hadbeen 13CO labeled in HFP-G and had been previously observedto give a fairly sharp signal.54 The 15N label was at either Val-2(HFP-H), Gly-3 (HFP-I), Ile-4 (HFP-J), or Gly-5 (HFP-K). Thevariation of the REDOR data among the different HFPs wasstriking (cf. Figure 4c-j and Figure 5a). For τ ) 32 ms, the(∆S/S0)exp were ∼0.3 for the HFP-I and HFP-J samples and∼0 for the HFP-H and HFP-K samples. These data suggestedthat there were two antiparallel registries which could beclassified: (1) Ala-14 on one strand opposite Gly-3 on theadjacent strand; and (2) Ala-14 on one strand opposite Ile-4 onthe adjacent strand. These two registries were denoted A and Band are displayed in Figure 6a. The σcor in Figure 5 were ∼0.04and explicit error bars are not displayed for visual clarity. FigureS5 in the Supporting Information displays the same plot of (∆S/S0)cor versus dephasing time with explicit error bars as well asthe corresponding plot of (∆S/S0)exp versus dephasing time. For(∆S/S0)exp appreciably greater than 0, the typical value of (∆S/S0)cor/(∆S/S0)exp was ∼1.2.
The samples used to obtain data for Figures 4 and 5a weremade with [HFP]initial ≈ 400 µM. To check for possible effectsof HFP self-association in aqueous solution prior to membranebinding, two additional HFP-I and HFP-K samples were madewith [HFP]initial ≈ 25 µM which is a concentration for which
HFP is known to be monomeric in the HEPES buffer.59 Figure5a,b illustrates that very similar (∆S/S0)cor were obtained forboth values of [HFP]initial and the apparent strand registriesappear to be due to membrane-association. The similar valuesalso support the reproducibility of the large differences in (∆S/S0)cor as a function of the 15N labeling site.
More quantitative analysis of the (∆S/S0)cor of the sampleswas done using calculations of (∆S/S0)sim based on differentmodels for registries of three adjacent strands with the overallgoal of quantitation of the populations of the different registries.The strands were denoted, “top”, “middle”, and “bottom”. Figure6b displays the models as well as spin geometries specific tothe HFP-I sample. The models were focused on registries atthe middle strand Ala-14 whose 13CO group was hydrogen-bonded to an amide proton in the top strand. Each model waslabeled by two letters which were either A, B, or X. The firstletter described the registry relating the middle strand and thetop strand and the second letter described the registry relatingthe middle strand and the bottom strand. For registry A, Ala-14 in the middle strand was across from Gly-3 in the adjacentstrand and for registry B, Ala-14 in the middle strand was acrossfrom Ile-4 in the adjacent strand (cf. Figure 6a). Registry Xwas defined as any structure for which the interpeptide13CO-15N distance was large in the HFP-H, HFP-I, HFP-J, andHFP-K samples so that d ≈ 0. Registry X could include thein-register parallel strand arrangement. Such registry has beenproposed for membrane-associated gp41 constructs whichcontain the HFP.78 Consideration of the two strands adjacentto the central strand is based on the labeled 15N which wouldbe close to the Ala-14 13CO and is not meant to imply thatHFP forms trimers.
Model XX had (∆S/S0)sim ) 0 for all dephasing times whilemodels AX, XA, BX, and XB resulted in two-spin systems forwhich (∆S/S0)sim were primarily dependent on the 13CO-15Ndistance. Models AA, BA, AB, and BB were three-spin systemsfor which (∆S/S0)sim depended both on the two 13CO-15Ndistances and on the angle between the two 13CO-15N vectors.79
For all samples and all models, (∆S/S0)sim were calculated foreach of the five experimental dephasing times.
The fractional populations of each of the models werecalculated with fitting of the (∆S/S0)sim and the (∆S/S0)cor. Thefitting was primarily based on the data from the HFP-I andHFP-J samples because many of the (∆S/S0)cor for these sampleswere appreciably positive. Fitting was accomplished with thefollowing equations:
2 ) ∑j)1
2
∑k)1
5 { (∆S / S0)j,kcalcd - (∆S / S0)j,k
cor} 2
(σj,kcor)2
(2)
(∆S / S0)j,kcalcd ) ∑
l)1
9
fl × (∆S / S0)j,ksim
(3)
for which j was the index of the sample, k was the index of thedephasing time, l was the index of the model, and fl was thefractional population of model l.
Three types of fitting were done and differed in the choiceof which fl were fitted and which were set to zero. For all fittings,Σ fl ) 1. For “unconstrained” fitting, there was no correlationbetween the registry of the middle and top strands and the
(78) Sackett, K.; Shai, Y. J. Mol. Biol. 2005, 350, 790–805.(79) Vogt, F. G.; Gibson, J. M.; Mattingly, S. M.; Mueller, K. T. J. Phys.
Chem. B 2003, 107, 1272–1283.
Figure 5. Plots of (∆S/S0)cor vs dephasing time for membrane-associatedHFP samples prepared with [HFP]initial of (a) 400 or (b) 25 µM. The symbollegend is diamonds, HFP-H; triangles, HFP-I; circles, HFP-J; and squares,HFP-K. The σcor were ∼0.04.
5466 J. AM. CHEM. SOC. 9 VOL. 130, NO. 16, 2008
A R T I C L E S Qiang et al.

registry of the middle and bottom strands. All f were thereforefitted and each f was a function of “a” and “b” which weredefined as the fractional probabilities of two adjacent strandshaving A or B registries, respectively. The fractional probabilityof the X registries was then 1 - a - b. Each f was the productof the fractional probabilities of the middle strand/top strandregistries and middle strand/bottom strand registries withresulting fAA ) a2, fBA ) ab, fAB ) ab, fBB ) b2, fAX ) a(1 -a - b), fXA ) a(1 - a - b), fBX ) b(1 - a - b), fXB ) b(1 -a - b), and fXX ) (1 - a - b)2. “Partially constrained” fittingwas done based on the idea that there were domains ofantiparallel strand registry and domains of X registry so thatfAA ) a2, fBA ) ab, fAB ) ab, fBB ) b2, fAX ) 0, fXA ) 0, fBX
) 0, fXB ) 0, and fXX ) 1 - (a + b)2. For partially constrainedfitting, physically meaningful expressions of a and b included(1) a/b which was the ratio of probability that two adjacentstrands had A registry to the probability that they had B registry;and (2) (a + b)2/[(1 - (a + b)]2 which was the ratio of thetotal population of the A and B antiparallel structures to thepopulation of the X structures. For “fully constrained” fitting,it was assumed that � strand domains would form with only Aor only B or only X registries so that fAA ) a2, fBA ) 0, fAB )0, fBB ) b2, fAX ) 0, fXA ) 0, fBX ) 0, fXB ) 0, and fXX ) 1 -a2 - b2. In this fitting, the fractional populations of the A, B,and X strand arrangements were a2, b2, and 1 - a2 - b2,respectively.
The results of unconstrained fitting are displayed in Figure7a as a 2D contour plot of 2 versus a and b. The best-fit a )0.22 and b ) 0.31 with 2
min ) 16.5 and good-fit a and brepresented in the black region.67,69 The good-fit regions of theplot showed negative correlation between a and b as might beexpected from the positive correlation between (∆S/S0)calcd andeither a or b for both the HFP-I and HFP-J samples. The (∆S/S0)calcd were also computed for the HFP-H and HFP-K samplesusing the best-fit a and b. At τ ) 32 ms, maximum (∆S/S0)calcd
of 0.08 and 0.09 were obtained for the HFP-H and HFP-Ksamples, respectively, and can be compared to the maximum(∆S/S0)cor ) 0.05 ( 0.04 for these samples. Figure 7b displaysthe 2D contour plot of partially constrained fitting with best-fita ) 0.31, b ) 0.42, and 2
min ) 15.1. At τ ) 32 ms, these a
and b values led to (∆S/S0)calcd ) 0.11 and 0.13 for the HFP-Hand HFP-K samples, respectively. Figure 7c displays the 2Dcontour plot of fully constrained fitting with best-fit a2 ) 0.26,b2 ) 0.33, and 2
min ) 12.7 and (∆S/S0)calcd ) 0.09 and 0.12at τ ) 32 ms for the HFP-H and HFP-K samples, respectively.For all three fittings, the 2
min are reasonable, as evidenced bybeing within a factor of 2 of 8, the number of degrees of freedomof the fitting. This suggests that each model is plausible. Thelimits of the good-fit black regions have been generously setand include all parameter space with 2 2–3 units higher than2
min.The best-fit f of the three fittings were used to calculate PA,
PB, and PX which were fractional populations of the A, B, andX registries, respectively: PA ) fAA + (fBA + fAB + fAX + fXA)/2; PB ) fBB + (fBA + fAB + fBX + fXB)/2; and PX ) fXX + (fAX
+ fXA + fBX + fXB)/2 with PA + PB + PX ) 1. The resultingfractional populations were (1) unconstrained fitting, PA ) 0.22,PB ) 0.31, and PX ) 0.47; (2) partially constrained fitting, PA
) 0.23, PB ) 0.31, and PX ) 0.46; and (3) fully constrainedfitting, PA ) 0.26, PB ) 0.33, and PX ) 0.41. An overall resultof the three fittings was therefore PA ≈ 0.25, PB ≈ 0.30, andPX ≈ 0.45. In addition, examination of the values in the blackregions of the three plots showed that the approximate rangeof reasonable values for the sum PA + PB was 0.5-0.6 andthat the corresponding range for PX was 0.4-0.5.
The determination of PX relied on quantitative determinationof (∆S/S0)cor. Although some REDOR studies in the literatureshow smaller (∆S/S0)cor than would be predicted by simulation,we think that our (∆S/S0)cor are quantitative based on the resultsof an earlier study by our group.20,52,80 In this study, REDORdata were analyzed for a membrane-associated HIV fusionpeptide with a 13CO label at Leu-7 and a 15N label at Phe-11.Unlike the membranes used in the present study, the modelmembranes in the earlier study did not contain cholesterol andthe Leu-7 13CO chemical shift was consistent with helical ratherthan strand conformation. It was also shown that the 13CO/15NREDOR data could be fitted well to a 4.1 ( 0.1 Å 13CO···15N
(80) Sharpe, S.; Kessler, N.; Anglister, J. A.; Yau, W. M.; Tycko, R. J. Am.Chem. Soc. 2004, 126, 4979–4990.
Figure 6. (a) Two antiparallel registries of residues 1–16 of HFP that were consistent with the REDOR data shown in Figure 5. The registries are denotedA and B and the 13CO labeled Ala-14 residue is highlighted in blue. (b) Models used to calculate (∆S/S0)sim and spin geometries specific for the HFP-Isample. Each model includes nuclei from three adjacent strands with the Ala-14 13CO always in the middle strand and 15N in the top and/or bottom strands.Consideration of the two strands adjacent to the central strand is based on the labeled 15N which would be close to the Ala-14 13CO and is not meant toimply that HFP forms trimers. The first letter in the labeling of each model refers to the middle strand/top strand registry and the second letter refers to themiddle strand/bottom strand registry. Registry X is any registry for which the interpeptide 13CO-15N distance was large in the HFP-H, HFP-I, HFP-J, orHFP-K samples so that d ≈ 0. The Ala-14 13CO is hydrogen bonded to an amide proton in the top strand. Relevant labeled 13C-15N distances and 15N-13C-15Nangles are r1 ) 4.063 Å; r1′ ) 5.890 Å; r2 ) 5.455 Å; r2′ ) 6.431 Å; θ1 ) 161.1°; θ2 ) 131.9°; θ3 ) 130.2°; and θ4) 117.0°. Each parameter value wasthe average of 10 specific values taken from the crystal structure of outer membrane protein G.
J. AM. CHEM. SOC. 9 VOL. 130, NO. 16, 2008 5467
NMR Spectroscopy of HIV Fusion Peptides A R T I C L E S

distance which is the expected distance between the Leu-7 andPhe-11 nuclei in a regular R helix. A natural abundancecorrection factor very similar to the one in the present paperwas applied prior to fitting and the corrected data had (∆S/S0)cor
) 1.0 at τ ) 32 ms which is the value predicted by simulation.We expect that there were similar 13C T2s in the earlier and thepresent studies because both samples were membrane-associatedHIV fusion peptides at the same temperature. The correctionfactors and the 13CO-15N dipolar couplings were also verysimilar and we therefore think that the (∆S/S0)cor in the presentstudy are quantitative.
4. Discussion
Membrane-associated HFP is known to adopt either helicalor �-strand conformation and membrane composition is onefactor which impacts conformation. The goal of the current studywas to develop a more detailed structural model for the �-strandform of the HFP and relied on previous studies which showedthat this was the dominant conformation in membranes whichcontained a significant amount of cholesterol.20,48,51,52,78,81 The� strand conformation may be a physiologically relevant HFPstructure because membranes of host cells of HIV contain ∼30mol % cholesterol and because HFP fuses vesicles whosemembranes contain cholesterol.18,21,48
The first aim of our study was to determine which HFPresidues adopted � strand conformation and which residuesadopted non-�-strand conformation. This aim was accom-plished with analysis of 13C-13C correlation spectra of SULsamples and resulted in an unambiguous 13C assignment forthe Ala-1 to Gly-16 and the Ala-21 residues. The 13CR, 13C�,and 13CO shifts of Ala-1 to Gly-16 were more consistentwith �-strand conformation than with helical conformation,and the good-fit �, ψ dihedral angles derived from TALOSanalysis of these shifts were closer to the centers of thedistributions of angles of antiparallel � strands than to thecenters of the distributions of parallel � strands. The Ala-2113C shifts were less clearly � strand and the linewidths werebroader than those of other residues.48 The overall results ofthe chemical shift analysis were (1) continuous � strand overthe Ala-1 to Gly-16 residues and (2) greater disorder at Ala-21. Infrared structural investigations of membrane-associatedHFP have generally been consistent with predominantantiparallel �-sheet conformation and were based on analysisof the wavenumbers of the amide I transition.17,51,81,82 Oneinfrared study proposed that there was �-hairpin structure inthe Ala-1 to Gly-16 region but the present work did notsupport this model because there were no residues in thisregion with non-�-strand 13C shifts.51 To our knowledge, thecomplete 13C shift assignment of the present study is the firstdefinitive evidence for a fully extended conformation.
One rationale for the conformational results of our studyis based on HFP membrane location. The first sixteen residuesof HFP are all apolar and could be predominantly located inthe membrane interior. Because the membrane interior has asmall dielectric constant and low water content, regularpeptide conformation which maximizes intra or interpeptidehydrogen bonding would be favored. The more C-terminalHFP residues are more polar and might be located near thelipid headgroups or in aqueous solution. More disordered
(81) Castano, S.; Desbat, B. Biochim. Biophys. Acta. 2005, 1715, 81–95.(82) Gordon, L. M.; Mobley, P. W.; Pilpa, R.; Sherman, M. A.; Waring,
A. J. Biochim. Biophys. Acta 2002, 1559, 96–120.
Figure 7. Contour plots of 2 vs strand fitting parameters for (a)unconstrained; (b) partially constrained; and (c) fully constrained fittings.The a, b, a2, and b2 parameters refer to probabilities for different adjacentstrand arrangements. In plot a, the black, green, blue, red, and white regionsrespectively correspond to 2 < 19, 19 < 2 < 21, 21 < 2 < 23, 23 < 2
< 25, and 2 < 25. In plot b, the regions respectively correspond to 2 <18, 18 < 2 < 20, 20 < 2 < 22, 22 < 2 < 24, and 2 < 24, and in plotc, the regions respectively correspond to 2 < 15, 15 < 2< 17, 17 < 2
< 19, 19 < 2 < 21, and 2 < 21. Best-fit parameters were: (plot a) a )0.22, b ) 0.31, 2 ) 16.5; (plot b) a ) 0.31, b ) 0.42, 2 ) 15.1; and (plotc) a2 ) 0.26, b2 ) 0.33, 2 ) 12.7. In plot a, the a and b parameters arethe fractional probabilities of adjacent strands having A or B registries,respectively. In plot c, the a2 and b2 parameters are the fractionalprobabilities of domains of A or B registries, respectively.
5468 J. AM. CHEM. SOC. 9 VOL. 130, NO. 16, 2008
A R T I C L E S Qiang et al.

conformation would be possible because the peptide CO andNH could hydrogen bond to water. This HFP membranelocation model has been generally supported by a solid-stateNMR study which showed that there were 5–6 Å distancesbetween lipid 31Ps and 13COs of the Ala-14 to Gly-16 residueswhile the corresponding distances for the Gly-5 to Gly-13residues were >8 Å.54
The second aim of this study was to determine the �-strandregistry. The first set of experiments was detection of interpep-tide/inter-residue crosspeaks in 13C-13C correlation spectra ofSUL samples with long mixing times. Crosspeaks between Ala-6and Gly-10 and between Ile-4 and Gly-13 were consistent withantiparallel strands with the A or B registries. These resultsdemonstrated how experiments using SUL samples could aiddevelopment of tertiary structure models. More specific labelingfor REDOR experiments probed adjacent strand 13CO-15Ndistances in registries consistent with the SUL data. REDORdata for HFPs with a 13CO label at Ala-14 and a 15N label ateither Val-2, Gly-3, Ile-4, or Gly-5 were qualitatively clear withlarge (∆S/S0)cor observed with a Gly-3 or Ile-4 15N label and(∆S/S0)cor ≈ 0 with a Val-2 or Gly-5 15N label. One appealingaspect of these registries was that they would result in completeor nearly complete interpeptide hydrogen bonding of the apolarAla-1 to Gly-16 apolar region of HFP as might be favored inthe membrane interior.
The REDOR data were more quantitatively analyzed toyield ∼25% population of antiparallel adjacent strands withAla-14/Gly-3 registry A, ∼30% antiparallel population withAla-14/Ile-4 registry B, and ∼45% population with a structurewhich was not Ala-14/Val-2, Ala-14/Gly-3, Ala-14/Ile-4, orAla-14/Gly-5 registry (registry X). This result is significantbecause to our knowledge, it provides the first residue-specificstructural model for �-strand HFP. As highlighted earlier,there would be complete (registry A) or nearly complete(registry B) interpeptide hydrogen bonding for residues Ala-1to Gly-16 which form the apolar region of the HFP. Thesehydrogen bonding patterns would be favored if this regionwere predominantly located in the membrane interior. Theexistence of multiple �-strand structures is also consistentwith a recent 13C and 15N assignment of a membrane-associated HFP with SUL at Phe-8, Leu-9, and Gly-10.44
There were two crosspeaks of comparable intensity for theLeu-9 13CO/Gly-10 15N correlation and two crosspeaks ofcomparable intensity for the Gly-10 13CR/Gly-10 15N cor-relation. For a given pair, the two 13C shifts differed by ∼0.5ppm and were both consistent with �-strand conformationwhereas the Gly-10 15N shifts were 107 and 111 ppm. Thetwo crosspeaks may correlate with the multiple �-strandstructures inferred from analysis of the REDOR data in thepresent paper.
It is interesting to compare the antiparallel registries detectedin the present study with the antiparallel registry suggested bya previous REDOR study.52 In this study, the samples containedan equimolar mixture of a HFP with three sequential 13COlabels and an HFP with three sequential 15N labels. Data wereonly acquired for a single dephasing time (τ ) 24 ms) and thebest-guess antiparallel registry had Ala-14 hydrogen bonded withLeu-7 which is different than the registries consistent with thedata of the present study. The Ala-14/Leu-7 registry could beone of the X structures but it is noted that there was significantuncertainty in the determination of this registry because of themultiple 13CO and 15N labels. Because of the single site 13COand 15N labeling in the present paper, there was definitive
determination of the A and B registries and as discussed earlier,these registries are biophysically reasonable.
The REDOR results confirmed that the earlier 13C-13Ccorrelation experiments with long mixing times on the SULsamples had provided accurate information about possibleregistries of antiparallel � strands. For these earlier experi-ments, it was significant that (1) there were no sequentiallabeled residues so that inter-residue/intrapeptide crosspeakintensities were attenuated; and (2) crosspeaks were observedbetween a few but not most residues and the observedcrosspeaks were consistent with a small number of strandregistries. A time-saving advantage of the approach was thatthe same SUL samples could be used for 13C assignment aswell as for semiquantitative 13C-13C distance determination.This type of SUL is an alternative to U-13C labeling forassignment and alternate site 13C labeling for distancedetermination.31,42,45–47 The SUL and assignment and distancedetermination method should be useful for concentration-limited systems such as membrane-associated peptides forwhich (1) reasonable signal-to-noise can be obtained with2D but not 3D spectra and (2) intrinsic 13C linewidths are2–3 ppm so that assignment is ambiguous with U-13Clabeling. The method is restricted to peptides and proteinswhich can be chemically synthesized.
It is interesting to consider models A and B in the context ofthe full gp41 protein. The gp41 soluble ectodomain structuresto-date show a symmetric trimer with an in-register parallelcoiled-coil extending over residues 30–80.11 The residuesN-terminal of Ala-30 are disordered and the soluble ectodomainconstructs also lacked the N-terminal HFP. Although there isno evidence that the oligomeric state of the membrane-associatedHFP of the present study is a trimer, it is interesting to considerthe antiparallel �-sheet structure of HFP in the context of theputative trimeric state of intact gp41. It is difficult to understandthis structure in the context of a single gp41 trimer, but thisstructure could be understood considering two trimers denoted“C” and “D” with respective HFP strands C1, C2, and C3 andD1, D2, and D3. A C1D3C2D2C3D1 antiparallel �-sheet structurecould be formed with the C1, C2, and C3 strands parallel to oneanother, the D1, D2, and D3 strands parallel to one another, andthe C and D strands antiparallel to one another with D3 hydrogenbonded to C1 and C2, C2 hydrogen bonded to D3 and D2, etc.There is some support for this model from internuclear distancemeasurements on a HFP trimer construct composed of threeHFP strands chemically cross-linked at their C-termini. The13C-13C and 13C-15N distances determined for this membrane-associated trimer were consistent with the A antiparallel registrydeduced from the present study.20
Detection of multiple registries for a membrane-associatedpeptide is to our knowledge rare. Peptides which form amyloidfibrils can adopt different antiparallel registries at different pHsbut we are not aware of a case for which two registries wereformed in a single amyloid sample.83 For a membrane-insertedHFP aggregate, one factor favoring the formation of the Aregistry is interpeptide hydrogen bonding for all of the residuesbetween Ala-1 and Gly-16. This hydrogen bonding wouldreduce the unfavorable Born energy of CO and NH dipoles inthe low dielectric environment of the membrane interior. Forthe B registry, Ala-1 is not part of the hydrogen bonded �-sheetregistry and if the HFP N-terminus is charged, better charge
(83) Petkova, A. T.; Buntkowsky, G.; Dyda, F.; Leapman, R. D.; Yau,W. M.; Tycko, R. J. Mol. Biol. 2004, 335, 247–260.
J. AM. CHEM. SOC. 9 VOL. 130, NO. 16, 2008 5469
NMR Spectroscopy of HIV Fusion Peptides A R T I C L E S

solvation might be achieved relative to the A registry. Ala-1could adopt a broader range of conformations in the B registrywhich might facilitate the location of the charged N-terminusin a solvated environment. A greater distribution of conforma-tions for Ala-1 is supported by linewidths which were broaderthan those of residues in the central region of HFP.48 Althoughthe ionization state(s) of membrane-associated �-strand HFPhave not yet been experimentally determined, there is evidencefor a charged amino terminus in the related influenza fusionpeptide in its helical conformation.84
Either HIV or HFP with the Val-2 f Glu-2 point mutationis nonfusogenic.4,8,9 In the context of our results, this lackof fusion activity may be related to a change in strandregistries arising from the charged glutamic acid side chain.The Val-2 f Glu-2 mutation is trans-dominant, that is,mixtures of wild-type and mutant proteins correlated withfusion activities which were reduced much more than wouldbe expected from the fraction of mutant protein. This effectcould be explained by registry changes for several strandsnear the mutant HFP which might affect HFP oligomerizationand/or membrane location.9
It might be expected that the combination of the A, B, andX �-strand structures would result in broad NMR linewidths.However, the 13C linewidths observed to-date for helical HFPare comparable to those of �-strand HFP.19 It is also noted thata liquid-state NMR study of detergent-associated HFP indicatedmultiple helical structures.85 Overall, the structural picture ofmembrane-associated HFP is complex with either predominanthelical or �-strand conformation and two or more �-strandregistries. This structural plasticity may be related to peptideflexibility needed as the lipid molecules move during the fusionprocess.86,87
The data in our study restrict the X structures to structuresother than the Ala-14/Val-2, Gly-3, Ile-4, or Gly-5 antiparallelregistries. There are therefore many possibilities for the Xstructures. One reasonable possibility is parallel �-strandstructure either in-register or close to in-register. This structuralmodel is appealing because most of the residues in the Ala-1to Gly-16 region would have interpeptide hydrogen bonds andthis region could therefore be located in the membrane interior.Previous solid-state NMR 13C-15N distance measurements wereconsistent with some population of in-register parallel strandstructure over residues Gly-5 to Gly-13 in addition to antiparallelpopulation over residues Gly-5 to Gly-16.52,88 In addition,infrared studies on constructs containing the first 34 or first 70residues of gp41 were consistent with predominant in-registerparallel �-sheet structure from residues Ala-1 to Gly-16.78 Theinterpretation of the infrared data was based on shifts in peakwavenumbers of 13C labeled relative to natural abundancepeptides.
The HFPs are monomeric in aqueous solution and �-sheetaggregates form upon association with the membrane.59 Thenumbers of molecules in an aggregate have not been directly
determined but this number is probably small and probably lessthan 100 based on the following experimental observations: (1)For ∼30% of the molecules in the aggregates, the 13COs ofresidues between Ala-14 and Gly-16 are <6 Å from the lipid31P.54 The membranes also remain in the bilayer phase for HFP/lipid e0.1.89 This close contact between HFP and lipid bilayerheadgroups is more reasonable for a smaller aggregate than fora larger aggregate. (2) Relative to frozen samples, spectra ofunfrozen samples yield significantly lower 13C cross-polarizationsignal intensity and narrower 13C linewidths.53 Both phenomenaare consistent with greater motion in the unfrozen samples. Alarger dependence of motion on frozen versus unfrozen state isexpected for smaller aggregates. Future solid-state NMR experi-ments might provide more detailed information about membrane-associated aggregate size.90
5. Conclusions
An unambiguous 13C assignment was obtained for residuesGly-1 to Gly-16 and residue Ala-21 of the membrane-associatedHFP. SUL and 2D 13C-13C correlation spectroscopy were usedto obtain this assignment. The 13C shifts and associated TALOS-derived �, ψ dihedral angles were consistent with fully �-strandconformation for residues Ala-1 to Gly-16. Less definitive�-strand shifts and broader linewidths were observed for Ala-21 and indicated a broader distribution of conformations.Unambiguous assignments and detailed conformational analysisof SUL HFPs with C-terminal cross-linking should also bepossible and should provide greater biological significancebecause the topology of HFP strands in these cross-linkedconstructs is thought to mimic the HFP topology in the gp41protein.57 In addition, the approach should be applicable tomembrane-associated HFP which is helical and should provideinformation about whether HFP forms a continuous helix aswas observed in detergent micelles or whether there is a helix-turn-helix motif as has been detected for membrane-associatedinfluenza fusion peptide.14,91
13C-13C correlation experiments with long mixing times onthe SUL samples provided information about possible registriesof antiparallel � strands, and these registry models were testedwith REDOR 13CO-15N distance measurements on a fewselectively labeled samples. Two of the registries were shownto have significant population and both registries were consistentwith complete or nearly complete interpeptide hydrogen bondingfor the apolar N-terminal domain of the HFP. This hydrogenbonding scheme would be favored if a significant part of thisdomain were located in the membrane interior where there islow water content.
The development of a detailed structural model for �-strandHFP is significant because this is the observed conformation incholesterol-containing membranes which reflect the compositionof membranes of host cells of HIV. HFP fusion activity is alsoobserved for vesicles with this membrane composition and the�-strand conformation may therefore be a physiologicallyrelevant HFP structure.(84) Zhou, Z.; Macosko, J. C.; Hughes, D. W.; Sayer, B. G.; Hawes, J.;
Epand, R. M. Biophys. J. 2000, 78, 2418–2425.(85) Gabrys, C. M.; Weliky, D. P. Biochim. Biophys. Acta. 2007, 1768,
3225–3234.(86) Hofmann, M. W.; Weise, K.; Ollesch, J.; Agrawal, P.; Stalz, H.; Stelzer,
W.; Hulsbergen, F.; de Groot, H.; Gerwert, K.; Reed, J.; Langosch,D. Proc. Natl. Acad. Sci. U.S.A. 2004, 101, 14776–14781.
(87) Reichert, J.; Grasnick, D.; Afonin, S.; Buerck, J.; Wadhwani, P.; Ulrich,A. S. Eur. Biophys. J. 2007, 36, 405–413.
(88) Zheng, Z.; Qiang, W.; Weliky, D. P. Magn. Reson. Chem. 2007, 245,S247–S260.
(89) Yang, J.; Parkanzky, P. D.; Khunte, B. A.; Canlas, C. G.; Yang, R.;Gabrys, C. M.; Weliky, D. P. J. Mol. Graph. Model. 2001, 19, 129–135.
(90) Luo, W.; Hong, M. J. Am. Chem. Soc. 2006, 128, 7242–7251.(91) Han, X.; Bushweller, J. H.; Cafiso, D. S.; Tamm, L. K. Nat. Struct.
Biol. 2001, 8, 715–720.(92) Hovmoller, S.; Zhou, T.; Ohlson, T. Acta Crystallogr. D 2002, 58,
768–776.
5470 J. AM. CHEM. SOC. 9 VOL. 130, NO. 16, 2008
A R T I C L E S Qiang et al.

Acknowledgment. This work was supported by NIH awardAI47153 to D.P.W. The Mass Spectroscopy, MacromolecularSynthesis and Structure, and Max T. Roger NMR facilitiesat Michigan State University were used to carry out thisresearch. Useful discussions with Dr. Charles Gabrys are alsoacknowledged.
Supporting Information Available: 2D PDSD spectra ofHFP-F at 10 and 500 ms exchange times; 1D slices for the 2DPDSD spectra of HFP-C and HFP-D; REDOR spectra at 24
and 32 ms dephasing times for HFP-I and HFP-K samplesprepared with 25 µM initial HFP concentration; derivation of(∆S/S0)cor from (∆S/S0)exp and σcor from σexp; comparison of(∆S/S0)exp with (∆S/S0)cor for the HFP-H, I, J, and K samples;model geometries for the HFP-H, HFP-J, and HFP-K samples;and (∆S/S0)sim for all models for the HFP-H, HFP-I, HFP-J,and HFP-K samples. This material is available free of chargevia the Internet at http://pubs.acs.org.
JA077302M
J. AM. CHEM. SOC. 9 VOL. 130, NO. 16, 2008 5471
NMR Spectroscopy of HIV Fusion Peptides A R T I C L E S

Supporting Information of “Solid-State NMR Spectroscopy of HIV Fusion Peptides
Associated with Host-Cell-Like Membranes: 2D Correlation Spectra and Distance
Measurements Support a Fully Extended Conformation and Models for Specific
Antiparallel Strand Registries” by Wei Qiang, Michele L. Bodner, and David P. Weliky
1. PDSD spectra of PC:PG:CHOL-associated HFP-F
Figure S1a
1
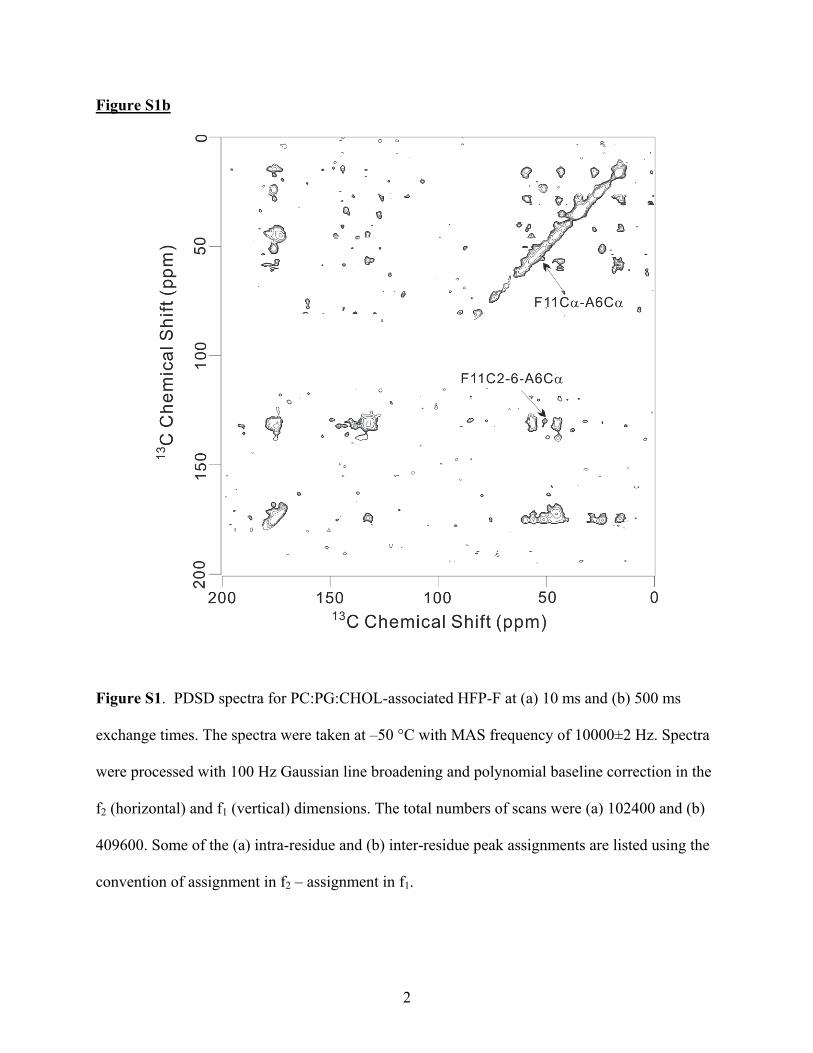
Figure S1b
Figure S1. PDSD spectra for PC:PG:CHOL-associated HFP-F at (a) 10 ms and (b) 500 ms
exchange times. The spectra were taken at –50 °C with MAS frequency of 10000±2 Hz. Spectra
were processed with 100 Hz Gaussian line broadening and polynomial baseline correction in the
f2 (horizontal) and f1 (vertical) dimensions. The total numbers of scans were (a) 102400 and (b)
409600. Some of the (a) intra-residue and (b) inter-residue peak assignments are listed using the
convention of assignment in f2 – assignment in f1.
2
2. 1D-slices of PDSD spectra
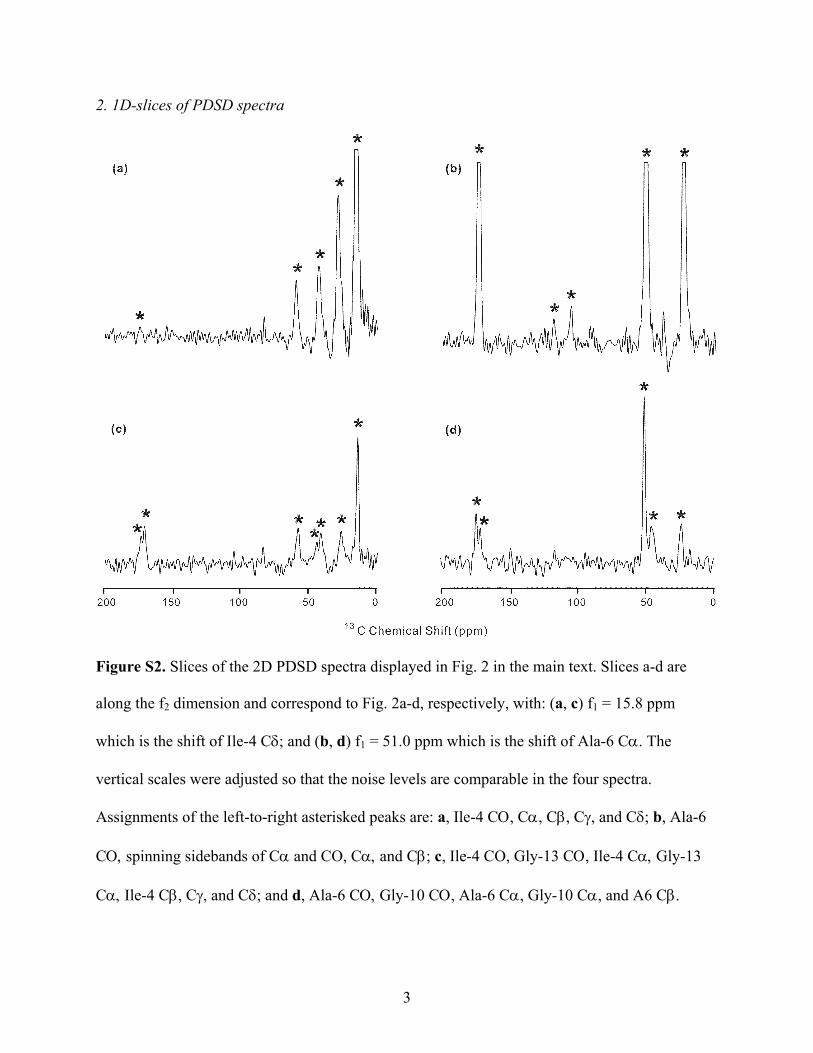
Figure S2. Slices of the 2D PDSD spectra displayed in Fig. 2 in the main text. Slices a-d are
along the f2 dimension and correspond to Fig. 2a-d, respectively, with: (a, c) f1 = 15.8 ppm
which is the shift of Ile-4 Cδ; and (b, d) f1 = 51.0 ppm which is the shift of Ala-6 Cα. The
vertical scales were adjusted so that the noise levels are comparable in the four spectra.
Assignments of the left-to-right asterisked peaks are: a, Ile-4 CΟ, Cα, Cβ, Cγ, and Cδ; b, Ala-6
CΟ, spinning sidebands of Cα and CO, Cα, and Cβ; c, Ile-4 CO, Gly-13 CΟ, Ile-4 Cα, Gly-13
Cα, Ile-4 Cβ, Cγ, and Cδ; and d, Ala-6 CΟ, Gly-10 CΟ, Ala-6 Cα, Gly-10 Cα, and A6 Cβ.
3

3. REDOR spectra of HFP-I and HFP-K samples prepared with [HFP]initial = 25 μM
Figure S3. REDOR S0 and S1 spectra for membrane-associated (a, b) HFP-I and (c, d) HFP-K
samples prepared with [HFP]initial = 25 μM. Spectra a and c were obtained with 24 ms dephasing
time and spectra b and d were obtained with 32 ms dephasing time. All spectra were taken at –50
°C with MAS frequency of 8000±2 Hz and were processed with 200 Hz line broadening and
polynomial baseline correction. Each S0 or S1 spectrum was the sum of (a) 40960, (b) 102400, (c)
30720, or (d) 40960 scans.
4
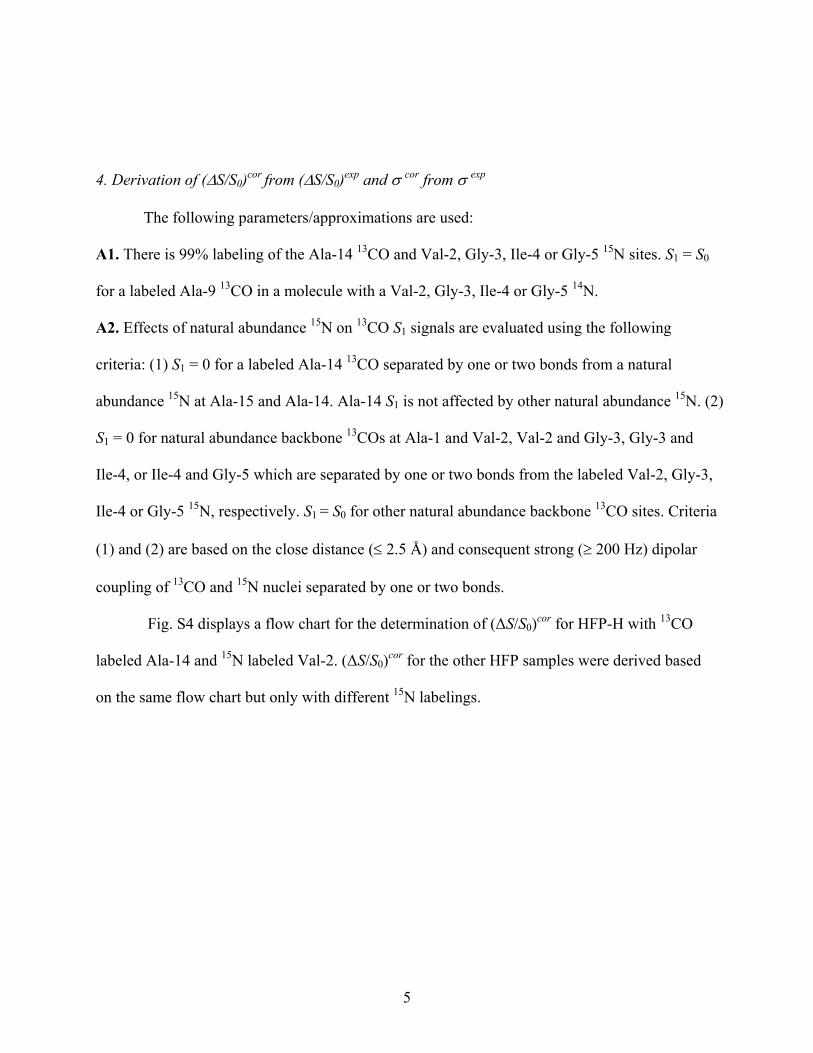
4. Derivation of (ΔS/S0)cor from (ΔS/S0)exp and σ cor from σ exp
The following parameters/approximations are used:
A1. There is 99% labeling of the Ala-14 13CO and Val-2, Gly-3, Ile-4 or Gly-5 15N sites. S1 = S0
for a labeled Ala-9 13CO in a molecule with a Val-2, Gly-3, Ile-4 or Gly-5 14N.
A2. Effects of natural abundance 15N on 13CO S1 signals are evaluated using the following
criteria: (1) S1 = 0 for a labeled Ala-14 13CO separated by one or two bonds from a natural
abundance 15N at Ala-15 and Ala-14. Ala-14 S1 is not affected by other natural abundance 15N. (2)
S1 = 0 for natural abundance backbone 13COs at Ala-1 and Val-2, Val-2 and Gly-3, Gly-3 and
Ile-4, or Ile-4 and Gly-5 which are separated by one or two bonds from the labeled Val-2, Gly-3,
Ile-4 or Gly-5 15N, respectively. S1 = S0 for other natural abundance backbone 13CO sites. Criteria
(1) and (2) are based on the close distance (≤ 2.5 Å) and consequent strong (≥ 200 Hz) dipolar
coupling of 13CO and 15N nuclei separated by one or two bonds.
Fig. S4 displays a flow chart for the determination of (ΔS/S0)cor for HFP-H with 13CO
labeled Ala-14 and 15N labeled Val-2. (ΔS/S0)cor for the other HFP samples were derived based
on the same flow chart but only with different 15N labelings.
5

Figure S4. Flow chart of derivation of (ΔS/S0)cor for REDOR of HFP-H. The four rows in each
box are in sequence: the site description, its relative population, and its contributions to S0 and S1.
A complete derivation of (ΔS/S0)cor follows:
0 1
0 0
exp exp exp
exp
S SSS S
⎛ ⎞ −Δ=⎜ ⎟
⎝ ⎠ (S1)
0expS is expressed as the sum of contributions from labeled 13CO nuclei ( ) and from natural
abundance 13CO nuclei ( ):
0labS
0n.a.S
. .0 0 0 1exp lab n a
CS S S U n= + = − + CA (S2)
where 1 – UC is the fractional Ala-14 13CO labeling, AC is the fractional 13C natural abundance,
and n is the total number of unlabeled peptide backbone CO sites in an HFP molecule. is
also expressed as the sum of contributions from labeled 13CO nuclei ( ) and from natural
abundance 13CO nuclei ( ):
1expS
1labS
. .1n aS
1 1 1exp lab n.a.S S S= + (S3)
with:
6
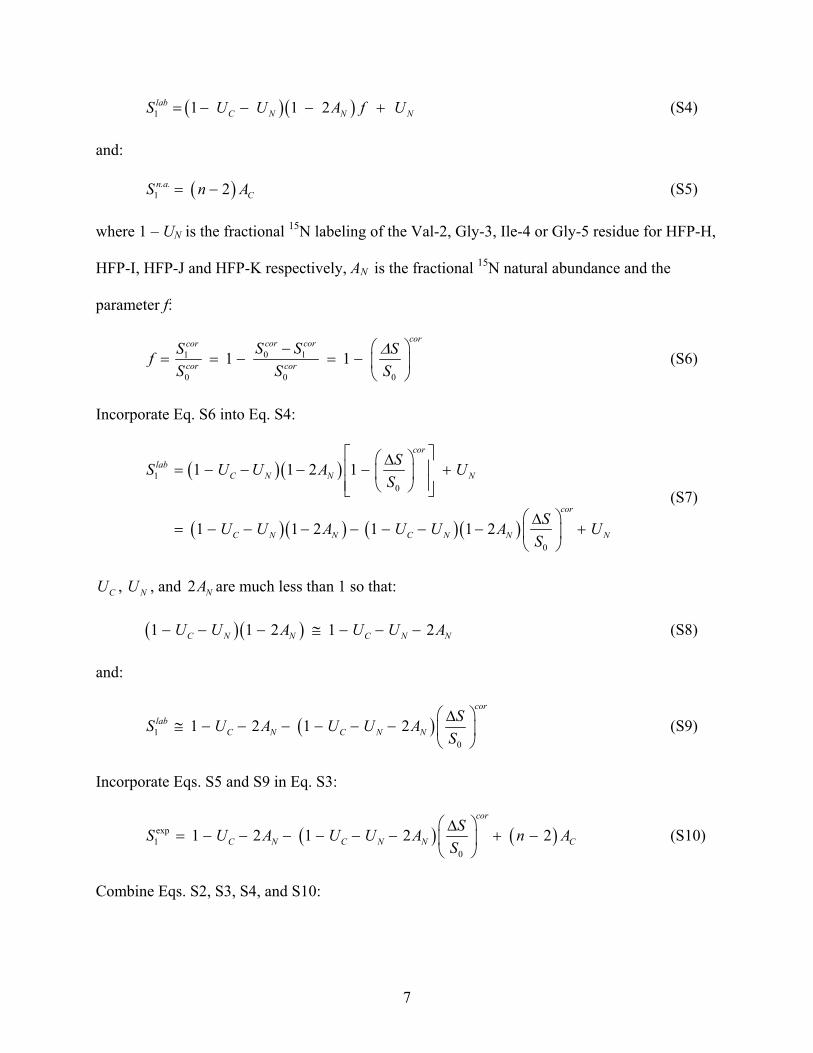
( )( )1 1 1 2labC N NS U U A f= − − − + NU
A
(S4)
and:
( )1 2n.a.CS n= − (S5)
where 1 – UN is the fractional 15N labeling of the Val-2, Gly-3, Ile-4 or Gly-5 residue for HFP-H,
HFP-I, HFP-J and HFP-K respectively, AN is the fractional 15N natural abundance and the
parameter f:
0 11
0 0
1 1corcor corcor
cor cor
S SSfS S
Δ⎛ ⎞−= = − = − ⎜ ⎟
⎝ ⎠0
SS
(S6)
Incorporate Eq. S6 into Eq. S4:
( )( )
( )( ) ( )( )
10
0
1 1 2 1
1 1 2 1 1 2
corlab
C N N N
cor
C N N C N N
SS U U A US
SU U A U U A US
⎡ ⎤⎛ ⎞Δ⎢ ⎥= − − − − +⎜ ⎟⎢ ⎥⎝ ⎠⎣ ⎦
⎛ ⎞Δ= − − − − − − − +⎜ ⎟
⎝ ⎠N
(S7)
CU , , and NU 2 NA are much less than 1 so that:
( )( )1 1 2 1C N N C NU U A U U A− − − ≅ − − − 2 N
)
(S8)
and:
(10
1 2 1 2cor
labC N C N N
SS U A U U AS
⎛ ⎞Δ≅ − − − − − − ⎜ ⎟
⎝ ⎠ (S9)
Incorporate Eqs. S5 and S9 in Eq. S3:
( ) ( )exp1
0
1 2 1 2 2cor
C N C N NSS U A U U A n
S⎛ ⎞Δ
= − − − − − − + −⎜ ⎟⎝ ⎠
CA (S10)
Combine Eqs. S2, S3, S4, and S10:
7
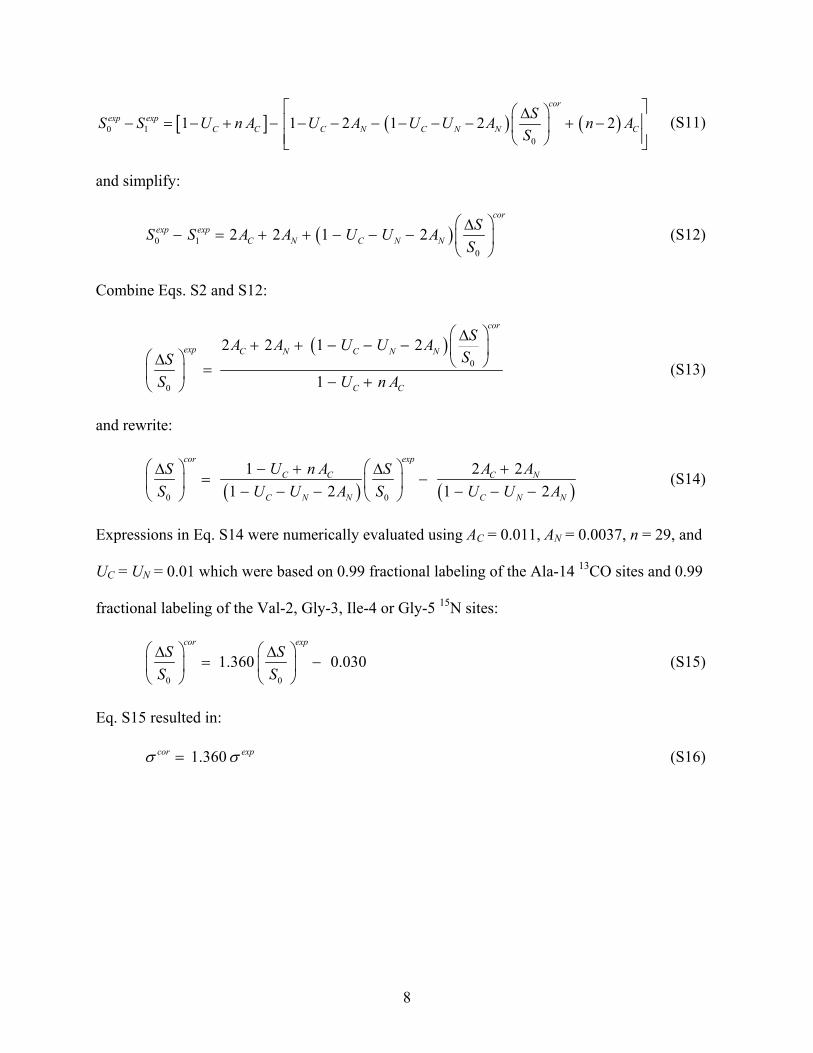
[ ] ( ) ( )0 10
1 1 2 1 2cor
exp expC C C N C N N C
SS S U n A U A U U A n AS
⎡ ⎤⎛ ⎞Δ⎢ ⎥− = − + − − − − − − − + −⎜ ⎟⎢ ⎥⎝ ⎠⎣ ⎦
2
)
(S11)
and simplify:
(0 10
2 2 1 2cor
exp expC N C N N
SS S A A U U AS
⎛ ⎞Δ− = + + − − − ⎜ ⎟
⎝ ⎠ (S12)
Combine Eqs. S2 and S12:
( )
0
0
2 2 1 2
1
cor
exp C N C N N
C C
SA A U U ASS
S U n A
⎛ ⎞Δ+ + − − − ⎜ ⎟⎛ ⎞Δ ⎝ ⎠=⎜ ⎟ − +⎝ ⎠
(S13)
and rewrite:
( ) ( )0 0
11 2 1 2
cor exp
C C C N
C N N C N N
U n A A AS SS U U A S U U A
⎛ ⎞ ⎛ ⎞− + +Δ Δ= −⎜ ⎟ ⎜ ⎟− − − − − −⎝ ⎠ ⎝ ⎠
2 2 (S14)
Expressions in Eq. S14 were numerically evaluated using AC = 0.011, AN = 0.0037, n = 29, and
UC = UN = 0.01 which were based on 0.99 fractional labeling of the Ala-14 13CO sites and 0.99
fractional labeling of the Val-2, Gly-3, Ile-4 or Gly-5 15N sites:
0 0
1.360 0.030cor exp
S SS S
⎛ ⎞ ⎛ ⎞Δ Δ= −⎜ ⎟ ⎜ ⎟
⎝ ⎠ ⎝ ⎠ (S15)
Eq. S15 resulted in:
1.360cor expσ σ= (S16)
8
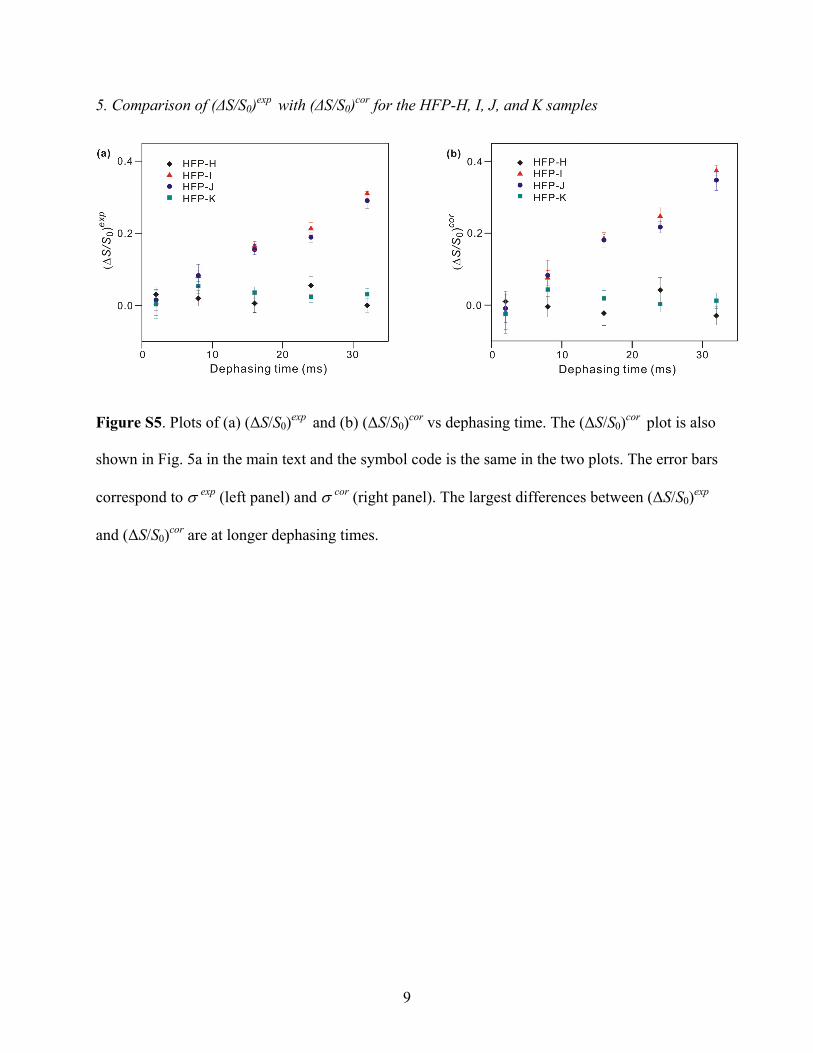
5. Comparison of (ΔS/S0)exp with (ΔS/S0)cor for the HFP-H, I, J, and K samples
Figure S5. Plots of (a) (ΔS/S0)exp and (b) (ΔS/S0)cor vs dephasing time. The (ΔS/S0)cor plot is also
shown in Fig. 5a in the main text and the symbol code is the same in the two plots. The error bars
correspond to σ exp (left panel) and σ cor (right panel). The largest differences between (ΔS/S0)exp
and (ΔS/S0)cor are at longer dephasing times.
9

6. Model geometries for the HFP-H, HFP-J and HFP-K samples
(a)
(b)
(c)
Figure S6. Models used to calculate (ΔS/S0)sim and spin geometries specific for the (a) HFP-J, (b)
HFP-H, and (c) HFP-K samples. Each model includes nuclei from three adjacent strands with the
Ala-14 13CO always in the middle strand and 15N in the top and/or bottom strands. The first letter
in the labeling of each model refers to the middle strand/top strand registry and the second letter
refers to the middle strand/bottom strand registry. Registry X is any registry for which the
10

interpeptide 13CO-15N distance was large in the HFP-H, HFP-I, HFP-J, or HFP-K samples so that
d ≈ 0. The Ala-14 13CO is hydrogen bonded to an amide proton in the top strand. Relevant
labeled 13C-15N distances and 15N-13C-15N angles are: (a) r1= 4.063 Å, r1′ = 5.502 Å, r2= 5.455 Å,
r2′ = 6.519 Å, θ1 = 117.2˚, θ2 = 131.1˚, θ3 = 131.9˚, θ4= 160.7˚; (b) r1= 5.890 Å, r1′ = 8.925 Å,
r2= 6.431 Å, r2′ = 9.463 Å, θ1 = 117.0˚, θ2 = 104.2˚, θ3 = 105.1˚, θ4= 88.9˚; and (c) r1= 9.319 Å,
r1′ = 5.502 Å, r2= 9.872 Å, r2′ = 6.519 Å, θ1 = 89.0˚, θ2 = 105.0˚, θ3 = 104.7˚, and θ4= 117.2˚.
Each parameter value was the average of 10 specific values taken from the crystal structure of
outer membrane protein G.
11
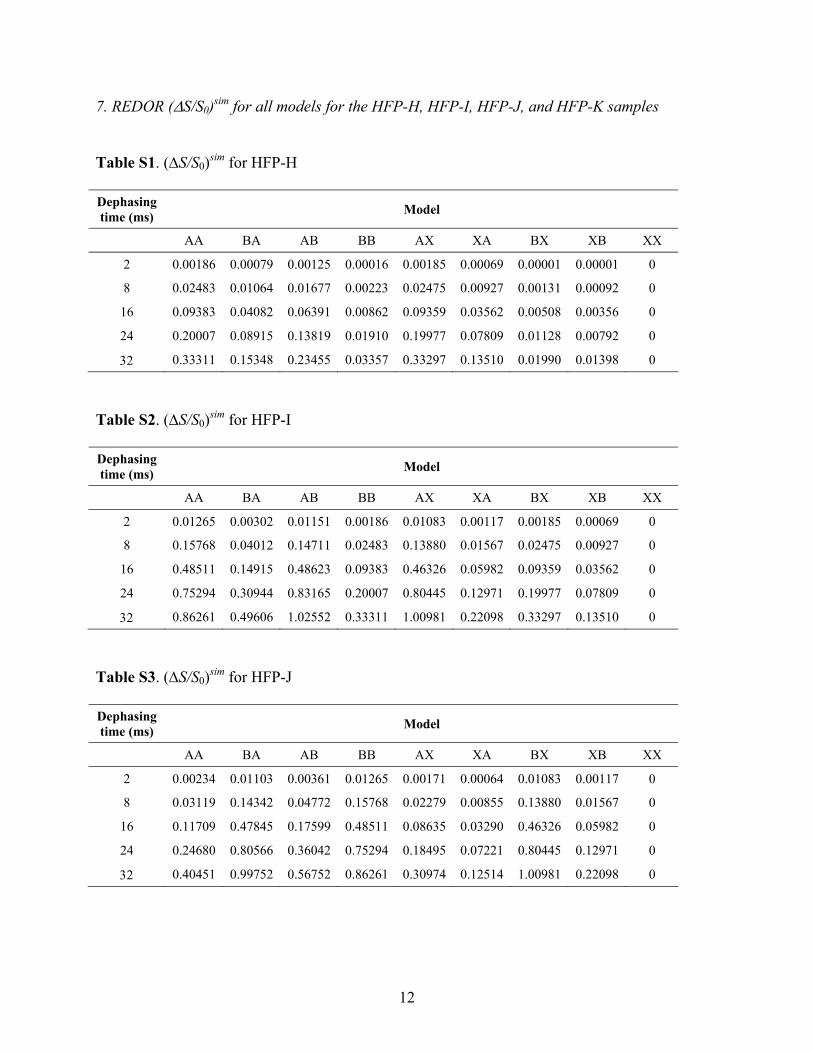
7. REDOR (ΔS/S0)sim for all models for the HFP-H, HFP-I, HFP-J, and HFP-K samples Table S1. (ΔS/S0)sim for HFP-H Dephasing time (ms) Model
AA BA AB BB AX XA BX XB XX
2 0.00186 0.00079 0.00125 0.00016 0.00185 0.00069 0.00001 0.00001 0
8 0.02483 0.01064 0.01677 0.00223 0.02475 0.00927 0.00131 0.00092 0
16 0.09383 0.04082 0.06391 0.00862 0.09359 0.03562 0.00508 0.00356 0
24 0.20007 0.08915 0.13819 0.01910 0.19977 0.07809 0.01128 0.00792 0
32 0.33311 0.15348 0.23455 0.03357 0.33297 0.13510 0.01990 0.01398 0
Table S2. (ΔS/S0)sim for HFP-I Dephasing time (ms) Model
AA BA AB BB AX XA BX XB XX
2 0.01265 0.00302 0.01151 0.00186 0.01083 0.00117 0.00185 0.00069 0
8 0.15768 0.04012 0.14711 0.02483 0.13880 0.01567 0.02475 0.00927 0
16 0.48511 0.14915 0.48623 0.09383 0.46326 0.05982 0.09359 0.03562 0
24 0.75294 0.30944 0.83165 0.20007 0.80445 0.12971 0.19977 0.07809 0
32 0.86261 0.49606 1.02552 0.33311 1.00981 0.22098 0.33297 0.13510 0
Table S3. (ΔS/S0)sim for HFP-J Dephasing time (ms) Model
AA BA AB BB AX XA BX XB XX
2 0.00234 0.01103 0.00361 0.01265 0.00171 0.00064 0.01083 0.00117 0
8 0.03119 0.14342 0.04772 0.15768 0.02279 0.00855 0.13880 0.01567 0
16 0.11709 0.47845 0.17599 0.48511 0.08635 0.03290 0.46326 0.05982 0
24 0.24680 0.80566 0.36042 0.75294 0.18495 0.07221 0.80445 0.12971 0
32 0.40451 0.99752 0.56752 0.86261 0.30974 0.12514 1.00981 0.22098 0
12

Table S4. (ΔS/S0)sim for HFP-K Dephasing time (ms) Model
AA BA AB BB AX XA BX XB XX
2 0.00013 0.00184 0.00071 0.00234 0.00001 0.00001 0.00171 0.00064 0
8 0.00175 0.02451 0.00957 0.03119 0.00102 0.00072 0.02279 0.00855 0
16 0.00677 0.09268 0.03674 0.11709 0.00397 0.00281 0.08635 0.03290 0
24 0.01502 0.19777 0.08042 0.24680 0.00882 0.00626 0.18495 0.07221 0
32 0.02642 0.32954 0.13885 0.40451 0.01556 0.01105 0.30974 0.12514 0
13