solid state and fusion resistance spot welding of td-nicr...
TRANSCRIPT

Solid State and Fusion Resistance Spot Welding of TD-NiCr Sheet
Excellent results require selecting (1) the best metallurgical condition of the material for the process and (2) variables that produce solid state rather than fusion type welds
BY T. J . M O O R E
ABSTRACT. This program was designed to produce high quality resistance spot welds in 0.4 mil l imetre (0.015 in.) thick TD-NiCr sheet. Four welding schedules were evaluated using conventional resistance we ld ing equipment. Both specially processed (unrecrystallized) and commercial TD-NiCr sheet were used. Welding parameters were selected in order to produce both solid state and fusion resistance spot welds. Al l mechanical tests of the weldments were conducted using a single-spot lap joint specimen after postheating at 1200 C for two hours in hydrogen. The feasibility of producing solid state resistance spot welds was also demonstrated in thicker, 1.6 mm (0.062 in.), TD-NiCr sheet.
Excellent results were obtained using a solid state resistance spot welding schedule and specially processed sheet. After postheating, the weld was indistinguishable f rom the base metal. In 1100 C stress-rupture shear tests the welds were as strong as the base metal. Base metal fai lure, rather than weld failure took place in the stress-rupture tests and the other mechanical tests that included room temperature and 1 1 0 0 C tensi le-
T. J. MOORE is Materials Engineer with the National Aeronautics and Space Administration, Lewis Research Center, Cleveland, Ohio.
Paper was presented at the 54th A WS Annual Meeting held in Chicago during April2-6, 1973.
shear, and room temperature fatigue tests.
Less satisfactory results were obtained using commercial sheet. A minimum heat input fusion spot we ld could not be made wi thout affecting the microstructure of the sheet. Solid state spot welds, however, were produced wi thout affecting sheet structure. But, for the solid state welds, the weld plane was a stable grain boundary.
Unsatisfactory results were obtained when a conventional fusion spot weld was made in commercial sheet. Wi th in the nugget the f ine thoria dispersion and the large grain structure of the sheet were lost. A valid stress-rupture curve could not be determined for this type of we ld ment.
In t roduct ion
The dispersion strengthened alloy, TD-NiCr(Ni-20Cr-2ThO2) has recently received consideration for high temperature applications such as reentry heat shields for Space Shuttle vehicles (Ref. 1). High creep strength and good oxidation resistance make this material quite attractive for these 1000 to 1200 C applications. But joining by fusion welding has been a major problem area w i th this material because melt ing destroys the f ine thoria dispersion and the textured structure. The result is that the fusion zone is much weaker than TD-NiCr sheet. The joint efficiency is only about 30 to 50% (of base metal
strength) in elevated temperature tensile tests (Ref. 2). In some applications this strength may be adequate, but in many cases stronger welds are required. Thus, it has been a major challenge to produce welds in th is material that are as strong as the base metal at elevated temperatures.
A recent review of joining methods for this material indicated that solid state and fusion resistance spot we lding (RSW) are probably the most promising joining methods for producing lap joints in TD-NiCr sheet (Ref. 2). Where applicable, resistance spot welding is quite attractive for economic reasons and exceedingly attractive for production applications. Thus, the studies reported in this paper were conducted to more fully evaluate the potential of using resistance spot welding for joining TD--NiCr sheet.
Welding variables studied included electrode dome radius, welding force, welding current, and the number of heat cycles. The effect of faying surface preparation also was investigated. Commercial and specially processed (unrecrystallized) TD-NiCr sheet were utilized in order to determine the effect of the metallurgical condition of the starting material. Both solid state and fusion resistance spot welds were evaluated.
Weld quality was evaluated using metallographic techniques and by mechanical property tests. The fol lowing mechanical tests were conducted on single-spot lap joints in 0.4 mm (0.015 in.) TD-NiCr sheet:
W E L D I N G R E S E A R C H S U P P L E M E N T | 37-s

1.1100 C stress-rupture shear tests (to 1000 h)
2. 1100 C tensile-shear tests 3. Room temperature fatigue tests
(tension-tension, om[n /ama% 0.2)
4. Room temperature t e n s i l e -shear tests
Based upon results f rom the above evaluation, conclusions are offered regarding the effect of resistance spot welding schedule and starting condition of the TD-NiCr sheet on weld quality. In addition, an attempt was made to demonstrate the feasibility of producing solid state resistance spot welds in thicker TD-NiCr sheet, 1.6 mm (0.062 in.).
Table 1 - Resista nee Spot Welding Schedules for Single-Spot Lap Welds in Class III Copper Alloy Electrodes
Schedule
A B C D
Base metal'3)
SP C
c c
Faying surface preparation"5)
CE,F CE,F CE.F C,P,W
We ld mach
type
1-phase 1 -phase 1 -phase 3-phase
mg ine
kVA
4 0 0 4 0 0 4 0 0 100
Electrode diameter,
mm
12.7 12.7 12.7
7.9«> 15.7 (8'
i n .
0.5 0.5 0.5 0.31<f> 0 6 2 ( 9 l
0.4 mm
Electr. dome radius. mm
305 203 305
50«> 305<9>
i n .
12 8
12 2(0-
1 2 g )
(a) SP = specially processed (unrecrystallized) material. C = commercial (recrystallized material). (b) CE,F - chemically etched, stored in freon (Fig. 3). C.P.W = cleaned, polished with 320 grit paper, wiped with solvent (Fig. 5). (c) Note in Figs. 4 and 6 that the sine wave heat cycle for the single phase machine is quite different from the heat cycle for the three phase machine.
Exper imenta l Procedure
TD-NiCr Sheet
TD-NiCr material has a nominal composition of Ni-20%Cr-2%ThO2 .
Manufacturing process
Powder manufacture
Powder compaction and sinter
Roll consolidation
Belt-sanded surfaces Unrecrystallized sheet ("specially processed")
Recrystallization anneal
Belt-sanded surfaces Commercial sheet (recrystallized)
Fig. 1 — Manufacturing process for TD-NiCr sheet. (From Ref. 3)
O' Qo
- » ( 0 . 7 9 1 — — - — 6 . 3 IO. 25) diam
Fig. 2 — Resistance spot-weld lap joint specimen used for tensile-shear, stress-rupture shear, and fatigue tests. Reinforcing tabs are spot welded to the test specimen to prevent failure at the pin holes. Dimensions are in millimetres (in.). Section A -A was used for metallographic examination of the test weld
Elevated temperature strengthening is produced from a combination of factors (Ref. 3) that include: (a) the f ine thoria dispersion in a Ni-Cr matrix, and (b) a stable textured microstructure w i th large pancake-shaped grains. This structure is produced during a recrystallization anneal after a thermomechanical p rocess ing cycle. Both a specially processed and commercially processed TD-NiCr sheet, 0.4 mm (0.015 in.) thick, were used in this program.
Specially Processed (SP) TD-NiCr. The manufacturing process for TD-NiCr sheet (from Ref. 3) is shown in Fig. 1. Note that when the material is removed from the processing cycle, directly after warm roll ing, it is unrecrystallized. In this specially processed condition (hereafter termed "SP"), TD-NiCr has a very f ine grain size that cannot be resolved by light microscopy (Refs. 3 and 4). This material has relatively low high-temperature strength, but it has good ducti lity at intermediate temperatures (about 750 C).
The SP material was selected as starting material since the weld line can be eliminated by postheating as demonstrated in hot press diffusion welding of TD-NiCr sheet (Ref. 4). Postheating recrystallized the SP material to the condition of commercial TD-NiCr. In that study, 1.6 mm (0.062 in.) sheet was used as compared to 0.4 mm (0.015 in.) material for this p rog ram. S ince the chemica l composition, microstructure, and thermomechanical processing cycle were essentially the same for both thicknesses, it was felt that the metallurgical behavior would be similar. Commercial TD-NiCr.TD-N\Cr sheet
0.4 mm (0.015 in.) thick, produced by the standard commercial process (hereafter termed "commerc ia l " material) was also used as starting material. This commercial material also is processed as shown in Fig. 1. It differs f rom SP material only in the fact that it has been given a recrystallization anneal at 1180 C for two
hours after warm roll ing (Ref. 3). The commercial material thus has the large recrystallized grains and textured microstructure that are necessary for optimum strength at elevated temperatures.
Welding Procedures
After a series of prel iminary experiments, three resistance spot welding schedules were developed in this study for lap welding 0.4 mm (0.015 in.)TD-NiCr sheet. These were designated as Schedules A, B, and C. Samples prepared w i th a more conventional fusion welding schedule, wh ich was developed by a commercial source, were included in this evaluation for comparison. This welding schedule was designated as Schedule D. Best results for Schedule A, B, C and D spot welds were obtained using the procedures and settings shown in Table 1. For each welding schedule a number of lap joint test specimens of the design shown in Fig. 2 were produced. A brief description of the metallurgical objectives for the spot welds developed under the four schedules is as fol lows:
Schedule A. Used to produce a solid state resistance spot weld in SP TD-NiCr. This weld is produced wi thout recrystallizing the base metal. Postheating is employed to recrystallize the base metal and promote grain growth across the weld line.
Schedule B. Used to produce a spot weld w i th min imum heat input in commercial TD-NiCr. These welds usually involved a small amount of melt ing. But sometimes a solid state weld was produced using the same parameters.
Schedule C Used to produce a solid state resistance spot weld in commercial material.
Schedule D. Used to produce a conventional resistance spot weld in which a molten nugget is intent ionally produced.
In the fol lowing paragraphs the effect of faying surface preparation and the weld schedule development
38-s I J A N U A R Y 1 9 7 4
(0.015 in.) TD-NiCr Sheet. All Welds Were the Single-Impulse Type, Made in Air, With
Pneum. force,
kN lb %
heat
10.0 2250 < 2 0 10.0 2250 26 10.0 2250 < 2 0 6.5 1450 30
Squeeze cycles
120 120 120
25
Heat lc)
cycles Hold
cycles
Peak welding Deforma- Spot current, tion,(d) diam(e)
kA %At mm in.
11 30 1 30
15 30 3 25
20.0 27.9 24.2 10.4
0.8 8.0 2.5
13.0
4.5 0.18 4.6 0.18 5.6 0.22 4.1 0.16
(d) %A t = «o
! 100, where t0 is twice the sheet metal thickness and t, is the minimum thickness of the joint at
the completed spot weld. (e) Average values based on measurements of tested weldments. (f) Upper electrode. (g) Lower electrode.
studies are discussed in more detail. Schedules A. B and C In devel
oping the welding schedules shown in Table 1 a 400 kVA, single phase resistance welding machine was used. Early in the program it was found that high quality solid state welds could be produced by simply using a chemical etching procedure on as-received (120 grit) sanded surfaces. Therefore, the surface preparation method shown in-Fig. 3 was used. Excellent results were obtained using Class III copper electrodes in that no sticking of the electrode to the work was experienced for Schedules A and B. Wi th Schedule C, very slight to no sticking was encountered. Pneumatic force proved to be an important variable in the development of l2R heating between the faying surfaces. For example, w i th all other variables held constant for Schedule B welds, progressively decreasing the air force from 10 ki lonewtons (2250 lb) to 6.7 ki lonewtons (1510 lb) produced excessive l2R interfacial heating and a large molten nugget. Gross thoria agglomeration, weld cracking, and excessive electrode indentation resulted.
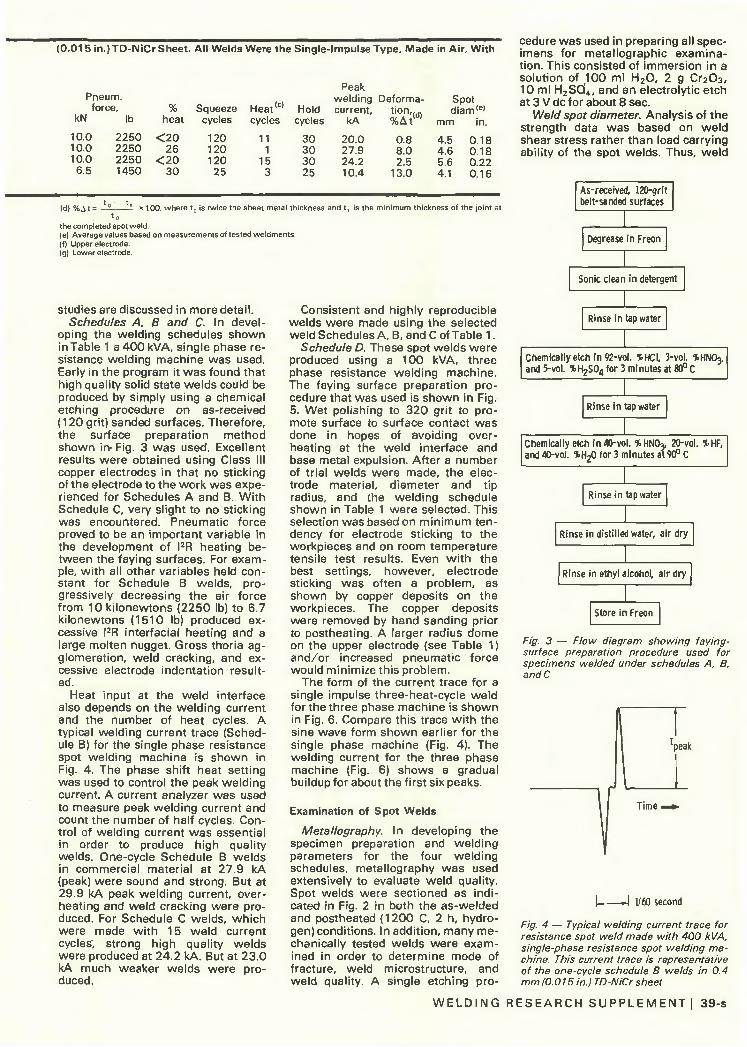
Heat input at the weld interface also depends on the welding current and the number of heat cycles. A typical welding current trace (Schedule B) for the single phase resistance spot welding machine is shown in Fig. 4. The phase shift heat setting was used to control the peak welding current. A current analyzer was used to measure peak welding current and count the number of half cycles. Control of welding current was essential in order to produce high quality welds. One-cycle Schedule B welds in commercial material at 27.9 kA (peak) were sound and strong. But at 29.9 kA peak welding current, overheating and weld cracking were produced. For Schedule C welds, wh ich were made w i th 15 weld current cycles, strong high quality welds were produced at 24.2 kA. But at 23.0 kA much weaker welds were produced.
Consistent and highly reproducible welds were made using the selected weld Schedules A, B, and C of Table 1.
Schedule D. These spot welds were produced using a 100 kVA, three phase resistance welding machine. The faying surface preparation procedure that was used is shown in Fig. 5. Wet polishing to 320 grit to promote surface to surface contact was done in hopes of avoiding overheating at the weld interface and base metal expulsion. After a number of trial welds were made, the electrode material, diameter and tip radius, and the welding schedule shown in Table 1 were selected. This selection was based on min imum tendency for electrode sticking to the workpieces and on room temperature tensile test results. Even w i th the best settings, however, electrode sticking was often a problem, as shown by copper deposits on the workpieces. The copper deposits were removed by hand sanding prior to postheating. A larger radius dome on the upper electrode (see Table 1) and/or increased pneumatic force would minimize this problem.
The form of the current trace for a single impulse three-heat-cycle weld for the three phase machine is shown in Fig. 6. Compare this trace w i th the sine wave form shown earlier for the single phase machine (Fig. 4). The welding current for the three phase machine (Fig. 6) shows a gradual buildup for about the f irst six peaks.
Examination of Spot Welds
Metallography. In developing the specimen preparation and welding parameters for the four weld ing schedules, metallography was used extensively to evaluate weld quality. Spot welds were sectioned as indicated in Fig. 2 in both the as-welded and postheated (1200 C, 2 h, hydrogen) conditions. In addit ion, many mechanically tested welds were examined in order to determine mode of fracture, weld microstructure, and weld quality. A single etching pro
cedure was used in preparing all specimens for metallographic examinat ion. This consisted of immersion in a solution of 100 ml H 2 0 , 2 g C r 2 0 3 , 10 ml H 2 S d 4 , and an electrolytic etch at 3 V dc for about 8 sec.
Weld spot diameter. Analysis of the strength data was based on we ld shear stress rather than load carrying ability of the spot welds. Thus, we ld
As-received, 120-grit belt-sanded surfaces
Degrease in Freon
Sonic clean in detergent
Rinse in tap water
Chemically etch in 92-vol. %HCI, 3-vol. ItHNO^ and 5-vol. %H2S04 for 3 minutes at 80° C
Rinse in tap water
Chemically etch in 40-vol. ItHNOj, 20-vol. %HF, and 40-vol. %H20 for 3 minutes at 90° C
Rinse in tap water
Rinse in distilled water, air dry
Rinse in ethyl alcohol, air dry
Store in Freon
Fig. 3 — Flow diagram showing faying-surface preparation procedure used for specimens welded under schedules A, B, andC
xpeak
Time.
—J 1/60 second
Fig. 4 — Typical welding current trace for resistance spot weld made with 400 kVA, single-phase resistance spot welding machine. This current trace is representative of the one-cycle schedule B welds in 0.4 mm (0.015 in.) TD-NiCr sheet
W E L D I N G R E S E A R C H S U P P L E M E N T ! 39-s

As-received, 120-grit belt-sanded surface
Degrease in methyl ethyl Ketone solvent
Soak 10 minutes in alkaline bath at 77° C
Rinse in cold water
Soak for 15 minutes at 88° C in a scale-conditioning solution of 75a/lOO0crrr of sodium carbonate, 150 g/1000 c m y of sodium hydroxide, and 75 g/1000 cm3 potassium permanganate
Rinse in cold water
Soak for 15 minutes at 88° C in a descaling solution of 300 g/1000 cm3 of citric acid, 97 g/1000 cm3 of ethyline diamine tetra-acetic acid, and 188 g/1000 cm3
of aqueous ammonia (26° Baume)
Rinse in cold water
Wet polish faying surfaces with silicon carbide, 240 grit, followed by 320 grit
Wipe with solvent cleaner just prior to resistance welding
Fig. 5 — Flow diagram showing faying-sur-face preparation procedures used for specimens welded under schedule D
Table 2 — Stress Rupture-Shear Test Results for Single-Spot Lap Joints in 0 .4 m m (0 .015 in.) TD-NiCr Sheet at 110O C. All Specimens Were Postheated at 1 2 0 0 C for 2 h in Hydrogen Prior to Testing
Schedule and
no. (a)
A-1 A-2 A-3 A-4 B-1 B-2 B-3 B-4 B-5 B-6 B-7 C-1 C-2 C-3 C-4 C-5 D-1 D-2 D-3 D-4 D-5 D-6 D-7 D-8 D-9 D-10
Load, N
622 578 534 490 622 534 490 445 423 401 378 622 578 534 490 445 245 231 222 200 200 200 191 187 178 156
lb
140 130 120 110 140 120 110 100
95 90 85
140 130 120 110 100
55 52 50 45 45 45 43 42 40 35
Weld shear stress, M N / m 2
38.8 36.0 33.2 30.7 37.6 32.2 29.6 26.9 25.6 24.2 22.8 25.2 23.4 21.6 19.7 18.0 18.4 17.5 16.8 15.1 15.1 15.1 14.4 14.1 13.4 11.7
ksi
5.62 5.22 4.82 4.42 5.45 4.67 4.28 3.89 3.70 3.50 3.30 3.64 3.39 3.13 2.86 2.61 2.67 2.53 2.43 2.19 2.19 2.19 2.09 2.04 1.94 1.70
Life, hr
29 16
592 665
19 508+
88 1.0 72
451 364
0.8 193 384 308 839+ FOL(°)
0.2 2.0 0.8 1.7
522+ 1125+
814+ 0.5
475+
Fracture
BM, away from weld BM, near weld B M , away f rom we ld BM, away f rom we ld weld shear test stopped BM, away from we ld we ld shear weld shear weld shear weld shear we ld shear BM, near weld
BM crack, weld shear test stopped we ld shear weld shear we ld shear weld shear weld shear test stopped, WSOC test stopped, WSOC test stopped, WSOC weld shear test stopped, WSOC
(a| See Table 1 (b) F0L = failed on loading (c) BM = base metal. WSOC - weld shear on cooling at zero load
peak
1/60 second
Fig. 6 — Typical welding current trace for resistance spot weld made with 100 kVA three-phase resistance welding machine. This current trace is representative for single impulse, schedule D lap welds in 0.4mm(0.015in.) TD-NiCrsheet
spot size was determined in order to evaluate weld integrity in a qualitative manner and to more accurately give a relative rating to Schedule A, B, C, and D spot welds. Scale measurements were made in order to determine spot diameter f rom tested tensile-shear and s t ress - rup tu re shear specimens. In cases where fa i l ure occurred away from the weld, spot size could not be measured in
this manner. For the tested fatigue specimens, all failures were located in the base metal in front of the spot. So, the fatigue specimens were not used in the determination of spot diameter. Spot diameter determinat ions are believed to be reasonably accurate even though some spot welds were somewhat ell iptical, rather than round. In these cases, an appropriate diameter was estimated and used for comparison. A n average value of spot diameter was determined for Series A, B, C, and D welds, and this value (shown in Table 1) was used for all calculations of shear stress at the weld.
Note in Table 1 that the weld spot diameters are rather large, being about 10 to 14 t imes the sheet thickness. In developing the welding schedules, emphasis was placed on producing particular microstructures. Spot size was a secondary consideration. Wi th a given load on a single spot welded lap jo int (Fig. 2) and spot diameter as shown in Table 1, the ratio of weld shear stress to base metal tensile stress ranges from 0.40 (for Schedule C) to 0.75 (for Schedule D).
Deformation. Typical deformation values are presented in Table 1 in terms of percent change in thickness (%At) at the center of the spot welds. For the solid state spot welds, the A t values are small: 0.8% for Schedule A
and 2.5% for Schedule C. But for the fusion spot welds, the %At values are much higher: 8% for Schedule B and 13% for Schedule D.
Mechanical Testing
Single-spot lap weldments of the design shown in Fig. 2 were subjected to the fol lowing tests (in air):
1100 C stress-rupture shear tests (to 1000 h) 1100 C tensile-shear tests Room temperature t e n s i l e -shear tests Room temperature fatigue tests (tension-tension,o-min/o-p 0.2)
Specimens resulting from each of the four weld schedules were included. Al l mechanical testing was conducted after the specimens were postheated at 1200 C for two hours in hydrogen. Prior to the postheating, residual copper (if present) was removed by hand sanding f rom the sheet/electrode contact areas. The 1100 C stress-rupture shear tests were conducted w i th deadweight loading. The 1100 C tensile-shear tests were conducted after a five minute hold t ime at the test temperature. Both the 1100 C and room temperature tensile-shear tests were run at a crosshead speed of 1.3 mm (0.05 in.) per minute. Room temperature fatigue tests were run in the tens ion/ tens ion mode.
40-s I J A N U A R Y 1 9 7 4
• Weld line
la) As-welded macrostructure. X?4.
'-•-Weld line
I S i - v S T rains
....
(bl As-welded microstructure. X500.
' i-vt,V.*r«-*::-'%iV •Weld line
(b) Postheated microstructure (1200° C, 2 hr). X500.
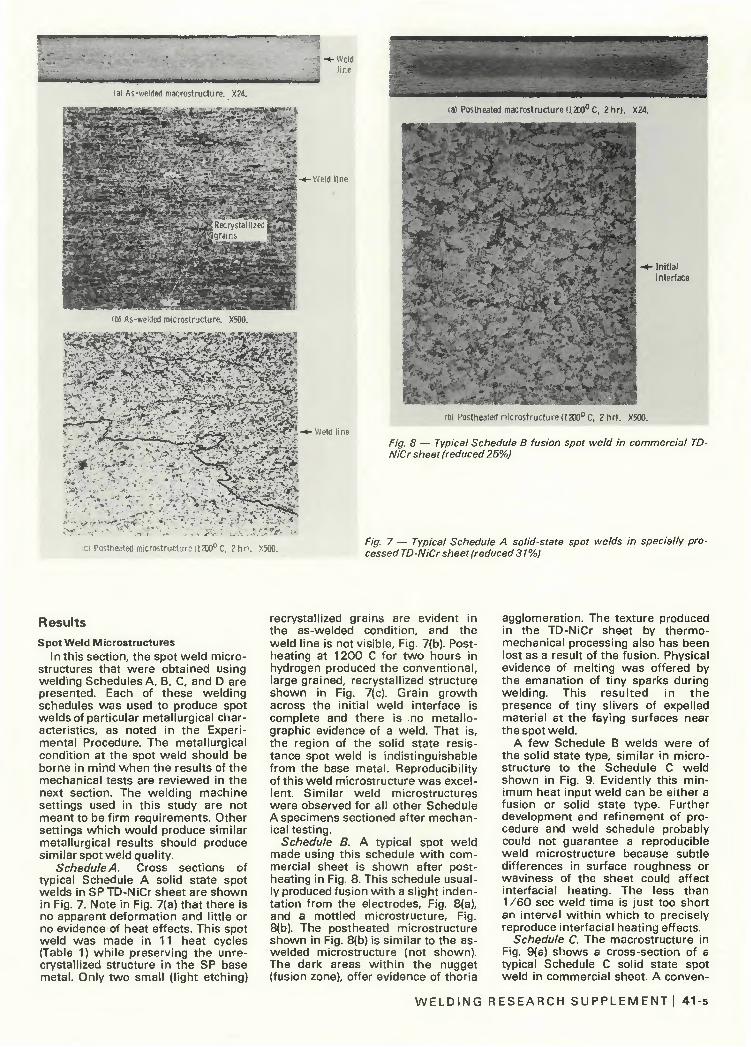
Fig. 8 — Typical Schedule B fusion spot weld in commercial TD-NiCr sheet (reduced 25%)
I d Postheated microstructure U200u C, ?hr>. X500. Fig. 7 — Typical Schedule A solid-state spot welds in specially processed TD-NiCr sheet (reduced31 %)
Resul ts
Spot Weld Microstructures In this section, the spot we ld micro-
structures that were obtained using welding Schedules A, B, C, and D are presented. Each of these welding schedules was used to produce spot welds of particular metallurgical characteristics, as noted in the Experimental Procedure. The metallurgical condition at the spot weld should be borne in mind when the results of the mechanical tests are reviewed in the next section. The welding machine settings used in th is study are not meant to be f i rm requirements. Other settings wh ich would produce similar metallurgical results should produce similar spot weld quality.
Schedule A. Cross sections of typical Schedule A solid state spot welds in SP TD-NiCr sheet are shown in Fig. 7. Note in Fig. 7(a) that there is no apparent deformation and little or no evidence of heat effects. This spot weld was made in 11 heat cycles (Table 1) wh i le preserving the unrecrystallized structure in the SP base metal. Only two small (light etching)
recrystallized grains are evident in the as-welded condit ion, and the weld line is not visible, Fig. 7(b). Postheating at 1200 C for two hours in hydrogen produced the conventional, large grained, recrystallized structure shown in Fig. 7(c). Grain growth across the init ial weld interface is complete and there is no metallographic evidence of a weld. That is, the region of the solid state resistance spot we ld is indistinguishable f rom the base metal. Reproducibility of this weld microstructure was excellent. Similar weld microstructures were observed for all other Schedule A specimens sectioned after mechanical testing.
Schedule B. A typical spot weld made using th is schedule w i t h commercial sheet is shown after postheating in Fig. 8. This schedule usually produced fusion w i th a slight indentat ion f rom the electrodes, Fig. 8(a), and a mottled microstructure. Fig. 8(b). The postheated microstructure shown in Fig. 8(b) is similar to the as-welded microstructure (not shown). The dark areas w i th in the nugget (fusion zone), offer evidence of thoria
agglomeration. The texture produced in the TD-NiCr sheet by thermomechanical processing also has been lost as a result of the fusion. Physical evidence of melting was offered by the emanation of tiny sparks during welding. This resu l ted in the presence of t iny slivers of expelled material at the faying surfaces near the spot weld.
A few Schedule B welds were of the solid state type, similar in micro-structure to the Schedule C weld shown in Fig. 9. Evidently this minimum heat input weld can be either a fusion or solid state type. Further development and ref inement of procedure and weld schedule probably could not guarantee a reproducible weld microstructure because subtle differences in surface roughness or waviness of the sheet could affect interfacial heating. The less than 1 /60 sec weld t ime is just too short an interval w i th in which to precisely reproduce interfacial heating effects.
Schedule C. The macrostructure in Fig. 9(a) shows a cross-section of a typical Schedule C solid state spot weld in commercial sheet. A conven-
W E L D I N G R E S E A R C H S U P P L E M E N T ! 41-s

TI • • ' I t • 1l.it •
EIM|niH|iJHPIM^PM|!******V
- » - , (a) As-welded macrostructure. X24.
: Initial interfa
Veld line -
4*P# :
• • • - # > - >
(b) As-welded microstructure. X500.
* • s . » i f J S ; J i (b) As-welded microstructu X500.
F/gr. 9 — Typical Schedule C solid state spot weld in commercial TD-NiCr sheet (reduced 25%)
)'&.
t£l • •"• V• § B • , ' • •'• , > V ••.<3.l>w-- , 1 /
•Ji '-:,•'-
F/g. 70— Typical Schedule D fusion spot weld in commercial TD-NiCr sheet (reduced 25%) (c) Postheated microstructure (1200° C, 2hr). X500.
t ional spot weld nugget was not produced nor is there any noticeable electrode indentation. The base metal microstructure was not disturbed, and the weld l ine is essentially a grain boundary. Fig. 9(b). This is a stable structure. No grain growth took place across the weld l ine during postheating.
In one case, a Schedule C spot weld showed some evidence of intergranular melting near the weld line. This w i l l be il lustrated under "Mechanica l Tests" in the next section.
Schedule D. This schedule produced a fusion weld w i th some electrode indentation and a wel l defined nugget, as shown in Fig. 10(a). No cracks were found, and only trace amounts of molten material were expelled between the faying surfaces. In the as-welded condit ion there is evidence of T h 0 2 agglomeration (dark areas) w i th in the nugget, Fig. 10(b). Also w i th in the nugget, the original base metal grain structure and texture were destroyed. In the postheated condit ion, Fig. 10(c), clear
ly defined wh i te regions appear near the init ial interface. These whi te areas are believed to be completely free of thoria particles (Refs. 5 and 6).
Mechanical Tests
Al l test resu l ts are s h o w n graphically in terms of shear stress on the weld rather than load. This approach is believed to give a better assessment of weld integrity. Meta l lographic analysis of typical fractured specimens is included in order to better understand the fracture mechanics and to evaluate weld quality.
Stress-rupture shear tests. Stress-rupture shear test results obtained for postheated single-spot lap joints at 1100 C are shown in Table 2. The types of fai lures listed in Table 2 are shown in Fig. 11 . Note that there was very little tendency for joint rotation. This was because of the high creep strength of the TD-NiCr sheet. As a result, relatively pure shear stress was imposed on the spot welds in the stress-rupture shear tests.
Spot weld shear stress values for Schedule A, B, C, and D welds are plotted against hours-to-rupture in Fig. 12. For comparative purposes, the 1090 C stress-rupture shear strength of 1.6 mm (0.062 in.) sheet (obtained from Ref. 4) is shown as a l ine in Fig. 12. Since it is assumed that properties of the unwelded 0.4 mm (0.015 in.) commercial TD-NiCr sheet used in this study are the same as those of the 1.6 mm (0.062 in.) sheet evaluated in Ref. 4, properties of the 1.6 mm (0.062 in.) sheet wi l l be referred to hereafter as "base meta l " properties. A l l of the Schedule A stress-rupture shear spec imens failed in the base metal. Table 2 and Fig. 11(d). Figure 13(a) (left) shows a typical weld region microstructure for a Schedule A spot weld after stress-rupture testing. The weld is sound, and the base metal shown in Fig. 13(a) (right), exhibits a typical stress-rupture failure (Ref. 6) for TD-NiCr sheet. Considering weld spot size (Table 1), the weld shear-stress to base metal tensile-stress ratio was
42-s I J A N U A R Y 1 9 7 4

(a) Shear at weld.
(b) Shear at weld and parent material cracks,
(c) Parent-material failure near spot weld.
C-72-;
(d) Parent-material failure away from spot weld.
Fig. 11 — Fracture appearance of tested 1100 C stress-rupture shear specimens (single-spot lap welds in 0.4 mm (0.015 in.) TD-NiCr sheet)
E 50
1 40
! ^
Welding schedule (table I I
0\ 1 1 1
o D A
O-A. 6
,Cr-A-
I ! i n I IO2 103
Time to rupture, hr
Fig. 12 — Comparison of shear stress-rupture lives for Schedule A, B, C and D lap welds. Single spot weldments in 0.4 mm (0.015 in.) TD-NiCr sheet were postheated at 1200 C for 2 h prior to testing
about 0.6. On this basis and because the weld test points are wel l above the shear stress curve for the base metal shown in Fig. 12, the stress-rupture shear strength of Schedule A welds is considered to be equivalent
to that of the base metal at 1100 C. Weld Schedule B test points were
above the base metal curve except for a 1 h test point (Fig. 12). But the failure mode was usually by shear at the weld. Fig. 11(a) and Table 2.
Earlier, under "Spot Weld Microstructures," it was pointed out that the Schedule B welding parameters sometimes produced solid state rather than fusion spot welds. Examination of two of the strongest welds (B-1 and B-2) showed that these were indeed solid state spot welds. The other Schedule B welds wh ich had excellent strength are considered as satisfactory for 1100 C service. The fracture microstructure of fusion spot weld B-4 in Fig. 13(b) (left) shows shear fai lure at the weld. A solid state spot weld specimen (B-2) that was unloaded after 508 h is shown in Fig. 13(b)(right).
Most of the Schedule C test points fall on or slightly above the base metal stress-rupture shear curve. The one exception is a 0.8 h failure below the curve. These results indicate that the Schedule C welds had satisfactory stress-rupture proper t ies . However, the fracture mode varied (Table 2). One specimen failed by weld shear, Fig. 11(a), and two others failed in the base metal near the weld, Fig. 11(c). Another failed by a combination of base metal cracking and weld shear. Fig. 11(b). Figure 13(c) shows a portion of the we ld microstructure for Specimen C-3 in wh ich the dark grain boundaries and dark matrix material are believed to be evidence of agglomerated thoria. Despite the evidence that some thoria agglomeration occurred, Specimen C-3 did not fail in the region shown in Fig. 13(c). Failure occurred in the base metal away from the spot weld (not shown). However, Schedule C was designed to produce solid state spot welds. For Specimen C-3 dark areas at the grain boundaries and in the matrix indicate that localized melting occurred. Further developmental efforts could probably e l iminate this small degree of melt ing. For example, reducing the number of heat cycles f rom 15 to perhaps 10 might e l im ina te th i s po ten t i a l problem area.
The Schedule D test points in Fig. 12 are below the base metal curve. Indeed, a valid stress-rupture curve cannot be drawn for the Schedule D test data because of the scatter of the rupture data. Wi th in a given we ld shear stress range, failure sometimes occurred on loading and sometimes after 4 0 0 h. Al l fai lures were smooth face shear at the weld, Fig. 11(a). Even for the cases in wh ich the test was stopped before rupture, the we ldments failed via smoothface shear on cooling under no load. This plane of weakness apparently results f rom the absence of thoria near the init ial interface (defined by the wh i te bands shown in Fig. 10(c) and the wh i te grained region at the init ial interface shown in Fig. 13(d)) and the loss of the large grain structure required for high temperature strength. On the basis of these stress-rupture results,
W E L D I N G R E S E A R C H S U P P L E M E N T ! 43-s

I fc*J;
- . : ' :£'>. -. } ^ ~ J " • .
(a-1) Weld region (no failure). la-2) Parent-material failure.
(a) Schedule A, solid-state spot weldment A-4.
.•vvir^Cv/.
&*v*
mamm
. .,V-^^-_#..v.. ... V t.v,' -jft-v t-v»* --•*• j r * i * »•#, ."V
«c* Schedule C weldment iC-3), overheated region (no lailurel
- I I Shear failure at fusion weldment B-4
(b) Schedule B spot welds
Id) Schedule D fusion spot weldment ID-9I. shear failure at weld.
(b-2) Solid-state weldment B-2 mo failure). Fig. 13 — Tested 1100 C stress-rupture shear lap weldments in TD-NiCr sheet. (X250, reduced 36%)
Table 3 — Tensile-Shear Test Results for Single-Spot Lap Joints in 0.4 mm (0.015 in.) TD-NiCr Sheet at Room Temperature and at 1100 C. All Specimens Were Postheated at 1 200 C for 2 h in Hydrogen Prior to Testing
Schedule and
no.<a)
A-5 A-6 B-8
B-9 C-6 C-7 D-11 D-12 D-13
A-7 A-8 A-9 A-10 B-10 B-11 C-8 C-9 D-14 D-15 D-16
(a) See Table 1 (b) BM = base
Fracture load,
N
800 711 631
666 578 556 467 445 365
2650 3120 3140 3090 3180 3120 3250 3400 2770 2850 2850
metal
lb
180 160 142
150 130 125 105 100 82
595 700 705 695 715 700 730 765 622 640 640
Weld shear stress at fracture
M N / m 2
1100 C tests 49.9 44.4 38.2
40.3 23.4 22.5 35.2 33.4 27.5
', ksi
7.22 6.42 5.52
5.84 3.38 3.26 5.10 4.85 3.98
Room temperature tests 165 194 195 193 192 188 131 137 208 215 215
23.9 28.1 28.3 27.9 27.8 27.2 19.0 19.9 30.2 31.1 31.1
Fracture^)
BM, away from weld BM, away from weld weld shear, partial
button weld shear BM, away from weld weld shear weld shear weld shear weld shear
button pullout (same for all
R t tests)
the Schedule D welds are considered unsatisfactory for 1100 C service where high strength jo ints are required. In addition, thermal cycling behavior of the Schedule D welds would probably be very poor because of the plane of weakness at the weld.
Tensile-shear tests. Both the 1100 C and room temperature test results are presented in this section. The test data are listed in Table 3 and plotted in Fig. 14. Photographs of tensile-shear specimens, tested at 1100 C, are shown in Fig. 15 to il lustrate the fracture modes described in Table 3. Note in Fig. 15 that the stiff base metal did not al low rotation of the joint. Thus, relatively pure shear loading was applied to the welds in the 1100 C tests. In these elevated temperature tests, best results were achieved for the Schedule A weldments because failure occurred in the base metal, Fig. 15(b), at an average weld shear stress of 47.4 newtons per square meter (6.82 ksi). The weld microstructure was similar to that shown in Fig. 13(a) (left). Schedule B, C, and D weldments were somewhat weaker and generally failed by weld shear, Figs. 14 and 15(a). A Schedule B fusion spot weld that pulled a par-
44-s | J A N U A R Y 1 9 7 4

Table 4 — Room Temperature Tension-Tension ,a |Fatigue Data for Single-Spot Lap Joints in 0.4 mm (0 .015 in.) TD-NiCr
Sheet. All Specimens Were Postheated at 1 2 0 0 C f or 2 h in Hydrogen Prior to Testing
Schedule and
no.(b)
A-11 A-12 A-13 A-14 A-15 B-12 B-13 B-14
Load Weld shear stress
15 16 17 10 11
C-12 C-13 C-14 D-17
18 19 20 21 22
lb
1890 1450 1000 800 555 1890 1560 1110 845 670 535 1960 1560 890 780 670 1340 1110 710 535 535 445
425 325 225 180 125 425 350 250 190 150 120 440 350 200 175 150 300 250 160 120 120 100
N
378 289 200 160 111 378 312 222 169 134 107 392 312 178 156 134 267 222 142 107 107 89
lb
85 65 45 36 25 85 70 50 38 30 24 88 70 40 35 30 60 50 32 24 24 20
max, MN/m 2
118 90.4 62.2 49.8 34.6 114 93.9 67.1 51.0 40.3 32.2 79.4 62.8 35.9 31.5 26.9 101 83.5 53.6 40.2 40.2 33.5
ksi
17.1 13.1 9.04 7.23 5.02 16.5 13.6 9.73 7.39 5.84 4.67 11.5 9.10 5.20 4.56 3.90 14.6 12.1 7.76 5.82 5.82 4.85
min, MN/m 2
23.6 18.0 12.5 10.0 6.9
22.8 18.8 13.5 10.2 8.1 6.4 16.4 12.6 7.2 6.1 5.4 20.1 16.8 10.7 8.0 8.0 6.7
ksi
3.42 2.61 1.81 1.45 1.00 3.31 2.72 1.95 1.48 1.17 0.93 2.39 1.82 1.04 0.91 0.78 2.91 2.43 1.55 1.16 1.16 0.97
Cycles to
failure
2.900 9,300
28,000 47,300
258,700 5,200
15,500 60,100 109,000 510,000 (c) 946,000+
7,800 38,900
480,700 401,600 ...
1,000,000+ 3,500 8.200
77,900 120,600 265,300 740,300
(a) <7min/(Tmax (b) See Table 1 (c) Test stopped
= 0.2
-LOfLJ-
1100° c -
On.
Room temperature
Fig. 14 — Comparison of tensile-shear test results for Schedule A, B, C, and D lap welds. Single-spot weldments in 0.4 mm (0.015 in.) TD-NiCr sheet were postheated at 1200 Cfor2h prior to testing
(a! Shear at weld.
hiiHUJi
C-72-27'
Fig. 16 — Failure of 1100 C tensile-shear lap weldments in TD-NiCr sheet. (X100, reduced approx. 50%)
(b) Parent-material failure away from spot weld.
Fig. 15 — Fracture appearance of tested 1100 C tensile-shear specimens (single-spot lap welds in 0.4 mm(0.015 in.) TD-NiCr sheet)
C-72-2787
Fig. 17 — Typical button pullout failure in room temperature tensile shear test specimens Single-spot weldments in 0.4 mm (0.015 in.) TD-NiCr sheet were postheated at 1200 C for 2 h prior to testing
W E L D I N G R E S E A R C H S U P P L E M E N T ! 4 5 - s

16
12
3 E
I 4
125
100 —
£ 7 5 -
0 1 -
* -
1
^ s . c ^ 3 ^
n 01
—
M i l i h l 1
^8 D
i 1 i
Welding schedule (table I)
CJ A O B D C A D
I . I . I 1 , 1 , 1 , 1 , 1
50
25 —
10̂ ID3 10° Cycles to failure
Fig. 18 — Room temperature fatigue strength of Schedule A, B, C, and D resistance spot welds. Single-spot lap welds in 0.4 mm (0.015 in.) TD-NiCr sheet were postheated at 1200 C for 2 h in hydrogen prior to testing
Fig. 19 — Typical fatigue crack in resistance spot welded0.4 mm (0.015 in.) TD-NiCr sheet. The crack is in the base metal at the periphery of the weld. Testing was done at room temperature in the postheated condition (1200 C for 2 hr)
Fig. 20 — Transgranular, room-temperature, fatigue fa/lure in single-spot lap weldment (A-13) in 0.4 mm (0.015 in.) TD-NiCr sheet. Testing was done in the postheated condition (1200 C for 2 h). (X100, reduced 49%)
Fig. 21 - Solid state resistance spot welds in 1.6 mm (0.062 in.) TD-NiCr sheet postheated at 1200 C for 2 h in hydrogen. 1X500. reduced 49%)
tial button is shown in Fig. 16(a). Weld shear w i th partial base metal pullout is shown for the Schedule C solid state spot weld in Fig. 1 6(b). The failure mode for the Schedule D welds is similar to that shown in Fig. 13(d), a smooth face shear fracture at the initial interface.
In the room temperature tensile-shear tests, the average calculated shear stress at fracture was about 186 ki lonewtons per square meter (27 ksi) for both Schedules A and B welds (Table 3 and Fig. 14). Schedule C gave a somewhat lower value 135 ki lonewtons per square meter (19.6 ksi), and Schedule D gave 173 ki lonewtons per square meter (25.1 ksi). Al l of these specimens failed by button pullout, as shown in Fig. 17. Because of this failure mode, the spot welds were not severely tested in shear. Thus, these tests were not discriminatory in the determination of weld quality.
Fatigue tests. The results of the
room temperature tests are shown in Table 4 and are plotted in Fig. 18. In the range of 104 to 10s cycles there is some difference in fatigue strength between the different welding schedule w i th the Schedule B welds being consistently stronger than the others. But at 106 cycles the fatigue strength tends to be similar for the Schedule A, B, C, and D spot welds. In no case did weld failure occur. The fatigue cracks in every case were located in the base metal at the periphery of the spot weld as shown in Fig. 19. A sect ion of a typical transgranular fatigue failure is shown in Fig. 20. These fatigue tests did show that the spot welds made under all four schedules were not prone to fatigue failure at room temperature under the cyclic conditions used here.
Discussion
Completely satisfactory resu l ts were obtained by using a solid state resistance spot welding technique
(Schedule A) and SP (unrecrystallized) TD-NiCr sheet. After postheating (1200 C, 2 h) the welds were indistinguishable from the base metal. Reproducibility of this weld micro-structure was excellent. Stress-rupture shear strength of the Schedule A spot welds was equal to that of the base metal. And in 1100 C tensile-shear, room temperature tensile-shear, and fatigue tests, failure always took place away from the weld.
Results obtained using a min imum heat input fusion spot weld in commercial sheet (Schedule B) showed promise, but there was some thoria agglomeration and the grain structure of the base metal was changed at the weld. Al though the stress-rupture shear strength was good, failure usually occurred at the weld. Schedule B welds appeared best in fatigue strength in room temperature tests. Weakening effects produced by melting apparently are not harmful in these room temperature tests. In de-
46-s I J A N U A R Y 1 9 7 4

veloping the Schedule B welding procedure, some weld cracking was produced w i th small changes in weld settings. This shows that w i th a fusion welding schedule, weld cracking is a potential problem.
For Schedule C, solid state resistance spot welds in commercial sheet, the weld line was essentially a grain boundary. Al though there was no loss of the thoria dispersion or grain structure, the lack of grain growth across the weld line was undesirable. Wi th commercial sheet, postheating did not promote grain growth across the weld line. The elevated temperature st ress-rupture shear and tensile-shear properties were good although they were generally lower than those of Schedules A and B. In some cases, Schedule C spot welds fractured at the weld in elevated temperature tests. For spot welding commercial TD-NiCr sheet to itself, however. Schedule C is preferred over Schedule B because the former is a solid state welding process that preserves the metallurgical structure of the TD-NiCr sheet and this weld microstructure is believed to be more reproducible.
The fusion spot weld produced w i th Schedule D w i th a conventional weld nugget in commercial sheet was less desirable than the others for several reasons. Wi th in the fusion zone, the fine thoria distribution and the large grain structure were destroyed. A plane of weakness at the weld was the fracture location for all 1100 C stress-rupture shear and tensi le-shear tests. A valid stress-rupture curve could not be determined because of extreme scatter in the data.
Conc lud ing R e m a r k s
Two major factors were responsible for the success achieved in the best resistance spot welds in 0.4 mm (0.015 in.) TD-NiCr sheet (i.e., using Schedule A). First was the selection of specially processed (unrecrystallized) TD-NiCr sheet. Second was the selection of a welding schedule that produced a solid state spot weld w i th out recrystallizating the specially processed sheet. Postheating produced grain growth across the weld line during recrystallization of the sheet.
Similar results were obtained in thicker gage, 1.6 mm (0.062 in.), sheet. The welding parameters that were used for the 1.6 mm (0.062 in.) thick, specially processed (unrecrystallized) sheet are shown in the Appendix. The weld microstructure in the postheated condit ion is shown in Fig. 21(a). This weld microstructure is quite similar to that shown earlier for the thinner sheet, Fig. 7(c).
Feasibility was also established for producing solid state resistance spot welds in 1.6 mm (0.062 in.) commercial TD-NiCr sheet. The weld micro-structure is shown in Fig. 21(b) and
the welding parameters are shown in the Appendix. Similar welds wh ich were made in the main portion of th is study, in 0.4 mm (0.015 in.) commercial sheet, Fig. 9(b), showed considerable promise.
The principles used here to successfully weld TD-NiCr sheet are recommended for use w i th other dispersion strengthened and diff icult-to-weld materials. Specifically, it is important to choose the best metallurgical starting condit ion for the welding process wh ich subsequently wi l l be used. Resistance spot weld schedules which wi l l produce a solid state spot weld should be considered. Resistance spot welding should not be thought of strictly as a fusion process in wh ich a molten nugget is developed. Postheating can be used effectively to improve weld quality.
Although it was beyond the scope of this study, it is believed that solid state resistance seam welds could readily be produced in TD-NiCr sheet. Al l that would be necessary is to substitute circular electrode wheels for the spot welding electrodes. Studies of solid state resistance seam welding are highly recommended where a continuous solid state weld is required.
Conclus ions
This study was designed to determine the applicability of resistance spot welding for weld ing 0.4 mm (0.015 in.) TD-NiCr sheet. Four welding schedules w e r e developed. In one schedule, specially processed (unrecrystallized) sheet was used. Commercial sheet was used for the other threee welding schedules. Both solid state and fusion spot welds were made. Weld quality was evaluated metallographically and by mechanical testing of single-spot lap joints. Included were 1100 C stress-rupture shear and tensile-shear, and room temperature tensile-shear and fatigue tests. Prior to mechanical testing, all weldments were postheated at 1200 C for two hours in hydrogen. The prime results and conclusions are as fol lows:
1. A solid state resistance spot welding schedule in combination w i th specially processed TD-NiCr
sheet resulted in the best quality welds. Wi th this procedure, all metallographic evidence of the weld was e l i m i n a t e d du r i ng pos thea t i ng (1200 C, 2 h). Stress-rupture shear strengths of the welds were equivalent to that of the base metal. In addition, base metal failure occurred away from the weld in the tensi le-shear tests at room temperature and 1100 C, and in the fatigue tests.
2. In commercial TD-NiCr sheet, overall spot weld qual i ty w a s generally satisfactory although not as good as that obtained w i th the specially processed material. Best results were achieved w i th the fol lowing weld schedules:
(a) A solid state welding schedule in wh ich spot welds w i th good stress-rupture shear s t r e n g t h were produced. Tensile-shear and fatigue strengths also were good. This solid state welding schedule is preferred over the min imum heat input fusion spot, because the solid state welding schedule does not change base metal microstructure at the weld. Also any potential weld cracking problem associated wi th melt ing can be avoided. (b) A minimum heat input fusion spot welding schedule wh ich gave good stress-rupture shear, tensile-shear, and fatigue properties. But shear failures at the weld in the stress-rupture shear tests were evidence that the thoria dispersion and the grain structure were adversely affected.
3. Fusion spot welds w i th a wel l defined nugget in commercial TD-NiCr sheet are less satisfactory for elevated temperature service. Erratic stress-rupture propert ies and a smooth face, weld shear fracture in the 1100 C stress-rupture shear and tensile-shear tests were observed.
Appendix
A resistance spot welding schedule (single impulse) was developed for single-spot lap welds in 1.6 mm (0.062 in.) specially processed and commercial TD-NiCr sheet. The variables associated w i th the two types of sheet are shown in Table A. Al l other parameters remained constant.
Table A — Variables Associated with Resistance Spot Welding of 1.6 mm (0.062 in. TD-NiCr Sheet
Base metal
Specially processed
Commercial
Heat cycles
11
15
Peak welding current, kA
18.8
19.5
Deformation %At (a)
none
0.2
Spot diam,™ mm in.
6.9 0.27
7.2 0.28
(a) SeeTable 1, footnote (d) (b) Measured from a single photomacrograph . Weld sectioned as shown in Fig. 2.
W E L D I N G R E S E A R C H S U P P L E M E N T ! 47-s

Of the latter, the fol lowing were the same as given for Schedule A, Table 1: surface preparation, welding atmosphere, welding machine, electrodes (type and dimensions), percent heat, squeeze cycles and hold cycles. Pneumatic force was 13.0 kN (2860 lb).
References
1. Blankenship, C. P. and Saunders, N.
T„ "Development of Dispersion-Strengthened Ni-Cr-Th02 Alloys of the Space Shuttle Thermal Protection System," NASA TM X-68024, March 1972.
2. Holko, K. H., Moore, T. J. and Gyor-gak, C. A., "State-of-Technology for Joining TD-NiCr Sheet," NASA TM X-68070, September 1972.
3. Klingler, L. J. and Weinberger, W. R., "Production of Dispersion Strengthened Nickel-Chromium Alloys," Space Shuttle Materials, Vol. 3 of National SAMPE Technical Conference, Soc. Aerospace Mat.
Process Eng., 1971, pp. 201-21 9. 4. Holko, K. H. and Moore, T. J., "En
hanced Diffusion Welding of TD-NiCr Sheet," Welding Journal, 51(2), Res. Suppl., 81 -s to 89-s, February 1972.
5. Whittenberger, J. D., "Diffusion in Thoriated and Nonthoriated Nickel and Nickel-Chromium Alloys at 1260 C," NASA TN D-6797, May 1972.
6. Whittenberger, J. D., "Diffusional Creep and Creep-Degradation in the Dispersion-Strengthened Alloy TD-NiCr," NASA TN D-7079, Oct. 1 972.
THE WELDING ENVIRONMENT
A research report on fumes and gases generated during welding operations
THE WELDING ENVIRONMENT presents important new data on the fumes produced during welding and recommends standard methods for sampling and analyzing these fumes.
Based on a study of welding fumes conducted by Battelle Memoria l Institute, the report is divided into three major parts. The first of these is essentially a state-of-the-art review which gives the essential f indings in the literature surveyed wi th an interpretation of the results and their implications.
A lack of uniformity in sampling and reporting data observed in Part I led to the experimental investigation reported in Part II. Part MA reports on the development of uniform procedures for generation, sampling, and analysis of welding fumes and gases and includes many tables of data on composit ions of welding fumes using several different f i l ler metals and fluxes. Part MB reports results of a supplemental investigation. Part III suggests uniform methods for sampling and analysis of welding fumes and gases.
THE WELDING ENVIRONMENT contains 124 tables, 40 il lustrations, and extensive literature references. Six appendices at the end of the report present supplementary information on Part 1 plus a discussion of federal and state safety regulations and a glossary of medical terms.
CONTENTS
Part I: Review of the Literature on Welding Fumes and Gases. Introduction. Hygienic Considerations of Welding Fumes and Gases. Welding Fume and Gas Investigations. Other Fume and Gas Investigations. Ventilation Considerations. Discussion of Prior Investigations. References-Part I. Part MA: Experimental Study of Arc-Welding Fumes and Gases. Introduction. Background. Materials. Equipment. Procedures. Evaluation of Analytical Techniques. Total Fume Studies. Fume Measurements in the Helmet Region. Effect of Welding Position on Fume Concentrations. Part MB: Supplementary Investigation of Arc-Welding Fumes and Gases. Introduction. Experimental Studies. References—Part II.Part III: Proposed Procedures for Sampling and Analysis of Welding Fumes and Gases. Introduction. Scope. Procedures. Appendix A: Physiological Effects from Exposure to Welding Fumes. Appendix B: Aerosol Deposition and Measurement. Appendix C: Air Sampling and Contaminants. Appendix D: Fume Analysis Techniques. Appendix E: Federal and State Regulations. Appendix F: Glossary of Medical Terms. 792 pp., 8V2 in. x 11 in., paperbound.-
The list price of THE WELDING ENVIRONMENT is $20.00.* Send your orders for copies to the American Welding Society, 2501 N.W. 7th Street, Miami , Florida 33125.
'Discount 25% to A and B members; 20% to bookstores, public libraries, and schools; 15% to C and D members. Add 4% sales tax in Florida.
48-s I J A N U A R Y 1 9 7 4