solar radiation alert system (revised 5/30/08)
TRANSCRIPT

Kyle Copeland1
Herbert H. Sauer2
Wallace Friedberg1
1Civil Aerospace Medical InstituteFederal Aviation AdministrationOklahoma City, OK 73125
2National Geophysical Data CenterNational Oceanic and Atmospheric AdministrationBoulder, CO 80305
March 2009
Final Report
Solar Radiation Alert System(Revised 30 May 2008)
DOT/FAA/AM-09/6Office of Aerospace MedicineWashington, DC 20591
OK-09-0434-JAH
Federal AviationAdministration

NOTICE
This document is disseminated under the sponsorship of the U.S. Department of Transportation in the interest
of information exchange. The United States Government assumes no liability for the contents thereof.
___________
This publication and all Office of Aerospace Medicine technical reports are available in full-text from the Civil Aerospace Medical Institute’s publications Web site:
www.faa.gov/library/reports/medical/oamtechreports
�
Technical Report Documentation Page 1. Report No. 2. Government Accession No. 3. Recipient's Catalog No.
DOT/FAA/AM-09/6 4. Title and Subtitle 5. Report Date
March 2009 Solar Radiation Alert System 6. Performing Organization Code
7. Author(s) 8. Performing Organization Report No. Copeland K,1 Sauer HH,2 Friedberg W1
9. Performing Organization Name and Address 10. Work Unit No. (TRAIS)
11. Contract or Grant No.
1FAA Civil Aerospace Medical Institute P.O. Box 25082 Oklahoma City, OK 73125
2National Geophysical Data CenterNOAA, Boulder, CO 80305
12. Sponsoring Agency name and Address 13. Type of Report and Period Covered Office of Aerospace Medicine Federal Aviation Administration 800 Independence Ave., S.W. Washington, DC 20591 14. Sponsoring Agency Code
15. Supplemental Notes This work was accomplished under approved task TOXLAB.AV9000 1208AC086110 16. Abstract The Solar Radiation Alert (SRA) system continuously evaluates measurements of high-energy protons made by instruments on GOES satellites. If the measurements indicate a substantial elevation of effective dose rates at aircraft flight altitudes, the Civil Aerospace Medical Institute issues an SRA via the National Oceanic and Atmospheric Administration Weather Wire Service. This report describes a revised SRA system. SRA issue-criteria remain the same but significant improvements have been made in the calculations. The solar proton fluence to effective dose conversion coefficients have been recalculated using 2007 recommendations of the International Commission on Radiological Protection and the latest release of the Monte Carlo transport code, MCNPX 2.6.0. The shape of the <10 MeV secondary neutron spectrum is now accounted for down to 100 eV. The flux correction based on spectral index has been revised to smooth the flux spectrum of solar protons. Estimates of the >605 MeV spectral shape have been improved by the addition of correction factors for the differential interpretation of the >700 MeV integral flux channel. Estimates of galactic cosmic radiation background count rates in the GOES data are now median rather than mean values. Estimated solar cosmic radiation dose rates are about 10 times higher than those made using the previous version of the SRA system.
17. Key Words 18. Distribution Statement
Solar Radiation, Monte Carlo Particle Transport Code, Solar Protons, Solar Particles, Space Weather, Solar Flare, Coronal Mass Ejection
Document is available to the public through the Defense Technical Information Center, Ft. Belvoir, VA 22060; and the National Technical Information Service, Springfield, VA 22161
19. Security Classif. (of this report) 20. Security Classif. (of this page) 21. No. of Pages 22. Price Unclassified Unclassified 24
Form DOT F 1700.7 (8-72) Reproduction of completed page authorized

���
ACKNOWLEDGMENTS
For ed�tor�al and techn�cal contr�but�ons to th�s report, we thank: E.B. Darden, Jr., Oak R�dge Assoc�ated Un�-
vers�t�es (Ret.), Oak R�dge, TN; M.E. Wayda and F.E. Duke (contract employee), C�v�l Aerospace Med�cal Inst�tute,
FAA, Oklahoma C�ty, OK; D.E. Parker, Un�vers�ty of Oklahoma Health Sc�ences Center, Oklahoma C�ty, OK; M.P.
Sattler, Un�ted States A�r Force; and M.A. Shea and D.F. Smart, Un�vers�ty of Alabama, Huntsv�lle, AL.


v
CONTENTS
IntroductIon . . . . . . . . . . . . . . . . . . . . . . . . . . . . . . . . . . . . . . . . . . . . . . . . . . . . . . . . . . . . . . . . . . . 1
Background . . . . . . . . . . . . . . . . . . . . . . . . . . . . . . . . . . . . . . . . . . . . . . . . . . . . . . . . . . . . . . . . . . . . 1
overvIew . . . . . . . . . . . . . . . . . . . . . . . . . . . . . . . . . . . . . . . . . . . . . . . . . . . . . . . . . . . . . . . . . . . . . . . 1
Rev�s�ons S�nce the Earl�er Vers�on . . . . . . . . . . . . . . . . . . . . . . . . . . . . . . . . . . . . . . . . . . . . . . . . . 1
SRA messages . . . . . . . . . . . . . . . . . . . . . . . . . . . . . . . . . . . . . . . . . . . . . . . . . . . . . . . . . . . . . . . . . 1
Method used to estIMate effectIve dose rates at flIght altItudes . . . . . . . . . . . . . . . . . . . . . . . 6
Bas�s of SRA System . . . . . . . . . . . . . . . . . . . . . . . . . . . . . . . . . . . . . . . . . . . . . . . . . . . . . . . . . . . . 6
Calculat�ng Effect�ve Dose Rate at Spec�fic Alt�tudes . . . . . . . . . . . . . . . . . . . . . . . . . . . . . . . . . . . 7
Method used to estIMate rIsk that the equIvalent dose to a conceptus exceeds 500 µsv In a 10-hour exposure . . . . . . . . . . . . . . . . . . . . . . . . . . . . . . . . . . . . . . . . . . . . . . . . . . . . . . . . . . . . . . 8
results and dIscussIon . . . . . . . . . . . . . . . . . . . . . . . . . . . . . . . . . . . . . . . . . . . . . . . . . . . . . . . . . . . 11
references . . . . . . . . . . . . . . . . . . . . . . . . . . . . . . . . . . . . . . . . . . . . . . . . . . . . . . . . . . . . . . . . . . . . . 11
appendIx A. Sample Solar Rad�at�on Alert System Messages . . . . . . . . . . . . . . . . . . . . . . . . . . . . . . . . A1


1
Solar radiation alert SyStem
INTRODUCTION
BackgroundDur�ng a�r travel, a�rcraft passengers and crew are usu-
ally exposed to �on�z�ng rad�at�on at h�gher dose rates than members of the general populat�on. The pr�nc�pal �on�z�ng rad�at�on for a�r travelers �s galact�c cosm�c rad�at�on, a ma�n source of wh�ch �s supernovae (explod�ng stars). Occas�onally, a d�sturbance �n the Sun leads to a large flux of solar protons w�th suffic�ent energy to penetrate Earth’s magnet�c field, enter the atmosphere, and �ncrease �on�z�ng rad�at�on levels at a�rcraft fl�ght alt�tudes (geo-potent�al alt�tudes are reported). For a pr�mer on a�rcrew exposure to �on�z�ng rad�at�on see Reference 1.
OverviewThe Federal Av�at�on Adm�n�strat�on (FAA) has �n
operat�on a system for cont�nuous evaluat�on of proton flux measurements made by �nstruments on Geosynchro-nous Operat�onal Env�ronmental Satell�tes (GOES). The system �s �llustrated �n F�gure 1. At present, the pr�mary data source �s GOES-11; GOES-10 measurements are used �f there �s a problem obta�n�ng data from GOES-11. If measurements �nd�cate the l�kel�hood of a substant�al elevat�on of �on�z�ng-rad�at�on levels at a�rcraft fl�ght alt�-tudes at polar lat�tudes (locat�ons w�th an effect�ve cutoff r�g�d�ty of ~0 MV (2)), the FAA’s C�v�l Aerospace Med�cal Inst�tute (CAMI) �ssues a Solar Rad�at�on Alert (SRA) to the Nat�onal Ocean�c and Atmospher�c Adm�n�strat�on Weather W�re Serv�ce (NWWS) (3).
The spec�fic cr�ter�a for �ssuance of an SRA �s that the est�mated effect�ve dose rate �nduced by solar protons at 70,000 ft equals or exceeds 20 m�cros�everts per hour (µSv/h) for each of three consecut�ve 5-m�nute per�ods. Because of the potent�al for a delay of 3-20 m�nutes �n commun�cat�on processes and the three 5-m�nute per�ods, not�ficat�on of the start of SRA cond�t�ons may be 18-35 m�nutes after the start of the first 5-m�nute per�od. The SRA �s canceled when the average effect�ve dose rate at 70,000 ft �s less than 20 µSv/h for s�x consecut�ve 5-minute periods.
Revisions Since the Earlier VersionTh�s report replaces Office of Aerospace Med�c�ne
report DOT/FAA/AM-05/14 (4) descr�b�ng the prev�-ous vers�on of the FAA SRA system. S�gn�ficant changes �nclude:
(a) Table 1 has been rev�sed to reflect s�gn�f�cant �m-provements: part�cle fluences �n the atmosphere have been recalculated us�ng the most recent release of the Monte Carlo transport code, MCNPX 2.6.0 (5). Effect�ve dose has been recalculated based on the 2007 recommenda-t�ons of the Internat�onal Comm�ss�on on Rad�olog�cal Protect�on (6) w�th the shape of the <10 MeV secondary neutron spectrum accounted for down to 100 eV. Also, the table values have been restated �n terms of dose per un�t fluence of part�cles enter�ng the atmosphere, rather than un�t fluence measured at the satell�te.
(b) Step 5 has been rev�sed to smooth the flux spectrum of solar protons. Step 8 has been rev�sed to reproduce the measured flux by alter�ng the spectral �ntens�ty rather than the spectral-hardness �ndex. A new Step 10 has been added to convert from GOES flux to flux enter�ng the atmosphere.
(c) Est�mates of spectral hardness and �ntens�ty �nvolv-�ng data from the H�gh-Energy Proton and Alpha Detector (HEPAD) have been �mproved through the add�t�on of correct�on factors for the d�fferent�al �nterpretat�on of channel P11 (Table 3).
(d) Est�mates of galact�c cosm�c rad�at�on “back-ground” count rates �n the GOES data are med�an rather than mean values.
The net result of the rev�s�ons, comb�ned w�th bug fixes �n the source code, �s cons�derably h�gher dose rates at all alt�tudes. As an example, F�gure 2 shows est�mates made for 20 January 2005 us�ng both vers�ons.
SRA messagesS�x d�fferent message types are �ssued to the NWWS
(3): Test, Alert, Alert Update, Alert Cancellat�on, Serv�ce Suspended, Serv�ce Resumed. A Test message �s sent every day at 1500 Coord�nated Un�versal T�me (UTC), un-less cond�t�ons �nd�cate an Alert, Alert Update, or Alert Cancellat�on message should be sent. An Alert message �s sent when the cr�ter�a for an SRA �s met. After the Alert message, Alert Update messages are sent every 5 m�nutes unt�l the cond�t�ons �nd�cate that the SRA should be cancelled. The Alert Cancellat�on message �s then sent. A Serv�ce Suspended message �s sent when the system cannot obta�n up-to-date GOES data. Data outages can occur dur�ng GOES ecl�pse seasons and because of commun�cat�ons trouble between SWPC and

2
Figure 1. Solar Rad�at�on Alert system: (1) Occas�onally, a d�sturbance �n the Sun (solar flare, coronal mass eject�on) leads to a large flux of h�gh-energy part�cles �n the v�c�n�ty of the Earth. (2) Instruments on a GOES satell�te cont�nuously measure the rad�at�on, and the �nformat�on �s transm�tted to NOAA. (3) From there �t �s sent to CAMI. A computer at CAMI analyzes the measurements. (4) If the measurements �nd�cate the l�kel�hood of a substant�al elevat�on of �on�z�ng rad�at�on levels at a�rcraft fl�ght alt�tudes, a Solar Rad�at�on Alert �s �ssued to the NOAA Weather W�re Serv�ce. Est�mated effect�ve dose rates for 30-, 40-, 50-, 60-, and 70-thousand feet are �ncluded and updated at 5-m�nute �ntervals for the durat�on of the alert. (5) The Nat�onal Weather Serv�ce d�str�butes alerts and updates v�a the NOAA Weather W�re Serv�ce and the Internet.

3
Table 1. Effective dose per unit incident fluence, Δ(R,H)a, to an adult at altitude (H), from incident exoatmospheric protons of rigidity (R)Table 1. Effective dose per unit incident fluence, (R,H),a to an adult at altitude (H), from incident exoatmospheric protons of rigidity (R)
Rigidity (R) Altitude (H) b
MV -50 ft 9722 ft 19,588 ft 29,378 ft 39,197 ft 183.5 1.00 x 10⁻¹⁶ 1.00 x 10⁻¹⁶ 1.00 x 10⁻¹⁶ 1.84 x 10⁻¹¹ 4.52 x 10⁻¹⁰
245.6 1.00 x 10⁻¹⁶ 1.00 x 10⁻¹⁶ 3.08 x 10⁻¹³ 5.69 x 10⁻¹¹ 1.39 x 10⁻⁹
329.7 1.00 x 10⁻¹⁶ 1.00 x 10⁻¹⁶ 4.51 x 10⁻¹³ 2.76 x 10⁻¹⁰ 8.16 x 10⁻⁹
444.6 1.00 x 10⁻¹⁶ 4.42 x 10⁻¹² 5.03 x 10⁻¹⁰ 1.77 x 10⁻⁸ 2.65 x 10⁻⁷
604.4 6.31 x 10⁻¹⁰ 6.05 x 10⁻¹⁰ 2.03 x 10⁻⁸ 3.39 x 10⁻⁷ 2.69 x 10⁻⁶
832.7 2.44 x 10⁻⁹ 7.11 x 10⁻⁸ 8.83 x 10⁻⁷ 5.89 x 10⁻⁶ 2.45 x 10⁻⁵
1171. 2.43 x 10⁻⁸ 7.37 x 10⁻⁷ 7.21 x 10⁻⁶ 3.78 x 10⁻⁵ 1.32 x 10⁻⁴
1696. 2.17 x 10⁻⁷ 4.62 x 10⁻⁶ 3.79 x 10⁻⁵ 1.93 x 10⁻⁴ 6.36 x 10⁻⁴
2549. 8.26 x 10⁻⁷ 1.49 x 10⁻⁵ 1.11 x 10⁻⁴ 4.70 x 10⁻⁴ 1.24 x 10⁻³
3991. 1.92 x 10⁻⁶ 3.54 x 10⁻⁵ 2.53 x 10⁻⁴ 9.84 x 10⁻⁴ 2.38 x 10⁻³
4848. 2.77 x 10⁻⁶ 4.89 x 10⁻⁵ 3.37 x 10⁻⁴ 1.27 x 10⁻³ 3.01 x 10⁻³
6494. 5.82 x 10⁻⁶ 8.75 x 10⁻⁵ 5.48 x 10⁻⁴ 1.93 x 10⁻³ 4.19 x 10⁻³
10,898. 3.14 x 10⁻⁵ 2.07 x 10⁻⁴ 1.06 x 10⁻³ 3.45 x 10⁻³ 7.13 x 10⁻³
18,695. 9.98 x 10⁻⁵ 4.61 x 10⁻⁴ 2.05 x 10⁻³ 6.14 x 10⁻³ 1.18 x 10⁻²
20,917. 1.02 x 10⁻⁴ 5.54 x 10⁻⁴ 2.36 x 10⁻³ 6.75 x 10⁻³ 1.25 x 10⁻²
32,545. 2.35 x 10⁻⁴ 9.41 x 10⁻⁴ 3.65 x 10⁻³ 9.98 x 10⁻³ 1.81 x 10⁻²
Rigidity (R) Altitude (H) b
MV 48,977 ft 58,749 ft 68,511 ft 78,260 ft 183.5 4.18 x 10⁻⁹ 1.91 x 10⁻⁸ 5.22 x 10⁻⁸ 9.68 x 10⁻⁸
245.6 1.52 x 10⁻⁸ 7.82 x 10⁻⁸ 2.21 x 10⁻⁷ 4.25 x 10⁻⁷
329.7 9.16 x 10⁻⁸ 4.48 x 10⁻⁷ 1.23 x 10⁻⁶ 2.33 x 10⁻⁶
444.6 1.64 x 10⁻⁶ 5.39 x 10⁻⁶ 1.16 x 10⁻⁵ 1.89 x 10⁻⁵
604.4 1.11 x 10⁻⁵ 2.86 x 10⁻⁵ 5.36 x 10⁻⁵ 8.15 x 10⁻⁵
832.7 6.87 x 10⁻⁵ 1.43 x 10⁻⁴ 4.38 x 10⁻⁴ 1.78 x 10⁻³
1171. 5.30 x 10⁻⁴ 1.37 x 10⁻³ 1.81 x 10⁻³ 1.88 x 10⁻³
1696. 1.25 x 10⁻³ 1.80 x 10⁻³ 2.13 x 10⁻³ 2.26 x 10⁻³
2549. 2.20 x 10⁻³ 2.97 x 10⁻³ 3.36 x 10⁻³ 3.41 x 10⁻³
3991. 3.91 x 10⁻³ 4.93 x 10⁻³ 5.29 x 10⁻³ 5.17 x 10⁻³
4848. 4.84 x 10⁻³ 6.01 x 10⁻³ 6.37 x 10⁻³ 6.16 x 10⁻³
6494. 6.32 x 10⁻³ 7.47 x 10⁻³ 7.62 x 10⁻³ 7.17 x 10⁻³
10,898. 1.00 x 10⁻² 1.11 x 10⁻² 1.07 x 10⁻² 9.62 x 10⁻³
18,695. 1.57 x 10⁻² 1.65 x 10⁻² 1.53 x 10⁻² 1.34 x 10⁻²
20,917. 1.62 x 10⁻² 1.69 x 10⁻² 1.56 x 10⁻² 1.36 x 10⁻²
32,545. 2.30 x 10⁻² 2.31 x 10⁻² 2.08 x 10⁻² 1.76 x 10⁻²
a Sv/(incident proton/cm2)b Geopotential altitude converted from atmospheric depth (11).
a µSv/(incident proton/cm2)b Geopotential altitude converted from atmospheric depth (11).

4
Table 2. Conversion factors (k, k') and characteristic rigidities (RP[j] in MV) (7)
Channel Conversion factor k a
Conversion factor k' b
Characteristic rigidity (RP[j]) c
P4 4.64 22.25 225.1 P5 15.5 43.04 338.2 P6 90. 252.8 563.9 P7 300. 1210. 950.0 P10 162. 175.6 1225. P11 1565. d 1103. 1700. a
k: counts/(particles/(cm2•sr•MeV))b k': counts/(particles/(cm2•sr•MV))
c The characteristic rigidity is a weighted average rigidity, where the weighting depends on the instrument sensitivity across the width of the channel and the assumed spectral shape.
d k: counts/(particles/(cm2•sr))
Table 3. Spectral-hardness index correction factors (s) for protons (7) a
ChannelSpectral-hardnessindex, γ P4 P5 P6 P7 P10 P11 Spectral-hardness index correction factor
0 1.0000 1.0000 1.0000 1.0000 1.0000 0.289 1 0.9565 0.9775 0.9733 0.9300 0.9968 0.289 1.5 0.9171 0.9562 0.9483 0.8675 0.9936 0.289 2 0.8777 0.9350 0.9233 0.8050 0.9904 0.513 3 0.7751 0.8764 0.8553 0.6502 0.9808 0.812 4 0.6609 0.8060 0.7753 0.4913 0.9683 0.962 5 0.5458 0.7284 0.6888 0.3485 0.9529 1.01 6 0.4380 0.6476 0.6011 0.2329 0.9348 1.00 7 0.3428 0.5674 0.5161 0.1473 0.9142 0.948 8 0.2623 0.4904 0.4366 0.08856 0.8914 0.874 9 0.1969 0.4186 0.3645 0.05089 0.8666 0.789
10 0.1453 0.3533 0.3006 0.02811 0.8400 0.702 a Intermediate correction factors are obtained by linear interpolation.

5
4
Table 4. Rigidity limits (in MV) for differential flux spectra
Flux spectrum (i) 1 2 3 4 5 6 Lower rigidity, Ri,lower 137 338 564 950 1225 1343 Upper rigidity, Ri,upper 338 564 950 1225 1343 See Step 9
Figure 2. (a) Or�g�nal SRA system est�mates of effect�ve dose rate on 20 January 2005, dur�ng the solar proton event of 16 January 2005; (b) Rev�sed SRA system est�mates of effect�ve dose rate on 20 January 2005, dur�ng the solar proton event of 16 January 2005.

6
CAMI. Informat�on g�ven w�th Alert and Alert Update messages �ncludes:
(a) Est�mated effect�ve dose rates from solar cosm�c rad�at�on �n µSv/h, based on 5-m�nute averages, at alt�-tudes of 30-, 40-, 50-, 60-, and 70-thousand feet.
(b) Est�mated r�sk that the equ�valent dose to the con-ceptus w�ll exceed 500 µSv at 40-, 50-, and 60-thousand feet �n a 10-hour exposure.
(c) Effect�ve doses for the prev�ous 1, 3, 5, and 10 hours at 40-, 50-, and 60-thousand feet.
A sample of each type of message �ssued by the system �s �n Append�x A. SRA system related messages can be �dent�fied �n three ways:
(a) The Advanced Weather Interact�ve Process�ng System (AWIPS, 7) �dent�f�er �s ALTPAV.
(b) The Space Weather Message Code �s ALTPAV.(c) The World Meteorolog�cal Organ�zat�on (WMO)
header �s WOXX50 KWNP.
Subscr�bers to the NWWS rece�ve SRA messages as part of the stream of weather related messages transm�t-ted through the NWWS. Recent SRA and other space weather related messages are also ava�lable at the Na-t�onal Weather Serv�ce Web s�te: www.weather.gov/view/ national.php?prodtype=space.
The Web s�te shows the most recent space weather-related messages.
METHOD USED TO ESTIMATE EFFECTIVE DOSE RATES AT FLIGHT ALTITUDES
Basis of SRA System Primary Solar Proton Spectrum. GOES-10 and
GOES-11 proton flux measurements are used to est�mate solar rad�at�on dose rates �n Earth’s atmosphere. They are ava�lable from the file transfer protocol (ftp) server of the Space Weather Pred�ct�on Center (SWPC) �n near real-t�me and are also ava�lable on the Internet (8). The measurements are 5-m�nute averages and are recorded �n several “channels”: P4-P7 (15-900 MeV energy, 168-1581 MV r�g�d�ty), P10 (510-700 MeV, 1103-1343 MV), and P11 (>700 MeV, >1343 MV). Channels P8 and P9 are excluded from the analys�s because the�r correct�on algor�thms are more complex than those of the other channels, and the�r exclus�on does not s�gn�ficantly affect the calculated dose rates. Fluxes �n channels P4-P10 are �n terms of d�fferent�al flux (part�cles/cm2·sterad�an·s·MeV). Fluxes �n channel P11 are �n terms of �ntegral flux (par-t�cles/cm2·sterad�an·s).
In Steps 1-3, fluxes from the SWPC are converted to count rates, galact�c background count rates are sub-tracted, and the count rates are reverted to fluxes us�ng convers�on factors that are appropr�ate for GOES-10 and GOES-11 (9).
In Steps 4-10, the fluxes are used to create a model of the proton flux spectrum enter�ng the atmosphere. The range of r�g�d�t�es (R) �n the model (137-32,545 MV) �ncludes 100% of the flux for over 99% of the solar proton events s�nce the 23 February 1956 event (10). The model cons�sts of s�x d�fferent�al flux spectra (f
i(R))
�n the form of Eq. 1, each spann�ng an adjo�n�ng r�g�d�ty range (Table 4). Parameters �n Eq. 1 are flux �ntens�ty (α) and spectral-hardness �ndex (γ).
In Step 11, the s�x spectra are used to calculate effec-t�ve doses.
Due to the requ�rement of extrapolat�ng the shape of the proton spectrum �n channel P11, the poss�b�l�ty cannot be d�scounted that the passage of a shock-front w�th a s�gn�ficantly h�gh flux of protons w�th r�g�d�t�es >1343 MV could result �n calculated doses rates that are unreal�st�cally h�gh.
Radiation Transport. The Monte Carlo rad�at�on transport code MCNPX 2.6.0 (5) was used to calculate part�cle fluences (part�cles/cm2) result�ng from the �n-teract�on of the exoatmospher�c pr�mary protons w�th the atmosphere. Part�cles transported w�th the rad�at�on transport code �nclude protons, neutrons, p�ons, kaons, photons, electrons, and muons. Prev�ous calculat�ons for alt�tudes of 60,000 ft and below �nd�cate that fluences of other part�cles are too small to be of s�gn�ficance �n dose calculat�ons (4, 11).
Earth was modeled as a sphere of l�qu�d water of rad�us 6371 km and dens�ty 1 g/cm3. Earth’s atmosphere was modeled as 100 spher�cally symmetr�c 1-km th�ck layers of a gaseous m�xture of atoms of n�trogen, oxygen, argon, and carbon, �n the fract�ons by we�ght present �n dry a�r near sea level (12). The dens�ty (g/cm3) ass�gned to each layer was the dens�ty at the geometr�c alt�tude of the m�ddle of the layer, based on data �n NOAA et al. (13). Thus, the th�ckness of the model atmosphere was 100 km, the area of �ts uppermost surface was 5.262 x 1018 cm2, and the total atmospher�c depth was 1035.08 g/cm2. Empty space surrounded the uppermost atmospher�c layer.
Fluence-to-Effective Dose Conversion. Table 1 con-ta�ns coeffic�ents ∆(R,H) for est�mat�ng effect�ve dose from part�cle fluences travel�ng �nto the top of the atmosphere, spec�fically pr�mary solar protons. Secondary part�cles
iRRf iiγα −=)( (Eq. 1)

7
�ncluded �n the dose calculat�ons (here�n des�gnated as �ncluded secondar�es) are muons, photons, electrons, pos�trons, p�ons, protons, and neutrons. Kaons were not �ncluded because the�r contr�but�on to the total dose was found to be negl�g�ble.
For �nc�dent solar protons of all energ�es, values of ∆(R,H) (µSv/(part�cle/cm2)) at each r�g�d�ty (R) and alt�tude (H) �n Table 1 were calculated as follows:
(a) For each part�cle �ncluded �n the dose calculat�ons, the average fluence spectrum at alt�tude H (part�cles/cm2) per solar proton of r�g�d�ty R enter�ng the atmosphere was mult�pl�ed by appropr�ate fluence-to-dose coeffic�ents (6, 14) to obta�n average effect�ve dose to an adult per solar proton of r�g�d�ty R enter�ng the atmosphere.
(b) Effect�ve doses to an adult were summed to obta�n J
D, the average effect�ve dose, �n µSv at alt�tude H, per
�nc�dent part�cle of r�g�d�ty R enter�ng the atmosphere.(c) JD was multiplied by 5.262 x 1018 cm2 (area of
the uppermost surface of the atmosphere) to obtain ∆(R,H), µSv at alt�tude H generated by a fluence of 1 part�cle/cm2 of solar protons of r�g�d�ty R enter�ng the atmosphere.
A ∆(R,H) of zero was reported as 1 x 10-16 µSv/(part�cle/cm2). Coeffic�ents for convert�ng fluence to effect�ve dose were obta�ned by �nterpolat�on from coeffic�ents reported by Pell�cc�on� (14), but adjusted to meet 2007 ICRP recommendat�ons (6). Table 1 �s appl�cable to any solar part�cle event.
Calculating Effective Dose Rate at Specific Altitudes Step 1. The uncorrected flux (φ) �n each of channels
P4, P5, P6, P7, P10, and P11 �s reverted to total count rate (galact�c plus solar, C) by mult�ply�ng φ by the con-vers�on factor (k) �n Table 2:
GOES-10 and GOES-11 have �dent�cal �nstruments and therefore use the same convers�on factors.
Step 2. For each channel, the med�an of the 144 ac-ceptable 5-m�nute count rates �mmed�ately preced�ng the current 5-m�nute per�od �s used as an est�mate of the galact�c cosm�c rad�at�on background (B). Count rates are unacceptable �f ≤ 0, des�gnated as "bad" by the arch�v�ng source, or �f a solar proton event �s ongo�ng (The SEC defines the onset of a solar proton event as the beg�nn�ng of the first of three or more consecut�ve 5-m�nute per�ods dur�ng wh�ch the GOES proton flux w�th energ�es ≥10 MeV exceeds 10 part�cles/(cm2·sterad�an·s) (15)). The reduct�on �n count rates dur�ng a Forbush decrease (16) �s small, and solar cosm�c rad�at�on doses based on GOES data dur�ng a large solar proton event are not apprec�ably
affected; thus the�r poss�ble �nfluence �s not a concern when calculat�ng galact�c cosm�c rad�at�on background.
The background corrected count rate (C’) �s calculated as follows:
(a) Galact�c cosm�c rad�at�on background count-rate (B) �s calculated.
(b) B �s subtracted from C, as shown �n Eq. 3.
(c) A negat�ve C’ �s changed to 1% of B.
Step 3. A d�fferent�al flux (φ'), for each of the channels l�sted �n Step 1, �s calculated by d�v�d�ng the background corrected count-rate (C') by the convers�on factor (k') from Table 2:
Step 4. W�th Eq. 5, der�ved from Eq. 1, prel�m�nary spectral-hardness �nd�ces (γ
i) are calculated for d�fferent�al
flux spectra fi=1
(R) through fi=5
(R), us�ng channel pa�rs (P[m] and P[n]): i=1 (channels P[m=4] and P[n=5]), i=2 (P[m=5] and P[n=6]), i=3 (P[m=6] and P[n=7]), i=4 (P[m=7] and P[n=10]), i=5 (P[m=10] and P[n=11]).
D�fferent�al proton fluxes (φ'P4
through φ'P11
) were calculated w�th Eq. 4 �n Step 3. Character�st�c r�g�d�t�es (R
P[m] and R
P[n]) for the channels are from Table 2.
Because the γi are calculated us�ng Eq. 5, the channel
character�st�c r�g�d�t�es are used as the upper and lower r�g�d�ty l�m�ts of most of the d�fferent�al flux spectra. Except�ons are the lower r�g�d�t�es of f
1(R) and f
6(R), and
the upper r�g�d�t�es of f5(R)
and f
6(R). The upper r�g�d�ty
of f5(R), wh�ch �s the lower r�g�d�ty of f
6(R), �s the lower
r�g�d�ty l�m�t of fluxes �n channel P11. The lower r�g�d-�ty of f
1(R)
�s the lowest r�g�d�ty of the model. The upper
r�g�d�ty of f6(R)
�s calculated �n Step 9. R�g�d�ty l�m�ts
are �n Table 4.
Step 5. D�fferent�al fluxes (φ') are further corrected (φ'') w�th Eq. 6, us�ng spectral-hardness �ndex correct�on factors (s) from Table 3. Correct�on factors are based on γ
i values calculated
w�th Eq. 5. Parameters γ
1 and γ
5 are
used w�th φ'P[j=4]
and φ'
P[j=11], respect�vely.
For φ'P5
, φ'P6
, φ'
P7, and φ'
P10, the γ
i values used to cal-
culate φ''P[j]
w�th Eq. 7 are: for φ''
P5, γ
1 and γ
2; for φ''
P6,
γ2 and γ
3; for φ''
P7, γ
3 and γ
4; for φ''
P10, γ
4 and γ
5.
(Eq. 2)kC φ=
BCC −=′ (Eq. 3)
kC ′′=′φ (Eq. 4)
(Eq. 5 ))ln()ln(
)ln()ln(
][][
][][
nPmP
mPnPi RR −
′−′=
φφγ
(Eq. 6 ))(][][ ijPjP s γφφ ′=′′

8
Step 6. For each channel pa�r �n Step 4, the prel�m�-nary spectral-hardness �ndex (γ
i) (calculated w�th Eq. 5) �s
recalculated w�th Eq. 5, but subst�tut�ng φ''P[m]
and φ''P[n]
(calculated w�th Eq. 6 and Eq. 7) for φ'
P[m] and φ'
P[n]. Any
negat�ve γi �s changed to zero. Any γ
i of 1 �s changed to
1.000001. For spectrum 6, γi �s g�ven the value of γ
5.
Step 7. For each d�fferent�al spectrum, f1(R) through
f5(R), α
i �s calculated w�th Eq. 8, us�ng character�st�c r�-
g�d�t�es (RP[j]
) from Table 2, d�fferent�al fluxes (φ''P[j]
) from Step 5, and the γ
i from Step 6. For spectra 1, 2, 3, 4, and
5, channel numbers are 4, 5, 6, 7, and 10, respect�vely.
For spectrum 6, αi �s g�ven the tr�al value of α
5.
Step 8. For channel P11, the �ntegral flux (F11
) �s obta�ned by d�v�d�ng the corrected count-rate calculated �n Step 2 (C’) by 0.73 (9). If the relat�onsh�p of Eq. 9 �s not sat�sfied by the tr�al value of α6, then a sat�sfactory value for α
6 �s calculated us�ng Eq. 10.
The upper l�m�t, 32,545 MV, �s the upper r�g�d�ty l�m�t of the model and encompasses all the ava�lable data for over 99% of the known solar proton events (10). The lower l�m�t, 1343 MV, �s the lower r�g�d�ty l�m�t of fluxes �n channel P11.
Step 9. To find R6,upper
(the upper r�g�d�ty of f6(R)), the
upper l�m�t �n Eq. 9 �s replaced w�th 1343 MV and α �s set equal to α
6. The upper l�m�t �s then �ncreased �n steps
of 1 MV unt�l the relat�onsh�p �s sat�sfied. The result�ng R
6,upper �s also the upper r�g�d�ty of fluxes �n channel P11
(�.e., f6(R>R
6,upper) = 0).
Step 10. At th�s po�nt, all parameters needed to cal-culate each f
i(R) have been obta�ned. To convert each
fi(R) from flux measured at GOES to flux enter�ng the
atmosphere, the αi values calculated �n prev�ous sect�ons
were each mult�pl�ed by π (ref. 11).
Step 11. Effect�ve dose rates (D(H), µSv/h) to an adult, at geopotent�al alt�tude (H), from exoatmospher�c pr�mary solar protons are calculated w�th Eq. 11. In Eq. 11: t �s a t�me-scale convers�on coeffic�ent (t = 3600 s/h),
i �s the spectrum, Ri,upper
and Ri,lower
are r�g�d�ty l�m�ts of spectrum i �n Table 4, f
i(R) represents flux spectra, and
∆(R,H) represents dose rate per un�t of �nc�dent proton fluence.
The �ntegral �n Eq. 11 �s evaluated numer�cally �n 1 MV steps. For �ntegrat�on steps w�th an upper r�g�d�ty less than R
0 (183.5 MV), ∆(R,H) �s set equal to ∆(R
0,H).
For all other �ntegrat�on steps, ∆(R,H) �s set equal to the mean of �ts values at the upper and lower r�g�d�t�es of the �ntegrat�on step. The values of ∆(R,H) at the upper and lower r�g�d�t�es of the �ntegrat�on step are calculated us�ng l�near �nterpolat�on of ln(R) and ln(∆(R,H)).
Dose rates (D(H)) at alt�tudes of 30- to 70-thousand feet are est�mated by calculat�ng D(H) at each of the n�ne alt�tudes �n Table 1 w�th Eq. 11 and then perform�ng a cub�c-spl�ne �nterpolat�on.
METHOD USED TO ESTIMATE RISK THAT THE EqUIVALENT DOSE TO A CONCEPTUS ExCEEDS 500 µSV IN A
10-HOUR ExPOSURE
The FAA and the Nat�onal Counc�l on Rad�at�on Protect�on and Measurements (NCRP) recommend that the equ�valent dose to a conceptus not exceed 500 µSv �n any month after pregnancy has been declared (1, 17).
Exam�nat�on of 169 of the 170 solar proton events from January 1986 through May 2008 (18) �nd�cated that 26 events met the cr�ter�a for at least one �ssuance of an SRA (an effect�ve dose ≥20 µSv/h at 70,000 ft for at least three consecut�ve 5-m�nute per�ods). Steps 1-9 g�ven above are only appropr�ate for analyz�ng GOES data from GOES-8 and more recent satell�tes (1 March 1995 to present). For solar proton events from 1 January 1986 through 28 February 1995, values of α and γ were est�mated from GOES data us�ng the procedure of sec-t�on A5 �n Ref. 11. A total of 42 SRAs would have been �ssued �n the 22-year per�od. The percentages of these SRAs for wh�ch an assoc�ated 10-hour cumulat�ve dose to the conceptus exceeded the recommended monthly l�m�t on a polar-lat�tude fl�ght was 4.8% at 40,000 ft, 21% at 50,000 ft, and 31% at 60,000 ft. F�gure 3 shows the r�sk est�mates for 40-, 50-, and 60-thousand feet as a funct�on of effect�ve dose rates at 70,000 ft. For each data po�nt at a spec�fied alt�tude, the y-coord�nate (Y) �s a percentage of SRAs,
where N �s the number of SRAs dur�ng wh�ch the ef-fect�ve dose rate at 70,000 ft equaled or exceeded the
(Eq. 7)( ) ( )
+′=′′ +
21
][][ii
jPjP
ss γγφφ
(Eq. 8)ijPjPi R γφα )( ][][′′=
(Eq. 12)N
nY 100=
(Eq. 11)
8
∑ ∫=
Δ=6
1
,
,
),()()(i
R
R iupperi
loweri
dRHRRftHD (Eq. 11)
(Eq. 9)
8
∫ −≤MV
MVdRRF
545,32
1343116γα
(Eq. 10)
9
1116116 )1343545,32)(1( 66 −−− −−= γγγα F

9
Figure 3. Est�mated r�sk that the equ�valent dose to a conceptus �n a 10-hour exposure on a polar-lat�tude fl�ght at 40-, 50-, or 60-thousand feet w�ll exceed 500 µSv when the lowest of the three h�ghest consecut�ve 5-m�nute effect�ve dose rates at 70,000 ft reaches the dose rate on the x-ax�s. Data po�nts are based on exam�nat�on of past solar proton events s�nce 1986 us�ng effect�ve doses calculated by the method of th�s report and equ�valent doses to the conceptus from Reference 11. For example, the data po�nt at (442, 50) �nd�cates that when the lowest of the three h�ghest 5-m�nute effect�ve dose rates at 70,000 ft was at least 442 Sv, the equ�valent dose to a conceptus at 40,000 ft exceeded 500 µSv �n a 10-hour exposure for 50% of alerts.
10
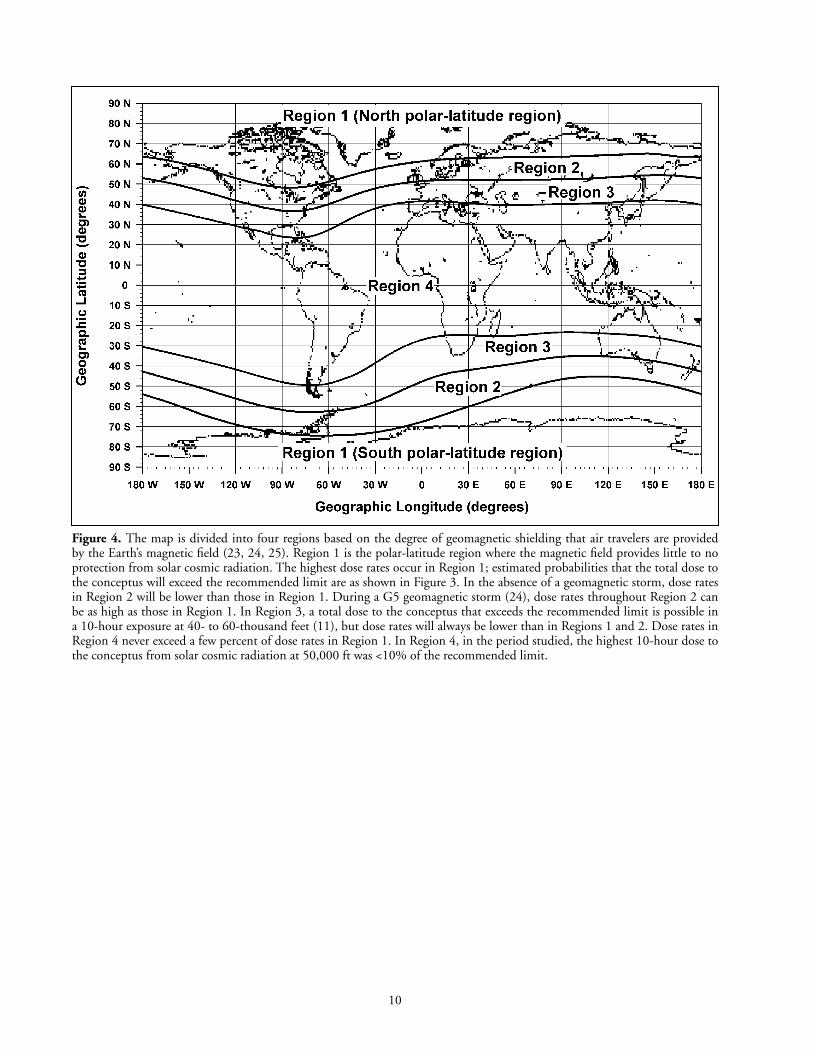
Figure 4. The map �s d�v�ded �nto four reg�ons based on the degree of geomagnet�c sh�eld�ng that a�r travelers are prov�ded by the Earth’s magnet�c field (23, 24, 25). Reg�on 1 �s the polar-lat�tude reg�on where the magnet�c field prov�des l�ttle to no protect�on from solar cosm�c rad�at�on. The h�ghest dose rates occur �n Reg�on 1; est�mated probab�l�t�es that the total dose to the conceptus w�ll exceed the recommended l�m�t are as shown �n F�gure 3. In the absence of a geomagnet�c storm, dose rates �n Reg�on 2 w�ll be lower than those �n Reg�on 1. Dur�ng a G5 geomagnet�c storm (24), dose rates throughout Reg�on 2 can be as h�gh as those �n Reg�on 1. In Reg�on 3, a total dose to the conceptus that exceeds the recommended l�m�t �s poss�ble �n a 10-hour exposure at 40- to 60-thousand feet (11), but dose rates w�ll always be lower than �n Reg�ons 1 and 2. Dose rates �n Reg�on 4 never exceed a few percent of dose rates �n Reg�on 1. In Reg�on 4, �n the per�od stud�ed, the h�ghest 10-hour dose to the conceptus from solar cosm�c rad�at�on at 50,000 ft was <10% of the recommended l�m�t.

11
x-coord�nate for three consecut�ve 5-m�nute per�ods and n �s the number of the N SRAs for wh�ch a 10-hour dose to a conceptus exceeded 500 µSv at the alt�tude of �nterest. The r�sks are est�mated us�ng Eq. 13-15, wh�ch are fits to the data for 40-, 50-, and 60-thousand feet, where D �s the lowest of the three h�ghest consecut�ve 5-m�nute effect�ve dose rates at 70,000 ft.
Est�mated r�sk at 40,000 ft = 5.900 (1 - exp-0.00004429 D) 0.6992 (13)
Est�mated r�sk at 50,000 ft = 1.009 (1 - exp-0.0006916 D) 0.7088 (14)
Est�mated r�sk at 60,000 ft = 1.010 (1 - exp-0.01988 D) 1.016 (15)
Dose est�mates for the solar proton event of 7 July 1991 could not be rel�ably est�mated because of several gaps �n the HEPAD data. However, the peak >10 MeV flux was only 2300 pfu (18) and there was no assoc�ated ground level event (19, 20). Of the 169 events exam�ned, 160 had peak >10 MeV fluxes <10,000 pfu. There were only 4 of these 160 events dur�ng wh�ch the 10-hour equ�valent dose to the conceptus exceeded the recommended l�m�t and all 4 were assoc�ated w�th very �ntense ground level events (20). Thus, �t �s very unl�kely that dur�ng the 7 July 1991 event the 10-hour equ�valent dose to the conceptus exceeded the 500 µSv recommended l�m�t.
RESULTS AND DISCUSSION Influences not accounted for �n the dose rate calcula-
t�ons are: (a) �ons other than protons (e.g., alpha part�cles) �n the pr�mary solar part�cle flux, (b) sh�eld�ng by Earth's magnet�c field, (c) an�sotropy �n the solar proton flux, and (d) sh�eld�ng by a�rcraft structure. In est�mat�ng dose rates for the SRA system, only solar protons are used because they are the dom�nant contr�butor to the �on�z�ng rad�a-t�on from the Sun at a�rcraft fl�ght alt�tudes and data are ava�lable �n near real-t�me. Other rad�at�on �nformat�on, such as GOES alpha part�cle measurements and data from the worldw�de network of neutron mon�tors, would enable more complete calculat�ons, �nclud�ng an�sotropy effects (21), but not w�th the �mmed�acy requ�red of an alert system. Earth’s magnet�c field, �nclud�ng effects of geomagnet�c storms, wh�le �mportant at lower lat�tudes, can be neglected at polar lat�tudes (F�g. 4). A�rcraft structure has very l�ttle effect on dose rates. In a study of the solar proton events of 29 September 1989, 14 July 2000, and 16 January 2005, calculat�ons �nd�cated that 0.6 g/cm2 of alum�num (approx�mate “sk�n” of a Boe�ng 747) at alt�tude 40,000 ft changed by <1% the effect�ve dose of solar plus galact�c cosm�c rad�at�on. Ferrar� et al. (22) �nvest�gated the effect of a�rcraft structure and �ts contents on the effect�ve dose of galact�c cosm�c rad�at�on, w�th a s�mulated fully-loaded A�rbus 340. They found that at a vert�cal cutoff r�g�d�ty of 0.4 GV and alt�tude
10.7 km (approx�mately 35,000 ft), a�rcraft structure and contents reduced the effect�ve dose by 0-8%, depend�ng on locat�on �n the a�rcraft.
Us�ng the method of Reference 11, wh�ch �ncorporates ground-level neutron mon�tor data and �ncludes dose rates from solar alpha part�cles, dose rates at 50,000 ft dur�ng the seven solar proton events w�th the h�ghest 10-hour polar-lat�tude doses at 50,000 ft were calculated. When compared w�th these, 77% of the dose rates est�mated by the method �n th�s report (but us�ng the same flu-ence-to-dose convers�ons as Reference 11) were w�th�n 20% (mean 5.1% lower, med�an 5.4% lower, standard dev�at�on 20%), �nd�cat�ng that dose rates generated by the rev�sed SRA system (th�s report), wh�ch uses eas�ly and rap�dly ava�lable data, are good est�mates at a�rcraft fl�ght-alt�tudes at polar lat�tudes.
REFERENCES
1. Fr�edberg, W., and Copeland, K. What Aircrews Should Know About Their Occupational Exposure to Ionizing Radiation. Wash�ngton, DC: U.S. Department of Transportat�on, Federal Av�at�on Adm�n�strat�on, Off�ce of Aerospace Med�c�ne, Report No. DOT/FAA/AM-03/16 (2003). Ava�lable through the Nat�onal Techn�cal Informat�on Serv�ce, Spr�ngf�eld VA 22161 and at: www.faa.gov/library/reports/medi-cal/oamtechreports/2000s/media/0316.pdf (accessed: 1 June 2007).
2. Clem, J.M., B�eber, J.W., Evenson, P., Hall, D., Humble, J.E., and Duld�g, M. Contr�but�on of obl�quely �nc�dent part�cles to neutron mon�tor count�ng rate. Journal of Geophysical Research 102(A12): 26919-26 (1997).
3. Nat�onal Weather Serv�ce. Solar Rad�at�on Alerts are d�str�buted to subscr�bers of the NOAAWeather W�re Serv�ce (NWWS). The NWWS �s adm�n�s-tered by Computer Sc�ences Corporat�on, phone (703) 818-4940. Messages are �dent�f�ed by the f�rst 11 characters of the WMO header “WOXX50 KWNP” and AWIPS �dent�f�cat�on “ALTPAV.” The most recent space weather messages are ava�lable w�thout subscr�pt�on at: www.weather.gov/view/national.php?prodtype=space (accessed: 18 July 2008).

12
4. Copeland, K., Sauer, H.H., and Fr�edberg, W. Solar Radiation Alert System. Wash�ngton, DC: U.S. Department of Transportat�on, Federal Av�at�on Adm�n�strat�on, Off�ce of Aerospace Med�c�ne, Report No. DOT/FAA/AM-05/14 (2005). Ava�l-able through the Nat�onal Techn�cal Informat�on Serv�ce, Spr�ngf�eld VA 22161 and at: www.faa.gov/library/reports/medical/oamtechreports/2000s/me-dia/0514.pdf (accessed: 1 June 2007).
5. Los Alamos Nat�onal Laboratory. Monte Carlo N-Part�cle Transport Code System for Mult�part�cle and H�gh Energy Appl�cat�ons (MCNPX 2.6.0), released Apr�l 2008. Ava�lable from the Rad�at�on Safety Informat�on Computat�onal Center at the Oak R�dge Nat�onal Laboratory.
6. Internat�onal Comm�ss�on on Rad�olog�cal Protect�on (ICRP). ICRP Publication 103: Recommendations of the ICRP, London, Elsev�er (2007). Ava�lable at: www.elsev�er.com/wps/f�nd/bookb�bl�ograph�c �nfo.cws_home/713998/descr�pt�on#b�bl�ograph�c �nfo (accessed: 9 January 2009).
7. NOAA, Nat�onal Ocean�c and Atmospher�c Adm�n-�strat�on. Overv�ew of the AWIPS System www.crh.noaa.gov/lmk/?n=awipsoverview (accessed: 27 February 2008).
8. Nat�onal Ocean�c and Atmospher�c Adm�n�strat�on, Space Weather Pred�ct�on Center Web S�te: www.swpc.noaa.gov/ftpmenu/lists/pchan.html. F�les to se-lect are G11pchan_5m.txt and G10pchan_5m.txt (accessed: 1 January 2008).
9. Sauer, H.H. Analysis of GOES Particle Data and the Development of a Processing Procedure in Sup-port of FAA Requirements for Radiation Exposure Estimation at Aircraft Altitudes, Boulder, CO: CIRES/NOAA-NGDC (2003). Prepared for the FAA under contract number DTFA0201P09198. 6973H5 FAA Aero Center AMQ-300. Append�x C conta�ns the �nstrument manufacturer’s cal�bra-t�on report Calibration Report for the EPS DOME Sensor Response to Protons, NXT-CAL-102, May 30, 1995, Panametr�cs, Inc. for Space Systems/Loral, Inc. The FAA-contracted report �s �n the l�brary of the C�v�l Aerospace Med�cal Inst�tute, Oklahoma C�ty, OK.
10. Sw�nson, D.B., and Shea, M.A. The September 29, 1989 ground-level event observed at h�gh r�g�d�ty. Geophysical Research Letters 17(8): 1073-5 (1990).
11. Copeland, K., Sauer, H.H., Duke, F.E., and Fr�ed-berg, W. Cosm�c rad�at�on exposure of a�rcraft oc-cupants on s�mulated h�gh-lat�tude fl�ghts dur�ng solar proton events from 1 January 1986 through 1 January 2008. Advances in Space Research 42: 1008-29 (2008).
12. ICRU, Internat�onal Comm�ss�on on Rad�at�on Un�ts and Measurements. Stopping Powers and Ranges for Protons and Alpha Particles. Bethesda, MD: Internat�onal Comm�ss�on on Rad�at�on Un�ts and Measurements, ICRU Report 49 (1993).
13. National Oceanic and Atmospheric Administration, National Aeronautics and Space Administration, and United States Air Force. U.S. Standard Atmo-sphere, 1976. NOAA S/T 76-1562, Washington, DC: U.S. Government Printing Office (1976).
14. Pellicioni, M. Overview of fluence-to-effective dose and fluence-to-ambient dose equivalent conversion coefficients for high energy radiation calculated using the FLUKA code. Radiation Protection Dosimetry 88(4): 279-97 (2000).
15. National Oceanic and Atmospheric Administration, Space Weather Prediction Center Web Site: swpc.noaa.gov/tiger/SolarProtons.html (accessed: 1 January 2008).
16. McCracken, K.G. Anisotropies in radiation of solar origin, in: MacDonald, F.B. (Ed.), Solar Proton Manual. Washington, DC: National Aeronautics and Space Administration, NASA Technical Re-port R-169 (December 1963) (Forbush decrease, pp. 73 and 74).
17. NCRP, Nat�onal Counc�l on Rad�at�on Protect�on and Measurements. Limitation of Exposure to Ion-izing Radiation. Bethesda, MD: Nat�onal Counc�l on Rad�at�on Protect�on and Measurements, Report No. 116. (1993) (NCRP recommends a monthly equ�valent dose l�m�t of 0.5 mSv (�.e., 500 µSv) to the embryo-fetus, p. 38.).
18. NOAA, Nat�onal Ocean�c and Atmospher�c Ad-m�n�strat�on, Space Weather Pred�ct�on Center, at www.swpc.noaa.gov/ftpdir/indices/SPE.txt (accessed: 18 December 2007).
19. HAARP, The H�gh Frequency Act�ve Auroral Research Program. Glossary of Solar and Geophysical Terms. Ava�lable at www.haarp.alaska.edu/haarp/glos.html (accessed: 4 September 2007).

13
20. IZMIRAN. Pushkov Inst�tute of Terrestr�al Mag-net�sm, Ionosphere and Rad�owave Propagat�on, Russ�an Academy of Sc�ences. L�st of ground level events w�th dates. Ava�lable at ftp://cr0.izmiran.rssi.ru/COSRAY!/FTP_GLE/DOC/GLEBASES.TXT (accessed: 20 February 2008).
21. Smart, D.F. and Shea, M.A. The local t�me depen-dence of the an�sotrop�c solar cosm�c ray flux. Advances in Space Research 32(1): 109-14 (2003).
22. Ferrar�, A., Pell�cc�on�, M., and V�llar�, R. A math-emat�cal model of a�rcraft for evaluat�ng the effects of sh�eld�ng structure on a�rcrew exposure. Radiation Protection Dosimetry 116 (1-4): 331-5 (2005).
23. Smart, D.F. and Shea, M.A. A rev�ew of geomag-net�c cutoff r�g�d�t�es for earth orb�t�ng spacecraft. Advances in Space Research 36: 2012-2020 (2005) (Reg�ons were selected based on boundar�es of con-stant L value, calculated us�ng Eq. 6, p. 2013.).
24. Pap�tashv�l�, N., Pap�tashv�l�, V., Belov, B., Popov V., and Moretto, T. Computer program GEO_CGM.FOR(EXE) vers�on 2001 (2001) (Used to convert from geomagnet�c to geocentr�c coord�nates. Geo-centr�c coord�nates d�ffer from geograph�c coord�-nates at a level of prec�s�on not v�s�ble �n the f�gure. See nssdc.gsfc.nasa.gov/space/cgm/ for deta�ls.).
25. NOAA, Nat�onal Ocean�c and Atmospher�c Ad-m�n�strat�on, Space Weather Pred�ct�on Cen-ter, at www.swpc.noaa.gov/NOAAscales/index.html#GeomagneticStorms (accessed: 6 March 2008).


A1
APPENDIx A
Sample Solar Radiation Alert System Messages The following six messages are samples of the messages that would have been issued during the solar proton event that started 16 January 2005, if the revised system had been operational. The samples begin with Test, Service Suspended, and Service Resumed messages that would have been issued on 19 January 2005. Dose rates on 20 January 2005 were high enough to warrant the sending the Alert message, which would have been followed by Alert Update messages until the conditions warranted the issuance of the Alert Cancelled message on 21 January 2005. Numbers in tables are reported to two significant digits.
1. Test
000WOXX50 KWNP 141506ALTPAV
Space Weather Message Code: ALTPAVSerial Number: 9989Issue Time 2005 Jan 19 1455 UTC
TEST ALERT: Message Delivery Test - Solar Radiation Alert
Comment:This is a message delivery test of the SOLAR RADIATION ALERTsystem. Test messages are sent each day at 1500 UTC unlessa SOLAR RADIATION ALERT is in progress.
Information on the Solar Radiation Alert system is atwww.faa.gov/education_research/research/med_humanfacs/aeromedical/radiobiology/solarradiation . . .CARI users:heliocentric potential was 583 in December 2004 . . .# Issued by the US DOT, FAA, Civil Aerospace Medical Institute# Send questions to [email protected]
2. Service Suspended
000WOXX50 KWNP 191938ALTPAV
Space Weather Message Code: ALTPAVSerial Number: 9990 Issue Time: 2005 Jan 19 1938 UTC
WARNING: GOES Satellite Data Unavailable
Comment:The Solar Radiation Alert system is currently inactive.

A2
GOES satellite data used in estimating radiation levels at flight altitudes are unavailable. The system will resume normal operation as soon as GOES data becomeavailable.
More information atwww.faa.gov/education_research/research/med_humanfacs/aeromedical/radiobiology/solarradiation
# Issued by the US DOT, FAA, Civil Aerospace Medical Institute# Send questions to [email protected]
3. Service Resumed
000WOXX50 KWNP 192008ALTPAV
Space Weather Message Code: ALTPAVSerial Number: 9991 Issue Time: 2005 Jan 19 2008 UTC
ATTENTION: Satellite Data Now Available
Comment:GOES satellite data are now available for estimating radiation levels at flight altitudes. SRAS service has resumed.
More information atwww.faa.gov/education_research/research/med_humanfacs/aeromedical/radiobiology/solarradiation
# Issued by the US DOT, FAA, Civil Aerospace Medical Institute# Send questions to [email protected]
4. Alert
000WOXX50 KWNP 200708ALTPAV
Space Weather Message Code: ALTPAVSerial Number: 9992 Issue Time: 2005 Jan 20 0705 UTC
ALERT: Solar Radiation Alert at Flight AltitudesConditions Began: 2005 Jan 0650 UTC
Comments:Satellite measurements indicate unusually high levels of ionizing radiation com-ing from the Sun. This may lead to excessive radiation doses to air travelers on trans-polar and other high-latitude flights. See map at www.faa.gov/education_research/research/med_humanfacs/aeromedical/radiobiology/solarradiation

A3
The following dose, dose rate, and risk estimates do notinclude any shielding by the Earth’s magnetic field.
Table 1. Effective dose rate estimates at selected altitudes based on the latest GOES solar proton flux measurements
Altitude Effective dose rate (ft) (microsieverts/hour)--------------------------------- 30,000 40 40,000 160 50,000 450 60,000 890 70,000 1300---------------------------------
Table 2. Effective doses for periods of selected length atselected altitudes* Effective Dose (microsieverts) -------------------------------------------------Altitude Previous Previous Previous Previous (ft) 1 hour 3 hours 5 hours 10 hours------------------------------------------------------------- 30,000 16 16 16 16 40,000 55 55 55 56 50,000 140 140 140 140 60,000 260 260 260 260 70,000 350 350 350 350-------------------------------------------------------------*Includes contributions made before the SRA was issued
Table 3. Estimated risk that the equivalent dose to a conceptus in an aircraft at the indicated altitude willexceed 500 microsieverts in a 10 hour exposure.
Altitude Risk (ft) (%) ------------------------ 40,000 20 50,000 85 60,000 98 ------------------------
To avoid possible excessive radiation exposure to the conceptus, a pregnant aircrew member or passenger may want toavoid flight altitudes of 40,000 ft or more in regions 1-3 shown on the aforementioned map.
# Issued by the US DOT, FAA, Civil Aerospace Medical Institute# Send questions to [email protected]

A4
5. Update Alert
000WOXX50 KWNP 200713ALTPAV Space Weather Message Code: ALTPAVSerial Number: 9993 Issue Time: 2005 Jan 20 0710 UTC
UPDATE ALERT: Update for Solar Radiation AlertAlert Conditions Began: 2005 Jan 20 0650 UTC
Comments:Satellite measurements indicate unusually high levels of ionizing radiation coming from the Sun. This may lead toexcessive radiation doses to air travelers on trans-polarand other high-latitude flights. See map at
www.faa.gov/education_research/research/med_humanfacs/aeromedical/radiobiology/solarradiation
The following dose, dose rate, and risk estimates do notinclude any shielding by the Earth’s magnetic field.
Table 1. Effective dose rate estimates at selected altitudes based on the latest GOES solar proton flux measurements
Altitude Effective dose rate (ft) (microsieverts/hour)--------------------------------- 30,000 51 40,000 200 50,000 590 60,000 1200 70,000 1800---------------------------------
Table 2. Effective doses for periods of selected length atselected altitudes* Effective Dose (microsieverts) ------------------------------------------------ Altitude Previous Previous Previous Previous (ft) 1 hour 3 hours 5 hours 10 hours----------------------------------------------------------- 30,000 20 20 20 20 40,000 72 72 72 72 50,000 190 190 190 190 60,000 350 350 350 360 70,000 500 500 500 500-----------------------------------------------------------*May include contributions made before the SRA was issued

A5
Table 3. Estimated risk that the equivalent dose to a conceptus in an aircraft at the indicated altitude willexceed 500 microsieverts in a 10 hour exposure.
Altitude Risk (ft) (%) ------------------------- 40,000 75 50,000 100 60,000 100 -------------------------
# Issued by the US DOT, FAA, Civil Aerospace Medical Institute# Send questions to [email protected]
6. Alert Cancelled
000WOXX50 KWNP 210138ALTPAV
Space Weather Message Code: ALTPAVSerial Number: 1008 Issue Time: 2005 Jan 21 0015 UTC
END ALERT: Solar radiation levels not excessiveAlert Conditions Began: 2005 Jan 20 0650Alert Conditions Ended: 2005 Jan 21 0010
Comment:The alert issued at 2005 Jan 20 0705 UTC has ended.The following 2 tables summarize peak effective dose rateestimates and peak effective dose estimates at polar latitudes:
Table 1. Peak effective dose rate estimates at selected altitudes based on the latest GOES solar proton flux measurements
Altitude Effective dose Rate (ft) (microsieverts/hour)---------------------------------- 30,000 130 40,000 460 50,000 1200 60,000 2000 70,000 2700----------------------------------

A6
Table 2. Peak effective doses for periods of selected lengthat selected altitudes* Effective Dose (microsieverts) ------------------------------------------------Altitude Peak Peak Peak Peak (ft) 1 hour 3 hours 5 hours 10 hours------------------------------------------------------------- 30,000 37 58 67 77 40,000 140 230 270 310 50,000 390 660 790 920 60,000 770 1300 1600 1900 70,000 1100 2000 2500 2900 -------------------------------------------------------------*May include contributions made before the SRA was issued
Information on the Solar Radiation Alert system is atwww.faa.gov/education_research/research/med_humanfacs/aeromedical/radiobiology/solarradiation
# Issued by the US DOT, FAA, Civil Aerospace Medical Institute# Send questions to [email protected]