solar power satellites: historical perspectives with a
TRANSCRIPT
American Institute of Aeronautics and Astronautics
1
Solar Power Satellites:
Historical Perspectives with a Look to the Future
Joseph R. Laracy1, Damien Bador2, Danielle Adams3, Annalisa Weigel4 Massachusetts Institute of Technology, Cambridge, Massachusetts, 02139
with
Richard Chambers, Daniel Kwon, David Proudfoot, Shen Qu, and Ted Shoepe
Since the late 1960s, there has been interest in the United States, and later in other nations, to capture solar energy in space and efficiently transmit it back to Earth. Starting with his seminal paper in 1968, Dr. Peter Glaser began architecting a prototype system that was further explored by the US Department of Energy in the Concept Development and Evaluation Program. This initial study showed that the project was very ambitious and fraught with technical, social, and economic uncertainties. Energy economics and the lack of a reliable, high frequency space launch capability brought most research to a halt in the 1990s. This paper proposes a rational technical strategy to refocus Solar Power Satellite (SPS) research. It suggests a 30 year timeline for program milestones and analyzes potential technical performance. Real options analysis is used to manage uncertainty and permits the exploration of possible futures that are dependent on launch costs and electricity market prices. We propose that the U.S. can make progress toward implementing a small scale SPS system within several decades if work is begun now on technology development and on addressing societal concerns.
Nomenclature Av % = Percentage of time where SPS produces energy when it is functioning Cbt $ = Cost of the beam transmitter Cc $ = Direct construction costs Ccs $ = Direct construction costs for the satellite Ccr $ = Direct construction costs for the rectenna Chr $ = Human costs of people building the rectenna Chs $ = Human costs of space workers Cmc $ = Cost of materials for the satellite Cmhs h = Number of man-hours needed to build the satellite Cmr $ = Cost of materials for the rectenna Cpm $/kg = Unit cost of payload transportation for materials Csi
$ / m 3 = Average unit cost for space infrastructure Cth $ = Cost of human transportation to the satellite position Ctm $ = Cost of materials transportation to the satellite (for the rectenna, transportation costs are supposed
1 Graduate Student – Complex Systems Research Laboratory, Engineering Systems Division, Bldg 33-407, AIAA Student Member. 2 Graduate Student – Lean Aerospace Initiative, Aeronautics/Astronautics & Engineering Systems Division, Bldg 41-205. 3 Graduate Student, Aeronautics/Astronautics & Technology and Policy Program, 28 Forest Street, Suite #2, Somerville, MA 02143, AIAA Student Member. 4 Assistant Professor, Aeronautics/Astronautics & Engineering Systems, Bldg 33-404, AIAA Member.
American Institute of Aeronautics and Astronautics
2
to be included in the materials costs) Cup
$ / m 2 = Unit cost of photovoltaic cells Cut $/person = Unit cost of human transportation to the satellite on a one-year timespan Cws $/h = Average hourly wages for space workers d = Downside factor of lattice analysis Dsi
kg / m 3 = Density of satellite infrastructure materials
Ef % = Efficiency of photovoltaic cells (percentage of energy received transformed in electricity) Fbt
year−1 = Frequency at which the beam transmitter should be changed
Mc $/year = Direct maintenance and operation costs per year Mcr $/year = Annual maintenance and operation costs for the rectenna Mcs $/year = Annual maintenance costs for the satellite Mhr $/year = Annual human costs for maintaining and operating the rectenna Mhs $/year = Annual human costs for maintaining the satellite Mmhs h/year = Annual number of man-hours needed to maintain the satellite Mmr $/year = Annual cost of materials needed to maintain the rectenna Mms $/year = Annual cost of materials needed to maintain the satellite Msw Persons/year = Number of space workers needed to maintain the satellite Nsw Persons = Number of space workers needed to build the satellite p = Probability that price will go up in the lattice analysis Pe $/kWh = Average electricity price per kilowatt-hour Pl % = Percentage of power lost in beam transmission to Earth (assumed to be the only significant cause
of power loss) Pts % = Percentage of the solar cells that need to be replaced each year on the satellite Qe kW = Electrical power produced by SPS R $/year = Annual revenue generated by SPS S
m 2 = Efficient surface of the solar array Se
kW / m 2 = Solar exposure (power received from the Sun per unit of surface of the solar array) SPS = Solar Power Satellites Sts
m 2 = Total surface of photovoltaic cells on the satellite T h = Number of hours per year where SPS is functional u = Upside factor of lattice analysis ve = Trend of the industrial electricity price vl = Trend of the costs of space operations Vsi
m 3 = Total volume of the satellite infrastructure (volume of photovoltaic cells and of the beam transmitter are considered negligible in front of the volume of the satellite infrastructure)
I. Introduction VER the last 30 years, there has been extensive study into utilizing satellites to capture solar energy in space and transmit it back to Earth. The many advantages of a solar power satellite (SPS) system are clear. Solar
energy can provide a significant amount of electricity to the world’s power grids, is renewable, and promises to be more environmentally friendly than fossil fuels. Twenty-two percent of incident solar energy is lost to a combination of reflection and absorption.1 The SPS concept relies on an efficient microwave beam that suffers from significantly less attenuation, approximately 7%. Further, access to solar power is not limited by geographic or political boundaries as are other valuable natural resources. Despite this, a number of technical, budgetary, societal, and political issues have prevented further exploration and development of the SPS concept. This paper investigates the 30 year evolution of the SPS in relation to these issues; it concludes with a proposed plan for working toward a functioning SPS system during the next 30 years. The first section presents data on the growing world energy needs. It identifies a significant gap in projected capital investments in energy and the level of funding required to meet world energy demands in 2020 and beyond. Additionally, this section identifies the merits of utilizing solar power, which range from reducing domestic reliance on foreign energy sources to leveraging more environmentally acceptable fuels. The second section presents lessons
O
American Institute of Aeronautics and Astronautics
3
learned over the last 30 years. Much attention is given to the architectural designs and concepts of the 1970s, the decade in which the SPS concept was conceived. The 1980s and 1990s noted a changed impetus for space power satellites and a diminished support for further concept development. The third section develops a quantitative model to conduct a Real Options analysis for SPS. The salient uncertainties of space launch cost and electricity prices are the basis for this analysis. Possible futures are explored with a binomial lattice model. The final section presents an architectural plan to realize an SPS system over the next three decades. A notional program roadmap with technical, political, and economic “swim lanes” is provided in order to clarify the linkage between these issues and articulate the requisite timing.
II. Drivers for Solar Power Satellites In 1973, the Organization of Petroleum Exporting Countries (OPEC) announced that it would no longer export
petroleum to countries that had supported Israel during the Yom Kippur war. On the international front, oil prices skyrocketed as a result of the decreased supply and triggered inflation, unemployment, and recession in Europe. U.S. daily imports were reduced by over 90% and “prices at the pump” nearly doubled, resulting in the creation of a national effort to ration fuel and to seek alternate sources of energy. Six years later, energy crisis lightning struck again during the Iranian revolution, renewing U.S. interest in developing alternate fuel sources and alleviating dependence upon foreign sources.2
The Western Energy crisis of 2001 illustrated that concerns over energy supply are not limited to international
providers. In the early 1970s, the state of California elected not to develop nuclear energy as a means of keeping pace with commercial and residential energy requirements. Rather, the state decided to procure energy from hydroelectric producers in the Pacific Northwest and from natural gas. In 2000, higher gas prices and a drought in the Northwest created a recipe for two years of rolling blackouts throughout California. Higher energy prices extended throughout the West Coast and led to a state-of-emergency declaration from Governor Gray Davis.3 The crisis showed the effects of not investing appropriate capital to keep pace with forecasted energy demand.
All three of these crises highlight reasons that support the development of alternate energy sources such as SPS. One reason is that domestic and world demand for energy is growing. Significant capital investment is required to alleviate projected capacity gaps. Also, the creation of more environmentally friendly energy sources is an obligation that all economies (emerging, transitional, and mature) share equally. A detailed discussion of each of these drivers follows next.
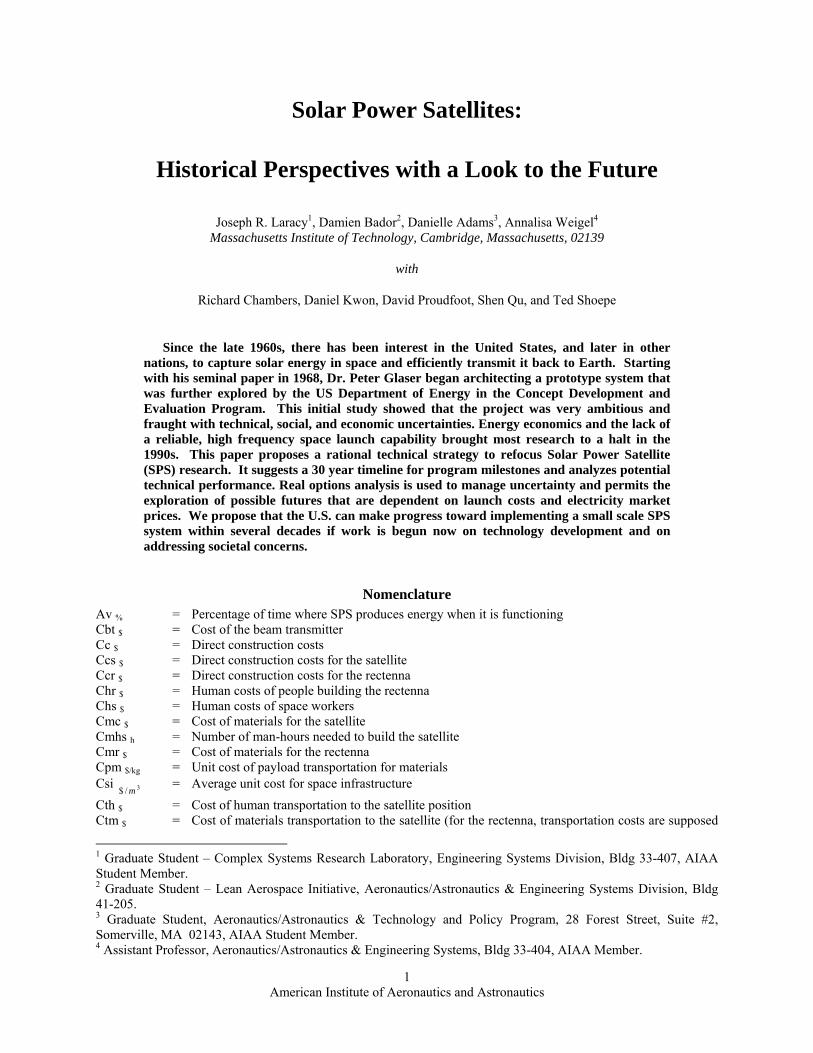
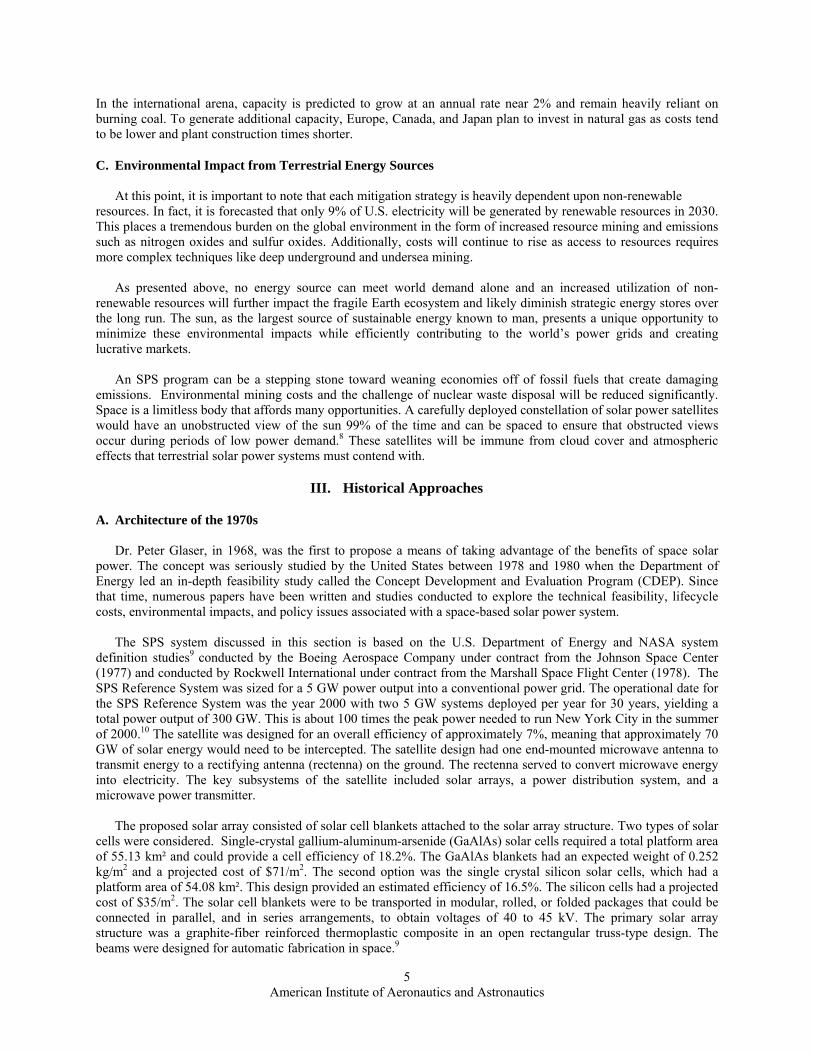
A. Growing Domestic and International Demand World energy demand continues to grow at a steady pace, placing significant pressure on all international energy suppliers. The Energy Information Administration projects annual commercial growth of nearly 2.5% through 2025 in the U.S. alone, as opposed to approximately 1.5% in the residential sector,4 revealing the increasing importance of commercial demand on total consumption. The growth of international demand, however, is more dramatic. Mature market economies have consistently represented the majority of world energy demands. However, within the next ten years, the energy requirements of emerging economies will surpass that of mature economies, ultimately composing nearly 50% of total world energy consumption by 2025. An incredible market opportunity is created for the mature economies as a result. If developed nations use their capital to develop new energy sources, they can position themselves to become sellers of energy. The figure below tells this story.
American Institute of Aeronautics and Astronautics
4
W o r ld M a r k e te d E n e rg y C o n s u m p t io n b y R e g io n , 1 9 7 0 -2 0 2 5 (q u a d r i l l io n B tu )
0
5 0
1 0 0
1 5 0
2 0 0
2 5 0
3 0 0
3 5 0
1 9 7 0 1 9 7 5 1 9 8 0 1 9 8 5 1 9 9 0 1 9 9 5 2 0 0 0 2 0 0 5 2 0 1 0 2 0 1 5 2 0 2 0 2 0 2 5
M a tu r e M a r k e t E c o n o m ie s
T r a n s it io n a l E c o n o m ie s
E m e r g in g E c o n o m ie s
In te rn a t io n a l E n e rg y O u t lo o k 2 0 0 5
4 6 %
4 2 %
1 2 %
S h a r e o fW o r ld T o ta l
H is to ry P ro je c t io n s
Figure 1. World Energy Consumption.5
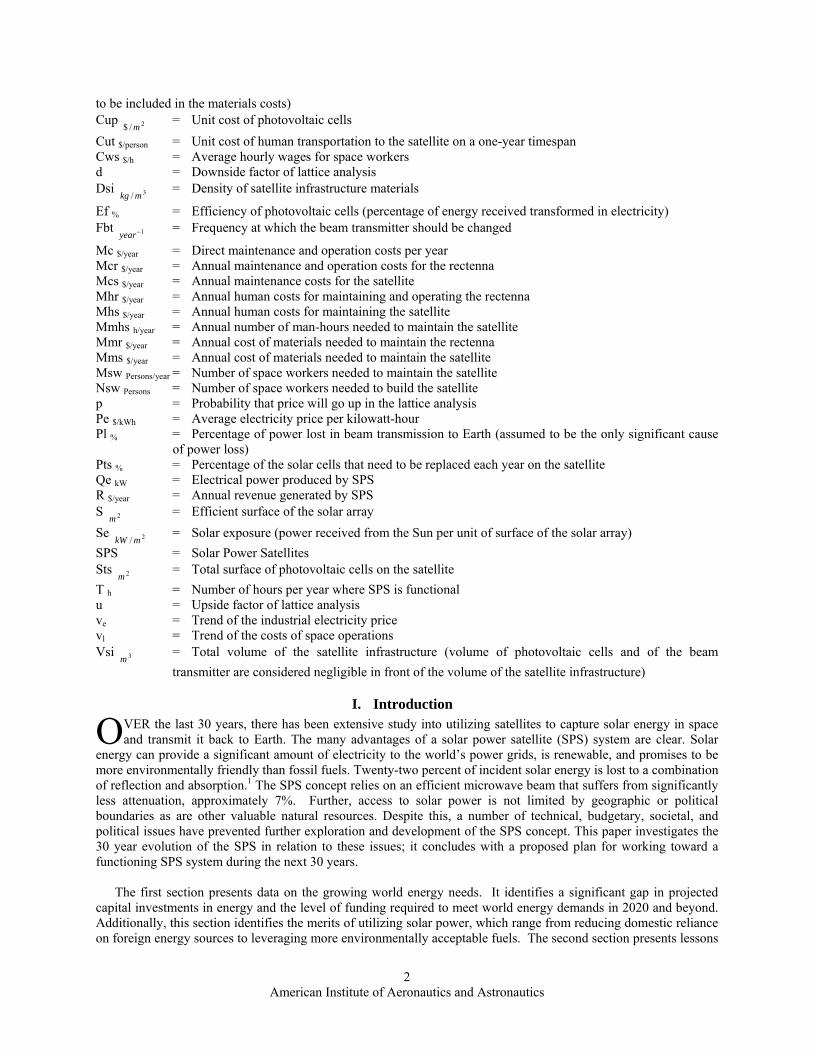
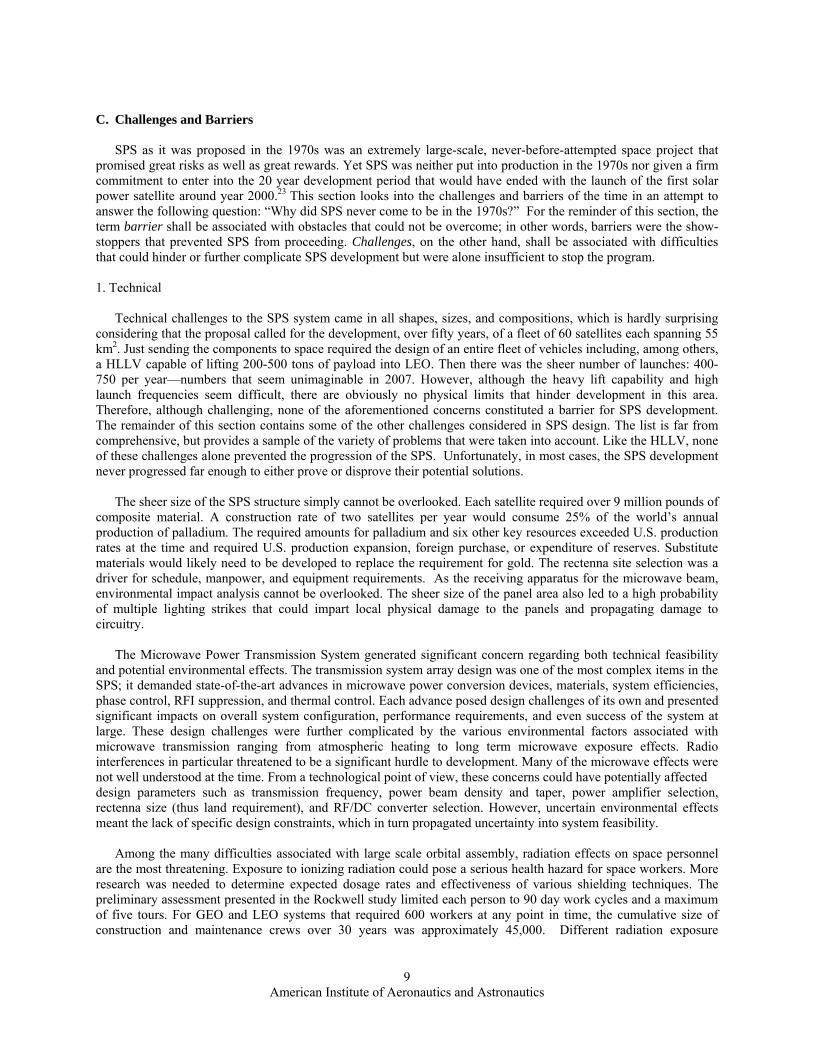
B. Capacity and Capital Investment To meet international energy demand through 2025, significant capital investment is required — preliminary estimates in 1997 speculated capital requirements upwards of $13 to $20 trillion. In the U.S., electricity generating capacity is forecasted to be nearly 25% short of national demands by 2025.6 This estimate assumes that all existing means of generating electricity, with the exception of fossil steam sources, remain constant and that current access to natural resources is preserved well into 2025. Current resolution strategies heavily leverage investment in new coal and natural gas processing capabilities (an additional 1,200 billion and 300 billion kWh respectively) in addition to marginal growth in nuclear and renewable sources of energy. The expected capacity breakdown is illustrated in the figure below.
0
2 0 0
4 0 0
6 0 0
8 0 0
1 , 0 0 0
1 , 2 0 0
1 , 4 0 0
2 0 0 5 2 0 1 0 2 0 1 5 2 0 2 0 2 0 2 5 2 0 3 0
U .S . E le c t r ic i t y G e n e r a t in g C a p a c i t y , in c lu d in gC o m b in e d H e a t a n d P o w e r , 2 0 0 4 -2 0 3 0 (g ig a w a t ts )
N e w R e n e w a b le
N e w N a t u r a l G a s
N e w C o a l
E x is t in g C o m b in e d -C y c le
N e e d e dC a p a c i ty
E x is t in g C o a l S te a m
E x is t in g O t h e r F o s s il S t e a m
E x is t in g C o m b u s t io n T u r b in e
E x is t in g N u c le a r E x is t in g P u m p e d S t o r a g e
E x is t in g R e n e w a b le
N e w N u c le a r
A n n u a l E n e r g y O u t lo o k 2 0 0 6 Figure 2. US Generating Capacity.7
American Institute of Aeronautics and Astronautics
5
In the international arena, capacity is predicted to grow at an annual rate near 2% and remain heavily reliant on burning coal. To generate additional capacity, Europe, Canada, and Japan plan to invest in natural gas as costs tend to be lower and plant construction times shorter.
C. Environmental Impact from Terrestrial Energy Sources At this point, it is important to note that each mitigation strategy is heavily dependent upon non-renewable resources. In fact, it is forecasted that only 9% of U.S. electricity will be generated by renewable resources in 2030. This places a tremendous burden on the global environment in the form of increased resource mining and emissions such as nitrogen oxides and sulfur oxides. Additionally, costs will continue to rise as access to resources requires more complex techniques like deep underground and undersea mining. As presented above, no energy source can meet world demand alone and an increased utilization of non-renewable resources will further impact the fragile Earth ecosystem and likely diminish strategic energy stores over the long run. The sun, as the largest source of sustainable energy known to man, presents a unique opportunity to minimize these environmental impacts while efficiently contributing to the world’s power grids and creating lucrative markets. An SPS program can be a stepping stone toward weaning economies off of fossil fuels that create damaging emissions. Environmental mining costs and the challenge of nuclear waste disposal will be reduced significantly. Space is a limitless body that affords many opportunities. A carefully deployed constellation of solar power satellites would have an unobstructed view of the sun 99% of the time and can be spaced to ensure that obstructed views occur during periods of low power demand.8 These satellites will be immune from cloud cover and atmospheric effects that terrestrial solar power systems must contend with.
III. Historical Approaches
A. Architecture of the 1970s
Dr. Peter Glaser, in 1968, was the first to propose a means of taking advantage of the benefits of space solar power. The concept was seriously studied by the United States between 1978 and 1980 when the Department of Energy led an in-depth feasibility study called the Concept Development and Evaluation Program (CDEP). Since that time, numerous papers have been written and studies conducted to explore the technical feasibility, lifecycle costs, environmental impacts, and policy issues associated with a space-based solar power system. The SPS system discussed in this section is based on the U.S. Department of Energy and NASA system definition studies9 conducted by the Boeing Aerospace Company under contract from the Johnson Space Center (1977) and conducted by Rockwell International under contract from the Marshall Space Flight Center (1978). The SPS Reference System was sized for a 5 GW power output into a conventional power grid. The operational date for the SPS Reference System was the year 2000 with two 5 GW systems deployed per year for 30 years, yielding a total power output of 300 GW. This is about 100 times the peak power needed to run New York City in the summer of 2000.10 The satellite was designed for an overall efficiency of approximately 7%, meaning that approximately 70 GW of solar energy would need to be intercepted. The satellite design had one end-mounted microwave antenna to transmit energy to a rectifying antenna (rectenna) on the ground. The rectenna served to convert microwave energy into electricity. The key subsystems of the satellite included solar arrays, a power distribution system, and a microwave power transmitter. The proposed solar array consisted of solar cell blankets attached to the solar array structure. Two types of solar cells were considered. Single-crystal gallium-aluminum-arsenide (GaAlAs) solar cells required a total platform area of 55.13 km² and could provide a cell efficiency of 18.2%. The GaAlAs blankets had an expected weight of 0.252 kg/m2 and a projected cost of $71/m2. The second option was the single crystal silicon solar cells, which had a platform area of 54.08 km². This design provided an estimated efficiency of 16.5%. The silicon cells had a projected cost of $35/m2. The solar cell blankets were to be transported in modular, rolled, or folded packages that could be connected in parallel, and in series arrangements, to obtain voltages of 40 to 45 kV. The primary solar array structure was a graphite-fiber reinforced thermoplastic composite in an open rectangular truss-type design. The beams were designed for automatic fabrication in space.9

American Institute of Aeronautics and Astronautics
6
The power distribution system on the satellite served several functions. First, it accumulated and controlled power from the solar cell panels. Next, it conditioned and regulated the quantity and quality of the electrical power generated for the microwave generator. The power distribution center also provided energy storage during eclipses and fault detection. The solar array was divided into power sectors that were each switchable and could be isolated from the main power bus. A battery storage system was available for about 12 MWh of electrical energy. Power transmission from the solar array sectors to the microwave antenna was conducted via a rotary joint using a slipring/brush assembly. Rotation of the antenna was achieved by a 350 m diameter turntable that was mechanically rotated. One of the challenges of the power distribution system was designing a rotary joint/slipring system with a 30 year life. In addition, spacecraft charging and high voltage interaction needed to be investigated. The satellite attitude control system design called for the use of argon ion thrusters. This baseline design for each solar cell option consisted of 64 thrusters for a lifetime of over 5000 hours. The propulsion system was serviceable on a yearly schedule. The power required for the thrusters was 34 MW.9
The satellite microwave power transmission system (MPTS) consisted of a 1 km diameter planar phased-array antenna. It had 7220 sub-arrays of approximately 10 m x 10 m with aluminum slotted waveguides as the radiating surface, an RF receiver, and phasing electronics to process a pilot beam phasing signal from the ground. A single coherent beam could be formed by phasing the sub-arrays. The resulting beam had approximately 88% of its energy within a 5 km radius perpendicular to the boresight with a beam width of 1.2 arc-minutes and was then focused on the center of the ground rectenna system. The MPTS operates at a frequency of 2.45 GHz and has an output power of 5 GW to the power grid with a 63% efficiency.9
On earth, the satellite hardware was complemented by a ground station with a rectenna. The purpose of the ground receiving antenna or rectenna was to receive and rectify the downlink power beam. The configuration had half-wave dipoles feeding Schottky barrier diodes with low pass filters to suppress harmonic generation and provide impedance matching. The rectenna was a series of serrated panels perpendicular to the incident beam and each panel had a steel mesh ground plane with 70-80% optical transparency. The total active panel area was 78.5 square kilometers. The panels were open-faced to reduce wind loading and to have a maximum leakage of 1% of the incident power. Radio Frequency Interference (RFI) effects were produced by the rectenna due to rescattered incident radiation and harmonic generation within the diodes. Some of the challenges of the MPTS were the design and development of the DC-RF converters and the transmitting antenna sub-arrays. In addition, the scale of the structures and construction on ground and in space needed to be investigated further.9
Construction of the satellite was to have occurred both in LEO and in GEO over a period of six months and with a crew size of 555 for the silicon design and 715 for the GaAlAs design. Therefore, a Heavy Lift Launch Vehicle (HLLV) was necessary to transport the system components from the ground to LEO. Other major items of the transportation system were the Cargo Orbit Transfer Vehicle (COTV), the Personnel Launch Vehicle (PLV), and the Personnel Orbit Transfer Vehicle (POTV). The Kennedy Space Center was selected as the launch site for each. Each vehicle was specialized for transport of either cargo or personnel and designed for potential operation in LEO or GEO. The HLLV, for instance, was meant to transport cargo to LEO; the PLV was intended to transport personnel to LEO. The COTV proposal required it to move cargo from LEO to GEO while the POTV moved personnel between the two orbits.9 The HLLV and PLV both shared characteristics with the shuttle. As blueprinted, they were both reusable, two-stage, vertical launch, horizontal landing, winged vehicles which traveled to LEO. The HLLV had a payload capacity of 424 metric tons using sixteen methane-oxygen engines on the first stage and fourteen standard SSME’s (Space Shuttle Main Engines) on the orbiter (second stage) resulting in a gross lift-off weight (GLOW) of 11,040 metric tons. Unlike the shuttle, the HLLV model called for an air breathing propulsion system on the booster for fly-back capability. The orbiter de-orbited using a glide-back maneuver. The PLV was intended for crew transportation and priority cargo. It was much larger than the current shuttle, with a 75 passenger capability. Also unlike the shuttle, the PLV draft included a winged propellant fly-back booster instead of solid rocket boosters and used four O2/CH4 engines which were also used on the HLLV.9
The POTV was meant to move personnel and priority cargo between LEO and GEO. The payload system was piloted by a two man crew flight control module and consisted of a 160 person passenger module and a re-supply module with 480 man-months of consumables. The down payload was identical except the re-supply module would

American Institute of Aeronautics and Astronautics
7
return to LEO empty. The COTV delivered cargo from the LEO staging area to GEO. The COTV fleet used electric propulsion Argon ion thrusters and was powered by solar arrays. For construction of GaAlAs arrays, the ion thruster was designed for an Isp of 13,000 seconds using an array of 259 thrusters allowing for a LEO-GEO trip time of 133 days, a total round trip time of 180 days. For construction of a silicon array, the thruster array consisted of 296 modules giving an Isp of 7,000 seconds resulting in a 160 day round trip time and two trips per year for each COTV.9
Some of the challenges of the space transportation system were the development of the electric propulsion technology for the thrusters and their controls, and the development of large liquid-fueled rocket engines for low cost, long-life HLLV operations. Logistically, the handling of rocket fluids and the technology for their transfer in orbit needed to be solved. One possible alternative to the HLLV that was considered was a single-stage-to-orbit booster.9
B. Operations of the 1970s The behavioral dynamics of the SPS system as envisioned in the late 1970s can be easily understood by taking a look at a typical day during the 12th year of commercial operations (assuming a 1970s development timeline). The major activities included operating and maintaining the current constellation, manufacturing a new SPS and receiving antenna, and constructing an Electric Cargo Orbital Transfer Vehicle (EOTV). Operations Control coordinated all the aforementioned functions. The Integrated Operations executive was assisted by three offices: Technical Staff, Plans and Schedules, and Program Logistics. Additionally, other units report to the Integrated Operations executive: Industrial Complex, Surface Transportation, Communications, Crew Systems, Launch and Recovery Site, Space Transportation, Space Traffic, LEO Base, SPS Operations, GEO Base, Rectenna/Grid Operations, and Space Construction.11
It is helpful to have an understanding of the personnel commitment required during this period. Approximately 500,000 people would have been involved in ground activities ranging from extracting raw materials from the Earth, to assembling satellite components, to driving trucks transporting propellant to the launch site. Even given a 1970s timeline, most of the resources would have been handled by existing industrial capacity with the exception of the photovoltaic cells and blankets. Transportation needs were accommodated by existing transport infrastructure. With the exception of the largest parts, most equipment was transported by train or truck. If most of the material were transported by train, however, only 30,000 rail cars would be required or 1.6% of the rail cars in the U.S. in 1978. During year twelve, two satellites, two rectennas, and eight EOTVs would have been under construction.11 Each rectenna site required 250 km2 of land and would take two years to build (12,600 man-months). Four sites would be under construction so that receiving stations could be activated on the same schedule as solar power satellites. This arrangement required 2100 workers. Cranes installed individual rectenna panels onto arches which were also installed by a crane into concrete footings.12 Four hundred HLLV launches were scheduled per year, with a schedule of 2/1/2/1/2 launches during a typical week. Boosters were turned around in 58 hours and launch pad operations required 34 hours/launch. Optimal operations occurred with a seven day/week schedule and two shifts per day. The one shift downtime allowed for making up lost time. The reference location for launch is Kennedy Space Center. Landing the HLLV required a runway 600 feet wide – twice the width of the standard STS runway - as well as other new support facilities. Other ground support, control tower, and navigational aids could be reused. The PLV could share STS ground facilities. Each PLV had a turnaround time of 10 days, with the majority of that time spent in booster processing operations. A command and control structure at Kennedy would provide coordination of SPS ground support operations, landing site maintainence, HLLV payload processing, HLLV processing, PLV processing, HLLV launch, propellant handling, and space crews.13 Given the 2/1/2/1/2 schedule, at least two HLLV docking stations were required, but three was preferable. Upon arrival, a cargo pallet handling machine removed the pallet from the HLLV bay and placed it on a transporter that would be driven to the area where the cargo was processed. HLLV crews were transported to the LEO base via a special tunnel adjacent to the docking facilities. Additionally, PLVs arrived at a rate of one per week, so one to two PLV docking stations were necessary. Two activities occurred at the LEO base: EOTV construction and cargo/personnel staging for trips to GEO, including fueling EOTVs, POTVs, and cargo tugs with propellant. During

American Institute of Aeronautics and Astronautics
8
the first four years of activity, 23 EOTVs would be deployed, including one spare. Thirty-three EOTV flights to GEO were required per year to build two satellites. Starting in the 10th year, EOTV replacements would be built at a rate of one EOTV every 45 days. Therefore, in year twelve, eight EOTVs would be constructed by a team of 35 workers from within a pressurized cabin on the LEO base.14 Two hundred and twenty-nine workers staffed the LEO base. One hundred and two people were required just for habitation operations. Eighty-four people conducted depot operations that would load POTVs with GEO personnel as well as EOTVs with cargo. It was assumed that each person would work ten-hour days, six days per week, during a 90 day duty cycle. A full replacement crew resided on Earth to cycle into space.15 One POTV flight was scheduled per week. An additional POTV was kept in reserve as a spare. POTVs docked nose-first into the LEO base and were controlled by a POTV crew. EOTVs did not dock with the LEO base. They performed station keeping 1-2 km away and were controlled remotely by the LEO operations crew. EOTVs were loaded/unloaded by cargo tugs, two of which were stationed at LEO, and two at GEO. Each EOTV carried twenty cargo pallets and two propellant pallets on its trip to GEO.16 The crew of the GEO base was responsible for constructing solar power satellites as well as maintaining the existing array. In addition to base central control functions such as base transportation, crew health and safety, and subsystem management, the GEO base coordinated a construction center, habitat control, flight vehicle maintenance, base maintenance, and crew training. From within pressurized cabins, 260 workers developed a solar array and antenna in parallel on a six-month schedule. Upon the completion of each satellite, the GEO base separated from the SPS and moved to the location of the next SPS. One hundred and eighty-five workers conducted habitation operations on the base. GEO personnel worked the same 90 day duty cycle.17 GEO personnel utilized three modes of transportation to move within and around the base. First, crew could use a manned remote work station (MRWS) flyer. Each MRWS carried two people and cargo. Second, for close proximity tasks that required precise workmanship, crews could use extravehicular mobility units (EMU) with manned maneuvering units (MMU) to permit space walks. Finally, a rail system would transport personnel and equipment within the base.18 POTVs docked with the GEO base directly and up to four personnel transports could be docked at once. Meanwhile, EOTVs were unloaded using cargo tugs similar to the LEO base and arrived at a rate of one every thirteen days. They would bring pallets containing 4000 MT of cargo and typically return 200 MT back to LEO. Two tugs facilitated the loading/unloading of up to twenty cargo pallets.19 During a 90 day period in maintenance mode, 166 workers visited twenty satellites taking each one out of service for 3.5 days. Crews used a mobile crew habitat which would have been transported to the satellite under repair along with equipment and replacement components. All degraded components were replaced and returned to the GEO base for refurbishment.20 The SPS system was conceived to be part of an integrated utility power pool. Therefore, the pool operators controlled each SPS/ground station assigned to it as power demands dictated. The Rectenna Control Center had the authority to vary the SPS power output as well as shutdown a SPS in an emergency. Each center received telemetry from a SPS containing power level statistics relevant to operations. A utility power pool used the SPS system to satisfy base load with terrestrial power sources brought on and off line as needed to handle transitory demand. One hundred and ten operations workers and 225 maintenance workers staffed each ground station. In an ideal world, a power system would be composed of a constant source satisfying a constant load. In reality, a system exhibits highly dynamic characteristics. Only satellite maintenance and an eclipse could yield a total power outage. Happily, these variations would occur on predictable schedules and only result in a 2.7% energy loss per year. Because re-radiation from the rectenna could have adverse effects, changes to input power to the rectenna motivated by load dynamics must be accomplished by controlling the power output from the SPS. Reducing beam voltage was easy to accomplish, but drops of greater than 20% would reduce efficiency and lifetime. Quadratic phase error and randomized antenna phases could drop the power 50-100% but would spread the microwave radiation over a footprint larger than the rectenna. Tilting the antenna phase would reduce the power up to 100% by transmitting the RF radiation away from the Earth. This was probably the ideal power management technique as it required little energy and safely reduced the load to the point of shutdown. Tilting the actual antenna accomplishes the same effect but at a high energy cost.21 Finally, the central SPS Control Center provided most of the systems control, monitoring, station keeping control, and fault management. It also coordinated satellite-rectenna pair maintenance. Two hundred and forty people would have staffed this center.22
American Institute of Aeronautics and Astronautics
9
C. Challenges and Barriers SPS as it was proposed in the 1970s was an extremely large-scale, never-before-attempted space project that promised great risks as well as great rewards. Yet SPS was neither put into production in the 1970s nor given a firm commitment to enter into the 20 year development period that would have ended with the launch of the first solar power satellite around year 2000.23 This section looks into the challenges and barriers of the time in an attempt to answer the following question: “Why did SPS never come to be in the 1970s?” For the reminder of this section, the term barrier shall be associated with obstacles that could not be overcome; in other words, barriers were the show-stoppers that prevented SPS from proceeding. Challenges, on the other hand, shall be associated with difficulties that could hinder or further complicate SPS development but were alone insufficient to stop the program. 1. Technical Technical challenges to the SPS system came in all shapes, sizes, and compositions, which is hardly surprising considering that the proposal called for the development, over fifty years, of a fleet of 60 satellites each spanning 55 km2. Just sending the components to space required the design of an entire fleet of vehicles including, among others, a HLLV capable of lifting 200-500 tons of payload into LEO. Then there was the sheer number of launches: 400-750 per year—numbers that seem unimaginable in 2007. However, although the heavy lift capability and high launch frequencies seem difficult, there are obviously no physical limits that hinder development in this area. Therefore, although challenging, none of the aforementioned concerns constituted a barrier for SPS development. The remainder of this section contains some of the other challenges considered in SPS design. The list is far from comprehensive, but provides a sample of the variety of problems that were taken into account. Like the HLLV, none of these challenges alone prevented the progression of the SPS. Unfortunately, in most cases, the SPS development never progressed far enough to either prove or disprove their potential solutions. The sheer size of the SPS structure simply cannot be overlooked. Each satellite required over 9 million pounds of composite material. A construction rate of two satellites per year would consume 25% of the world’s annual production of palladium. The required amounts for palladium and six other key resources exceeded U.S. production rates at the time and required U.S. production expansion, foreign purchase, or expenditure of reserves. Substitute materials would likely need to be developed to replace the requirement for gold. The rectenna site selection was a driver for schedule, manpower, and equipment requirements. As the receiving apparatus for the microwave beam, environmental impact analysis cannot be overlooked. The sheer size of the panel area also led to a high probability of multiple lighting strikes that could impart local physical damage to the panels and propagating damage to circuitry. The Microwave Power Transmission System generated significant concern regarding both technical feasibility and potential environmental effects. The transmission system array design was one of the most complex items in the SPS; it demanded state-of-the-art advances in microwave power conversion devices, materials, system efficiencies, phase control, RFI suppression, and thermal control. Each advance posed design challenges of its own and presented significant impacts on overall system configuration, performance requirements, and even success of the system at large. These design challenges were further complicated by the various environmental factors associated with microwave transmission ranging from atmospheric heating to long term microwave exposure effects. Radio interferences in particular threatened to be a significant hurdle to development. Many of the microwave effects were not well understood at the time. From a technological point of view, these concerns could have potentially affected design parameters such as transmission frequency, power beam density and taper, power amplifier selection, rectenna size (thus land requirement), and RF/DC converter selection. However, uncertain environmental effects meant the lack of specific design constraints, which in turn propagated uncertainty into system feasibility. Among the many difficulties associated with large scale orbital assembly, radiation effects on space personnel are the most threatening. Exposure to ionizing radiation could pose a serious health hazard for space workers. More research was needed to determine expected dosage rates and effectiveness of various shielding techniques. The preliminary assessment presented in the Rockwell study limited each person to 90 day work cycles and a maximum of five tours. For GEO and LEO systems that required 600 workers at any point in time, the cumulative size of construction and maintenance crews over 30 years was approximately 45,000. Different radiation exposure

American Institute of Aeronautics and Astronautics
10
constraints could greatly affect parameters such as duration of stay, total number of personnel required, and space suit and system design. Another source of uncertainty was the effect of space plasma on properties of materials such as solar cells, solar array interconnects, reflector films, conductor/insulations and overall high voltage power systems performance. These have led to studies in solar cell selection, solar cell annealing technique, reflector materials, and power distribution voltage level. However, the actual effects that 30 years in space could have on SPS were unknown. 2. Societal Many of the roadblocks that threatened the SPS project had social, environmental, or political components. Examples include the need to establish frequency allocations through international agreement or the need to define safe microwave exposure standards. Some potential problems associated with the SPS were identified but were not considered to be more serious than those caused by conventional energy systems. An example was the waste generated by the manufacturing process for SPS or the occupational hazards for terrestrial SPS workers. The discussion below highlights risks that were unique to SPS and that had social implications. The SPS system produced in the CDEP study transmitted radio frequency power at approximately 2.45 GHz to large receiving antennas on Earth. The Environmental Assessment of the CDEP could not conclusively show the absence of adverse effects. There was sufficient doubt to recommend that further study be pursued. Overall, however, there was not serious concern about biological effects due to microwave exposure. Three different groups of people were considered: 1) the general public in the vicinity of the receiving antenna, 2) the workers at the terrestrial SPS power plant, and 3) SPS workers in space. At the time, the United States and the U.S.S.R had very different standards for maximum exposure to radio frequency radiation. In the U.S., no national standard existed but the Occupational Safety and Health Administration had suggested a maximum exposure of 10 mW/cm² over 6 minutes. This was for a frequency from 10 Megahertz to 100 Gigahertz. Meanwhile, the U.S.S.R had a much stricter policy, which was also considered. This stated that in the range from 300 Megahertz to 300 Gigahertz, only .01 mW/cm² should be received; for the case of the general public near a receiving antenna, the ambient radiation should be on the order of 10-4 mW/cm2. There was concern that those living and working near the receiving antenna would receive levels higher than the U.S.S.R standard and that the repercussions of this were not known. Also unknown was the danger to a worker in space or on Earth accidentally exposed to a very concentrated amount of radiation.24 Large areas of land were required for both the SPS receiving antenna and for the launch sites. In his 1977 SPS overview, Peter Glaser estimated that “the land required for the receiving antenna site…could be limited to about 270 km2.”25 The CDEP study estimated a need for 60 receiving antenna sites, each using a 10 by 13 km ellipse of land.26 These were – and still are – large amounts of land to be used for a power station. Glaser however claimed that “the land could be developed to productive uses because only about one-third of it would be covered by the receiving antenna, which is a lightweight structure 80 percent transparent to sunlight and unobtrusive to rain.”27 Given that, the difficulty became finding creative ways to use the land for a dual purpose. The CDEP Land Use study noted that part of the challenge was not just the amount of land, but the suitability of the land. The location of the receiving antenna must consider both land area and proximity to high power demand sites. Furthermore, the position of satellite power stations could be a source of public unrest, either due to the spoiling of land or due to high power industries moving in order to be close to the station.28 Because of the large number of launches required for SPS construction, many new launch sites were also necessary. This requirement impacted land use for the SPS, as those who lived near sites chosen for new launch facilities needed to decide how to respond to the noise associated with launches.29 Atmospheric side effects were a large concern. The most sensitive issues dealt with the ionosphere, a layer between 50 and 400 km from the Earth’s surface. Concerns arose regarding the ability of the microwave power beam from the SPS to heat the ionosphere sufficiently to alter its electron density. This would harm communication systems that depend on dense electron regions. This could also lead to undesirable scattering in the microwave beam path. The rocket effluents from the SPS launches could also interact with the ionosphere to reduce electron density. Another fear was that weather could be altered in the troposphere due to the exhaust of frequent launches. This is an area of large uncertainty.30
American Institute of Aeronautics and Astronautics
11
A major concern about the SPS design was its potential for interference with other electronic systems. As mentioned in the CDEP Final Program review, “Electromagnetic systems likely to experience SPS interference would include military systems, public communications, radar, aircraft communications, public utility and transportation system communications, other satellites, and radio and optical astronomy.”31 Such a long and varied list clearly puts this issue into the realm of a serious social problem. In particular, military systems close to the transmitter or receiver would be threatened. Also, radio and optical astronomy would be very difficult with an SPS system in place. For radio astronomy, Earth based systems close to receiving antenna sites would be affected by interference. Meanwhile, optical astronomy would be limited because the SPS would create light pollution.32 In the 1970s, much less was known about the effects of long duration space flight, though CDEP concluded that this was not a major concern. There was concern about the risks faced by SPS workers in space. Launch and space travel risks were noted. There was also concern about the dangers of radiation in space and of accidents that could happen during construction. This is also an area of great uncertainty.33 There were three key areas identified in the 1970s in which international agreements were necessary in order to move forward with SPS. In these areas, the United States was unable to act independently or to make choices in a vacuum. The first area was frequency allocations. This was considered a major hurdle, since even at early stages, the desirable frequencies seemed to be already taken. The second issue was orbit allocation. The SPS was conceived of as operating in a geostationary orbit, the prime orbital real estate. Third, international standards for microwave power levels that could be generated by machines and received by humans needed to be agreed upon. Glaser expected that these decisions would require multilateral agreements or treaties.34 Another international issue regarded potential military uses of an SPS. The SPS architecture could be viewed as a threat by other nations because of its potential to carry weapons, transport military cargo or personnel, etc. The SPS was also vulnerable to attack on Earth and in space. It was feared that such a large and overwhelming system could invite hostilities.35 3. Economic Unlike the various challenging but uncertain technical and social factors, the economic barriers blocking SPS’s entry into the energy market were very real and difficult to circumvent. The following subsections consider the inherent economic difficulties with SPS development and how the SPS system compares to other energy systems. These factors are relevant to both commercial considerations of whether a company should invest in SPS and to political considerations on whether the government should fund SPS development. High Investment: The Rockwell study estimated an initial required investment of $84 billion (1978 dollars) for development up to and including the construction of the first satellite with a cost of $14 billion dollars per satellite thereafter. This does not include a maintenance cost of $0.65 billion dollars per satellite per year.36 Long Lead Time: Most studies projected a twenty year development period prior to the deployment of the first satellite and another 30 years before the completion of the full fleet of 60 satellites. Thus investors could not expect a prompt return on investment and profit. High Project Risk: No space project resembling the scale of SPS had ever been attempted. There was little infrastructure in place and a large portion of the technology requirements were still pending development. This fact, coupled with the high technological and societal uncertainties within the system and the high risk factors associated with any space project, made an SPS system a very insecure investment choice. Even excluding the event of a catastrophic loss, one had to still consider the possibility of periodically losing a payload, which seemed likely given the frequency of launch. Furthermore, space projects had been known to run over budget and over time with both overruns worsening as the scale of the project grew. Uncertain Energy Demands: The acceptance or rejection of the SPS was also highly dependent on the demand for energy in the future. However, 1970’s projections of future energy requirements varied greatly. The lower projection levels could easily be sustained by hydropower, coal, and nuclear generators; upper projections, conversely, demanded the incorporation of several new technologies. Even if energy demand projections did exceed the capability of conventional generation techniques, the SPS system still needed to compete with other renewable/inexhaustible energy sources such as hydropower, wind, terrestrial solar, ocean thermal energy conversion, fusion, fission breeder, and geothermal energy sources.37

American Institute of Aeronautics and Astronautics
12
Although SPS promised higher energy production than alternative energy systems, it was characterized by lower experience, higher uncertainty, and higher cost. Therefore, although CDEP concluded that, “within the assumptions, uncertainties, and scope of the assessment, no comparative issues appear as insurmountable barriers to the SPS concept,” these results also did not provide overwhelming incentive to choose SPS over the other concepts.38 Initial development costs needed to be lowered, and this would only be possible given dramatic improvements over the baseline studies. However, such advances were not guaranteed. The high cost and risk nature of SPS, the uncertainty in future energy demand, and the various other competing technologies constituted an economic barrier that was virtually insurmountable at the time. 4. Overall Assessment (1970’s) SPS was nothing if not grand. Unfortunately though, along with its grand design and grand potential energy return came a grand list of problems. Table 1 lists some of the technical, societal, economical, and political challenges and barriers faced by SPS. The rows “technical,” “society/policy,” “international agreements,” and “political environment” are section headers and not assessed as a whole. The columns track the status of these obstacles through different periods in time—past and future. The table as presented here contains only information pertaining to the 1970s. Other columns will be filled in later sections. 1970 1990/Current 2015 2025 Technical - Lift Capacity - Deployment/Lift Tempo - Space personnel deployment and space habitation
- Materials availability and aging - Rectenna site selection (footprint, etc) - Microwave power transmission technology - Microwave effects on humans—terrestrial - Radiation effects on humans in space - Autonomous Assembly - Large structure assembly in space Society/Policy - Atmospheric effects (pollution, etc) - Microwave Ionspheric heating effects - RFI communication issues (telecommunications, radio)
- Radio Astronomy - International agreements -- Frequency allocation -- GEO Orbit allocations -- Microwave power transmission levels Economic/Cost Political Environment - Domestic National Priority - International Political Environment Summary Assessment
Table 1. SPS Barriers and Evolution: 1970s.
Barrier Degree of Difficulty: Low—capability exists or issue is resolved (workaround in place) Medium—candidate resolution identified and/or in study

American Institute of Aeronautics and Astronautics
13
High—significant concern, resolution unidentified and/or highly improbable There were clearly many technical questions to answer. Although no solution seemed fundamentally impossible, they were certainly challenging. Amongst them, an HLLV had to be developed with the ability to launch several hundred times a year. In hindsight, this presented a substantial barrier. However, the 1970s followed the age of Apollo when space technology raced forward by leaps and bounds; there was no telling how further developments may have proceeded given the proper incentives. Therefore, within the context of the period, this list of technical problems was challenging but certainly not an insurmountable barrier. In the societal realm, it was clear that many classes of stakeholders would have to be convinced in order to move forward. Employees and citizens living near a satellite solar power station would need to feel safe with the technology and be certain that the system was not damaging their neighborhood. International agreements would be required to allow unthreatened operation of the system in space. The economic analysis made it clear that, given the high cost and high risk associated with SPS, no private entities could bankroll such a scheme alone. It was even questionable whether a government could afford or would even want to fund such a system considering the uncertain energy demand projection and the viability of alternative energy options.
D. Evolution during the 1980s and 1990s The transition from the oil crises of the 1970s into the more energy rich periods of the 1980s and 1990s changed the impetus for solar power satellites, diminishing reasons for development in many cases while laying the foundations for the mega-project in others. This section reviews some of the development of SPS since the 1970s. The 1980s brought substantive research on SPS in the United States to a close. The Office of Technology Assessment reviewed the NASA and DOE studies and found that the technical and economic aspects of the projects simply did not have a level of maturity warranting further project support. 39 Estimates for the world energy profile did not make SPS appear as a viable option, especially considering its considerable initial costs. As early as 1984, the country began to notice a reduction in oil prices, easing fears of ever-increasing energy problems. The Department of Energy focused on increasing U.S. efficiency and security. In fact, as Americans became more efficient with their energy usage, the nation began spending relatively less on electrical production per unit of GDP. These changes obviously did not support those arguing for the development of an expensive satellite power program. Growing energy demands and the declaration of crises during the 1990s and 2000s likely have contributed to the return of SPS to scientific thought in the United States. John C. Mankins, as Manager of the Advanced Concepts Office at NASA headquarters, in his summary of the 1997 NASA Fresh Look Study40 on SPS, recounted concerns of increasing global demand for electricity. However, this factor does not conclusively argue for the development of the SPS. Rather, the system must be shown to be competitive with terrestrial power sources both in terms of initial development costs and return on investment. The SPS project did not change in a revolutionary way during the 1980s and the 1990s. Although many concerns were addressed during this period, major problems remained to be solved, especially in the domain of launch vehicles. The delays in the successive American space programs severely hurt SPS. Even if technological progress in related fields (such as semiconductors or photovoltaic transformation) improved the financial perspectives of SPS, the initial investment was still so huge that all potential investors ultimately avoided commitments. Market drivers and environmental perspectives were also not as favorable as previously projected, therefore giving even less incentive to make SPS a national priority. Table 2 summarizes the evolution of SPS barriers and challenges up to the current time.

American Institute of Aeronautics and Astronautics
14
1970 1990/Current 2015 2025 Technical - Lift Capacity - Deployment/Lift Tempo - Space personnel deployment and space habitation - Materials availability and aging - Rectenna site selection (footprint, etc) - Microwave power transmission technology - Microwave effects on humans—terrestrial - Radiation effects on humans in space - Autonomous Assembly - Large structure assembly in space Society/Policy - Atmospheric effects (pollution, etc) - Microwave Ionspheric heating effects - RFI communication issues (telecommunications, radio)
- Radio Astronomy - International agreements -- Frequency allocation -- GEO Orbit allocations -- Microwave power transmission levels Economic/Cost Political Environment - Domestic National Priority - International Political Environment Summary Assessment
Table 2. SPS Barriers and Evolution: Current State.
Barrier Degree of Difficulty: Low—capability exists or issue is resolved (workaround in place) Medium—candidate resolution identified and/or in study High—significant concern, resolution unidentified and/or highly improbable
IV. Lattice Model Analysis Section III of this paper provides a historical perspective about the technical vision and societal elements that have been a part of the SPS story since the 1970’s. This section suggests a new way to analyze SPS that provides insight for the future. Much of the initial design work on SPS was hindered by the inherent uncertainty in the project. A binomial lattice model is used to quantitatively explore uncertainties. Several key factors of the SPS design are difficult to integrate into a traditional uncertainty analysis, as they display non-linear behavior and depend on elements that are not easily quantified. In particular in the study of the SPS system, one is concerned with the evolution of the electricity market and space launch costs. One option for exploring these uncertainties is the traditional financial forecast models, which take point estimates of the evolution of unknown variables to measure the profitability of a project. Another option uses decision trees, but this is not feasible here, as the number of possibilities increases geometrically at each level of the tree. We propose using a binomial lattice model analysis, which assumes that an evolutionary process is stationary over time. Each possible future state is a multiple of the current state (e.g. State 1 u[State 1] or d[State 1], with u and d representing by convention the up and down future states). It is also recombinatorial, that is, u[d[State 1]] = d[u[State 1]].41,42 As a consequence, the number of future states increases linearly instead of geometrically, thereby making the analysis
American Institute of Aeronautics and Astronautics
15
tractable. The binomial lattice model is limited in that it does not permit an evolution from positive to negative numbers and it assumes path independence. Thus, it does not matter how the system evolves to state α, only that it is currently in state α. However, these constraints do not limit the applicability of the model to this analysis as it is well suited for handling such situations such as the valuation of an asset. The lattice analysis is very valuable because it allows one to determine efficiently whether a certain project is financially robust, and determines a set of rules to maximize profit in the face of a non-optimal external outcome. As mentioned earlier, the two salient uncertainties are the cost of space launches with operations and the market price of electricity. As these uncertainties are fundamentally independent, the analysis does not suffer from any loss of precision by modeling them separately. An average value is assumed for one of the variables when the other is varied. Historical data allows one to establish robust hypotheses concerning the trends and variance of both the cost of space launches and the price of electricity. The analysis assumes that the cost of space operations is proportional to the cost of space launches. Other major independent variables are the rectenna building costs and its operation costs, these are fixed. Major dependent variables are the dimension of the solar array and the efficiency of energy conversion. In order to explore the profitability of a solar power satellite constellation, one must first consider the engineering economics associated with one SPS. The SPS yearly revenue, R, expressed in constant 2005 dollars can be computed as the product of the electricity produced by SPS, the percentage of time where SPS produces energy when it is functioning, the number of hours per year the satellite is functional, and the price of electricity per kilowatt hour. The construction costs, Cc, are the sum of the construction costs of the satellite and of the rectenna, with the satellite construction costs being the sum of the space transportation costs for both the materials and the workers, the worker-related costs and the material costs. Similarly, the yearly maintenance costs, Mc, can be divided between rectenna and satellite, with the satellite maintenance costs being the sum of the costs of the materials needed to maintain the satellite and the costs related to the people maintaining the satellite. Equation (1) models the annual revenue; Eq. (2) shows the construction costs; and Eq. (3) gives the yearly maintenance costs:
PeTAvPlSEfSePeTAvQeR ×××−×××=×××= )1( (1)
Cc = Ccs + Ccr = (Cmc + Ctm + Chs + Cth) + (Cmr + Chs) (2)
Mc = Mcs + Mcr = (Mms + Mhs) + (Mmr + Mhr) (3)
Eq. (2) and Eq. (3) can be further detailed to uncover the details of the costs of SPS. Equation (4) models the satellite construction costs (Ccs), and Eq. (5) the satellite yearly maintenance costs (Mcs):
Ccs = (Sts × Cup + Vsi × Csi + Cbt) + (Vsi × Dsi × Cpm) + (Cws × Cmhs) + (Nsw × Cut) (4)
Mcs = (Sts × Pts × Cup + Fbt × Cbt) + (Msw × Cut + Mmhs × Cws) (5)
The baseline design features an architecture based on the 1970s SPS proposal, adapted to current technologies. It is an inflexible system, sized to optimize economies of scale in the hypothesis of a low-to-medium launching cost to geostationary orbit and of a medium-to-high price of electricity. The investment costs are amortized over twenty years at a 7% annual rate. We will assume that SPS is functional throughout the year, and set T = 8330 hr.
The size of the rectenna is assumed to be constant throughout the useful life of the system. Table 3 contains a
list of the fixed variables of the model, and Table 4 lists the assumptions concerning the controlled variables of the model, which are a function of the size of the satellite. S, represents its surface, Vsi, the volume of its structure, Cmhs, the number of hours needed to assemble it in orbit, and Nsw, the number of space workers that would be required. These controlled variables are not intended to represent an in-depth study of the size of the satellite or of the manpower needed to build it but are reasonable approximations based on the original Glaser proposal.
American Institute of Aeronautics and Astronautics
16
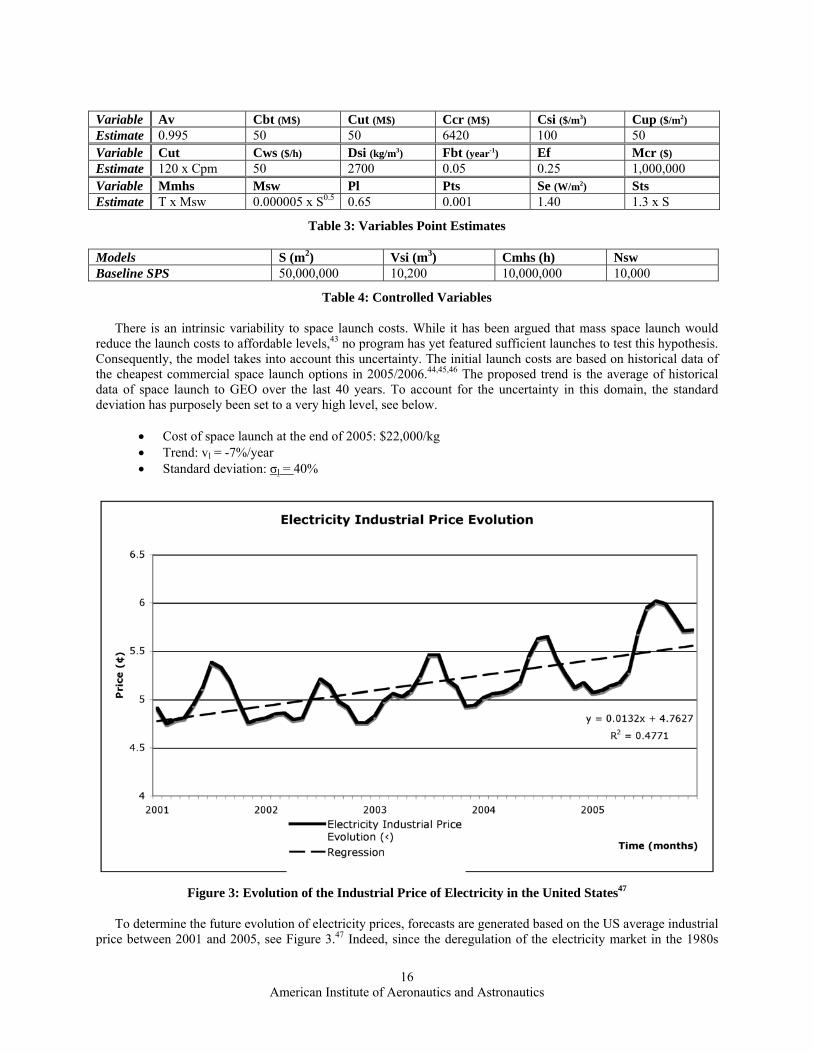
Variable Av Cbt (M$) Cut (M$) Ccr (M$) Csi ($/m3) Cup ($/m2) Estimate 0.995 50 50 6420 100 50 Variable Cut Cws ($/h) Dsi (kg/m3) Fbt (year-1) Ef Mcr ($) Estimate 120 x Cpm 50 2700 0.05 0.25 1,000,000 Variable Mmhs Msw Pl Pts Se (W/m2) Sts Estimate T x Msw 0.000005 x S0.5 0.65 0.001 1.40 1.3 x S
Table 3: Variables Point Estimates
Models S (m2) Vsi (m3) Cmhs (h) Nsw Baseline SPS 50,000,000 10,200 10,000,000 10,000
Table 4: Controlled Variables
There is an intrinsic variability to space launch costs. While it has been argued that mass space launch would reduce the launch costs to affordable levels,43 no program has yet featured sufficient launches to test this hypothesis. Consequently, the model takes into account this uncertainty. The initial launch costs are based on historical data of the cheapest commercial space launch options in 2005/2006.44,45,46 The proposed trend is the average of historical data of space launch to GEO over the last 40 years. To account for the uncertainty in this domain, the standard deviation has purposely been set to a very high level, see below.
• Cost of space launch at the end of 2005: $22,000/kg • Trend: vl = -7%/year • Standard deviation: σl = 40%
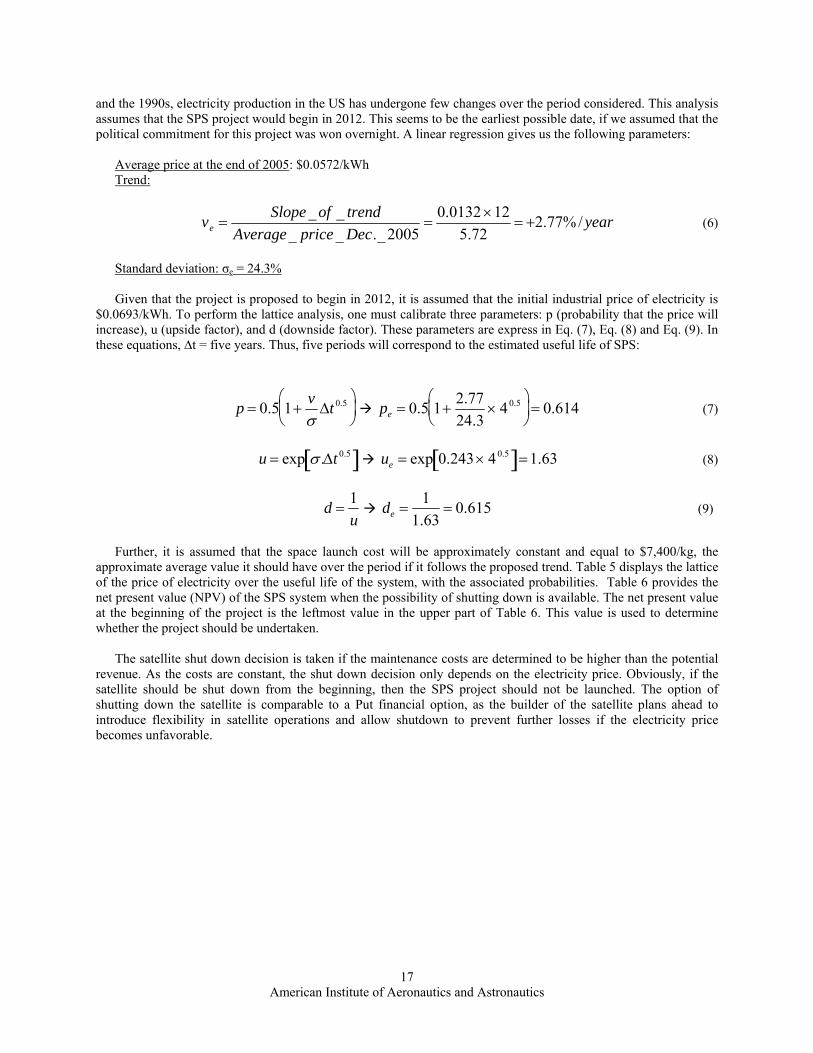
Figure 3: Evolution of the Industrial Price of Electricity in the United States47
To determine the future evolution of electricity prices, forecasts are generated based on the US average industrial price between 2001 and 2005, see Figure 3.47 Indeed, since the deregulation of the electricity market in the 1980s
American Institute of Aeronautics and Astronautics
17
and the 1990s, electricity production in the US has undergone few changes over the period considered. This analysis assumes that the SPS project would begin in 2012. This seems to be the earliest possible date, if we assumed that the political commitment for this project was won overnight. A linear regression gives us the following parameters:
Average price at the end of 2005: $0.0572/kWh Trend:
ve =Slope _of _ trend
Average _ price _ Dec._2005=
0.0132 ×125.72
= +2.77% / year (6)
Standard deviation: σe = 24.3% Given that the project is proposed to begin in 2012, it is assumed that the initial industrial price of electricity is
$0.0693/kWh. To perform the lattice analysis, one must calibrate three parameters: p (probability that the price will increase), u (upside factor), and d (downside factor). These parameters are express in Eq. (7), Eq. (8) and Eq. (9). In these equations, ∆t = five years. Thus, five periods will correspond to the estimated useful life of SPS:
p = 0.5 1+vσ
Δt 0.5⎛ ⎝ ⎜
⎞ ⎠ ⎟ pe = 0.5 1+
2.7724.3
× 40.5⎛ ⎝ ⎜
⎞ ⎠ ⎟ = 0.614 (7)
u = exp σ .Δt 0.5[ ] ue = exp 0.243 × 40.5[ ]=1.63 (8)
d =1u
de =1
1.63= 0.615 (9)
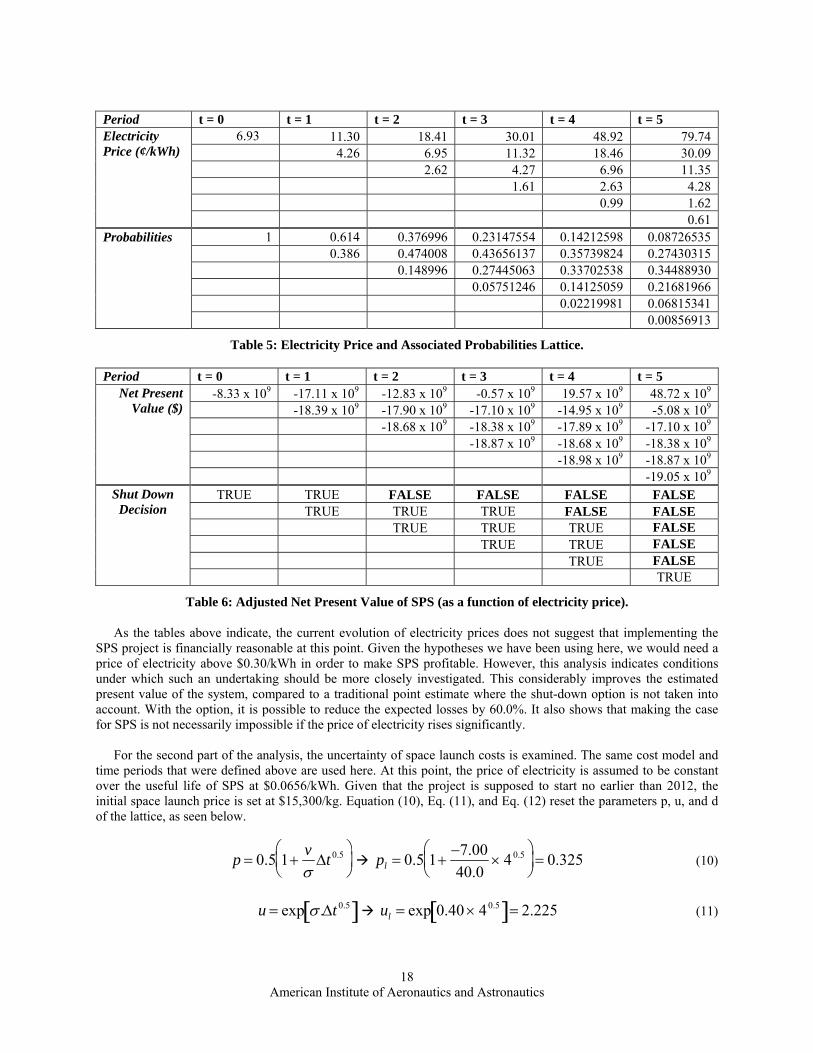
Further, it is assumed that the space launch cost will be approximately constant and equal to $7,400/kg, the approximate average value it should have over the period if it follows the proposed trend. Table 5 displays the lattice of the price of electricity over the useful life of the system, with the associated probabilities. Table 6 provides the net present value (NPV) of the SPS system when the possibility of shutting down is available. The net present value at the beginning of the project is the leftmost value in the upper part of Table 6. This value is used to determine whether the project should be undertaken.
The satellite shut down decision is taken if the maintenance costs are determined to be higher than the potential
revenue. As the costs are constant, the shut down decision only depends on the electricity price. Obviously, if the satellite should be shut down from the beginning, then the SPS project should not be launched. The option of shutting down the satellite is comparable to a Put financial option, as the builder of the satellite plans ahead to introduce flexibility in satellite operations and allow shutdown to prevent further losses if the electricity price becomes unfavorable.
American Institute of Aeronautics and Astronautics
18
Period t = 0 t = 1 t = 2 t = 3 t = 4 t = 5
6.93 11.30 18.41 30.01 48.92 79.74 4.26 6.95 11.32 18.46 30.09 2.62 4.27 6.96 11.35 1.61 2.63 4.28 0.99 1.62
Electricity Price (¢/kWh)
0.61 1 0.614 0.376996 0.23147554 0.14212598 0.08726535
0.386 0.474008 0.43656137 0.35739824 0.27430315 0.148996 0.27445063 0.33702538 0.34488930 0.05751246 0.14125059 0.21681966 0.02219981 0.06815341
Probabilities
0.00856913
Table 5: Electricity Price and Associated Probabilities Lattice.
Period t = 0 t = 1 t = 2 t = 3 t = 4 t = 5 -8.33 x 10⁹ -17.11 x 10⁹ -12.83 x 10⁹ -0.57 x 10⁹ 19.57 x 10⁹ 48.72 x 10⁹
-18.39 x 10⁹ -17.90 x 10⁹ -17.10 x 10⁹ -14.95 x 10⁹ -5.08 x 10⁹ -18.68 x 10⁹ -18.38 x 10⁹ -17.89 x 10⁹ -17.10 x 10⁹ -18.87 x 10⁹ -18.68 x 10⁹ -18.38 x 10⁹ -18.98 x 10⁹ -18.87 x 10⁹
Net Present Value ($)
-19.05 x 10⁹ TRUE TRUE FALSE FALSE FALSE FALSE
TRUE TRUE TRUE FALSE FALSE TRUE TRUE TRUE FALSE TRUE TRUE FALSE TRUE FALSE
Shut Down Decision
TRUE
Table 6: Adjusted Net Present Value of SPS (as a function of electricity price).
As the tables above indicate, the current evolution of electricity prices does not suggest that implementing the SPS project is financially reasonable at this point. Given the hypotheses we have been using here, we would need a price of electricity above $0.30/kWh in order to make SPS profitable. However, this analysis indicates conditions under which such an undertaking should be more closely investigated. This considerably improves the estimated present value of the system, compared to a traditional point estimate where the shut-down option is not taken into account. With the option, it is possible to reduce the expected losses by 60.0%. It also shows that making the case for SPS is not necessarily impossible if the price of electricity rises significantly.
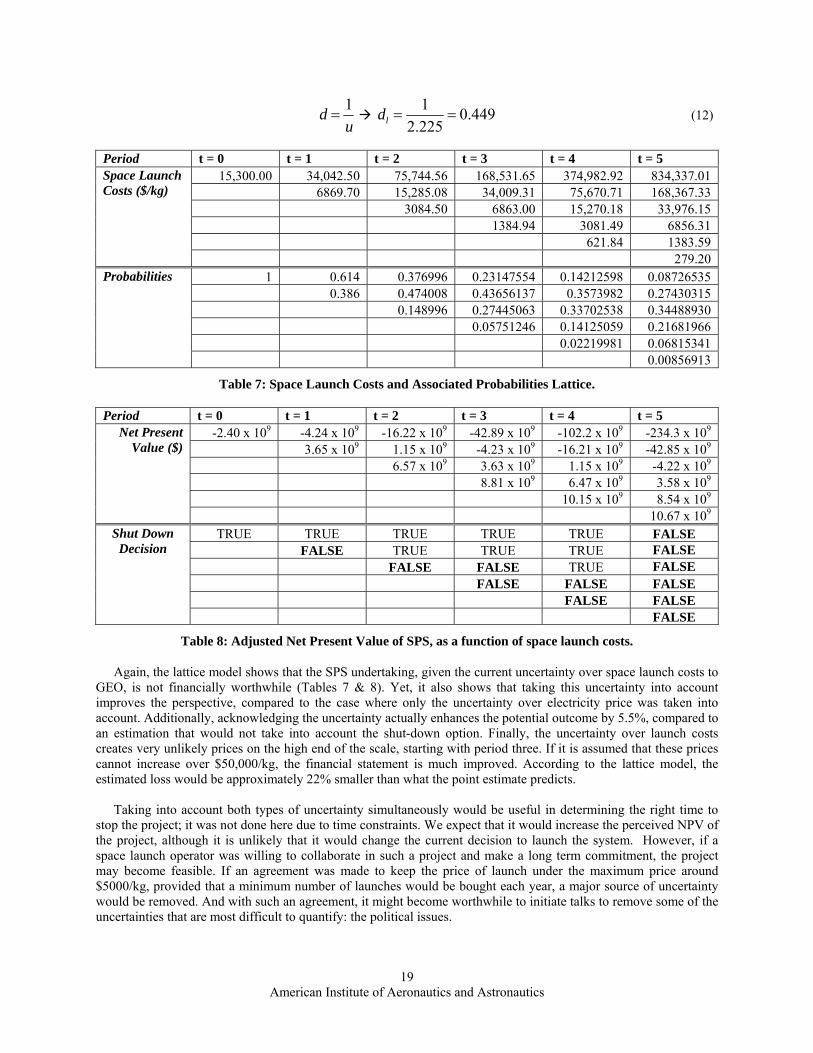
For the second part of the analysis, the uncertainty of space launch costs is examined. The same cost model and
time periods that were defined above are used here. At this point, the price of electricity is assumed to be constant over the useful life of SPS at $0.0656/kWh. Given that the project is supposed to start no earlier than 2012, the initial space launch price is set at $15,300/kg. Equation (10), Eq. (11), and Eq. (12) reset the parameters p, u, and d of the lattice, as seen below.
p = 0.5 1+vσ
Δt 0.5⎛ ⎝ ⎜
⎞ ⎠ ⎟ pl = 0.5 1+
−7.0040.0
× 40.5⎛ ⎝ ⎜
⎞ ⎠ ⎟ = 0.325 (10)
u = exp σ .Δt 0.5[ ] ul = exp 0.40 × 40.5[ ]= 2.225 (11)
American Institute of Aeronautics and Astronautics
19
d =1u
dl =1
2.225= 0.449 (12)
Period t = 0 t = 1 t = 2 t = 3 t = 4 t = 5 15,300.00 34,042.50 75,744.56 168,531.65 374,982.92 834,337.01
6869.70 15,285.08 34,009.31 75,670.71 168,367.33 3084.50 6863.00 15,270.18 33,976.15 1384.94 3081.49 6856.31 621.84 1383.59
Space Launch Costs ($/kg)
279.20 1 0.614 0.376996 0.23147554 0.14212598 0.08726535
0.386 0.474008 0.43656137 0.3573982 0.27430315 0.148996 0.27445063 0.33702538 0.34488930 0.05751246 0.14125059 0.21681966 0.02219981 0.06815341
Probabilities
0.00856913
Table 7: Space Launch Costs and Associated Probabilities Lattice.
Period t = 0 t = 1 t = 2 t = 3 t = 4 t = 5 -2.40 x 10⁹ -4.24 x 10⁹ -16.22 x 10⁹ -42.89 x 10⁹ -102.2 x 10⁹ -234.3 x 10⁹
3.65 x 10⁹ 1.15 x 10⁹ -4.23 x 10⁹ -16.21 x 10⁹ -42.85 x 10⁹ 6.57 x 10⁹ 3.63 x 10⁹ 1.15 x 10⁹ -4.22 x 10⁹ 8.81 x 10⁹ 6.47 x 10⁹ 3.58 x 10⁹ 10.15 x 10⁹ 8.54 x 10⁹
Net Present Value ($)
10.67 x 10⁹ TRUE TRUE TRUE TRUE TRUE FALSE
FALSE TRUE TRUE TRUE FALSE FALSE FALSE TRUE FALSE FALSE FALSE FALSE FALSE FALSE
Shut Down Decision
FALSE
Table 8: Adjusted Net Present Value of SPS, as a function of space launch costs.
Again, the lattice model shows that the SPS undertaking, given the current uncertainty over space launch costs to GEO, is not financially worthwhile (Tables 7 & 8). Yet, it also shows that taking this uncertainty into account improves the perspective, compared to the case where only the uncertainty over electricity price was taken into account. Additionally, acknowledging the uncertainty actually enhances the potential outcome by 5.5%, compared to an estimation that would not take into account the shut-down option. Finally, the uncertainty over launch costs creates very unlikely prices on the high end of the scale, starting with period three. If it is assumed that these prices cannot increase over $50,000/kg, the financial statement is much improved. According to the lattice model, the estimated loss would be approximately 22% smaller than what the point estimate predicts.
Taking into account both types of uncertainty simultaneously would be useful in determining the right time to
stop the project; it was not done here due to time constraints. We expect that it would increase the perceived NPV of the project, although it is unlikely that it would change the current decision to launch the system. However, if a space launch operator was willing to collaborate in such a project and make a long term commitment, the project may become feasible. If an agreement was made to keep the price of launch under the maximum price around $5000/kg, provided that a minimum number of launches would be bought each year, a major source of uncertainty would be removed. And with such an agreement, it might become worthwhile to initiate talks to remove some of the uncertainties that are most difficult to quantify: the political issues.
American Institute of Aeronautics and Astronautics
20
V. The Future of SPS This section discusses how a future SPS system could be implemented given the lessons learned from the 1970s
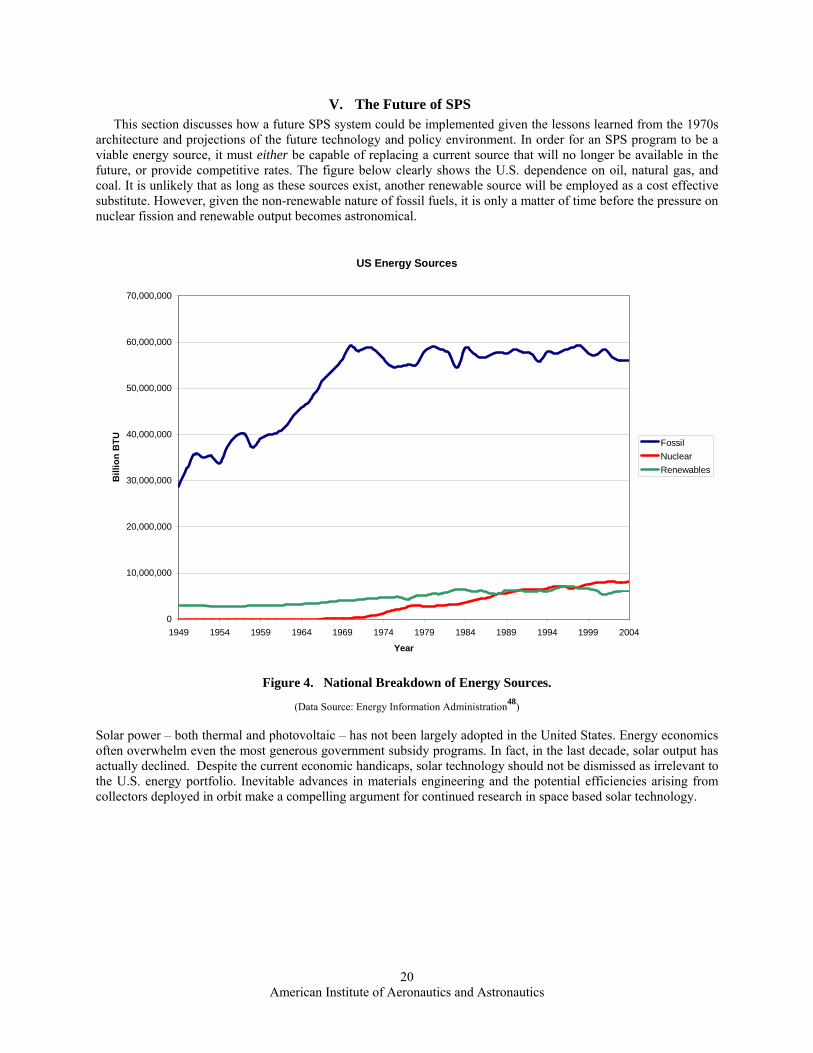
architecture and projections of the future technology and policy environment. In order for an SPS program to be a viable energy source, it must either be capable of replacing a current source that will no longer be available in the future, or provide competitive rates. The figure below clearly shows the U.S. dependence on oil, natural gas, and coal. It is unlikely that as long as these sources exist, another renewable source will be employed as a cost effective substitute. However, given the non-renewable nature of fossil fuels, it is only a matter of time before the pressure on nuclear fission and renewable output becomes astronomical.
US Energy Sources
0
10,000,000
20,000,000
30,000,000
40,000,000
50,000,000
60,000,000
70,000,000
1949 1954 1959 1964 1969 1974 1979 1984 1989 1994 1999 2004
Year
Bill
ion
BTU Fossil
NuclearRenewables
Figure 4. National Breakdown of Energy Sources.
(Data Source: Energy Information Administration48)
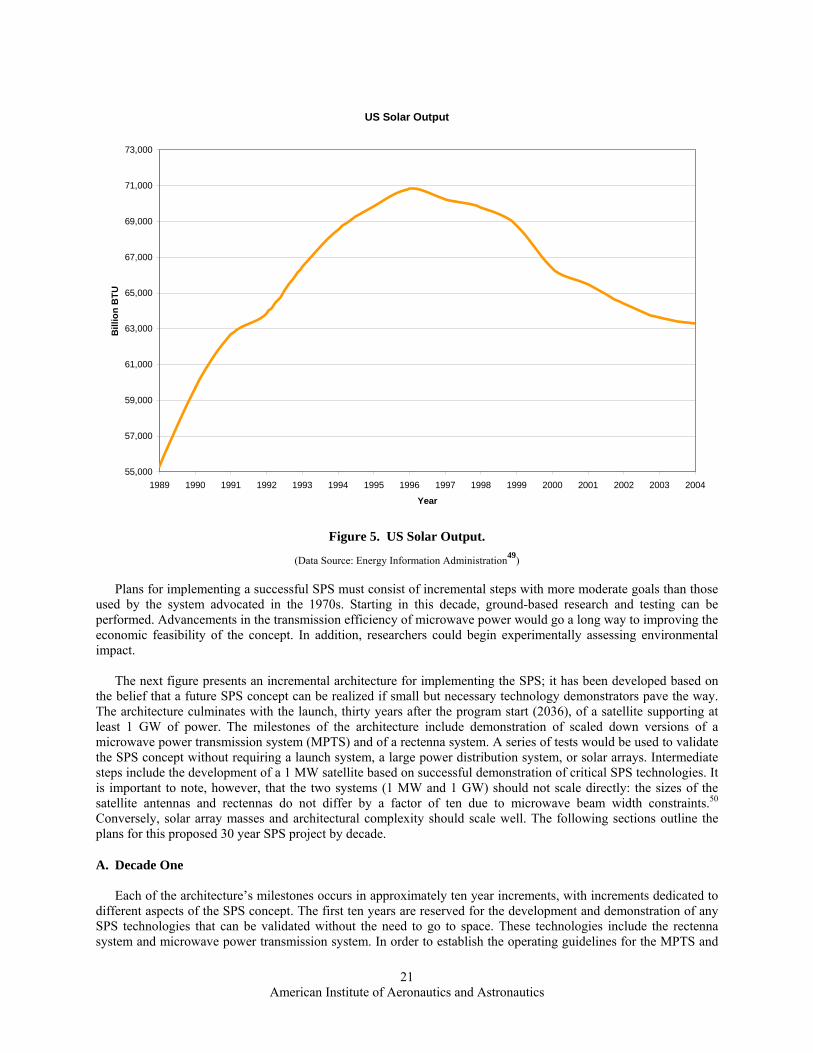
Solar power – both thermal and photovoltaic – has not been largely adopted in the United States. Energy economics often overwhelm even the most generous government subsidy programs. In fact, in the last decade, solar output has actually declined. Despite the current economic handicaps, solar technology should not be dismissed as irrelevant to the U.S. energy portfolio. Inevitable advances in materials engineering and the potential efficiencies arising from collectors deployed in orbit make a compelling argument for continued research in space based solar technology.
American Institute of Aeronautics and Astronautics
21
US Solar Output
55,000
57,000
59,000
61,000
63,000
65,000
67,000
69,000
71,000
73,000
1989 1990 1991 1992 1993 1994 1995 1996 1997 1998 1999 2000 2001 2002 2003 2004
Year
Bill
ion
BTU
Figure 5. US Solar Output.
(Data Source: Energy Information Administration49)
Plans for implementing a successful SPS must consist of incremental steps with more moderate goals than those used by the system advocated in the 1970s. Starting in this decade, ground-based research and testing can be performed. Advancements in the transmission efficiency of microwave power would go a long way to improving the economic feasibility of the concept. In addition, researchers could begin experimentally assessing environmental impact.
The next figure presents an incremental architecture for implementing the SPS; it has been developed based on the belief that a future SPS concept can be realized if small but necessary technology demonstrators pave the way. The architecture culminates with the launch, thirty years after the program start (2036), of a satellite supporting at least 1 GW of power. The milestones of the architecture include demonstration of scaled down versions of a microwave power transmission system (MPTS) and of a rectenna system. A series of tests would be used to validate the SPS concept without requiring a launch system, a large power distribution system, or solar arrays. Intermediate steps include the development of a 1 MW satellite based on successful demonstration of critical SPS technologies. It is important to note, however, that the two systems (1 MW and 1 GW) should not scale directly: the sizes of the satellite antennas and rectennas do not differ by a factor of ten due to microwave beam width constraints.50 Conversely, solar array masses and architectural complexity should scale well. The following sections outline the plans for this proposed 30 year SPS project by decade.
A. Decade One
Each of the architecture’s milestones occurs in approximately ten year increments, with increments dedicated to different aspects of the SPS concept. The first ten years are reserved for the development and demonstration of any SPS technologies that can be validated without the need to go to space. These technologies include the rectenna system and microwave power transmission system. In order to establish the operating guidelines for the MPTS and

American Institute of Aeronautics and Astronautics
22
rectenna to interact in space, it is necessary to test them in an environment where the two subsystems are in relative motion and separated by large distances. The relative motion required would have to be high enough to be able to extrapolate to orbital velocities. A high altitude aircraft may be required to achieve this milestone.
Figure 6. Proposed SPS Timeline.
B. Decade Two
The main objective of the second phase is to demonstrate the viability of a single 1 MW satellite. The period selected for these tests is ideal because, by 2020, the availability of launch vehicles should have increased due to the introduction of the launch vehicle for NASA’s Vision for Space Exploration. A second very important objective of the first SPS satellite is to achieve operational knowledge of the architecture. After some operational experience, the design could be iterated one or two more times until a stable and efficient platform is created. One option for the development program is to develop a second SPS satellite approximately halfway through the second decade. A second satellite would have the potential to further the SPS concept by demonstrating the ability of SPS to work as a ��ï �Ĥ�����ï�tiple satellites with multiple ground stations.
The second satellite could also have greater power output and be a more scalable stepping stone towards the goal
of a 1 GW SPS. Having successfully demonstrated the operation of ground systems, research efforts during this period should focus on systems that are unique to space. These include the power distribution and solar array systems. The MPTS and rectenna design from the previous decade could be used again, this time with the addition of solar arrays and a power distribution system.

American Institute of Aeronautics and Astronautics
23
C. Decade Three
The final decade of development focuses on the creation of the 1 GW satellite. Using the incremental technology developments from previous decades, a 1 GW satellite can be developed with a smoother transition that one without the various developmental phases.
D. Technology Readiness for Building SPS
All of the technological questions that have previously been identified in this domain must be answered in some way before completing this project. This section focuses on the technology readiness level of the various elements of the SPS program. NASA has used nine levels of technology readiness ranging from TRL1, Basic Technology Research (e.g. quantum computers), to TRL9, System Test, Launch, and Operations (e.g. Space Shuttle). Figure 7 illustrates NASA’s TRL Meter. Many SPS subsystems are located between TRL4 and TRL8.
Figure 7. NASA Technology Readiness Level Meter.51
One of the most mature subsystems that had previously been considered a source of uncertainty is the energy conversion system, i.e. the solar cells. On the scale defined above, it could now be ranked at TRL9. However, no test has yet been made to check the resilience and durability of modern solar cells over very long periods of time in conditions similar to those planned for SPS. Rotary joints and other mechanical subsystems that would be implemented on SPS can be considered as having a similar technology readiness level. In this case, comparable systems already exist in the International Space Station but are one or two orders of magnitude smaller than those that would be used on SPS. Because of the particular constraints of GEO and the inner complexity of such mechanical devices, it would in fact not be possible to consider these systems as completely mature before conducting full scale tests. Ground-based infrastructures also have a comparably high TRL. Even if no rectenna site has ever been tested, all of the necessary components have already been specified and used for other ground-based power systems.
A number of subsystems at TRL 6 or TRL 7 are currently used for other purposes such as space exploration.
Amongst them, protection systems against radiation and next generation space suits have been developed for the Moon and Mars exploration programs. Similarly, the International Space Station has established the feasibility of larger docking stations in LEO orbits. The U.S. Vision for Space Exploration will contribute to the development of many key SPS technologies. The creation of the Crew Exploration Vehicle and Cargo Launch Vehicle (CaLV) are examples. Such items could be ranked between TRL5 and TRL6, especially given that they use relatively mature technology.

American Institute of Aeronautics and Astronautics
24
Some SPS technologies, conversely, carry only moderate rankings. This category of subsystems includes those where the utilization is too specialized or the testing is too costly to be deeply studied. The most important subsystems in this domain are the DC-RF converters on the solar arrays, the microwave power units, and the microwave phase control systems. Even if the underlying component technology is sound and has some applications on Earth, it is not possible to know how much modification is necessary for a large-scale space deployment. Presently, these elements cannot be considered above TRL 4.
In addition to technology readiness, mutual dependences influence the development timeline for overcoming the
current barriers. Testing several subsystems requires having others already functional. Major restrictions in this area concern questions of access and of building capacity. With these points in mind, it is possible to create a rough timeline for the development steps toward achieving the SPS program as shown in the figure below. The timeline assumes that the current space program will be achieved and that the need for an SPS system will be recognized within ten years, thus creating a firm political commitment. It can consequently be considered as a “best case” situation.
Figure 8. Approximate Timeline for Technology Readiness of Major Subsystems of SPS.
E. Performance of Future SPS Technology The mass of solar arrays is a key factor in the engineering economics of SPS. Three solar array specific powers
have been investigated, which approximately represent current COTS space technology (50 W/kg), current research development technology (200 W/kg), and future technology (500 W/kg).52 The various sizes of SPS satellites from 1 MW to 1 GW are shown below for each technology tier. Obviously, operating at the highest specific power allows one to minimize the mass of the solar array system.

American Institute of Aeronautics and Astronautics
25
SPS Solar Array Mass
1.E+03
1.E+04
1.E+05
1.E+06
1.E+07
1.E+08
1 10 100 1000 10000
MW
Mas
s (k
g)__
s 50 W/kg200 W/kg500 W/kg
Figure 9. SPS Mass as a function of Power.
The next figure shows the number of launches required to place the system in orbit, assuming use of the NASA CaLV (5 segmented RSRB in-line with 5 SSME Core - Cargo with upper stage), proposed Atlas Phase X (8 m Core), or the Space Shuttle for a 1 GW system.53 This analysis assumes that the solar array composes the majority of the satellite mass. The best scenario incorporates high specific power systems (500 W/kg) using any of the launch vehicles. One additional item to consider is the deployment of the solar array and the human support staff for assembly. However, it is promising to note that, for a 1 GW system, less than eighteen launches may be necessary for a 500 W/kg solar cell using the CaLV.
Number of Launches for 1 GW SPS
0
10
20
30
40
50
60
70
80
90
100
Solar Array Specific Power
Laun
ches CaLV
Atlas Phase X
Shuttle
CaLV 160 40 16
Atlas Phase X 211 53 22
Shuttle 799 200 80
50 W/kg 200 W/kg 500 W/kg
Figure 10. Number of Launches for a 1 GW SPS.

American Institute of Aeronautics and Astronautics
26
To understand the challenge of launching SPS components into space, it is useful to project forward to a 5 GW system (see the figure below). A 5 GW system requires more launches, as presented in the previous figure. For a 5 GW system, it is certainly reasonable to make the assumption that the solar array is the dominant mass. Here, current launch vehicles are not adequate for any of the solar array options. In order to avoid issues regarding high launch rates the development of a new heavy lift launcher or other novel means of lift, such as a space elevator, are the most favorable options. Given this analysis, a 1 GW system has reasonable launch rates considering future solar cell technology; however, a 5 GW system is not reasonable in the proposed timeline even with future technology.
Number of Launches for 5 GW SPS
10
100
1000
10000
50 W/kg
Solar Array Specific Power
Laun
ches CaLV
Atlas Phase X
Shuttle
200 W/kg 500 W/kg
Figure 11. Number of Launches for a 5 GW SPS.
VI. Conclusion This study began by reviewing the details of the proposed 1970s architecture for a solar power satellite system.
The ambitious launch schedule, immense manpower requirements, and intense budgetary requirements may seem extreme. It is no surprise that the United States did not commit wholeheartedly to the SPS program in the 1970s. As the world begins the 21st century, however, steps must be taken to respond to growing demand for power. This reality motivates us to look again at the potential of energy from the sun for meeting global needs. Clearly, a stepping stone approach in which technology is advanced gradually could eventually make the SPS concept feasible. The aforementioned three decade time table in which first ground technology is developed, then a small scale SPS is implemented, followed by a large scale SPS provides a basis for action. Finally, the lattice model enables responsible management of the uncertainty in parameters such as launch cost and electricity prices.
Table 9 summarizes the evolution of SPS barriers and challenges up through current time and provides
projections for the 2015 and 2025 timeframes. The characterizations of low, medium, or high difficulty for each category are based on our team’s informed judgments. It is anticipated that many of the challenges can be mitigated during the next 30 years, but some will require that research, education, and negotiation begin today.
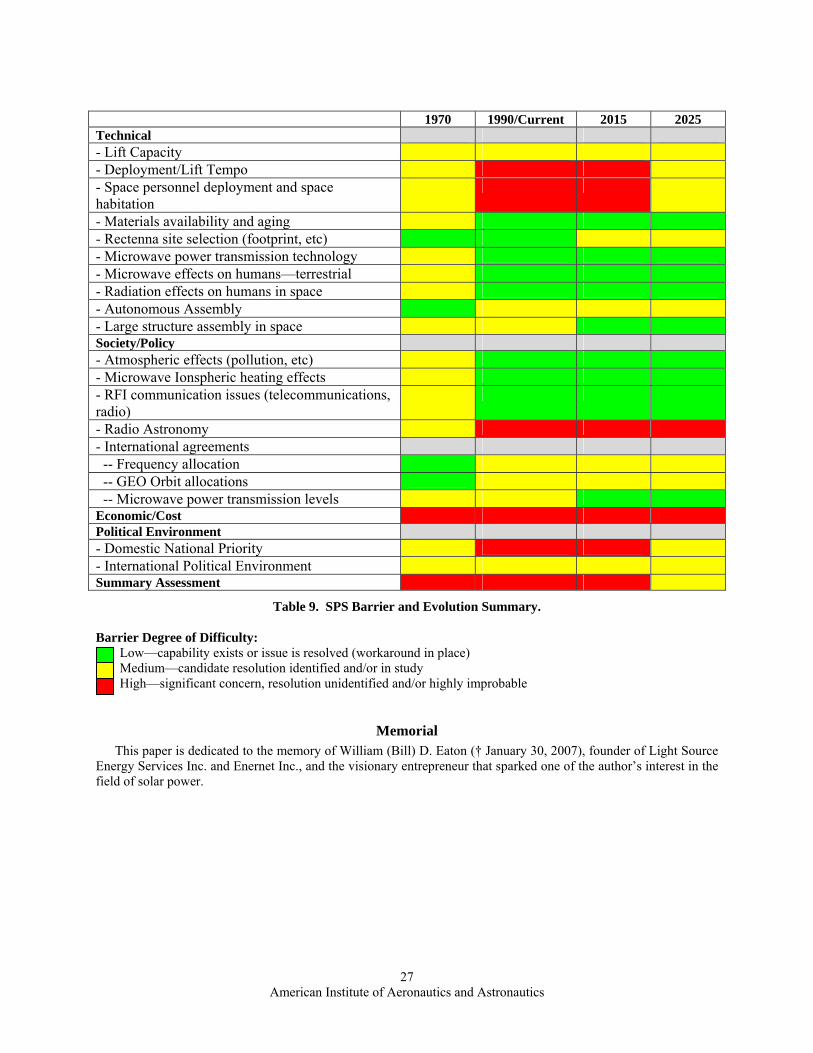
American Institute of Aeronautics and Astronautics
27
1970 1990/Current 2015 2025 Technical - Lift Capacity - Deployment/Lift Tempo - Space personnel deployment and space habitation
- Materials availability and aging - Rectenna site selection (footprint, etc) - Microwave power transmission technology - Microwave effects on humans—terrestrial - Radiation effects on humans in space - Autonomous Assembly - Large structure assembly in space Society/Policy - Atmospheric effects (pollution, etc) - Microwave Ionspheric heating effects - RFI communication issues (telecommunications, radio)
- Radio Astronomy - International agreements -- Frequency allocation -- GEO Orbit allocations -- Microwave power transmission levels Economic/Cost Political Environment - Domestic National Priority - International Political Environment Summary Assessment
Table 9. SPS Barrier and Evolution Summary.
Barrier Degree of Difficulty: Low—capability exists or issue is resolved (workaround in place) Medium—candidate resolution identified and/or in study High—significant concern, resolution unidentified and/or highly improbable
Memorial This paper is dedicated to the memory of William (Bill) D. Eaton († January 30, 2007), founder of Light Source
Energy Services Inc. and Enernet Inc., and the visionary entrepreneur that sparked one of the author’s interest in the field of solar power.

American Institute of Aeronautics and Astronautics
28
References 1 “Earth Radiation Budget .” NASA Langley Research Center. 2006. 2 Hakes, Jay E. “25th Anniversary of the 1973 Oil Embargo,” Energy Information Administration. http://www.eia.doe.gov/emeu/25opec/anniversary.html. 3 “Addressing the 2000-2001 Western Energy Crisis,” Federal Energy Regulatory Commission. http://www.ferc.gov/industries/electric/indus-act/wec.asp 4 "Long Term Outlook for Energy Markets," Energy Information Administration, March, 2006. 5 Ibid. 6 Ibid. 7 Ibid. 8 Hoffert, M., and Potter, S. “Beam It Down: How the New Satellites Can Power the World,” http://www.spacefuture.com, October, 1997. 9 “Satellite Power System: Concept Development and Evaluation Program, Reference System Report DOE/ER-0023.” US Department of Energy and the National Aeronautics and Space Administration, January, 1979. 10 “Interim Pricing Report On New York State's Independent System Operator,” New York Public Service Commission, December 2000. 11 “Solar Power Satellite System Definition Study.” Boeing Aerospace Company, 1979, p. 2:4. 12 Ibid, p. 2:8. 13 Ibid, pp. 6:16-21. 14 Ibid, p. 9:32. 15 Ibid, p. 9:36. 16 Ibid, p. 9:23. 17 Ibid, p. 12:13. 18 Ibid, p. 13:29. 19 Ibid, p. 12:6. 20 Ibid, p. 12:13. 21 Ibid, pp. 14:9-11. 22 Ibid, p. 2:25. 23 Glaser, P. “The Potential of Satellite Solar Power.” Proceedings of the IEEE, Vol. 65, No. 8, August, 1977. 24 Valentino, A. R. “Environmental Assessment Overview.” Final Proceedings of the Solar Power Satellite Program Review. NASA Center for Aerospace Information, NASA-TM-84183, July 1, 1980, pp. 38-39. 25 Glaser, P. “The Potential of Satellite Solar Power.” Proceedings of the IEEE, Vol. 65, No. 8, August, 1977. 26 Newsom, D.E., and Wolsko, T.D. “Preliminary Comparative Assessment of Land Use for Satellite Power System and Alternative Electric Energy Technologies.” NASA/DOE Concept Design and Evaluation Program. April 1, 1980. 27 Glaser, P. “The Potential of Satellite Solar Power.” Proceedings of the IEEE, Vol. 65, No. 8, August, 1977. 28 Bloomquist, C. “Societal Assessment Overview.” Final Proceedings of the Solar Power Satellite Program Review. NASA Center for Aerospace Information, NASA-TM-84183, July 1, 1980, pp. 56. 29 Glaser, P. “The Potential of Satellite Solar Power.” Proceedings of the IEEE, Vol. 65, No. 8, August, 1977. 30 Valentino, A. R. “Environmental Assessment Overview.” Final Proceedings of the Solar Power Satellite Program Review. NASA Center for Aerospace Information, NASA-TM-84183, July 1, 1980, pp. 47-49. 31 Ibid, p. 50. 32 Ibid, p. 52. 33 Ibid, pp. 42-43. 34 Glaser, P. “The Potential of Satellite Solar Power.” Proceedings of the IEEE, Vol. 65, No. 8, August, 1977. 35 Glaser, P. “On the Military Implications of a Satellite Power System.” Peter Glaser Papers. MC 569. Box 71. Folder 8. Institute Archives and Special Collections, MIT Libraries, Cambridge, MA. 36 Rockwell International, “Satellite Power System Concept Definition”, Final Report 1977. 37 Riches, M. R. “A Comparative Assessment of the Reference Satellite Power System with Selected Current, Near-Term, and Advanced Energy Technologies.” NASA/DOE Concept Development and Evaluation Program Report, N82-22676, 1980, pp. 66-77. 38 Ibid. 39 “Solar Power Satellites”. Office of Technology Assessment, August 1981. http://www.nss.org/settlement/ssp/library/index.htm. Accesses 8/3/07. 40 J C Mankins, , "A Fresh Look at Space Solar Power: New Architectures, Concepts and Technologies", IAF-97-R.2.03, 38th International Astronautical Federation, 1997. 41 de Neufville R. Applied Systems Analysis. New-York: McGraw-Hill, 1990. 42 Wang T. and de Neufville R. “Building Real Options into Physical Systems with Stochastic Mixed-Integer Programming.” Proceedings of the 8th Real Options Annual International Conference. Montreal: June 2004.
American Institute of Aeronautics and Astronautics
29
43 Koelle D. ‘Specific Space Transportation Cost to GEO – Past, Present and Future” Proceedings of the 53rd IAC. Houston: Oct. 2002. 44 Ibid. 45 Senft D. C. ‘Opportunities in Photovoltaics for Space Power Generation” Proceedings of the Photovoltaic Specialists Conference. January 2005. 46 Czysz P. A. and Bruno C. Future Spacecraft Propulsion Systems: Enabling Technologies for Space Exploration. Chichester: Springer-Praxis, 2006. 47 Energy Information Administration (EIA) Electric Power Annual. November 2006. 48 “National Breakdown of Energy Sources.” Energy Information Administration (EIA). April 2006. 49 “US Solar Production.” Energy Information Administration (EIA). April 2006. 50 Personal Communication with Prof. Geoffery Landis, MIT. May 2, 2006. 51 Graphic Source. “RCA Projects Overview” http://ctd.grc.nasa.gov/organization/branches/amosb/RCA_PROJECTS/PROJECTS.htm Accessed Aug 5, 2007. 52 Wertz, James, and Wiley Larson, Space Mission Analysis and Design. 3rd Ed. October 1999. 53 “NASA’s Exploration Systems Architecture Study Final Report,” NASA-TM-2005-214062. November, 2005.