solar photovoltaic power plant modeling and validation guideline solar... · 2019-12-10 ·...
TRANSCRIPT

Solar Photovoltaic Power Plant Modeling and Validation Guideline
First Solar Proprietary & Confidential - Finance/Accounting/RND
Solar Photovoltaic Power Plant Modeling and Validation
Guideline
M&VWG
<<Date>>

Solar Photovoltaic Power Plant Modeling and Validation Guideline
First Solar Proprietary & Confidential - Finance/Accounting/RND
Introduction ..................................................................................................................................................... 1
Guideline Criteria .......................................................................................................................................... 1
Power Flow Modeling ................................................................................................................................... 2
Dynamic Modeling ........................................................................................................................................ 2
Model Validation Procedure ........................................................................................................................ 3
Please refer to the following guidelines and policies for more information: ..................................... 3
Version History ............................................................................................................................................... 4
1 Background ............................................................................................................................................. 5
2 POWER FLOW REPRESENTATION ................................................................................................. 8
2.1 Central Station solar PV Systems .................................................................................................. 8
Implications of Collector System Equivalencing .............................................................. 10
Interconnection Transmission Line ................................................................................. 1110
solar PV Plant Station Transformer ................................................................................. 1110
Plant Level Reactive Compensation ............................................................................... 1110
Equivalent Collector System ............................................................................................ 1110
Equivalent Inverter Pad-Mounted Transformer ........................................................... 1413
Equivalent Generator Representation ............................................................................ 1413
2.2 Representation of Distribution-Connected solar PV Systems ............................................. 1918
2.3 Modeling during post transient power flows ........................................................................ 2018
3 DYNAMIC MODELING ................................................................................................................ 2019
3.1 Active Power / Frequency Control .......................................................................................... 2019
3.2 Reactive Power /Voltage Control ............................................................................................ 2119
3.3 Fault Ride-Through and Representation of Protection Limits ............................................ 2120
4 WECC Generic Models ................................................................................................................... 2220
4.1 Technical Specifications for the WECC Generic Models ..................................................... 2220
4.2 WECC Generic Model for Large-scale solar PV Plants ........................................................ 2321
Model Structure ................................................................................................................. 2322
Model Invocation ............................................................................................................... 2523
Scaling for the solar PV Plant Size and Reactive Capability ....................................... 2624

Solar Photovoltaic Power Plant Modeling and Validation Guideline
First Solar Proprietary & Confidential - Finance/Accounting/RND
Reactive Power / Voltage Controls Options .................................................................. 2624
Active power control options .......................................................................................... 2725
Current Limit Logic ........................................................................................................... 2726
Representation of Voltage and Frequency Protection .................................................. 2826
Momentary cessation ........................................................................................................ 2826
4.3 WECC Generic Model for Distributed and Small solar PV Plants ..................................... 3128
5 MODEL VALIDATION ................................................................................................................. 3128
5.1 Data Collection ........................................................................................................................... 3129
5.2 Defining the Mode of Operation ............................................................................................. 3330
Setting the REPC Model Flags ......................................................................................... 3330
Setting the REEC Model Flags ......................................................................................... 3431
Strictly Local Control – No REPC_A Module ................................................................ 3431
Plant-Level Control – Model Includes REPC Module .................................................. 3532
Setting the REGC Model Flags ......................................................................................... 3633
5.3 Valid Model Parameter Flag Combinations .......................................................................... 3733
Strictly Local Control – No REPC Module ..................................................................... 3733
Plant-Level Control – Model Includes REPC Module .................................................. 3834
5.4 Dynamic Model Invocation Considerations .......................................................................... 4037
REPC Module Invocation Considerations ..................................................................... 4037
5.5 Populating Model Parameters ................................................................................................. 4138
Dynamic Model Parameter Sensitivity ........................................................................... 4239
Real Power Response to Voltage Variations .................................................................. 4239
Real Power Response to Frequency Variations ............................................................. 4240
Reactive Power Response to Voltage Variations ........................................................... 4340
Reactive Power Response to Frequency Variations ...................................................... 4340
Properly Coordinated Plant Control and Inverter Control ......................................... 4340
Parameter Estimation Example........................................................................................ 4340
Importance of Power Flow Representation.................................................................... 4744
Model Performance for Various Disturbances .............................................................. 4845

Solar Photovoltaic Power Plant Modeling and Validation Guideline
First Solar Proprietary & Confidential - Finance/Accounting/RND
6 FINAL WORDS ................................................................................................................................ 4946
7 Appendix ........................................................................................................................................... 5047
7.1 Short-Circuit Ratio Fundamentals .......................................................................................... 5047
7.2 REGC_A Block Diagram and Model Parameters .................................................................. 5249
7.3 REEC_A Block Diagram and Model Parameters .................................................................. 5653
7.4 REPC_A Block Diagram and Model Parameters .................................................................. 5955
7.5 SAMPLE solar PV POWER PLANT DATA REQUEST........................................................ 6157

Solar Photovoltaic Power Plant Modeling and Validation Guideline
1
First Solar Proprietary & Confidential - Finance/Accounting/RND
Introduction
Along with development of the generic renewable energy system (RES) dynamic models, WECC
Modeling and Validation Work Group has established several guidelines for modeling bulk power
system (BPS)-connected solar PV plants:
• Central Station Photovoltaic Power Plant Model Validation Guideline, dated June 17, 2015
• WECC solar PV Power Plant Dynamic Modeling Guide, dated April 2014
• WECC Guide for Representation of Photovoltaic Systems In Large-Scale Load Flow
Simulations, dated August 2010
The generic dynamic models have evolved to the second generation RES models and have been
adopted to represent most of the solar PV plants in the Western Interconnection. The guidelines
above have been referred to extensively in producing the models for the solar PV plants. However,
recent solar PV tripping events1 due to system disturbance revealed some weakness of the
modeling approach. At the same time, new technical requirements have been imposed on solar PV
generating resources, such as FERC Order 827 and FERC Order 824 The modeling guidelines need
an update to capture lessons learned and considerations in alignment with the technical
requirements.
The scope of this document encompasses the representation of BPS-connected solar PV plants in
both power flow and dynamic data sets for bulk system studies. Its primary purpose is to outline
recommended modeling techniques for all solar PV resources in the transmission and distribution
systems, as well as best practices for performing model validation of utility-scale solar PV systems
(≥ 10 MW) connected to the transmission network (60 kV and above).
Guideline Criteria
This is a consolidated document that augments and updates the following guidelines:2
1 NERC disturbance reports –
https://www.nerc.com/pa/rrm/ea/Pages/April-May-2018-Fault-Induced-Solar-solar PV-Resource-
Interruption-Disturbances-Report.aspx
https://www.nerc.com/pa/rrm/ea/Pages/October-9-2017-Canyon-2-Fire-Disturbance-Report.aspx
https://www.nerc.com/pa/rrm/ea/Pages/1200-MW-Fault-Induced-Solar-Photovoltaic-Resource-Interruption-
Disturbance-Report.aspx
2 Approval of this guideline will supersede the listed guidelines; the latest technical guidance should be used
for modeling BPS-connected solar solar PV resources.

Solar Photovoltaic Power Plant Modeling and Validation Guideline
2
First Solar Proprietary & Confidential - Finance/Accounting/RND
• Central Station Photovoltaic Power Plant Model Validation Guideline, dated June 17, 2015
• WECC Solar Plant Plant Dynamic Modeling Guide, dated April 2014
• WECC Guide for Representation of Photovoltaic Systems In Large-Scale Load Flow
Simulations, dated August 2010
The intended audience for this guideline includes solar PV plant owners responsible for
performing model validation of their plants and transmission planners responsible for verifying
validation data submitted to them and for developing interconnection-wide base cases that
sufficiently represent their planning area footprint.
Power Flow Modeling
Each central station solar PV plant (≥ 10 MW and connected to 60 kV and above) is modeled
explicitly in the power flow model. The power flow representation includes:
• An explicit representation of the interconnection transmission line, if one exists.
• An explicit representation of all station transformers.
• An equivalent representation of the collector systems.
• An equivalent representation of inverter pad-mount transformers with a scaled MVA
rating.
• An equivalent representation of generators scaled to match the total capacity of the plant.
The small or distribution-connected in-front-of-the-meter solar PV plants may be aggregated at a
high voltage bus that is represented in the power flow. The power flow representation simply
includes:
• A pseudo transmission line (jumper) from the aggregated generator to the point of
interconnection
• The aggregated generator matching the total capacity of multiple plants that can be
delivered to the point of interconnection
The behind-the-meter distributed solar PV are represented as aggregated DG component of the
load.
Dynamic Modeling
The dynamic model of a solar PV plant explicitly modeled in the power flow includes:
• A generator/converter module representing the typical solar PV inverter in the plant,

Solar Photovoltaic Power Plant Modeling and Validation Guideline
3
First Solar Proprietary & Confidential - Finance/Accounting/RND
scaled-up to match the plant’s aggregate nameplate rating.
• A local electrical control module which translates real and reactive power references
into current commands.
• A plant-level control module which sends real and reactive power references to the
local electrical controller, if the plant-level control is implemented.
The dynamic model of solar PV plants connected at the distribution system represented by an
aggregated generator in the power flow includes:
• Stand-alone DER_A model or PVD1 model
Behind-the-meter distributed solar PV resources are modeled by the DER_A component of the
composite load model.
Model Validation Procedure
The steps of a successful model validation procedure include:
• Gather available data from commissioning tests, field tests, and grid disturbances.
• Clearly define the mode of operation, or control mode, of the plant.
• Work with the inverter manufacturer, system integrator, and/or plant operator to
determine as many model parameters as possible beforehand.
• Minimize the set of dynamic model parameters that are available for tuning or
parameter estimation.
• Use appropriate engineering analyses, including tests and tuning, to bring measured
and simulated data into agreement.
Please refer to the following guidelines and policies for more
information:
• WECC Generating Unit Model Validation Policy
• WECC Generating Facility Data, Testing, and Model Validation Requirements
• WECC Data Preparation Manual
• NERC reliability guideline on power plant model verification for inverter-based resources
Commented [RQ1]: This is no longer the
recommended approach.

Solar Photovoltaic Power Plant Modeling and Validation Guideline
4
First Solar Proprietary & Confidential - Finance/Accounting/RND
Disclaimer
WECC receives data used in its analyses from a wide variety of sources. WECC strives to source its data from reliable
entities and undertakes reasonable efforts to validate the accuracy of the data used. WECC believes the data contained
herein and used in its analyses is accurate and reliable. However, WECC disclaims any and all representations,
guarantees, warranties, and liability for the information contained herein and any use thereof. Persons who use and rely
on the information contained herein do so at their own risk.
Version History
Modified Date Modified By Description

Solar Photovoltaic Power Plant Modeling and Validation Guideline
5
First Solar Proprietary & Confidential - Finance/Accounting/RND
1 Background
The composition of the generation fleet in the Western Interconnection is undergoing rapid
transformation. As renewable energy plants have increased in capacity, standards and policies
have been developed to ensure they are accurately represented in power flow and dynamic data
sets. In particular, the latest versions of NERC MOD-026 and MOD-027 apply to all BES generating
facilities with an aggregate nameplate rating of 75 MVA or larger. The standards, which are subject
to enforcement, require accurate representation of a BES generating facility’s reactive power
response to system voltage variations, and its real power response to system frequency variations
respectively. Although these NERC MOD standards currently only apply to generating facilities
with an aggregate nameplate rating of 75 MVA or larger, WECC policy requires the submission of
validated generating facility data for all plants connected to the transmission system (60 kV and
above) with an aggregate nameplate rating of 20 MVA or larger. The WECC Generating Unit
Model Validation Policy requires generating facility data to be updated at least once every 5 years.
As the penetration of solar PV generation keeps increasing, the dynamic response of the system is
changing, in part due to a decline in inertia provided by thermal power plants. In order to conduct
accurate planning studies and ensure the grid operates reliably, it is vital to model variable
generation with the same care and attention to detail as synchronous generation. The intent is for
time domain simulation of the system to match reality as closely as possible. Over the course of
many years and with input from manufacturers, the WECC Renewable Energy Modeling Task
Force (REMTF) has developed a suite of generic models for renewable energy plants and
established several guidelines for modeling solar PV plants –
• Central Station Photovoltaic Power Plant Model Validation Guideline, dated June 17, 2015
• WECC Solar PV Power Plant Dynamic Modeling Guide, dated April 2014
• WECC Guide for Representation of Photovoltaic Systems In Large-Scale Load Flow
Simulations, dated August 2010
The guidelines above have been referred to extensively in producing the models for the solar PV
plants. However, recent solar PV tripping events due to system disturbance revealed some
weakness of the modeling approach. At the same time, the technology are evolving and new
technical requirements have been imposed on solar PV generating resources. The modeling
guidelines need an update to capture lessons learned and considerations in align with the technical
requirements.
Solar Photovoltaic Power Plant Modeling and Validation Guideline
6
First Solar Proprietary & Confidential - Finance/Accounting/RND
This document augments and updates the above guidelines and focuses on central station solar PV
plants (≥ 10 MW) regarding how to model them in bulk system planning studies, and how to
estimate appropriate dynamic model parameters.
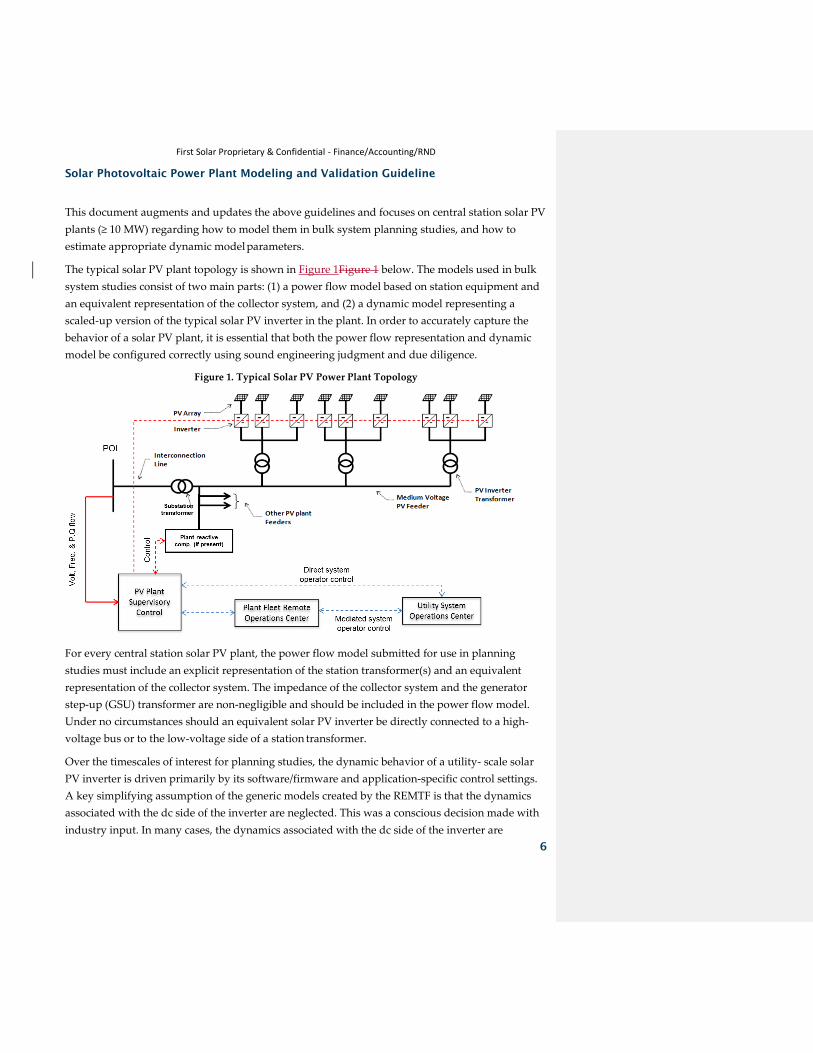
The typical solar PV plant topology is shown in Figure 1Figure 1 below. The models used in bulk
system studies consist of two main parts: (1) a power flow model based on station equipment and
an equivalent representation of the collector system, and (2) a dynamic model representing a
scaled-up version of the typical solar PV inverter in the plant. In order to accurately capture the
behavior of a solar PV plant, it is essential that both the power flow representation and dynamic
model be configured correctly using sound engineering judgment and due diligence.
Figure 1. Typical Solar PV Power Plant Topology
For every central station solar PV plant, the power flow model submitted for use in planning
studies must include an explicit representation of the station transformer(s) and an equivalent
representation of the collector system. The impedance of the collector system and the generator
step-up (GSU) transformer are non-negligible and should be included in the power flow model.
Under no circumstances should an equivalent solar PV inverter be directly connected to a high-
voltage bus or to the low-voltage side of a station transformer.
Over the timescales of interest for planning studies, the dynamic behavior of a utility- scale solar
PV inverter is driven primarily by its software/firmware and application-specific control settings.
A key simplifying assumption of the generic models created by the REMTF is that the dynamics
associated with the dc side of the inverter are neglected. This was a conscious decision made with
industry input. In many cases, the dynamics associated with the dc side of the inverter are

Solar Photovoltaic Power Plant Modeling and Validation Guideline
7
First Solar Proprietary & Confidential - Finance/Accounting/RND
dominated by high frequency content that is beyond the realm of interest for bulk system planning
studies.
The dynamic model for a central station solar PV plant comprises 2 or 3 modules and contains
between 45-75 unique parameters, depending on whether a plant controller is implemented. The
resulting model has a high degree of flexibility and can be configured in over 30 unique modes of
operation. With such a plethora of available control settings, it is essential to compile as much
information about the system as possible before attempting to tune the model parameters. In
particular, knowing the pertinent time constants and the mode of operation, i.e., control mode, of
the plant are critical to achieving satisfactory model validation. In many cases, this will require
engaging the inverter manufacturer, system integrator, and/or plant operator in the process. The
number of parameters available for tuning should be minimized to avoid multiple solutions of
parameter fitting. The primary purpose of this document is to outline best practices for using
measured data to estimate dynamic model parameters for central station solar PV plants.
Note: The generic models developed by the WECC REMTF and discussed in this document are
applicable for systems with a short circuit ratio of 2 to 3 and higher at the point of interconnection
(POI). These generic models are not intended for studying parts of the system with very low short-
circuit levels. In such cases, detailed, vendor-specific models may be required. A brief overview of
these concepts is presented in the Appendix.

Solar Photovoltaic Power Plant Modeling and Validation Guideline
8
First Solar Proprietary & Confidential - Finance/Accounting/RND
2 POWER FLOW REPRESENTATION
2.1 Central Station Solar PV Systems
The WECC Data Preparation Manual3 states that single generating units 10 MVA or higher, or
aggregated capacity of 20 MVA connected to the transmission system (60kV and above)
through a step-up transformer(s) should be modeled as distinct generators in WECC base cases.
It also states that collector-based system such as wind or solar plants connected to the
transmission grid may be represented as an equivalent generator, low voltage to intermediate
voltage transformer, equivalent collector circuit, and transformer.
REMTF recommends that each central station solar PV plant (aggregated capacity ≥ 20 MVA
and connected to 60 kV and above) is modeled explicitly in the power flow model. The power
flow representation includes:
• An explicit representation of the interconnection transmission line, if one exists.
• An explicit representation of all substation transformers.
• An explicit representation of all plant level reactive compensation devices either
as shunts (fixed or switchable) or as generators (FACTs devices), if applicable
• An equivalent representation of the collector systems.
• An equivalent representation of inverter pad-mount transformers with a scaled
MVA rating.
• An equivalent representation of generators scaled to match the total capacity of
the plant. Typically, each solar PV plant is represented by the single-machine equivalence as shown in
Figure 2Figure 2.
3 https://www.wecc.org/Administrative/2019 WECC Data Preparation Manual.pdf

Solar Photovoltaic Power Plant Modeling and Validation Guideline
9
First Solar Proprietary & Confidential - Finance/Accounting/RND
Figure 2: Illustrative Single-Generator Equivalent Power Flow Representation for a Solar PV Power
Plant
PV
1 2 3 4 5
Interconnection Transmission
Line
Substation Transformer
Equivalent Collector System
Equivalent Pad-mounted Transformer
Plant-level Reactive
Compensation (if applicable)
Equivalent PV Generator
Point of Interconnection
It is common that a solar PV plant has several different makes of the inverters installed and
these inverters have different reactive capability, control setup and protection setup. In such
cases, a multi-generator representation is appropriate. The determination of single or multiple
generator equivalence shall take into account the number of the main substation transformers,
the collector system behind each main substation transformer, the placement of different makes
of inverters behind the main substation transformers, the setting difference among inverters,
and the mix of different inverters.
• Each substation transformer is explicitly represented in the power flow model.
• If the same inverters are installed behind the substation transformer, represent
the inverters with one equivalent collector circuit, one equivalent pad-mounted
transformer and one equivalent generator.
• If different inverters with the same control and protection setting are installed
behind one substation transformer, all inverters can represented by one
equivalent collector circuit, one equivalent pad-mounted transformer and one
equivalent generator.
• If inverters with different setting are installed behind the same substation
transformer, model each type of inverters that has at least 10 MVA installed
capacity by one equivalent generator with its own equivalent pad-mounted
transformer. The type of inverters less than 10 MVA installed capacity may be
modeled together with another type of inverters in one equivalent generator.
•
Commented [ZS2]: SCE suggests that we set a
threshold for modeling different types of inverters as
equivalent generators, for instance 10 MVA or greater.

Solar Photovoltaic Power Plant Modeling and Validation Guideline
10
First Solar Proprietary & Confidential - Finance/Accounting/RND
Figure 3: Illustrative Multiple-Generator Equivalent Power Flow Representation for a Solar PV Power
Plant
P1
1 2 3 4 5
Interconnection Transmission
Line
Substation Transformer
Equivalent Collector System
Equivalent Pad-mounted Transformer
Equivalent Generator for
PV Make 1
Point of Interconnection
P2
6 7 8 Equivalent Generator for
PV Make 2
Equivalent Generator for
PV Make 3 P3
9
In these models, an equivalent generator represents the total generating capacity of a group of
inverters, the equivalent pad-mounted transformer represents the aggregate effect of all inverter
to mid-voltage transformers, and the equivalent collector system branch represents the
aggregate effect of the solar PV plant collector system. With the proper model parameters, this
model should approximate solar PV plant load flow characteristics at the interconnection point,
collector system real and reactive losses and voltage profile at the terminals of the “average”
inverter in the solar PV plant. Each component of the equivalent model is discussed below.
Implications of Collector System Equivalencing
As with any other model, the equivalent machine representation has some limitations. Due to
collector system effects, terminal voltage of individual inverters could vary somewhat,
especially in very large solar PV plants where the electrical distance between inverters may be
significant. Inverters that are closest to the interconnection point may experience significantly
different terminal voltage compared to inverters that are electrically farthest from the
interconnection point. In actual operation, terminal voltage of some inverters may reach control
or protection limits, resulting in different terminal behavior, or tripping. During the design
stage, or in special cases, it may be reasonable to use a more detailed representation of the
collector system to capture these details.

Solar Photovoltaic Power Plant Modeling and Validation Guideline
11
First Solar Proprietary & Confidential - Finance/Accounting/RND
Interconnection Transmission Line
Standard data includes nominal voltage, positive-sequence line parameters (impedance and
charging) and line normal and emergency ratings.
Solar PV Plant Substation Transformer
Transmission-connected solar PV plants require one or more substation transformers. Each
substation transformer should always be represented explicitly. Standard data includes
transformer nominal voltage of each winding, impedance, tap ratios, regulated bus and set
point, and ratings. Positive-sequence impedance for substation transformers is in the range of
6% to 10%, and X/R ratio in the range of 20 to 50.
Plant Level Reactive Compensation
Solar PV plants could have station fixed and/or switched capacitors installed at collector system.
If present, shunt capacitors should be modeled as constant impedance devices in load flow, to
capture voltage-squared effects. The WECC Data preparation Manual states that each switched
capacitor should be modeled explicitly. Standard data includes nominal rating, impedance, and
controlled device, if applicable. Operation of the shunt devices is coordinated with the plant-
level reactive controller (see equivalent generator representation).
Equivalent Collector System
Central-station solar PV plants collector systems consist of one or more medium voltage
feeders, as described in Figure 1Figure 1. Factors considered in feeder design include cost, real
power losses, and voltage performance. A typical design goal is to keep average real power
losses below 1%. At full output, real power losses can be higher, as much as 2% to 4%. The
collector system network is typically underground. For that reason, the equivalent collector
system X/R ratio tends to be low compared to typical overhead circuits. The equivalent collector
system impedance tends to be small compared to the substation transformer impedance, but it
not insignificant.
A simple method developed by NREL4 can be used to derive equivalent impedance (Zeq) and
equivalent susceptance (Beq) of a collector system consisting of radial elements. The
computation is as follows:
4 E. Muljadi, A. Ellis, et al, “Equivalencing the Collector System of a Large Wind Power Plant”, IEEE
Power Engineering Society Annual Conference, Montreal, Quebec, June 12-16, 2006.

Solar Photovoltaic Power Plant Modeling and Validation Guideline
12
First Solar Proprietary & Confidential - Finance/Accounting/RND
where I is total number of branches in the collector system, Zi is the impedance (Ri + jXi) for ith
branch, ni is the number of inverters connected to the ith branch, and N is the total number of
inverters in the solar PV plant. Branch impedance data can be obtained from collector system
design (conductor schedule) for the project. As stated before, the equivalent impedance
computed in this manner approximates real and reactive losses seen by the “average inverter”
in the solar PV plant. This calculation can be easily implemented in a spreadsheet. Figure 4
shows a simple example with nine branches (I = 9), and 21 inverters (N = 21). The corresponding
calculations are shown in Table 1. In this example, the inverters are 7 clusters of 3 inverters
each. In general, larger solar PV power plants would have lower Zeq and higher Beq considering
that more parallel feeders would be required.

Solar Photovoltaic Power Plant Modeling and Validation Guideline
13
First Solar Proprietary & Confidential - Finance/Accounting/RND
Figure 4: Sample Utility-Scale Solar PV plant topology
Table 1: Computation of collector system equivalent parameters for the sample system in Figure 4

Solar Photovoltaic Power Plant Modeling and Validation Guideline
14
First Solar Proprietary & Confidential - Finance/Accounting/RND
Equivalent Inverter Pad-Mounted Transformer
A solar PV plant has many pad-mounted transformers, each connected to one or more solar PV
inverters.
Assuming that all pad-mounted transformers are identical, and each connects to the same
number of inverters, the per-unit equivalent impedance (ZTeq) and the equivalent MVA rating
(MVATeq) can be computed as follows:
In these equations, ZT is the impedance of one transformer on its own MVA base (MVAT). For
the example system discussed above, the equivalent transformer impedance would be 6% on a
21 MVA base (7 X 3 MVA), with an X/R ratio of 10. If there are different transformer sizes or a
different number of inverters are connected to each transformer, the method shown in Table 1
can be applied to calculation of the equivalent transformer impedance. Step-up transformers
associated with utility-scale solar PV plants are in the range of 500 kVA to 2 MVA, and have
impedance of approximately 6% on the transformer MVA base, with X/R ratio of about 8.
As the inverter design evolves, it becomes more common to have integrated inverters and pad-
mounted transformers. For the integrated design, the manufacturer’s test and data are provided
at the terminal of the integrated unit of inverters and the pad-mounted transformer. Inverter
control inputs are also taken from the terminal of the integrated unit. In such case, the pad-
mounted transformers are not explicitly modeled in the power flow model. Instead, the
integrated units are modeled by the equivalent generator in the next section.
Equivalent Generator Representation
For load flow simulations, the equivalent solar PV generator should be represented as a
standard generator, as opposed to a negative load. Active power level and reactive power
capability must be specified according to the guidelines below. According to the WECC data
preparation manual, a turbine type of 31 shall be set for the equivalent generator except for
solar PV with DC side energy storage. Modeling considerations for solar PV and energy storage
hybrid resources are discussed in section 2.1.7.3 below.
2.1.7.1 Active Power Capability and Output Level
It is common that solar PV plant installs more solar panel and inverters than its contracted MW
capacity value. The MW capacity, i.e. PMAX in the base case model, of the equivalent generator
shall be set to the maximum output allowed by its interconnection agreement with the utility,
Commented [RD3]: Is this the same number or type in
all software?
Commented [ZS4R3]: Should be, since this is specified
in WECC manual

Solar Photovoltaic Power Plant Modeling and Validation Guideline
15
First Solar Proprietary & Confidential - Finance/Accounting/RND
instead of the physical capacity. The MVA base of the equivalent generator, on the other hand,
represents the sum of the physical MVA base of all the inverters.
Solar PV plant output varies as a function of solar input and, to a lesser extent, temperature.
Typically, solar PV plants are designed to achieve full output for several hours of the day under
clear sky conditions. The real power level assumed for the solar PV plant depends on the
purpose of the study. In the context of an interconnection study, a solar PV plant would be
modeled at full output. For other studies, solar PV plants may be modeled at partial output or
zero output. For instance, solar PV active power output is zero in night-time off-peak cases.
Heavy summer scenarios typically correspond to mid-afternoon peak load periods, when solar
PV is likely to be near 100% of output. For regional transmission planning studies, it is
recommended that the power level be established based on the average expected output level
during the time frame of interest.
2.1.7.2 Reactive Power Capability
Interconnection requirements and performance standards addressing reactive power capability
from large solar PV systems was established in FERC Order 827 dated June 165, 2016. Newly
interconnecting non-synchronous generators are required to maintain a composite power
delivery at continuous rated power output at the high-side of the generator substation. At that
point, the non-synchronous generator must provide dynamic reactive power within the power
factor range of 0.95 leading to 0.95 lagging, unless the transmission provider has established a
different power factor range that applies to all non-synchronous generators in the transmission
provider’s control area on a comparable basis. Non-synchronous generators may meet the
dynamic reactive power requirement by utilizing a combination of the inherent dynamic
reactive power capability of the inverter, dynamic reactive power devices (e.g., Static VAR
Compensators), and static reactive power devices (e.g., capacitors) to make up for losses.
For solar PV power plants subject to FERC Order 827 requirement, the dynamic reactive
capability is typically provided by the inverters. For example, if a solar PV power plant intends
to have 100 MW gross output from the inverters, the plant needs to have at least 33 MVar
reactive capacity and the total installed capacity of the inverters would could then be about 106
MVA. Alternatively, the 33 Mvar capacity could also be provided by auxiliary dynamic reactive
power sources within the plant as long as the total reactive power capability does not reduce
with decrease in voltage.
5 Federal Energy Regulatory Commission, Order No. 827, 16 June 2016. Available:
http://www.ferc.gov/whats-new/comm-meet/2016/061616/E-1.pdf
Solar Photovoltaic Power Plant Modeling and Validation Guideline
16
First Solar Proprietary & Confidential - Finance/Accounting/RND
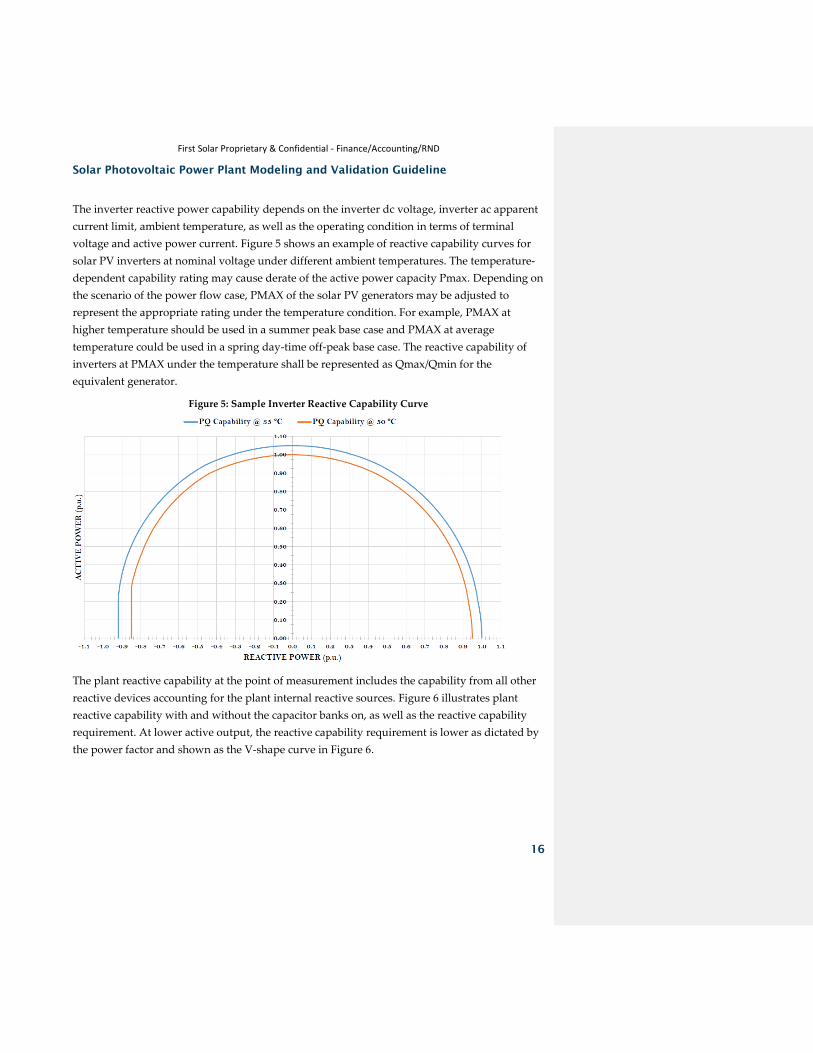
The inverter reactive power capability depends on the inverter dc voltage, inverter ac apparent
current limit, ambient temperature, as well as the operating condition in terms of terminal
voltage and active power current. Figure 5 shows an example of reactive capability curves for
solar PV inverters at nominal voltage under different ambient temperatures. The temperature-
dependent capability rating may cause derate of the active power capacity Pmax. Depending on
the scenario of the power flow case, PMAX of the solar PV generators may be adjusted to
represent the appropriate rating under the temperature condition. For example, PMAX at
higher temperature should be used in a summer peak base case and PMAX at average
temperature could be used in a spring day-time off-peak base case. The reactive capability of
inverters at PMAX under the temperature shall be represented as Qmax/Qmin for the
equivalent generator.
Figure 5: Sample Inverter Reactive Capability Curve
The plant reactive capability at the point of measurement includes the capability from all other
reactive devices accounting for the plant internal reactive sources. Figure 6 illustrates plant
reactive capability with and without the capacitor banks on, as well as the reactive capability
requirement. At lower active output, the reactive capability requirement is lower as dictated by
the power factor and shown as the V-shape curve in Figure 6.

Solar Photovoltaic Power Plant Modeling and Validation Guideline
17
First Solar Proprietary & Confidential - Finance/Accounting/RND
Figure 6: Sample Plant Reactive Capability Curve
When required, the power factor of individual inverters can be adjusted via a plant-level
reactive controller to meet operating requirements at the point of measurement6. Several control
modes are possible:
• Closed-loop voltage control - Maintain voltage schedule within the reactive power
capability of the solar PV plant, over a certain range of real power output. A small voltage
hysteresis or dead band may be appropriate in some situations. For instance, the
requirement may be to regulate voltage at the interconnection point within 1% or 2% of
schedule.
• Voltage droop control – Increase or decrease reactive power output linearly, as a
function of voltage. This type of control allows the solar PV plant to provide voltage
support while avoiding large reactive power swings that a small solar PV plant would
see when connected to a relatively strong transmission system. A small dead band may
be implemented.
6 The plant level controller also coordinates operation of the switched capacitors, if present.

Solar Photovoltaic Power Plant Modeling and Validation Guideline
18
First Solar Proprietary & Confidential - Finance/Accounting/RND
• Power factor control - Maintain power factor at the interconnection pointpoint of
measurement close to a specified level. For instance, the requirement may be to maintain
power factor between 0.98 lead and unity at the interconnection point.
• Reactive power control - Maintain reactive power flow within some specified limits. For
instance, the requirement may be to limit reactive power flow at the interconnection point
to 5 or 10 MVAr, in either direction.
Representation of reactive power capability of the equivalent inverter depends on the reactive
range of the inverters, and how that range is utilized in operations. If the reactive capability is
utilized up to the power factor requirement, the equivalent generator load flow model should
be set to power factor control mode, i.e. the actual Qmax/Qmin is limited by the power factor at
the active power output. If the full reactive capability is utilized, the best modeling approach is
to define the capability curve in the Q-table and have the power flow software calculate the
actual Qmax/Qmin from the Q-table.
The older solar PV inverters were typically designed to operate at unity power factor. Plant
level var devices were installed to meet the reactive capability requirement. The Qmax and
Qmin for such solar PV inverters are 0 and the plant-level var compensation is modeled in the
power flow model.
2.1.7.3 Consideration for modeling solar PV and battery storage hybrid plant
Many of the new solar PV plants include on-site battery storage. Operation of the solar PV and
battery storage are optimized to manage the fast ramping up of generation in the morning
before the load goes up, extend the production hours at the sunset, and better utilize the
transmission capability. As such, the plant contractual capacity is lower than the sum of the
installed solar PV capacity and battery storage capacity. If the solar PV and battery storage each
has its own set of inverters, i.e. ac coupled (Figure 7), the solar PV and battery storage should be
modeled explicitly by separate equivalent generators, equivalent pad-mounted transformers
and equivalent collectors. The turbine type of the generator is set to 32 if the storage does not
charge from the grid and 31 if the storage charges from the grid. If the solar PV and battery
storage are dc-coupled (Figure 8), one equivalent generator will represent the inverters for both
solar PV and battery storage. The turbine type of the generator is set to 342 if the storage does
not charge from the grid and 33 if the storage charges from the grid. Pmin of the equivalent
generator represents the maximum charging power if the battery storage charges from the grid.
Commented [RD5]: This may account for reactive
power output at 0 MW output. But capability to
provide such reactive power output at 0 MW is a
requirement.
Formatted: Highlight
Commented [RD6]: Same comment as before, whether
this number is common to all software
Commented [ZS7R6]: Turbine type is specified in
WECC base case preparation manual. All software
should be using the same list. The question is how do
we ask WECC to add the proposed turbine types.
Formatted: Not Highlight
Formatted: Highlight
Formatted: Highlight
Commented [RD8]: Same comment as before, whether
this number is common to all software
Commented [ZS9R8]: Turbine type is specified in
WECC base case preparation manual. All software
should be using the same list. The question is how do
we ask WECC to add the proposed turbine types.
Formatted: Not Highlight

Solar Photovoltaic Power Plant Modeling and Validation Guideline
19
First Solar Proprietary & Confidential - Finance/Accounting/RND
Figure 7: AC Coupled Solar PV and Energy Storage
Figure 8: DC Coupled Solar PV and Energy Storage
2.2 Representation of Distribution-Connected Solar PV Systems

Solar Photovoltaic Power Plant Modeling and Validation Guideline
20
First Solar Proprietary & Confidential - Finance/Accounting/RND
In some ways, representation of distribution-connected solar PV systems in bulk system studies
is more challenging. In WECC base cases, the distribution system is not typically represented
and the load and the distributed generation are typically lumped at the transmission substation
transformers. The in-front-of-the-meter distributed solar PV generations are represented by an
equivalent aggregated generator connecting to the lower side of the transmission substation
transformer via an equivalent LTC transformer and equivalent series impedance. The behind-
the-meter distributed generations are modeled as the DG component of the load. Representing
solar PV generation and other distributed generation as a separate component of the load
would allow for proper load scaling and would give planners the ability to account for existing
and emerging performance standards applicable to distributed generation, including anti-
islanding, voltage tolerance envelope and reconnection, reactive support, and etc. More
information can be found in NERC reliability guideline for distributed energy resource
modeling7.
2.3 Modeling during post transient power flows
Modeling of solar PV generation and reactive compensation components should be consistent
with WECC post-transient methodology. Control devices that can complete switching or
operation within three minutes (e.g., SVCs, STATCOMS and shunts under automatic control)
should not be blocked. Devices that require operator action should be blocked. The equivalent
generator should have the Base Load Flag set to “1” if the output should not increase during a
governor power flow or set to “2” if the output should not change during a governor power
flow.
3 DYNAMIC MODELING
3.1 Active Power / Frequency Control
Average irradiance over a large solar PV plant can change appreciably during the span of a
typical dynamic simulation (up to 30 seconds). By default, the WECC generic models assume a
fixed reference generator output in the solved power flow case. Presently, there is no provision
for incorporating simulation of irradiance variability in large-scale system studies. This
approach is prudent given that the effect of AGC is not included in dynamic simulations. The
generic models do allow for the specification of active power control, including ramp rate
limits, frequency response and active/reactive power priority during voltage dips. Primary
frequency response capability is required to be enabled for the newly installed solar PV
7 https://www.nerc.com/comm/PC_Reliability_Guidelines_DL/Reliability_Guideline_-
_DER_Modeling_Parameters_-_2017-08-18_-_FINAL.pdf

Solar Photovoltaic Power Plant Modeling and Validation Guideline
21
First Solar Proprietary & Confidential - Finance/Accounting/RND
inverters within its operating limits. Solar PV resources typically operate at the full output
allowed by the radiance condition. Therefore, they do not have upward headroom for primary
frequency response. For such situation, both the power flow model and the dynamic model
shall reflect the downward only primary frequency response. However, the solar PV Plant may
have upper headroom for primary frequency response should the solar PV plant be operating at
a reduced MW output, when the low system frequency condition occurs.
3.2 Reactive Power /Voltage Control
Reactive power capability and response characteristics are an important consideration in system
studies. A variety of reactive power control modes can be implemented in a solar PV power
plant. Typically, central station solar PV plants are required to maintain the voltage at the point
of measurement at the given voltage schedule, up to the required reactive power capability.
Implementation of such requirement varies among different utilities. The dynamic models
should reflect the implementation by coordinating the plant controller model and inverter
electrical control model. During a dynamic event, the reactive power response is the net result
of fast inverter response and slower supervisory control by the plant controller. Under large
disturbance, as indicated by abnormal voltage condition, the slower plant control freezes and
the fast inverter control take over. The inverter reactive power output during the transient
period is not limited by the power factor requirement. Instead, it is limited by the inverter
current rating and the priority between producing active current and reactive current. The
reactive current limits in the dynamic model shall be wider than Qmax/Qmin in the power flow
model.
3.3 Fault Ride-Through and Representation of Protection Limits
An important part of a dynamic performance evaluation is whether the solar PV system trip off
line for a given voltage or frequency disturbance. The equivalent representation and simplified
dynamic models described here are not recommended for evaluation of compliance of fault
ride-through capability with the requirement. The simplified representation is generally
sufficient for the purpose of system studies. Whether or not an inverter will ride through a
voltage disturbance depends on the type of fault and the magnitude of the remaining voltage at
the inverter terminals. The control actions that affect the behavior of the inverter during the
span of a short fault are generally not modeled in detail in the generic dynamic models. This
limitation is acceptable because system studies focus on the characteristics of the dynamic
recovery, rather than on system conditions during the fault. Considering that terminal voltage
can vary significantly across the plant, a single machine representation has obvious limitations
with respect to assessment of the voltage ride through capability.
Commented [RD10]: Can there be a concern that this
statement would be misconstrued as generic models
cannot be used to represent fault ride through?

Solar Photovoltaic Power Plant Modeling and Validation Guideline
22
First Solar Proprietary & Confidential - Finance/Accounting/RND
Some solar PV inverters use momentary cessation as a means of ride-through. The inverters
remain connected but stop current injection into the grid during low or high voltage conditions
outside the continuous operating range. The momentary cessation behavior could be modeled
with voltage-dependent current limits in the dynamic models. Since the equivalent generator
and collector system are modeled, the model can only be an approximation. Furthermore, when
a mix of inverters deploying different momentary cessation settings are installed in the solar PV
inverters, modeling all inverters by one equivalent generator would introduce significant
inaccuracy. It is a better practice to model each group of inverters by one equivalent generator.
4 WECC Generic Models
The WECC Renewable Energy Modeling Task Force (REMTF) has developed a set of dynamic
models for renewable energy power plants using a modular approach. The models are available
as standard-library models in commercial simulation platforms used in WECC.
4.1 Technical Specifications for the WECC Generic Models
The WECC generic models for solar PV plants are based on the following technical
specifications:
• The models shall be non-proprietary and accessible to transmission planners and grid
operators without the need for non-disclosure agreements.
• The models shall provide a reasonably good representation of dynamic electrical
performance of solar photovoltaic power plants at the point of interconnection with the
bulk electric system, and not necessarily within the solar PV power plant itself.
• The models shall be suitable for studying system response to electrical disturbances, not
solar irradiance transients (i.e., available solar power is assumed constant through the
duration of the simulation). Electrical disturbances of interest are primarily balanced
transmission grid faults (external to the solar PV power plant), typically 3 - 9 cycles in
duration, and other major disturbances such as loss of generation or large blocks of load.
• Plant owners, inverter manufacturers and model users (with guidance from the
integrators and manufacturers) shall be able to represent differences among specific
inverter and/or plant controller responses by selecting appropriate model parameters and
feature flags.
• Simulations performed using these models typically cover a 20-30 second time frame, with
integration time steps in the range of 1 to 10 milliseconds.

Solar Photovoltaic Power Plant Modeling and Validation Guideline
23
First Solar Proprietary & Confidential - Finance/Accounting/RND
• The models shall be valid for analyzing electrical phenomena in the frequency range of
zero to approximately 10 Hz.
• The models shall incorporate protection functions that trip the associated generation
represented by the model, or shall include the means for external modules to be connected
to the model to accomplish such generator tripping.
• The models shall be initialized from a solved power flow case with minimal user
intervention required in the initialization process.
• Power level of interest is primarily 100% of plant nominal rating. However, performance
shall be valid, within a reasonable tolerance, for the variables of interest (current, active
power, reactive power and power factor) within a range of 25% to 100% of rated power.
• The models shall perform accurately for systems with a short circuit ratio of two to three
and higher at the point of interconnection.
• External reactive compensation and control equipment (i.e., external to the solar PV
inverters) shall be modeled separately using existing WECC-approved models.
WECC approved the use of two generic dynamic models for solar PV plants: (a) a model
consisting of plant controller, electrical controls and grid interface modules, intended for large-
scale solar PV plants, and (b) a simplified model intended for distribution-connected,
aggregated solar PV plants.
4.2 WECC Generic Model for Large-scale solar PV Plants
Model Structure
Dynamic representation of large-scale solar PV plants requires the use of three renewable
energy (RE) modules listed below and shown in Figure 9Figure 8. These modules, in addition
to others, are also used to represent wind and inverter-based energy storage power plants.
• REGC (REGC_*) module, used to represent the generator/converter (inverter) interface
with the grid. It processes the real and reactive current command and outputs of real and
reactive current injection into the grid model.
• REEC (REEC_*) module, used to represent the electrical controls of the inverters. It acts
on the active and reactive power reference from the REPC module, with feedback of
terminal voltage and generator power output, and provides real and reactive current
commands to the REGC module.
• REPC (REPC_*) module, used to represent the plant controller. It processes voltage and
reactive power output to emulate volt/var control at the plant level. It also processes

Solar Photovoltaic Power Plant Modeling and Validation Guideline
24
First Solar Proprietary & Confidential - Finance/Accounting/RND
frequency and active power output to emulate active power control. This module
provides active reactive power command to the REEC module.
Figure 98: Block Diagrams of Different Modules of the WECC Generic Models
Q Control
P Control
Current Limit Logic
IqcmdIqcmd
IpcmdIpcmd
Generator Model
Network Solution
Plant Level V/Q Control
Plant Level P Control
VrefVreg
QrefQbranch
PrefPbranchFreq_ref
Freg
Qext
Pref
REPC
Pqflag
REEC REGCVt Vt
Iq
Ip
These modules do not include inverter or plant protection. However, existing generator
protection models can be used to represent time-delayed voltage and frequency protection
settings. Table 2 shows the list of solar PV power plant simulation modules implemented in
two simulation platforms commonly used in WECC. Although the internal implementation
may differ across simulation platforms, the modules have the same functionality and parameter
sets.
Table 2: Models for Solar PV Power Plant in PSLF and PSSE
Module PSLF modules PSSE modules
Grid interface regc_* REGC*
Electrical controls8 reec_* REECA*
Plant controller repc_* REPC*
Voltage/frequency protection lhvrt / lhfrt VRGTPA / FRQTPA
Strictly speaking, only the REGC is required to run a simulation; however, the rest of the
modules are needed to enable control functionality.
The appendix contains a detailed description of the large-scale solar PV plant dynamic
modules. Default parameters are provided; however, these are intended for model testing only.
They do not represent the performance of any particular plant or equipment. Consultation with
8 Reec_b model has been retired by MVWG and should not be used to model solar solar PV plants
anymore.
Solar Photovoltaic Power Plant Modeling and Validation Guideline
25
First Solar Proprietary & Confidential - Finance/Accounting/RND
the inverter manufacturer and the plant operator is required to properly select appropriate
model parameters.
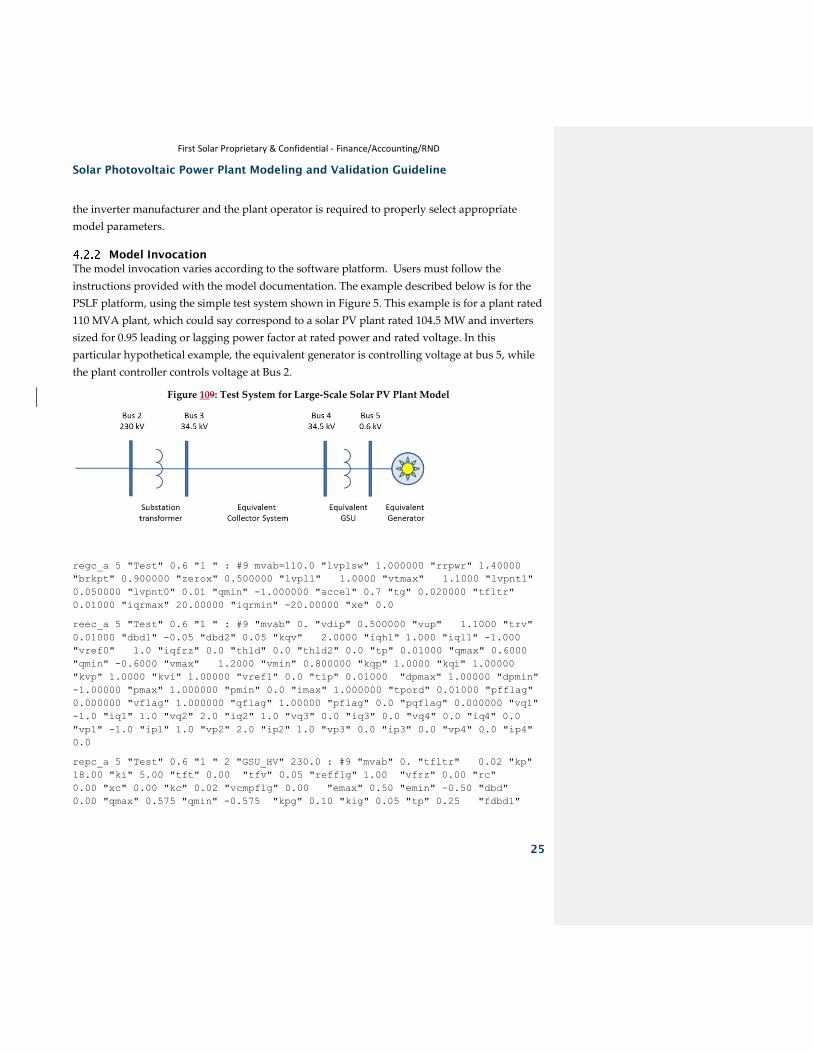
Model Invocation
The model invocation varies according to the software platform. Users must follow the
instructions provided with the model documentation. The example described below is for the
PSLF platform, using the simple test system shown in Figure 5. This example is for a plant rated
110 MVA plant, which could say correspond to a solar PV plant rated 104.5 MW and inverters
sized for 0.95 leading or lagging power factor at rated power and rated voltage. In this
particular hypothetical example, the equivalent generator is controlling voltage at bus 5, while
the plant controller controls voltage at Bus 2.
Figure 109: Test System for Large-Scale Solar PV Plant Model
regc_a 5 "Test" 0.6 "1 " : #9 mvab=110.0 "lvplsw" 1.000000 "rrpwr" 1.40000
"brkpt" 0.900000 "zerox" 0.500000 "lvpl1" 1.0000 "vtmax" 1.1000 "lvpnt1"
0.050000 "lvpnt0" 0.01 "qmin" -1.000000 "accel" 0.7 "tg" 0.020000 "tfltr"
0.01000 "iqrmax" 20.00000 "iqrmin" -20.00000 "xe" 0.0
reec_a 5 "Test" 0.6 "1 " : #9 "mvab" 0. "vdip" 0.500000 "vup" 1.1000 "trv"
0.01000 "dbd1" -0.05 "dbd2" 0.05 "kqv" 2.0000 "iqh1" 1.000 "iql1" -1.000
"vref0" 1.0 "iqfrz" 0.0 "thld" 0.0 "thld2" 0.0 "tp" 0.01000 "qmax" 0.6000
"qmin" -0.6000 "vmax" 1.2000 "vmin" 0.800000 "kqp" 1.0000 "kqi" 1.00000
"kvp" 1.0000 "kvi" 1.00000 "vref1" 0.0 "tip" 0.01000 "dpmax" 1.00000 "dpmin"
-1.00000 "pmax" 1.000000 "pmin" 0.0 "imax" 1.000000 "tpord" 0.01000 "pfflag"
0.000000 "vflag" 1.000000 "qflag" 1.00000 "pflag" 0.0 "pqflag" 0.000000 "vq1"
-1.0 "iq1" 1.0 "vq2" 2.0 "iq2" 1.0 "vq3" 0.0 "iq3" 0.0 "vq4" 0.0 "iq4" 0.0
"vp1" -1.0 "ip1" 1.0 "vp2" 2.0 "ip2" 1.0 "vp3" 0.0 "ip3" 0.0 "vp4" 0.0 "ip4"
0.0
repc_a 5 "Test" 0.6 "1 " 2 "GSU_HV" 230.0 : #9 "mvab" 0. "tfltr" 0.02 "kp"
18.00 "ki" 5.00 "tft" 0.00 "tfv" 0.05 "refflg" 1.00 "vfrz" 0.00 "rc"
0.00 "xc" 0.00 "kc" 0.02 "vcmpflg" 0.00 "emax" 0.50 "emin" -0.50 "dbd"
0.00 "qmax" 0.575 "qmin" -0.575 "kpg" 0.10 "kig" 0.05 "tp" 0.25 "fdbd1"

Solar Photovoltaic Power Plant Modeling and Validation Guideline
26
First Solar Proprietary & Confidential - Finance/Accounting/RND
-0.0006 "fdbd2" 0.0006 "femax" 99.00 "femin" -99.00 "pmax" 1.00 "pmin"
0.00 "tlag" 0.10 "ddn" 0.05 "dup" 0.05 "frqflg" 1.00
The parameters shown are intended for model testing only, and do not represent the
performance of any particular solar PV plant or equipment.
Scaling for the Solar PV Plant Size and Reactive Capability
Model parameters are expressed in per unit of the generator MVA base (mvab parameter in the
regc_a module in the example above). The specification of MVA base is implementation-
dependent. For example, in the PSLF implementation, if the MVA base for those modules is
zero, the MVA base entered for the regc module applies to the electrical controls (reec) and
plant controller (repc). A different MVA base can be specified for those modules, if desired.
To scale the dynamic model to the size of the plant, the generator MVA base parameter must be
adjusted. The active and reactive range are expressed in per unit on the scaled MVA base.
Normally, the MVA base is the same as in the power flow model. The reactive range could be
wider than the Qmax/Qmin range in the power flow model.
Reactive Power / Voltage Controls Options
The plant-level control module allows for the following reactive power control modes to be
represented:
• Closed loop voltage regulation (V control) at a user-designated bus with optional line drop
compensation, droop response and dead band.
• Closed loop reactive power regulation (Q control) on a user-designated branch, with
optional dead band.
• Constant power factor control (PF control) on a user-designated branch active power and
power factor. This control function is available in repc_b, not in repc_a.
Different function calls are required to specify the regulated bus or branch. In the electrical
control module, additional reactive control options are available:
• Constant power factor (PF), based on the generator PF in the solved power flow case.
• Constant reactive power, based either on the equivalent generator reactive power in the
solved power flow case or from the plant controller.
• Open-loop reactive current injection during a user-defined voltage-dip event.
Various combinations of plant-level and inverter-level reactive control are possible by setting
the appropriate parameters and switches. Table 3 shows a list of control options, and the

Solar Photovoltaic Power Plant Modeling and Validation Guideline
27
First Solar Proprietary & Confidential - Finance/Accounting/RND
models and switches that would be involved. The entry "N/A" for vflag indicates that the state
of the switch does not affect the indicated control mode. The entry “N/A” for refflag means repc
model is not present.
Table 3: Reactive Power Control Options for Large-Scale Solar PV Plant Generic Model
Functionality Required Models pfflag vflag qflag refflag
Constant local power factor control REEC 1 N/A 0 N/A
Constant Q control REEC 0 N/A 0 N/A
Local V control REEC 0 0 1 N/A
Local coordinated Q/V control REEC 0 1 1 N/A
Local coordinated PF/V control REEC 1 1 1 N/A
Plant level Q control REEC + REPC 0 N/A 0 0
Plant level V control REEC + REPC 0 N/A 0 1
Plant level Q control &
Local coordinated Q/V control
REEC + REPC
0
1
1
0
Plant level V control &
Local coordinated Q/V control
REEC + REPC
0
1
1
1
Plant level PF control REEC + REPC (_b and above)
0 N/A 0 2
Plant level PF control &
Local coordinated Q/V control
REEC + REPC (_b and above)
0
1
1
2
Active power control options
The plant controller allows a user to specify the active power control options listed below. Table
4 shows the active power control modes as well as the models and parameters involved.
• Constant active power, based on the generator output in the solved power flow case.
• Governor droop response with different characteristics for over and under frequency
conditions, based on frequency deviation at a user-designated bus.
Table 4: Active Power Control Options
Functionality Required Models frqflag ddn dup
No governor response REEC 0 0 0
Governor response, down regulation REEC + REPC 1 >0 0
Governor response, up and down REEC + REPC 1 >0 >0
Current Limit Logic
The electrical control module first determines the active and reactive current commands
independently according to the active power control option and reactive power control option.

Solar Photovoltaic Power Plant Modeling and Validation Guideline
28
First Solar Proprietary & Confidential - Finance/Accounting/RND
Each command is subject to the respective current limit, 0 to Ipmax for active current and Iqmin
to Iqmax for reactive current. Then the total current of √𝐼𝑝𝑐𝑚𝑑2 + 𝐼𝑞𝑐𝑚𝑑2 is limited by Imax. In
situations where current limit Imax of the equivalent inverter is reached, the user should specify
whether active or reactive current takes precedence, by setting the pqflag parameter in the REEC
module.
Representation of Voltage and Frequency Protection
Frequency and voltage ride-through is required for transmission-connected solar PV plants.
Because they are simplified, the WECC generic models may not be suitable to fully assess
compliance with voltage and frequency ride-through requirement. Voltage ride-through is
engineered as part of the plant design, and requires far more sophisticated modeling detail than
is possible to capture in a positive-sequence simulation environment. It is recommended that a
standardized (existing) protection model with voltage and frequency thresholds and time
delays can be used to indicate the minimum disturbance tolerance requirement that applies to
the plant. Also the frequency calculations in a positive-sequence simulation tool is not accurate
during or immediately following a close-by fault. It is recommended to use the frequency
protection relay model in a monitor only mode and always have some time delay associated
with any under/over frequency trip settings9.
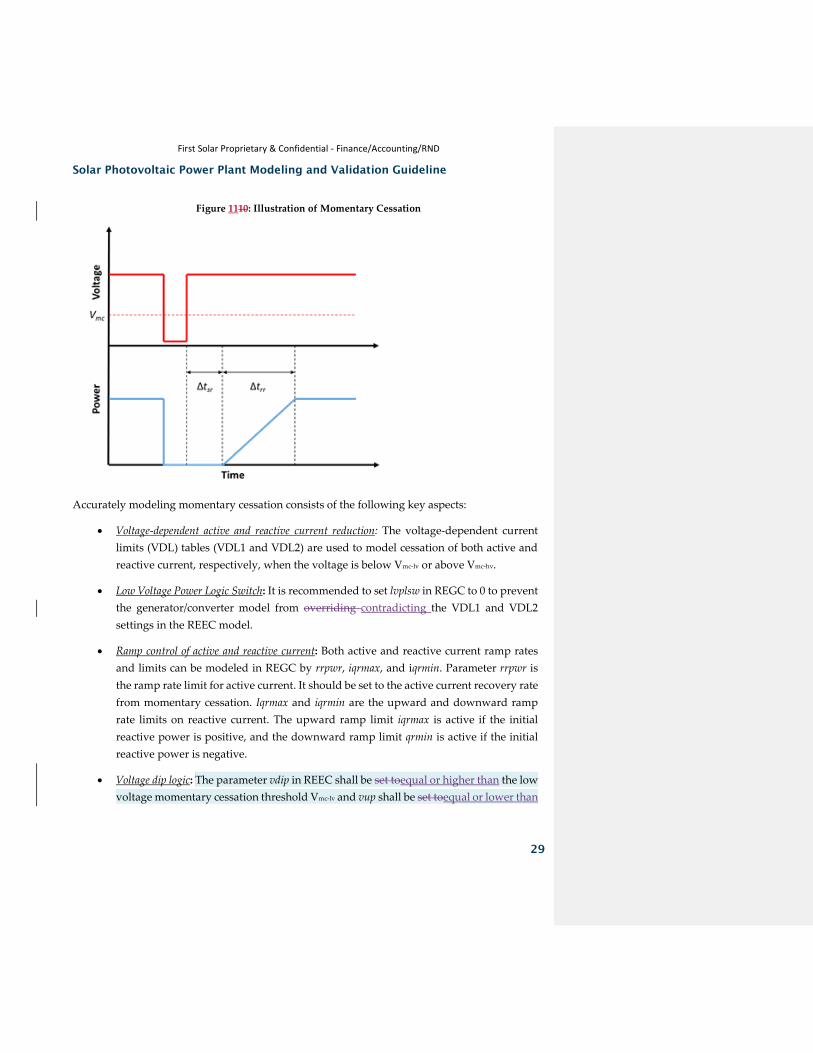
Momentary cessation
Momentary cessation can be characterized using the response shown in Figure 11Figure 10.
9 https://www.wecc.org/Reliability/WECC_White_Paper_Frequency_062618_Clean_Final.pdf
Commented [SS11]: Can we specify a minimum time
delay here using the IRPTF guideline?
Solar Photovoltaic Power Plant Modeling and Validation Guideline
29
First Solar Proprietary & Confidential - Finance/Accounting/RND
Figure 1110: Illustration of Momentary Cessation
Accurately modeling momentary cessation consists of the following key aspects:
• Voltage-dependent active and reactive current reduction: The voltage-dependent current
limits (VDL) tables (VDL1 and VDL2) are used to model cessation of both active and
reactive current, respectively, when the voltage is below Vmc-lv or above Vmc-hv.
• Low Voltage Power Logic Switch: It is recommended to set lvplsw in REGC to 0 to prevent
the generator/converter model from overriding contradicting the VDL1 and VDL2
settings in the REEC model.
• Ramp control of active and reactive current: Both active and reactive current ramp rates
and limits can be modeled in REGC by rrpwr, iqrmax, and iqrmin. Parameter rrpwr is
the ramp rate limit for active current. It should be set to the active current recovery rate
from momentary cessation. Iqrmax and iqrmin are the upward and downward ramp
rate limits on reactive current. The upward ramp limit iqrmax is active if the initial
reactive power is positive, and the downward ramp limit qrmin is active if the initial
reactive power is negative.
• Voltage dip logic: The parameter vdip in REEC shall be set toequal or higher than the low
voltage momentary cessation threshold Vmc-lv and vup shall be set toequal or lower than

Solar Photovoltaic Power Plant Modeling and Validation Guideline
30
First Solar Proprietary & Confidential - Finance/Accounting/RND
the high voltage threshold Vmc-hv to ensure inverter controls are frozen during the
cessation period.
• Recovery delay: The delay in recovery of active current10 can be represented by using a
non-zero value for the thld2 parameter in the REEC model if vdip is set to Vmc-lv and vup
is set to Vmc-hv. There is currently no capability to accurately model a delay in reactive
current injection in the reec_a model. The reec_d model under development uses
parameter thld to delay reactive current injection following a voltage dip event. This
delay is activated once the measured terminal voltage comes back within vdip and vup
i.e. following a low voltage (Vt < vdip) or high voltage event (Vt > vup). From the time
instant of vdip < Vt < vup, the active/reactive current command will be held at the
previous value (zero in the case of momentary cessation) for a period of thld2/thld
seconds. If the value of vdip/vup is set as mentioned above to comply with the Voltage
dip logic (vdip = Vmc-lv and vup = Vmc-hv), then the active/reactive current will be held at
zero for a period of thld2/thld seconds. If vdip and vup are not the same as Vmc-lv and Vmc-
hv, what to do?
Consideration for modeling solar PV and battery storage hybrid plant
If the solar PV and battery storage each has its own set of inverters (i.e., ac-coupled), the solar
PV and battery storage are modeled explicitly by separate equivalent generators, equivalent
pad-mounted transformers and equivalent collector systems in the power flow. Each generator
has its set of regc and reec models. It is recommended that repc_b is used as the master plant
controller to coordinate electrical controls between the solar PV and battery storage.
10 There is currently no capability to accurately model a delay in reactive current injection in the reec_a
model. The reec_d model uses parameter thld to delay reactive current injection following a voltage dip
event.
Commented [SS12]: I’m not sure if Vdip and Vup is
directly related to MC. My understanding is that Vdip
and Vup parameters are intended to activate fast
reactive current injection/absorption in REEC_* model
when the voltage at the inverter terminals falls outside
the voltage window specified by Vdip and Vup
parameters.
Commented [RQ13]: But no separate collector system?
This should probably be explained.
A figure here would be helpful. To help explain what
ac- an dc-coupled is.
But you have a separate document for this, correct?
Commented [RQ14]: Again, there’s a separate
document for this? Otherwise this needs to be
explained. Possibly link to that document?

Solar Photovoltaic Power Plant Modeling and Validation Guideline
31
First Solar Proprietary & Confidential - Finance/Accounting/RND
If the solar PV and battery storage are dc-coupled (Figure 7: AC Coupled Solar PV and Energy Storage
Figure 8Figure 7), one equivalent generator represents the inverters for both solar PV and
battery storage. One set of regc, reec and repc models is needed for the equivalent generator.
The electrical control model suitable for the battery storage could always be used for this type of
inverters. In case the battery does not charge from the grid, the electrical control model suitable
for the solar PV could also be used to represent the inverters with dc-coupled solar PV and
battery storage.
4.3 WECC Generic Model for Distributed and Small Solar PV Plants
The generic model DER_A or PVD1 is recommended to represent distribution-connected small
solar PV plants or multiple solar PV plants aggregated at a high voltage bus that is represented
in power flow. The DER_A model is used either as a stand-alone model for in-front-of-the-
meter distributed solar PV plants or as plug-in in the composite load model for behind-the-
meter solar PV resources. The DER_A model is much simpler than the modules discussed in
Commented [RQ15]: As in, it just looks like a normal
solar solar PV or wind plant, correct? With just
modified capability/parameter values/modes of
operation? So how do I model it or dispatch it in the
base case?

Solar Photovoltaic Power Plant Modeling and Validation Guideline
32
First Solar Proprietary & Confidential - Finance/Accounting/RND
Section 4.2, and provides a basic set of control options. Please refer to the DER_A model
specification11.
5 MODEL VALIDATION
The overarching goal of the model validation process is to verify that the results of time domain
simulation agree with measured data and hence, are consistent with actual system performance.
In commercial software tools, the power system is simulated by integrating the differential
equations of the dynamic models used to represent the system equipment. Many dynamic
model inputs are values provided by the solution of the algebraic power flow equations. As
such, computational simulation of the power system is dependent upon the fidelity of both the
power flow and dynamic models. For central station solar PV plants, the power flow
representation is dictated by physics. All of the necessary parameters are known or can be
directly calculated with a high degree of certainty. Hence, the focus of this section will be on
configuring the structure and selecting the parameter values of dynamic models for central
station solar PV plants.
5.1 Data Collection
The types of data useful for model validation of solar PV plants can be roughly divided into two
categories. The first corresponds to the system’s response to repeatable tests, and the second
corresponds to the system’s to spontaneously occurring disturbances. Repeatable tests, such as
performing a step-test with a switched capacitor, can be an effective method of characterizing a
plant’s response. The controlled nature of the test makes it easier to distinguish the plant’s
response from noise in the measurement channel. However, data collected during actual grid
disturbances help demonstrate the accuracy of the model when subject to uncontrolled
perturbations in a way that tests cannot. The intent is for the modeled and measured output to
agree for contingencies that occur in the field. Note that for small disturbance verification, only
those parameters that affect small disturbance behavior will be verified. Large disturbance
behavior invokes different model controls blocks and settings, and therefore large disturbances
are needed to truly verify these parameters using measurement data.
To isolate the behavior of the typical inverter in the plant, measurements may be taken at either
the terminals of the inverter or the generator step-upinverter pad-mount transformer. For plant-
level model validation purposes, measurements may be taken at either the point of
interconnection (POI) or the planthigh or low side of the substation transformer. In the context
of bulk system dynamics studies, the bandwidth of interest for the equipment models spans a
11 https://www.wecc.org/Reliability/DER_A_Final_061919.pdf

Solar Photovoltaic Power Plant Modeling and Validation Guideline
33
First Solar Proprietary & Confidential - Finance/Accounting/RND
range between approximately 0-5 Hz. Using a multiple of the Nyquist rate as a guide, the
sample rate of measurements used for model validation should ideally be 30 Hz or greater. For
phasor measurement units (PMUs), a sample rate of 60 Hz is preferred. In modern
implementations, PMU measurements are typically taken at both the primary and secondary of
the substation transformer(s). Digital Fault Recorders (DFRs) and PMU-capable DFRs can
capture valuable data for dynamic model validation as well.

Solar Photovoltaic Power Plant Modeling and Validation Guideline
34
First Solar Proprietary & Confidential - Finance/Accounting/RND
5.2 Defining the Mode of Operation
With the generic models developed by the REMTF, a central station solar PV plant can be
configured in over 30 unique modes of operation. Because there are a myriad of different ways the
models can be configured, selecting the appropriate model structure is a vital first step in the
parameter estimation process. Each unique model configuration corresponds to a particular control
scheme. Table 3 and Table 4 in the previous section provide a breakdown of commonly employed
reactive and real power control options respectively. Models should be developed, configured, and
tested to match the actual settings and equipment response installed in the field. Changes to control
mode should not be tested simply for verification of response, and then changed to different
settings for in-service operation.
Setting the REPC Model Flags
The plant controller module, REPC, has three control flags. The reference flag, refflag, selects either
plant-level voltage, or reactive power control or power factor control. If plant-level voltage control
is selected, the voltage compensation flag, vcmpflag, selects either voltage droop or line drop
compensation. The real power reference flag, frqflag, determines whether the real power output of
the plant is modulated to support system frequency and/or to maintain a constant plant-level real
power output.
1) Does the plant feature a plant-level controller?
• If yes, move on to Step 2. Otherwise, do not include the REPC_A module
in the dynamic model and skip ahead to 5.2.2.
2) What plant-level volt/var control is implemented?
• If plant-level voltage control, set refflag = 1.
• If plant-level reactive power control, set refflag = 0.
• If plant-level power factor control, set refflag = 2. 12
3) If plant-level voltage control is implemented, does it use line drop compensation?
• If yes, set vcmpflag = 1. If voltage droop compensation is implemented
instead, set vcmpflag = 0.
• With vcmpflag = 1, if the measured voltage is not compensated, set he
compensation resistance and reactance to zero, rc = 0 and xc = 0.
12 This is available in REPC_B and future REPC models.

Solar Photovoltaic Power Plant Modeling and Validation Guideline
35
First Solar Proprietary & Confidential - Finance/Accounting/RND
4) Does the plant modulate its real power output to support system frequency
and/or maintain a constant plant-level real power output?
• If yes, set frqflag = 1. Otherwise, set frqflag = 0.
• With frqflag = 1,
- if the plant responds to high frequency by reducing real power
output, set ddn to the actual plant downward frequency droop;
otherwise, set ddn = 0.
- If the plant responds to low frequency by increaing real power
output, set dup to the actual plant upward frequency droop;
otherwise, set dup = 0.
Setting the REEC Model Flags
The renewable energy electrical control model for solar PV systems, REEC, has four flags which
allow the user to fine-tune its control structure and select real or reactive power priority. The
combination of the power factor (pfflag), voltage (vflag), and reactive power (qflag) control flags
dictates the reactive power control scheme of the plant. For information on how to map a given
control scheme to a flag combination, please see Table 3.
The purpose of the current limit logic is to allow the plant to properly allocate its current capacity
upon saturation. Priority is given to either the active or reactive current com- mand depending on
the value of the current limit logic priority flag (pqflag). The first priority command is bounded
only by the current rating of the converter. Hence, the second priority command is bounded by
whatever capacity is leftover after generating the first priority command.
The instructions for how to set the REEC module flags are broken down into two sections, one for
plants with strictly local control (i.e., no plant controller) and one for plants with plant-level control.
Be careful to follow the correct procedure for the plant being modeled.
Strictly Local Control – No REPC Module
1) Does the plant regulate its output to maintain a constant local power factor?
• If yes, set pfflag = 1 and qflag = 0. Skip to Step 5.
• If no, set pfflag = 0. Go to Step 2.
2) Does the plant compute a reactive current command by dividing the reactive
power reference by a voltageregulate its output to maintain a constant
reactive power level (constant reactive power control or constant power

Solar Photovoltaic Power Plant Modeling and Validation Guideline
36
First Solar Proprietary & Confidential - Finance/Accounting/RND
factor control)?
• If yes, set qflag = 0. Skip to Step 5.
3) Does the plant regulate voltage at the terminal bus (local voltage control)?
• If yes, set vflag = 0 and qflag = 1. Skip to Step 5.
4) Does the plant operate in local coordinated Q/V or PF/V control using the series
PI loops depicted in Figure 11?
• If yes, set vflag = 1 and qflag = 1.
5) Does the plant operate in real or reactive power priority mode?
• For real power priority, set pqflag = 1. For reactive power priority, set
pqflag = 0.
Next section describes how to set the REEC parameter flags for central station solar PV plants with
plant-level control (i.e., the REPC module is included). This procedure is different because the mode
of operation and flag settings must be compatible across the REEC and REPC modules.
Plant-Level Control – Model Includes REPC Module
1) Set pfflag = 0. Local power factor control should not be used with the plant
controller module.
2) Does the Qref Volt/VAR output of the plant controller correspond to a
voltage reference?
• If yes, set vflag = 0 and qflag = 1. Skip to Step 6.
3) Does the Qref Volt/VAR output of the plant controller correspond to a
reactive power reference?
• If yes, set vflag = 1. Go to Step 4.
4) Does the plant employ local coordinated Q/V control using the series PI loops
depicted in Figure 11?
• If yes, set qflag = 1. Skip to Step 6.
5) Does the plant compute a reactive current command by dividing the reactive
power reference by a voltage?

Solar Photovoltaic Power Plant Modeling and Validation Guideline
37
First Solar Proprietary & Confidential - Finance/Accounting/RND
• If yes, set qflag = 0. In this configuration, the series PI loops depicted in
Figure 11 are bypassed.
6) Does the plant operate in real or reactive power priority mode?
• For real power priority, set pqflag = 1. For reactive power priority, set
pqflag = 0.
Setting the REGC Model Flags
The generator converter module, REGC, has one flag which enables or disables the Low Voltage
Power Logic (LVPL) feature. The lvplsw flag set to 1, together with brkpt, zerox and lvpl1, defines
an active current limit reducing from lvpl1 to 0 between voltage brkpt and zeroszerox.
Figure 1211: Low Voltage Power Logic
lvpl1
zerox brkpt V (p.u.)
Active Current Limit (p.u.)
1) Are both active and reactive current limits voltage-dependent?
• If yes, set lvplsw = 0 and use VDL blocks in REEC model for the voltage-
dependent current limits.
• If no, goto Step 2.
2) Is the active current limit voltage-dependent as illustrated in Figure 12Figure 11?
• If yes, set lvplsw = 1. Otherwise, set lvplsw = 0 and the VDL1 block in REEC
model may be used to represent piece-wise linear dependence of active
current limit on the voltage. After setting the model parameter flags as described in this section, check to ensure that the selected
flag combination corresponds to a valid mode of operation.
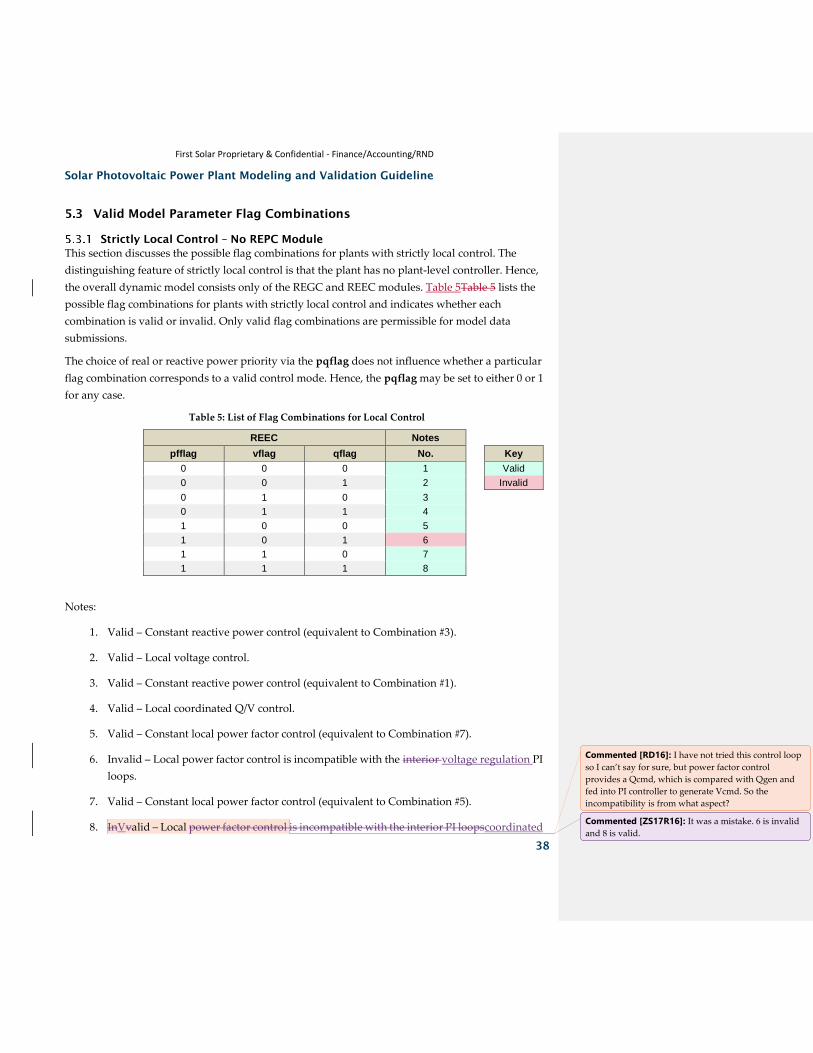
Solar Photovoltaic Power Plant Modeling and Validation Guideline
38
First Solar Proprietary & Confidential - Finance/Accounting/RND
5.3 Valid Model Parameter Flag Combinations
Strictly Local Control – No REPC Module
This section discusses the possible flag combinations for plants with strictly local control. The
distinguishing feature of strictly local control is that the plant has no plant-level controller. Hence,
the overall dynamic model consists only of the REGC and REEC modules. Table 5Table 5 lists the
possible flag combinations for plants with strictly local control and indicates whether each
combination is valid or invalid. Only valid flag combinations are permissible for model data
submissions.
The choice of real or reactive power priority via the pqflag does not influence whether a particular
flag combination corresponds to a valid control mode. Hence, the pqflag may be set to either 0 or 1
for any case.
Table 5: List of Flag Combinations for Local Control
REEC Notes
pfflag vflag qflag No. Key
0 0 0 1 Valid
0 0 1 2 Invalid
0 1 0 3 0 1 1 4
1 0 0 5
1 0 1 6
1 1 0 7
1 1 1 8
Notes:
1. Valid – Constant reactive power control (equivalent to Combination #3).
2. Valid – Local voltage control.
3. Valid – Constant reactive power control (equivalent to Combination #1).
4. Valid – Local coordinated Q/V control.
5. Valid – Constant local power factor control (equivalent to Combination #7).
6. Invalid – Local power factor control is incompatible with the interior voltage regulation PI
loops.
7. Valid – Constant local power factor control (equivalent to Combination #5).
8. InVvalid – Local power factor control is incompatible with the interior PI loopscoordinated
Commented [RD16]: I have not tried this control loop
so I can’t say for sure, but power factor control
provides a Qcmd, which is compared with Qgen and
fed into PI controller to generate Vcmd. So the
incompatibility is from what aspect?
Commented [ZS17R16]: It was a mistake. 6 is invalid
and 8 is valid.

Solar Photovoltaic Power Plant Modeling and Validation Guideline
39
First Solar Proprietary & Confidential - Finance/Accounting/RND
PF/V control.
Plant-Level Control – Model Includes REPC Module
This section discusses the possible flag combinations for plant-level control. Only valid flag
combinations are permissible for model data submissions. The overall plant model comprises three
modules: REGC, REEC, and REPC. The plant controller module contains three parameter flags:
refflag, vcmpflag and frqflag. A brief description of the REPC flags follows:
refflag — Determines whether the plant-level Volt/VAR control loop
regulates voltage (=1) or reactive power (=0)
vcmpflag — Determines whether the plant controller employs line drop
compensation (=1) or voltage droop (=0) when refflag = 1
frqflag — Determines whether the real power control functionality of
the plant controller is enabled (=1) or disabled (=0)
The position of the voltage compensation flag, vcmpflag, only has an impact when the plant-level
Volt/VAR control loop is regulating voltage (i.e., when refflag = 1). Although the value of vcmpflag
does not affect the validity of a flag combination, care must be taken to coordinate its setting with
the plant’s mode of operation and the REPC model invocation.
Table 6: List of Flag Combinations for Plant and Local Control
REEC REPC Notes
pfflag vflag qflag refflag No. Key
0 0 0 0 1 Valid
0 0 0 1 2 Invalid
0 0 1 0 3 0 0 1 1 4
0 1 0 0 5
0 1 0 1 6
0 1 1 0 7
0 1 1 1 8
1 0 0 0 9
1 0 0 1 10
1 0 1 0 11
1 0 1 1 12
1 1 0 0 13
1 1 0 1 14
1 1 1 0 15
1 1 1 1 16
0 0 0 2 17 0 1 0 2 18

Solar Photovoltaic Power Plant Modeling and Validation Guideline
40
First Solar Proprietary & Confidential - Finance/Accounting/RND
0 1 1 2 19
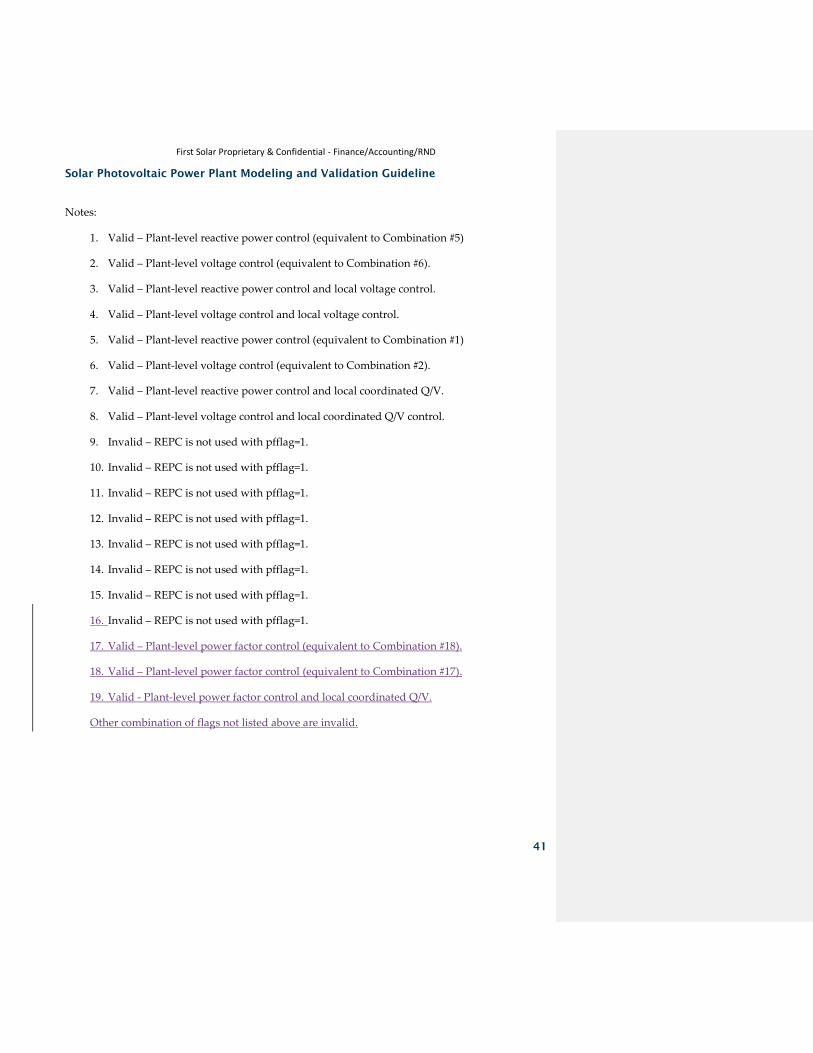
Solar Photovoltaic Power Plant Modeling and Validation Guideline
41
First Solar Proprietary & Confidential - Finance/Accounting/RND
Notes:
1. Valid – Plant-level reactive power control (equivalent to Combination #5)
2. Valid – Plant-level voltage control (equivalent to Combination #6).
3. Valid – Plant-level reactive power control and local voltage control.
4. Valid – Plant-level voltage control and local voltage control.
5. Valid – Plant-level reactive power control (equivalent to Combination #1)
6. Valid – Plant-level voltage control (equivalent to Combination #2).
7. Valid – Plant-level reactive power control and local coordinated Q/V.
8. Valid – Plant-level voltage control and local coordinated Q/V control.
9. Invalid – REPC is not used with pfflag=1.
10. Invalid – REPC is not used with pfflag=1.
11. Invalid – REPC is not used with pfflag=1.
12. Invalid – REPC is not used with pfflag=1.
13. Invalid – REPC is not used with pfflag=1.
14. Invalid – REPC is not used with pfflag=1.
15. Invalid – REPC is not used with pfflag=1.
16. Invalid – REPC is not used with pfflag=1.
17. Valid – Plant-level power factor control (equivalent to Combination #18).
18. Valid – Plant-level power factor control (equivalent to Combination #17).
19. Valid - Plant-level power factor control and local coordinated Q/V.
Other combination of flags not listed above are invalid.

Solar Photovoltaic Power Plant Modeling and Validation Guideline
42
First Solar Proprietary & Confidential - Finance/Accounting/RND
5.4 Dynamic Model Invocation Considerations
This section discusses important things to consider when selecting the correct dynamic model
invocation for a solar PV plant. A dynamic model invocation is an entry or series of entries in a
dynamic data file that specifies which modules will be employed to represent a plant and what their
respective parameters are. Model invocation conventions vary somewhat between software
platforms, so consult the appropriate user manual for guidance.
The precise details of the model invocation can affect the operation of the modules. For example, the
manner in which the plant controller module is invoked specifies which bus is regulated and which
branch is monitored. It is crucial to consider not only how the parameters of the REPC module are
populated, but how the model itself is invoked.
REPC Module Invocation Considerations
In the REPC module invocation, the user specifies which bus is regulated by the plant. In addition to
declaring which bus is regulated, the user has the option of specifying a monitored branch. For
central station solar PV plants, this branch is typically selected such that it reflects the total output of
the plant as measured on either side of the collector system equivalent.
The Ibranch, Pbranch, and Qbranch inputs to REPC seen in Figure 26Figure 23 are determined from
the flows on this branch. Hence, in order to model real and/or reactive power control at the plant-
level, a monitored branch must be specified. Notice that for plant-level voltage control, line drop
compensation is performed using the current magnitude on this branch and the user-specified
compensation resistance and reactance.
Key Points
• Define the terminal bus to which the equivalent generator/converter is connected.
• Define the bus that is regulated by the plant, if other than the terminal bus.
• Define the monitored branch from which the Ibranch, Pbranch, and Qbranch
inputs to REPC are derived.
Solar Photovoltaic Power Plant Modeling and Validation Guideline
43
First Solar Proprietary & Confidential - Finance/Accounting/RND
5.5 Populating Model Parameters
Once the field tuning of the controls is done, most of parameters in the generic models are fixed
and can be obtained from the Original Equipment Manufacturer or from the actual controller
settings. There are some parameters to be calibrated from the field test and the measured data as
the control block in the generic model may not have a direct association with an actual controller.
Before the generic model parameters are populated, it is essential to complete three key
prerequisites:
• Create a power flow representation of the plant as described in Section 2 of this
document.
• Define the mode of operation for the plant as discussed in Sections 5.2 and 5.3.
• Determine the correct dynamic model invocation for the plant based on the mode
of operation, the regulated bus, and the monitored branch as described in Section
5.4.
Unless these three prerequisites are successfully completed, the correct parameter values will still
not yield the desired model behavior.
After the power flow representation for the plant and the proper dynamic model invocation have
been established, it is time to begin populating the parameters of the dynamic model.
A plant’s mode of operation determines the model structure and which parameters have an impact
on its model behavior. Most of the parameters are fixed such as control deadbands, time constants,
error limit, ramp rate and etc. The tunable parameters are usually control gains. There are eleven
control gains in the three renewable energy modules. Table 7 categorizes those parameters
according to whether they affect real or reactive power. The columns of the table indicate whether
a parameter belongs to the electrical control module (REEC) or the plant controller (REPC). Very
few, if any, implementations should require all of these gains to be tuned. For example, the value
of kqv can be directly set from the inverter control implementation. If the voltage proportional
control under abnormal voltage condition is not implemented, kqv should be 0; otherwise, the
value from the field control tuning should be used. kqp and kqi are tuned if qflag is 1. kvp and
kvi are tuned if vflag is 1. The values of ddn and dup are also directly based on the field
implementation and would not require parameter tuning. Commented [ZS18]: Ask inputs from plant operator,
system operator, and manufacturer.

Solar Photovoltaic Power Plant Modeling and Validation Guideline
44
First Solar Proprietary & Confidential - Finance/Accounting/RND
Table 7: Tunable Control Gains
Real Power Reactive Power
REEC REPC REEC REPC
- kpg kqv kp
- kig kqp ki
- ddn kqi -
- dup kvp -
- - kvi -
Dynamic Model Parameter Sensitivity
In most circumstances, the control loops which affect a plant’s real and reactive power response
are independent of one another. As a result, a majority of the tunable parameters directly influence
either the real or reactive current command, but not both. An example of where this clear
delineation breaks down is when the converter’s output approaches its current rating. Under
saturation, the REEC current limit logic engages, and the active and reactive current commands are
allocated according to the limit scheme and the priority selection made with pqflag. However, the
real and reactive power responses can generally be tuned independently.
A plant’s dynamic response can be roughly divided into four components which characterize its
real and reactive power response to voltage and frequency variations respectively. The following
section aims to explain the key factors which influence each of those four elements. Along the way,
we will attempt to highlight the role of important model parameters.
Real Power Response to Voltage Variations
In the REEC electrical control module, the active current command is generated by dividing the
real power reference by the terminal voltage of the equivalent converter. This operation will cause
the real power response of the plant to be sensitive to voltage. The ability to tune this response
within REEC is limited. The key factors influencing a plant’s real power response to voltage
variations are the current limit logic in the REEC module and low voltage power logic in the REGC
module. These features should be set according to how a particular plant’s active current output is
limited in response to terminal voltage variations.
Key parameters: imax, VDL2 (REEC)
lvplsw, zerox, brkpt, lvpl1, lvpnt0, lvpnt1 (REGC)
Real Power Response to Frequency Variations
Many of the central station solar PV plants have the capability to control the active power output
to regulate frequency. This capability is required by FERC Order 842 on all the newly
interconnected solar PV plants. However, the solar PV plants typically do not preserve headroom

Solar Photovoltaic Power Plant Modeling and Validation Guideline
45
First Solar Proprietary & Confidential - Finance/Accounting/RND
for upward frequency regulation. The control is modeled in REPC module. Three of the key
parameters, frqflag, ddn and dup, are determined by the control implementation. Two control
gains, kpg and kig, shall be estimated to match the measurement data.
Key parameters: frqflag, kpg, kig, ddn, dup (REPC)
Reactive Power Response to Voltage Variations
The plant-level reactive power control loop and the majority of the REEC electrical control module
are dedicated to shaping a plant’s reactive power response to system voltage variations.
Everything discussed in Sections 5.2 to 5.4 about a plant’s mode of operation and its dynamic
model invocation will affect the relationship between reactive power and voltage.
Key parameters: kp, ki (REPC)
kqv, kqp, kqi, kvp, kvi, vdip, vup, qmax, qmin, imax, VDL1 (REEC)
Reactive Power Response to Frequency Variations
Solar PV inverters are designed such that their reactive power output is insensitive to system
frequency variations. Furthermore, there is no supplemental control loop which modulates
reactive power in response to frequency error. Hence, there are no key control features or
parameters that impact this element of a plant’s response.
Key parameters: Not applicable
Properly Coordinated Plant Control and Inverter Control
The majority of the controls represented by the generic models is about reactive power control. The
plant control loop, inverter PI control loops and the inverter proportional control shall be properly
coordinated through field tuning and accurately reflected in the models. In addition to the key
parameters above, the following parameters play an important role in modeling the control
coordination.
Key parameters: vfrz, qmax, qmin, kw (REPC)
vdip, vup, qmax, qmin (REEC)
Parameter Estimation Example
This section presents an example of a successful parameter estimation procedure. This case was
constructed using simulated data for purposes of demonstration. As such, the model data and
plant response are not associated with any specific solar PV plant. The necessary preliminaries
discussed in Section 5.5 were executed prior to beginning the parameter estimation procedure.
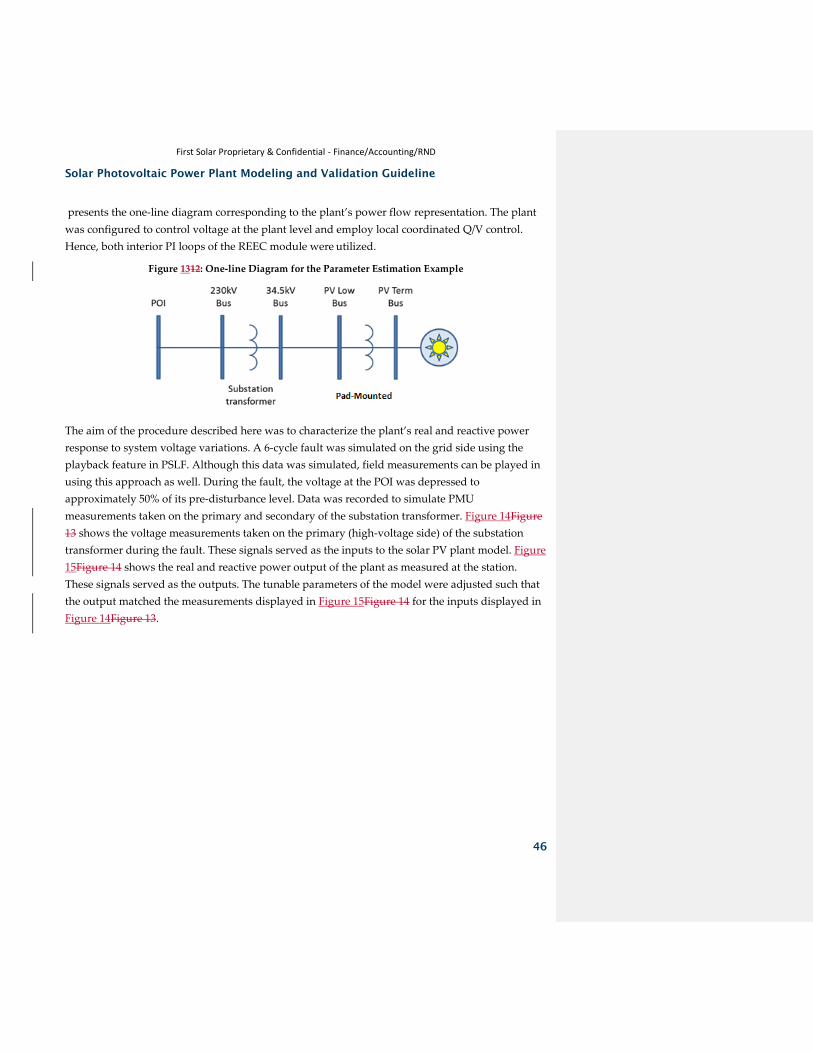
Solar Photovoltaic Power Plant Modeling and Validation Guideline
46
First Solar Proprietary & Confidential - Finance/Accounting/RND
presents the one-line diagram corresponding to the plant’s power flow representation. The plant
was configured to control voltage at the plant level and employ local coordinated Q/V control.
Hence, both interior PI loops of the REEC module were utilized.
Figure 1312: One-line Diagram for the Parameter Estimation Example
The aim of the procedure described here was to characterize the plant’s real and reactive power
response to system voltage variations. A 6-cycle fault was simulated on the grid side using the
playback feature in PSLF. Although this data was simulated, field measurements can be played in
using this approach as well. During the fault, the voltage at the POI was depressed to
approximately 50% of its pre-disturbance level. Data was recorded to simulate PMU
measurements taken on the primary and secondary of the substation transformer. Figure 14Figure
13 shows the voltage measurements taken on the primary (high-voltage side) of the substation
transformer during the fault. These signals served as the inputs to the solar PV plant model. Figure
15Figure 14 shows the real and reactive power output of the plant as measured at the station.
These signals served as the outputs. The tunable parameters of the model were adjusted such that
the output matched the measurements displayed in Figure 15Figure 14 for the inputs displayed in
Figure 14Figure 13.
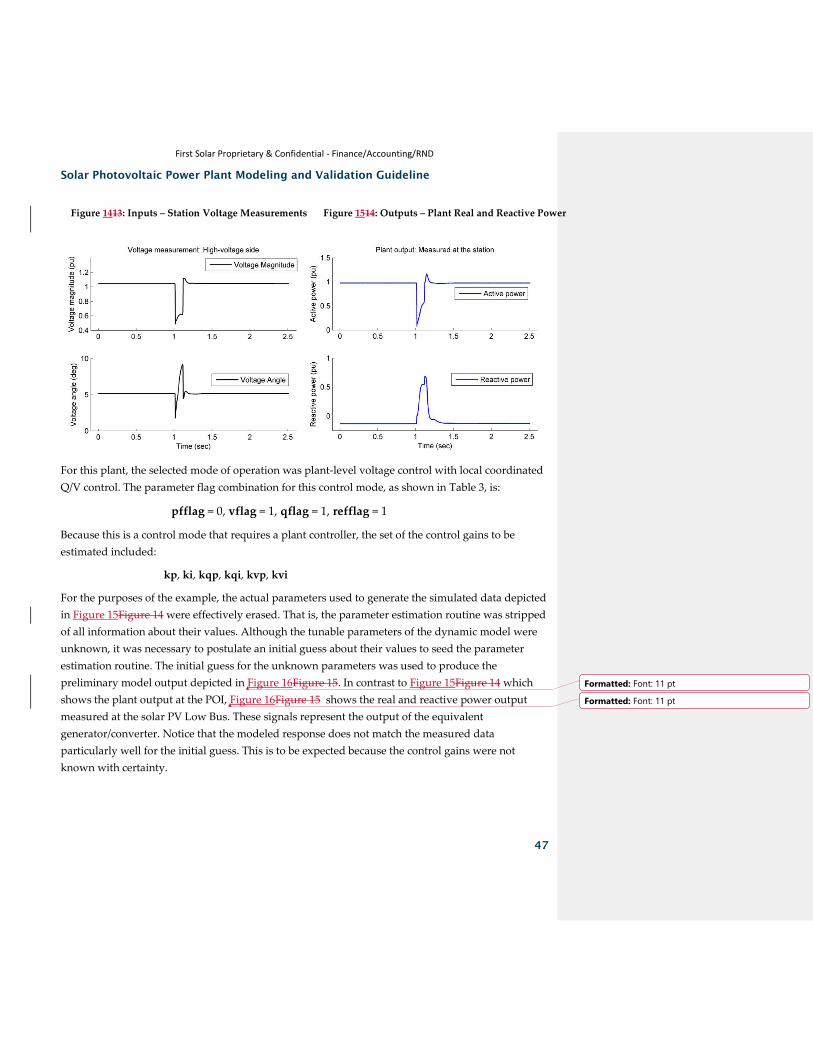
Solar Photovoltaic Power Plant Modeling and Validation Guideline
47
First Solar Proprietary & Confidential - Finance/Accounting/RND
Figure 1413: Inputs – Station Voltage Measurements Figure 1514: Outputs – Plant Real and Reactive Power
For this plant, the selected mode of operation was plant-level voltage control with local coordinated
Q/V control. The parameter flag combination for this control mode, as shown in Table 3, is:
pfflag = 0, vflag = 1, qflag = 1, refflag = 1
Because this is a control mode that requires a plant controller, the set of the control gains to be
estimated included:
kp, ki, kqp, kqi, kvp, kvi
For the purposes of the example, the actual parameters used to generate the simulated data depicted
in Figure 15Figure 14 were effectively erased. That is, the parameter estimation routine was stripped
of all information about their values. Although the tunable parameters of the dynamic model were
unknown, it was necessary to postulate an initial guess about their values to seed the parameter
estimation routine. The initial guess for the unknown parameters was used to produce the
preliminary model output depicted in Figure 16Figure 15. In contrast to Figure 15Figure 14 which
shows the plant output at the POI, Figure 16Figure 15 shows the real and reactive power output
measured at the solar PV Low Bus. These signals represent the output of the equivalent
generator/converter. Notice that the modeled response does not match the measured data
particularly well for the initial guess. This is to be expected because the control gains were not
known with certainty.
Formatted: Font: 11 pt
Formatted: Font: 11 pt

Solar Photovoltaic Power Plant Modeling and Validation Guideline
48
First Solar Proprietary & Confidential - Finance/Accounting/RND
For this example, the parameters were estimated using an optimization algorithm called the Nelder-
Mead method. The algorithm yielded a set of estimated (or optimized) parameters and the modeled
plant output generated with those parameters. The results of the parameter estimation routine are
summarized in Table 8Table 8. The table presents the initial guess at the tunable parameter values,
the actual values used to generate the data, and the estimated (or optimized) parameter values.
Because this example was created in simulation for demonstration purposes, the actual parameter
values are known with certainty. This allows us to assess how well the actual and estimated
parameters agree. For real-world scenarios, there is no master parameter set which represents the
“true” solution.
Table 8: Initial, actual, and optimized model parameters.
Model Param. Initial guess Actual Estimated
REPC Kp 15.0 10.0 10.9
Ki 1.0 5.0 4.3
REEC
Kqp 0.0 0.1 0.0
Kqi 0.0 0.1 0.0
Kvp 12.0 5.0 4.1
Kvi 2.0 1.0 1.2
Figure 1615: Initial Guess Output Comparison Figure 1716. Optimized Parameter Output Comparison

Solar Photovoltaic Power Plant Modeling and Validation Guideline
49
First Solar Proprietary & Confidential - Finance/Accounting/RND
The extent to which the modeled output matches the measured data in Figure 17Figure 16 is
representative of what is achievable using field data. The modeled output does not exhibit any
significant bias error, and it tracks the data well during the disturbance. While the aim of a
parameter estimation routine is to make the modeled output match measured data as well as
possible, it is unrealistic to expect an exact fit. If the modeled output matched the measured data
exactly, that would be an indication of overfitting. The intention is to track the physical response of
the plant and disregard the process noise.
In the case of model validation for solar PV plants, the criterion by which parameterizations are
judged is difficult to codify. Mathematical norms, such as the sum of squared error or the Euclidean
norm, can serve as useful metrics for describing how well the modeled output matches measured
data. That said, it is the opinion of the REMTF that it is counter-productive to attempt to reduce the
model validation criteria to a rigid mathematical definition. Model validation for power systems is
as much an art as a science, and engineering judgment plays a significant role in the process. As
such, this document does not prescribe any tests of goodness of fit which neatly separate “good”
model parameter sets from “bad.”
Importance of Power Flow Representation
The importance of a plant’s power flow representation was discussed in Section 2. To elaborate on
the subject, the figures below illustrate that a plant’s response is based on both its power flow
representation and its dynamic model. Figure 18Figure 17 shows the case in which the dynamic
model parameters and power flow representation match the master data precisely. Figure 19Figure
18 shows the case in which the dynamic model parameters match exactly, but the impedance of the
collector system equivalent is incorrect. This type of result could lead one to believe that the
dynamic model parameters are incorrect, when in reality it is the power flow representation that is
deficient.
Formatted: Font: 11 pt
Formatted: Font: 11 pt
Formatted: Font: 11 pt

Solar Photovoltaic Power Plant Modeling and Validation Guideline
50
First Solar Proprietary & Confidential - Finance/Accounting/RND
Figure 1817: Exact Fit Output Comparison Figure 1918: Bad Power Flow Model Output Comparison
Model Performance for Various Disturbances
A satisfactory solar PV plant model produces simulated output that matches measured data for an
array of different disturbances and power output levels, not just a select data set used to train the
model. A good practice is to reserve certain data sets and use them for model evaluation only,
meaning they are not used to tune the model parameters. When performing model validation using
multiple data sets, one must confirm that the plant’s mode of operation and control settings are
consistent across the different cases.

Solar Photovoltaic Power Plant Modeling and Validation Guideline
51
First Solar Proprietary & Confidential - Finance/Accounting/RND
6 FINAL WORDS
This guideline is intended to clarify the goals and requirements of the model validation process
rather than to serve as a rigid procedure. There are many different ways to arrive at a satisfactory
model parameterization for a central station solar PV plant; however, all successful approaches
have certain characteristics in common. Modeling a central station solar PV plant begins with
establishing an accurate power flow representation of the plant. Without one, it is very difficult to
accurately assess the performance of the dynamic model. Next, the plant’s mode of operation is
defined and the corresponding dynamic model invocation is specified. The generic models
developed by the REMTF possess tremendous flexibility, and the control structure must be
configured in a way that is consistent across the various modules. Because the dynamic model for
a solar PV plant contains between 45-75 parameters, it is critical to minimize the set of tunable
parameters by holding fixed as many of them as possible. Then, and only then is it appropriate to
adjust the parameters of the dynamic model to bring the modeled and measured output into
agreement. Irrespective of the method used to estimate the unknown parameters, sound
engineering judgment is required to discern a satisfactory dynamic model representation.

Solar Photovoltaic Power Plant Modeling and Validation Guideline
52
First Solar Proprietary & Confidential - Finance/Accounting/RND
7 Appendix
7.1 Short-Circuit Ratio Fundamentals
The ac system strength at a central station solar PV plant’s point of interconnection (POI) has a
significant impact on the interaction between the plant and the grid. For inverter- coupled
renewable generation plants, a simple measure of ac system strength is the Short-Circuit Ratio
(SCR). One component of this measure is the three-phase apparent power delivered to a short
circuit at the POI13. This quantity is given by,
𝑆𝐶𝑠𝑦𝑠(𝑀𝑉𝐴) ≝ 𝑎𝑐 𝑠𝑦𝑠𝑡𝑒𝑚 𝑠ℎ𝑜𝑟𝑡 𝑐𝑖𝑟𝑐𝑢𝑖𝑡 𝑀𝑉𝐴
𝑉𝑎𝑐 ≝ 𝑎𝑐 𝑣𝑜𝑙𝑡𝑎𝑔𝑒 𝑎𝑡 𝑝𝑙𝑎𝑛𝑡 𝑟𝑎𝑡𝑒𝑑 𝑝𝑜𝑤𝑒𝑟
𝑍𝑡ℎ ≝ 𝑎𝑐 𝑠𝑦𝑠𝑡𝑒𝑚 𝑇ℎ𝑒𝑣𝑒𝑛𝑖𝑛 𝑒𝑞𝑢𝑖𝑣. 𝑖𝑚𝑝𝑒𝑑𝑎𝑛𝑐𝑒
𝑉2
𝑆𝐶𝑠𝑦𝑠(𝑀𝑉𝐴) = 𝑎𝑐
𝑍𝑡ℎ
(Eq. 1)
The short-circuit MVA is an indicator of the Thevenin equivalent impedance looking into the grid
at the POI14. The short-circuit ratio is calculated by dividing the short-circuit MVA, defined in (Eq.
1), by the plant’s rated (maximum) real power output. Voltages on systems with a low SCR are
more sensitive to fluctuations in reactive power than those with a high SCR. Plants with a low SCR
(<3) tend to experience voltage stability problems, including, but not limited to: high dynamic
over-voltages, harmonic resonance, and voltage flicker. Reactive compensation in the form of
synchronous condensers or static VAR compensators (SVC) can help alleviate some of these
problems.
𝑃𝑟𝑎𝑡𝑒𝑑 (𝑀𝑊) ≝ 𝑝𝑙𝑎𝑛𝑡 𝑚𝑎𝑥 𝑀𝑊 𝑜𝑢𝑡𝑝𝑢𝑡
𝑆𝐶𝑠𝑦𝑠(𝑀𝑉𝐴) 𝑆𝐶𝑅 =
𝑃𝑟𝑎𝑡𝑒𝑑 (𝑀𝑊) (Eq. 2)
The generic models developed by the WECC REMTF and discussed in this document are
applicable for systems with a short circuit ratio of 3 and higher at the point of interconnection
(POI). These generic models are not intended to represent plants with very low short-circuit levels.
In such cases, detailed vendor-specific models may be required.
The SCR as defined above cannot be easily applied to a situation when multiple inverter-based
resources are connected electrically close. It can lead to overly optimistic results. Several methods
13 North American Electric Reliability Corporation (NERC), “Interconnection Requirements for Variable
Generation,” Special Assessment, September 2012.
14 P. Kundur, Power System Stability and Control, pp. 528-533, New York: McGraw-Hill, 1994.

Solar Photovoltaic Power Plant Modeling and Validation Guideline
53
First Solar Proprietary & Confidential - Finance/Accounting/RND
have been proposed to estimate system strength for groups of inverter-based resource connected
electrically close. For more information, refer to NERC Reliability Guideline for intergarting
inverters-based resources into low short circuit strength systems15.
15 https://www.nerc.com/comm/PC_Reliability_Guidelines_DL/Item_4a._Integrating%20_Inverter-
Based_Resources_into_Low_Short_Circuit_Strength_Systems_-_2017-11-08-FINAL.pdf
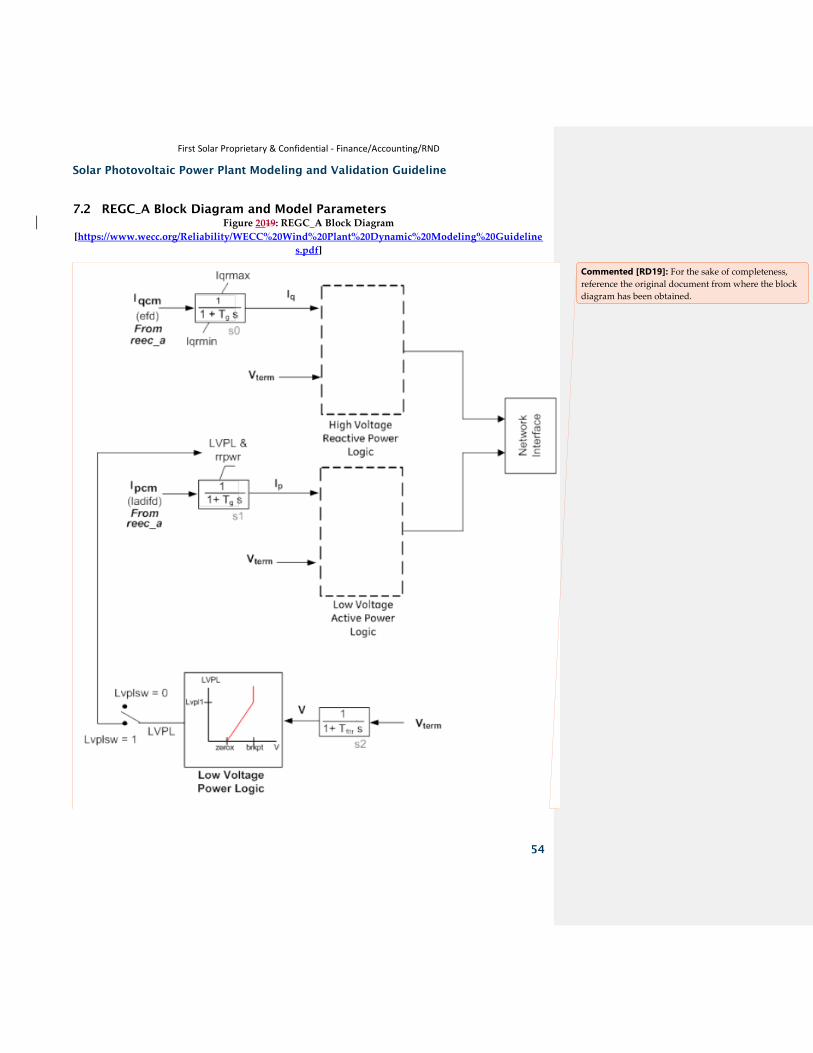
Solar Photovoltaic Power Plant Modeling and Validation Guideline
54
First Solar Proprietary & Confidential - Finance/Accounting/RND
7.2 REGC_A Block Diagram and Model Parameters
Figure 2019: REGC_A Block Diagram
[https://www.wecc.org/Reliability/WECC%20Wind%20Plant%20Dynamic%20Modeling%20Guideline
s.pdf]
Commented [RD19]: For the sake of completeness,
reference the original document from where the block
diagram has been obtained.

Solar Photovoltaic Power Plant Modeling and Validation Guideline
55
First Solar Proprietary & Confidential - Finance/Accounting/RND
The high voltage reactive power logic and low voltage active power logic are explained below.
Figure 2120: Instantaneous High Voltage Reactive Power Logic Flowchart
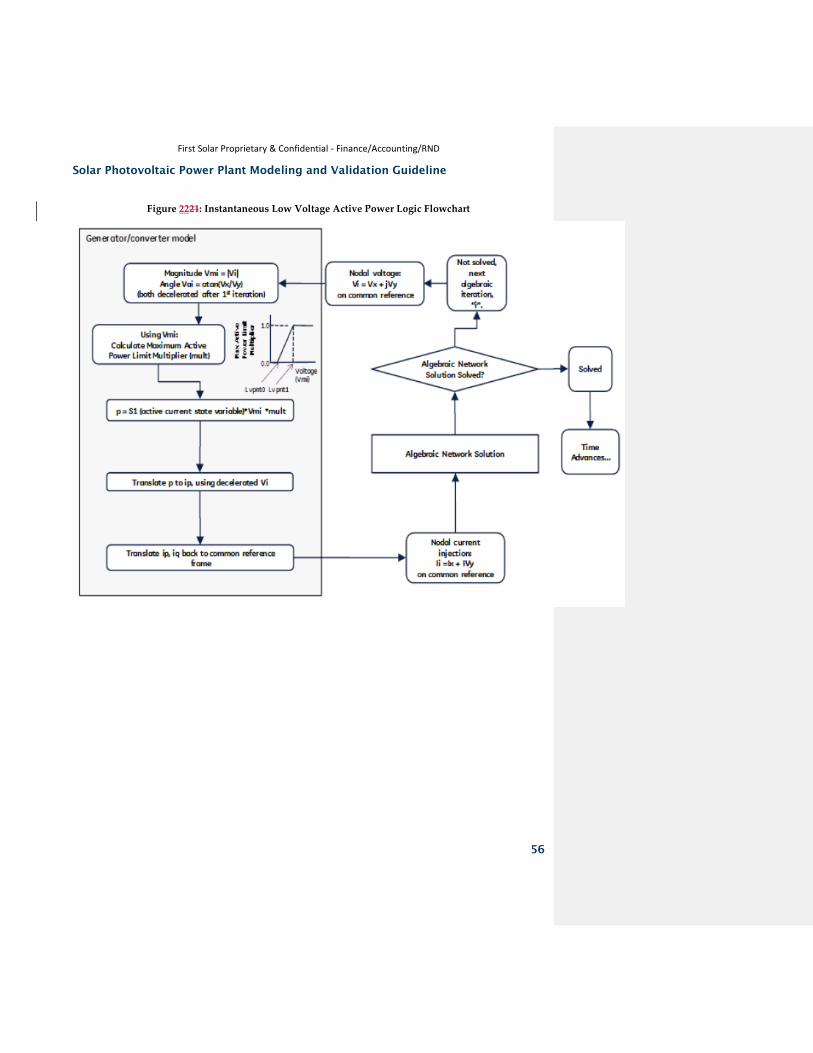
Solar Photovoltaic Power Plant Modeling and Validation Guideline
56
First Solar Proprietary & Confidential - Finance/Accounting/RND
Figure 2221: Instantaneous Low Voltage Active Power Logic Flowchart

Solar Photovoltaic Power Plant Modeling and Validation Guideline
57
First Solar Proprietary & Confidential - Finance/Accounting/RND
Table 9: REGC_A Input Parameters
REGC_A Input Parameters
Name Description Typical Values
lvplsw Enable (=1) or disable (=0) Low Voltage Power Logic, LVPL -
rrpwr Active current up-ramp rate limit on voltage recovery, p.u./sec. 10.00
brkpt LVPL breakpoint, p.u. 0.90
zerox LVPL zero crossing, p.u. 0.40
lvpl1 LVPL gain breakpoint, p.u. 1.22
vtmax Voltage limit in the high voltage reactive current, p.u. 1.20
lvpnt1 High voltage point for low voltage active current management, p.u. 0.80
lvpnt0 Low voltage point for low voltage active current management, p.u. 0.40
qmin Limit in the high voltage reactive current management, p.u. -1.30
accel High voltage reactive current management acceleration factor, p.u. 0.70
tg Inverter current regulator lag time constant, sec. 0.02
tfltr Terminal voltage filter (for LVPL) time constant, sec. 0.02
iqrmax Maximum rate-of-change of reactive current, p.u./sec. 999.00
iqrmin Minimum rate-of-change of reactive current, p.u./sec. -999.00
xe Generator effective reactance, p.u. 0.00

Solar Photovoltaic Power Plant Modeling and Validation Guideline
58
First Solar Proprietary & Confidential - Finance/Accounting/RND
7.3 REEC_A Block Diagram and Model Parameters
Figure 2322: REEC_A Block Diagram
[https://www.wecc.org/Reliability/WECC%20Wind%20Plant%20Dynamic%20Modeling%20Guidelines.pdf]
Table 10: REEC_A Input Parameters
REEC_A Input Parameters
Name Description Typical Values
mvab If mvab is less than or equal to zero, then the base used by regc_a is also used in reec_b
0.0
vdip Low voltage condition trigger voltage, p.u. [0.00, 0.90]
vup High voltage condition trigger voltage, p.u. [1.10, 1.30]
trv Terminal bus voltage filter time constant, sec. [0.02, 0.05]
dbd1 Overvoltage deadband for reactive current injection, p.u. [-0.10, 0.00]
dbd2 Undervoltage deadband for reactive current injection, p.u. [0.00, 0.10]
kqv Reactive current injection gain, p.u. 2.0
iqh1 Maximum reactive current injection, p.u. [0.00, 1.10]

Solar Photovoltaic Power Plant Modeling and Validation Guideline
59
First Solar Proprietary & Confidential - Finance/Accounting/RND
iql1 Minimum reactive current injection, p.u. [-1.10, 0.00]
vref0 Reference voltage for reactive current injection, p.u. 0.0
iqfrz Value at which Iqinj is held for thld seconds following a voltage dip event
thld Time delay associated with iqinj when voltage_dip is reset from 1 to 0, sec. –
If thld = 0, swtich SW is reset to position 0.
If thld > 0, switch SW is set to position 2 for thld seconds; then SW is reset to position 0.
If thld < 0, switch SW is held at position 1 for thld seconds; then SW is reset to position 0.
0.0
thld2 Time of holding the active current command after voltage_dip returns to 0, sec.
0.0
tp Active power filter time constant, sec. [0.02, 0.05]
qmax Maximum reactive power when vflag = 1, p.u. [0.00, 0.43]
qmin Minimum reactive power when vflag = 1, p.u. [-0.43, 0.00]
vmax Maximum voltage at inverter terminal bus, p.u. [1.05, 1.15]
vmin Minimum voltage at inverter terminal bus, p.u. [0.85, 0.95]
kqp Local Q regulator proportional gain, p.u. -
kqi Local Q regulator integral gain, p.u. -
kvp Local voltage regulator proportional gain, p.u. -
kvi Local voltage regulator integral gain, p.u. -
verf1 Inner-loop voltage control reference, p.u. 0.0
tiq Reactive current regulator lag time constant, sec. [0.02, 0.05]
dpmax Active power up-ramp limit, p.u./sec. 999.00
dpmin Active power down-ramp limit, p.u./sec. -999.00
pmax Maximum active power, p.u. 1.00
pmin Minimum active power, p.u. 0.00
imax Maximum apparent current, p.u. [1.00, 1.70]
tpord Inverter power order lag time constant (s) [0.02, 0.05]
pfflag Constant Q (=0) or local power factor (=1) control -
vflag Local Q (=0) or voltage control (=1) -
qflag Bypass (=0) or engage (=1) inner voltage regulator loop -
pflag Power reference flag (always set to 0 for solar PV plant) 0
pqflag Priority to reactive current (=0) or active current (=1) -
vq1 – vq4 Voltage breaking points for reactive current limit, p.u. -
iq1 – iq4 Voltage-dependent reactive current limit, p.u. -
vp1 – vp4 Voltage breaking points for active current limit, p.u. -
iq1 – iq4 Voltage-dependent active current limit, p.u. -

Solar Photovoltaic Power Plant Modeling and Validation Guideline
60
First Solar Proprietary & Confidential - Finance/Accounting/RND
Figure 2423: Illustration of VDL1
Figure 2524: Illustration of VDL2

Solar Photovoltaic Power Plant Modeling and Validation Guideline
61
First Solar Proprietary & Confidential - Finance/Accounting/RND
7.4 REPC_A Block Diagram and Model Parameters
Figure 2623: REPC_A Block Diagram
[https://www.wecc.org/Reliability/WECC%20Wind%20Plant%20Dynamic%20Modeling%20Guidelines.pdf]
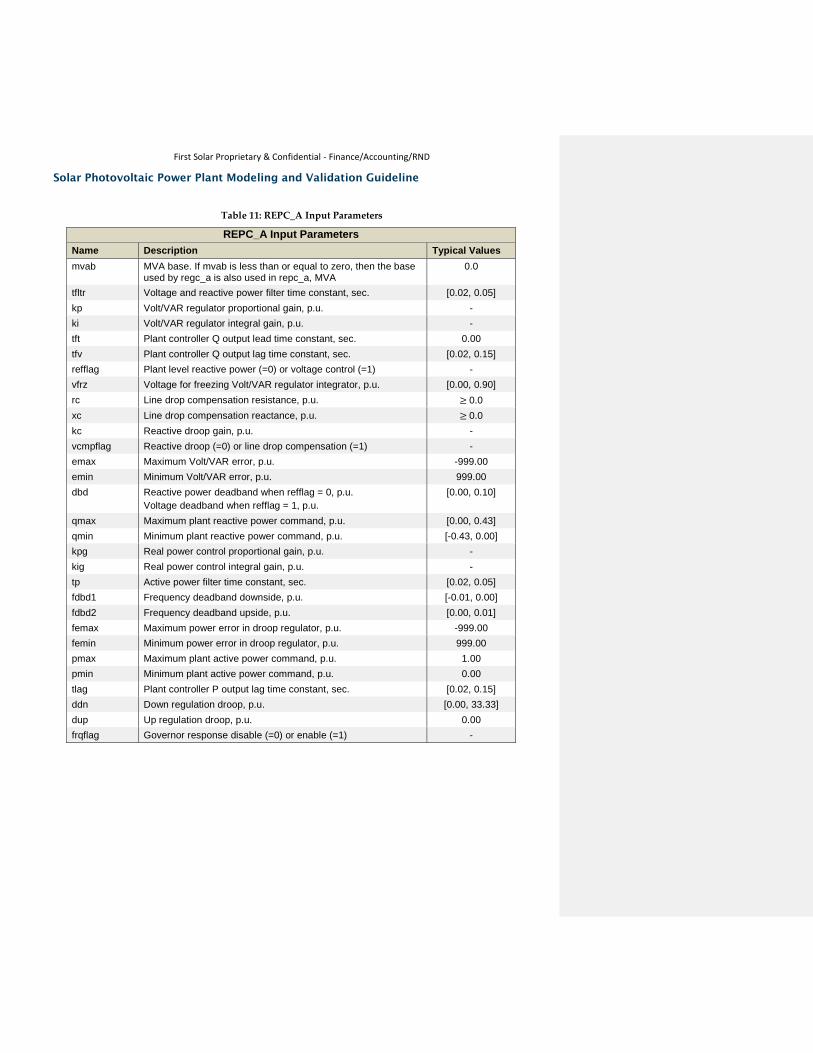
Solar Photovoltaic Power Plant Modeling and Validation Guideline
First Solar Proprietary & Confidential - Finance/Accounting/RND
Table 11: REPC_A Input Parameters
REPC_A Input Parameters
Name Description Typical Values
mvab MVA base. If mvab is less than or equal to zero, then the base used by regc_a is also used in repc_a, MVA
0.0
tfltr Voltage and reactive power filter time constant, sec. [0.02, 0.05]
kp Volt/VAR regulator proportional gain, p.u. -
ki Volt/VAR regulator integral gain, p.u. -
tft Plant controller Q output lead time constant, sec. 0.00
tfv Plant controller Q output lag time constant, sec. [0.02, 0.15]
refflag Plant level reactive power (=0) or voltage control (=1) -
vfrz Voltage for freezing Volt/VAR regulator integrator, p.u. [0.00, 0.90]
rc Line drop compensation resistance, p.u. ≥ 0.0
xc Line drop compensation reactance, p.u. ≥ 0.0
kc Reactive droop gain, p.u. -
vcmpflag Reactive droop (=0) or line drop compensation (=1) -
emax Maximum Volt/VAR error, p.u. -999.00
emin Minimum Volt/VAR error, p.u. 999.00
dbd Reactive power deadband when refflag = 0, p.u.
Voltage deadband when refflag = 1, p.u.
[0.00, 0.10]
qmax Maximum plant reactive power command, p.u. [0.00, 0.43]
qmin Minimum plant reactive power command, p.u. [-0.43, 0.00]
kpg Real power control proportional gain, p.u. -
kig Real power control integral gain, p.u. -
tp Active power filter time constant, sec. [0.02, 0.05]
fdbd1 Frequency deadband downside, p.u. [-0.01, 0.00]
fdbd2 Frequency deadband upside, p.u. [0.00, 0.01]
femax Maximum power error in droop regulator, p.u. -999.00
femin Minimum power error in droop regulator, p.u. 999.00
pmax Maximum plant active power command, p.u. 1.00
pmin Minimum plant active power command, p.u. 0.00
tlag Plant controller P output lag time constant, sec. [0.02, 0.15]
ddn Down regulation droop, p.u. [0.00, 33.33]
dup Up regulation droop, p.u. 0.00
frqflag Governor response disable (=0) or enable (=1) -

Solar Photovoltaic Power Plant Modeling and Validation Guideline
63
7.5 SAMPLE SOLAR PV POWER PLANT DATA REQUEST
This sample includes the basic modeling data request for solar PV plant. Each utility has its own data requirement, which might be more extensive.
1. One-Line Diagram. This should be similar to Figure 27Figure 24 below. Figure 2724: Sample One-Line Diagram
2. Interconnection Transmission Line.
• Point of Interconnection (substation or transmission line name):
• Line voltage = kV
• R = ohm or pu on 100 MVA and line kV base (positive sequence)
• X = ohm or pu on 100 MVA and line kV base (positive sequence)
• B = F or pu on 100 MVA and line kV base (positive sequence)
• R0 = ohm or pu on 100 MVA and line kV base (zero sequence)
• X0 = ohm or pu on 100 MVA and line kV base (zero sequence)
• Line normal rating = Amps or MVA
• Line emergency rating = Amps or MVA
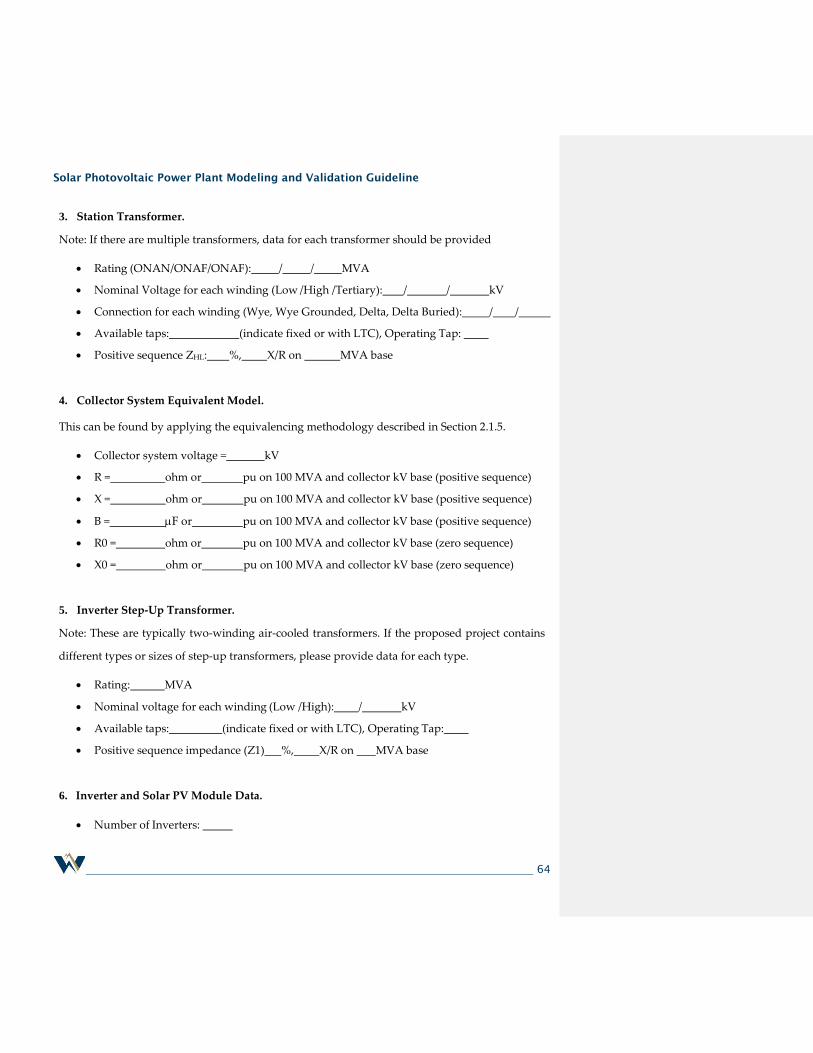
Solar Photovoltaic Power Plant Modeling and Validation Guideline
64
3. Station Transformer.
Note: If there are multiple transformers, data for each transformer should be provided
• Rating (ONAN/ONAF/ONAF): / / MVA
• Nominal Voltage for each winding (Low /High /Tertiary): / / kV
• Connection for each winding (Wye, Wye Grounded, Delta, Delta Buried): / /
• Available taps: (indicate fixed or with LTC), Operating Tap:
• Positive sequence ZHL: %, X/R on MVA base
4. Collector System Equivalent Model.
This can be found by applying the equivalencing methodology described in Section 2.1.5.
• Collector system voltage = kV
• R = ohm or pu on 100 MVA and collector kV base (positive sequence)
• X = ohm or pu on 100 MVA and collector kV base (positive sequence)
• B = F or pu on 100 MVA and collector kV base (positive sequence)
• R0 = ohm or pu on 100 MVA and collector kV base (zero sequence)
• X0 = ohm or pu on 100 MVA and collector kV base (zero sequence)
5. Inverter Step-Up Transformer.
Note: These are typically two-winding air-cooled transformers. If the proposed project contains
different types or sizes of step-up transformers, please provide data for each type.
• Rating: MVA
• Nominal voltage for each winding (Low /High): / kV
• Available taps: (indicate fixed or with LTC), Operating Tap:
• Positive sequence impedance (Z1) %, X/R on MVA base
6. Inverter and Solar PV Module Data.
• Number of Inverters:

Solar Photovoltaic Power Plant Modeling and Validation Guideline
65
• Nameplate Rating (each Inverter): / kW/kVA
• Describe reactive capability as a function of voltage:
• Inverter Manufacturer and Model #:
• Solar PV Module Manufacturer and Model #:
• [Note: This section would also request completed PSLF or PSS/E data sheets for the
generic solar PV library model(s) once they are available.]
7. Plant Reactive Power Compensation.
Provide the following information for plant-level reactive compensation, if applicable:
• Individual shunt capacitor and size of each: X MVA
• Dynamic reactive control device, (SVC, STATCOM):
• Control range MVAr (lead and lag)
• Control mode (e.g., voltage, power factor, reactive power):
• Regulation point
• Describe the overall reactive power control strategy: