solar ordinance feasibility study
TRANSCRIPT

Solar Ordinance Feasibility Study
A Study Finding If Mandatory Residential Solar Photovoltaics is Feasible
By Darya OreiziCity and Regional Planning B.S.
Advised by Chris Clark J.D.
California Polytechnic UniversityCity and Regional Planning Department
San Luis California
June 2015
A Study Finding If Mandatory Residential Solar Photovoltaics is Feasible
By Darya OreiziCity and Regional Planning B.S.
Advised by Chris Clark J.D.
California Polytechnic UniversityCity and Regional Planning Department
San Luis California
June 2015


Table of Contents
4
Executive Summary
Chapter One: Introduction
Chapter Seven: Implementation
Chapter Six: Cost/Benefit Analysis
Chapter Five: Cast Studies
Chapter Four: Proposed Solution
Chapter Three: Rules, Regulations, and Requirements
Chapter Two: The Solar System
Chapter Eight: Final Remarks
Appendices
References
Table of Contents
Solar Ordinance Feasibility Study
6
8
86
84
82
62
54
50
36
12
96
Ta
ble
of C
on
ten
ts
Table of Contents
5
Darya Oreizi

Executive Summary
Executive Summary
6
Solar Ordinance Feasibility Study
A solar ordinance is feasible. As simple as that statement is, the results from this comprehensive report find it to be true. Through looking at various sources and regulations, mandating solar for California cities is proven to be effective and necessary. Communities that require new residential to install solar benefit in many ways:
• Decrease greenhouse gas and air pollution emissions
• Increase job growth
• Decrease dependence on centralized grid
• Decrease water consumption
• Achieve several California air quality and energy mandates
In addition, the homeowner benefits in many ways:
• Decrease energy costs
• Increase home value
• Increase home marketability
Altogether, communities and homeowners unify in support of renewable energy—energy that is necessary for future healthy and sustainable cities. Both research and personal testimonies prove the effectiveness of homes that go solar.
This report explores these studies and identifies strengths and weaknesses of residential solar. In addition, this report summarizes and interviews the two California cities that have already mandated solar for new development. Both Lancaster and Sebastopol have shown the nation that it is feasible to require communities to install.
In hope of future cities following the footpath of Lancaster and Sebastopol, this report aims to reveal the path of how California cities can mandate solar photovoltaic for new residential development.

Exe
cu
tive
Su
mm
ary
Executive Summary
7
Darya Oreizi

Introduction
8
Chapter One: Introduction
Solar Ordinance Feasibility Study
Key Words: Greenhouse gas (GHG), Photovoltaic (PV)
“If you want to change the world, pick up the pen and write” –Martin Luther
Over the past few decades, electricity generation has become an increasing dilemma. The United States has invested billions of dollars in foreign fossil fuels to appease the American public. For a while, investing in foreign fossil fuels sufficed electricity user’s demand. The United States was able to produce or import enough energy that was required.
However, there was a catch. The United States invested so much into foreign energy that is was pulled into several wars and serious economic downfalls. In addition, climate scientists linked the correlation between burning fossil fuels and greenhouse gas (GHG) emissions to Climate Change—a global climate shift with negative implications on human and environmental health (“Climate Change”, 2015).
Negative effects of Climate Change are, but not limited to, rising sea level, increased heat waves, increased drought frequency, increased storms, and acidification of ocean (“Climate Change”, 2015).
Since the 1980s, California has led the nation in pursuing environmental and sustainable goals. For example, the State of California established a Renewable Portfolio Standard under Senate Bill 1078 in 2002. The Renewable Portfolio Standard requires investor-owned utilities (IOUs) to achieve 33% of energy sourced from renewable sources by 2020 (California Energy Commission, 2015).
Progressive mandates like the Renewable Portfolio Standard drive the State of California to be cleaner, healthier, sustainable, and energy secure. There are several other state laws that aim to direct private companies, utility companies, and the public to become less dependent on foreign energy and fossil fuel production. Laws such as Assembly Bill 32 direct Californian cities to decrease GHG emissions.
One way to decrease GHG emissions is through reducing fossil fuel production and increasing renewable

Intro
du
ctio
n
Introduction
9
Darya Oreizi
energy—an energy source that replenishes itself faster than consumption (California Energy Commission, 2015).
In 2001, California experienced massive blackouts statewide. Utility companies were unable to supply enough energy to the demand. Despite the California Public Utility Commission’s (CPUC) attempt to reduce the constantly increasing electricity rates, millions of Californians lost power for days. This event is known as the California Energy Crisis of 2001.
According to the Congress of the United States Congressional Budget Office, there were two problems that led to this disaster on the demand side: “Extreme weather and strong economic growth put stress on the market by increasing the use of power” (Congressional Budget Office, 2001). The California Energy Crisis of 2001 demonstrated the need for a change to the outdate electricity system. Due to high population increases each year, “California’s total electricity consumption has quadrupled since 1960” (Aroonruengsawat, 2009, p. 6).
To demonstrate the magnitude of the California electricity consumption: “California’s residential sector alone consumes as much electricity as Argentina, Finland, or roughly half of Mexico”
(Aroonruengsawat, 2009, p. 4). This means utility companies must constantly increase electricity generation each year. Capital costs and maintenance on power plants as well as resource extraction cause electricity rates to increase. During the crisis, California electrical rates were 75% higher than the average of 10 western states (Congressional Budget Office, 2001). The California Energy Crisis is one of many events that spark a need for change in how California generates electricity.
Alternative energy and decentralizing the energy grid is the solution. Rooftop solar has developed tremendously over the past few decades. In addition, there are many benefits of solar photovoltaic (PV) compared to traditional fossil fuels. Cities that mandate the installation of residential solar, decrease grid dependency on expensive power plants. In addition, the cost of electricity for the homeowner is reduced due to the simple conversion of sunlight into electricity—a carbon free process.
This study will explore the future of solar energy in an effort to meet various state requirements,

Intr
od
uctio
n
Introduction
10
Solar Ordinance Feasibility Study
decrease environmental degradation, improve energy security, increase municipality sustainability, and increase local health. The report will discuss how solar PV works, important agencies and companies involved, federal and state regulations on electricity, solar incentives and tax credits, case studies of cities that already have a mandatory rooftop solar ordinance, a cost-benefit analysis, and implementation suggestions.
Altogether, this report will examine the costs and benefits and feasibility of a municipal solar ordinance—an ordinance that requires new residential development to install specific amounts of solar energy through rooftop solar PV systems.

Intro
du
ctio
n
Introduction
11
Darya Oreizi

The Solar System
12
2.1 History of Solar Energy
2.2 How Does it Work?
2.3 Types of Solar Panels
2.3.1 Monocrystalline and Polycrystalline Silicon
2.3.2 Thin Film and Solar Shingles
2.4 Purchasing Options
2.4.1 Buy
2.4.2 Lease
2.4.3 Power Purchase Agreement
2.5 Invester-Owned Utility vs. Independent Power Producer
2.6 Current Energy Conditions
Chapter Two: The Solar System
Solar Ordinance Feasibility Study

Th
e S
ola
r Syste
m
The Solar System
13
Darya Oreizi
Key Words: Solar Cell, Solar Array, Investor Owned Utility (IOU), Power Purchase Agreement (PPA), Independent Power Producer (IPP), Renewable Energy Credit (REC)
2.1 History of Solar Energy
The energy from the Sun spawned life across millions of years on this planet. All organisms of all sizes rely on energy on Earth that is generated by the Sun. Without solar energy our planet could not exist (“Go Solar California”, 2015). Today, solar energy is most commonly harnessed on photovoltaic panels to produce electricity.
Despite the recent explosion of the solar industry, human societies have known about solar energy for thousands of years. Dating back to the Seventh Century B.C., civilizations used the sun’s power to heat objects through mirrors and lenses. This technology was spread through ancient Greek, Roman, and Chinese societies for various purposes, such as cooking, fire making, and bathhouses (“The History of Solar, 2015).
However, the advanced solar technology we know today was discovered in 1839. French scientist, Alexandre “Edmond” Becquerel, learned particular materials produce electricity when exposed to light (“Go Solar California, 2015). Edmond Becquerel discovered the
Photovoltaic Effect: “When light is absorbed by matter, photons are given up to excite electrons to higher energy states within the material” (“Photovoltaic Effect: An Introduction to Solar Cells”, 2015). Roughly 30 years later, scientist William Grylls Adams, and his apprentice, Richard Evans Day, discover the element Selenium has the characteristic to produce electricity when exposed to light.
After numerous experiments and contributions of other scientists in the same era, the first attempt at creating a photovoltaic cell was born. Photovoltaic means converting light (Photo means light in Greek) into voltage (Voltaic: coined by the scientist, Alessandro Volta, who discovered electricity) or electrical energy (“Go Solar California, 2015).

The Solar System
Th
e S
ola
r S
yste
m
14
Solar Ordinance Feasibility Study
Although the Selenium solar cell failed to convert enough electricity to power electrical equipment in 1876, the possibility of solar technology to power machines sparked interest of several scientists including Albert Einstein. Finally, in 1954, the first successful photovoltaic cell was born in the United States. Scientists Daryl Chapin, Calvin Fuller, and Gerald Pearson of Bell Telephone Laboratories designed a Silicon PV cell capable of converting sunlight into electricity to power everyday items, which initially consisted of 4% efficiency (“The History of Solar, 2015).
Efficiency is the ratio of total energy available to total harnessed and usable energy.
A year later, Hoffman Electronics-Semiconductor Division prepared the first commercial PV products, which was, “priced at $25 per cell, at 14 milliwatts each, or $1,785 per watt (in 1955 dollars) (“Go Solar California, 2015).
Soon solar technology went mainstream. With a demand of renewable energy for the Space Race and global energy insecurities from large wars, such as World War II, Vietnam, and the Persian Gulf War, the United States supported research in renewable energy.
Figure 2.1: Daryl Chapin, Calvin Fuller, and Gerald Pearson of Bell Telephone Laboratories creating solar photovoltaics. Sourced from “The History of Solar (2015)

Th
e S
ola
r Syste
m
The Solar System
15
Darya Oreizi
By the 1970s, scientists improved solar PV cell efficiency to 14%, and the price per watt decreased from $100 per watt to $25. The University of Delaware established the first solar technology dedicated laboratory and created Solar One—the first residence powered by solar during the day and purchases energy at night (“The History of Solar, 2015). However, like most new technology, advancements in solar technology could not happen without the support of the U.S. government.
In 1977, the United State’s Government formed the Department of Energy to oversee and regulate energy production and consumption (“The History of Solar, 2015). In 1978, Congress passed the Public Utility Regulatory Policy Act (PURPA). PURPA was created to allow Independent Power Producers (IPPs) to interconnect with the local utility provider. This act gave way to independent solar companies to sell PV systems to the public, whose PV systems would feed directly into the local energy infrastructure.
Additionally, Investor-Owned Utilities (IOUs) must buy energy produced by IPP at a regulated rate (“Go Solar California”, 2015). Also in 1978, due to the energy crisis of the 1970s from the Arab Oil Embargo and the U.S.-Iran hostage situation,
the federal government created the Energy Tax Act (ETA), which encouraged homeowners to invest in renewable technologies and reduce energy consumption. The ETA was the first of many government initiatives to encourage the public to shift away from an oil-dominated society to renewable technology.
By the early 1980s utility companies such as ARCO Solar and Solar One constructed industrial PV power plants in California. These large PV modules began producing 1-6 megawatts (MW) of electricity per year (“Go Solar California”, 2015).
By 1983 worldwide solar production exceeded 21.3 MW compared to mere 500 kilowatts (kW) in 1977 (“History of Solar”, 2015).
In 1996, California (already ahead of the United States in solar energy production) increased governmental support by enacting Assembly Bill 1890, signed by Governor Pete Wilson. AB 1890, “deregulated the state’s investor-owned electric utilities and created incentives for grid-tied PV systems under the

The Solar System
Th
e S
ola
r S
yste
m
16
Solar Ordinance Feasibility Study
California Energy Commission’s Renewable Energy Program” (“Go Solar California”, 2015).
The California Energy Commission’s Renewable Energy Program and the California Public Utilities Commission (CPUC) increased renewable energy production and encouraged large businesses to invest in solar technology, respectively (“California Renewable Energy Overview and Programs”, 2015). After 10 years AB 1890 was signed, CPUC and IOUs assisted large businesses to generate over 150 MW of renewable energy (“Go Solar California”, 2015).
Throughout the 1990s and 2000s, the United States continued investing in renewable technology. California, most notably, established several acts, assembly bills, and commissions (which will be discussed later in this report) to further increase solar energy production in the state.
Most famously, the California Solar Initiative (CSI), established in 2006, revolutionized solar energy incentives by providing affordable opportunities to purchase solar technology for millions of Californians. Just in the pilot year of the CSI, over 1,800 MW of solar
energy was produced (“Go Solar California”, 2015).
Today, solar PV cells are visible in nearly every Californian city. In 2014, the U.S. Department of Energy released the Annual Energy Outlook 2014—a report recapping all energy generation and consumption, electricity rates, and energy forecasts. According to the report, total solar energy production in 2012 was 7.58 gigawatts (GW) (Monthly Energy Review, 2015). In addition, the report found solar energy production has dramatically increased from 500 kW to 7.5 GW in roughly 30 years.
All in all, solar PV technology has a bright future.

Th
e S
ola
r Syste
m
The Solar System
17
Darya Oreizi
2.2 How does it work?
Despite the decades of years it took scientist to develop an efficient solar PV cell, converting sunlight into usable electrical energy is a fairly straightforward process. The abundance of sunlight consists of tiny particles called photons. PV panels are positioned so that they absorbed as many photons as possible. The more the PV cell is exposed to photons, the more energy is produced. This is why regions in California and Hawaii are the dominant solar energy producers in the nation.
Solar PV cells are made up of two semi-conductor layers, one being positive while the other being negative (“Photovoltaic Effect: An Introduction to Solar Cells”, 2015). The square-shaped solar cells are made up of silicon and other conductive materials.
When enough photons hit and are absorbed into the PV cell, electrons in the negative semi-conductive layer are released and sent to the positive layer (“Go Solar California”, 2015). This exchange in electrons causes a voltage difference between the two layers, similar to a battery. The energy produced from the conversion of the two semi-conductive layers is called a Direct Current or DC power.
Each cell only produces 1-2 watts. To increase voltage and amperage to the requested amount, solar cells are linked together. Linking cells together creates a module (or a panel). Connecting multiple modules together creates an array.
The type of electricity household items use is AC (alternating current) power, not DC (direct current) power (“Photovoltaic Effect: An Introduction to Solar Cells”, 2015). Therefore, invertors are installed to convert energy produced by the solar cells into AC power. There are two general types of invertors: micro-converters and central converters.
Micro-converters convert each individual solar panel’s energy while central converters convert the entire solar array’s energy. Micro-converters are more efficient in converting energy (5-25% more efficient) and are far more reliable as far as energy output (Maehlum, 2014). For example, sometimes solar panels reduce energy output because of less sunlight due to shade. Central converters can only convert a single range of electricity; therefore

The Solar System
Th
e S
ola
r S
yste
m
18
Solar Ordinance Feasibility Study
central converters decrease the wattage produced by the other panels in the array to the lowest producing panel. This can severely reduce the amount of energy produced. With micro-converters, each solar panel is converted individually. If one solar panel is broken or is not producing much energy, it will not affect the other panels like it will with central converters. Micro-converters are currently more expensive, but are becoming more affordable (“Which Solar Panel Type Is Best? Mono-, Polycrystalline or Thin Film?”, 2015).
2.3 Types of Solar Panels
Currently, there are four major types of solar panels used in the residential and commercial building industry. The four types of panels are Monocrystalline Silicon, Polycrystalline Silicon, Thin Film, and Solar Shingles. Depending on the region and solar provider, a homeowner may have an option of which type of solar panel to choose from.
2.3.1 Monocrystalline and Polycrystalline Silicon
Monocrystalline Silicon panels are distinguishable from Polycrystalline Silicon panels by their solid black color and rectangular shaped cells. Polycrystalline panels are a glossy blue color. Besides appearance, the major difference between the two lies in performance and cost.
Monocrystalline panels are more efficient (20-30% compared to Polycrystalline 15-25%) and are more space efficient (convert more energy in fewer panels). Monocrystalline panels are also more durable. However, Monocrystalline panels are more expensive than Polycrystalline panels.

Th
e S
ola
r Syste
m
The Solar System
19
Darya Oreizi
In addition, Monocrystalline reduce performance under intense heat and can short circuit when covered by dirt, snow, or shade, while Polycrystalline panels do not (“Which Solar Panel Type Is Best? Mono-, Polycrystalline or Thin Film?”, 2015).
Figure 2.2: Monocystalline Silicon. Sourced from EC21 (2015)
The Solar System
Th
e S
ola
r S
yste
m
20
Solar Ordinance Feasibility Study
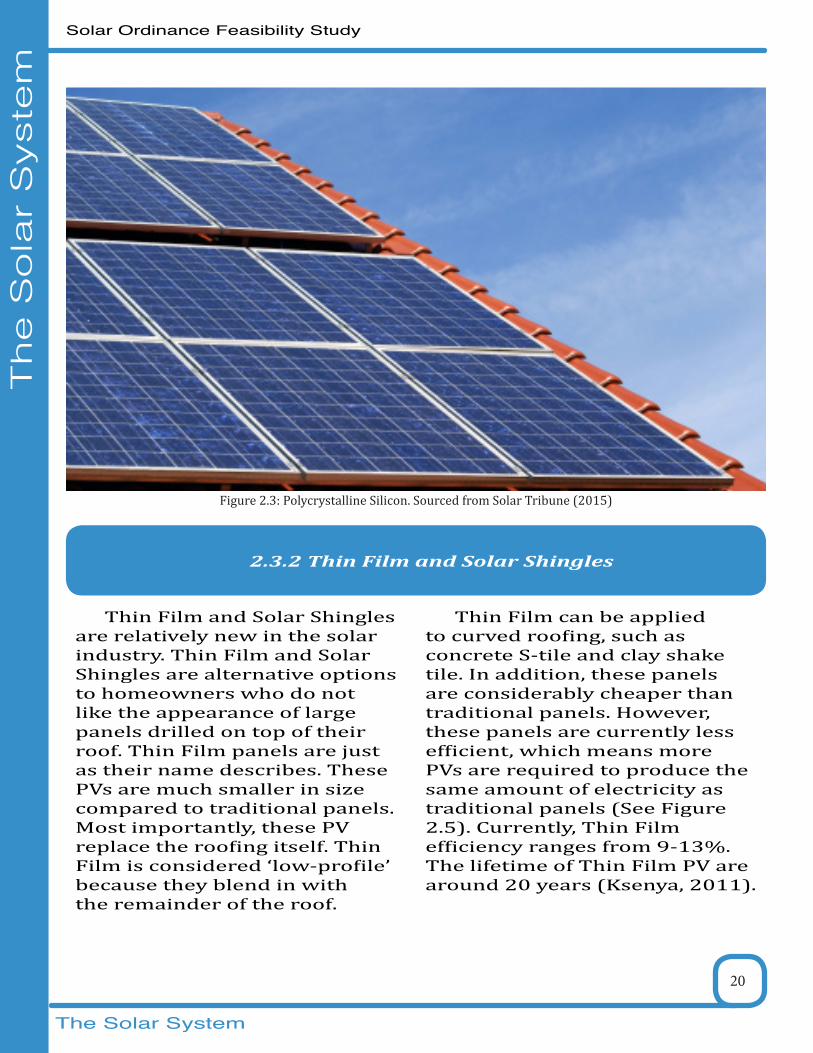
Figure 2.3: Polycrystalline Silicon. Sourced from Solar Tribune (2015)
2.3.2 Thin Film and Solar Shingles
Thin Film and Solar Shingles are relatively new in the solar industry. Thin Film and Solar Shingles are alternative options to homeowners who do not like the appearance of large panels drilled on top of their roof. Thin Film panels are just as their name describes. These PVs are much smaller in size compared to traditional panels. Most importantly, these PV replace the roofing itself. Thin Film is considered ‘low-profile’ because they blend in with the remainder of the roof.
Thin Film can be applied to curved roofing, such as concrete S-tile and clay shake tile. In addition, these panels are considerably cheaper than traditional panels. However, these panels are currently less efficient, which means more PVs are required to produce the same amount of electricity as traditional panels (See Figure 2.5). Currently, Thin Film efficiency ranges from 9-13%. The lifetime of Thin Film PV are around 20 years (Ksenya, 2011).

Th
e S
ola
r Syste
m
The Solar System
21
Darya Oreizi
Solar Shingles are very similar to Thin Film PV. Solar Shingles have the appearance similar to concrete tiles, which also give a ‘low profile’ look since they can replace existing roofing. Solar Shingles efficiency is around 9%, which is the smallest out of the three other types of solar PV. Again, reduced efficiency means more solar tiles are required to generate the same amount of energy as traditional panels (Kensya, 2011).
Figure 2.4: Thin Film. Sourced from Solar Tribune (2011)

The Solar System
Th
e S
ola
r S
yste
m
22
Solar Ordinance Feasibility Study
Figure 2.5: Solar Shingles. Sourced from Solar Tribune (2011)
Figure 2.6: Roof Area Needed in Square Feet. Source from Energy.gov (2015)
2.4 Purchasing Options
There are three types of financial options for purchasing a solar system on a residential roof: buy, lease, or power-purchase agreement (PPA). A homeowner decides on whether to buy, lease to own, or to sign a PPA based on numerous factors such as available capital, credit rating, and duration of planned residence (Sunrun, 2015).

Th
e S
ola
r Syste
m
The Solar System
23
Darya Oreizi
2.4.1 Buy
The first option for a homeowner is to install solar on his or her roof is to purchase. This option is ideal for maximizing the financial benefits. However, buying a solar system is the most expensive route to take. Typically, solar systems cost around $15,000-30,000 depending on available rebates and government incentives (“Should You Buy or Lease Your Solar Panel System?”, 2015).
Currently, rebates and tax credits can reduce system costs by about 50% and can reduce the amount of taxes owed. When designing a system for a home, installers considered annual electricity consumption (measured in kilowatt hours) and build a system to offset those demands. The goal is to zero out electricity costs per year. Of course panels do not produce energy during the night, so energy must be pulled from the grid. On the other hand, energy not used by the homeowner during the day is sent back into the grid. Off-grid systems include batteries to store energy during the night. This process will be discussed later in the report.
Additionally, homeowners who buy a solar system are eligible for Renewable Energy
Credits (RECs) (Rebates, incentives, and RECs will be discussed in depth later in this report) (Llorens, 2012).
If the initial capital is too much, a homeowner may choose to utilize a solar loan. Solar loans usually include the following characteristics: 5-20 year terms, credit rating of 650 or above, and 4-8% interest rate (“Should You Buy or Lease Your Solar Panel System?”, 2015). Incentives, location of house, and property characteristics (i.e. roof azimuth or amount of solar radiation) dictate the amount of return of investment from the solar system. Typically, solar systems yield a 10-30% rate of investment (ROI) (Sunrun, 2015).
A homeowner who buys, however, must maintain the system himself or herself. Solar systems, despite public opinion, require minimal maintenance. Panels usually last 30 years and only decrease efficiency .5-1% annually (National Renewable Energy Laboratory, 2015).

The Solar System
Th
e S
ola
r S
yste
m
24
Solar Ordinance Feasibility Study
2.4.2 Lease
The second option for a homeowner is to lease a solar system. Solar leases are great for homeowners who seek to maximize return, but do not have upfront capital. Leases can range from 15 years and upwards with payments increasing 3-5% per year. The upfront cost is relatively low, sometimes zero down, similarly to a PPA. Good credit rating is also required.
For additional energy that the solar system cannot produce, (similar to a homeowner who purchases an on-grid system) energy is
The third and final option for a homeowner is to sign a Power Purchase Agreement. PPAs are very similar to solar leases. Both include lengthy contracts, the solar installer monitors and maintains the system for the duration of the contract, and requires little to no money down upfront cost.
However, PPAs are unique and increasingly popular. A PPA is a contract between the host (homeowner) and the provider (solar company). The host agrees to a reduced
electrical rate compared to the existing utility company for anywhere from 6-25 years (Sunrun, 2015). The host, typically, is guaranteed a fixed, competitively-priced electrical rate, unlike most utility companies. The provider monitors and maintains the system for the duration of the contract. The host must have a good credit rating to qualify. Essentially, the major difference between a PPA and a lease is in a PPA the host only pays for the energy consumed from the panels, not for any panels, equipment, or
pulled from the grid. Therefore, there is still a relationship with local utility company. At the end of the lease, homeowners are able to purchase the system at a fair market value. Homeowners are not eligible for RECs (Llorens, 2012).
Typical solar leases save 10-50% on electricity expenditures at the end of the lease (“Should You Buy or Lease Yvour Solar Panel System?”, 2015).
2.4.3 PPA

Th
e S
ola
r Syste
m
The Solar System
25
Darya Oreizi
installation (SolarCity, 2015).
If the homeowner consumes more electricity than the provider acknowledges to sell, then the homeowner must pay the utility company for additional energy. This process is called a ‘True Up’ (Sunrun, 2015). At the end of the contract, the host has the option of buying the system at a fair market value (“Should You Buy or Lease Your Solar Panel System?”, 2015).
PPAs can save homeowners around 10-50% on electricity costs by the end of the contract (“Should You Buy or Lease Your Solar Panel System?”, 2015).
Solar energy is a viable option whether a homeowner decides to buy, lease, or sign a PPA. A popular misconception of solar energy is that a homeowner must pay high upfront costs, however, solar companies provide numerous financial options to accommodate this dilemma. Additionally, solar systems can be easily transferable to the next homeowner, depending on the solar provider. The next section will discuss the differences between Investor-Owned Utilities (IOU) and Independent Power Producers (IPP).
2.5 Investor-owned Utility vs. Independent Power Producer
There are two main types of electricity providers: Investor-Owned Utility and Independent Power Producer. There is a third type of service called Municipal-Owned Utility or Public-Owned Utility (POU), however there are very few of them in California. Both IOUs and IPPs generate and transfer electricity to the consumer. However, IOUs and IPPs differ vastly in the source of production as well as location of production.
The big three IOUs in California are Pacific Gas and Electric (PG&E), Southern
Edison Electric (SCE), and San Diego Gas and Electric (SDG&E) (“California Electricity Statistics & Data”, 2015). In 2012, the major three IOUs produced over 160,000 GWh (gigawatt hour) (“California Electricity Statistics & Data”, 2015).
After 2012, IOUs were granted a right for confidentially in electricity production till 2016. The major sources of energy for IOUS are fossil fuels, nuclear, large hydroelectric plants, and renewables

The Solar System
Th
e S
ola
r S
yste
m
26
Solar Ordinance Feasibility Study
Figure 2.7: PG&E 2012 Reported Electricity Source Portfolio. Sourced from Pacific Gas & Electric (2012)
Despite the abundance of energy production in California, 30% of total energy production is imported from the Pacific Northwest and the American Southwest. Once energy is produced or gathered, IOUs distribute the energy to its customers similarly to gas and water utilities (“California Electricity Statistics & Data”, 2015).
Customers are billed not just for how much they use, or generation costs, but also for transmission, distribution, and other various fees. Transmission and distribution
costs are sometimes more than generation costs (See Figure 2.8).
IOUs incorporate a Tier System for electricity rates. A Tier System charges a customer based on how much electricity is available per electrical rate. For example, PG&E uses a Four Tier System. These tiers can be visualized as buckets with a limited amount of energy in each. The first tier is the cheapest energy, usually around 13 to 15 cents per kWh; however, there is very little amount of this tier available. Once this
(See Appendix D). See Figure 2.7 for PG&E’s 2012 electricity source portfolio.

Th
e S
ola
r Syste
m
The Solar System
27
Darya Oreizi
Figure 2.8: Southern California Edison Billing Scheme. Sourced from Rocky Mountain Institute (2015)
tier is exhausted, customers must pay more for the next tier.
During the summertime when demand is high due to heat, customers dip into the fourth tier, the most expensive bucket, on a daily basis. For many IOUs, the second through fourth tiers can be very expensive compared to the first tier. Tiers three and four can cost as much as 38 cents per kWh.
Compared to the first tier, the third and fourth tier are nearly three times as expensive (Pacific Gas & Electric, San Diego Gas & Electric, Southern California Edison, 2015).
The other type of electricity supplier is an Independent Power Provider. The role of an IPP is to give residents alternatives to large corporate utility companies. In addition, IPP are typically renewable energy supplies—that is they supply energy sourced from solar, wind,

The Solar System
Th
e S
ola
r S
yste
m
28
Solar Ordinance Feasibility Study
or geothermal. IPP are most commonly solar PV providers. Within the past decade, the solar industry has skyrocketed.
According to a study by Solar Energy Industries Associations in 2014, there is over 17.5 GW of solar energy produced in the United States, with California leading the nation. Just in the year 2014, an estimated 6.5 GW of solar PV was installed, which is a 36% increase from 2013 (58% increase in residential PV from 2013 to 2014) (“Solar Industry Facts and Figures”, 2015). Essentially, every three minutes in the U.S. a solar system is installed on a roof. The quick and explosive growth in the solar industry not only benefits customers involved, but also the economy.
From 2012 to 2014, total employment in the solar industry has increased by 20% (“Solar Industry Facts and Figures”, 2015). The solar industry boom does not stop there. An estimated 8.2 GW and 12.1 GW of solar energy are expected to install in the U.S. in 2015 and 2016, respectively (“Solar Industry Facts and Figures”, 2015). Solar providers have become a major trend since the early 2000s.
Despite popular opinion, solar PV is affordable to the majority not because of government rebates and
incentives, but because of innovative financial strategies. In 2014, over 50% of residential PV systems were purchased without any state incentives. Solar companies managed this by offering residents affordable solar leases and PPAs. One of the largest dedicated residential solar provider in the United States, Sunrun, has doubled in size since last year due to pioneering the PPA system (Doom, 2014).
IPPs are becoming more and more popular as the solar industry grows. With help from the federal, state, and municipal governments, innovative financial strategies, and decreasing PV prices solar PV providers are capable of transforming the way people purchase electricity. Residents now have the option of choosing a cheaper, cleaner source of energy rather than forcibly purchasing energy from a monopolizing IOU.
The following section will discuss California’s current energy situation as it pertains to the need of renewable energy.

Th
e S
ola
r Syste
m
The Solar System
29
Darya Oreizi
2.6 Current Energy Conditions
The United States current and historical favored energy source is fossil fuels. In 2013, the United States relied on fossil fuels for 85% of its energy whereas only 20% for renewables (a mere 2.5% for solar) (“California Electricity Statistics & Data”, 2015). In California, the electricity source breakdown is roughly 52% for fossil fuels and 19% for renewables (again a mere 2% for solar) (“California Electricity Statistics & Data”, 2015).
In 2008, for the first time in national history, the U.S. spent over one trillion dollars on fossil fuels alone—more than military or education spending. On the same token, each year Americans spend more on electricity than the previous year (Figdor, 2009, p. 7).
Fossil fuel extraction and generation for energy purposes not only costs a large amount of money, but also includes devastating health impacts (fossil fuel impacts on health and the environment will be discussed later in this report).
For the past few decades, the U.S. used fossil fuels as the main source of energy despite the consequential economical and environmental hardships.
As mentioned previously in this report, the United States, specifically California, is in an energy crisis. Major energy emergencies cause electricity prices to dramatically increase. Unfortunately for Californians, energy crisis hit hard in California. Events such as the California Electricity Crisis of 2001, cause electricity rates to inflate due to high demand and stress on a 100-year-old energy infrastructure (“Understanding California’s Electricity Prices”, 2015). Since the 1970s, outdated transmissions, expensive energy resources, and monopolizing energy corporations increase electricity rates every year.
According to the U.S. Energy Information Administration (EIA), energy rates have increased 85% in the past 25 years (See Appendix E). Specifically, in 2004, the average cost for residential electricity was $8.95 kWh. In 2015, the average residential electricity rate has increased to $12.10 per kWh (“Independent Statistics and Analysis”, 2015).

The Solar System
Th
e S
ola
r S
yste
m
30
Solar Ordinance Feasibility Study
In addition, from 2008 to 2014, according to EIA (2015), residential retail price for electricity has increased 24% (“Independent Statistics and Analysis”, 2015).
The increase in electricity rates is also true for other sectors besides residential, such as commercial and industrial. For Californians, energy rates have increased nearly 65% since 2000 (See Figure 2.9). Essentially, energy rates are increasing 6% each and every year. Unfortunately, the price for energy is not expected to stop anytime soon (“Independent Statistics and Analysis”, 2015).
Figure 2.9: California Residential Electricity Monthly Pricing. Sourced from Energy Information Ad-ministration (2015)

Th
e S
ola
r Syste
m
The Solar System
31
Darya Oreizi
Energy rates are constantly increasing because of several factors. The three major factors are capital, fossil fuel extraction, and climate change costs. First, utility companies must maintain transmission lines, generators, and other grid related facilities (“Understanding California’s Electricity Prices”, 2015). Because of this, every homeowner is charged to maintain the infrastructure of the grid. As technology degrades from age, use, and weather the infrastructure must be replaced. This can cost utility companies large sums of money to fix.
In addition, utility companies must constantly increase electricity generation by building more power plants to keep up increasing demand.
According to EIA (2015), electricity demand has increased nearly 9% from 2001 to 2013.
Increase demand equates to further costs to increase generation.
Figure 2.10: Transmission lines. Sourced from Brown (2012)

The Solar System
Th
e S
ola
r S
yste
m
32
Solar Ordinance Feasibility Study
Second, the cost of fossil fuels is increasing (See Appendix G). The United States consumes 50% of its energy supply from coal, and increased fossil fuel production by 25% in 2008 alone (“Understanding California’s Electricity Prices”, 2015). Unfortunately, these fossil fuels are not cheap. Despite the annual price increase of fossil fuels, the U.S. government increases its fossil fuel subsidies each year.
A recent study discovered in 2008 that the U.S. government spent over 15 billion dollars each year on fossil fuel subsidies (See Figure 2.11).
Furthermore, the U.S. government subsides for fossil fuels increases each year. In 2013, the fossil fuel subsidy allotted to over $21 billion. These $21 billion dollars goes towards discovery, extraction, and production of fossil fuels into energy (Makhijani, 2014, p. 4).
Figure 2.11: Fossil Fuel Subsidies by the Federal Government. Sourced from Makhijani (2014)

Th
e S
ola
r Syste
m
The Solar System
33
Darya Oreizi
Third, climate change costs add additional fees to utilities and fossil fuel corporations. The U.S. government, despite heavily subsidizing fossil fuels, also charges fees for emissions related to fossil fuels. Carbon caps, limit for carbon dioxide (a greenhouse gas) per energy production, add costs to electricity rates. Fossil fuel producers must pay extra for emitting GHGs into the air. Therefore, the consumer pays extra for these additional fees.
In addition, the federal and state government have implemented several laws to direct the nation and state into producing more renewables and less fossil fuels. These laws and regulations force utility companies to disinvest from fossil fuels and invest in sustainable, clean energy sources. This process increases cost of electricity due to the capital required to re-create the 100-year old energy infrastructure we use today. Initially, these capital costs are high (currently 5-6% increase in costs), but as utility companies invest more and more into renewables renewable energy prices will decreases (“Understanding California’s Electricity Prices”, 2015).
Federal and state laws and regulations that shift energy sources from fossil
fuels to renewables will be discussed more thoroughly in a later chapter.
Fortunately for the solar industry, the price of electricity is increasing, and the price for solar is decreasing. For the first time, the cost for residential solar energy is affordable to the average American. In 1977, the price for residential solar PV was $76.67 per watt. In 2013, the price for residential solar PV was only $5.42 per watt (Cheeseman, 2014). The dramatic decrease in solar PV is the result of many years of scientific progress on panel efficiency, governmental support, and societal mainstream breaching.
According to The Energy & Policy Institute, 64% of a solar system cost is due to the installation, permitting, financing, and other non-hardware costs—not the panels themselves. Therefore, the price of solar panels is relatively inexpensive.
According to Sunshot, a program sponsored by the U.S. Department of Energy (DOE), residential PV systems have decreased in costs 6% to 7% each year from 1998-2013.

The Solar System
Th
e S
ola
r S
yste
m
34
Solar Ordinance Feasibility Study
Specifically, from 2012 to 2013 PV systems have decreased 12% to 15% in cost (Feldman, 2014, p. 5). Just in a one-year span, 2013 to 2014, a residential solar PV system less than 10 kW decreased cost from $4.74 to $4.50 per watt (costs include all hard and soft costs—hardware and installation). According to Solar Energy Industries Associations (SEIA) (2015), the average price for a solar system decreased 60% from 2011 to 2013 (“Solar Industry Facts and Figures”, 2015).
Numerous reports and studies prove residential solar, and even utility scale solar, is becoming more and more affordable (see Appendix C). In comparison to solar markets in other countries, solar in the U.S. is more expensive than many European nations. For example, in 2013 U.S. solar systems priced around $4.50 per watt while in Germany systems cost around $2.05 per watt. Despite the major price difference in other countries, the U.S. solar industry has made monumental strides in producing affordable, clean energy (Feldman, 2014, p. 5).
In addition, as mentioned previously, numerous financial options such as the PPA make residential solar an option for nearly every household.
Every year the U.S. EIA publishes its Annual Energy Outlook. The study provides energy and electricity projections for the nation that span the next few decades.
According to the 2014 report, electricity is expected to increase in cost for the next 30 years, the entire length of the projection, (see Appendix E)(“Independent Statistics and Analysis”, 2015).
In addition, the Annual Energy Outlook of 2014 estimated growth in electricity slows, but electricity-use increases 29% from 2012 to 2040 (see Appendix F). Increase in electricity cost and consumption combined with slow generation growth easily explains the current energy crisis. In other words, slow generations growth (or minimal increase of new power plants) and rapid consumption calls for an energy dilemma full of rate increases and blackouts. In California, reports predict fossil fuel expenditure will increase 10% from 2006 to 2030 (Figdor, 2009, p. 4). Increase in expensive fossil fuels creates more expenses for homeowners. Californians are already paying a large sum of their income on energy expenses.

Th
e S
ola
r Syste
m
The Solar System
35
Darya Oreizi
A recent study found households pay 9% of total household income on energy, most of which are from fossil fuels (Figdor, 2009, p. 7).
The future for California’s energy appears dim, but there is a bright, attainable solution: solar.

Rules, Regulations, and Requirements
36
Chapter Three: Rules, Regulations, and Requirements
3.1 Global Warming Solutions Act
3.2 California Public Utilities Commission
3.2.1 Renewable Portfolio Standard
3.2.2 Million Solar Roofs Initiative
3.2.2.1 California Solar Initiative
3.2.2.2 New Solar Home Partnership
3.3 Residential Solar Laws
3.3.1 Solar Rights Act
3.3.2 Solar Shade Control Act
3.3.3 Expedited Solar Permitting Act
3.4 Net Metering
3.5 Title 24
3.5.1ComprehensiveEnergyEfficiency Program for Existing Buildings
3.6 Climate Action Plan
3.7 California Zoning Law
Solar Ordinance Feasibility Study

Ru
les, R
eg
ula
tions, a
nd
Req
uire
men
ts
Rules, Regulations, and Requirements
37
Darya Oreizi

Rules, Regulations, and Requirements
38
Ru
les,
Reg
ula
tions,
an
d R
eq
uire
me
nts
Solar Ordinance Feasibility Study
Key Words: AB 32 (Global Warming Solution Act), RPS (Renewable Portfolio Standard), NEM (Net Energy
Metering), CAP (Climate Action Planning)
3.1 Global Warming Solutions Act
In 2006, Governor Arnold Schwarzenegger surprised the nation by leading California into war against GHG emissions. Governor Schwarzenegger and his staff signed the Global Warming Solutions Act, also know as Assembly Bill 32 (AB 32), in efforts to reduce GHG emissions to 1990 levels by 2020. AB 32 is enforced by the California Air Resource Board (CARB) and is the first comprehensive, statewide approach in the country that aims to decrease GHG emissions 15% below business as usual (“Assembly Bill 32 Overview”, 2015).
As stated on CARB’s website, climate change is the result of GHG released into the atmosphere. These gases include Ozone, Methane, and Carbon Dioxide. GHG are emitted from most human activity such as transportation, buildings, and industrial production. In the past century, humans have rapidly increase GHG emissions thereby speeding up climate change. Climate change has numerous, negative effects such as an increase in sea level, severe weather, extreme
heat, and drought. Overall, climate change damages global environments and societal well being (California Greenhouse Gas Emission Inventory: 2000-2012, 2014).
In addition to CARB, AB 32 is implemented by numerous California state agencies such as California Environmental Protection Agency, California Public Utilities Commission, and California Energy Commission. These agencies enforce AB 32 by reducing GHG related to the agencies’ agenda. Funding is provided by primarily GHG emission-based taxes. AB 32 goals are accomplished through the updating Scoping Plan.
The Scoping Plan lays out the groundwork of where and how California will decrease GHG emissions. In relation to this report, the energy industry is a major component of AB 32. The Climate Change Scoping Plan (2014) describes a, “set of actions the State is taking is driving down greenhouse emissions and moving us steadily in the direction of a cleaner energy economy.” (Climate Change Scoping

Ru
les, R
eg
ula
tions, a
nd
Req
uire
men
ts
Rules, Regulations, and Requirements
39
Darya Oreizi
Plan, 2014). In addition,
“California continues to be a global leader in energy efficiency… Renewable energy is rapidly coming down in cost and is already cost-effective in California for millions of homes and businesses, and in certain utility applications. Once thought of as exotic and alternative, renewable energy technologies have now become an integral part of California’s energy mix”. (Climate Change Scoping Plan, 2014)
Within the plan a Committee was formed to discuss long-term goals. Pertaining to the energy sector, the Committee
recommended a need to, “reduce its energy use and transition to 100 percent renewable energy” (Climate Change Scoping Plan, 2014). Once again, the Global Warming Solutions Act is one of the most robust and monumental laws in the world that is combatting climate change. Much of AB 32 is focused around cleaning the energy industry, especially electricity production. As a focus in AB 32, renewables, like solar, are the priority of California’s future electricity generation.
3.2 California Public Utilities Commission
The California Public Utilities Commission (CPUC) regulates utility companies’ generation, transmission, and distribution services. According to the CPUC, the Commission’s goal is to, “play a key role in making California a national and international leader on a number of energy-related initiatives designed to benefit consumers, the environment, and the economy” (“Investor-Owned Utility Solar Photovoltaic (PV) Programs”, 2015). In addition, CPUC implements its Energy Action Plan—a plan guiding the future of California’s energy production.
Initiated in 2003, due to the California Energy Crisis of 2001, and updated every few years, the Energy Action Plan calls for a number of changes to California’s electricity industry in compliance of AB 32 (2008 Energy Action Plan, 2008). Because 25% of California’s GHG emissions derive from electricity generation, the Energy Action Plan calls for a major change in the electricity industry. The plan set a number of goals to reduce energy consumption and increase usage efficiency in efforts to

Rules, Regulations, and Requirements
40
Ru
les,
Reg
ula
tions,
an
d R
eq
uire
me
nts
Solar Ordinance Feasibility Study
decrease GHG emissions and resource depletion. In essence, the state intends on vastly increasing renewable electricity production in the near future. As stated in the Energy Plan, “Renewable energy policy is a cornerstone of [California’s] approach to reducing greenhouse gas emissions in the electricity sector” (2008 Energy Action Plan, 2008).
As far as specific programs on how the state will accomplish said goals, the CPUC, Governor Jerry Brown, and Governor Schwarzenegger initiated and implemented two monumental renewable/solar programs: the Renewable
3.2.1 Renewable Portfolio Standard
In efforts to revolutionize the inefficient energy industry, California took the initiative to re-source its electricity production. One of the two major programs is the Renewable Portfolio Standard (RPS). Initially adopted in 2002 and later signed by Governor Schwarzenegger in 2008 under Executive Order S-14-08, the RPS requires all electricity utility companies to, “serve 33 percent of their load with renewable energy by 2020” (“Renewable Portfolio Standard”, 2015). Both the CPUC and the California Energy Commission (CEC) oversee
and implement the RPS. This aggressive state policy has made a serious change in how California obtains its electricity.
As of 2012, the major three IOUs produced just over 19% of their energy sources from renewables (Renewable Portfolio Standard Quarterly Report, 2014). The way these utility companies obtain eligible renewable energy for the RPS is organized by a three portfolio content categories (PCC). PCC 1 is from electricity generation contracts within state boarders. PCC 2 is from electricity generation contracts
Portfolio Standard and the California Solar Initiative.

Ru
les, R
eg
ula
tions, a
nd
Req
uire
men
ts
Rules, Regulations, and Requirements
41
Darya Oreizi
outside state boarders, but will match eligible RPS electricity into state boarders. PCC 3 is electricity purchased separately from underlying electricity, such as a solar service provider or a homeowner who owns his or her system. The amount of each PCC changes as time progresses. In 2017, utility companies must increase PCC 1 from 65% to 75% and decrease PCC 3 from 15% to 10% (Renewable Portfolio Standard Quarterly Report, 2014).
According to the Energy Action Plan (2008), California is right on target in accomplishing 30% renewable electricity generation by 2020. Since the creation of RPS in 2003, California has produced over 8,200 MW of renewables (Renewable Portfolio Standard Quarterly Report, 2014). In an interview with Angie Gould, a RPS Program Coordinator, Angie discussed the future of the RPS in California. Angie stated, “the governor (Jerry Brown) called for an increase in renewable generation to 50% by 2030, and we have seen several bills introduced in the State Legislature proposing a 50% RPS” (Angie Gould, personal communication, March 14, 2015).
Whether a 50% RPS will pass in the upcoming years is uncertain at the moment; however, the progress California
has made to change the electricity fuel source in the recent years is record breaking in the country.

Rules, Regulations, and Requirements
42
Ru
les,
Reg
ula
tions,
an
d R
eq
uire
me
nts
Solar Ordinance Feasibility Study
3.2.2 Million Solar Roofs Initiative
The second remarkable program California passed in efforts to decrease GHG emissions is the Million Solar Roofs Initiative, or Senate Bill 1 (SB 1) signed by Governor Schwarzenegger in 2006. SB 1 expanded the state’s California Solar Initiative (CSI) and New Solar Homes Partnership (NSHP). SB 1 spawned the Go Solar California! campaign, which is managed by CPUC and CEC. Both CPUC and CEC implement the CSI and NSHP programs. The Go Solar California campaign aims to install 3,000 MW of solar energy by the end of 2017 and place solar on 50% of new
homes by 2020 (“California Renewable Energy Overview and Programs”, 2015). As stated in the CEC Tracking Progress Report of 2014, “[the] goal of SB 1 was to transform the solar market such that solar energy systems are a viable mainstream option for both homes and businesses by 2017.
A key component of transforming California’s commercial and residential solar markets is the continued decline in prices of PV systems” (“California Renewable Energy Overview and Programs”, 2015).
3.2.2.1 California Solar Initiative
The California Solar Initiative offers incentives for solar power for IOU customers (including residential, commercial, government, and agriculture uses). The CSI has a budget of over $2 billion dollars from 2007-2016 with a goal to install over 1,900 MW of electricity (“About the California Solar Initiative (CSI)”, 2015).
As of March 2015, the CSI has installed nearly 700 MW of solar energy in the residential sector alone (“About the California Solar Initiative (CSI)”, 2015).
Since 2007, the CSI has installed solar PV systems on over 136,000 homes (“About the California Solar Initiative (CSI)”, 2015).

Ru
les, R
eg
ula
tions, a
nd
Req
uire
men
ts
Rules, Regulations, and Requirements
43
Darya Oreizi
3.2.2.2 New Solar Home Partnership
The CEC developed the New Solar Home Partnership in collaboration with the CPUC to further implement the CSI and overarching SB 1. The NSHP aims to install 360 MW of solar PV on new residential buildings by 2016 with special attention to low-income housing (“California Renewable Energy Overview and Programs”, 2015). This is implemented by offering residents a wide range of incentives to purchase solar systems. Total funding for the NSHP is $208 million with $28 million remaining
(“About the California Solar Initiative (CSI)”, 2015).
As of March 2015, the NSHP has contributed to over 40,000 systems producing 109 MW of electricity since the formation of the program in 2007 (“About the California Solar Initiative (CSI)”, 2015).
3.3 Residential Solar Laws
In 1978, California passed two acts that encourage residents of the California to install solar PV systems. Though the mainstream breakthrough of residential solar did not occur until 25 years after the two acts, the Solar Rights Act and Solar Shade Control Act became the cornerstones of California solar laws.
3.3.1 Solar Rights Act
As stated on the Go Solar California webpage, the Solar Rights Act of 1978 (AB 3250), “created a legal framework for solar access. The law includes protections to allow consumers access to sunlight (and prevent shading of systems) and to limit the ability of homeowner
associations (HOA) and local governments from preventing installation of solar energy systems” (“About the California Solar Initiative (CSI)”, 2015). Additionally, as stated in the California Civil Code Section 714 (a), “Any covenant, restriction, or

Rules, Regulations, and Requirements
44
Ru
les,
Reg
ula
tions,
an
d R
eq
uire
me
nts
Solar Ordinance Feasibility Study
condition contained in any deed, contract, security instrument, or other instrument affecting the transfer or sale of, or any interest in, real property that effectively prohibits or restricts the installation or use of a solar energy system is void and unenforceable” (“The California Solar Rights Act”, 2015).
3.3.2 Solar Shade Control Act
Furthermore, in 1978, California passed the Solar Shade Control Act in response to the California energy crisis of the 1970s. The original act banned trees or shrubs from blocking 10% of a solar PV system (“About the California Solar Initiative (CSI)”, 2015). Trees or shrubs that interfere with the solar panels line-of-sight of the sun subsequent to the installation of the system must be cut down.
In 2008, SB 1399 passed modifying the Solar Shade Control Act by requiring the building owner to notify surrounding neighbors about the solar system if he or she wishes to enforce the Act (“Solar Easement and the Solar Shade Control Act”, 2015).
The Solar Rights Act not only proved California was ready for a change in electricity production, but also gave way for many other state legislature actions promoting the use of solar energy.
3.3.3 Expedited Solar Permitting Act
In 2014, the Expedited Solar Permitting Act (SB 2188) modified the 30-year-old Solar Rights Act to enforce all municipalities to rapidly decrease the solar application process by implementing an ordinance by September of 2015. SB 2188 additionally mandates the ordinance to require the permitting process to no longer than three days
and the inspection process to no longer than two days after the request. The goal of SB 2188 is to streamline the previously exhausting application process in order to save the applicant time and money (“AB 2188 Implementation”, 2015).

Ru
les, R
eg
ula
tions, a
nd
Req
uire
men
ts
Rules, Regulations, and Requirements
45
Darya Oreizi
3.4 Net Metering
In late 2009, Governor Schwarzenegger signed AB 920. This bill requires California utilities to compensate customers using Net Energy Metering (NEM) over a 12-month period (Renewable Portfolio Standard Quarterly Report, 2014). NEM tracks a homeowner’s energy consumption as well as solar PV production. Since NEM is integrated with the standard electricity meter monitored by the local utility company, the process is very fluid.
Since a solar PV system’s production is influenced by inclement weather, time of day, and time of the year, the amount of energy produced is not constant. Similarly, a homeowner’s electricity consumption varies drastically
throughout the year for many reasons as well. With NEM, a homeowner can easily receive credits for energy produced that the household is not consuming. These credits are deducted from the consumption. In the past, homeowners with a solar PV system would not receive credit for energy not used by the household that is fed back into the grid.
With NEM, energy consumed is balanced by energy produced over a yearly basis—like rollover cell phone minutes. NEM allows households to zero out electric bills by appropriately sizing PV systems to annual usage history with the help of the rollover credits.
3.5 Title 24
Since 1977, the CEC have saved more than $74 billion through the Building Efficiency Program (Title 24) (“California Renewable Energy Overview and Programs”, 2015). The program reduces residential energy consumption through a number of home upgrades to increase energy efficiency. According to the 2013
Building Energy Efficiency Standards, adhering to the CEC’s implementation plan could reduce California’s electricity consumption by 613 GW hours per year (2013 Building Energy Efficiency Standards, 2012, p. 107). Within the plan are regulations on solar systems. In Section 110.10—

Rules, Regulations, and Requirements
46
Ru
les,
Reg
ula
tions,
an
d R
eq
uire
me
nts
Solar Ordinance Feasibility Study
Mandatory Requirements For Solar Ready Buildings, the document lays forth standards that must be met to grant ‘solar ready buildings’ (2013 Building Energy Efficiency Standards, 2012, p. 107).
3.5.1 Comprehensive Energy Efficiency Program for Existing Buildings
In addition to Title 24 requirement for residential building stock, AB 758, passed in 2009, furthers California’s will to increase home energy efficiency in efforts to reduce consumption and GHG emissions. AB 758 is administered by CEC with support from CPUC. Included in the program are strategies for cost-effective energy efficiency improvements and Green workforce training, such as solar installation (“AB 758”,
2015). Specifically, Section 1 (a) states, “ (1) The significant energy savings and greenhouse gas emission reductions inherent in the state’s existing residential and nonresidential building stock. (2) The need to establish a comprehensive energy efficiency program to capture these reductions (“AB 758”, 2015).
3.6 Climate Action Plan
In the recent years, cities across the U.S. have formulated plans to address Climate Change. As stated in Local Climate Action Planning, “In response to increasing evidence that climate change is occurring and has the potential to negatively impact human civilization, climate action plans are becoming the primary comprehensive policy mechanism for the reduction of greenhouse gas emissions
and for management of risks posed by climate change” (Boswell et al., 2012, p. XI). Climate Action Plans (CAPs) are strategies put forth by local governments to reduce GHG emissions. Strategies include implementation measures of various sectors such as Residential, Transportation, and Waste.

Ru
les, R
eg
ula
tions, a
nd
Req
uire
men
ts
Rules, Regulations, and Requirements
47
Darya Oreizi
For example, in terms of energy conservation, the City of Boston’s Climate Action Plan includes a Renewable Energy & Conservation Initiative, which includes numerous programs to switch to alternative fuels. One program, Renew Boston Solar, encourages and educations the public of Boston to switch to solar energy (“Renew Boston Solar”. 2015).
Additionally, The San Luis Obispo’s Climate Action Plan increases support of the City’s Conservation and Open Space Element of the General Plan which states, “Within new single-family residential projects of 20 or more dwelling units, 5% of the total number of dwellings shall be built with photovoltaic
solar collectors beginning in 2008; this percentage shall increase 4% each year until 2020” (City of San Luis Obispo, 2006).
Every CAP includes basic components: Introduction to Climate Change, GHG Inventory, GHG Forecasts, Emission Reduction Measures, Adaption Strategies, Implementation Strategies, and Monitoring Programs (Boswell et al., 2012). Although California law does not require CAPs, CAPs or Energy Plans do play an important role in reducing GHG emissions to 1990 levels by 2020 as mandated by AB 32.
3.7 California Zoning Law
Before adopting new legislature, municipalities must ensure the people and the courts the new law is benefitting the city or county. When dealing with land regulation, cities and counties execute their police powers, which include zoning standards and ordinances. Authors of Curtin’s California Land Use and Planning Law, Cecily Talbert Barclay and Matthew S. Gray, state, “The legal basis for all land use regulation is the police power of the city to protect the public health, safety, and welfare of
its residents” (Barclay, Cecily Talbert, and Matthew Gray, 2012, p. 1). While this serves as good definition of how police powers may be used, it still leaves much room for questioning.
Justice William O. Douglas of the United States Supreme Court explains in detail what exactly police powers can be used for in Berman v. Parker. Justice Douglas explains, “The concept of the public welfare is broad and inclusive…

Rules, Regulations, and Requirements
48
Ru
les,
Reg
ula
tions,
an
d R
eq
uire
me
nts
Solar Ordinance Feasibility Study
the values it represents are spiritual as well as physical, aesthetic as well as monetary. It is within the power of the legislature to determine that the community should be beautiful as well as healthy, spacious as well as clean, well balanced as well as carefully patrolled” (Barclay, Cecily Talbert, and Matthew Gray, 2012, p. 32).
Furthermore, the California Constitution Article XI § 7 explains, “[police powers] make and enforce within [their] limits all local police, sanitary and other ordinances and regulations not in conflict with general laws”.
Therefore, police powers are ‘elastic’ in their nature (Barclay, Cecily Talbert, and Matthew Gray, 2012, p. 2). Incorporating the use of police powers and land use regulations to support the local economy and public health, justified by the California Constitution, pronounces a mandatory solar ordinance is appropriate and just.

Ru
les, R
eg
ula
tions, a
nd
Req
uire
men
ts
Rules, Regulations, and Requirements
49
Darya Oreizi

Proposed Solution
50
Chapter Four: Proposed Solution
Solar Ordinance Feasibility Study
In response to rising electricity costs and consumption and degradation of the environment and public health, the remainder of the report will reveal how residential solar can greatly benefit communities throughout California. With increasingly affordable solar PV and the capabilities of municipalities, a mandatory solar ordinance is proposed for qualified California communities. A mandatory solar ordinance requires new and qualified existing residential development to install a set amount of solar on the roof or ground. This ordinance responds directly to the electricity problem by producing energy sustainable communities.
After an extensive research on solar PV and two case studies, the proposed mandatory solar ordinance is featured below:
City of ____________________
SECTION _____________
MANDATORY REQUIREMENTS FOR THE
IMPLEMENTATION OF SOLAR PHOTOVOLTAIC SYSTEMS
(a) Purpose and intent. It is the purpose and intent of this section to provide standards and procedures for builders of new residential dwelling units to install solar photovoltaic systems in
an effort to decrease energy costs and reliance to non-renewable energy. In addition, this ordinance will assist the city to implement
more renewable energy to be a more sustainable place to live.
(b) Applicability. These specific standards are applicable for all new residential dwelling units with a building permit
issuance date on or after _________________.
Exception: Accessory dwelling units.

Pro
po
se
d S
olu
tion
Proposed Solution
51
Darya Oreizi
(c) Provision of solar photovoltaic systems.
1. A builder shall provide solar photovoltaic systems for new homes in accordance with the energy generation requirements as listed in Section _______________ of the
_______________ Building Code. It is intended that no individual installed system shall produce less than 2.0 kW.
2. Installation of solar photovoltaic systems is not required for all homes within a production subdivision; however, the
builder shall meet the aggregate energy generation requirement within the subdivision (as calculated by the per-unit energy
generation requirement multiplied by the number of homes in the subdivision). For example, a subdivision with ten (10) homes that is required to provide 2.0 kW per unit would have an aggregate
energy generation requirement of 20 kW for the subdivision. The 20 kW energy generation requirement can be met with four (4) homes having solar energy systems generation 5 kW
each, or with eight (8) homes having systems generating 2.5 kW each. Multi-family development shall provide 1.0 kW per unit.
3. Homebuilders shall demonstrate through building plan check their intention to meet the solar
photovoltaic energy generation requirement.
4. Homebuilders shall build solar photovoltaic systems on model homes, reflective of the products
that will be offered to homebuyers.
5. If a tract is built in phases, the solar photovoltaic generation requirement shall be fulfilled for each phase, or release of homes.
6. Solar photovoltaic systems shall meet the development standards and guidelines as described
in the _______________ Building Code.
7. If there is not enough roof space, a ground mount system shall be installed within existing setbacks.
8. For any existing residential dwelling that remodels more than 50% of the floor plan must comply with this ordinance.

Proposed Solution
52
Pro
po
se
d S
olu
tio
nSolar Ordinance Feasibility Study
7. Solar photovoltaic systems for multi-family developments may be provided on rooftops, or on solar support/
shade structures, such as parking lot shade structures.
(d) Alternative methods of compliance. If site-specific situations make it impractical for a developer to meet the requirements of
this section, the developer may propose an alternative method of compliance with the intent of this section. An alternative method of compliance shall be approved where the building official finds that
the proposed alternative is satisfactory and complies with the intent of the provisions of this section. Alternative methods of compliance can include upgrading building materials or appliance so that energy efficiency is increased. The amount of upgrading must reduce 75% of energy consumption compared to standard energy efficiency code.
(e) Implementation costs. The homeowner shall assume all costs for the solar photovoltaic system including permits, installation, and hardware. The homeowner will be the sole
recipient of all rebates, tax credits, and renewable energy credits.
The proposed ordinance requires an average of 2 kW sized system per house because systems that size will either offset electricity demands and/or greatly reduces demand on the grid. Though a 2 kW system will only offset roughly 40% of the average homeowner’s annual consumption, this ordinance is a stepping-stone to creating energy smart communities. Due to constraints of resources, the commercial aspect was not analyzed. Alternative compliance and exclusions are suggested to allow flexibility to design and homes with difficult landscape and geographic location that inhibit solar reception.

Pro
po
se
d S
olu
tion
Proposed Solution
53
Darya Oreizi

Case Studies
54
Chapter Five: Case Studies
5.1 Lancaster
5.2 Sebastopol
Solar Ordinance Feasibility Study

Ca
se
Stu
die
s
Case Studies
55
Darya Oreizi

Case Studies
56
Ca
se
Stu
die
sSolar Ordinance Feasibility Study
5.1 Lancaster
In the early spring of 2013, Lancaster, California, a city of approximately 160,000 inhabitants, passed the nation’s first solar ordinance. Effective January 1st of 2014, the ordinance, set into the city’s building code, requires all new residential project to include solar PV in efforts to decrease reliance on fossil fuel energy. Despite the historical conservative background of Lancaster, including much of the city staff, Mayor Rex Parris took the initiative to procure alternative energy resources to better the well being of Lancaster.
In a news release in 2014, Mayor Parris stated, “Requiring solar power assets for new residential construction in the coming years will bring Lancaster one huge step closer to becoming the Alternative Energy Capital of the World, while providing new homeowners with earth-friendly and cost-effective benefits” (Shahan, 2014). In addition to claiming the ‘Alternative Energy Capital of the World’, Mayor Parris also aims to achieve zero-net energy buildings (buildings that produce more energy than they consume) before the CEC’s goal by 2020 and L.E.E.D. certified buildings in his city limits (Shahan, 2014).
According to Lancaster’s Code of Ordinances Chapter 15.28.020—Implementation of Solar Energy Systems (See Appendix B), solar ordinance pursues an aggregate approach—the sum of a residential project must achieve the required 1 kW system per house. In other words, if there are 10 houses being built for a project, not every house needs a minimum 1 kW system. Instead, the aggregate approach allows a 5 kW systems installed on two houses to average 1 kW for 10 houses. The ordinance also calls for the solar energy generation requirement installed for each phase if the residential project is a tract plan. For multi-family developments, solar PV may be installed in rooftops or parking shade structures. If the developer finds the site unsuitable for solar generation, the developer may propose an alternative solution to city staff. Alternative solutions may include off-site solar systems within city-limits (City of Lancaster, 2015).
Furthermore, the City of Lancaster also implemented “Solar Energy System Standards” in succession of the mandatory solar ordinance. Per Chapter 17.08.300—Solar Energy Systems, the zoning code

Ca
se
Stu
die
s
Case Studies
57
Darya Oreizi
identifies standards for solar systems in efforts to properly install systems to maintain aesthetic quality. For example, the Lancaster code prescribes standards for ground-mount systems such as the banning of installing such systems in the front yard or in any setbacks (City of Lancaster, 2015).
On April 9th, 2015, City of Lancaster Assistant Planner, Chuen Ng, was interviewed to discuss the mandatory solar ordinance. Chuen Ng, a former Cal Poly student, helped draft the ordinance in 2013. Ng explained how Lancaster was successful to implement the world’s first solar ordinance. Lancaster, located in North Los Angeles County, is optimal for solar energy. Since the past decade, Lancaster has experienced an abundance of solar permits coming through the public counter. Developers soon caught on to the trend and began offering solar as a standard option for homebuyers.
Ng commented on the process to adopting the ordinance, “Lets see if we [City of Lancaster] can make solar mandatory. We thought the timing was right” (Chuen Ng, personal communication, April 9, 2015). Ng explained every stakeholder was on board with the idea, which is critical for any city zoning change. The only party that was skeptical was the Planning
Commission; however, the State of California produced a solar PV cost-effectiveness analysis, which was used as justification for the Planning Commission. In addition, the cost-effectiveness analysis included increasing standards above the CEC building energy code.
Furthermore, Ng stated, “We were in the middle of updating our residential zoning standards”; therefore, the process to create a solar ordinance streamlined into a simple addition to the residential zoning standards (Chuen Ng, personal communication, April 9, 2015). Unlike the City of Sebastopol, the ordinance only covers the residential and not the commercial sector. This was due to the update of the residential zoning standards, which did not call for an update to the commercial sector. Therefore, there was a low cost to adopt an ordinance within the residential zoning.
When asked how Lancaster financially manages the solar ordinance, Ng replied, “The costs are all on the homeowner” (Chuen Ng, personal communication, April 9, 2015). Although the ordinance includes a flexible “Alternative Method of Compliance” section, Ng

Case Studies
58
Ca
se
Stu
die
sSolar Ordinance Feasibility Study
reported this option has yet to be used since adoption on January 1st, 2014. Since the beginning of 2014, over 120 homes have been incorporated into the solar ordinance (Chuen Ng, personal communication, April 9, 2015). When asked how other California cities could adopt their own solar ordinance, Ng replied, “Most importantly, you need support from stakeholders” (Chuen Ng, personal communication, April 9, 2015).
5.2 Sebastopol
Unlike Lancaster, Sebastopol becomes the first city in the nation to mandate solar PV for both residential and commercial new development. Enacted in 2014, the Sebastopol Municipal Code Chapter 15.72: Mandatory Photovoltaic System Requirements (See Appendix A) aims to reduce greenhouse gases, protect public health, and increase energy conservation (City of Sebastopol, 2015).
The ordinance has several components, exemptions, and alternatives. Buildings that qualify for the ordinance are new residential and commercial, remodeled commercial buildings where the remodel is greater than 1,800 square foot or greater than 50% of the original building, and
remodeled residential buildings where the remodel is 75% of the original building. Structures that fall into this category must install either 2 watts per square foot or offset 75% of annual energy consumption as determined by the building official. In acknowledgement to the built environment and natural landscaping, the City of Sebastopol offers exclusions to the solar ordinance. Structures that are excluded from the ordinance must pay an in-lieu fee or install alternative energy systems.
According to Chapter 15.72.050 of the Sebastopol Municipal Code, “Reasonable conditions may include the use of alternate energy systems, exceeding mandatory energy

Ca
se
Stu
die
s
Case Studies
59
Darya Oreizi
compliance standards by ten percent or other methods as determined” (City of Sebastopol, 2015). Owners of multiple properties may aggregate solar systems as long as the average energy load is offset according to the ordinance. In addition, owners with a previously installed solar system must update their system size to meet the new requirement.
On February 24, 2015, Sebastopol Building Official Glenn Schainblatt participated in an interview to discuss the solar ordinance. Glenn Schainblatt reported Sebastopol’s solar ordinance began through support of the City, volunteers, and Solar Sebastopol, a solar advocating group. Prior to the ordinance Sebastopol produced 1.3 MW of solar electricity in the past 10 years—an impressive feat for a small town of 7,500 people. This is a result of a long history of support from the city for solar energy.
When asked to explain the difficulties of establishing such an ordinance, Schainblatt replied, “It really wasn’t that hard to do. The Building Director and Mayor didn’t have much to do. A lot of people already were going solar. [The ordinance] just made it easier for the developer to install solar during construction of the building since it’s cheaper to do so” (Glenn Schainblatt, personal
communication, February 24, 2015). Schainblatt did remark that Sebastopol had to be flexible with one difficulty. Schainblatt said, “The tricky part is how to mitigate shade problems for subdivisions” (Glenn Schainblatt, personal communication, February 24, 2015).
Since subdivisions do not always produce perfectly oriented homes for solar production, the solar ordinance had to be flexible. Therefore, Sebastopol incorporated exceptions for homes or commercial buildings that could not feasibly install solar such as geothermal mitigations, upgrade appliance energy efficiency, or reduction in building’s energy consumption.
If all else fails, an in lieu fee is available; however, Schainblatt reported this option has never been applied. Schainblatt reported the only financial commitment the city has to commit is the permit fees. Besides those fees, the homeowner assumes the cost of the system. “This adds $20,000 to $30,000 to a single family house”, Schainblatt reports (Glenn Schainblatt, personal communication,

Case Studies
60
Ca
se
Stu
die
sSolar Ordinance Feasibility Study
February 24, 2015).
When asked how other cities couldmodel an ordinance similar to Sebastopol’s, Glenn replied, “The key to success is flexibility. It’s not always going to work for some lots. The overarching goal is reducing energy consumption” (Glenn Schainblatt, personal communication, February 24, 2015).

Ca
se
Stu
die
s
Case Studies
61
Darya Oreizi
Cost/Benefit Analysis
62
Chapter Six: Cost/Benefit Analysis
6.1 Costs
6.1.1 Hazardous Materials
6.1.2 Increase Cost of Home
6.1.3DifficultRegions/Lots
6.1.4 Inclement Weather
6.2Benefits
6.2.1Incentives,Rebates,andTaxCredits
6.2.2SystemLifetimeSavings
6.2.3 Improved Environmental Conditions
6.2.3.1PublicHealth
6.2.3.2WaterResources
6.2.4TrueCostofElectricity
6.2.5JobGrowth
6.2.6 Increase Value of Home
Solar Ordinance Feasibility Study

Co
st/B
en
efit A
naly
sis
Cost/Benefit Analysis
63
Darya Oreizi

Cost/Benefit Analysis
Cost/
Be
ne
fit
An
aly
sis
64
Solar Ordinance Feasibility Study
This chapter discusses the costs and benefits of implementing a solar ordinance by analyzing numerous factors such as cost of electricity by source, added home cost, environmental conditions, and more. After examining the costs and benefits of a solar ordinance, a final conclusion will be made to determine how feasible it is to implement such ordinance for other California cities. The figure below displays the general cost/benefit results (See Figure 5.1).
Figure 5.1: Cost-Benefit Analysis of Residential Solar Photovoltaic
Co
st/B
en
efit A
naly
sis
Cost/Benefit Analysis
65
Darya Oreizi
6.1 Costs
Costs are categorized as negative implications from mandating solar PV on rooftops.
6.1.1 Hazardous Materials
Despite how solar is a ‘clean’ energy source, there are still related hazardous materials used in the production of the PV panels. Like every other manufacturing process, toxins and environmentally harmful waste are produced. Specifically, the solar PV manufacturing process involves some foul agents such as sulfur hexafluoride (a powerful greenhouse gas), hydrochloric acid, sodium hydroxide, and arsine gas (“Solar Industry Facts and Figures”, 2015).
The U.S. government regulates factories in the country for health and safety precautions to ensure none of these chemicals are exposed to anyone or anything. In addition, dealing with old panels can be burdensome. Since they include toxic materials, throwing them away in landfills can be dangerous to the environment. Similar to car batteries, PVs must be treated with care after use.
Some PV manufacturing companies accepted the
challenge and are now producing 100% recyclable panels. Solar PV manufacturer Suntech’s panels are completely recyclable because 85% of the materials are from recycled sources (Hales, 2014).
Furthermore, at the end of a PV panel’s life it must be disposed properly. According to the Federal Conservation and Recovery Act, waste must pass a test to determine if it is ‘hazardous waste’ or not. Solar Energy Industries Association reports most panels pass this test thereby are not classified as ‘hazardous waste’ (“Solar Industry Facts and Figures”, 2015).

Cost/Benefit Analysis
Cost/
Be
ne
fit
An
aly
sis
66
Solar Ordinance Feasibility Study
6.1.2 Increase Cost of Home
Assuming the solar ordinance relies on the homeowner to pick up the tab for the solar system, the cost of the home will increase for future homebuyers. In an interview with Sebastopol Building Official Glen Schainblatt, Glen reported implementing a solar ordinance increases the cost of a new home around $20,000 to $30,000 (Glenn Schainblatt,
personal communication, February 24, 2015). This additional cost includes installation and hardware. Future homeowners that are already stressed on finances may be dismayed by a city or county mandating solar to all new homes, especially if the price of the home increases over $20,000.
6.1.3 Difficult Regions/Lots
Occasionally, certain regions/lots are unable to ‘go solar’ due to various environmental factors. The two most prominent factors that inhibit good production from a rooftop solar system are shade cast from vegetation and tilt (altitude and azimuth). For existing homeowners wishing to install a system on their roof, tall trees can be rooftop solar’s adversary. Trees that cast shade on roofs can greatly reduce overall efficiency.
Specifically for California, homes can sometimes be built with minimal south facing exposure (desired direction for best solar production), and may not be best suited for rooftop PVs. Municipalities can
avoid this problem by drafting a solar-ready ordinance, which regulates residential development so that they are best suited for rooftop solar.

Co
st/B
en
efit A
naly
sis
Cost/Benefit Analysis
67
Darya Oreizi
6.1.4 Inclement Weather
The most frequent concern of rooftop solar is inclement weather. Weather conditions such as rain, snow, fog, and cloudy skies can negatively impact the production of PVs. Less production equates to less energy produced for the home. As found by Residential Solar 101 (2015), reduction to inclement weather by type compared to peak production percentage is as follows:
• Cloudy/Rain: 40%-90%
• Heavy fog: 15%-20%
• Light fog: 8%-15%
• Dirt: 1%-5%
At first glance, cloudy or rainy weather conditions can seem gloomy since they can decrease production up to 90% (Suttida, 2013). This may seem like bad news for areas in California that experience lots of rain or cloudy skies, such as San Francisco. However, solar still makes economical sense in those regions. The Bay Area is a large market in the solar industry despite inclement weather. In 2009, 61% of California’s solar PV was installed in the Bay Area (2009 Bay Area Solar Installations
Report, 2009). In addition, Germany is particularly known for its world recognition in solar energy.
Germany experiences as much solar irradiation (amount of solar energy radiating to the surface) as Montreal; however, Germany produces about 25 GW of solar—about half of the world’s supply (See Figure 6.1)(Llorens, 2009; National Renewable Energy Laboratory, 2009).
In terms of comparing Germany to California, Germany’s solar irradiation is around 2.5-4.5 kWh/m² while California experiences 4.5-7.0 kWh/m² (National Renewable Energy Laboratory, 2009)

Cost/Benefit Analysis
Cost/
Be
ne
fit
An
aly
sis
68
Solar Ordinance Feasibility Study
Figure 6.1: World Map of Global Horizontal Irradiation. Sourced from National Renewable Energy Laboratory (2009)
Furthermore, in 2007, the National Renewable Energy Laboratory (NREL) published a map depicting solar radiation (irradiation) just in California (See Figure 6.2). The map reveals how many kW-hours per square meter each region of California absorbs.
Based on the study by NREL, essentially everywhere in California experiences enough solar energy to offset the system costs.

Co
st/B
en
efit A
naly
sis
Cost/Benefit Analysis
69
Darya Oreizi
This map was produced bythe National Renewable Energy Laboratory
for the U.S. Department of Energy.September 25, 2007
kWh/m2/Day
> 9
8.5 - 9
.0
8.0 - 8
.5
7.5 - 8
.0
7.0 - 7
.5
6.5 - 7
.0
6.0 - 6
.5
5.5 - 6
.0
5.0 - 5
.5
4.5 - 5
.0
4.0 - 4
.5
3.5 - 4
.0
3.0 - 3
.5
2.5 - 3
.0
2.0 - 2
.5 < 2
0 100 20050Miles
Model estimates of monthly average daily total radiation,averaged from hourly estimates of direct normal irradianceover 8 years (1998-2005). The model inputs are hourlyvisible irradiance from the GOES geostationary satellites,and monthly average aerosol optical depth, precipitablewater vapor, and ozone sampled at a 10km resolution.
Sacramento
Inyo
Kern
San Bernardino
Fresno
Riverside
Siskiyou
Tulare
Lassen
Modoc
Imperial
Mono
ShastaTrinity
San Diego
Humboldt
Tehama
Monterey
Plumas
Los Angeles
Mendocino
Butte
Madera
Lake
Merced
Kings
Yolo
Ventura
Placer
Tuolumne
Glenn
San Luis Obispo
Sonoma
El Dorado
Santa Barbara
Colusa
Sierra
MariposaStanislaus
Napa
NevadaYuba
Alpine
Solano
Del N
orte
Santa Clara
Orange
Marin
Alameda
San Benito
San Joaquin
Calaveras
Sutter
Sacramento Amador
ContraCosta
San Mateo
Santa Cruz
San Francisco
124°0'0"W 123°0'0"W 122°0'0"W 121°0'0"W 120°0'0"W
120°0'0"W
119°0'0"W
118°0'0"W
117°0'0"W116°0'0"W
115°0'0"W
41°0'0"N
40°0'0"N
39°0'0"N
38°0'0"N 38°0'0"N
37°0'0"N 37°0'0"N
36°0'0"N 36°0'0"N
35°0'0"N
34°0'0"N
33°0'0"N
123°0'0"W
122°0'0"W
121°0'0"W
118°0'0"W
117°0'0"W
115°0'0"W
40°0'0"N
35°0'0"N
34°0'0"N
33°0'0"N
Figure 6.2: Global Solar Radiation at Latitude Tilt. Sourced from National Renewable Energy Laborato-ry (2009)

Cost/Benefit Analysis
Cost/
Be
ne
fit
An
aly
sis
70
Solar Ordinance Feasibility Study
6.2 Benefits
Benefits are categorized as factors that support the claim that solar PV are reasonable to mandate as part of a citywide ordinance.
6.2.1 Incentives, Rebates, and Tax Credits
In 2005, the federal government approved the Energy Policy Act of 2005, which included Solar Investment Tax Credit (ITC) (“Solar Industry Facts and Figures”, 2015). The Solar ITC created a 30% tax credit to homeowners who purchase a solar system. Since the adoption of the Solar ITC, the solar industry has grown 76% per year resulting in 20 times more job creation than normal growth in the United States (“Solar Industry Facts and Figures”, 2015).
As of now, the Solar ITC is set to expire by the end of 2016 where it will reduce back to a 10% tax credit. The tax credit has greatly assisted homeowners acquire solar for over 10 years. Since a major obstacle to owning a system is the large investment costs, the Solar ITC relieves a substantial amount of financial worries. As reported by SEIA (2015), “Since the eight-year ITC was put into place, solar prices have consistently fallen year after year while installation rates and
efficiencies have continued to climb”. The federal ITC is just one of many financial incentives.
As mentioned earlier the State of California has a long history of assisting homeowners acquire solar. The two incentives powered by the Go Solar Campaign are the California Solar Initiative and the New Solar Home Partnership. Both CSI and NSHP programs reduce the investment costs of a new system. These financial incentives can be added on top of the federal ITC thereby maximizing savings.
Furthermore, there are many other local municipalities and not-for-profit organizations that assist homeowners purchase solar. Local municipality incentives can be found by using the online search directory DSIRE (Database for State Incentives for Renewables and Efficiency). For example, the City of Roseville in California offers rebates on new homes that install solar. Currently, the program offers $0.24 off per

Co
st/B
en
efit A
naly
sis
Cost/Benefit Analysis
71
Darya Oreizi
approved AC wattage (“Database of State Incentives for Renewable & Efficiency”, 2015). The City of San Francisco also offers financial rebates to homeowners who install solar systems. The amount of savings is based on whether the property is, “residential, commercial, low-income residential, non-profit, or multi-unit residential” (“Database of State Incentives for Renewable & Efficiency”, 2015). Typical residential properties are granted savings ranging $500-$2,800.
Not-for-profits are also getting into the solar game. Grid Alternatives is a 501(c)(3) certified non-profit solar installed in California. Grid Alternatives offers low-income households financial assistance so they too can acquire solar. Nonprofits, like Grid Alternatives, are attempting
to give all households a chance to reduce energy expenses by going solar despite economic criteria.
In addition to all the incentives, rebates, and tax credits, the State of California excludes any solar PV system installed on a new or existing house from increasing property taxes (Section 73 of the California Revenue and Taxation Code). It is clearly noted by the federal and state government, as well as local cities and nonprofits, that solar can be purchased at reasonable costs. The common thought that solar is too expensive for the average American is an outdated misconception. Today, there are many incentives to assist homeowners acquire solar at an affordable cost.
6.2.2 System Lifetime Savings
Many homeowners are concerned about the lifetime savings of a solar system—will a rooftop solar system save money in the lifetime of the panels? Clean Power Research (2011) found after investigating over 45,000 homes with solar the average price for a system cost $10,192 with $143 savings per month after federal and state incentives.
In addition, the average lifetime savings for a home in California accounted to $34,260 after 20 years.
Lifetime savings is the amount of money saved by installing solar over purchasing electricity from the utility company over the lifetime of the panels. The payback period (amount of time to completely pay off

Cost/Benefit Analysis
Cost/
Be
ne
fit
An
aly
sis
72
Solar Ordinance Feasibility Study
the system) is 9 years (Clean Power Research, 2011).
According to Energy Informative (2015) a simple calculation was done using average metrics. The simple case study assumed cost of electricity is 14.78 cents per kWh, average monthly electric bill is $100, system cost is $6.50 per watt, and a 2.8% increase in electricity rates (According to results explained earlier in this report, these assumptions are accurate). The system size is 3 kW. Annual household electricity consumption is 5,600 kWh. System will offset 70% of
electricity demand. The total system cost was $19,500, but after local incentives and the Solar ITC, the cost was reduced to $10,248. The lifetime savings from the panels accounted to $21,989. In this cast study, the panels’ lifetime was 25 years. The Internal Rate of Return (ROR), amount of investment returned in savings per year for the 25-year lifespan of the panels, was 11%. The Return of Investment (ROI) is 215%. The payback period was 9.5 years (Maehlum, 2015).
6.2.3 Improved Environmental Conditions
Implementing solar PV on residential rooftops not only has significant economic benefits, but also improves local environmental conditions. Solar PV improves the integrity of local air quality and public health as well as decreases water consumption.
According to the California Air Resource Board (CARB), California’s electricity generation accounts for 21% of the state’s 459 MMTCO2e (Million metric tons of carbon dioxide equivalent) emissions in 2012 (California Greenhouse Gas Emission Inventory: 2000-2012, 2014).
Since GHGs contribute to Climate Change, power plants that burn CO2e emitting coal and natural gas do not help the situation. Additionally, the cost to reduce the negative effects of Climate Change is not cheap. A recent study, titled Risky Business: The Economic Risks of Climate Change In The U.S., estimated increased temperatures in California will add $12 billion to homeowners a year for air conditioning costs (Greenstone, 2014). Heavy GHG emissions by fossil fuel power plants increase the negative effects of Climate Change such as increased drought, heat waves, and ocean acidification (“Climate Change”, 2015). The Intergovernmental Panel on
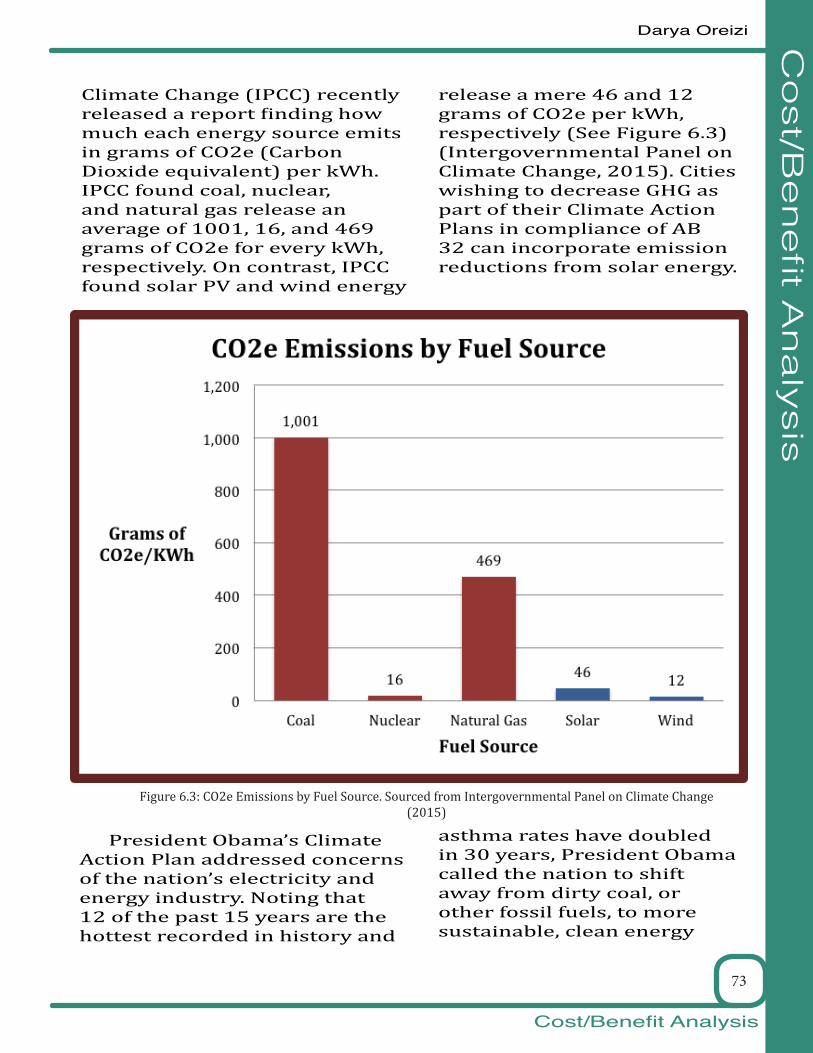
Co
st/B
en
efit A
naly
sis
Cost/Benefit Analysis
73
Darya Oreizi
Climate Change (IPCC) recently released a report finding how much each energy source emits in grams of CO2e (Carbon Dioxide equivalent) per kWh. IPCC found coal, nuclear, and natural gas release an average of 1001, 16, and 469 grams of CO2e for every kWh, respectively. On contrast, IPCC found solar PV and wind energy
release a mere 46 and 12 grams of CO2e per kWh, respectively (See Figure 6.3)(Intergovernmental Panel on Climate Change, 2015). Cities wishing to decrease GHG as part of their Climate Action Plans in compliance of AB 32 can incorporate emission reductions from solar energy.
Figure 6.3: CO2e Emissions by Fuel Source. Sourced from Intergovernmental Panel on Climate Change (2015)
President Obama’s Climate Action Plan addressed concerns of the nation’s electricity and energy industry. Noting that 12 of the past 15 years are the hottest recorded in history and
asthma rates have doubled in 30 years, President Obama called the nation to shift away from dirty coal, or other fossil fuels, to more sustainable, clean energy

Cost/Benefit Analysis
Cost/
Be
ne
fit
An
aly
sis
74
Solar Ordinance Feasibility Study
sources such as wind, solar, and hydro (The President’s Climate Action Plan, 2013). As called by CARB, EPA, and the President of the United States, a change in energy production is in order to reduce the rate of Climate
Change. The report will now briefly review negative effects fossil fuels have on public health and water consumption.
6.2.3.1 Public Health
The effects of Climate Change negatively impact public health. The Center for Disease Control and Prevention (CDC) identifies, “diminished lung function, increased hospital admissions and emergency room visits for asthma, and increases in premature deaths” are a result from Climate Change (“Climate Effects on Health”, 2014). Increased heat wave frequency increases heat-related deaths. Longer warm seasons allow insects to spread fatal diseases longer. Decrease snowpack cause droughts, which threatens community’s food supply and water resources (“Climate Change”, 2015).
Public health is integrated in all aspects of Climate Change. For example, the EPA estimated in 2010 there were 1.5 heat-related deaths per million people (“Climate Change”, 2015). Furthermore, CDC estimates if no further government regulations are implemented there will be 1,000-4,300 premature deaths as a result of poor air quality.
CDC states, “Health-related costs of the current effects of ozone air pollution exceeding national standards have been estimated at $6.5 billion (in 2008 U.S. dollars) nationwide, based on a U.S. assessment of health impacts from ozone levels during 2000–2002.” (“Climate Effects on Health”, 2014).
According to the Rocky Mountain Institute, pollution from today’s electricity generation costs the United States $100 billion (“Bringing Clean Competitive Solar Power to Scale.”, 2015).
The generation of electricity from fossil fuels directly impacts local air quality. Environment California published a report, titled The High Cost of Fossil Fuels, in 2009 discussing the negative implications of fossil fuel use. The report found a clear nexus between air quality and fossil fuel used for electricity generation. Fossil fuel use remains the one of the leading sources of air pollution.

Co
st/B
en
efit A
naly
sis
Cost/Benefit Analysis
75
Darya Oreizi
From 1970 to 2009, the United States has spent over $9 trillion, through the Clean Air Act, in efforts to clean the air from such pollution (Figdor, 2009, p. 10). Furthermore, the report found if the United States were to invest in clean energy sources, like solar PV, the nation could reduce its pollution from fossil fuels by 1.2 billion metric tons of Carbon Dioxide per year, or, “20 percent of today’s fossil fuel emissions” (Figdor, 2009, p. 14).
Cleaning the air by reducing the use of fossil fuels will decrease costs related to air pollution thereby restoring taxpayer’s money to other useful objectives.
Figure 6.4: Image of emissions from fossil fuel power plants. Source from www.followinggreenliving.com

Cost/Benefit Analysis
Cost/
Be
ne
fit
An
aly
sis
76
Solar Ordinance Feasibility Study
6.2.3.2 Water Resources
The three large IOU companies produce electricity primarily from dirty, exhaustible resources. Fossil fuels comprise the majority of the IOU’s energy portfolio (“California Electricity Statistics & Data”, 2015). The process to turn the chemical energy in the fossil fuels to electrical energy is very complex. For example, a coal firing power plant first grinds the coal to small pieces. The pulverized coal is then ignited to create lots of heat. This heat is used to turn water into steam. The steam is used to run a turbine, which powers a generator. The generator converts the mechanical energy of the spinning turbine into usable electrical energy. This process, used by coal, natural gas, and nuclear power plants, is known as thermoelectric energy.
Thermoelectric energy must use ample amounts of water so the steam can power the generators. According to River Network’s report, Burning Our Rivers, thermoelectric power plants are using freshwater at the quickest rate in the United States (Wilson, 2012, p. 5). The United States Geological Survey (USGS) reported in 2005 that thermoelectric power plants consumed 53% all surface water withdrawn for human
use (not including hydroelectric power plants). Burning Our Rivers also states, “In 2009 the water footprint of U.S. electricity was approximately 42 gallons per kWh produced” (Wilson, 2012, p. 31).
To translate this fact for a household-scale, the average American household consumes nearly 40,000 gallons of water per year just for energy consumption.
Direct water consumption for the average household is five times less than water required for energy use (Wilson, 2012, p. 30). For example, in 2010, the average household consumed about 1,000 kWh for every month. This correlates to the household consuming about 40,000 gallons per month to produce the household’s energy supply if 100% of the electricity is produced from fossil fuels (Wilson, 2012, p. 31).
California is already stressed for water. Some communities are relying on neighboring cities to provide water for drinking and agriculture. Fossil fuel power plants absorb already scare water supplies, which is unnecessary. Naturally, different fuel sources require different amounts of water to produce

Co
st/B
en
efit A
naly
sis
Cost/Benefit Analysis
77
Darya Oreizi
electricity. Renewable energy, like wind and solar, consume minimal amounts of water to produce the exact same amount of electricity thermoelectric power plants produce. Coal, nuclear, and natural gas power plants consume about 692, 572, and 172 gallons of water per MWh, respectively, for the total electricity generation process (See Figure 6.5)(Wilson, 2012, p. 22). These numbers represent water consumed for generation alone. Each fossil fuel and nuclear supply require much more water (6,000 to 16,000 gallons per MWh) for mining, extraction, and
purification (Wilson, 2012, p. 23). Furthermore, these numbers do not represent water consumption by hydraulic fracking methods, which require an average of five million gallons of water per well (Jenkins, 2013). On the other hand, solar and wind consume only two and one gallon(s) per MWh, respectively (Wilson, 2012, p. 13).
Cities that increase solar PV will decrease water consumption significantly.
Figure 6.5: Total Water Use by Fuel Source. Sourced from Burning Our Rivers (2012)

Cost/Benefit Analysis
Cost/
Be
ne
fit
An
aly
sis
78
Solar Ordinance Feasibility Study
In addition to thermoelectric power plants consuming large quantities of freshwater, thermoelectric power plants also contaminate local waterways. After thermoelectric and nuclear power plants produce steam to run generators, the steam is converted back into a liquid state. The water is then at a much higher temperature than the nearby natural waterway where it was withdrawn, despite the location of the
power plant. The warmer water is released back into the river, lake, or ocean, and infused with the natural habitat. This fusion of warm and cold water disrupts ecosystems. Certain marine animals are forced to migrate elsewhere as they cannot survive warmer temperature conditions. In addition, foreign species gather the new warm-water habitat, further disturbing the natural ecosystem (“The External Costs of Fossil Fuels”, 2014).
6.2.4 True Cost of Electricity
As mentioned earlier, fossil fuels and nuclear energy carry baggage. These fuels, while slightly cheaper than their renewable competitors in terms of retail rates, cost the United States billions of dollars in environmental, economic, and health external costs. A study by Harvard University found coal alone cost the U.S. between $330 and $500 billion each year in external damages (Epstein, 2011). Another study by Resource of the Future in 2012 found similar results (Parsons, 2014).
As noted in the chart on the next page (Figure 6.6), the cost to produce each fuel to electricity are relatively competitive; however, studies show the external environmental, economic, and
health damage cost to produce each fuel to electricity truly adds much more than end-users (homeowners) pay for. In other words, it cost power plants around $.06 per kWh for coal and natural gas.
However, the true cost of coal and natural gas (the choice fuel source by IOUs) are $.33 and $.22 per kWh, respectively (See Figure 6.6). Solar PV, because of the minimal external damages costs, remains below $.10 per kWh.
The true cost of electricity is dispersed through tax dollars and government subsidies; hence why end-users do not see retail electricity baseline rates above $.40 per kWh. Switching away from fossil fuels to solar

Co
st/B
en
efit A
naly
sis
Cost/Benefit Analysis
79
Darya Oreizi
energy will reduce external costs thereby reducing tax dollars wasted on unnecessary environmental, economic, and health damage costs.
6.2.5 Job Growth
Since the explosion of the solar industry in the mid 2000s, the U.S. has experienced tremendous job growth. As reported by The Solar Foundation, a nonprofit founded in 1977, there are over 174,000
solar jobs (California holds 54,700 of them). Solar jobs in California rank number one in the share of the state’s total employment. Many of these jobs do not require extensive education allowing the majority of the
Figure 6.6: True Cost of Electricity by Fuel Source. Sourced by Annals of the New York Academy of Sciences (2011)

Cost/Benefit Analysis
Cost/
Be
ne
fit
An
aly
sis
80
Solar Ordinance Feasibility Study
population to join the solar industry. The average pay in the solar industry, reported by The Solar Foundation’s Executive Director Andrea Luecke, ranges from $20 to $24 dollars an hour. Additionally, Luecke reports since data collection in 2010, the solar industry employment
rate has grown 86% per year with an estimated 36,000 jobs added in 2015 (“State Solar Jobs”, 2015). Cities that mandate solar on residential units will increase job growth in the local area, which will benefit the local economy.
6.2.6 Increase Value of Home
The final benefit of mandating solar on new homes is the increased home value due to the PV system. According to a study by Lawrence Berkeley National Laboratory (LBNL) in 2011, research shows new homes with a PV system increase the home premiums anywhere from $2.3 to $2.6 per watt (Hoen, 2011).
In other words, given standard residential PV systems range from 2 kW to 10 kW, new homes with a solar system increase the value of the home from $4,600 to $26,000 (Hoen, 2011).
Of course systems degrade over time thereby reducing the value of the system. As previously mentioned, PV installed on homes degrade anywhere from .05% to 1% per year (National Renewable Energy Laboratory, 2014). However, the study found that PV systems premiums degrade 9% per year (Hoen, 2011). In addition, the study found homes with PVs sold 20% faster than non-PV homes (Hoen, 2011). Altogether, installing PV on a new residential home increases the resale value of the home as well as decreasing time on the market.

Co
st/B
en
efit A
naly
sis
Cost/Benefit Analysis
81
Darya Oreizi

Implementation
82
Chapter Seven: Implementation
Solar Ordinance Feasibility Study
Implementing new ordinances into a city’s zoning code requires careful planning. Cities incorporating new ideas, standards, or requirements must address stakeholders to ensure fair implementation. On March 3rd, Chuck Stevenson, previous San Luis Obispo County Planning Supervisor, shared a few suggestions to cities wishing to incorporate a mandatory solar ordinance. Stevenson commented, “With any new city action, outreach is crucial” (Chuck Stevenson, personal communication, March 3, 2015). Through several years of leading the County of San Luis Obispo to many achievements, such as increasing building code energy efficiency 10% above Title 24, Stevenson learned creating a relationship with stakeholders propels any project in the right direction.
Stevenson explained cities that portray a transparent image with the public receive positive feedback. In addition, Stevenson suggested stakeholders should include: home builders, realtors, general public, and solar installers. As far as public opinion on new ordinances, Stevenson reported, “Its hard to include community members supporting the ordinance.
Mostly those opposed turn out to public hearings” (Chuck Stevenson, personal communication, March 3, 2015). Stevenson suggested posting announcements on social media sites, such as Facebook, is a great medium to connect and educate with the public.
City staff of existing mandatory solar ordinances (Lancaster and Sebastopol) also gave input for new cities. As previously mentioned, both Lancaster and Sebastopol advised to create a flexible ordinance. Lancaster’s solar ordinance allows several exceptions to their ordinance, such as improving energy efficiency in building materials or appliances. Since the overall goal of the mandatory solar ordinance is to reduce energy consumption of fossil fuels, improving material or appliance energy efficiencies indirectly decreases home energy consumptions of fossil fuels. Therefore, decrease energy consumption achieves the same goal as the mandatory solar ordinance. Additionally, Lancaster’s flexibility gives homebuilders and homeowners alternatives to lots with difficult solar conditions. Sebastopol also prescribes alternatives

Imp
lem
en
tatio
n
Implementation
83
Darya Oreizi
to their solar ordinance to offer flexibility. Sebastopol’s ordinance allows both increased energy efficiency and in-lieu fees if a particular lot cannot feasibly install solar; however, in lieu fees have yet to be used due to the success of the ordinance.
As far as new cities wishing to mandate a solar ordinance, Chen Ng, Lancaster Planner, advised, “Most importantly, you need support from stakeholders” (Chuen Ng, personal communication, April 9, 2015).

Final Remarks
84
Final Remarks
Solar Ordinance Feasibility Study
After thorough research on how solar PV works, federal and state regulations and incentives, case studies of existing solar ordinances, and conducting a cost-benefit analysis, mandating rooftop solar for residential zones is feasible. The technology is at a point where it is cost effective to return investment in a reasonable amount of time. The homeowner is able to reduce energy costs and improve marketability of the home. Various federal and state incentives help reduce capital costs. In addition, the local community benefits as well by reducing water consumption from fossil fuel power plants, improving local air quality, and reducing GHG emissions.
These are just a few of the benefits of mandatory solar. As the report has found, the list of benefits greatly outweighs the costs. Most importantly, there is a need for alternative energy. Historic events, such as the California Energy Crisis of 2001, and GHG and air pollution emissions prove the demand for a change in how communities generate electricity. By switching away from fossil fuels and decentralizing the electrical grid, communities become not only healthier due
to reduced emissions, but also more energy resilient at a lower cost. Numerous studies report negative impacts of polluting the airways from burning coal and natural gas for electricity generation. Additionally, thermoelectric power plants consume vast amounts of water. There is a great need for California to transition away from fossil fuels to renewables.
As proven in this report, cities have the ability to ensure affordable, clean, and abundant electricity to communities. If business continues as normal, California is bound for yet another energy crisis. A residential solar PV ordinance provides a simple solution that is cost effective and less resource demanding; and, most importantly, provides a positive step in the direction towards an energy secure city.
As stated by chairman of the Rocky Mountain Institute, Amory Lovins, renewables are, “Not dug from below, but flowing from above; not scarce, but bountiful; not local, but everywhere; not trenchant, but permanent; not costly, but free” (Lovins, 2015).

Fin
al R
em
ark
s
Final Remarks
85
Darya Oreizi
Mandatory residential rooftop solar is necessary for healthier, economical, and sustainable cities.

Appendix
86
Appendix
Solar Ordinance Feasibility Study
Appendix A: Sebastopol Solar Ordinance
Sebastopol Municipal CodeZoning Ordinance
Chapter 15.72Mandatory Photovoltaic System Requirements
15.72.010 Findings4. Reduction of Green House Gases is a stated goal of the City of Sebastopol. As a responsible environmental steward the City of Sebastopol is committed to policies and programs that conserve and use natural resources wisely. 5. Solar Photovoltaic technology and equipment have become reasonably available. 6. Therefore consistent with its authority as a municipal corporation and its responsibility to protect the public health, safety and welfare the City hereby enacts requirements for new construction and specified additions to existing structures to increase energy conservation and reduce green house gas emissions.
15.72.020 Purpose This ordinance addresses installation of solar photovoltaic systems for all new commercial and residential building construction and specified additions to existing structures.
15.72.030 When Required New commercial or residential buildings, and specific alterations, additions and remodels require the installation of a photovoltaic energy generation system. Any addition to an existing commercial building which increases the square footage by 1800 square feet or greater and all commercial remodels, alterations or repairs that are made involving demolition, remodel or repair of more than 50% of the structure. Any addition to an existing residential building which increases the square footage by 75% or greater and all residential remodels, alterations or repairs that are made involving demolition, remodel or repair of more than 75% of the structure. At the time of submittal of a Building Permit application for a new commercial building or addition over 1800 square feet or alterations, remodel or repairs over 50% or more of the structure or new residential building or residential addition, alteration, remodel or repairs of 75% or more of the structure an applicant shall be required to submit plans and specifications for a solar photovoltaic system included in the submittal application. Buildings and structures of an accessory character as defined in the California Building and Residential Code as Group U occupancies and Residential Buildings 840 square feet or less are not regulated by this ordinance.

Ap
pe
nd
ix
Appendix
87
Darya Oreizi
15.72.040 Size Minimum system size may be calculated by either of two methods, prescriptive or performance. Prescriptive Method. The minimum system size utilizing the prescriptive method is two watts per square foot of conditioned building area including existing, remodeled and new conditioned space. Watts are calculated by using the nameplate rating of the photovoltaic system. There are no considerations for performance such as tilt, orientation shading or tariffs. Performance Method. The system sizing requirement for the performance method shall be calculated using modeling software or other methods approved by the official. The total building load including conditioned and unconditioned space is calculated in kilowatt hours. The photovoltaic system annual output is calculated by factoring in system orientation, tilt, shading, local weather conditions and equipment efficiency. The photovoltaic system must offset 75% of the electrical load of the building on an annual basis. Incentives, to be determined by the official, shall be instituted for installations which exceed the minimum size required. Methods of electrical energy production through renewable sources other than photovoltaic systems shall be considered when calculating the total requirement for any specific project.
15.72.050 Exceptions The Building Official may exempt facilities from the provisions of this Chapter, and impose reasonable conditions in lieu of full compliance herewith, if the Official determines that there are practical difficulties involved in carrying out the provisions of this chapter. Practical difficulties may be the result of the building site location, shading resulting from topography or other conditions. Reasonable conditions may include the use of alternate energy systems, exceeding mandatory energy compliance standards by ten percent or other methods as determined. The Official may require that sufficient evidence or proof be submitted to substantiate any exception or acceptance of alternatives. The City Council may establish an in lieu fee as an acceptable alternative for full compliance. The in lieu fee shall be 90% of the permit valuation amount for a similar sized system and shall be based upon historical data collected by the building department for the previous twelve calendar months. Owners of multiple properties may install a single photovoltaic system meeting the aggregate energy generation requirement for all owned properties which require compliance with this chapter. Properties which have a previously installed photovoltaic system are required to increase the size of any existing system to meet the current minimum standards.
15.72.060 Prior to the issuance of a Certificate of Occupancy for new construction or a Final inspection for specified additions the owner of record or his agent shall certify in writing that the solar photovoltaic system is operational.
15.72.070 This ordinance shall take effect 60 days after its passage, but shall not be applicable to complete applications for plan check filed with the Sebastopol Building and Safety Department as of the effective date of this ordinance, except at the election of the applicant.

Ap
pe
nd
ix
Appendix
88
Solar Ordinance Feasibility Study
Appendix B: Lancaster Solar Ordinance
Lancaster Municipal CodeZoning Ordinance
15.28.020 - Implementation of solar energy systems. Subchapter 2 of the California Energy Code is hereby amended by adding Section 110.11 to read as follows: SECTION 110.11
MANDATORY REQUIREMENTS FOR THEIMPLEMENTATION OF SOLAR ENERGY SYSTEMS (a) Purpose and intent. It is the purpose and intent of this section to provide standards and procedures for builders of new dwelling units to install solar energy systems in an effort to achieve energy savings and greater usage of alternative energy. It is intended that each dwelling unit owner or tenant shall be the beneficiary of achieved energy savings.
(b) Applicability. These specific standards are applicable for all new dwelling units with a building permit issuance date on or after January 1, 2014. Exception: Accessory dwelling units.
(c) Provision of solar energy systems. 1. A builder shall provide solar energy systems for new homes in accordance with the energy generation requirements as listed in Section 17.08.060 of the Lancaster Municipal Code. It is intended that no individual installed system shall produce less than 1.0 kW. 2. Installation of solar energy systems is not required for all homes within a production subdivision; however, the builder shall meet the aggregate energy generation requirement within the subdivision (as calculated by the per-unit energy generation requirement multiplied by the number of homes in the subdivision). For example, an R-7000 subdivision with ten (10) homes that is required to provide 1.0 kW per unit would have an aggregate energy generation requirement of 10 kW for the subdivision. The 10 kW energy generation requirement can be met with two homes having solar energy systems generation 5 kW each, or with four homes having systems generating 2.5 kW each. 3. Homebuilders shall demonstrate through building plan check their intention to meet the solar energy generation requirement. 4. Homebuilders shall build solar energy systems on model homes, reflective of the products that will be offered to homebuyers. 5. If a tract is built in phases, the solar energy generation requirement shall be fulfilled for each phase, or release of homes. 6. Solar energy systems shall meet the development standards and guidelines as described in the Lancaster Zoning Code. 7. Solar energy systems for multi-family developments may be provided on rooftops, or on solar support/shade structures.

Ap
pe
nd
ix
Appendix
89
Darya Oreizi
(d) Alternative methods of compliance. If site-specific situations make it impractical for a developer to meet the requirements of this section, the developer may propose an alternative method of compliance with the intent of this section. An alternative method of compliance shall be approved where the building official finds that the proposed alternative is satisfactory and complies with the intent of the provisions of this section.
(Ord. No. 994, § 11, 11-12-13)

Ap
pe
nd
ix
Appendix
90
Solar Ordinance Feasibility Study
Appendix C: California Energy Commission- Historical and Future Solar PV Costs

Ap
pe
nd
ix
Appendix
91
Darya Oreizi
Appendix D: Energy Information Administration- California Electricity Generation Fuel Comparison
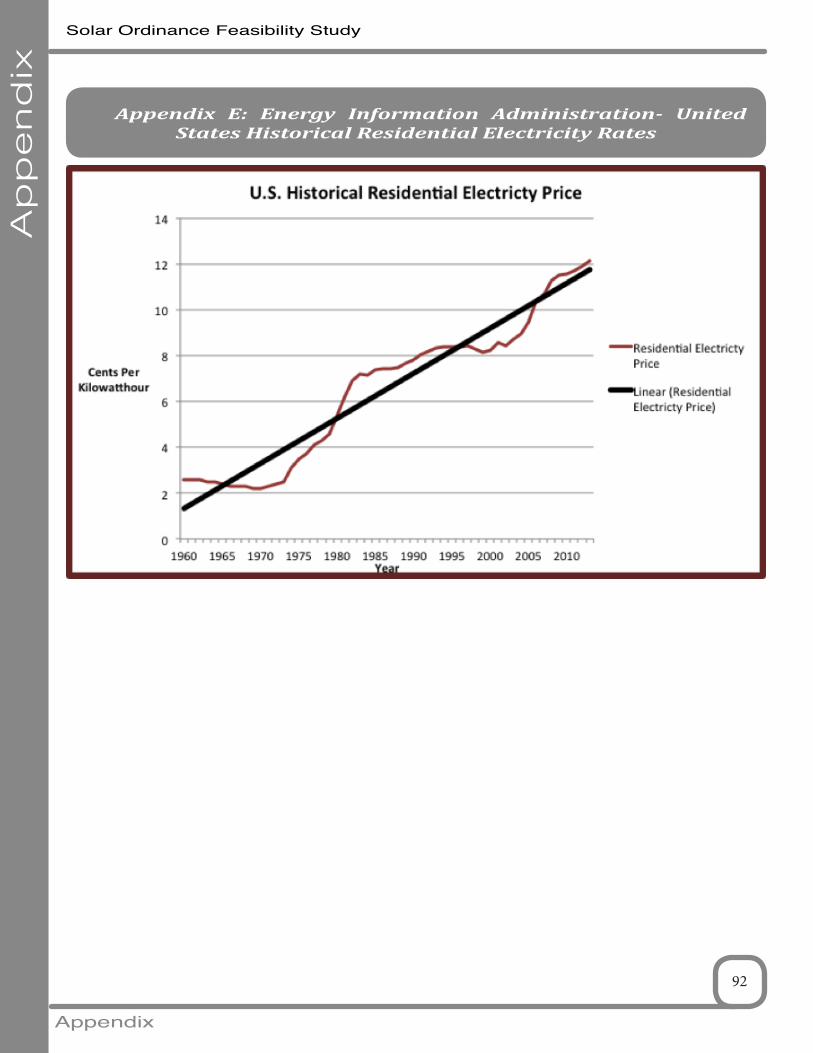
Ap
pe
nd
ix
Appendix
92
Solar Ordinance Feasibility Study
Appendix E: Energy Information Administration- United States Historical Residential Electricity Rates

Ap
pe
nd
ix
Appendix
93
Darya Oreizi
Appendix F: Energy Information Administration- United States Historical Residential Electricity Consumption

Ap
pe
nd
ix
Appendix
94
Solar Ordinance Feasibility Study
Appendix G: Energy Information Administration- United States Historical Cost of Fossil Fuels for Electricity Generation

Ap
pe
nd
ix
Appendix
95
Darya Oreizi

References
96
References
Solar Ordinance Feasibility Study
“2008 Energy Action Plan.” State of California, 1 Feb. 2008. Web. 7 May 2015. <http://www.energy. ca.gov/2008publications/CEC-100-2008-001/CEC-100-2008-001.PDF>.“2009 Bay Area Solar Installations Report.” 2009 Bay Area Solar Installations Report. Northern California Solar Energy Association, 1 July 2010. Web. 1 May 2015. <http://norcalsolar.org/images/ bayareasolarinstallationsreport2009.pdf>.2013 Building Energy Efficiency Standards. California Energy Commission, 12 May. 2012. Print.“AB 758.” California Energy Commission. California Energy Commission. Web. 2 Apr. 2015. <http://www. energy.ca.gov/ab758/documents/AB-758_Statute_Summary.pdf>.“AB 758: Energy Efficiency Law.” Global Green. Global Green. Web. 18 Apr. 2015. <http://www.globalgreen. org/articles/global/62>.“About the California Solar Initiative (CSI).” Go Solar California. Go Solar California, 2015. Web. 11 Apr. 2015. <http://www.gosolarcalifornia.ca.gov/about/csi.php>.Anderson, David. “Positive & Negative Effects of Solar Energy.” Home Guides. SF Gate. Web. 8 Apr. 2015. <http://homeguides.sfgate.com/positive-negative-effects-solar-energy-79619.html>.Aroonruengsawat, Anin. Impacts of Climate Change on Residential Electricity Consumption: Evidence From Billing Data. California Climate Change Center, 2009. Print.“Assembly Bill 32 Overview.” Assembly Bill 32. California Air Resource Board, 1 Aug. 2014. Web. 7 May 2015. <http://www.arb.ca.gov/cc/ab32/ab32.htm>.Barclay, Cecily Talbert, and Matthew Gray. Curtin’s California Land Use and Planning Law. 2012 (32nd) ed. Point Arena, Calif.: Solano, 2012. Print.Bedsworth, Louise. California Climate Change Research Plan. Climate Action Team, 2014. Print.Boswell, Michael R., and Adrienne I. Greve. Local Climate Action Planning. Washington, DC: Island, 2012. Print.“Bringing Clean Competitive Solar Power to Scale.” Rocky Mountain Institute. Web. 26 May. 2015. <http:// www.rmi.org/impact_bringing_clean_competitive_solar_power_to_scale>.“Buy Clean Energy 2014.” Why Clean Energy. Buy Clean Energy. Web. 9 Apr. 2015. <http://buycleanenergy. org/why>.“CALGreen.” CALGreen. California Building Standards Commission, 2015. Web. 1 May 2015. <http://www. bsc.ca.gov/Home/CALGreen.aspx>.“California Climate Change Legislation.” Legislation. State of California, 2015. Web. 5 May 2015. <http:// www.climatechange.ca.gov/state/legislation.html>.“California Electricity Statistics & Data.” Energy Almanac. California Energy Commission, 2015. Web. 30 Mar. 2015. <http://energyalmanac.ca.gov/electricity/>.California Greenhouse Gas Emission Inventory: 2000-2012. California Air Resource Board, 2014. Print.“California Renewable Energy Overview and Programs.” California Renewable Energy Overview and Programs. California Energy Commission, 2015. Web. 14 Apr. 2015. <http://www.energy.ca.gov/ renewables/>.“California Solar Rebates, Tax Credits, and Incentives.” Residential Solar 101. Residential Solar 101, 2015. Web. 5 Apr. 2015. <http://www.residentialsolar101.org/california-solar-rebates-tax-credits- and-incentives/>.

Re
fere
nc
es
References
97
Darya Oreizi
“California Zero Net Energy.” California Zero Net Energy. Zero Net Energy Homes, 2013. Web. 17 Apr. 2015. <http://www.californiaznehomes.com/#!about/cdtl>.“California and U.S. Renewable Energy Legislation - Go Solar California.” California and U.S. Renewable Energy Legislation. Go Solar California, 2015. Web. 11 Apr. 2015. <http://www.gosolarcalifornia. ca.gov/about/gosolar/legislation.php>.Causes and Lessons of the California Electricity Crisis. Congressional Budget Office, 2001. Print.Cheeseman, Gina-Marie. “Solar Prices Still Falling Fast, Study Finds.” People Planet Profit. Triple Pundit, 26 Oct. 2014. Web. 3 Apr. 2015. <http://www.triplepundit.com/2014/10/solar-prices-still-falling- fast-study-finds/>.Stevenson, Chuck. “Chuck Stevenson.” Telephone interview. 3 Mar. 2015.“Clean Energy Vision.” Clean Energy Vision, 2015. Web. 2 May 2015. <http://www.cleanenergyvision. org>.“Clean Power Plan Proposed Rule.” Clean Power Plan Proposed Rule. EPA, 2014. Web. 30 Mar. 2015. <http://www2.epa.gov/carbon-pollution-standards/clean-power-plan-proposed-rule>.“Climate Change.” EPA. Environmental Protection Agency, 15 Apr. 2015. Web. 29 Mar. 2015. <http:// www.epa.gov/climatechange/>.Desmarais, Lisa K. “The Impact of Photovoltaic Systems on Market Value and Marketability.” Colorado Energy Office, 1 May 2013. Web. 7 May 2015. <http://www.colorado.gov/cs/Satellite?blobcol=urldata&b lobheadername1=Content-Disposition&blobheadername2=Content-Type&blobheadervalue1=inli ne;+filename%3D%22PV_Case+Studies.pdf%22&blobheadervalue2=application/pdf&blobkey%>.Doom, Justin. “Sunrun CEO Sees 100-Percent Growth Rate Continuing Through 2015.” Bloomberg.com. Bloomberg, 24 Sept. 2014. Web. 11 Apr. 2015. <http://www.bloomberg.com/news/articles/2014-09-24/ sunrun-ceo-sees-100-percent-growth-rate-continuing-through-2015>.Ebeling, Ashlea. “How Much Do Solar Panels Boost Home Sale Prices?” Forbes. Forbes Magazine, 11 Aug. 2011. Web. 8 May 2015. <http://www.forbes.com/sites/ashleaebeling/2011/08/01/how-much- do-solar-panels-boost-home-sale-prices/>.Energy Efficiency Strategic Plan. Engage 360, 2011. Print.“Energy, Efficiency, Alternative and Renewable Energy Sources.” Energy Informative. National Resources Defense Council, 2015. Web. 7 May 2015. <http://www.nrdc.org/energy/default.asp>.“Environmental Impacts of Solar Power.” Union of Concerned Scientists. Union of Concerned Scientists, 1 Mar. 2013. Web. 5 Apr. 2015. <http://www.ucsusa.org/clean_energy/our-energy-choices/ renewable-energy/environmental-impacts-solar-power.html#.VP3bw0I6ElI>.Epstein, Paul R. Full Cost Accounting for the Life Cycle of Coal. ANNALS OF THE NEW YORK ACADEMY OF SCIENCES, 2011. Print.Feldman, David. PV Pricing Trends. Sunshot, 2014. Print.Figdor, Emily. The High Cost of Fossil Fuels. Environment California, 2009. Print.“Financing Options for Solar and Renewable Energy Systems.” Financing Options for Solar and Renewable Energy Systems. PG&E, 2015. Web. 5 May 2015. <http://www.pge.com/en/myhome/ saveenergymoney/solar/financing.page>.“GRID Alternatives.” GRID Alternatives, 2015. Web. 9 Apr. 2015. <http://www.gridalternatives.org>.Green, Miranda. “California Towns Pass Law Requiring New Buildings to Have Solar Panels.” The Daily Beast. The Daily Beast, 10 May 2013. Web. 3 Apr. 2015. <http://www.thedailybeast. com/articles/2013/05/10/california-towns-pass-law-requiring-new-buildings-to-have- solar-panels.html>.

References
Re
fere
nc
es
98
Solar Ordinance Feasibility Study
Greenstone, Michael. “Paying the Cost of Climate Change.” The Brookings Institution. Brookings, 19 Sept. 2014. Web. 29 Mar. 2015. <http://www.brookings.edu/blogs/planetpolicy/posts/2014/09/19- paying-cost-of-climate-change-greenstone>.Hales, Roy L. “Solar Panels & Their Toxic Emissions.” CleanTechnica. CleanTechnica, 1 May 2014. Web. 30 Mar. 2015. <http://cleantechnica.com/2014/05/01/solar-panels-toxic-emissions/>.Henson, Robert, and Duncan Clark. The Rough Guide to Climate Change. London: Rough Guides, 2006. Print.“History of Solar Energy in California - Go Solar California.” History of Solar Energy in California. Go Solar California, 2015. Web. 3 May 2015. <http://www.gosolarcalifornia.ca.gov/about/gosolar/california. php>.Hoen, Ben. “An Analysis of the Effects of Residential Photovoltaic Energy Systems on Home Sales Prices in California.” Lawrence Berkeley National Laboratory, 1 Apr. 2011. Web. 17 Apr. 2015. <http://emp.lbl. gov/sites/all/files/lbnl-4476e.pdf>.“How Photovoltaic Cells Work.” SolarEnergy. SolarEnergy, 2015. Web. 18 Apr. 2015. <http://solarenergy.net/ solar-power-resources/how-photovoltaic-cells-work/>.“Independent Statistics and Analysis.” Electricity Data Browser. U.S. Energy Administration Information, 2015. Web. 19 Apr. 2015. <http://www.eia.gov/electricity/data/browser/#/ topic/7?agg=0,1&geo=000000000004&endsec=vg&linechart=ELEC.PRICE.CA-COM. M~ELEC.PRICE.CA-RES.M&columnchart=ELEC.PRICE.CA-ALL.M&map=ELEC.PRICE.CA-ALL.M&freq=M &start=200801&end=201411&chartindexed=1&ctype=linechar>.“Investor-Owned Utility Solar Photovoltaic (PV) Programs.” California Public Utilities Commission. California Public Utilities Commission, 2015. Web. 8 Apr. 2015. <http://www.cpuc.ca.gov/PUC/energy/ Renewables/hot/Utility PV Programs.htm>.Jenkins, Jesse. “Energy Facts: How Much Water Does Fracking for Shale Gas Consume?” The Energy Collective. The Energy Collective, 6 Apr. 2013. Web. 2 May 2015. <http://theenergycollective.com/ jessejenkins/205481/friday-energy-facts-how-much-water-does-fracking-shale-gas-consume>.Jones, Willie. “How Much Water Does It Take to Make Electricity?” IEEE Spectrum. IEEE Spectrum, 1 Apr. 2008. Web. 7 May 2015. <http://spectrum.ieee.org/energy/environment/how-much-water-does-it- take-to-make-electricity>.Jones, Willie. “How Much Water Does It Take to Make Electricity?” IEEE Spectrum. IEEE Spectrum, 1 Apr. 2008. Web. 7 May 2015. <http://spectrum.ieee.org/energy/environment/how-much-water-does-it- take-to-make-electricity>.Ksenya. (2011, June 9). Thin Film & Solar Shingles. Retrieved May 11, 2015, from http://solartribune.com/ thin-film-photovoltaic/Ng, Chuen. “Lancaster.” Telephone interview. 9 Apr. 2015.“Lancaster Building Code: Chapter 15.” Building Code. City of Lancaster, 2015. Web. <https:// www.municode.com/library/ca/lancaster/codes/code_of_ordinances?nodeId=TIT15BUCO_ CH15.28ENCO_15.28.020IMSOENSY>.“Lancaster Choice Energy.” FAQs. City of Lancaster, 2015. Web. 5 Apr. 2015. <http://www. lancasterchoiceenergy.com/faq-s.html>.“Lancaster: Net Zero Power City By 2020.” Go 100% Renewable Energy. Go 100% Renewable Energy, 2013. Web. 9 May 2015. <http://www.go100percent.org/cms/index.php?id=92&tx_ttnews[tt_ news]=181&cHash=ce0be9725a292ac373baf02cc04860b1>.Llorens, Dave. “What’s the Difference between a Solar Lease and a PPA.” Solar Power Rocks. Solar Power Rocks, 5 June 2009. Web. 3 May 2015. <http://www.solarpowerrocks.com/los-angeles-solar/solar- ppa-vs-lease-solar/>.

Re
fere
nc
es
References
99
Darya Oreizi
“Local Ordinances Exceeding the 2013 Building Energy Efficiency Standards.” Local Ordinances Exceeding the 2013 Building Energy Efficiency Standards. California Energy Commission, 2015. Web. 7 Apr. 2015. <http://www.energy.ca.gov/title24/2013standards/ordinances/>.Maehlum, Mathias Aarre. “Micro-Inverters vs. Central Inverters.” Energy Informative. Energy Informative, 14 Sept. 2014. Web. 21 Apr. 2015. <http://energyinformative.org/are-solar- micro-inverters-better-than-central-inverters/>.Maehlum, Mathias Aarre. “How Much Do Solar Panels Cost.” Energy Informative. Energy Informative, 23 March. 2015. Web. 17 May. 2015. http://energyinformative.org/solar-panels-cost/.Makhijani, Shakuntala. “Cashing in on All of the Above: U.S. Fossil Fuel Production Subsidies Under Obama.” Oil Change International, 1 July 2014. Web. 29 Mar. 2015. <http://priceofoil.org/ content/uploads/2014/07/OCI_US_FF_Subsidies_Final_Screen.pdf>.Monthly Energy Review. Vol. February. Energy Information Administration, 2015. Print.Mulvaney, Dustin. “Hazardous Material Used in Silicon PV Cell Production: A Primer.” Solar Industry Magazine. Solar Industry Magazine, 2015. Web. 22 Apr. 2015. <http://www.solarindustrymag. com/issues/SI1309/FEAT_05_Hazardous_Materials_Used_In_Silicon_PV_Cell_Production_A_ Primer.html>.Nevin, Rick. More Evidence of Rational Market Values for Home Energy Efficiency. Appraisal Institute, 2012. Print.Newcomb, James. Net Energy Metering, Zero Net Energy, and The Distributed Energy Resource Future. Rocky Mountain Institute, 2015. Print.P, John. “Complete Guide to Installing a Solar Panel.” Complete Guide to Installing a Solar Panel. Geek Beat, 9 Sept. 2013. Web. 3 Apr. 2015. <http://geekbeat.tv/the-complete-guide-to-installing-a-pv- photovoltaic-solar-panel-system/>.Parsons, Sarah. “The Price Is Wrong: New Report Calls for Fossil Fuel Prices That Reflect Environmental Costs.” World Resource Institute, 31 July 2014. Web. 13 Apr. 2015. <http://www.wri.org/ blog/2014/07/price-wrong-new-report-calls-fossil-fuel-prices-reflect-environmental-costs>.“Photovoltaic Effect: An Introduction to Solar Cells.” Sustainable Energy Science and Engineering Center. Florida State University. Web. 22 Apr. 2015. <https://esc.fsu.edu/documents/lectures/ ECS2005/SuntoSolar.pdf>.“Planning and Zoning for Solar Energy.” American Planning Association. American Planning Association, 2015. Web. 7 May 2015. <https://www.planning.org/research/solar/faq.htm>.“Renewable Portfolio Standard.” California Renewables Portfolio Standard (RPS). California Public Utilities Commission, 2007. Web. 3 Apr. 2015. <http://www.cpuc.ca.gov/PUC/energy/ Renewables/>.Renewable Portfolio Standard Quarterly Report. California Public Utilities Commission, 2014. Print.“SREC FAQ.” Solar Renewable Energy Credit (SREC). SolSystems, 2015. Web. 29 Apr. 2015. <http://www. solsystemscompany.com/our-resources/srec-prices-and-knowledge/srec-faq>.Schainblatt, Glenn. “Sebastopol.” Telephone interview. 24 Feb. 2015.“Sebastopol Building Code: Chapter 15.” Building Code. City of Sebastopol, 2015. Web. <http://ci.sebastopol.ca.us/sites/default/files/mgourley/title_15_entire_document_updated_ november_18_2014.pdf>.Shahan, Zachary. “Lancaster Home Solar Mandate — 1st In US (& World?) — Leads City Into 2014.” CleanTechnica. CleanTechnica, 4 Jan. 2014. Web. 5 Apr. 2015. <http://cleantechnica. com/2014/01/04/lancaster-home-solar-mandate-1st-us-world-leads-city-2014/>.

References
Re
fere
nc
es
100
Solar Ordinance Feasibility Study
Sheppard, Kate. “Solar Jobs Report Shows Huge Growth.” The Huffington Post. TheHuffingtonPost. com, 16 Jan. 2015. Web. 1 May 2015. <http://www.huffingtonpost.com/2015/01/16/solar-jobs- growth-us_n_6490050.html>.“Should You Buy or Lease Your Solar Panel System?” EnergySage. EnergySage. Web. 14 Apr. 2015. <https:// www.energysage.com/solar/financing/should-you-buy-or-lease-your-solar-panel-system>.“Solar Easement and the Solar Shade Control Act.” Solar Easement and the Solar Shade Control Act. U.S. Department of Energy, 2015. Web. 14 Apr. 2015. <http://energy.gov/savings/solar-easement-and- solar-shade-control-act>.“Solar Electricity.” Make Your Power with Solar Power. Energy Upgrade California, 2015. Web. 6 May 2015. <http://www.energyupgradeca.org/en/save-energy/home/make-your-power/make-your-power- with-solar-power>.“Solar Industry Facts and Figures.” SEIA. SEIA, 2015. Web. 7 May 2015. <http://www.seia.org/research- resources/solar-industry-data>.“Solar Investment Tax Credit (ITC).” SEIA. SEIA, 2015. Web. 7 May 2015. <http://www.seia.org/policy/ finance-tax/solar-investment-tax-credit>.“Solar Leasing For Your Home.” Solar Leasing For Your Home. Sunrun, 2015. Web. 15 Apr. 2015. <http:// www.sunrun.com/solar-lease>.“Solar PPA for Home.” Solar PPA Financing. Solar City, 2015. Web. 2 Apr. 2015. <http://www.solarcity.com/ residential/solar-ppa>.“State Solar Jobs.” California- The Solar Foundation. California Solar Foundation, 2015. Web. 2 May 2015. <http://pre.thesolarfoundation.org/solarstates/california>.“Study Shows Rooftop Solar Adds Thousands To Home Resale Values.” CleanTechnica. CleanTechnica, 17 Dec. 2013. Web. 5 Apr. 2015. <http://cleantechnica.com/2013/12/17/study-shows-rooftop-solar- adds-thousands-to-home-resale-values/>.Suttida. “How the Weather Affects Solar Panel Performance.” Solar Reviews. Solar Reviews, 4 Mar. 2013. Web. 7 May 2015. <http://www.solarreviews.com/news/how-the-weather-affects-solar-panel- performance/>.“The California Solar Rights Act.” The California Solar Rights Act. State of California, 2015. Web. 7 May 2015. <http://solar-rights.com/files/THE_CALIFORNIA_SOLAR_RIGHTS_ACT2.pdf>.“The External Costs of Fossil Fuels.” Energy and Policy Institute. Energy and Policy Institute, 2014. Web. 4 May 2015. <http://www.energyandpolicy.org/value-of-solar-versus-fossil-fuels-part-two>.“The History of Solar.” Energy Efficiency and Renewable Energy. U.S. Department of Energy. Web. 2 Apr. 2015. <https://www1.eere.energy.gov/solar/pdfs/solar_timeline.pdf>.“The Impact of Photovoltaic Systems on Market Value and Marketability.” Colorado Energy Office, 1 May 2013. Web. 8 May 2015. <http://www.colorado.gov/cs/Satellite?blobcol=urldata&blobheadernam e1=Content-Disposition&blobheadername2=Content-Type&blobheadervalue1=inline;+filename%3D %22PV_Case+Studies.pdf%22&blobheadervalue2=application/pdf&blobkey%>.“The Numbers: Why We Work for Cleaner Energy.” Environmental Defense Fund. Environmental Defense Fund. Web. 2 Apr. 2015. <http://www.edf.org/energy/energy-surprising-facts-and-what-they-mean>.The President’s Climate Action Plan. Executive Office of the President, 2013. Print.“Understanding California’s Electricity Prices.” BloomEnergy. BloomEnergy, 2015. Web. 1 May 2015. <http:// c0688662.cdn.cloudfiles.rackspacecloud.com/downloads_pdf_White_Paper_Calif_Elec_Prices.pdf>.“Which Solar Panel Type Is Best? Mono-, Polycrystalline or Thin Film?” Energy Informative. Energy Informative, 13 Dec. 2013. Web. 22 Apr. 2015. <http://energyinformative.org/best-solar-panel- monocrystalline-polycrystalline-thin-film/>.

Re
fere
nc
es
References
101
Darya Oreizi
Wilson, Wendy. Burning Our Rivers. River Network, 2012. Print.

