solar heat worldwide 2012 - iea shc · with prefabricated solar-active roof and façade elements...
TRANSCRIPT


SOLAR HEAT WORLDWIDE 2012
Solar Heat Worldwide
Markets and Contribution to the Energy Supply 2012E D I T I O N 2 0 1 4
IEA Solar Heating & Cooling Programme, June 2014
Supported by the Austrian Ministry for Transport, Innovation and Technology
Cover: AEE INTEC / Advanced building renovation of a residential building to a plus-energy building
with prefabricated solar-active roof and façade elements
Design, Grafics, Typesetting & Imageprocessing: STEINHUBER INFODESIGN, Graz, Austria
Franz Mauthner and Werner Weiss
AEE INTEC
AEE - Institute for Sustainable Technologies
A-8200 Gleisdorf, Austria
Notice:
The Solar Heating and Cooling Programme functions within a framework created by the International Energy Agency (IEA). Views, findings and publications of
the Solar Heating and Cooling Programme do not necessarily represent the views or policies of the IEA Secretariat or of all its individual member countries.

SOLAR HEAT WORLDWIDE 2012
3
SOLAR HEAT WORLDWIDE 2012
Table of Contents
1 Background · · · · · · · · · · · · · · · · · · · · · · · · · · · · · · · · · · · · · · · · · · · · · · · · · · · · · · · · · · · · · · · · · · · · · · · · · · · · · · · · · · · · · · · · · · · · · · · · · · · · · · · · · · · · · · · · · · · · · · · 4
2 Summary · · · · · · · · · · · · · · · · · · · · · · · · · · · · · · · · · · · · · · · · · · · · · · · · · · · · · · · · · · · · · · · · · · · · · · · · · · · · · · · · · · · · · · · · · · · · · · · · · · · · · · · · · · · · · · · · · · · · · · · · · · · 5
2.1 Preview2013 · · · · · · · · · · · · · · · · · · · · · · · · · · · · · · · · · · · · · · · · · · · · · · · · · · · · · · · · · · · · · · · · · · · · · · · · · · · · · · · · · · · · · · · · · · · · · · · · · · · · · · · · · · · · · · · · · · · · · · · 7
3 Totalcapacity inoperationbyendof2012 · · · · · · · · · · · · · · · · · · · · · · · · · · · · · · · · · · · · · · · · · · · · · · · · · · · · · · · · · · · · · · · · · · · · · · · · · · · · 8
3.1 Generalmarketoverviewof thetotal installedcapacity inoperation · · · · · · · · · · · · · · · · · · · · · · · · · · · · · · · · · · · · · · · · · · · · · · · · · 8
3.2 Total capacityofglazedwatercollectors inoperation · · · · · · · · · · · · · · · · · · · · · · · · · · · · · · · · · · · · · · · · · · · · · · · · · · · · · · · · · · · · · · · · · · · · · 13
3.3 Total capacityofglazedwatercollectors inoperationbyeconomic region · · · · · · · · · · · · · · · · · · · · · · · · · · · · · · · · · · · · · · · · · · · 14
3.4 Total capacityofunglazedwatercollectors inoperation · · · · · · · · · · · · · · · · · · · · · · · · · · · · · · · · · · · · · · · · · · · · · · · · · · · · · · · · · · · · · · · · · · 15
4 Newlyinstalledcapacity in2012andmarketdevelopment · · · · · · · · · · · · · · · · · · · · · · · · · · · · · · · · · · · · · · · · · · · · · · · · · · · 16
4.1 Generalmarketoverviewofnewly installedcapacity · · · · · · · · · · · · · · · · · · · · · · · · · · · · · · · · · · · · · · · · · · · · · · · · · · · · · · · · · · · · · · · · · · · · · 16
4.2 Newly installedcapacityofglazedwatercollectors · · · · · · · · · · · · · · · · · · · · · · · · · · · · · · · · · · · · · · · · · · · · · · · · · · · · · · · · · · · · · · · · · · · · · · · · 22
4.3 Marketdevelopmentofglazedwatercollectorsbetween2000and2012 · · · · · · · · · · · · · · · · · · · · · · · · · · · · · · · · · · · · · · · · · · · 23
4.4 Marketdevelopmentofunglazedwatercollectorsbetween2000and2012 · · · · · · · · · · · · · · · · · · · · · · · · · · · · · · · · · · · · · · · · 25
5 ContributiontotheenergysupplyandCO2reduction · · · · · · · · · · · · · · · · · · · · · · · · · · · · · · · · · · · · · · · · · · · · · · · · · · · · · · · · · · · · 27
5.1 Annual collectoryieldbyeconomic region · · · · · · · · · · · · · · · · · · · · · · · · · · · · · · · · · · · · · · · · · · · · · · · · · · · · · · · · · · · · · · · · · · · · · · · · · · · · · · · · · · · 29
5.2 Annualenergysavingsbyeconomic region · · · · · · · · · · · · · · · · · · · · · · · · · · · · · · · · · · · · · · · · · · · · · · · · · · · · · · · · · · · · · · · · · · · · · · · · · · · · · · · · · 29
5.3 Annual contribution toCO2 reductionbyeconomic region · · · · · · · · · · · · · · · · · · · · · · · · · · · · · · · · · · · · · · · · · · · · · · · · · · · · · · · · · · · · · · · 30
6 Distributionofsystemsbysystemtypeandapplication · · · · · · · · · · · · · · · · · · · · · · · · · · · · · · · · · · · · · · · · · · · · · · · · · · · · · · · · 31
6.1 Distributionby typeofsolar thermal collector · · · · · · · · · · · · · · · · · · · · · · · · · · · · · · · · · · · · · · · · · · · · · · · · · · · · · · · · · · · · · · · · · · · · · · · · · · · · · · 31
6.2 Distributionby typeofsystem · · · · · · · · · · · · · · · · · · · · · · · · · · · · · · · · · · · · · · · · · · · · · · · · · · · · · · · · · · · · · · · · · · · · · · · · · · · · · · · · · · · · · · · · · · · · · · · · · · 32
6.3 Distributionbykindofapplication · · · · · · · · · · · · · · · · · · · · · · · · · · · · · · · · · · · · · · · · · · · · · · · · · · · · · · · · · · · · · · · · · · · · · · · · · · · · · · · · · · · · · · · · · · · · · 33
7 Exceptionalmarketsandapplicationsforsolarthermalsystems · · · · · · · · · · · · · · · · · · · · · · · · · · · · · · · · · · · · · · · · · · · · · · · 36
7.1 Overviewofglobalmegawatt-scalesolar thermalapplications · · · · · · · · · · · · · · · · · · · · · · · · · · · · · · · · · · · · · · · · · · · · · · · · · · · · · · · · 36
7.2 Large-scalesolardistrictheatingandcoolingapplications inEurope · · · · · · · · · · · · · · · · · · · · · · · · · · · · · · · · · · · · · · · · · · · · · · · · · 37
7.3 Market forsolarair conditioningandcoolingapplications · · · · · · · · · · · · · · · · · · · · · · · · · · · · · · · · · · · · · · · · · · · · · · · · · · · · · · · · · · · · · · · 38
7.4 Goodpracticeexamplesofworld-wide installedsolarprocessheatapplications · · · · · · · · · · · · · · · · · · · · · · · · · · · · · · · · · · · · 39
7.5 Market forSolarAirHeatingSystems · · · · · · · · · · · · · · · · · · · · · · · · · · · · · · · · · · · · · · · · · · · · · · · · · · · · · · · · · · · · · · · · · · · · · · · · · · · · · · · · · · · · · · · · · 40
8 Appendix · · · · · · · · · · · · · · · · · · · · · · · · · · · · · · · · · · · · · · · · · · · · · · · · · · · · · · · · · · · · · · · · · · · · · · · · · · · · · · · · · · · · · · · · · · · · · · · · · · · · · · · · · · · · · · · · · · · · · · · · · · · 41
8.1 Methodological approach for theenergycalculation · · · · · · · · · · · · · · · · · · · · · · · · · · · · · · · · · · · · · · · · · · · · · · · · · · · · · · · · · · · · · · · · · · · · · · 41
8.2 Referencecollectors · · · · · · · · · · · · · · · · · · · · · · · · · · · · · · · · · · · · · · · · · · · · · · · · · · · · · · · · · · · · · · · · · · · · · · · · · · · · · · · · · · · · · · · · · · · · · · · · · · · · · · · · · · · · · · · 47
8.3 Referenceclimates · · · · · · · · · · · · · · · · · · · · · · · · · · · · · · · · · · · · · · · · · · · · · · · · · · · · · · · · · · · · · · · · · · · · · · · · · · · · · · · · · · · · · · · · · · · · · · · · · · · · · · · · · · · · · · · · 47
8.4 Populationdata · · · · · · · · · · · · · · · · · · · · · · · · · · · · · · · · · · · · · · · · · · · · · · · · · · · · · · · · · · · · · · · · · · · · · · · · · · · · · · · · · · · · · · · · · · · · · · · · · · · · · · · · · · · · · · · · · · · · · 48
8.5 Marketdataof thepreviousyears · · · · · · · · · · · · · · · · · · · · · · · · · · · · · · · · · · · · · · · · · · · · · · · · · · · · · · · · · · · · · · · · · · · · · · · · · · · · · · · · · · · · · · · · · · · · · · 49
8.6 References to reportsandpersons thathavesupplied thedata · · · · · · · · · · · · · · · · · · · · · · · · · · · · · · · · · · · · · · · · · · · · · · · · · · · · · · · · 53
8.7 ListofFigures · · · · · · · · · · · · · · · · · · · · · · · · · · · · · · · · · · · · · · · · · · · · · · · · · · · · · · · · · · · · · · · · · · · · · · · · · · · · · · · · · · · · · · · · · · · · · · · · · · · · · · · · · · · · · · · · · · · · · · · 58
8.8 ListofTables · · · · · · · · · · · · · · · · · · · · · · · · · · · · · · · · · · · · · · · · · · · · · · · · · · · · · · · · · · · · · · · · · · · · · · · · · · · · · · · · · · · · · · · · · · · · · · · · · · · · · · · · · · · · · · · · · · · · · · · · · 59

1 Background
This report was prepared within the framework of the Solar Heating and Cooling Programme (SHC) of the Interna-
tional EnergyAgency(IEA).Thegoal of the report is todocument thesolar thermal capacity installed in the important
markets worldwide, and to ascertain the contribution of solar thermal systems to the supply of energy and the CO2
emissionsavoidedasa result of operating these systems. Thecollectorsdocumentedareunglazedcollectors, glazed
flat-plate collectors (FPC) and evacuated tube collectors (ETC) with water as the energy carrier as well as glazed and
unglazed air collectors.
The data were collected from a survey of the national delegates of the SHC Programme’s Executive Committee and
other national experts active in the field of solar thermal energy. As some of the 58 countries included in this report
haveverydetailed statistics andothers haveonly estimates fromexperts, thedatawas checked for its plausibility on
the basis of various publications.
Starting with the collector area, respectively the capacity installed, the contributions of solar thermal systems to-
wards the supply of energy and the reduction of CO2 were ascertained.
The 58 countries included in this report represent 4.4 billion people, or about 63% of the world’s population. The in-
stalled capacity in these countries is estimated to represent 95% of the solar thermal market worldwide.
4
SOLAR HEAT WORLDWIDE 2012
Figure 1: Countries represented in this report

2 Summary
This report comprises solar thermal market data from 58 countries covering an estimated 95% of the worldwide
market.
Total installed capacity in operation worldwide by the end of 2012
By the end of 2012, an installed capacity of 269.3 GWth, corresponding to a total of 384.7 million square meters1 of
collector area was in operation in the 58 countries recorded in this report.
The vast majority of the total capacity in operation was installed in China (180.4 GWth) and Europe (42.8 GWth),
which together account for 83% of the total installed. The remaining installed capacity was shared between the
United States and Canada (17.2 GWth), Asia excluding China (10.3 GWth), Latin America (7.4 GWth), Austra-
lia and New Zealand (5.4 GWth), the MENA2 countries Israel, Jordan, Lebanon, Morocco and Tunisia (4.9 GWth) and
the Sub-Sahara African countries Mozambique, Namibia, South Africa and Zimbabwe (1.0 GWth).
Thebreakdownof the cumulated capacity in operation in 2012by collector type is 26.4%glazed flat-plate collectors,
64.6% evacuated tube collectors, 8.4% unglazed water collectors, and 0.6% glazed and unglazed air collectors.
The leading countries in cumulated unglazed and glazed water collector capacity in operation in 2012 per 1,000 in-
habitants were Cyprus (548 kWth/1,000 inhabitants), Austria (420 kWth/1,000 inhabitants), Israel (385 kWth/1,000
inhabitants), Barbados (320 kWth/1,000 inhabitants), Greece (268 kWth/1,000 inhabitants), Australia (233 kWth/
1,000 inhabitants),Germany (145 kWth/1,000 inhabitants), Turkey (136 kWth/1,000 inhabitants),China (134 kWth/
1,000 inhabitants) and Jordan (121 kWth/1,000 inhabitants).
Newly installed capacity worldwide in 2012
In the year 2012, a capacity of 52.7 GWth, corresponding to 75.3 million square meters of solar collectors, was in-
stalled worldwide. This means an increase in new collector installations of 9.4% compared to the year 2011.
The main markets were in China (44.7 GWth) and Europe (3.7 GWth), which together accounted for 92% of the new
collector installations in 2012. The rest of the market was shared between Asia excluding China (1.3 GWth), Latin
America represented by Brazil, Chile and Mexico (1.0 GWth), the United States and Canada (0.8 GWth), Australia
(0.7 GWth), the MENA region represented by Israel, Jordan, Lebanon, Morocco and Tunisia (0.4 GWth) and the Sub-
Sahara African countries Mozambique, South Africa and Zimbabwe (0.1 GWth).
The breakdown of the newly installed capacity in 2012 by collector type is 15.9% glazed flat-plate collectors, 81.0%
evacuated tube collectors, 3.0% unglazed water collectors and 0.2% glazed and unglazed air collectors.
5
SOLAR HEAT WORLDWIDE 2012
1 To compare the installed capacity of solar thermal collectors with other energy sources, solar thermal experts agreed upon a
methodology to convert installed collector area into solar thermal capacity at a joint meeting of the IEA SHC Programme and major
solar thermal trade associations held September 2004 in Gleisdorf, Austria. The represented associations from Austria, Canada,
Germany, the Netherlands, Sweden and United States as well as the European Solar Thermal Industry Federation (ESTIF) and the
IEA SHC Programme agreed to use a factor of 0.7 kWth/m² to derive the nominal capacity from the area of installed collectors.
2 Middle East and North Africa

The leading countries in newly install unglazed and glazed water collector capacity in 2012 per 1,000 inhabitants
wereChina (33 kWth/1,000 inhabitants); Australia (29 kWth/1,000 inhabitants); Israel (29 kWth/1,000 inhabitants),
Austria (18 kWth/1,000 inhabitants); Greece (16 kWth/1,000 inhabitants); Denmark (14 kWth/1,000 inhabitants);
Turkey (14 kWth/1,000 inhabitants); Switzerland (14 kWth/1,000 inhabitants); Cyprus (14 kWth/1,000 inhabitants)
and Lebanon (10 kWth/1,000 inhabitants).
Contribution to the energy supply and CO2 reduction
The annual collector yield of all water-based solar thermal systems in operation by the end of 2012 was 227.8 TWh
(= 820 PJ) in the 58 recorded countries. This corresponds to an energy savings equivalent to 24.5 million tons of oil
and 79.1 million tons of CO2.
Distribution of systems by system type and application
The thermal use of the sun’s energy varies greatly from region to region across the globe. It can be roughly distin-
guished by the type of solar thermal collector used (unglazed water collectors, evacuated tube collectors, flat plate
collectors, glazed and unglazed air collectors, concentrating collectors), the type of system operation (pumped solar
thermal systems, thermosiphon systems), and the main type of application (swimming pool heating, domestic hot
water preparation, space heating, heating of industrial processes, solar district heating or solar thermal cooling).
Forunglazedandglazedwater collectors, theevacuated tubecollectordominatedwitha65%shareof thecumulated
capacity inoperationanda82%shareof thenewly installedcapacity. InChina, vacuumtubecollectorsplayedan im-
portant role, and since this was by far the largest market, the worldwide figures tend towards a higher share of this
type of solar thermal collector.
Unglazed water collectors accounted for 8% of the cumulated water collectors installed worldwide and the share
tended to decrease. In 2012 the share of unglazed water collectors was 3% of the newly installed capacity.
Worldwide, around75%of all solar thermal systems installedare thermosiphon systemsand25%arepumpedsolar
heating systems. Similar to the distribution by type of solar thermal collector in total numbers, the Chinese market
influenced the overall figures most, and in 2012 89% of the newly installed systems were estimated to be thermo-
siphon systems while pumped systems only accounted for 11%.
In general, thermosiphon systems are more common in warm climates such as in Africa, South and East Asia (ex-
cluding China), Latin America, southern Europe and the MENA region. In these regions thermosiphon systems are
moreoftenequippedwith flat plate collectors,while inChina the typical thermosiphonsystemfordomestichotwater
preparation is equipped with evacuated tubes.
Thecalculatednumberofwater-basedsolar thermal systems inoperationwasapproximately78millionby theendof
2012. The breakdown is 8% used for swimming pool heating, 78% used for domestic hot water preparation in single
family houses, and 9% attached to larger domestic hot water consumers, such as multifamily houses, hotels, hospi-
tals, schools, etc.Around4%of theworldwide installedcapacity suppliedheat forbothdomestichotwaterandspace
heating (solar combi-systems). The remainingsystemsaccounted for about1%oralmost4million squaremetersof
solar thermal collectorsanddeliveredheat todistrict heatingnetworks, industrial processesor thermallydrivensolar
cooling applications.
Compared to the cumulated installed capacity, the share of swimming pool heating was much less for new installa-
tions (8% of total capacity and only 2% of newly installed capacity). To a lesser extent, this is also true for domestic
6
SOLAR HEAT WORLDWIDE 2012

hot water systems in single-family houses. Here the share shows a declining trend, but with a share of 77% in 2012
this is still themost commonapplication for solar thermal systemsworldwide. Thesharesof large-scaledomestic hot
water applications tended to increase (9% of total capacity and already 17% of newly installed capacity) while the
share of solar-combi systems remained at a low level of 3–4%.
The calculated number of different types of solar thermal systems in operation was approximately 78 million.
2.1 Preview 2013
The estimated total capacity of solar thermal collectors in operation worldwide by the end of 2013 is 330 GWth, or
471 million squaremetersof collector area. This corresponds toanannual collector yieldof 281 TWh,which is equiv-
alent to savings of 30.1 million tons of oil and 97.4 million tons of CO23.
The preview for 2013 is based on latest market data from Austria, Brazil, China, Germany, India, Japan, Mexico,
Portugal and Spain, which represent more than 90% of the global solar thermal market. The other countries were
estimated according to their trend over the past two years.
Compared with other forms of renewable energy, solar heating’s contribution in meeting global energy demand is,
besides the traditional renewableenergies likebiomassandhydropower, secondonly towindpower (Figure2). And
in installed capacity, solar thermal is the leader.
Employment
Based on data collected from the detailed country reports, the number of jobs in the fields of production, installation
and maintenance of solar thermal systems is estimated to be 460,000 worldwide in 2013.
7
SOLAR HEAT WORLDWIDE 2012
Total capacity in operation and produced energy , 2013[GW ], [GW ] [TWh /a], [TWh /a]el th el th
0
100
200
300
400
500
600
700
Solar Thermal
Heat
Wind Power Geothermal
Power
Solar ThermalPhotovoltaic
Power
Ocean Tidal
Power
Total capacity in operation [GW] 2013
Produced energy [Twh] 2013
heat power
330318
138
12 3 1
281
662
160
76
5 1
Figure 2: Total capacity in operation [GWel], [GWth] 2013 and annual energy generated [TWhel], [TWhth]
(Sources: AEE INTEC, GWEC, EPIA, IEA PVPS, Navigant Research, Ocean Energy Systems, REN21,
U.S. Geothermal Energy Association)
3 The preview 2013 represents a projection of 100% of the solar thermal market world-wide.

3 Total capacity in operation by end of 2012
This report aims togive theactual collector area inoperationandnot the cumulated collector area that haseverbeen
installed inacountry.Todetermine thecollectorarea(andrespectivecapacity) inoperation,eitherofficial country re-
ports on the lifetime were used or, if such reports were not available, a 25-year lifetime for a system was calculated.
The collector area in operation was then calculated using a linear equation. For China, the methodology of the
Chinese Solar Thermal Industry Federation (CSTIF) was used. According to the CSTIF approach the operation
lifetime is considered to be less than 10 years.
The analysis further aims to distinguish between different types of solar thermal collectors, such as unglazed water
collectors, glazed water collectors including flat plate collectors (FPC) and evacuated tube collectors (ETC) as well as
unglazed and glazed air collectors.
3.1 General market overview of the total installed capacity in operation
By the end of 2012, an installed capacity of 269.3 GWth corresponding to a total of 384.7 million square meters of
collector area was in operation in the 58 countries recorded in this report. These 58 countries represent 4.4 billion
people, which is 63% of the world’s population. The installed capacity in these countries represents more than 95%
of the solar thermal market worldwide.
The vast majority of the total capacity in operation was installed in China (180.4 GWth) and Europe (42.8 GWth),
which together accounted for 83% of the total installed. The remaining installed capacity was shared between the
United States and Canada (17.2 GWth), Asia excluding China (10.3 GWth), Latin America (7.4 GWth), Austra-
lia and New Zealand (5.4 GWth), the MENA countries Israel, Jordan, Lebanon, Morocco and Tunisia (4.9 GWth) and
Sub-Sahara African countries Mozambique, Namibia, South Africa and Zimbabwe (1.0 GWth).
8
SOLAR HEAT WORLDWIDE 2012
USA / Canada
Asia excl. China
Latin America
Australia / New Zealand
MENA Region
Sub-Sahara Africa
6.4%
3.8%
2.7%
2.0%
1.8%
0.4%
Others
17.1%
China
67.0%
Europe
15.9%
Sub-Sahara Africa: Mozambique, Namibia, South Africa, Zimbabwe
Asia excluding China: India, Japan, Korea South, Taiwan, Thailand
Latin America: Brazil, Chile, Mexico, Uruguay
Europe: EU 28, Albania, Macedonia, Norway, Switzerland, Russia, Turkey
MENA Region: Israel, Jordan, Lebanon, Morocco, Tunisia
Figure 3: Share of the total installed capacity in operation (glazed and unglazed water and air collectors)
by economic region at the end of 2012

9
SOLAR HEAT WORLDWIDE 2012
CountryWater Collectors Air Collectors
TOTAL [MWth]unglazed FPC ETC unglazed glazed
Albania 77.8 0.6 78.3
Australia 3,045.0 2,035.6 47.6 196.0 5.0 5,329.2
Austria 391.0 3,002.7 55.7 1.3 3,450.8
Barbados* 92.2 92.2
Belgium 31.5 230.6 38.5 300.7
Brazil 1,620.3 4,163.1 5,783.4
Bulgaria 84.0 1.4 85.5
Canada 544.7 43.0 25.0 244.8 16.9 874.4
Chile*** 56.0 56.0
China 12,177.7 168,212.3 180,390.0
Croatia# 84.0 84.0
Cyprus 1.5 605.7 16.2 623.4
Czech Republic 327.6 235.1 61.5 624.2
Denmark 14.4 444.0 6.0 2.3 12.6 479.3
Estonia 2.8 1.8 4.6
Finland 8.2 21.2 4.5 34.0
France (mainland) + 74.0 1,623.3 29.5 3.5 0.8 1,731.1
Germany 409.9 10,095.4 1,282.4 21.5 11,809.2
Greece 2,872.9 12.5 2,885.4
Hungary 9.5 118.1 35.8 1.3 1.0 165.6
India 3,521.7 994.0 14.1 4,529.8
Ireland 129.2 61.2 190.4
Israel 22.3 2,901.5 0.4 2,924.2
Italy 30.6 2,048.6 333.5 2,412.7
Japan 3,064.8 58.3 352.1 3,475.2
Jordan*** 4.2 611.4 171.3 786.8
Korea. South 1,179.4 1,179.4
Latvia 2.0 0.8 2.8
Lebanon*** 163.8 204.4 368.2
Lithuania 2.3 1.9 4.2
Luxembourg 24.5 3.3 27.9
Macedonia* 17.5 0.5 18.0
Malta 25.2 8.6 33.8
Mexico 582.1 610.6 228.2 0.2 5.6 1,426.7
Morocco*** 343.9 343.9
Mozambique 0.2 0.2
Namibia** 14.5 0.9 15.4
Netherlands 293.1 300.2 11.9 605.2
New Zealand* 4.9 100.1 6.8 111.8
Norway 1.4 22.0 1.9 2.1 27.4
Poland 641.6 206.5 848.1
Portugal 1.5 661.9 15.5 678.9
Romania 56.5 21.0 77.5
Russia# 12.3 0.9 13.2
Slovakia 88.1 14.8 102.9
Slovenia 117.3 13.5 130.8
South Africa 606.8 266.7 80.9 954.5
Spain 93.9 1,862.9 117.2 2,074.0
Sweden 91.0 182.0 42.0 315.0
Switzerland 148.1 686.7 51.1 613.3 1,499.2
Taiwan 1.6 927.1 75.3 1,003.9
Thailand 84.3 84.3
Tunisia 415.1 32.3 447.5
Turkey 9,580.2 1,268.4 10,848.5
United Kingdom 376.6 120.2 13.3 510.1
United States 14,311.4 1,853.3 82.1 66.7 14.0 16,327.4
Uruguay** 8.8 8.8
Zimbabwe 13.1 0.6 13.7
TOTAL 22,670 70,983 174,061 1,142 447 269,303
Note: If no data is given: no reliable database for this collector type is available.
FPC: flat plate collector; ETC: evacuated tube collector
* Total capacity in operation refers to the year 2009
** Total capacity in operation refers to the year 2011
*** Total capacity in operation is based on estimations for new installations in 2012
# New included countries compared to the 2013 edition of this report
+ The figures for France relate to mainland France only, overseas territories of France (DOM) are not considered
Table 1: Total capacity in operation by the end of 2012 [MWth]

10
SOLAR HEAT WORLDWIDE 2012
CountryWater Collectors Air Collectors
TOTAL [m²]unglazed FPC ETC unglazed glazed
Albania 111,135 786 111,921
Australia 4,350,000 2,908,000 68,000 280,000 7,200 7,613,200
Austria 558,601 4,289,605 79,542 1,908 4,929,656
Barbados* 131,690 131,690
Belgium 45,000 329,469 55,064 429,533
Brazil 2,314,735 5,947,321 8,262,056
Bulgaria 120,050 2,050 122,100
Canada 778,102 61,475 35,695 349,750 24,140 1,249,162
Chile*** 80,009 80,009
China 17,396,732 240,303,268 257,700,000
Croatia# 120,000 120,000
Cyprus 2,147 865,269 23,095 890,511
Czech Republic 468,000 335,813 87,925 891,738
Denmark 20,515 634,310 8,584 3,264 18,000 684,673
Estonia 3,930 2,590 6,520
Finland 11,779 30,251 6,472 48,502
France (mainland) + 105,699 2,318,973 42,129 5,053 1,117 2,472,971
Germany 585,600 14,422,000 1,832,000 30,720 16,870,320
Greece 4,104,200 17,800 4,122,000
Hungary 13,500 168,700 51,100 1,800 1,450 236,550
India 5,031,000 1,420,000 20,200 6,471,200
Ireland 184,524 87,444 271,968
Israel 31,817 4,145,000 550 4,177,367
Italy 43,766 2,926,580 476,420 3,446,766
Japan 4,378,220 83,340 502,949 4,964,509
Jordan*** 5,940 873,420 244,674 1,124,034
Korea, South 1,684,824 1,684,824
Latvia 2,850 1,190 4,040
Lebanon*** 234,000 292,000 526,000
Lithuania 3,300 2,700 6,000
Luxembourg 35,050 4,750 39,800
Macedonia* 25,020 724 25,744
Malta 36,000 12,293 48,293
Mexico 831,508 872,305 326,063 300 7,983 2,038,159
Morocco*** 491,261 491,261
Mozambique 273 273
Namibia** 20,699 1,307 22,006
Netherlands 418,783 428,859 17,000 864,642
New Zealand* 7,025 142,975 9,644 159,645
Norway 2,007 31,445 2,674 2,961 39,088
Poland 916,500 295,000 1,211,500
Portugal 2,128 945,587 22,090 969,805
Romania 80,700 30,000 110,700
Russia# 17,601 1,297 18,898
Slovakia 125,920 21,080 147,000
Slovenia 167,550 19,250 186,800
South Africa 866,871 381,044 115,597 1,363,512
Spain 134,191 2,661,260 167,373 2,962,824
Sweden 130,000 260,000 60,000 450,000
Switzerland 211,540 980,970 72,980 876,154 2,141,644
Taiwan 2,254 1,324,383 107,546 1,434,183
Thailand 120,360 120,360
Tunisia 593,038 46,180 639,218
Turkey 13,685,943 1,811,970 15,497,913
United Kingdom 537,990 171,683 19,000 728,673
United States 20,444,848 2,647,521 117,232 95,239 20,000 23,324,841
Uruguay** 12,571 12,571
Zimbabwe 18,761 807 19,568
TOTAL 32,386,356 101,404,238 248,658,408 1,631,110 638,628 384,718,741
Note:
If no data is given: no reliable database for this collector type is available.
FPC: flat plate collector; ETC: evacuated tube collector
* Total capacity in operation refers to the year 2009
** Total capacity in operation refers to the year 2011
***Total capacity in operation is based on estimations for new installations in 2012
# New included countries compared to the 2013 edition of this report
+ The figures for France relate to mainland France only, overseas territories of France (DOM) are not considered
Table 2: Total installed collector area in operation by the end of 2012 [m²]

The total installed capacity in operation by end of 2012 is divided into flat plate collectors (FPC): 71 GWth (101.4 mil-
lion square meters), evacuated tube collectors (ETC): 174.1 GWth (248.7 million square meters), unglazed water
collectors 22.7 GWth (32.4 million square meters), and glazed and unglazed air collectors: 1.6 GWth (2.3 million
square meters).
With a share of 65%, evacuated tube collectors are the predominant solar thermal collector technology worldwide,
followedby flat plate collectors with 26%andunglazedwater collectors with 8%. Air collectors only play a minor role
in total numbers (Figure 4).
By contrast in Europe, the second largest marketplace for solar thermal collectors to China, flat plate collectors are
much more widespread (Figure 5).
11
SOLAR HEAT WORLDWIDE 2012
Unglazed collector
8.4%
Flat plate collector
26.4%
Evacuated tube
collector
64.6%
Air collector
0.6%
Figure 4: Distribution of the total installed capacity in operation by collector type in 2012 - WORLD
Unglazed collector
4.5%
Flat plate collector
84.9%
Evacuated
tube collector
9.0%
Air collector
1.6%
Figure 5: Distribution of the total installed capacity in operation by collector type in 2012 - EUROPE

Figure6shows thecumulated installedcapacityofglazedandunglazedwater collectors inoperation for the10 lead-
ing markets in 2012 in total numbers. Compared to the year 2011 the ranking has remained the same.
China, as the world leader in total capacity, is focusing very much on evacuated tube collectors, whereas the United
States is holding second position due to its high installation of unglazed water collectors. Only in Australia, and to
some extent in Brazil, do unglazed water collectors also play an important role. The rest of the “Top 10 countries” are
clearly focusing on flat plate collector technology.
The leading countries in cumulated unglazed and glazed water collector capacity in operation in 2012 per 1,000 in-
habitants were Cyprus (548 kWth/1,000 inhabitants), Austria (420 kWth/1,000 inhabitants), Israel (385 kWth/1,000
inhabitants), Barbados (320 kWth/1,000 inhabitants), Greece (268 kWth/1,000 inhabitants), Australia (233 kWth/
1,000 inhabitants),Germany (145 kWth/1,000 inhabitants), Turkey (136 kWth/1,000 inhabitants),China (134 kWth/
1,000 inhabitants), and Jordan (121 kWth/1,000 inhabitants).
12
SOLAR HEAT WORLDWIDE 2012
flat plate collectorsunglazed water collectors evacuated tube collectors
16,247
11,78810,849
5,7835,128
4,516
3,449 3,123 2,924
0
2,000
4,000
6,000
8,000
10,000
12,000
14,000
16,000
18,000
20,000
China Israel
180,390
Capacity
[MW ]th
GermanyUSA Turkey Brazil Australia India Austria Japan
Figure 6: Top 10 countries of cumulated water collector installations (absolute figures in MWth)
flat plate collectorsunglazed water collectors evacuated tube collectors
China JordanIsrael Barbados Greece
548
420
385
320
268
233
145 136 134121
0
50
100
150
200
250
300
350
400
450
500
550
600
Capacity [kW per 1,000 inh.]th
Germany TurkeyAustraliaAustriaCyprus
Figure 7: Top 10 countries of cumulated water collector installations
(relative figures in kWth per 1,000 inhabitants)

3.2 Total capacity of glazed water collectors in operation
Withmore than180 GWth,China is the leaderby far in termsof total installedcapacityofglazedwatercollectors.With
more than 10 GWth of installed capacity Germany and Turkey are next. Several countries, namely India, Brazil,
Japan, Austria, Israel, Greece, Italy, Australia, Spain, the United States, France, South Korea, and Taiwan had more
than 1 GWth of water collectors installed by end of 2012 (Figure 8).
In terms of total installed capacity of glazed water collectors in operation per 1,000 inhabitants, there was a continued
dominance by 5 countries: Cyprus ahead of Israel, Austria, Barbados and Greece. China is catching up with the Top
10 and almost reached the levels of Germany and Turkey (Figure 9).
13
SOLAR HEAT WORLDWIDE 2012
180,390
11,3
78
10,8
49
4,5
16
4,1
63
3,1
23
3,0
58
2,9
02
2,8
85
2,3
82
2,0
83
1,9
80
1,9
35
1,6
53
1,1
79
1,0
02
848
839
783
738
677
622
497
450
447
368
348
344
312
297
269
224
190
154
131
107
103
92
85
84
84
78
77
68
56
34
28
26
24
18
15
14
13
9
5 4
3
10
100
1,000
10,000
100,000
1,000,000
Capacity [MW ]th
Chin
a
Germ
any
Turk
ey
India
Bra
zil
Japan
Austr
ia
Isra
el
Gre
ece
Ita
ly
Austr
alia
Spain
USA
Fra
nce
Kore
a,South
Taiw
an
Pola
nd
Mexic
o
Jord
an
Sw
itzerland
Port
ugal
Cypru
s
United
Kin
gdom
Denm
ark
Tunis
ia
Lebanon
South
Afr
ica
Moro
cco
Neth
erlands
Czech
Republic
Belg
ium
Sw
eden
Ire
land
Hungary
Slo
venia
New
Zeala
nd
Slo
vakia
Barb
ados
Bulg
aria
Thailand
Cro
atia
Alb
ania
Rom
ania
Canada
Chile
Malta
Luxem
bourg
Fin
land
Norw
ay
Macedonia
Nam
ibia
Zim
babw
e
Russia
Uru
guay
Esto
nia
Lithuania
Latv
ia
Figure 8: Total capacity of glazed water collectors in operation by the end of 2012
Cypru
s
Isra
el
Austr
ia
Barb
ados
Gre
ece
Germ
any
Turk
ey
Chin
a
Jord
an
Austr
alia
Sw
itzerland
Lebanon
Malta
Denm
ark
Slo
venia
Port
ugal
Luxem
bourg
Taiw
an
Spain
Tunis
ia
Ire
land
Ita
ly
Czech
Republic
Alb
ania
Belg
ium
Fra
nce
New
Zeala
nd
Japan
Kore
a,South
Sw
eden
Pola
nd
Bra
zil
Slo
vakia
Cro
atia
Neth
erlands
Hungary
Bulg
aria
Moro
cco
Macedonia
United
Kin
gdom
Mexic
o
South
Afr
ica
USA
Fin
land
Norw
ay
India
Esto
nia
Rom
ania
Chile
Uru
guay
Canada
Latv
ia
Thailand
Lithuania
Zim
babw
e
Nam
ibia
Russia
546.4
382.2
372.1
320.4
268.0
139.9
136.0
134.3
120.2
94.6
93.1
88.9
82.5
81.2
65.5
62.8
54.7
43.1
42.1
41.7
40.3
38.9
28.0
26.1
25.8
25.2
24.7
24.5
24.1
23.4
22.1
20.9
18.8
18.7
18.7
15.5
12.1
10.6
8.7
7.9
7.2
7.1
6.2
4.9
4.8
3.7
3.6
3.5
3.3
2.7
2.0
1.3
1.3
1.2
1.1
0.7
0.1
0
100
200
300
400
500
600
Capacity [kW per 1,000 inh.]th
Figure 9: Total capacity of glazed water collectors in operation in kWth per 1,000 inhabitants by the end of 2012

3.3 Total capacity of glazed water collectors in operation by economic region
14
SOLAR HEAT WORLDWIDE 2012
180,390
40,176
9,9055,159 4,844 2,190 2,003 377
0
20,000
40,000
60,000
80,000
100,000
120,000
140,000
160,000
180,000
200,000
Capacity [MW ]th
Sub-Sahara
Africa
Asia excl.
China
Australia /
New Zealand
Latin
America
Europe MENA
Region
USA /
Canada
China
Figure 10: Total capacity of glazed flat plate and evacuated tube collectors in operation
by economic region by the end of 2012
134.3
83.179.0
66.7
15.3
6.7 5.8 4.4
0
20
40
60
80
100
120
140
160
Capacity [kW /1,000 inh.]th
Sub-Sahara
Africa
Asia excl.
China
Australia /
New Zealand
Latin
America
EuropeMENA
Region
USA /
Canada
China
Sub-Sahara Africa: Mozambique, Namibia, South Africa, Zimbabwe
Asia excluding China: India, Japan, Korea South, Taiwan, Thailand
Latin America: Brazil, Chile, Mexico, Uruguay
Europe: EU 28, Albania, Macedonia, Norway, Switzerland, Russia, Turkey
MENA Region: Israel, Jordan, Lebanon, Morocco, Tunisia
Figure 11: Total capacity of glazed flat plate and evacuated tube collectors in operation
by economic region and in kWth per 1,000 inhabitants by the end of 2012

3.4 Total capacity of unglazed water collectors in operation
84% of the total capacity of unglazed water collectors in operation is installed in three countries: the United States,
Australia and Brazil (Figure 12).
Relative to the inhabitantsofacountry, the largestmarketpenetration forunglazedcollectorscanbe found inAustra-
lia (138.3 kWth/1,000 inhabitants), followedbyAustria (47.6 kWth/1,000 inhabitants), theUnitedStates (45.6 kWth/
1,000 inhabitants), and the Czech Republic (30.9 kWth/1,000 inhabitants).
15
SOLAR HEAT WORLDWIDE 2012
14,3
11
3,0
45
1,6
20
607
582
545
410
391
328
293
148
94
91
74
31
31
22
14
9 8
5 4
2 2 1 1
10
100
1,000
10,000
100,000
USA
Austr
alia
Bra
zil
South
Afr
ica
Mexic
o
Canada
Germ
any
Austr
ia
Czech
Republic
Neth
erlands
Sw
itzerland
Spain
Sw
eden
Fra
nce
Belg
ium
Ita
ly
Isra
el
Denm
ark
Hungary
Fin
land
New
Zeala
nd
Jord
an
Taiw
an
Cypru
s
Port
ugal
Norw
ay
Capacity [MW ]th
Figure 12: Total capacity of unglazed water collectors in operation by the end of 2012
138.3
47.6
45.6
30.9
18.7
17.5
15.9
12.4
9.5
8.1
5.0
5.0
3.0
2.9
2.6
2.0
1.6
1.3
1.1
1.1
0.9
0.6
0.5
0.3
0.1
0.1
0
20
40
60
80
100
120
140
160
Austr
alia
Austr
ia
USA
Czech
Republic
Sw
itzerland
Neth
erlands
Canada
South
Afr
ica
Sw
eden
Bra
zil
Germ
any
Mexic
o
Belg
ium
Isra
el
Denm
ark
Spain
Fin
land
Cypru
s
New
Zeala
nd
Fra
nce
Hungary
Jord
an
Ita
ly
Norw
ay
Port
ugal
Taiw
an
Capacity [kW /1,000 inh.]th
Figure 13: Total capacity of unglazed water collectors in operation in kWth per 1,000 inhabitants
by the end of 2012

4 Newly installed capacity in 2012 and market development
4.1 General market overview of newly installed capacity
In the year 2012, a total capacity of 52.7 GWth, corresponding to 75.3 million square meters of solar collectors, was
installed worldwide. This means an increase in new collector installations of 9.4% compared to the year 2011. In
comparison, the market growth in the period 2010/2011 amounted to 14.3%.
Themain markets were in China (44.7 GWth) andEurope (3.7 GWth), which together accounted for 92%of theover-
all new collector installations in 2012. The rest of the market was shared between Asia excluding China (1.3 GWth),
LatinAmerica representedbyBrazil, ChileandMexico (1.0 GWth), theUnitedStates and Canada(0.8 GWth),Austra-
lia (0.7 GWth), the MENA region represented by Israel, Jordan, Lebanon, Morocco and Tunisia (0.4 GWth) and the
Sub-Sahara African countries Mozambique, South Africa and Zimbabwe (0.1 GWth).
The global market growth rate of 9.4% in the period 2011/2012 was mainly driven by the large markets in China
(+10.9%), Brazil (+11.8%), India (+44.4%) and the United States (+2.7%). In other major solar thermal markets
such as in Australia (–4.7%), Germany (–9.5%), Israel (–16.5%), Italy (–15.4%), and Turkey (–10.1%) declines
were recorded.
In terms of economic regions, there was positive market growth in the period 2011/2012 in Asia, Latin America and
theUnitedStateswhereas inSub-SaharaAfrica, Australia, Europeand theMENA region solar thermal system instal-
lations dropped.
In China, the growth rates between 2000 and 2011 were on average around 23% and since then have been leveling
off (+17.6% in 2010/2011, +10.6% in 2011/2012, +3.3% in 2012/2013).
16
SOLAR HEAT WORLDWIDE 2012
2.4%
2.0%
1.5%
1.3%
0.8%
Others 8.1%
0.2%
China
84.9%
Europe
6.9%
Asia excl. China
Latin America
USA / Canada
Australia
MENA Region
Sub-Sahara Africa
Sub-Sahara Africa: Mozambique, South Africa, Zimbabwe
Asia excluding China: India, Japan, Korea South, Taiwan, Thailand
Latin America: Brazil, Chile, Mexico
Europe: EU 28, Albania, Norway, Switzerland, Russia, Turkey
MENA Region: Israel, Jordan, Lebanon, Morocco, Tunisia
Figure 14: Share of the newly installed capacity (glazed and unglazed water and air collectors)
by economic regions in 2012

Of all the Asian countries covered in this report, positive market figures were reported for China (+10.9%), India
(+44.4%), Japan (+1.2%), South Korea (+16.5%), Taiwan (+ 5.5%), and Thailand (+ 19.9%).
In Latin American, countries with positive market growth were Brazil (+11.8%), Chile (+15%) and Mexico
(+11.0%).
Themarketdecline inSub-SaharaAfrica ismainlycausedbythe6.7%reductionofnew installations inSouthAfrica.
Israel, the largestandmostmaturemarket in theMENAregion, reportedanegativegrowthrateof–16.5%for2012.
Of the top 10 European countries only four countries—Poland, France, Greece and Denmark—reported a positive
growth rate. A significant decreaseof –7.2%was reported for all of Europewith the largermarketsTurkey,Germany,
Italy, Spain, Austria and Switzerland experiencing significant market declines.
The United States and Canada experienced a market growth of 16.1% in 2009/2010 followed by a significant de-
crease of –21.7% in 2010/2011, and recovered again in 2011/2012 (+1.2%)
In Australia, the market for water collectors declined for a third year in a row, –5.4% in the period 2009/2010,
–10.4% in the period 2010/2011, and –4.7% in the period 2011/2012.
17
SOLAR HEAT WORLDWIDE 2012
Sub-Sah.
Africa
Asia excl.
China
Australia Latin
America
Europe MENA
Region
USA /
Canada
WORLD
–6.0
%
–4.7
%
11.7
%
10.9
%
–7.2
%
–6.9
%
1.2
%
9.4
%
35%
30%
25%
20%
15%
10%
5%
0%
5%
–10%
–
Market growth 2011 / 2012
China
34.4
%
Sub-Sahara Africa: Mozambique, South Africa, Zimbabwe
Asia excluding China: India, Japan, Korea South, Taiwan, Thailand
Latin America: Brazil, Chile, Mexico
Europe: EU 28, Albania, Norway, Switzerland, Russia, Turkey
MENA Region: Israel, Jordan, Lebanon, Morocco, Tunisia
Figure 15: Market growth of newly installed capacity between 2011 and 2012 by economic region

18
SOLAR HEAT WORLDWIDE 2012
CountryWater Collectors Air Collectors
TOTAL [MWth]unglazed FPC ETC unglazed glazed
Albania 14.7 0.1 14.8
Australia 455.0 167.6 21.3 24.5 0.7 669.1
Austria 1.7 140.6 3.9 0.6 146.7
Belgium 35.4 8.1 43.4
Brazil 367.9 438.1 806.0
Bulgaria 5.2 0.4 5.6
Canada 50.1 4.6 5.5 11.1 8.7 79.8
Chile* 15.3 15.3
China 3,500.0 41,230.0 44,730.0
Croatia # 9.6 9.6
Cyprus 0.0 14.5 1.0 15.5
Czech Republic 35.0 25.9 9.1 70.0
Denmark 78.8 0.4 79.1
Estonia 0.6 0.6 1.3
Finland 2.1 0.7 2.8
France (mainland) + 168.5 6.1 3.2 0.7 178.5
Germany 725.2 79.8 805.0
Greece 169.1 1.1 170.1
Hungary 1.1 24.5 10.5 0.2 0.2 36.4
India 374.5 640.5 5.6 1,020.6
Ireland 13.0 5.7 18.7
Israel 0.8 217.4 218.2
Italy 198.7 32.3 231.0
Japan 111.1 2.2 5.6 118.9
Jordan* 38.2 9.6 47.8
Korea, South 44.6 44.6
Latvia 0.1 0.1 0.2
Lebanon* 30.8 15.4 46.2
Lithuania 0.4 0.8 1.3
Luxembourg 2.3 0.6 2.9
Malta 1.0 0.4 1.4
Mexico 76.7 66.7 66.7 210.0
Morocco* 55.0 55.0
Mozambique 0.1 0.1
Netherlands 19.2 19.6 5.6 44.4
Norway 10.7 0.6 1.4 12.6
Poland 151.2 60.2 211.4
Portugal 0.1 58.5 5.0 63.6
Romania 6.0 4.9 10.9
Russia # 4.3 0.2 4.5
Slovakia 4.6 0.7 5.3
Slovenia 9.5 2.1 11.6
South Africa 34.3 15.5 35.2 85.1
Spain 2.5 147.7 8.8 159.1
Sweden 0.6 5.8 2.1 8.5
Switzerland 8.3 87.9 12.1 108.3
Taiwan 0.0 74.0 8.3 82.3
Thailand 15.9 15.9
Tunisia 52.0 1.5 53.5
Turkey 802.4 334.6 1,137.0
United Kingdom 33.5 8.0 3.5 45.0
United States 530.2 160.8 8.4 10.5 9.8 719.7
Zimbabwe 0.6 0.4 1.0
TOTAL 1,583.4 8,354.1 42,651.7 52.9 33.2 52,675.3
Note: If no data is given: no reliable database for this collector type is available.
FPC: flat plate collector; ETC: evacuated tube collector
No data from Barbados, Macedonia, Namibia, New Zealand and Uruguay
* Country market data for new installations in 2012 estimated by AEE INTEC
# New included countries compared to the 2012 edition of this report
+ The figures for France relate to mainland France only, overseas territories of France (DOM) are not considered
Table 3: newly installed capacity in 2012 [MWth/a]

New installations in2012aredivided into flatplatecollectors:8.4 GWth (12.0millionsquaremeters), evacuated tube
collectors: 42.7 GWth (60.9million squaremeters), unglazedwater collectors: 1.6 GWth (2.3million squaremeters,)
and glazed and unglazed air collectors: 0.09 GWth (0.12 million square meters).
19
SOLAR HEAT WORLDWIDE 2012
CountryWater Collectors Air Collectors
TOTAL [m²]unglazed FPC ETC unglazed glazed
Albania 21,060 140 21,200
Australia 650,000 239,400 30,450 35,000 1,000 955,850
Austria 2,410 200,800 5,590 830 209,630
Belgium 50,500 11,500 62,000
Brazil 525,508 625,855 1,151,363
Bulgaria 7,400 600 8,000
Canada 71,510 6,513 7,812 15,824 12,359 114,018
Chile* 21,893 21,893
China 5,000,000 58,900,000 63,900,000
Croatia # 13,750 13,750
Cyprus 24 20,646 1,439 22,109
Czech Republic 50,000 37,000 13,000 100,000
Denmark 112,500 500 113,000
Estonia 900 900 1,800
Finland 3,000 1,000 4,000
France (mainland) 240,750 8,750 4,500 1,000 255,000
Germany 1,036,000 114,000 1,150,000
Greece 241,500 1,500 243,000
Hungary 1,500 35,000 15,000 300 250 52,050
India 535,000 915,000 8,000 1,458,000
Ireland 18,516 8,148 26,664
Israel 1,200 310,500 311,700
Italy 283,800 46,200 330,000
Japan 158,741 3,208 7,950 169,899
Jordan* 54,531 13,705 68,236
Korea, South 63,774 63,774
Latvia 150 150 300
Lebanon* 44,000 22,000 66,000
Lithuania 600 1,200 1,800
Luxembourg 3,250 900 4,150
Malta 1,499 510 2,009
Mexico 109,500 95,250 95,250 300,000
Morocco* 78,572 78,572
Mozambique 143 143
Netherlands 27,396 27,972 8,000 63,368
Norway 15,236 795 1,983 18,014
Poland 216,000 86,000 302,000
Portugal 182 83,624 7,090 90,896
Romania 8,500 7,000 15,500
Russia # 6,097 287 6,384
Slovakia 6,500 1,000 7,500
Slovenia 13,500 3,000 16,500
South Africa 49,068 22,176 50,344 121,588
Spain 3,591 211,060 12,623 227,274
Sweden 910 8,251 3,006 12,167
Switzerland 11,815 125,609 17,287 154,711
Taiwan 5 105,698 11,848 117,551
Thailand 22,660 22,660
Tunisia 74,238 2,180 76,418
Turkey 1,146,298 478,000 1,624,298
United Kingdom 47,893 11,382 5,000 64,275
United States 757,400 229,700 12,000 15,000 14,000 1,028,100
Zimbabwe 802 570 1,372
TOTAL 2,262,019 11,934,463 60,931,007 75,624 47,372 75,250,486
Note: If no data is given: no reliable database for this collector type is available.
FPC: flat plate collector; ETC: evacuated tube collector
No data from Barbados, Macedonia, Namibia, New Zealand and Uruguay
* Country market data for new installations in 2012 estimated by AEE INTEC
# New included countries compared to the 2012 edition of this report
+ The figures for France relate to mainland France only, overseas territories of France (DOM) are not considered
Table 4: New Installed collector area in 2012 [m²/a]

With a share of 81%, evacuated tube collectors are by far the most important solar thermal collector technology
worldwide (Figure16). In aglobal context this breakdown ismainly drivenby thedominanceof theChinesemarket
where more than 86% of all newly installed collectors in 2012 were evacuated tube collectors.
By contrast, in Europe the situation is almost the opposite with more than 86% of all solar thermal systems installed
in 2012 being flat plate collectors (Figure 17).
Figure 18 shows the newly installed capacity of glazed and unglazed water collectors for the 10 leading markets in
2012 in total numbers.Compared to thenewly installed capacity in2011,China remained themarket leader inabso-
lute terms followed by Turkey.
20
SOLAR HEAT WORLDWIDE 2012
Unglazed water
collector
3.0%
Flat plate
collector
15.9%
Evacuated tube
collector
81.0%
Air collector
0.2%
Figure 16: Distribution of the newly installed capacity by collector type in 2012 - WORLD
Unglazed water
collector
2.5%
Flat plate collector
86.2%
Evacuated tube
collector
10.9%
Air collector
0.3%
Figure 17: Distribution of the newly installed capacity by collector type in 2012 – EUROPE
China IsraelItaly Poland
1,137
44,730
1,015806
699 644
231 218 211
0
500
1,000
1,500
2,000
2,500
3,000
3,500
4,000
4,500
5,000
USA
Capacity
[MW ]th flat plate collectors evacuated tube collectors unglazed water collectors
GermanyTurkey AustraliaBrazilIndia
805
Figure 18: Top 10 markets for glazed and unglazed water collectors in 2012 (absolute figures in MWth)

Germany faced a significant market decline in 2012 and hence fell behind India and Brazil within the top 10 ranking.
Poland entered the top 10 in 2012 as one of the most dynamic markets in Europe in recent years replacing Spain
where the market has halved over the last four years.
As illustrated in Figure 19 China is leading as well with a remarkable 33.3 kWth of newly installed solar thermal
capacity per 1,000 inhabitants in 2012 ahead of Australia, Israel, Austria and Greece.
Denmark is ranked insixthposition,but it isworthmentioning that themajorityof theDanishsystemsare largescale
(>5,000 m²) and hydraulically connected to district heating systems (see Chapter 7.2).
By contrast, Australia is ranked second, which is mainly due to the country’s large market share of unglazed water
collectors that are used primarily for swimming pool heating.
21
SOLAR HEAT WORLDWIDE 2012
GreeceChina LebanonIsrael
flat plate collectors evacuated tube collectors unglazed water collectors
33.3
29.2 28.7
17.8
15.814.3 13.7 13.6
11.2
0
5
10
15
20
25
30
35
40
Capacity
[kW per 1,000 inh.]th
Denmark SwitzerlandTurkey CyprusAustralia Austria
14.3
Figure 19: Top 10 markets for glazed and unglazed water collectors in 2012
(relative figures in kWth per 1,000 inhabitants)

4.2 Newly installed capacity of glazed water collectors
In 2012 glazed water collectors (evacuated tube and flat plate collectors) accounted for 96.8% of the total installed
capacity (Figure 16).
For glazed water collectors, the solar thermal market in 2012 grew by 9.6% with China once again as the strong
driverof thispositivedevelopment.Within the top10glazedwaterheatermarketsGermany fell behind India in2012
and Poland passed Australia and Spain (Figure 20).
In terms of newly installed glazed water collector capacity per 1,000 inhabitants, China is the leader ahead of Israel
and Austria. Compared to the year 2011, Cyprus fell behind Greece, Denmark and Turkey (Figure 21).
22
SOLAR HEAT WORLDWIDE 2012
44,730
1,1
37
1,0
15
805
438
231
217
211
189
175
170
169
157
144
133
113
100
82
79
63
55
53
51
48
46
45
43
41
35
35
25
19
16
15
15
15
12
11
11
10
10
8
6 5 4
3 3
1 1 1
1
0.2
0.1
1.0
10.0
100.0
1,000.0
10,000.0
100,000.0
Capacity [MW ]th
Chin
a
Turk
ey
India
Germ
any
Bra
zil
Ita
ly
Isra
el
Pola
nd
Austr
alia
Fra
nce
(m
ain
land)
Gre
ece
USA
Spain
Austr
ia
Mexic
o
Japan
Sw
itzerland
Taiw
an
Denm
ark
Port
ugal
Moro
cco
Tunis
ia
South
Afr
ica
Jord
an
Lebanon
Kore
a,South
Belg
ium
United
Kin
gdom
Hungary
Czech
Republic
Neth
erlands
Ire
land
Thailand
Cypru
s
Chile
Alb
ania
Slo
venia
Norw
ay
Rom
ania
Canada
Cro
atia
Sw
eden
Bulg
aria
Slo
vakia
Russia
Luxem
bourg
Fin
land
Malta
Esto
nia
Lithuania
Zim
babw
e
Latv
ia
Figure 20: Newly installed capacity of glazed water collectors in 2012
Chin
a
Isra
el
Austr
ia
Gre
ece
Denm
ark
Turk
ey
Cypru
s
Sw
itzerland
Lebanon
Germ
any
Austr
alia
Jord
an
Port
ugal
Slo
venia
Luxem
bourg
Pola
nd
Tunis
ia
Alb
ania
Belg
ium
Ire
land
Ita
ly
Taiw
an
Hungary
Malta
Spain
Czech
Republic
Fra
nce
(m
ain
land)
Norw
ay
Bra
zil
Cro
atia
Moro
cco
Neth
erlands
Mexic
o
South
Afr
ica
Esto
nia
Slo
vakia
Kore
a,South
Chile
Japan
India
Sw
eden
Bulg
aria
United
Kin
gdom
USA
Fin
land
Rom
ania
Lithuania
Canada
Thailand
Latv
ia
Zim
babw
e
Russia
33.3
28.6
17.6
15.8
14.3
14.3
13.6
12.6
11.2
9.9
8.6
7.3
5.9
5.8
5.7
5.5
5.0
4.9
4.2
4.0
3.8
3.5
3.5
3.4
3.3
3.3
2.7
2.2
2.2
2.1
1.7
1.5
1.1
1.0
1.0
1.0
0.9
0.9
0.9
0.8
0.8
0.8
0.7
0.5
0.5
0.5
0.4
0.3
0.2
0.1
0.1
0.0
0
5
10
15
20
25
30
35
Capacity [kW /yr/1,000 inh.]th
Figure 21: Newly installed capacity of glazed water collectors in 2012 in kWth per 1,000 inhabitants

4.3 Market development of glazed water collectors between 2000 and 2012
The worldwide market of glazed water collectors is characterized by a steady growth over the past 12 years with
China as the main driver for this positive development. Between 2000 and 2012, the average growth rate worldwide
was around 20% and between 2006 and 2012 the annual installed glazed water collector area worldwide tripled.
Compared to the year 2011, the growth rate has dropped from 15.3% to 9.6% in 2012 (Figure 22).
In 2000 the Chinese market was about three times as large as the European market while in 2012 the Chinese market
volume exceeded it 13-fold (Figure 23).
23
SOLAR HEAT WORLDWIDE 2012
29%27%
10%
20%
9%
12%
26%
23%
34%
27%
14%
15%
10%
0
5
10
15
20
25
30
35
40
45
50
55
Capacity [GW /year]th
0%
5%
10%
15%
20%
25%
30%
35%
40%
45%
50%
55%
market growth rate [%]
China
Europe
RoW
market growth [%]
2000 2001 2002 2003 2004 2005 2006 2007 2008 2009 2010 2011 2012
Europe: EU 28, Albania, Norway, Switzerland, Turkey
RoW: Asia (India, Japan, Korea South, Taiwan, Thailand), Australia, Canada, Latin America (Brazil, Chile, Mexico),
MENA Region (Israel, Jordan, Lebanon, Morocco, Tunisia), South Africa, United States
Figure 22: Global market development of glazed water collectors from 2000 to 2012
4.55.7
7.08.4
9.510.5
12.6
16.1
21.7
29.4
34.3
40.3
44.7
1.4 1.6 1.2 1.6 1.5 1.8
3.0 3.14.4 4.1 3.8 3.8 3.6
0
5
10
15
20
25
30
35
40
45
50
2000 2001 2002 2003 2004 2005 2006 2007 2008 2009 2010 2011 2012
Capacity [GW /year]th
China
Europe
Figure 23: Market development of glazed water collectors in China and Europe
In 2008 the European market peaked and since then the market has been declining. By contrast, in the remaining
markets worldwide an upwards trend can be observed (indicated as RoW (Rest of World) in Figure 24).
RoW includes all economic regions other than China and Europe (Figure 25). Of these countries, Asia (excluding
China) and Latin America hold the largest market shares and both regions show a steady upwards trend mainly due
to the developments in India and Brazil.
In 2012 theMENA region saw a16.5%decrease in its largestmarket, Israel, whichholdsmore than50%of the solar
thermal capacity installed. Also South Africa, the only country with a considerable solar thermal market in Sub-Sa-
hara Africa, reported a market decline of 6.7% in 2012.
The Australian market has seen a significant market decline since 2009. The annual installed capacity almost halved
from364 MWth in2009 to189 MWth in2012. In theUnitedStates andCanada, themarket for glazedwater collectors
has more or less stagnated, since 2008.
24
SOLAR HEAT WORLDWIDE 2012
2000 2001 2002 2003 2004 2005 2006 2007 2008 2009 2010 2011 2012
1.41.6
1.2
1.6 1.5
1.8
3.03.1
4.4
4.1
3.8 3.8
3.6
0.8
1.1 1.0 1.1 1.1 1.21.3
1.51.7
1.9
2.32.4
2.7
0.0
0.5
1.0
1.5
2.0
2.5
3.0
3.5
4.0
4.5
5.0
Capacity [GW /year]th
Europe
RoW
Figure 24: Market development of glazed water collectors in Europe and the Rest of World (excluding China)
0
150
300
450
600
750
900
1,050
1,200
1,350
Capacity [MW /year]th
Asia excl. China Latin America
MENA Region Australia
USA / Canada South Africa
2000 2001 2002 2003 2004 2005 2006 2007 2008 2009 2010 2011 2012
Figure 25: Market development of glazed water collectors in Rest of World (excluding China and Europe)

In relative figures, theannualglobalmarketvolumeforglazedwatercollectorsgrewfrom1.8 kWthper1,000 inhabit-
ants in 2000 to 12.0 kWth per 1,000 inhabitants in 2012 (Figure 26).
It can be noted that in 2012 China has the highest market penetration in terms of glazed water collector installations
per capita not only compared to other economic regions, but also compared to all other countries covered in this re-
port. The annual installed capacity rose from 3.5 kWth per 1,000 inhabitants in 2000 to 33.3 kWth per 1,000 inhabit-
ants in 2012. Worldwide, only Israel shows a comparable market penetration of 28.6 kWth per 1,000 inhabitants in
2012 as can be seen in Figure 21.
In Europe, the market penetration peaked in 2008 with 7.4 kWth per 1,000 inhabitants and since then a constant
downwards trend in per capita installations can be observed leading to a value of 5.9 kWth per 1,000 inhabitants in
2012.
The other economic regions showed a slow, but steady upwards trend at a low market penetration level. Here, the
annual installedcapacity rose from0.4 kWthper1,000 inhabitants in2000to1.2 kWthper1,000 inhabitants in2012.
4.4 Market development of unglazed water collectors between 2000 and 2012
In 2012 unglazed water collectors accounted for 3.0% of the total installed capacity (Figure 16) and compared to
the year 2011 the market grew moderately by 2.1%.
The most important markets for unglazed collectors in 2012 were the United States (530 MWth), Australia
(455 MWth), and Brazil (368 MWth). The three countries accounted for 85% of the recorded unglazed water collector
installations. Another 14% were installed in Mexico, Canada, the Czech Republic, South Africa, and the Netherlands.
Only 1% was installed in other countries (Figure 27).
25
SOLAR HEAT WORLDWIDE 2012
1.8 2.2 2.4 2.8 3.0 3.44.2
5.1
6.8
8.69.7
11.112.0
0.0
2.5
5.0
7.5
10.0
12.5
15.0
17.5
20.0
22.5
25.0
27.5
30.0
32.5
35.0
Capacity [kW /year/1,000 inh.]th
China
Europe
RoW
global trend
2000 2001 2002 2003 2004 2005 2006 2007 2008 2009 2010 2011 2012
Figure 26: Annual installed capacity of glazed water collectors in kWth per 1,000 inhabitants from 2000 to 2012

Although the unglazed water collector market in the United States faced a heavy market downturn between 2006
and 2011, the global annual market volume for unglazed water collectors remained at a constant level between
1.5 GWth and1.75 GWth (Figure27). The reason for thisdevelopment is theBrazilianmarket,whichentered in2007
and has grown steeply since then (Figure 28).
26
SOLAR HEAT WORLDWIDE 2012
0
200
400
600
800
1,000
1,200
1,400
1,600
1,800
2,000
2000 2001 2002 2003 2004 2005 2006 2007 2008 2009 2010 2011 2012
Capacity [MW /year]th
USA
Australia
Brazil
RoW
Figure 27: Global market development of unglazed water collectors from 2000 to 2012
0
100
200
300
400
500
600
700
800
900
1,000
1,100
2000 2001 2002 2003 2004 2005 2006 2007 2008 2009 2010 2011 2012
Capacity [MW /year]th
USA
Australia
Brazil
RoW
Figure 28: Global market development of unglazed water collectors from 2000 to 2012
5 Contribution to the energy supply and CO2 reduction
In this section, the contribution of the total installed glazed and unglazed water collectors in operation to the thermal
energy supply and CO2 reduction is shown.
The basis for these calculations is the total glazed and unglazed water collector area in operation in each country as
shown inTable1. Thecontributionof the total installedair collector capacity inoperation in2012of1.6 GWth wasnot
taken into consideration—with a share of around 0.6% of the total installed collector capacity these collectors were
omitted from the calculation.
The results are basedon calculations using the simulation tool T-SOLexpert 4.5 (www.valentin.de) for each country.
For thesimulations, different typesof collectorsandapplicationsaswell as thecharacteristic climatic conditionswere
considered for each country. A more detailed description of the methodology can be found in the appendix (see
Chapter 8.1).
Theannual collector yieldof allwater-basedsolar thermal systems inoperationby theendof2012 in the58 recorded
countrieswas227.8 TWh(= 820 PJ). This corresponds toanenergysavingsequivalentof24.5million tonsof oil and
79.1 million tons of CO2. The calculated number of different types of solar thermal systems in operation was around
78 million (Table 5).
The most important field of application for solar thermal systems is heating domestic hot water (see section 6.3),
and therefore, this type of application also accounted for the highest savings in terms of oil equivalent and CO2. In
2012, 92% of the energy provided by solar thermal systems worldwide was used for heating domestic hot water,
mainly by small-scale systems in single family houses and larger applications attached to multi-family houses, hotels,
schools, etc. Swimming pool heating held a share of 10% in the contribution to the energy supply and CO2 reduction
and the remaining 2% was met by solar combi systems.
Table 5 summarizes the calculatedannual collector yields and the correspondingoil equivalents andCO2 reductions
of all water-based solar thermal systems (systems for hot water, spaceheatingand swimmingpool heating) in oper-
ation by the end of 2012.
27
SOLAR HEAT WORLDWIDE 2012
6% Swimming pool heating
82% Domestic hot water systems for single family houses
10% Large domestic hot water systems
2% Solar combi systems
Figure 29: Share of energy savings and CO2 reduction
by type of application of glazed and unglazed water collectors in operation by the end of 2012

In Chapters 5.1 to 5.3, the annual collector yield, energy savings and CO2 savings by economic regions and world-
wide are graphed.
28
SOLAR HEAT WORLDWIDE 2012
CountryTotal
collector area[m²]
Totalcapacity[MWth]
Calculatednumber
of systems
Collector yield[GWh/a]
Energy savings[toe/a]
CO2 reduction[tCO2/a]
Albania 111,921 78 14,347 78 8,412 27,193
Australia 7,326,000 5,128 1,010,588 4,598 494,147 1,597,429
Austria 4,927,748 3,449 490,570 2,094 225,104 727,693
Barbados 131,690 92 32,923 116 12,491 40,379
Belgium 429,533 301 107,383 182 19,544 63,180
Brazil 8,262,056 5,783 1,329,864 5,785 621,816 2,010,145
Bulgaria 122,100 85 22,455 64 6,841 22,116
Canada 875,272 613 14,333 457 49,120 158,790
Chile 80,009 56 10,065 60 6,451 20,854
China 257,700,000 180,390 58,742,715 149,837 16,104,526 52,061,101
Croatia 120,000 84 30,000 65 6,949 22,465
Cyprus 890,511 623 196,236 791 85,064 274,987
Czech Republic 891,738 624 60,205 382 41,074 132,780
Denmark 663,409 464 77,712 286 30,766 99,457
Estonia 6,520 5 1,630 3 303 978
Finland 48,502 34 12,126 21 2,298 7,430
France (mainland) 2,466,801 1,727 387,400 1,194 128,321 414,824
Germany 16,839,600 11,788 1,841,364 6,939 745,807 2,410,971
Greece 4,122,000 2,885 1,591,106 3,164 340,057 1,099,302
Hungary 233,300 163 27,008 109 11,671 37,730
India 6,451,000 4,516 1,224,561 5,423 582,826 1,884,103
Ireland 271,968 190 62,943 114 12,239 39,564
Israel 4,176,817 2,924 1,381,826 3,910 420,271 1,358,610
Italy 3,446,766 2,413 590,603 2,119 227,796 736,395
Japan 4,461,560 3,123 1,094,867 2,610 280,508 906,799
Jordan 1,124,034 787 198,953 1,064 114,325 369,580
Korea, South 1,684,824 1,179 242,952 854 91,753 296,611
Latvia 4,040 3 1,010 2 200 648
Lebanon 526,000 368 113,353 448 48,185 155,766
Lithuania 6,000 4 1,500 3 290 939
Luxembourg 39,800 28 9,950 18 1,923 6,218
Macedonia 25,744 18 3,298 15 1,661 5,370
Malta 48,293 34 12,073 42 4,505 14,563
Mexico 2,029,876 1,421 105,300 1,244 133,710 432,246
Morocco 491,261 344 122,815 439 47,209 152,611
Mozambique 273 0.2 68 0.2 25 81
Namibia 22,006 15 2,718 20 2,158 6,975
Netherlands 864,642 605 130,026 385 41,402 133,839
New Zealand 159,645 112 39,911 103 11,101 35,886
Norway 36,126 25 1,308 14 1,479 4,780
Poland 1,211,500 848 152,447 495 53,173 171,893
Portugal 969,805 679 188,330 753 80,932 261,629
Romania 110,700 77 27,675 66 7,063 22,834
Russia 18,898 13 743 8 847 2,737
Slovakia 147,000 103 24,500 71 7,595 24,551
Slovenia 186,800 131 28,250 78 8,353 27,003
South Africa 1,363,512 954 125,969 904 97,113 313,937
Spain 2,962,824 2,074 341,762 2,063 221,693 716,666
Sweden 450,000 315 34,103 187 20,061 64,851
Switzerland 1,265,490 886 153,112 540 58,026 187,580
Taiwan 1,434,183 1,004 293,158 880 94,586 305,769
Thailand 120,360 84 30,090 103 11,043 35,697
Tunisia 639,218 447 223,551 575 61,751 199,622
Turkey 15,497,913 10,849 3,589,317 13,904 1,494,448 4,831,103
United Kingdom 709,673 497 177,418 295 31,674 102,391
United States 23,209,601 16,247 976,949 11,793 1,267,572 4,097,679
Uruguay 12,571 9 3,143 9 921 2,977
Zimbabwe 19,568 14 4,892 17 1,796 5,808
TOTAL 382,449,002 267,714 77,715,472 227,790 24,482,975 79,146,115
Table 5: Calculated annual collector yield and corresponding oil equivalent and CO2 reduction of glazed and
unglazed water collectors in operation by the end of 2012

5.1 Annual collector yield by economic region
In2012gross solar thermal collector yieldsamounted to227.8TWhworldwide (Table5) and themajor share,82%,
was contributed by domestic hot water applications for single family houses (Figure 29).
Of the thermal energygains,Chinaaccounted for66%(150TWh), Europe16%(37TWh)andRest of theWorld18%
(42 TWh) (Figure 30).
5.2 Annual energy savings by economic region
Considering a utilization ratio of 0.8 for the reference oil boiler, which is assumed to be partly replaced by the solar
thermal system (see methodology Chapter 8.1), the annual final energy savings amounted to 284.7 TWh or
24.5 million tons of oil equivalent in 20124.
The breakdown was China 16.1 million tons oil equivalent; Europe 16.1 million tons oil equivalent, Rest of World
4.5 million tons oil equivalent (Figure 31).
29
SOLAR HEAT WORLDWIDE 2012
150
37
12 10 7 6 5 1
228
0
25
50
75
100
125
150
175
200
225
250
Collector yield [TWh/a]
Sub-
Sahara Africa
Asia excl.
China
AustraliaLatin
America
Europe MENA
Region
USA /
Canada
WORLDChina
Solar combi systems
Swimming pool heating
Large domestic hot water systems
Domestic hot water systems for single family houses
Figure 30: Annual collector yield of unglazed and glazed water collectors in operation by end of 2012
16.1
3.9
1.3 1.1 0.8 0.7 0.5 0.1
24.5
0.0
2.5
5.0
7.5
10.0
12.5
15.0
17.5
20.0
22.5
25.0
27.5
Energy savings [Mio. t /a]oil-e
Sub-
Sahara Africa
Asia excl.
China
AustraliaLatin
America
Europe MENA
Region
USA /
Canada
WORLDChina
Solar combi systems
Swimming pool heating
Large domestic hot water systems
Domestic hot water systems for single family houses
Sub-Sahara Africa: Mozambique, Namibia, South Africa, Zimbabwe
Asia excluding China: India, Japan, Korea South, Taiwan, Thailand
Latin America: Brazil, Chile, Mexico, Uruguay
Europe: EU 28, Albania, Macedonia, Norway,
Switzerland, Russia, Turkey
MENA Region: Israel, Jordan, Lebanon, Morocco, Tunisia
Figure 31: Annual energy savings in oil equivalent
by unglazed and glazed water collectors in operation by end of 2012
4 1 toe = 1.163 x 10⁴ kWh (Defra/DECC 2013)
5.3 Annual contribution to CO2 reduction by economic region
24.5 million tons of oil equivalents correspond to an annual CO2 emission reduction of 79.1 million tons5. Here, the
breakdown was China 52.1 million tons of CO2e; Europe 12.7 million tons of CO2e, Rest of World 14.4 million tons of
CO2e (see Figure 32).
30
SOLAR HEAT WORLDWIDE 2012
52.1
12.7
4.3 3.4 2.5 2.2 1.6 0.3
79.1
0.0
10.0
20.0
30.0
40.0
50.0
60.0
70.0
80.0
90.0
CO reduction2 [Mio. t /a]CO2-e
Sub-
Sahara Africa
Asia excl.
China
AustraliaLatin
America
Europe MENA
Region
USA /
Canada
WORLDChina
Solar combi systems
Swimming pool heating
Large domestic hot water systems
Domestic hot water systems for single family houses
Sub-Sahara Africa: Mozambique, Namibia, South Africa, Zimbabwe
Asia excluding China: India, Japan, Korea South, Taiwan, Thailand
Latin America: Brazil, Chile, Mexico, Uruguay
Europe: EU 28, Albania, Macedonia, Norway,
Switzerland, Russia, Turkey
MENA Region: Israel, Jordan, Lebanon, Morocco, Tunisia
Figure 32: Contribution to CO2 reduction by unglazed and glazed water collectors in operation by end of 2012
5 1 toe (fuel oil) = 3,232.7 kg CO2e (Defra/DECC 2013)

6 Distribution of systems by system type and application
The use of solar thermal energy varies greatly from region to region and can be roughly distinguished by the type of
solar thermal collector used (unglazed water collectors, evacuated tube collectors, flat plate collectors, glazed and
unglazed air collectors, concentrating collectors), the type of system operation (pumped solar thermal systems,
thermosiphon systems), and the main type of application (swimming pool heating, domestic hot water preparation,
space heating, others such as heating of industrial processes, solar district heating or solar thermal cooling).
In Chapters 6.1 to 6.3, the share of these system types and applications are shown by different economic regions
for both the cumulated capacity in operation by the end of 2012 and the newly installed capacity in 20126.
6.1 Distribution by type of solar thermal collector
In terms of the total water collector area, evacuated tube collectors dominatedwith a share of 65%of the cumulated
capacity in operation (Figure 33) and a share of 82% of the newly installed capacity (Figure 34). Especially in
China, vacuum tube collectors played an important role and since this was by far the largest market supported by
high growth rates, the worldwide figures tend towards a higher share of this type of solar thermal collector. Unglazed
water collectors accounted for 8% of the cumulated water collectors installed worldwide and for 3% of the newly
installed capacity.
31
SOLAR HEAT WORLDWIDE 2012
flat plate collectors evacuated tube collectors unglazed water collectors
8%3%
9% 8% 11%
93%
65%
11%
30%41%
67%
86% 91%89%
7%
26%
88%
62%58%
30%
5%
8%
0%
10%
20%
30%
40%
50%
60%
70%
80%
90%
100%
Sub-Sahara
Africa
Asia excl.
China
Australia /
New Zealand
Latin
America
Europe MENA
Region
USA /
Canada
WORLDChina
Sub-Sahara Africa: Mozambique, Namibia, South Africa, Zimbabwe
Asia excluding China: India, Japan, Korea South, Taiwan, Thailand
Latin America: Brazil, Chile, Mexico, Uruguay
Europe: EU 28, Albania, Macedonia, Norway, Switzerland, Russia, Turkey
MENA Region: Israel, Jordan, Lebanon, Morocco, Tunisia
Figure 33: Distribution by type of solar thermal collector
for the total installed water collector capacity in operation by the end of 2012
6 It has to be considered that statistical information summarized in Chapters 6.1 to 6.4 is sometimes based on rough expert
estimations by country representatives only and hence especially the share by type of system and application of the cumulated
installed capacity in operation can deviate significantly from figures published in previous editions of this report.

6.2 Distribution by type of system
Worldwide, about three quarters of all solar thermal systems installed are thermosiphon systems and the rest are
pumpedsolarheatingsystems(Figure35).Similar to thedistributionby typeof solar thermal collector in total num-
bers the Chinese market influenced the overall figures most, and in 2012 89% of the newly installed systems were
estimated to be thermosiphon systems while pumped systems only accounted for 11% (Figure 36).
32
SOLAR HEAT WORLDWIDE 2012
flat plate collectors evacuated tube collectors unglazed water collectors
2% 3% 6%
41%
17%
6%
51%
92%
82%
22%26%
50%
19%
81%93%
49%
8%
16%
76%71%
43% 40%
2% 3%
0%
10%
20%
30%
40%
50%
60%
70%
80%
90%
100%
USA /
Canada
Sub-Sahara
Africa
Asia excl.
China
Australia /
New Zealand
Latin
America
Europe MENA
Region
WORLDChina
Sub-Sahara Africa: Mozambique, South Africa, Zimbabwe
Asia excluding China: India, Japan, Korea South, Taiwan, Thailand
Latin America: Brazil, Chile, Mexico
Europe: EU 28, Albania, Norway, Switzerland, Russia, Turkey
MENA Region: Israel, Jordan, Lebanon, Morocco, Tunisia
Figure 34: Distribution by type of solar thermal collector for the newly installed water collector capacity in 2012
Asia excl.
China
China Sub-Sahara
Africa
Australia /
New Zealand
Latin
America
Europe MENA
Region
USA /
Canada
WORLD
38%44%
50%
73%81% 85%
75%
94%
62%56%
50%
27%19% 15%
4%
25%
6%
96%
0%
10%
20%
30%
40%
50%
60%
70%
80%
90%
100%
Thermosyphon Solar Heating Systems Pumped Solar Heating Systems
Sub-Sahara Africa: Namibia, South Africa
Asia excluding China: India, Japan, Korea South, Taiwan, Thailand
Latin America: Brazil, Chile
Europe: EU 27, Albania, Norway, Switzerland, Turkey
MENA Region: Israel, Jordan, Lebanon, Tunisia
Figure 35: Distribution by type of system for the total installed glazed water collector capacity
in operation by the end of 2012
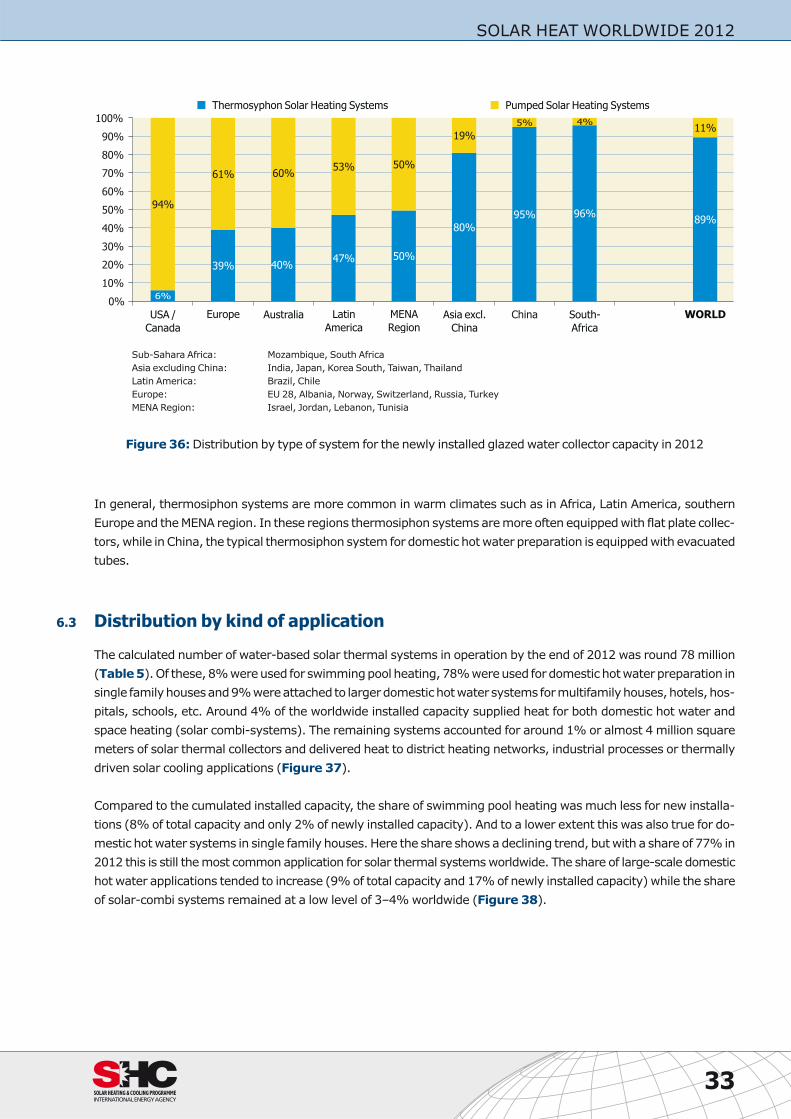
In general, thermosiphon systems are more common in warm climates such as in Africa, Latin America, southern
Europe and the MENA region. In these regions thermosiphon systems are more often equipped with flat plate collec-
tors, while inChina, the typical thermosiphon system for domestic hotwater preparation is equippedwith evacuated
tubes.
6.3 Distribution by kind of application
The calculated number of water-based solar thermal systems in operation by the end of 2012 was round 78 million
(Table5).Of these,8%wereused for swimmingpool heating,78%wereused fordomestichotwaterpreparation in
single familyhousesand9%wereattachedto largerdomestichotwatersystems formultifamilyhouses,hotels,hos-
pitals, schools, etc. Around 4% of the worldwide installed capacity supplied heat for both domestic hot water and
space heating (solar combi-systems). The remaining systems accounted for around 1% or almost 4 million square
meters of solar thermal collectors and delivered heat to district heating networks, industrial processes or thermally
driven solar cooling applications (Figure 37).
Compared to the cumulated installed capacity, the share of swimming pool heating was much less for new installa-
tions (8% of total capacity and only 2% of newly installed capacity). And to a lower extent this was also true for do-
mestic hot water systems in single family houses. Here the share shows a declining trend, but with a share of 77% in
2012 this is still the most common application for solar thermal systems worldwide. The share of large-scale domestic
hot water applications tended to increase (9% of total capacity and 17% of newly installed capacity) while the share
of solar-combi systems remained at a low level of 3–4% worldwide (Figure 38).
33
SOLAR HEAT WORLDWIDE 2012
Asia excl.
China
China South-
Africa
Australia Latin
America
Europe MENA
Region
USA /
Canada
WORLD
39% 40%47% 50%
80%
95%89%
94%
61% 60%53% 50%
19%
5% 4%11%
6%
96%
0%
10%
20%
30%
40%
50%
60%
70%
80%
90%
100%
Thermosyphon Solar Heating Systems Pumped Solar Heating Systems
Sub-Sahara Africa: Mozambique, South Africa
Asia excluding China: India, Japan, Korea South, Taiwan, Thailand
Latin America: Brazil, Chile
Europe: EU 28, Albania, Norway, Switzerland, Russia, Turkey
MENA Region: Israel, Jordan, Lebanon, Tunisia
Figure 36: Distribution by type of system for the newly installed glazed water collector capacity in 2012

34
SOLAR HEAT WORLDWIDE 2012
6% 3% 2%2%
18%
4%8%
10%16%
12%54%
9%
42%36%
21%
90%
54%
82%
62%
43%
78%
57%63%
75%
30%
5% 8%
0%
10%
20%
30%
40%
50%
60%
70%
80%
90%
100%
WORLDChinaUSA /
Canada
Australia Latin
America
Sub-Sahara
Africa
Asia excl.
China
Europe MENA
Region
Swimming pool
heating
Domestic hot water
systems for single
family houses
Large DHW systems
(multi family houses,
tourism and public
sector)
Solar combi systems
(DHW and space
heating for single and
multi family houses)
Other (solar district
heating, solar process
heat, solar cooling)
DHW Domestic hot water
Sub-Sahara Africa: Namibia, South Africa
Asia excluding China: India, Japan, Korea South, Taiwan,
Latin America: Brazil, Chile, Mexico
Europe: EU 18, Albania, Norway, Switzerland, Russia, Turkey
MENA Region: Israel, Jordan, Lebanon, Tunisia
Figure 37: Distribution of solar thermal systems by application for the total installed water collector capacity
by economic region in operation by the end of 2012
Swimming pool
heating
Domestic hot water
systems for single
family houses
Large DHW systems
(multi family houses,
tourism and public
sector)
Solar combi systems
(DHW and space
heating for single and
multi family houses)
Other (solar district
heating, solar process
heat, solar cooling)6% 2% 2% 5%8%
2%
21%
3%
3%17% 18%
16%
53%
17%32%
58%
55%
84%
80% 80%
55%
45%
77%
68%
40%36%
2% 2% 2%
0%
10%
20%
30%
40%
50%
60%
70%
80%
90%
100%
Asia excl.
China
WORLDChinaAustralia South
Africa
Latin
America
Europe MENA
Region
USA /
Canada
DHW Domestic hot water
Asia excluding China: India, Japan, Korea South, Taiwan, Thailand
Latin America: Brazil, Chile, Mexico
Europe: EU 18, Albania, Norway, Switzerland, Russia, Turkey
MENA Region: Israel, Jordan, Lebanon, Tunisia
Figure 38: Distribution of solar thermal systems by application for the newly installed water collector capacity
by economic region in 2012

Of the top 10 markets in terms of newly installed glazed water collector capacity, Germany, Italy, Poland, India, and
Brazil have the most sophisticated markets for different solar thermal applications (Figure 39). The applications in-
clude domestic hot water preparation, space heating of single and multi-family houses, and hotels. In addition a
noteworthy share of other applications include those for solar district heating, solar process heating and solar
cooling.
It should benoted that somecountries appear to “specialize” in certain applications. In Denmark, for example, more
than two thirds of the 2012 newly installed capacity was large-scale solar thermal systems attached to district heat-
ing networks. The data shows that 40,000 m² of solar assisted solar thermal systems were installed in Denmark in
2011, 76,000 m² in 2012, and another 96,000 m² in 2013. By end of 2013 fifty large-scale solar district heating
plants with an average system size of around 7,800 m² were installed in Denmark (see Chapter 7.2). In India a
notable share of concentrating solar thermal collectors are in use and the most commonly used are Scheffler dishes.
They are used for community cooking in temples, prisons, student hostels, community places of stay, etc. Moreover,
solarprocessheat installationswithbothconcentratingandconventionalnon-concentratingcollectorsare increasing
due to rising oil prices.
35
SOLAR HEAT WORLDWIDE 2012
Swimming pool
heating
Domestic hot water
systems for single
family houses
Large DHW systems
(multi family houses,
tourism and public
sector)
Solar combi systems
(DHW and space
heating for single and
multi family houses)
Other (solar district
heating, solar process
heat, solar cooling)5% 2%10%9%
2%
15%15%
59%
3%2% 11%
18% 18%
9%
16%
7%
82%
17%32%
47%
90% 88%79% 80%
76%62%
24%18%
78%
68%
46%
2%
5%
2%
0%
10%
20%
30%
40%
50%
60%
70%
80%
90%
100%
TOP 10China Poland Italy Israel*GermanyTurkeyAustralia Brazil IndiaUSA
* In the MENA region (especially in Israel), but also in China, it is very common to equip multifamily houses with thermosiphon systems
for domestic hot water preparation. A typical system is connected to one apartment. By contrast, in many European countries large pumped
DHW systems in multifamily houses supply DHW or both DHW and space heating to the entire building. When interpreting the figures in
Chapter 6.3 this has to be considered.
Figure 39: Distribution of solar thermal systems by application for the 10 leading markets
of the newly installed glazed water collector capacity in 2011

7 Exceptional markets and applications for solar thermal systems
7.1 Overview of global megawatt-scale solar thermal applications
Megawatt-scale solar supported district heating systems and solar heating and cooling applications in the commer-
cial and industrial sector have gained increasing interest all over the world in recent years, and several ambitious
projects have been successfully implemented.
In June 2013 the world’s largest collector field was commissioned in Chile. The installation with a maximum thermal
peak capacity of 32 MWcoversa total of 39,300m²of flat plate collector area connected to4,000m³ thermal energy
storage. The projected thermal energy output is 51.8 GWh per year. The solar thermal system is designed to cover
85% of the process heat demand needed to refine copper at the world´s largest copper mine7.
The world’s largest solar district heating plant started its operation in February 2014 in Dronninglund, Denmark. The
collector field, with a collector area of 37,275 m² (26 MWth) together with a seasonal storage, is designed to cover
around50%of the total annual heatdemandof1,400connectedcustomers. Thecollector fieldworks togetherwitha
60,000 m³ pit heat storage, gas motors for combined heat and power production (CHP), an absorption heat pump, a
biomassboilerandaback-upoil boiler.Dueto the largestorage thegasmotorswill alwaysbeable toproduceelectricity
when the electricity price is high—even when there is no heat load (as the storage then can absorb the heat produc-
tion)8. A systemsimilar to theone inDronninglund is installed in theDanish city ofMarstal9 andmore so-called smart
district heatingplantswith large-scale solar thermal systemsandseasonal storagesare scheduled tobebuilt inDen-
mark.
In Riyadh, Saudi Arabia another large-scale solar district heating plant was commissioned in July 2011. The solar
thermal plant with a total capacity of 25 MWth (36.305 m²) is connected to a heating network for the supply of space
heating and domestic hot water at a university campus10. Another successful solar supported heating network was
implemented inAlberta,Canada.TheDrakeLandingcommunityusesa1.6 MWth (2.293 m²)centralizedsolar thermal
plant connected to a seasonal storage to supply more than 90% of the energy needed for space heating of 52 de-
tached energy efficient homes11.
In Singapore, a large-scale solar thermal heating and cooling installation with a total capacity of 2.73 MWth
(3,900 m²) started operation in 2011. The roof mounted solar thermal plant is connected to a 1.76 MWth absorption
chiller and supplies hot water and cooling to about 2,500 students, who live and study at a newly created 76,000 m²
campus12.
Probably the largest solar thermal system in the United States is a solar process heat application that was dedicated
in April 2012 in North Carolina. The 5.5 MWth (7,800 m²) solar thermal system equipped with flat plate collectors
supplies hot water to a turkey processing plant, lessening the use of propane gas13.
36
SOLAR HEAT WORLDWIDE 2012
7 http://www.sunmark.com/
8 For further information go to http://task45.iea-shc.org/
9 http://sunstore4.eu/
10 http://solarthermalworld.org/content/saudi-arabia-worlds-biggest-solar-thermal-plant-operation
11 http://www.dlsc.ca/
12 http://www.solid.at/
13 http://solarthermalworld.org/content/usa-contractor-runs-7804-m2-collector-system-prestage-foods-factory

The largest solar process heat applications installed in China are connected to dyeing and weaving mill factories. A
system with a thermal peak capacity of 9.1 MWth (13,000 m²) was constructed in the province of Zhejiang and two
other projects of 10.5 MWth (15,000 m²) have been commissioned in the neighboring province of Jiangsu.
More examples of solar process heat applications can be found at http://ship-plants.info/.
7.2 Large-scale solar district heating and cooling applications in Europe
In the Scandinavian countries of Denmark and Sweden, but also in Austria, Germany, Spain and Greece large-scale
solar thermal applications connected to local or district heating grids have been in use since the early 1980s.
By the end of 2013, 192 large-scale solar thermal systems >350 kWth (500 m²) connected to heating networks and
17 systems connected to cooling networks were in operation in Europe. The total installed capacity of these systems
equaled 423 MWth (about 600,000 m²). The average system size was 2.0 MWth or 2,900 m².
In summary, 37 systems larger than 3.5 MWth or 5,000 m² were reported with most installations in Denmark (30)
followed by Germany (2), Sweden (1), Austria (1), the Netherlands (1), France (1) and Norway (1).
By end of 2013, 9 of the 10 largest European solar thermal systems were installed in Denmark: Dronninglund
(37,275 m²), Marstal (33,300 m²), Gråsten (19,017 m²), Braedstrup (18,612 m²), Tarm (18,585 m²), Vojens
(17,500 m²), Ringkøbing (15,000 m²), Oksbøl (14,745 m²) and Jægerspris (13,300 m²). The only system within
the top 10 ranking outside of Denmark was commissioned in 2013 in Akershus, Norway (12,581 m²).
The market for solar supported district heating networks in Denmark has been booming for several years and is
driven by high taxes for fossil fuels and an energy supply system that is characterized by decentralization on the one
hand and a high share of wind energy for electricity production on the other hand. This together with the liberalized
market mechanisms for electricity in Europe and low solar thermal system prices for large-scale systems make solar
thermal heat in Denmark even competitive against natural gas driven combined heat and power systems in many
cases14.
37
SOLAR HEAT WORLDWIDE 2012
50
2224 25
1614
8 9 8 7
14
3
9
0
25
50
75
100
125
150
175
200
225
250
275
300
DK SE AT DE ES GR NL CH PL IT FR CZ Oth.
Cumulated capacity [MW ]th
0
5
10
15
20
25
30
35
40
45
50
55
60
No. of systems installed [-]
Plants <0.35 MW
Plants >3.5 MW
No. of systems
Figure 40: European large-scale solar heating systems by end of 2013
(Source: Jan-Olof Dalenbäck—Chalmers University of Technology)
14 More information about the (Danish) Solar District Heating success story in Europe can be found here: http://www.solar-district-
heating.eu/ and here http://www.solvarmedata.dk/side5696.html

7.3 Market for solar air conditioning and cooling applications
Solar cooling applications convert the energy from the sun into cold by means of driving a thermal cooling machine
with thermal energy generated with solar thermal collectors.
By the end of 2013, an estimated 1,050 solar cooling systems were installed worldwide. The marked showed a posi-
tive trendbetween2004and2013,but thegrowth rates tendedtodecrease from32%in2007/2008to11%in2012/
2013.
Approximately 80% of the solar cooling installations worldwide are installed in Europe, most notably in Spain, Ger-
many and Italy. The majority of these systems is equipped with flat plate or evacuated tube collectors. By contrast
someexamples for thermal coolingmachines driven by concentrated solar thermal energy (with concentrating solar
thermal collectorssuchasparabolic troughsorFresnel collectors)werereported fromIndia,AustraliaandTurkey15.
Theoverall numberof systems installed todate indicates that solar cooling is still anichemarket, butonewhich isde-
veloping.Since2007,acost reductionof about50%hasbeen realizedasa result of the further standardizationof the
solar cooling kits.
38
SOLAR HEAT WORLDWIDE 2012
60
120
250
330
450
600
750
950
1050
0
100
200
300
400
500
600
700
800
900
1000
1100
1200
2004 2006 2007 2008 2009 2010 2011 2012 2013
No. of solar cooling installations [-]
Europe World
Figure 41: Market development 2004–2013 of small to large-scale solar air conditioning and cooling systems
(Source: Climasol, EURAC, Fraunhofer ISE, Green Chiller, Rococo, Solem Consulting, Tecsol)
15 Jakob U. (2013): Status and Perspective of Solar Cooling outside of Australia; Australian Solar Cooling 2013 Conference, Sydney
2013

7.4 Good practice examples of world-wide installed solar process heat applications
A variety of industrial processesdemandvast amounts of thermal energy, whichmakes the industrial sector aprom-
isingmarket for solar thermalapplications.Dependingon the temperature level of theneededheat,different typesof
solar thermal collectorsareused—air collectors, flatplateandevacuated tubecollectors for temperaturesatorbelow
100°C to concentrating solar thermal collectors such as parabolic troughs, Fresnel collectors or Scheffler dishes for
temperatures up to 400°C.
Currently Solar Heat for Industrial Processes (SHIP) is still a niche market, but a number of promising projects have
beenrealized in the last coupleofyears ranging fromsmall-scaledemonstrationplants tovery largesystems,suchas
theworld’s largestsolar thermalplant inChile,whichdeliversheat for theelectro-winningofcopper (seesection7).
Currently, 124SHIPapplicationsare reported tobe inoperationall over theworldwitha cumulated installed capacity
of over 93 MWth (133,200 m²). Of that, 18 systems are larger than 1,000 m² and another 25 systems are between
500–1,000 m² (Figure 42).
The SHIP database was created within the framework of IEA SHC Task 49/IV. This online database contains an over-
view of existing solar thermal plants worldwide. Each plant description contains detailed information, for example,
location, size of the collector field, collector technology used, integration point in the production process and costs.
TheSHIPdatabasecanbeaccessedbyprivateusersand it is the intention to continuouslyaddnewandexistingSHIP
applications in order to spread knowledge about the possibilities offered by this technology.
The database can be found at http://ship-plants.info/
39
SOLAR HEAT WORLDWIDE 2012
72.0
12.1
8.0
1.2
18
25
47
34
0
17,500
35,000
52,500
70,000
87,500
105,000
122,500
> 0.7 MW
(> 1,000m²)
0.35 - 0.7 MW
(500 - 1,000m²)
0.07 - 0.35 MW
(100 - 500m²)
< 0.07 MW
(< 100m²)
Installed collector area [m²]
0.0
12.3
24.5
36.8
49.0
61.3
73.5
85.8
Installed capacity [MW ]th
Installed collector area [m²]
Installed capacity [MW ]th
No. of systems [-]
Figure 42: Global solar process heat applications in operation
(Source: IEA SHC Task49/IV SHIP database, accessed on 2014-05-16)

7.5 Market for Solar Air Heating Systems
Solar air heating is a solar thermal technology in which the energy from the sun heats air. In colder climates, space
heating is usually the largest useof buildingenergyand it is theair in thebuildings that is heated.Spaceheating con-
sumesmuchmoreenergy thanhotwater inmost buildings. Solar air heating systemscanbebuilding integratedand
typically reduce between 20–30% of conventional energy used for heating buildings.
Theair is generally takenoff the topof thewall (sincehot air rises) and theheatedorpre-heated freshair is then con-
nected to existing or new fans and ducted into the building via the ventilation system.
Solar air heaters are also common in agricultural applications primarily for drying.
Solar air heating systems have been used globally for the past 30 years by schools, municipalities, military, agricul-
tural and commercial and industrial entities as well as in residential buildings. Wall mounted systems are common
andtakeadvantageof the lowerwinter sunanglesandeliminateanysnowaccumulation typical of roofmountedsys-
tems. Storage of the heat is possible, but most solar air systems do not include storage to minimize costs.
Solar space heating with air collectors has not been common in Europe, likely due to the lack of an European test
standard for air collectors, but in North America, building integrated solar air collectors are the most popular form of
solar thermal systems in the commercial, industrial and institutional markets due to their low cost and architectural
integration into buildings.
40
SOLAR HEAT WORLDWIDE 2012

8 Appendix
8.1 Methodological approach for the energy calculation
In order to obtain theenergy yield of solar thermal systems, theoil equivalent savedand theCO2 emissions avoided,
the following procedure was used:
• Only water collectors were used in the calculations (unglazed water collectors, flat-plate collectors and evacuated
tube collectors). Air collectors were not included.
• For each country, the cumulated water collector area was allocated to the following applications (based on avail-
able country market data):
• Solar thermal systems for swimming pool heating
• Solar domestic hot water systems for single-family houses,
• Solar domestic hot water systems for multifamily houses including the tourism sector as well as the public sec-
tor (to simplify the analysis solar district heating systems, solar process heat and solar cooling applications
were also allocated here), and
• Solar combi systems for domestic hot water and space heating for single- and multifamily houses.
• Reference systemsweredefined for each country and for each typeof application (pumpedor thermosiphon solar
thermal system).
• The number of systems per country was determined from the share of collector area for each application and the
collector area defined for the reference system.
Apart from the reference applications and systems mentioned above, reference collectors and reference climates
were determined. On the basis of these boundary conditions, simulations were performed with the simulation pro-
gram T-Sol [T-Sol, Version 4.5 Expert, Valentin Energiesoftware, www.valentin.de] and gross solar yields for each
country and each system were obtained. The gross solar yields refer to the solar collector heat output and do not in-
clude heat losses through transmission piping or storage heat losses16.
Theamountof final energysaved is calculated fromthegrosssolaryields consideringautilization rateof theauxiliary
heating system of 0.8. Final energy savings are expressed in tons of oil equivalent (toe): 1 toe = 11,630 kWh.
Finally, theCO2 emissions avoidedby thedifferent solar thermal applications arequotedaskilogramscarbondioxide
equivalent (kgCO2e) per tons of oil equivalent: 1 toe = 3.233 t CO2e17
Toobtain anexact statementabout theCO2 emissionsavoided, the substitutedenergymediumwouldhave tobeas-
certained for each country. Since this could only be done in a very detailed survey, which goes beyond the scope of
this report, the energy savings and the CO2 emissions avoided therefore relate to fuel oil. It is obvious that not all so-
lar thermal systems just replace systems running on oil. This represents a simplification since gas, coal, biomass or
electricity can be used as the energy source for the auxiliary heating system instead of oil.
The following tables describe the key data of the reference systems in the different countries, the location of the ref-
erence climate used and the share of the total collector area in use for the respective application. Furthermore, a hy-
draulic scheme is shown for each reference system.
41
SOLAR HEAT WORLDWIDE 2012
16 Using gross solar yields for the energy calculations is based on a definition for Renewable Heat by EUROSTAT and IEA SHC. In editions
of this report prior to 2011 solar yields calculated included heat losses through transmission piping and hence energy savings
considered were about 5 to 15% less depending on the system, the application and the climate.
17 Source: Defra/DECC 2013
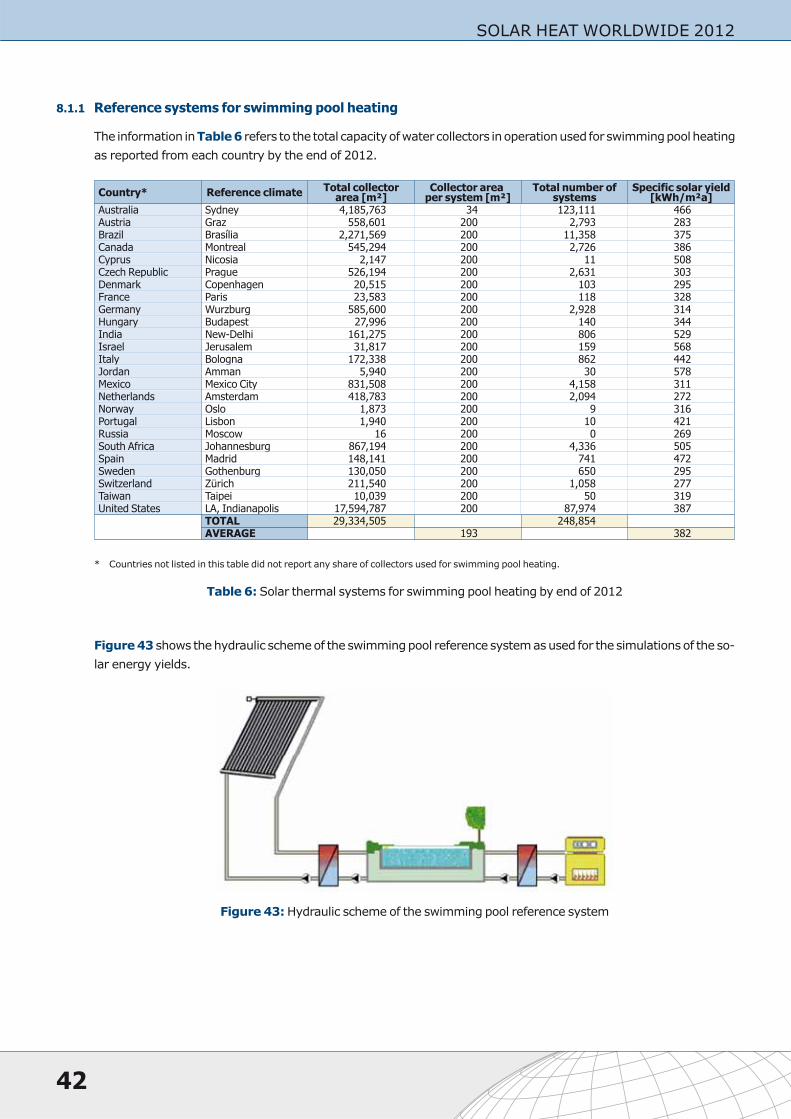
8.1.1 Reference systems for swimming pool heating
The information inTable6 refers to the total capacityofwatercollectors inoperationused forswimmingpoolheating
as reported from each country by the end of 2012.
Figure43 shows thehydraulic schemeof the swimmingpool referencesystemasused for the simulationsof the so-
lar energy yields.
42
SOLAR HEAT WORLDWIDE 2012
Country* Reference climateTotal collector
area [m²]Collector area
per system [m²]Total number of
systemsSpecific solar yield
[kWh/m²a]
Australia Sydney 4,185,763 34 123,111 466
Austria Graz 558,601 200 2,793 283
Brazil Brasília 2,271,569 200 11,358 375
Canada Montreal 545,294 200 2,726 386
Cyprus Nicosia 2,147 200 11 508
Czech Republic Prague 526,194 200 2,631 303
Denmark Copenhagen 20,515 200 103 295
France Paris 23,583 200 118 328
Germany Wurzburg 585,600 200 2,928 314
Hungary Budapest 27,996 200 140 344
India New-Delhi 161,275 200 806 529
Israel Jerusalem 31,817 200 159 568
Italy Bologna 172,338 200 862 442
Jordan Amman 5,940 200 30 578
Mexico Mexico City 831,508 200 4,158 311
Netherlands Amsterdam 418,783 200 2,094 272
Norway Oslo 1,873 200 9 316
Portugal Lisbon 1,940 200 10 421
Russia Moscow 16 200 0 269
South Africa Johannesburg 867,194 200 4,336 505
Spain Madrid 148,141 200 741 472
Sweden Gothenburg 130,050 200 650 295
Switzerland Zürich 211,540 200 1,058 277
Taiwan Taipei 10,039 200 50 319
United States LA, Indianapolis 17,594,787 200 87,974 387
TOTAL 29,334,505 248,854
AVERAGE 193 382
* Countries not listed in this table did not report any share of collectors used for swimming pool heating.
Table 6: Solar thermal systems for swimming pool heating by end of 2012
Figure 43: Hydraulic scheme of the swimming pool reference system

8.1.2 Reference systems for domestic hot water preparation in single-family houses
The information in Table 7 refers to the total capacity of water collectors in operation used for domestic hot water
heating in single family houses at the end of 2012 as reported by each country.
43
SOLAR HEAT WORLDWIDE 2012
CountryReference
climateTotal collector
area [m²]Collector area
per system [m²]Total number of
systemsSpecific solar
yield [kWh/m² a]Type ofsystem
Albania Tirana 31,864 2.5 12,746 713 TS
Australia Sydney 3,103,607 3.5 886,745 844 PS
Austria Graz 2,051,412 6.0 341,902 451 PS
Barbados Grantley Adams 131,690 4.0 32,923 882 TS
Belgium Brussels 429,533 4.0 107,383 423 PDS / PS
Brazil Brasília 5,211,723 4.0 1,302,931 809 TS
Bulgaria Sofia 87,014 4.0 21,753 524 PS
Canada Montreal 34,136 6.0 5,689 556 PS
Chile Santiago de Chile 36,804 4.0 9,201 771 PS
China Shanghai 231,930,000 4.0 57,982,500 592 TS
Croatia Zagreb 120,000 4.0 30,000 539 PS
Cyprus Nicosia 771,988 4.0 192,997 912 TS
Czech Republic Prague 179,752 4.7 38,245 385 PS
Denmark Copenhagen 279,756 4.0 69,939 454 PS
Estonia Tallinn 6,520 4.0 1,630 432 PS
Finland Helsinki 48,502 4.0 12,126 441 PS
France Paris 943,337 3.2 294,793 496 PS
Germany Wurzburg 7,314,300 6.0 1,219,050 424 PS
Greece Athens 3,969,486 2.5 1,587,794 772 TS
Hungary Budapest 139,980 6.0 23,330 473 PS
India New-Delhi 4,773,740 4.0 1,193,435 882 TS
Ireland Dublin 244,772 4.0 61,193 423 PS
Israel Jerusalem 829,000 3.0 276,333 1,024 TS
Italy Bologna 2,136,995 4.0 534,249 661 PS
Japan Tokyo 4,372,329 4.0 1,093,082 586 TS
Jordan Amman 894,475 4.6 194,451 986 TS
Korea, South Seoul 909,805 4.0 227,451 525 PS
Latvia Riga 4,040 4.0 1,010 462 PS
Lebanon Beirut 447,100 4.0 111,775 860 TS
Lithuania Vilnius 6,000 4.0 1,500 450 PS
Luxembourg Luxembourg 39,800 4.0 9,950 450 PS
Macedonia Skopje 12,100 4.0 3,025 627 PS
Malta Luqa 48,293 4.0 12,073 868 PS
Mexico Mexico City 335,543 4.0 83,886 718 PS
Morocco Rabat 491,261 4.0 122,815 894 TS
Namibia Windhoek 9,903 4.0 2,476 1,032 TS
Netherlands Amsterdam 343,311 2.8 122,611 433 PDS / PS
New Zealand Wellington 159,645 4.0 39,911 647 PS
Norway Oslo 1,181 8.0 148 430 PS
Poland Warsaw 848,050 6.0 141,342 397 PS
Portugal Lisbon 725,414 4.0 181,354 804 PS
Romania Bucharest 110,700 4.0 27,675 594 PS
Russia Moscow 1,497 4.0 374 443 PS
Slovakia Bratislava 147,000 6.0 24,500 481 PS
Slovenia Ljubljana 155,044 6.0 25,841 424 PS
South Africa Johannesburg 485,683 4.0 121,421 1,009 TS
Spain Madrid 1,155,501 4.0 288,875 766 PS
Sweden Gothenburg 34,200 4.0 8,550 383 PS
Switzerland Zürich 706,147 5.7 123,885 426 PS
Taiwan Taipei 1,404,065 4.8 292,514 616 TS
Thailand Bangkok 120,360 4.0 30,090 854 TS
Tunisia Tunis 625,155 2.8 223,270 902 TS
Turkey Antalya 14,258,080 4.0 3,564,520 910 TS
United Kingdom London 709,673 4.0 177,418 415 PS
United States LA, Indianapolis 5,077,571 6.0 846,262 646 PS
Uruguay Montevideo 12,571 4.0 3,143 682 TS
Zimbabwe Harare 19,568 4.0 4,892 854 TS
TOTAL 299,476,976 74,350,976
AVERAGE 4,3 640
PS: pumped system
TS: thermosiphon system
PDS: pumped drain back system
Table 7: Solar thermal systems for domestic hot water heating in single family houses by end of 2012

Figure 44 shows the hydraulic scheme used for the energy calculation for all pumped solar thermal systems and
Figure 45 refers to the thermosiphon systems.
For the Chinese thermosiphon systems the reference system above was used, but instead of a flat plate collector as
shown in Figure 45 a representative Chinese vacuum tube collector was used for the simulation.
44
SOLAR HEAT WORLDWIDE 2012
Figure 44: Hydraulic scheme of the domestic
hot water pumped reference system for
single family houses
Figure 45: Hydraulic scheme of the domestic
hot water thermosiphon reference system
for single family houses

8.1.3 Reference systems for domestic hot water preparation in multifamily houses
The information in Table 8 refers to the total capacity of water collectors in operation used for domestic hot water
heating in multifamily houses at the end of 2012 as reported by each country.
Figure 46 shows the hydraulic scheme of domestic hot water reference system for multifamily houses as used for
thesimulationsof thesolar energyyields.Asopposed to small-scaledomestichotwater systems, all large-scale sys-
tems are assumed to be pumped solar thermal systems.
45
SOLAR HEAT WORLDWIDE 2012
CountryReference
climateTotal collector
area [m²]Collector area
per system [m²]Total number of
systemsSpecific solar
yield [kWh/m² a]Type ofSystem
Albania Tirana 80,057 50.0 1,601 694 PS
Australia Sydney 36,630 50.0 733 725 PS
Austria Graz 382,614 50.0 7,652 505 PS
Brazil Brasília 778,763 50.0 15,575 658 PS
Bulgaria Sofia 35,086 50.0 702 515 PS
Canada Montreal 295,842 50.0 5,917 621 PS
Chile Santiago de Chile 43,205 50.0 864 733 PS
China Shanghai 21,904,500 50.0 438,090 502 PS
Cyprus Nicosia 102,162 50.0 2,043 750 PS
Czech Republic Prague 29,218 42.4 689 436 PS
Denmark Copenhagen 356,709 50.0 7,134 414 PS
France Paris 1,247,563 20.0 62,378 489 PS
Germany Wurzburg 1,982,988 50.0 39,660 472 PS
Greece Athens 148,392 50.0 2,968 642 PS
Hungary Budapest 17,498 50.0 350 522 PS
India New-Delhi 1,515,985 50.0 30,320 749 PS
Ireland Dublin 8,159 50.0 163 425 PS
Israel Jerusalem 3,316,000 3.0 1,105,333 919 PS
Italy Bologna 620,418 50.0 12,408 593 PS
Japan Tokyo 89,231 50.0 1,785 516 PS
Jordan Amman 223,619 50.0 4,472 801 PS
Korea, South Seoul 775,019 50.0 15,500 485 PS
Lebanon Beirut 78,900 50.0 1,578 809 PS
Macedonia Skopje 13,644 50.0 273 577 PS
Mexico Mexico City 862,825 50.0 17,256 713 PS
Namibia Windhoek 12,103 50.0 242 814 PS
Netherlands Amsterdam 80,255 50.0 1,605 418 PS
Norway Oslo 16,749 50.0 335 406 PS
Poland Warsaw 302,875 50.0 6,058 447 PS
Portugal Lisbon 226,934 40.0 5,673 705 PS
Russia Moscow 16,926 50.0 339 416 PS
Slovenia Ljubljana 3,736 50.0 75 477 PS
South Africa Johannesburg 10,635 50.0 213 867 PS
Spain Madrid 1,422,156 50.0 28,443 676 PS
Sweden Gothenburg 45,900 50.0 918 430 PS
Switzerland Zürich 84,316 20.0 4,216 457 PS
Taiwan Taipei 20,079 33.8 594 518 PS
Tunisia Tunis 14,063 50.0 281 756 PS
Turkey Antalya 1,239,833 50.0 24,797 750 PS
United States LA, Indianapolis 32,484 50.0 650 688 PS
TOTAL 38,474,071 1,849,883
AVERAGE 46.5 602
PS: pumped system
Table 8: Solar thermal systems for domestic hot water heating in multifamily houses by end of 2012
Figure 46: Hydraulic scheme of the
domestic hot water pumped reference
system for multifamily houses

8.1.4 Reference systems for domestic hot water preparation and space heating in single and
multifamily houses (solar combi-systems)
The information in Table 9 refers to the total capacity of water collectors in operation used for domestic hot water
heating in multifamily houses at the end of 2012 as reported by each country.
Figure 47 shows the hydraulic scheme of domestic hot water reference system for multifamily houses as used for
the simulations of the solar energy yields.
46
SOLAR HEAT WORLDWIDE 2012
CountryReference
climateTotal collector
area [m²]Collector area
per system [m²]Total number of
systemsSpecific solar
yield [kWh/m² a]Type ofSystem
Austria Graz 1,935,121 14.0 138,223 369 PS
China Shanghai 3,865,500 12.0 322,125 388 PS
Cyprus Nicosia 14,214 12.0 1,184 663 PS
Czech Republic Prague 156,574 8.4 18,640 351 PS
Denmark Copenhagen 6,429 12.0 536 348 PS
France Paris 143,859 11.0 13,078 370 PS
Germany Wurzburg 6,956,712 12.0 579,726 378 PS
Greece Athens 4,122 12.0 344 558 PS
Hungary Budapest 47,827 15.0 3,188 422 PS
Ireland Dublin 19,038 12.0 1,586 364 PS
Italy Bologna 517,015 12.0 43,085 499 PS
Netherlands Amsterdam 22,293 6.0 3,715 352 PS
Norway Oslo 16,323 20.0 816 342 PS
Poland Warsaw 60,575 12.0 5,048 365 PS
Portugal Lisbon 15,517 12.0 1,293 593 PS
Russia Moscow 459 15.0 31 350 PS
Slovenia Ljubljana 28,020 12.0 2,335 362 PS
Spain Madrid 237,026 10.0 23,703 619 PS
Sweden Gothenburg 239,850 10.0 23,985 389 PS
Switzerland Zürich 263,488 11.0 23,953 385 PS
United States LA, Indianapolis 504,759 12.0 42,063 579 PS
TOTAL 15,054,718 1,248,657
AVERAGE 12.5 431
combi-system system for the supply of domestic hot water and space heating
PS: pumped system
Table 9: Solar combi system reference for single and multifamily houses
and the total collector area in operation in 2011
Figure 47: Hydraulic scheme of the solar-combi reference system for single and multifamily houses

8.2 Reference collectors
8.2.1 Data of the reference unglazed water collector for swimming pool heating
� = 0.85 a1 = 20 [W/m²K] a2 = 0.1 [W/m²�K²]
8.2.2 Data of the reference collector for all other applications except for China
� = 0.8 a1 = 3.69 [W/m²K] a2 = 0.007 [W/m² K²]
8.2.3 Data of the Chinese reference vacuum tube collector
� = 0.74 a1 = 2.5 [W/m²K] a2 = 0.013 [W/m² K²]
8.3 Reference climates
47
SOLAR HEAT WORLDWIDE 2012
Ho
riz
on
ta
lir
ra
dia
tio
n
In
cli
ne
dir
ra
dia
tio
n
Avg
.O
ut-
sid
ea
irte
mp
.
No. CountryReferenceclimate
[kWh/
m²·a]
[kWh/
m²·a][°C]
1 Albania Tirana 1,604 1,835 13.5
2 Australia Sydney 1,674 1,841 18.1
3 Austria Graz 1,126 1,280 9.2
4 Barbados Grantley Adams 2,016 2,048 27.4
5 Belgium Brussels 971 1,095 10.0
6 Brazil Brasília 1,793 1,838 22.0
7 Bulgaria Sofia 1,188 1,304 10.1
8 Canada Montreal 1,351 1,568 6.9
9 Chile Santiago d. C. 1,753 1,850 14.5
10 China Shanghai 1,282 1,343 17.1
11 Croatia Zagreb 1,212 1,352 11.3
12 Cyprus Nicosia 1,886 2,098 19.9
13 Czech Rep. Prague 998 1,111 7.9
14 Denmark Copenhagen 989 1,164 8.1
15 Estonia Tallinn 960 1,126 5.3
16 Finland Helsinki 948 1,134 4.6
17 France Paris 1,112 1,246 11.0
18 Germany Wurzburg 1,091 1,225 9.5
19 Greece Athens 1,585 1,744 18.5
20 Hungary Budapest 1,199 1,346 11.0
21 India New-Delhi 1,961 2,275 24.7
22 Ireland Dublin 949 1,091 9.5
23 Israel Jerusalem 2,198 2,400 17.3
24 Italy Bologna 1,419 1,592 14.3
25 Japan Tokyo 1,175 1,287 16.7
26 Jordan Amman 2,145 2,341 17.9
27 Korea, South Seoul 1,161 1,280 12.7
28 Latvia Riga 991 1,187 6.3
29 Lebanon Beirut 1,935 2,132 19.9
Ho
riz
on
ta
lir
ra
dia
tio
n
In
cli
ne
dir
ra
dia
tio
n
Avg
.O
ut-
sid
ea
irte
mp
.
No. CountryReferenceclimate
[kWh/
m²·a]
[kWh/
m²·a][°C]
30 Lithuania Vilnius 1,001 1,161 6.2
31 Luxembourg Luxembourg 1,037 1,158 8.4
32 Macedonia Skopje 1,381 1,521 12.5
33 Malta Luqa 1,902 2,115 18.7
34 Mexico Mexico City 1,706 1,759 16.6
35 Morocco Rabat 2,011 2,281 17.2
36 Mozambique Maputo 1,927 2,135 22.8
37 Namibia Windhoek 2,363 2,499 21.0
38 Netherlands Amsterdam 999 1,131 10.0
39 New Zealand Wellington 1,401 1,542 13.6
40 Norway Oslo 971 1,208 5.8
41 Poland Warsaw 1,024 1,156 8.1
42 Portugal Lisbon 1,686 1,875 17.4
43 Romania Bucharest 1,324 1,473 10.6
44 Russia Moscow 996 1,181 5.9
45 Slovakia Bratislava 1,214 1,374 10.3
46 Slovenia Ljubljana 1,115 1,231 9.8
47 South Africa Johannesburg 2,075 2,232 15.6
48 Spain Madrid 1,644 1,844 15.5
49 Sweden Gothenburg 934 1,105 7.2
50 Switzerland Zürich 1,094 1,218 9.6
51 Taiwan Taipei 1,372 1,398 20.8
52 Thailand Bangkok 1,765 1,898 29.1
53 Tunisia Tunis 1,808 2,038 19.3
54 Turkey Antalya 1,795 1,958 18.4
55 UK London 943 1,062 12.0
56 USA LA, Indianapolis 1,646 1,816 14.3
57 Uruguay Montevideo 1,534 1,647 15.9
58 Zimbabwe Harare 2,017 2,087 18.9
Source: T-Sol expert version 4.5 and Meteonorm version 6.1.
Table 10: Reference climates for the 58 countries surveyed

8.4 Population data
48
SOLAR HEAT WORLDWIDE 2012
No Country 2012 Region code
1 Albania 3,002,859 6
2 Australia 22,015,580 3
3 Austria 8,219,743 6
4 Barbados 287,733 4
5 Belgium 10,438,350 6
6 Brazil 199,321,400 4
7 Bulgaria 7,037,935 6
8 Canada 34,300,080 8
9 Chile 17,067,370 4
10 China 1,343,240,000 5
11 Croatia 4,480,043 6
12 Cyprus 1,138,071 6
13 Czech Republic 10,591,710 6
14 Denmark 5,543,453 6
15 Estonia 1,274,709 6
16 Finland 5,262,930 6
17 France (mainland) 65,630,690 6
18 Germany 81,305,860 6
19 Greece 10,767,830 6
20 Hungary 9,958,453 6
21 India 1,205,074,000 2
22 Ireland 4,722,028 6
23 Israel 7,590,758 7
24 Italy 61,261,250 6
25 Japan 127,368,100 2
26 Jordan 6,508,887 7
27 Korea, South 48,860,500 2
28 Latvia 2,191,580 6
29 Lebanon 4,140,289 7
30 Lithuania 3,525,761 6
31 Luxembourg 509,074 6
No Country 2012 Region code
32 Macedonia 2,082,370 6
33 Malta 409,836 6
34 Mexico 117,299,200 4
35 Morocco 32,309,240 7
36 Mozambique 23,515,930 1
37 Namibia 2,165,828 1
38 Netherlands 16,730,630 6
39 New Zealand 4,327,944 3
40 Norway 5,021,106 6
41 Poland 38,415,280 6
42 Portugal 10,781,460 6
43 Romania 21,848,500 6
44 Russia 142,517,670 6
45 Slovakia 5,483,088 6
46 Slovenia 1,996,617 6
47 South Africa 48,810,430 1
48 Spain 47,042,980 6
49 Sweden 9,573,256 6
50 Switzerland 7,925,517 6
51 Taiwan 23,234,940 2
52 Thailand 67,245,400 2
53 Tunisia 10,732,900 7
54 Turkey 79,749,460 6
55 United Kingdom 63,047,160 6
56 United States 313,914,000 8
57 Uruguay 3,316,328 4
58 Zimbabwe 12,619,600 1
� Solar Thermal
World Statistics4,424,753,696 63.0%
� Inhabitants world 7,020,760,225 100.0%
Data source: International Data Base of the U.S. Census Bureau http://www.census.gov/ipc/www/idb/country.php
Table 11: Inhabitants by the end of 2012 of the 58 surveyed countries in alphabetical order
Region Code / Region � Inhabitants Share
1 Sub-Sahara Africa 86,184,778 2.0%
2 Asia excl. China 1,455,189,038 34.3%
3 Australia / New Zealand 26,057,058 0.6%
4 Latin America 337,637,999 8.0%
5 China 1,336,718,015 31.5%
6 Europe 598,744,151 14.1%
7 MENA Region 60,721,971 1.4%
8 United States / Canada 345,081,566 8.1%
TOTAL 4,246,334,576 100.0%
Data source: International Data Base of the U.S. Census Bureau
http://www.census.gov/ipc/www/idb/country.php
Sub-Saharan Africa: Mozambique, Namibia, South Africa, Zimbabwe
Asia excluding China: India, Japan, Korea South, Taiwan, Thailand
Latin America: Brazil, Chile, Mexico, Uruguay
Europe: EU 28, Albania, Macedonia, Norway,
Switzerland, Russia, Turkey
MENA Region: Israel, Jordan, Lebanon, Morocco, Tunisia
Table 12: Inhabitants per economic region
by the end of 2011

8.5 Market data of the previous years
The data presented in Chapters 3 – 5 were originally collected in square meters. Through an agreement of inter-
national experts the collector areas of these solar thermal applications have been converted and are shown in in-
stalled capacity as well.
Making the installed capacity of solar thermal collectors comparable with that of other energy sources, solar thermal
experts from seven countries agreed upon a methodology to convert installed collector area into solar thermal
capacity.
The methodology was developed during a meeting with IEA SHC Programme officials and major solar thermal trade
associations in Gleisdorf, Austria in September 2004. The represented associations from Austria, Canada, Germany,
the Netherlands, Sweden and the United States as well as the European Solar Thermal Industry Federation (ESTIF)
and the IEA SHC Programme agreed to use a factor of 0.7 kWth/m2 to derive the nominal capacity from the area of
installed collectors.
In order to ensure consistency of the calculations within this report the following tables provide data from the pre-
vious years. If necessary thenumbers havebeen revised in 2013 compared to thedata originally published in earlier
editions of this report due to changes in methodology or the origin of the data for each country.
In the following Table 13, Table 14 and Table 15 these countries are highlighted accordingly and in Chapter 8.6
(References) the respective data source is cited.
49
SOLAR HEAT WORLDWIDE 2012

50
SOLAR HEAT WORLDWIDE 2012
CountryWater Collectors Air Collectors
TOTAL [m²]unglazed FPC ETC unglazed glazed
Albania 7,480 82 7,562
Australia 680,000 362,351 35,837 1,078,188
Austria 5,539 268,093 11,805 350 285,787
Barbados**
Belgium 31,306 6,995 38,301
Brazil 493,725 472,956 966,681
Bulgaria 7,750 650 8,400
Canada 84,690 11,481 11,493 89,560 2,267 199,491
Chile* 10,920 10,920
China 3,000,000 46,000,000 49,000,000
Croatia # 11,250 11,250
Cyprus 109 32,931 1,782 34,822
Czech Republic 53,000 73,898 17,719 144,617
Denmark 61,944 400 62,344
Estonia 100 400 500
Finland 4,000 2,000 6,000
France (mainland) 247,000 9,000 256,000
Germany 1,038,000 112,000 1,150,000
Greece 212,500 1,500 214,000
Hungary 2,400 14,700 6,300 300 150 23,850
India 608,436 280,369 888,805
Ireland 17,472 13,109 30,581
Israel 316,000 316,000
Italy 427,500 62,500 490,000
Japan 146,866 4,794 11,850 163,511
Jordan 5,940 79,621 12,654 98,215
Korea, South 69,803 69,803
Latvia 100 100 200
Lebanon**
Lithuania 50 150 200
Luxembourg 3,500 1,000 4,500
Macedonia**
Malta 1,759 1,101 2,860
Mexico 90,000 95,000 85,000 2,580 272,580
Morocco 69,260 69,260
Mozambique**
Namibia 5,440 860 6,300
Netherlands 26,507 45,862 4,000 76,369
New Zealand**
Norway 170 2,123 813 3,106
Poland 111,000 35,000 146,000
Portugal 353 186,990 302 187,645
Romania 8,500 7,000 15,500
Russia**
Slovakia 12,800 2,200 15,000
Slovenia 15,000 4,000 19,000
South Africa 50,000 42,300 7,700 100,000
Spain 11,000 315,500 21,500 348,000
Sweden 17,191 13,567 7,132 37,890
Switzerland 11,944 129,026 15,746 8,000 164,716
Taiwan 2 115,938 11,811 127,751
Thailand* 18,200 18,200
Tunisia 72,200 12,500 84,700
Turkey* 1,333,970 348,000 1,681,970
United Kingdom 75,600 29,600 105,200
United States 937,856 225,383 1,163,239
Uruguay**
Zimbabwe 450 75 525
TOTAL 2,470,426 10,433,875 47,186,980 98,210 16,847 60,106,338
* revised due to new / adapted database in 2014
# added in 2014
** no available data for the year 2010
Table 13: Newly installed collector area in 2010 (revised 2014) [m²/a]

51
SOLAR HEAT WORLDWIDE 2012
CountryWater Collectors Air Collectors
TOTAL [m²]unglazed glazed evacuated tube unglazed glazed
Albania 12,890 98 12,988
Australia 600,000 343,980 22,230 36,000 900 1,003,110
Austria 5,700 221,500 8,690 350 236,240
Barbados**
Belgium 35,500 10,000 45,500
Brazil 512,099 517,517 1,029,616
Bulgaria 10,000 800 10,800
Canada 74,490 7,880 9,500 28,377 7,165 127,412
Chile* 19,037 19,037
China 2,880,000 54,720,000 57,600,000
Croatia # 14,500 14,500
Cyprus 142 26,794 1,643 28,579
Czech Republic 65,000 49,150 16,650 130,800
Denmark 61,897 504 62,401
Estonia 900 900 1,800
Finland 3,000 1,000 4,000
France (mainland) 242,200 8,800 553 117 251,670
Germany 1,152,000 118,000 428 1,270,428
Greece 230,000 230,000
Hungary 1,500 14,000 6,000 300 250 22,050
India 606,000 404,000 1,010,000
Ireland 12,538 8,232 20,770
Israel 2,500 370,984 373,484
Italy 339,300 50,700 390,000
Japan 155,264 1,802 10,773 167,839
Jordan 54,531 13,705 68,236
Korea, South 54,733 54,733
Latvia 1,000 800 1,800
Lebanon* 40,000 20,000 60,000
Lithuania 600 1,200 1,800
Luxembourg 3,500 1,000 4,500
Macedonia**
Malta 2,335 480 2,815
Mexico 90,000 95,000 85,000 300 270,300
Morocco 71,429 71,429
Mozambique 130 130
Namibia**
Netherlands 27,396 31,445 5,000 63,841
New Zealand**
Norway 160 2,863 946 3,969
Poland 187,400 66,300 253,700
Portugal 235 126,227 736 204 127,402
Romania 8,500 7,000 15,500
Russia**
Slovakia 19,320 3,680 23,000
Slovenia 9,000 3,000 12,000
South Africa 48,200 42,811 39,300 130,311
Spain 8,600 249,700 17,250 1,500 277,050
Sweden 22,601 15,654 5,153 43,408
Switzerland 9,040 129,142 8,721 9,000 155,903
Taiwan 100,386 11,061 111,447
Thailand* 18,900 18,900
Tunisia 64,300 8,000 72,300
Turkey* 1,301,075 504,600 1,570 1,807,245
United Kingdom 72,953 18,826 5,597 97,376
United States 747,900 220,000 11,400 15,500 6,000 1,000,800
Uruguay*
Zimbabwe 230 320 550
TOTAL 2,215,563 10,249,865 56,223,156 99,329 25,555 68,813,468
* revised due to new / adapted database in 2013
# added in 2014
** no available data for the year 2011
Table 14: Newly installed collector area in 2011 (revised 2014) [m²/a]

52
SOLAR HEAT WORLDWIDE 2012
CountryWater Collectors Air Collectors
TOTAL [m²]unglazed glazed evacuated tube unglazed glazed
Albania 90,075 646 90,721
Australia 3,900,000 2,642,000 46,000 264,000 6,600 6,858,600
Austria 586,191 4,101,100 74,926 1,078 4,763,295
Barbados 131,690 131,690
Belgium 45,000 289,888 33,395 368,283
Brazil 1,789,227 5,351,866 7,141,093
Bulgaria* 112,650 1,450 114,100
Canada 719,364 55,316 27,921 334,426 11,781 1,148,808
Chile* 58,116 58,116
China 14,787,370 202,612,630 217,400,000
Croatia # 105,500 105,500
Cyprus 2,123 845,449 21,656 869,228
Czech Republic 418,000 299,743 74,925 792,668
Denmark 20,515 583,707 8,588 3,264 18,000 634,074
Estonia 3,030 1,690 4,720
Finland 11,779 27,251 5,472 44,502
France (mainland) 90,000 1,995,094 33,379 2,118,473
Germany 610,000 13,386,000 1,718,000 32,000 15,746,000
Greece 4,105,700 16,300 4,122,000
Hungary 12,000 133,700 36,100 1,500 1,200 184,500
India 4,457,384 522,616 16,320 4,996,320
Ireland 116,539 57,319 173,858
Israel 30,617 4,234,498 550 4,265,665
Italy 43,766 2,673,510 399,490 3,116,766
Japan 4,594,313 83,753 475,199 5,153,265
Jordan 5,940 818,889 230,969 1,055,798
Korea, South 1,621,050 1,621,050
Latvia 2,700 1,040 3,740
Lebanon 190,000 270,000 460,000
Lithuania 2,700 1,500 4,200
Luxembourg 31,800 3,850 35,650
Macedonia 25,020 724 25,744
Malta 34,502 11,782 46,284
Mexico 722,008 777,055 230,813 7,983 1,737,859
Morocco* 412,689 412,689
Mozambique # 130 130
Namibia 20,699 1,307 22,006
Netherlands 410,239 418,478 14,000 842,717
New Zealand 7,025 142,975 9,644 159,645
Norway 2,090 16,885 1,958 1,019 21,952
Poland 694,000 215,500 909,500
Portugal 1,946 861,963 15,000 878,909
Romania* 72,200 23,000 95,200
Russia # 11,504 1,010 12,514
Slovakia 119,420 20,080 139,500
Slovenia 154,050 16,250 170,300
South Africa 851,878 373,821 67,972 1,293,671
Spain 130,600 2,450,200 154,750 2,735,550
Sweden 130,000 256,000 60,000 446,000
Switzerland 212,260 864,440 61,160 876,000 2,013,860
Taiwan 85 2,070,686 86,522 2,157,294
Thailand* 97,700 97,700
Tunisia 518,800 44,000 562,800
Turkey 13,185,391 1,333,970 14,519,361
United Kingdom 490,097 160,301 14,000 664,398
United States 19,980,762 2,502,284 105,232 84,685 6,000 22,678,963
Uruguay 12,571 12,571
Zimbabwe 17,959 237 18,196
TOTAL 2010 30,733,415 94,450,147 208,918,828 1,578,425 577,180 336,257,996
* revised due to new / adapted database in 2013
# added in 2014
** no available data for the year 2012
Table 15: Total collector area in operation by the end of 2011 (revised 2014) [m2]
8.6 References to reports and persons that have supplied the data
Theproductionof the report,SolarHeatWorldwide2012–2014editionwaskindly supportedbynational representa-
tives of the recorded countries or other official sources of information as cited below.
COUNTRY CONTACT SOURCE
REMARKS
AlbaniaAlbania Edmond M. HIDO
EEC - Albania-EU Energy Efficiency Centre (EEC)
EEC - Albania-EU Energy Efficiency Centre
Australia David Ferrari
Sustainability Victoria
Sustainability Victoria
Out of operation systems calculated by Sustainability Victoria
Austria Werner Weiss
AEE - Institute for Sustainable Technologies
Biermayr et al., 2013
http://www.nachhaltigwirtschaften.at/iea/results.html/id7253
Out of operation systems calculated by AEE INTEC
Belgium ESTIF – European Solar Thermal
Industry Federation
Glazed water collectors: ESTIF, 2013
http://www.estif.org/statistics/st_markets_in_europe_2012/
AEE INTEC Unglazed water collectors: AEE INTEC recordings
Unglazed water collectors: AEE INTEC recordings
Brazil Marcelo Mesquita
Depto. Nac. de
Aquecimento Solar da ABRAVA
DASOL ABRAVA
Out of operation systems calculated based on DASOL ABRAVA
long time recordings
Bulgaria ESTIF – European Solar Thermal
Industry Federation
Glazed water collectors: ESTIF, 2013 (estimation)
http://www.estif.org/statistics/st_markets_in_europe_2012/
AEE INTEC Unglazed water collectors: AEE INTEC recordings
http://www.estif.org/statistics/st_markets_in_europe_2012/
Canada Reda Djebbar
Natural Resources Canada
ClearSky Advisors Inc. Survey of Active Solar
Thermal Collectors, Industry and Markets in
Canada (2012)
http://www.cansia.ca/sites/default/files/survey_of_active_
solar_thermal_collectors_-_2012_-_july_17.pdf
Out of operation systems considered
Chile AEE INTEC, 2014 (estimation)
Projected by AEE INTEC (0% growth rate 2011 / 2012)
China Hu Runqing
Center for Renewable Energy Development -
Energy Research Institute (NDRC)
CSTIF - Chinese Solar Thermal Industry Federation
Out of operation systems calculated by CSTIF
Croatia ESTIF – European Solar Thermal
Industry Federation
Glazed water collectors: ESTIF, 2013
http://www.estif.org/statistics/st_markets_in_europe_2012/
Cyprus Soteris Kalogirou
Cyprus University of Technology
Cyprus University of Technology;
Energy Service, Ministry of Commerce,
Industry & Tourism, Cyprus
Out of operation systems considered for flat plate collectors only
by AEE INTEC
Czech Republic Ales Bufka
Ministry of Industry and Trade
Ministry of Industry and Trade; Bufka, A.: Solar
collectors in 2012 - statistical review
53
SOLAR HEAT WORLDWIDE 2012

Denmark ESTIF – European Solar Thermal
Industry Federation
Glazed water collectors: ESTIF, 2013
http://www.estif.org/statistics/st_markets_in_europe_2012/
AEE INTEC Unglazed water collectors: AEE INTEC recordings
Estonia ESTIF – European Solar Thermal
Industry Federation
Glazed water collectors: ESTIF, 2013 (estimation)
http://www.estif.org/statistics/st_markets_in_europe_2012/
Finland ESTIF – European Solar Thermal
Industry Federation
Glazed water collectors: ESTIF, 2013 (estimation)
http://www.estif.org/statistics/st_markets_in_europe_2012/
AEE INTEC Unglazed water collectors: AEE INTEC recordings
France (mainland) Céline Coulaud
ADEME - Centre de Sophia Antipolis
Glazed water collectors: ADEME; Enerplan
Unglazed water collectors: AEE INTEC recordings
John Hollick
SAHWIA - Solar Air Heating World Industry Association
Air collectors: SAHWIA
Germany Jan Knaack
BSW - Bundesverband Solarwirtschaft e.V.
Glazed water collectors: BSW
Unglazed water collectors: AEE INTEC recordings
http://www.solarwirtschaft.de/unsere-themen/
zahlen-und-fakten.html
Out of operation systems considered for unglazed water
collectors only by AEE INTEC
John Hollick
SAHWIA - Solar Air Heating World Industry Association
Air collectors: SAHWIA
Greece Vassiliki Drosou
CRES - Centre for Renewable Energy Sources
Vassiliki Drosou (CRES), Costas Travasoras (EBHE)
Hungary Pál Varga
MÉGNAP- Hungarian Solar Thermal Industry
Federation
MÉGNAP- Hungarian Solar Thermal Industry
Federation
India Jaideep N. Malaviya
Malaviya Solar Energy Consultancy
Malaviya Solar Energy Consultancy
(based on market survey)
Ireland Mary Holland
Sustainable Energy Authority of Ireland
Energy policy statistical support unit of Sustainable
Energy Authority of Ireland
Based on Grant scheme data; BER database
Israel Asher Vaturi
ICTAF - Israel Bureau of Statistics
Israel Bureau of Statistics, Israel Ministry of water
and energy & The Max Stern Yezreel Valley College
Out of operation systems (replacements) considered by ICTAF
Italy Valeria Verga
Assolterm - Associazione Italiana Solare Termico
Glazed water collectors: Assolterm processing of
data by Price Waterhouse Coopers
Unglazed water collectors: AEE INTEC recordings
Japan Yamashita Noriaki
ISEP - Institute for Sustainable Energy Policies
ISEP; Solar System Development Association
(SSDA)
Out of operation systems calculated by ISEP
Jordan AEE INTEC, 2014 (estimation)
Projected by AEE INTEC (0% growth rate 2011 / 2012)
Korea, South 2012 New & Renewable Energy Statistics by the
Korea New & Renewable Energy Center, 2013
http://solarthermalworld.org/content/south-korea-renewable-
building-obligation-increases-market-size
54
SOLAR HEAT WORLDWIDE 2012

Latvia ESTIF – European Solar Thermal
Industry Federation
Glazed water collectors: ESTIF, 2013 (estimation)
http://www.estif.org/statistics/st_markets_in_europe_2012/
Lebanon AEE INTEC, 2014 (estimation)
Projected by AEE INTEC (10% growth rate 2011 / 2012)
Lithuania ESTIF – European Solar Thermal
Industry Federation
Glazed water collectors: ESTIF, 2013 (estimation)
http://www.estif.org/statistics/st_markets_in_europe_2012/
Luxembourg ESTIF – European Solar Thermal
Industry Federation
Glazed water collectors: ESTIF, 2013 (estimation)
http://www.estif.org/statistics/st_markets_in_europe_2012/
Malta Godwin Sant
Malta Resources Authority
Malta Resources Authority
Mexico ANES – Asociación Nacional de Energía Solar
http://solarthermalworld.org/print/62486
Morocco AEE INTEC, 2014 (estimation)
Projected by AEE INTEC (10% growth rate 2011 / 2012)
Mozambique Unpublished sources,
provided by Geraldo Nhumaio
SOLTRAIN survey
Netherlands Reinoud Segers
Statistics Netherlands (CBS)
Statistics Netherlands (CBS)
Cumulated areas: Statistics Netherlands based on survey of
sales. Market Shares: Expert Estimates NL Agency.
Norway Peter Bernhard
Asplan Viak AS – KanEnergi
Asplan Viak AS – KanEnergi
Poland Aneta Wiecka
EC BREC Institute for Renewable Energy (EC BREC IEO)
EC BREC IEO
Portugal João Farinha Mendes
APISOLAR - Associação Portuguesa da
Indústria Solar
APISOLAR (www.apisolar.pt); „Oservatório Solar :
Estatisticas Solar Termico 2012"
http://www.aguaquentesolar.com/_fich/18/
ST-Pt2012_fntApisolar.pdf
Romania ESTIF – European Solar Thermal
Industry Federation
Glazed water collectors: ESTIF, 2013 (estimation)
http://www.estif.org/statistics/st_markets_in_europe_2012/
Russia Semen Frid, Sophia Kiseleva
Moscow State University
Moscow State University
Vitaly Butuzov
Yuzhgeoteplo corporation, Krasnodar
Slovakia ESTIF – European Solar Thermal
Industry Federation
Glazed water collectors: ESTIF, 2013
http://www.estif.org/statistics/st_markets_in_europe_2012/
Slovenia ESTIF – European Solar Thermal
Industry Federation
Glazed water collectors: ESTIF, 2013
http://www.estif.org/statistics/st_markets_in_europe_2012/
South Africa Dieter Holm
SOLTRAIN coordinator Southern Africa and
SESSA organiser for Gauteng
Eskom’s"Dashboard"(2008-2011); Raj Pandaram
(2013);
SOLTRAIN2 survey in Gauteng (2013)
Spain Pascual Polo
ASIT - Asociación Solar de la Industria Térmica
ASIT - Asociación Solar de la Industria Térmica
Out of operation systems calculated by ASIT
Sweden Jan-Olof Dalenbäck
Svensk Solenergi / CHALMERS
Svensk solenergi;
CHALMERS University of Technology
55
SOLAR HEAT WORLDWIDE 2012

Switzerland SWISSOLAR SWISSOLAR – Schweizerischer Fachverband
für Sonnenenergie: Markterhebung Sonnenergie,
2012
http://www.swissolar.ch/fileadmin/files/swissolar_neu/
1._Unsere_Themen/1.07_Schweizer_Solarindustrie/
Marktumfrage_2012.pdf
Out of operation systems calculated by SWISSOLAR
Taiwan K.M. Chung
Energy Research Center -
National Cheng Kung University
Bureau of Energy, Ministry of Economic Affairs,
R.O.C.
Out of operation systems calculated by Bureau of Energy,
Ministry of Economic Affairs, R.O.C.
Tunisia Moncef Njaimi
ANME - National Agency of Energy Conservation
ANME - National Agency of Energy Conservation
Turkey A. Kutay Ulke
EZINC Metal San. Tic. A.S.
EZINC Metal San. Tic. A.S.
Out of operation systems calculated by AEE INTEC
United Kingdom ESTIF – European Solar Thermal
Industry Federation
SAHWIA - Solar Air Heating World
Industry Association
Glazed water collectors: ESTIF, 2013
Air collectors: SAHWIA
http://www.estif.org/statistics/st_markets_in_europe_2012/
United States Les Nelson
IAPMO Solar Heating & Cooling Programs
Water Collectors: IAPMO Solar Heating & Cooling
Programs; provided by Les Nelson (Director);
Out of operation systems considered based on historical data
(1975 – 2009) from U.S. Department of Energy (DoE) -
Energy Information Administration (EIA)
John Hollick
SAHWIA - Solar Air Heating World Industry Association
Air collectors: SAHWIA
56
SOLAR HEAT WORLDWIDE 2012

8.6.1 Additional literature and web sources used
The following reports and statistics were used in this report.
• Associação Portuguesa da Indústria Solar (APISOLAR): Oservatório Solar: Estatisticas Solar Termico 2012;
February 2013
• Bundesamt für Energie (BFE): Markterhebung Sonnenenergie 2012 – Teilstatistik der Schweizerischen Statistik
der erneuerbaren Energien; prepared by SWISSOLAR, Thomas Hostettler, Bern, Switzerland July 2013
• Bundesministerium für Verkehr, Innovation und Technologie (BMVIT): Innovative Energietechnologien
in Österreich – Marktentwicklung 2012; prepared by Peter Biermayr et al., Vienna, Austria May 2013
• Bundesverband Solarwirtschaft e.V. (BSW-Solar): Statistische Zahlen der deutschen Solarwärmebranche
(Solarthermie) 2012; accessed on November 2013
• ClearSky Advisors Inc.: Survey of Active Solar Thermal Collectors, Industry and Markets in Canada (2012);
Prepared by ClearSky Advisors Inc., Dr. Reda Djebbar, Natural Resources Canada, July 2013
• EurObserv’ER: Solar Thermal Barometer, May 2013
• European Solar Thermal Industry Federation (ESTIF): Solar Thermal Markets in Europe, Trends and Market
Statistics 2012; Belgium - Brussels; June 2013
• Observatoiremediterraneende l’energie(OME):SolarThermal in theMediterraneanRegion:MarketAssessment
Report, OME report for GSWH-UNEP-UNDP; September 2012
• REN 21: MENA 2013 - MENA renewables status report; June 2013
• REN 21: Renewables 2013 Global Status Report, June 2013
The following online sources were used in this report:
• http://www.anes.org/
• http://www.aderee.ma/
• http://www.apisolar.pt/
• http://www.asit-solar.com/
• http://www.dasolabrava.org.br/
• http://www.epia.org/home/
• http://www.estif.org/
• http://www.iea-shc.org/
• http://www.mnre.gov.in/
• http://www.ome.org/
• http://www.olade.org/
• http://www.ren21.net/
• http://sahwia.org/
• http://www.solar-district-heating.eu/
• http://www.solarwirtschaft.de/
• http://www.solrico.com/
• http://www.solarthermalworld.org/
57
SOLAR HEAT WORLDWIDE 2012

8.7 List of Figures
Figure 1: Countries represented in this report . . . . . . . . . . . . . . . . . . . . . . . . . . . . . . . . . . . . . . . . . . . . . . . . . . . . . . . . . . . . . . . . . . . . . . . . . . . . . . . . . . . . . . . . 4
Figure 2: Total capacity in operation [GWel], [GWth] 2013 and annual energy generated [TWhel], [TWhth ]
(Sources: AEE INTEC, GWEC, EPIA, IEA PVPS, Navigant Research, Ocean Energy Systems, REN21,
U.S. Geothermal Energy Association) . . . . . . . . . . . . . . . . . . . . . . . . . . . . . . . . . . . . . . . . . . . . . . . . . . . . . . . . . . . . . . . . . . . . . . . . . . . . . . . . . . . . . . 7
Figure 3: Share of the total installed capacity in operation (glazed and unglazed water and air collectors)
by economic region at the end of 2012 . . . . . . . . . . . . . . . . . . . . . . . . . . . . . . . . . . . . . . . . . . . . . . . . . . . . . . . . . . . . . . . . . . . . . . . . . . . . . . . . . . . . . 8
Figure 4: Distribution of the total installed capacity in operation by collector type in 2012 - WORLD . . . . . . . . . . . . . . . . . . . . . . . . 11
Figure 5: Distribution of the total installed capacity in operation by collector type in 2012 - EUROPE . . . . . . . . . . . . . . . . . . . . . . . . 11
Figure 6: Top 10 countries of cumulated water collector installations (absolute figures in MWth) . . . . . . . . . . . . . . . . . . . . . . . . . . . . . 12
Figure 7: Top 10 countries of cumulated water collector installations (relative figures in kWth per 1,000 inhabitants) . . . . 12
Figure 8: Total capacity of glazed water collectors in operation by the end of 2012 . . . . . . . . . . . . . . . . . . . . . . . . . . . . . . . . . . . . . . . . . . . . 13
Figure 9: Total capacity of glazed water collectors in operation in kWth per 1,000 inhabitants by the end of 2012 . . . . . . . . . 13
Figure 10: Total capacity of glazed flat plate and evacuated tube collectors in operation by economic region
at the end of 2012 . . . . . . . . . . . . . . . . . . . . . . . . . . . . . . . . . . . . . . . . . . . . . . . . . . . . . . . . . . . . . . . . . . . . . . . . . . . . . . . . . . . . . . . . . . . . . . . . . . . . . . . . . . . 14
Figure 11: Total capacity of glazed flat plate and evacuated tube collectors in operation by economic region and
in kWth per 1,000 inhabitants by the end of 2011 . . . . . . . . . . . . . . . . . . . . . . . . . . . . . . . . . . . . . . . . . . . . . . . . . . . . . . . . . . . . . . . . . . . . . . . 14
Figure 12: Total capacity of unglazed water collectors in operation by the end of 2012 . . . . . . . . . . . . . . . . . . . . . . . . . . . . . . . . . . . . . . . . . 15
Figure 13: Total capacity of unglazed water collectors in operation in kWth per 1,000 inhabitants by the end of 2012 . . . . . . 15
Figure 14: Share of the newly installed capacity (glazed and unglazed water and air collectors)
by economic regions in 2012 . . . . . . . . . . . . . . . . . . . . . . . . . . . . . . . . . . . . . . . . . . . . . . . . . . . . . . . . . . . . . . . . . . . . . . . . . . . . . . . . . . . . . . . . . . . . . . . 16
Figure 15: Market growth of newly installed capacity between 2011 and 2012 by economic region . . . . . . . . . . . . . . . . . . . . . . . . . . 17
Figure 16: Distribution of the newly installed capacity by collector type in 2012 - WORLD . . . . . . . . . . . . . . . . . . . . . . . . . . . . . . . . . . . . . . . . .
Figure 17: Distribution of the newly installed capacity by collector type in 2012 – EUROPE . . . . . . . . . . . . . . . . . . . . . . . . . . . . . . . . . . . . 20
Figure 18: Top 10 markets for glazed and unglazed water collectors in 2012 (absolute figures in MWth) . . . . . . . . . . . . . . . . . . . . . 20
Figure 19: Top 10 markets for glazed and unglazed water collectors in 2012 (relative figures in kWth
per 1,000 inhabitants) . . . . . . . . . . . . . . . . . . . . . . . . . . . . . . . . . . . . . . . . . . . . . . . . . . . . . . . . . . . . . . . . . . . . . . . . . . . . . . . . . . . . . . . . . . . . . . . . . . . . . . 21
Figure 20: Newly installed capacity of glazed water collectors in 2012 . . . . . . . . . . . . . . . . . . . . . . . . . . . . . . . . . . . . . . . . . . . . . . . . . . . . . . . . . . . . 22
Figure 21: Newly installed capacity of glazed water collectors in 2012 in kWth per 1,000 inhabitants . . . . . . . . . . . . . . . . . . . . . . . . . 22
Figure 22: Global market development of glazed water collectors from 2000 to 2012 . . . . . . . . . . . . . . . . . . . . . . . . . . . . . . . . . . . . . . . . . . 23
Figure 23: Market development of glazed water collectors in China and Europe . . . . . . . . . . . . . . . . . . . . . . . . . . . . . . . . . . . . . . . . . . . . . . . . . 23
Figure 24: Market development of glazed water collectors in Europe and the Rest of World (excluding China) . . . . . . . . . . . . . . 24
Figure 25: Market development of glazed water collectors in Rest of World (excluding China and Europe) . . . . . . . . . . . . . . . . . . 24
Figure 26: Annual installed capacity of glazed water collectors in kWth per 1,000 inhabitants from 2000 to 2012 . . . . . . . . . . 25
Figure 27: Global market development of unglazed water collectors from 2000 to 2012 . . . . . . . . . . . . . . . . . . . . . . . . . . . . . . . . . . . . . . . 26
Figure 28: Global market development of unglazed water collectors from 2000 to 2012 . . . . . . . . . . . . . . . . . . . . . . . . . . . . . . . . . . . . . . . 26
Figure 29: Share of energy savings and CO2 reduction by type of application of glazed and unglazed water collectors
in operation by the end of 2012 . . . . . . . . . . . . . . . . . . . . . . . . . . . . . . . . . . . . . . . . . . . . . . . . . . . . . . . . . . . . . . . . . . . . . . . . . . . . . . . . . . . . . . . . . . . . 27
Figure 30: Annual collector yield of unglazed and glazed water collectors in operation by end of 2012 . . . . . . . . . . . . . . . . . . . . . . . 29
Figure 31: Annual energy savings in oil equivalent by unglazed and glazed water collectors in operation by end of 2012 . 29
Figure 32: Contribution to CO2 reduction by unglazed and glazed water collectors in operation by end of 2012 . . . . . . . . . . . . 30
Figure 33: Distribution by type of solar thermal collector for the total installed water collector capacity in operation
by the end of 2012 . . . . . . . . . . . . . . . . . . . . . . . . . . . . . . . . . . . . . . . . . . . . . . . . . . . . . . . . . . . . . . . . . . . . . . . . . . . . . . . . . . . . . . . . . . . . . . . . . . . . . . . . . . . 31
Figure 34: Distribution by type of solar thermal collector for the newly installed water collector capacity in 2012 . . . . . . . . . . 32
Figure 35: Distribution by type of system for the total installed glazed water collector capacity in operation
by the end of 2012 . . . . . . . . . . . . . . . . . . . . . . . . . . . . . . . . . . . . . . . . . . . . . . . . . . . . . . . . . . . . . . . . . . . . . . . . . . . . . . . . . . . . . . . . . . . . . . . . . . . . . . . . . . . 32
Figure 36: Distribution by type of system for the newly installed glazed water collector capacity in 2012 . . . . . . . . . . . . . . . . . . . . 33
58
SOLAR HEAT WORLDWIDE 2012

Figure 37: Distribution of solar thermal systems by application for the total installed water collector capacity
by economic region in operation by the end of 2012 . . . . . . . . . . . . . . . . . . . . . . . . . . . . . . . . . . . . . . . . . . . . . . . . . . . . . . . . . . . . . . . . . . . . 34
Figure 38: Distribution of solar thermal systems by application for the newly installed water collector capacity
by economic region in 2012 . . . . . . . . . . . . . . . . . . . . . . . . . . . . . . . . . . . . . . . . . . . . . . . . . . . . . . . . . . . . . . . . . . . . . . . . . . . . . . . . . . . . . . . . . . . . . . . . 34
Figure 39: Distribution of solar thermal systems by application for the 10 leading markets of the newly installed glazed
water collector capacity in 2011 . . . . . . . . . . . . . . . . . . . . . . . . . . . . . . . . . . . . . . . . . . . . . . . . . . . . . . . . . . . . . . . . . . . . . . . . . . . . . . . . . . . . . . . . . . . 35
Figure 40: European large-scale solar heating systems by end of 2013
(Source: Jan-Olof Dalenbäck - Chalmers University of Technology) . . . . . . . . . . . . . . . . . . . . . . . . . . . . . . . . . . . . . . . . . . . . . . . . . . 37
Figure 41: Market development 2004-2013 of small to large-scale solar air conditioning and cooling systems
(Source: Climasol, EURAC, Fraunhofer ISE, Green Chiller, Rococo, Solem Consulting, Tecsol) . . . . . . . . . . . . . . . . . . . 38
Figure 42: Global solar process heat applications in operation
(Source: IEA SHC Task49/IV SHIP database, accessed on 2014-05-16) . . . . . . . . . . . . . . . . . . . . . . . . . . . . . . . . . . . . . . . . . . . . 39
Figure 43: Hydraulic scheme of the swimming pool reference system . . . . . . . . . . . . . . . . . . . . . . . . . . . . . . . . . . . . . . . . . . . . . . . . . . . . . . . . . . . . 42
Figure 44: Hydraulic scheme of the domestic hot water pumped reference system for single family houses . . . . . . . . . . . . . . . . 44
Figure 45: Hydraulic scheme of the domestic hot water thermosiphon reference system for single family houses . . . . . . . . . 44
Figure 46: Hydraulic scheme of the domestic hot water pumped reference system for multifamily houses . . . . . . . . . . . . . . . . . . 45
Figure 47: Hydraulic scheme of the solar-combi reference system for single and multifamily houses . . . . . . . . . . . . . . . . . . . . . . . . 46
8.8 List of Tables
Table 1: Total capacity in operation by the end of 2012 [MWth] . . . . . . . . . . . . . . . . . . . . . . . . . . . . . . . . . . . . . . . . . . . . . . . . . . . . . . . . . . . . . . . . . . . . 9
Table 2: Total installed collector area in operation by the end of 2012 [m²] . . . . . . . . . . . . . . . . . . . . . . . . . . . . . . . . . . . . . . . . . . . . . . . . . . . . 10
Table 3: Newly installed capacity in 2012 [MWth/a] . . . . . . . . . . . . . . . . . . . . . . . . . . . . . . . . . . . . . . . . . . . . . . . . . . . . . . . . . . . . . . . . . . . . . . . . . . . . . . . 18
Table 4: Newly installed collector area in 2012 [m²/a] . . . . . . . . . . . . . . . . . . . . . . . . . . . . . . . . . . . . . . . . . . . . . . . . . . . . . . . . . . . . . . . . . . . . . . . . . . . . 19
Table 5: Calculated annual collector yield and corresponding oil equivalent and CO2 reduction of glazed
and unglazed water collectors in operation by the end of 2012 . . . . . . . . . . . . . . . . . . . . . . . . . . . . . . . . . . . . . . . . . . . . . . . . . . . . . . . . 28
Table 6: Solar thermal systems for swimming pool heating by end of 2012 . . . . . . . . . . . . . . . . . . . . . . . . . . . . . . . . . . . . . . . . . . . . . . . . . . . 28
Table 7: Solar thermal systems for domestic hot water heating in single family houses by end of 2012 . . . . . . . . . . . . . . . . . . . 43
Table 8: Solar thermal systems for domestic hot water heating in multifamily houses by end of 2012 . . . . . . . . . . . . . . . . . . . . . 45
Table 9: Solar combi system reference for single and multifamily houses and the total collector area
in operation in 2011 . . . . . . . . . . . . . . . . . . . . . . . . . . . . . . . . . . . . . . . . . . . . . . . . . . . . . . . . . . . . . . . . . . . . . . . . . . . . . . . . . . . . . . . . . . . . . . . . . . . . . . . . . 46
Table 10: Reference climates for the 58 countries surveyed . . . . . . . . . . . . . . . . . . . . . . . . . . . . . . . . . . . . . . . . . . . . . . . . . . . . . . . . . . . . . . . . . . . . . . . 47
Table 11: Inhabitants by the end of 2012 of the 58 surveyed countries in alphabetical order . . . . . . . . . . . . . . . . . . . . . . . . . . . . . . . . . 48
Table 12: Inhabitants per economic region by the end of 2011 . . . . . . . . . . . . . . . . . . . . . . . . . . . . . . . . . . . . . . . . . . . . . . . . . . . . . . . . . . . . . . . . . . . 48
Table 13: Newly installed collector area in 2010 (revised 2014) [m²/a] . . . . . . . . . . . . . . . . . . . . . . . . . . . . . . . . . . . . . . . . . . . . . . . . . . . . . . . . . 50
Table 14: Newly installed collector area in 2011 (revised 2014) [m²/a] . . . . . . . . . . . . . . . . . . . . . . . . . . . . . . . . . . . . . . . . . . . . . . . . . . . . . . . . . 51
Table 15: Total collector area in operation by the end of 2011 (revised 2014) [m²] . . . . . . . . . . . . . . . . . . . . . . . . . . . . . . . . . . . . . . . . . . . . 52
59
SOLAR HEAT WORLDWIDE 2012