solar energy technologies program the prospect for $1/watt
TRANSCRIPT

Sol
ar E
nerg
y Te
chno
logi
es P
rogr
am
The
Pros
pect
for $
1/W
att E
lectri
city f
rom
Sola
r
$1/W
Wor
ksho
p Au
gust
10, 2
010
John
Lus
hets
ky
Pro
gram
Man
ager
Sol
ar E
nerg
y Te
chno
logi
es P
rogr
am (S
ETP
)
Dep
artm
ent o
f Ene
rgy
Offi
ce o
f Ene
rgy
Effi
cien
cy a
nd R
enew
able
Ene
rgy
APL000040 10/21/2011

Dis
clai
mer
“It’s
toug
h m
akin
g pr
edic
tions
, esp
ecia
lly a
bout
the
futu
re.”
-Sev
eral
sou
rces
U.S
. Dep
artm
ent o
f Ene
rgy
Sol
ar E
nerg
y Te
chno
logi
es P
rogr
amSl
ide
2
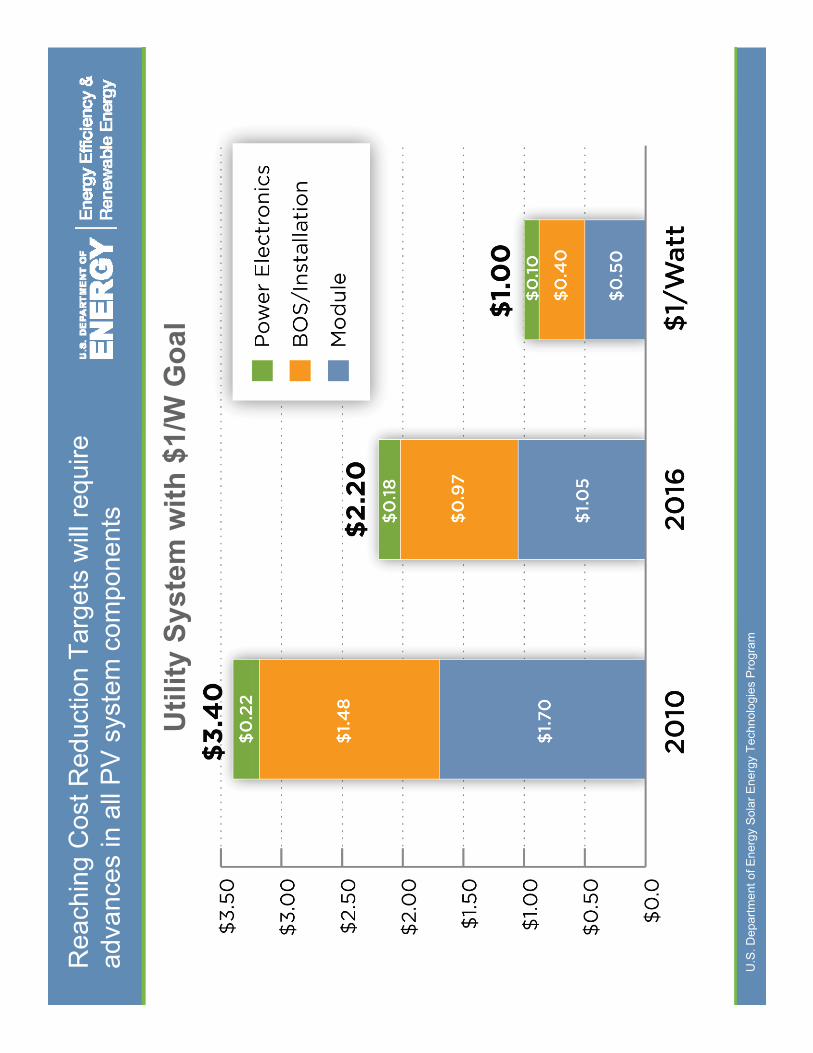
Rea
chin
g C
ost R
educ
tion
Targ
ets
will
requ
ire
adva
nces
in a
ll P
V s
yste
m c
ompo
nent
s
Util
ity S
yste
m w
ith $
1/W
Goa
l
U.S
. Dep
artm
ent o
f Ene
rgy
Sol
ar E
nerg
y Te
chno
logi
es P
rogr
am

Utilit
y PV:
LCOE
Tar
gets
Ghi
Lti
Fina
ncin
g C
ondi
tions
•Lo
w: 8.
2% af
ter-ta
x W
ACC
•Hi
gh: 9
.9% af
ter-ta
x W
ACC
Geo
grap
hic
Loca
tions
•Ph
oenix
, AZ
•Ka
nsas
City
, MO
•Ne
w Yo
rk, N
Y
2015
•W
ith th
e 30%
ITC,
PV
is br
oadly
comp
etitiv
e with
wh
olesa
le ele
ctrici
ty ra
tes
unde
r all c
ondit
ions
With
th10
%IT
CPV
i
Utilit
y PV
with
10%
ITC:
Initi
al Gr
id P
arity
: 201
4W
ides
prea
d Gr
id P
arity
: 203
0
•W
ith th
e 10%
ITC,
PV
iseq
ual to
or be
low th
e CA
MPR
unde
r mos
t co
nditio
ns an
d co
mpeti
tive w
ith hi
gh
whole
sale
electr
icity
rates
un
der t
he be
st ins
olatio
n an
d fina
ncing
cond
itions
2030
•W
ith th
e 10%
ITC,
PV
is br
oadly
comp
etitiv
e with
U.S
. Dep
artm
ent o
f Ene
rgy
Sol
ar E
nerg
y Te
chno
logi
es P
rogr
am4
* Ass
umes
IOU
or IP
P ow
nersh
ip of
PV, a
nd th
us th
e LCO
E inc
ludes
the t
axes
paid
on el
ectric
ity g
ener
ated.
Includ
es 5-
year
MAC
RS b
ut no
t stat
e or lo
cal in
centi
ves.
The
rang
e in
utility
PV
LCOE
is d
ue to
diffe
rent
insola
tion
and f
inanc
ing co
nditio
ns.
For a
comp
lete l
ist o
f ass
umpti
ons,
see D
OE S
olar C
ost T
arge
ts(2
009 –
2030
), in
proc
ess.
‡ The
elec
tricity
rate
rang
e rep
rese
nts on
e stan
dard
devia
tion b
elow
and a
bove
the m
ean U
.S. w
holes
ale el
ectric
ity p
rices
. Th
e 200
9 CA
MPR
includ
es ad
justm
ents
by ut
ility f
or th
e tim
e of
deliv
ery p
rofile
of s
olar (
low ca
se: S
DG&E
, mid
case
: PG&
E, h
igh ca
se: S
CE).
whole
sale
electr
icity
rates
un
der a
ll fina
ncing
and
insola
tion c
ondit
ions

Resid
entia
l PV:
LCOE
Tar
gets
Fina
ncin
g M
echa
nism
s•
Home
Mor
tgage
(80%
fin
ancin
g, 6.0
% in
teres
t, 30
-year
term
)•
Home
Equ
ity Lo
an (1
00%
fin
ancin
g, 7.7
5% in
teres
t, 15
-year
term
)
Geo
grap
hic
Loca
tions
•Ph
oenix
, AZ
•Ka
nsas
City
MORe
siden
tialP
Vwi
thou
tITC
:
Phoe
nix &
Ca
sh P
urch
ase †
2015
•W
ithou
t the I
TC, P
V is
broa
dlyco
mpeti
tivew
ith
Kans
as C
ity, M
O•
New
York,
NY
Resid
entia
l PV
with
out I
TC:
Initi
al Gr
id P
arity
: 201
3W
ides
prea
d Gr
id P
arity
: 201
5
broa
dly co
mpeti
tive w
ith
resid
entia
l elec
tricity
rates
un
der a
ll fina
ncing
and
insola
tion c
ondit
ions
2030
•W
ithou
ttheI
TCPV
has
Phoe
nix &
PAC
E Fi
nanc
ing
Phoe
nix &
PAC
E Fi
nanc
ing
•W
ithou
t the I
TC, P
V ha
s lev
elize
d cos
ts tha
t are
low
er th
an m
ost
resid
entia
l elec
tricity
rates
U.S
. Dep
artm
ent o
f Ene
rgy
Sol
ar E
nerg
y Te
chno
logi
es P
rogr
am5
*No s
tate,
local
or ut
ility i
ncen
tives
are i
nclud
ed. T
he ra
nge i
n res
identi
al PV
LCOE
is du
e to
differ
ent in
solat
ion an
d fina
ncing
cond
itions
. For
a co
mplet
e list
of a
ssum
ption
s, se
e DOE
So
lar C
ost T
arge
ts (2
009 –
2030
), in
proc
ess.
‡ The
elec
tricity
rate
rang
e rep
rese
nts on
e stan
dard
devia
tion b
elow
and a
bove
the
mean
U.S
. res
identi
al ele
ctrici
ty pr
ices.
Prop
erty
Asse
ssed
Clea
n Ene
rgy (
PACE
) Fina
ncing
assu
mes 1
00%
finan
cing a
t 5.0%
inter
est w
ith a
20-ye
ar pa
ybac
k sch
edule
† Cas
h pur
chas
e ass
umes
a dis
coun
t rate
of 9
.2% (n
omina
l), eq
ual to
the
long t
erm
retur
n on t
he S
&P 50
0

Sol
ar P
V C
ost R
educ
tion
Pro
gres
s,
Pot
entia
l of K
now
n Te
chno
logy
Pat
hway
s
Rea
chin
g$
50/W
coul
dta
keun
til20
30fo
rSim
odul
es*
Rea
chin
g$.
50/W
coul
dta
keun
til20
30fo
rSim
odul
es
U.S
. Dep
artm
ent o
f Ene
rgy
Sol
ar E
nerg
y Te
chno
logi
es P
rogr
amSl
ide
6

Man
ufac
turin
g C
ost M
odel
Sco
pe:
Cry
stal
line
Silic
on P
V
•D
etai
led
cost
mod
els
deve
lope
d fo
r eac
h st
ep:
•E
valu
ate
Tech
nica
l (C
ost)
Impr
ovem
ent O
ppor
tuni
ties
•S
imul
ate
disc
rete
man
ufac
turin
g op
erat
ions
•S
ensi
tivity
toin
depe
nden
tpro
cess
mat
eria
lpro
perti
esS
ensi
tivity
toin
depe
nden
tpro
cess
,mat
eria
lpro
perti
es•
Mar
gins
at e
ach
step
in th
e va
lue
chai
n•
Inte
rmed
iate
pro
duct
sal
es o
ppor
tuni
ty•
pro
form
a in
com
e st
atem
ent
•M
inim
um s
usta
inab
le: e
limin
ate
mar
ket n
oise
from
pro
ject
ions
•C
olla
bora
tions
with
stak
ehol
ders
from
thro
ugho
utth
e
U.S
. Dep
artm
ent o
f Ene
rgy
Sol
ar E
nerg
y Te
chno
logi
es P
rogr
am
•C
olla
bora
tions
with
stak
ehol
ders
from
thro
ugho
utth
eIn
dust
ry c
ritic
al to
mod
el d
evel
opm
ent
Slid
e 7

Cos
t red
uctio
n of
silic
on fe
edst
ock
to b
e le
d by
intro
duct
ion
of F
BR
pro
cess
FBR
pro
cess
cos
t adv
anta
ges:
•B
ette
r sila
ne g
as u
tiliz
atio
n•
Low
er te
mpe
ratu
re (e
nerg
y)•
Impr
oved
yie
ld (r
ates
)•
Cap
ital u
tiliz
atio
n
•To
tal c
ost b
enef
it: ~
40%
Mat
eria
lqua
lity:
Est
imat
ed m
argi
n co
mpr
essi
on
Mat
eria
lqua
lity:
•Fe
wer
met
al, O
2im
purit
ies
Cry
stal
gro
wth
adv
anta
ges:
•M
ultip
le re
char
ge (i
.e. s
emi
tiC
th)
cont
inuo
usC
z-gr
owth
)
•B
y 20
15, m
argi
n co
mpr
essi
on e
xpec
ted
to
driv
e S
G-S
i pric
e to
min
imal
sus
tain
able
.
•B
y 20
30, 2
0% e
xpec
ted
from
FB
R
U.S
. Dep
artm
ent o
f Ene
rgy
Sol
ar E
nerg
y Te
chno
logi
es P
rogr
am
•A
dditi
onal
driv
er fo
r FB
R w
ill c
ome
from
ad
vanc
ed c
ell a
rchi
tect
ures
.
Slid
e 8
Sour
ce:
MEM
C

Cos
t Red
uctio
n O
ppor
tuni
ties:
c-
Si W
afer
s
•K
ey in
nova
tions
•S
emi-c
ontin
uous
CZ-
crys
tal g
row
th
•D
iam
ond
wire
waf
erin
g
•K
erfle
ssw
afer
(80
mic
rons
)
U.S
. Dep
artm
ent o
f Ene
rgy
Sol
ar E
nerg
y Te
chno
logi
es P
rogr
am
•K
erfle
ssw
afer
(80
mic
rons
)
Slid
e 9
Sou
rce:
Sig
en

c-S
i Cel
l Des
crip
tion:
203
0*B
ased
on
publ
icly
dis
clos
ed (l
itera
ture
) cel
l des
igns
, not
inte
nded
to d
epic
t pr
oprie
tary
arc
hite
ctur
es
Not d
rawn
to sc
ale.
Text
urin
g no
t sho
wn.
•A
ll R
ear (
Inte
rdig
itate
d) C
onta
cts
•H
igh
lifet
ime
(n-t
ype)
waf
er•
Hig
hlif
etim
e(n
-typ
e)w
afer
•U
ltra
thin
(80
mic
rons
) ker
fless
waf
ers
•H
igh
qual
ity s
urfa
ce p
assi
vatio
n
•P
late
d em
itter
con
tact
s
•E
lect
role
ssni
ckel
bar
rier,
Cu
plat
ing
•B
ase
poin
tcon
tact
abso
rber
s
U.S
. Dep
artm
ent o
f Ene
rgy
Sol
ar E
nerg
y Te
chno
logi
es P
rogr
am
ase
potc
ota
ctab
sobe
s
•P
rinte
d A
l con
tact
s
Slid
e 10

c-S
i Cel
l Cos
tsMo
no C
ryst
allin
e (c-
Si) C
ell M
anuf
actu
ring
Cost
s
Sili
PV
hiti
lf
liit
U.S
. Dep
artm
ent o
f Ene
rgy
Sol
ar E
nerg
y Te
chno
logi
es P
rogr
am
•S
ilico
nP
V a
ppro
achi
ng p
ract
ical
per
form
ance
limit
•20
30 c
ase:
24%
pro
duct
ion
aver
age
cell,
21.
5% m
odul
e
Slid
e 11

c-S
i Mod
ule
Cos
tsMo
no C
ryst
allin
e(c-
Si) M
odul
e Man
ufac
turin
g Cos
ts
Selec
tive e
mitt
ers
All r
ear c
onta
cts
180�
m w
afer
140 �
m ke
rf16
0�m
120 �
m12
0�m
90�m
80�m
kerfl
ess
PS: $
34/kg
10 C
zrec
harg
es80
micr
on A
g Fr
amele
ss m
odul
e
PS: $
33/kg
Diam
ond
wire
40 m
icron
Ag
see+
CuA
gSn
plat
ing
Enha
nced
pass
ivatio
n (d
ielec
tric)
Rear
poi
nt co
ntac
tsAR
glas
sAl
l rea
r con
tact
s
PS: $
32/kg
Ni el
ectro
less s
eed
All C
u em
itter
(plat
ing)
U.S
. Dep
artm
ent o
f Ene
rgy
Sol
ar E
nerg
y Te
chno
logi
es P
rogr
amS
lide
12

Sol
ar P
V C
ost R
educ
tion
Pro
gres
s,
Pot
entia
l of K
now
n Te
chno
logy
Pat
hway
s
$.83
-$.
71/W
U.S
. Dep
artm
ent o
f Ene
rgy
Sol
ar E
nerg
y Te
chno
logi
es P
rogr
amSl
ide
13

Sol
ar P
V C
ost R
educ
tion
Pro
gres
s,
Pot
entia
l of K
now
n Te
chno
logy
Pat
hway
s
$.83
-$.
71/W
U.S
. Dep
artm
ent o
f Ene
rgy
Sol
ar E
nerg
y Te
chno
logi
es P
rogr
amSl
ide
14

Sol
ar P
V C
ost R
educ
tion
Pro
gres
s,
Pot
entia
l of K
now
n Te
chno
logy
Pat
hway
s
Rea
chin
g $.
50/W
cou
ld ta
ke u
ntil
2021
for C
dTe
mod
ules
*
U.S
. Dep
artm
ent o
f Ene
rgy
Sol
ar E
nerg
y Te
chno
logi
es P
rogr
amSl
ide
15

CdT
e E
ffici
ency
Roa
d M
ap:
Inno
vatio
n R
emai
ns a
n Im
porta
nt F
acto
r
?
•Fi
rst S
olar
sta
ted
(Jun
e 20
09)g
oal f
or $
.52/
W c
ost (
$.63
/Wpr
ice)
U.S
. Dep
artm
ent o
f Ene
rgy
Sol
ar E
nerg
y Te
chno
logi
es P
rogr
amS
lide
16
()g
$($
p)
•14
.4%
impl
ies
a si
gnifi
cant
adv
ance
men
t in
mod
ule
tech
nolo
gy (8
6% o
f cur
rent
, or n
ew ‘c
ham
pion
cel
l’)•
Bes
t in
clas
s c-
Si m
odul
e: ~
79%
of c
ham
pion
lab
cell,
man
y m
ore
year
s to
clo
se th
e ga
p

Sol
ar P
V C
ost R
educ
tion
Pro
gres
s,
Pot
entia
l of K
now
n Te
chno
logy
Pat
hway
s
Firs
t Sol
ar Q
2 20
10 re
porte
d co
st: $
0.76
/Wp
$.63
-$.
52/W
U.S
. Dep
artm
ent o
f Ene
rgy
Sol
ar E
nerg
y Te
chno
logi
es P
rogr
amSl
ide
17

Sol
ar P
V C
ost R
educ
tion
Pro
gres
s,
Pot
entia
l of K
now
n Te
chno
logy
Pat
hway
s
Firs
t Sol
ar Q
2 20
10 re
porte
d co
st: $
0.76
/Wp
$.63
-$.
52/W
U.S
. Dep
artm
ent o
f Ene
rgy
Sol
ar E
nerg
y Te
chno
logi
es P
rogr
amSl
ide
18

$0.5
0/W
Mod
ule
Cha
lleng
e: P
oten
tial
Bre
akdo
wn
of M
odul
e C
osts
2010
2015
Cost
Cost
Cost�($/W
)Cost�($/m
2)
$1/W
�Target
Capital
$0.24
$0.20
$0.10
$28
Materials
$1.11
$0.49
$0.23
$68
Labor
$0.27
$0.12
$0.06
$17
Margin
$079
$024
$011
•In
ord
er to
ach
ieve
$0.
50/W
mod
ule
selli
ng p
rice
Margin
$0.79
$0.24
$0.11
Total�M
odule
$1.70
$1.05
$0.50
•C
apex
of $
0.70
/W m
ay b
e re
quire
d.
•M
ater
ials
cos
ts m
ust b
e ab
out $
68/m
2*
•G
lass
EV
Aan
dba
cksh
eett
oday
cost
sab
out$
18/m
2ab
out2
5%of
•G
lass
,EV
A,a
ndba
cksh
eett
oday
cost
sab
out$
18/m
2 ,ab
out2
5%of
the
budg
et fo
r mat
eria
ls.
Met
alliz
atio
n ne
xt s
igni
fican
t opp
ortu
nity
.
•M
anuf
actu
ring
labo
r mus
t acc
ount
for l
ess
than
$0.
06/W
F10
0M
Wf
ti
ltt
120
FTE
t$50
k/f
lll
dd
U.S
. Dep
artm
ent o
f Ene
rgy
Sol
ar E
nerg
y Te
chno
logi
es P
rogr
am
•Fo
r100
MW
fact
ory,
equ
ival
entt
o12
0FT
Es
at$5
0k/y
rful
lylo
aded
Slid
e 19
*$/m
2 as
sum
es 2
5% e
ffici
ency

Non
-Mod
ule
Sol
ar P
V In
stal
latio
n (B
oS) C
osts
‘Inst
alla
tion’
labo
r:•
Nea
rly 7
5% o
f lab
or h
ours
ski
lled
•E
lect
ricia
n w
age
prem
ium
•G
rid c
onne
ct, w
iring
, pow
er, o
ther
ele
ctro
nics
‘O&
M’ c
osts
: rel
iabi
lity
$0.2
4/ W
$0.0
9/ W
•In
verte
r rel
iabi
lity,
repa
ir co
sts
•S
yste
m m
onito
ring
and
prev
enta
tive
mai
nten
ance
‘Indi
rect
Pro
ject
Cos
ts’v
ary:
$0.2
5/ W
$0.4
1/ W
Indi
rect
Pro
ject
Cos
tsva
ry:
•E
nviro
nmen
tal r
evie
w: $
100K
, up
to $
1 M
M a
nd 2
yea
rs
•La
nd p
rep.
: <$0
.10/
Wp,
dep
endi
ng o
n
$0.0
6/ W
$0.1
4/ W
$0.2
3/ W
•G
lass
mod
ule
inst
alla
tion
cost
s bu
rden
ed b
y di
sagg
rega
te s
yste
ms
(num
ber o
f
site
sel
ectio
n
•Tr
ansm
issi
on in
terc
onne
ct:
$1.0
-$1.
5 M
M, u
p to
$80
MM
(pro
hibi
tive)
U.S
. Dep
artm
ent o
f Ene
rgy
Sol
ar E
nerg
y Te
chno
logi
es P
rogr
am
ggg
y(
com
pone
nts)
•In
tegr
ate
com
pone
nts
at fa
ctor
y?
Slid
e 20

Util
ity S
cale
Sol
ar P
V:
Non
Mod
ule
Cos
ts
$0.0
9/ W
$0.4
1/ W
$0.0
9/ W
$0.0
6/ W
$0.1
4/ W
$0.2
3/ W
$0.1
3/ W
$0.1
1/ W
$0.0
3/ W
$0.2
8/ W
$0.2
5/ W
$0.2
4/ W
$0.2
5/ W
$0.2
4/ W
$0.0
5/ W
$0.0
8/ W
$0.0
8/ W
$0.0
9/ W
$0.0
2/ W
$0.1
5/ W
$0.0
3/ W
Rel
ativ
e to
the
25%
mod
ule
effic
ienc
y sc
enar
io, t
he $
0.50
/Wp
syst
em m
ust:
•R
educ
efix
edpo
wer
cost
s(In
verte
r,O
&M
)by
66%
U.S
. Dep
artm
ent o
f Ene
rgy
Sol
ar E
nerg
y Te
chno
logi
es P
rogr
am
Red
uce
fixed
pow
erco
sts
(Inve
rter,
O&
M)b
y66
%•
Trim
(sho
rt, lo
ng) w
iring
cos
ts (c
onte
nt) a
nd in
stal
latio
n by
50%
•D
ecre
ase
rack
ing
hard
war
e, B
oSco
mpo
nent
s by
33%
Slid
e 21

Non
Mod
ule
Cos
t-Sen
sitiv
ity to
E
ffici
ency
2010
144%
Sid
l20
10: 1
4.4%
c-Si
mod
ule
Optim
istic
c-Si
mod
ule
(pra
ctica
l effi
cienc
y lim
it*)
er
Non-
Modu
le Co
sts G
oal:
$0.50
/ Wp
*“P
ract
ical
lim
it”;
silic
on, o
ne s
un,
high
vol
ume
man
ufac
turin
gav
erag
e.
BOS/Inverte
•M
odul
eef
ficie
ncy
alon
eis
nota
dequ
ate
toac
hiev
egr
idpa
rity
(non
mod
ule
cost
s
aver
age.
U.S
. Dep
artm
ent o
f Ene
rgy
Sol
ar E
nerg
y Te
chno
logi
es P
rogr
am
•M
odul
eef
ficie
ncy
alon
eis
nota
dequ
ate
toac
hiev
egr
idpa
rity
(non
-mod
ule
cost
sex
ceed
$/W
at p
ract
ical
lim
it; 2
5%)
Slid
e 22

Sol
ar P
V E
nerg
y C
osts
:C
urre
nt a
nd P
roje
cted
, Lea
ding
Tec
hnol
ogie
s
2010
2015
US
Who
lesa
le E
lect
ricity
Pric
e
(US
Nat
iona
l Ave
rage
: 5.7
2)$/W
Goa
l(4
.5 ce
nts/k
Wh)
U.S
. Dep
artm
ent o
f Ene
rgy
Sol
ar E
nerg
y Te
chno
logi
es P
rogr
am
•U
nsub
sidi
zed
Sol
ar P
V e
nerg
y co
sts
will
rem
ain
>50%
hig
her t
han
US
who
lesa
le a
vera
ge (o
ptim
al s
olar
reso
urce
s)
Slid
e 23

Sum
mar
y
•H
isto
ry o
f mod
ule
cost
redu
ctio
n m
ay n
ot c
ontin
ue to
be
extra
pola
ted
•C
ost t
arge
t for
bro
ad (u
nsub
sidi
zed)
US
ado
ptio
n lik
ely
requ
ires
revo
lutio
nary
tech
nica
l inn
ovat
ions
Md
lt
df
•M
odul
e co
st a
nd p
erfo
rman
ce
•P
ower
ele
ctro
nics
effi
cien
cy a
nd re
liabi
lity
•B
oSin
stal
latio
nco
sts
•B
oS,i
nsta
llatio
nco
sts
•Fo
cus
on h
igh
cost
ele
ctric
ity m
arke
ts m
ay re
duce
the
ince
ntiv
e fo
r suc
h in
dust
rial i
nves
tmen
ts•
Suc
cess
in th
e U
S m
arke
t at $
1/W
will
ena
ble
US
co
mpa
nies
to le
ad in
oth
er re
gion
s of
the
wor
ld
U.S
. Dep
artm
ent o
f Ene
rgy
Sol
ar E
nerg
y Te
chno
logi
es P
rogr
amS
lide
24

Than
k Y
ou
Conta
ct Inf
orma
tion:
John
Lus
hets
kySo
lar E
nerg
y Tec
hnolo
gies
PM
Prog
ram
Mana
ger
U.S.
Dep
artm
ent o
f Ene
rgy
:Em
ail:
john
.lush
etsk
y@ee
.doe
.gov
Phon
e: 20
2-28
7-16
85on
the w
eb:
www.
solar
.ener
gy.g
ov
U.S
. Dep
artm
ent o
f Ene
rgy
Sol
ar E
nerg
y Te
chno
logi
es P
rogr
amS
lide
25S
lide
25