solar city master plan of faridabad
TRANSCRIPT

Final Report
Project Code 2008RT13
MMaasstteerr ppllaann ttoo ddeevveelloopp
FFaarriiddaabbaadd aass aa ““SSoollaarr CCiittyy””
Prepared for
Municipal Corporation, Faridabad, Haryana

Master plan to develop Faridabad as a “Solar City”
ii
© The Energy and Resources Institute 2012
Suggested format for citation
T E R I. 2012
Master plan to develop Faridabad as a “Solar City”
New Delhi: The Energy and Resources Institute. 318pp.
[Project Report No.2008RT13]
For more information
Project Monitoring Cell
T E R I Tel. 2468 2100 or 2468 2111
Darbari Seth Block E-mail [email protected]
IHC Complex, Lodhi Road Fax 2468 2144 or 2468 2145
New Delhi – 110 003 Web www.teriin.org
India India +91 • Delhi (0)11

Master plan to develop Faridabad as a “Solar City”
iii
Contents
ACKNOWLEDGEMENTS ................................................................................................................. 1
PROJECT TEAM ............................................................................................................................... 3
EXECUTIVE SUMMARY ................................................................................................................... 5
Master Plan .............................................................................................................................. 6
Capacity building and awareness generation .................................................................... 9
1. INTRODUCTION ..................................................................................................................... 11
Methodology ......................................................................................................................... 12
2. REVIEW OF GLOBAL „SOLAR CITY‟ PROJECTS ..................................................................... 15
Introduction ........................................................................................................................... 15
Institutions involved on Solar Cities .................................................................................. 15
Programme on solar cities ................................................................................................... 18
Case studies ........................................................................................................................... 19
3. NATIONAL AND INTERNATIONAL PRACTICES ................................................................... 27
Energy conservation in buildings ...................................................................................... 27
Policy review ......................................................................................................................... 38
4. ENERGY BASELINE OF FARIDABAD ...................................................................................... 47
5. ENERGY PLANNING OF FARIDABAD .................................................................................... 77
Projected population ............................................................................................................ 77
Energy demand forecast up to 2018 ................................................................................... 80
Renewable energy resource availability ............................................................................ 89
Energy efficiency: Options for energy savings and demand reduction ....................... 94
Supply side options based on renewables ...................................................................... 110
6. ACTION PLAN....................................................................................................................... 133
Implementation plan .......................................................................................................... 134
Budget estimation for Solar City initiative ..................................................................... 137
ANNEXURE 1 ELECTRICITY CONSUMPTION DATA IN FARIDABAD ...................................... 143
ANNEXURE 2 TECHNICAL DETAILS OF STREET LIGHTING IN FARIDABAD .......................... 149
ANNEXURE 3 TECHNICAL DETAILS OF MUNICIPAL WATER PUMPING IN FARIDABAD ....... 157
ANNEXURE 4 „TREND ANALYSIS‟ - METHODOLOGY ADOPTED FOR PROJECTION .............. 215
ANNEXURE 5 DETAILS OF EXISTING RENEWABLE ENERGY PROJECT IN FARIDABAD ......... 217
ANNEXURE 6 ENERGY EFFICIENT SCHEMES OF BEE AND BSES ........................................... 219
ANNEXURE 7 ENERGY EFFICIENCY MEASURES FOR AIR CONDITIONING ............................. 223
ANNEXURE 8 LIST OF ENERGY SERVICE COMPANIES (ESCO) AND BIS APPROVED
MANUFACTURER OF SOLAR WATER HEATERS .................................................................. 227
ANNEXURE 9 TECHNICAL SPECIFICATIONS OF SOLAR LIGHTING SYSTEMS ........................ 231

Master plan to develop Faridabad as a “Solar City”
iv
ANNEXURE 10 ASTRONOMICAL TIMER SWITCH FOR STREET LIGHTING ............................. 237
ANNEXURE 11 ANALYSIS FOR LED BASED STREET LIGHTING ............................................. 239
ANNEXURE 12 TECHNICAL SPECIFICATIONS OF ENERGY EFFICIENT LIGHTING .................. 243
ANNEXURE 13 TECHNICAL SPECIFICATIONS AND ANALYSIS OF INDUCTION LAMPS ........ 255
ANNEXURE 14 HARYANA STATE SUBSIDY SCHEME FOR DOMESTIC SOLAR WATER HEATING
SYSTEM ................................................................................................................................. 261
ANNEXURE 15 LIST OF IDENTIFIED GOVERNMENT BUILDINGS FOR INSTALLATION OF RE
SYSTEMS ............................................................................................................................... 265
ANNEXURE 16 TECHNICAL SPECIFICATIONS OF SOLAR WATER SOLAR WATER HEATING
SYSTEMS ............................................................................................................................... 267
ANNEXURE 17 PROGRAM ON OFF-GRID AND DECENTRALISED SOLAR APPLICATIONS ... 277
ANNEXURE 18 RETSCREEN WORKSHEETS FOR SPV BASED POWER GENERATION ........... 301
ANNEXURE 19 SINGLE LINE DIAGRAM OF A SOLAR PHOTOVOLTAIC POWER PLANT ......... 305
ANNEXURE 20 TECHNICAL SPECIFICATIONS OF SOLAR HYBRID INVERTER ........................ 307
ANNEXURE 21 BUDGET ESTIMATES FOR IMPLEMENTATION OF DIFFERENT ACTIVITIES TO
MAKE FARIDABAD AS A SOLAR CITY ................................................................................ 309

Master plan to develop Faridabad as a “Solar City”
v
List of Tables
Table E1 Targets for energy conservation generation and greenhouse gas emission reduction ........................................................................................................................................................ 6
Table 2.1 Checklist of parameters and initiatives taken up ......................................................... 25
Table 3.1 Suggested energy efficiency measures for commercial buildings ............................. 31
Table 3.2 Alternative technologies to improve energy efficiency of HVAC systems .............. 34
Table 3.3 Potential technologies for water heating ....................................................................... 37
Table 4.1 Meteorological Parameters of Faridabad ...................................................................... 49
Table 4.2 Changing land use structure in the city ........................................................................ 51
Table 4.3 Sub-stations in Faridabad Circle..................................................................................... 52
Table 4.4 Types of street lights used in Faridabad ....................................................................... 70
Table 4.5 Water supply system of Faridabad ................................................................................ 72
Table 4.6 Water demand pattern of Faridabad ............................................................................. 72
Table 4.7 Location and capacity of GLSRs in Faridabad.............................................................. 73
Table 4.8 Details of sewerage system of Faridabad ...................................................................... 74
Table 5.1 Daily and monthly pattern of solar radiation over Faridabad ................................... 93
Table 5.2 Wind speed over Faridabad (10m) ................................................................................. 94
Table 5.3 List of lamps in street lights installed by MCF in Faridabad (till March 31, 2011) 101
Table 5.4 Lighting design requirement as per Indian standard................................................ 103
Table 5.5 LED based Solar powered energy efficient street lighting project identified for implementation under the solar city project ....................................................................... 107
Table 5.6 Microprocessor controller based energy efficient street lighting project identified for implementation under the solar city project ................................................................. 108
Table 5.7 Summary of electricity consumption in BAU scenario and solar city scenario ..... 109
Table 5.8 Performance of proposed Roof Top SPV systems in Faridabad .............................. 122
Table 5.9 Performance of proposed 5MWp SPV systems in Faridabad .................................. 123
Table 5.10 Details of Identified solar PV plant and solar hybrid inverters for promotion of rooftop SPV projects under solar city program .................................................................. 125
Table 5.11 Overall scenario of Faridabad as solar city ............................................................... 130
Table 6.1 Targets for energy conservation generation and greenhouse gas emission reduction ................................................................................................................................... 133
Table 6.2 Budget estimated for implementation of different activities for making Faridabad as a Solar City ........................................................................................................................... 137
Table 6.3 Cost estimated for pilot renewable energy and energy efficiency projects to be implemented under Faridabad Solar City action plan by year 2012. .............................. 142


Master plan to develop Faridabad as a “Solar City”
vii
List of Figures
Figure 4.1(a) Map of Faridabad District ......................................................................................... 47
Figure 4.1(b) City Map of Faridabad .............................................................................................. 48
Figure 4.2(a) Population growths in Faridabad from 1961 to 2001............................................. 50
Figure 4.2(b) Population density in Faridabad from 1961 to 2001 .............................................. 50
Figure 4.3 Land use pattern of Faridabad ...................................................................................... 52
Figure 4.4 Grid Map of Faridabad ................................................................................................... 53
Figure 4.5 Per capita electricity consumption at Faridabad ........................................................ 54
Figure 4.6 Sector-wise annual electricity consumption in NIT at Faridabad ............................ 55
Figure 4.7 Sector-wise annual electricity consumption in Ballabhghar at Faridabad .............. 55
Figure 4.8 Sector-wise annual electricity consumption in Old Faridabad ................................. 56
Figure 4.9 Sectoral Electricity use pattern of NIT in 2010-2011 ................................................... 56
Figure 4.10 Sectoral Electricity use pattern of Ballabhghar in 2010-2011 ................................... 57
Figure 4.11 Sectoral Electricity use pattern of Old Faridabad in 2010-2011 .............................. 57
Figure 4.12 Annual electricity consumption in NIT (LU) ............................................................ 58
Figure 4.13 Annual electricity consumption in Ballabhghar (LU) .............................................. 58
Figure 4.14 Annual electricity consumption in Old Faridabad (LU) .......................................... 59
Figure 4.15 House type pattern of Faridabad ................................................................................ 59
Figure 4.16 Distributions of households by number of dwelling rooms ................................... 60
Figure 4.17 Distribution of households by family sizes ............................................................... 61
Figure 4.18 Distribution of households by source of lighting ..................................................... 61
Figure 4.19 Total electricity consumption in the domestic sector of Faridabad ....................... 62
Figure 4.20 Electricity consumption pattern of domestic sectors in Faridabad ........................ 62
Figure 4.21 Electricity consumption pattern in residential sector .............................................. 63
Figure 4.22 Electricity consumption pattern in different types of households ........................ 63
Figure 4.23 Fuel type use pattern for cooking in residential sector ............................................ 64
Figure 4.24 Per Capita electricity consumption in commercial sector ....................................... 65
Figure 4.25 Electricity consumption in commercial sector of Faridabad in NIT, Old Faridabad and Ballabhgarh zones ........................................................................................... 66
Figure 4.26 Annual total electricity consumption in commercial sector of Faridabad ............ 66
Figure 4.27 Growth pattern on the Industrial Sector of Faridabad ............................................ 67
Figure 4.28 Electricity consumption in Industrial Sector in NIT, Old Faridabad and
Ballabhgarh Zones of Faridabad city ...................................................................................... 68

Master plan to develop Faridabad as a “Solar City”
viii
Figure 4.29 Annual total electricity consumption in Industrial Sector of Faridabad city ....... 68
Figure 4.30 Electricity consumption in Municipal Sector in NIT, Old Faridabad and Ballabhgarh zones of Faridabad City ..................................................................................... 69
Figure 4.31 Annual total electricity consumption in Municipal Service Sector of Faridabad
City .............................................................................................................................................. 69
Figure 4.32 Street lights in Faridabad ............................................................................................. 70
Figure 4.33 Types of street lights in Faridabad .............................................................................. 71
Figure 4.34 GHG emissions based on electricity and LPG consumption of Faridabad ........... 75
Figure 4.35 Sector wise GHG emissions of Faridabad .................................................................. 75
Figure 5.1 Population projection of Faridabad using various methods ..................................... 78
Figure 5.2 Population growth trends in Faridabad from 1961 to 2021 ....................................... 79
Figure 5.3 Per capita income of Haryana ....................................................................................... 80
Figure 5.4 Per capita electricity consumption in Haryana ........................................................... 81
Figure 5.5 Annual electricity consumption (in LU) of Faridabad ............................................... 82
Figure 5.6 Total electricity consumption in the residential sector up to 2018 ........................... 82
Figure 5.7 LPG Consumption scenario of Faridabad city ............................................................ 83
Figure 5.8 Total Annual Electricity consumption in commercial sector (LU) ........................... 84
Figure 5.9 Electricity consumption in Industrial sector of Faridabad ........................................ 85
Figure 5.10 Annual Electricity consumption of street lighting in Faridabad ............................ 86
Figure 5.11 Annual Electricity consumption of water pumping in Faridabad ......................... 86
Figure 5.12 Annual Electricity consumption in municipal sector of Faridabad ....................... 87
Figure 5.13 Annual Electricity consumption in various sectors of Faridabad .......................... 87
Figure 5.14 Fuel wise GHG emissions projection for Faridabad ................................................ 88
Figure 5.15 Sector wise GHG emissions projection for Faridabad ............................................. 88
Figure 5.16 MSW (tonnes/day) generation in Faridabad ............................................................ 90
Figure 5.17 Solar Radiation pattern of Faridabad ......................................................................... 92
Figure 5.18 Sun path diagram of Faridabad (ECOTECH) ........................................................... 93
Figure 5.19 Pattern of ambient temperature and Relative Humidity in Faridabad ................. 95
Figure 5.20 Business as usual (BAU) and solar city (SC) scenario of residential sector .......... 96
Figure 5.21 BAU and Solar city scenarios for commercial sector ................................................ 98
Figure 5.22 BAU and Solar city scenarios for Industrial sector ................................................. 101
Figure 5.23 A typical fixture along with the lamp and ballast specifications ......................... 103
Figure 5.24 Distribution of lighting levels for a typical streetlight in Faridabad ................... 104
Figure 5.25 Polar distribution curve for a typical streetlight in Faridabad ............................. 104
Figure 5.26 Distribution of lighting levels of recommended streetlight in Faridabad........... 105

Master plan to develop Faridabad as a “Solar City”
ix
Figure 5.27 Schematic process diagram and MSW power Plant ............................................... 111
Figure 5.28 Solar water heating systems in residential and commercial sectors .................... 113
Figure 5.29 Solar water heating options under BAU and solar city scenarios ........................ 116
Figure 5.30 Schematic of a roof top grid connected solar PV system ....................................... 118
Figure 5.31 (a, b, c) Satellite view of few potential sectors in Faridabad for roof top SPV ... 120
Figure 5.32 Performance of Roof top SPV Systems in Faridabad estimated through
RETScreen Software ................................................................................................................ 120
Figure 5.33 Total area required for setting up 2 MWp SPV power plant ................................ 121
Figure 5.34 Electricity generation pattern of roof top SPV in Faridabad ................................. 122
Figure 5.35 Implementation strategy of 5 MWp SPV power plant(s) in Faridabad ............... 124
Figure 5.36 Energy generation/saving in Faridabad under solar city scenario ..................... 129
Figure 5.37 Overall scenario of Faridabad as solar city .............................................................. 130


1
AAcckknnoowwlleeddggeemmeennttss
The project team gratefully acknowledges the financial support received from Municipal
Corporation Faridabad that made it possible to carry out this exercise. In particular, the valuable guidance and support received from Mr. D Suresh (IAS), Municipal Commissioner,
Faridabad, is gratefully acknowledged.
TERI team is thankful to Mr. Harcharan Singh, Executive Engineer, Municipal Corporation Faridabad to give full support and interest during the study. The inputs given by Mr P. C.
Sharma, Project Officer, DRDA are also appreciated. TERI team is also thankful to HAREDA
officials for their continuous interest and support in the project.
The project team wishes to thank Ms Rita Grover and Ms Nirmal, TERI for their efficient
secretarial support.
The project team also gratefully acknowledges constant encouragement and support received from Dr R K Pachauri, Director General, TERI.


3
PPrroojjeecctt TTeeaamm
Team members Dr. Ishan Purohit
Lokesh Jain
Rana Pratap Poddar
Alok Kumar Jindal
Ankit Narula
Project advisor Amit Kumar
Shirish Garud
Pradeep Kumar

5
EExxeeccuuttiivvee ssuummmmaarryy
Haryana has been a power deficit state for several years. With installed generation capacity
of 59261 MW, the power shortage ranges between 300–500 MW in off-peak hours and between 750–850–MW in peak hours resulting in a peak deficit of about 14–15percent.
Today, some of the critical issues facing Haryana's power sector include rising electricity
demand coupled with persistent shortages; low-cost recovery through tariffs; rising government subsidies for supply of power; and limited capacity of service providers. The
state is also grappling with the twin challenges of serving a growing and commercially
vibrant urban and industrial customer base while also revitalizing the rural economy.
On the basis of last three year‟s data the electricity has been projected over the period till
2018 for Faridabad city. The industrial sector consumes approximately 52 per cent of the
total electricity supply followed by residential sector; which consumes 28 per cent and so on.
In case of Faridabad, as per Dakshin Haryana Bijli Vitran Nigam (DHBVN), Faridabad, per
capita electricity consumption has been reported as 1162 kWh in 2006–07. On the basis of
time series based data of last seven years it is estimated that the per capita electricity consumption will be increased to 1148 kWh in 2012 (short term); 1532 kWh by 2015
(medium term); and by 2018 (long term) it could be 1996 kWh.
The total electricity consumption in the Faridabad City has been reported as 18865 Lakh units (LU) during 2008 in the city. It has been estimated that the total electricity consumption
of the city will increase to 27702 LU in 2012; 34446 LU by 2015 and by 2018 it will reach
41191 LU. Taking in to account the exponentially increasing energy demand, it became obvious to Faridabad that this trend is not sustainable in the long run. It is felt that measures
such as reducing energy demands and switching from fossil fuel to renewable energy
technologies would go a long way in addressing these concerns.
As has been the case with the wide-scale introduction of renewable energy technologies for a
variety of applications in the country; Ministry of New and Renewable Energy (MNRE),
Government of India took initiative to develop Faridabad city as a solar city. The Municipal Corporation, Faridabad (MCF) had been given the mandate to prepare the plan to achieve
this objective. In essence, the Solar City programme strives to integrate:
Energy conservation measures to reduce the energy demand, and
Utilization of locally available renewable energy resources such as solar energy to
meet these reduced energy demands
This Master Plan for Solar City is a dynamic document meant to change with time, experience, and need. The development of master plan has benefited from the active
participation of Municipal Corporation Faridabad, Public Works Department, Faridabad
Administration, Municipal Water Supply Department, Forest Department, power utilities, Haryana Urban Development Authority (HUDA), Dakshin Haryana Bijli Vitran Nigam
(DHBVN), Faridabad; and other agencies with energy-related responsibilities.
The whole exercise of developing a Master Plan for making Faridabad a solar city has been a collaborative endeavour along with all the major stakeholders in the city. Developing the
city as a solar city requires an integrated urban planning approach, which simultaneously
involves reducing reliance on fossil fuels by the application of energy conservation and
1 http://www.cea.nic.in/reports/planning/power_scenario.pdf
Master plan to develop Faridabad as a “Solar City”
6
efficiency measures and by replacing/complementing the conventional energy generation
with the renewable energy. As per the MNRE scheme, this exercise did not include the transportation sectors as there are very few renewable energy technologies for
transportation. The key components of the study comprised
Base line determination – using available secondary data and surveys,
Energy planning
- Energy use projections
- Energy efficiency measures and audit
- Utilization of available renewable energy sources and
Developing a Master Plan
The Master Plan has been developed on the basis of different energy saving and renewable
energy options, along with those technological options that are feasible in long term only.
Master Plan
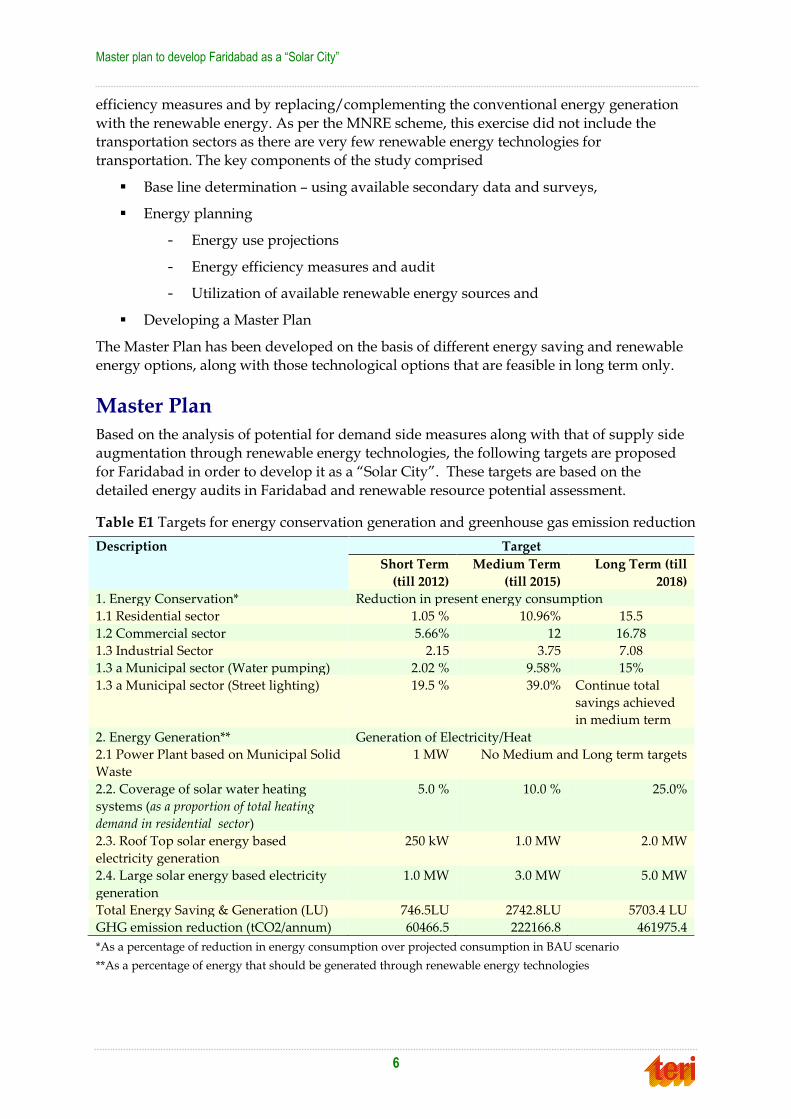
Based on the analysis of potential for demand side measures along with that of supply side augmentation through renewable energy technologies, the following targets are proposed
for Faridabad in order to develop it as a “Solar City”. These targets are based on the
detailed energy audits in Faridabad and renewable resource potential assessment.
Table E1 Targets for energy conservation generation and greenhouse gas emission reduction
Description Target
Short Term
(till 2012)
Medium Term
(till 2015)
Long Term (till
2018)
1. Energy Conservation* Reduction in present energy consumption
1.1 Residential sector 1.05 % 10.96% 15.5
1.2 Commercial sector 5.66% 12 16.78
1.3 Industrial Sector 2.15 3.75 7.08
1.3 a Municipal sector (Water pumping) 2.02 % 9.58% 15%
1.3 a Municipal sector (Street lighting) 19.5 % 39.0% Continue total
savings achieved
in medium term
2. Energy Generation** Generation of Electricity/Heat
2.1 Power Plant based on Municipal Solid
Waste
1 MW No Medium and Long term targets
2.2. Coverage of solar water heating
systems (as a proportion of total heating
demand in residential sector)
5.0 % 10.0 % 25.0%
2.3. Roof Top solar energy based
electricity generation
250 kW 1.0 MW 2.0 MW
2.4. Large solar energy based electricity
generation
1.0 MW 3.0 MW 5.0 MW
Total Energy Saving & Generation (LU) 746.5LU 2742.8LU 5703.4 LU
GHG emission reduction (tCO2/annum) 60466.5 222166.8 461975.4
*As a percentage of reduction in energy consumption over projected consumption in BAU scenario
**As a percentage of energy that should be generated through renewable energy technologies

Executive summary
7
The short-term targets for energy conservation are based on the energy conservation options
identified in the energy audit. To achieve the medium and long-term targets the key implementation points of the proposed Master Plan to make Faridabad a Solar City is
summarized below:
Implementation plan
A “Solar City Cell” may be established within Municipal Corporation Faridabad.
The Solar City Cell will Comprise of a) One Project Officer who will take overall
responsibility of the solar city cell functioning i.e. preparing the proposals and plans for the implementation of the measures and activities suggested in Solar City master
plan, implementation of the activities and the monitoring of the projects
implemented under the solar city plan b) Two technical officers who will help the Project officer by preparing the proposals and plans to be implemented under solar
city
For implementation of Solar City project, an empowered committee may be set up to provide overall guidance under the chairmanship of the Municipal Commissioner.
The Solar City Cell may take advantage of programmes like Jawaharlal Nehru
National Urban Renewal Mission (JNNURM) and recently announced Jawaharlal Nehru National Solar Mission (JNNSM) under the National Action Plan of Climate
Change (NAPCC) for implementation of the master plan.
The Solar City Cell may also seek for financial support (for energy consultancy as well as incremental cost of building construction for a few buildings) from Bureau of
Energy Efficiency (BEE) to design a few pilot energy efficient buildings in the city, in
accordance with Energy Conservation Building Code (ECBC). The possibility of availing incentives provided by the central government for Green Rating for
Integrated Habitat Assessment (GRIHA) rated buildings may also be explored.
The Solar City Cell may work proactively:
- To get ECBC notified immediately
- To ensure that the building bye-laws are changed in accordance with it
- To ensure that all upcoming non-residential buildings are brought under the ambit of ECBC and incorporate the relevant green buildings elements.
- To ensure that the major new public buildings and commercial complexes
including those for ITES services are „GRIHA‟ rated.
The Municipal Corporation Faridabad may join hands with the Dakshin Haryana
Bijli Vitran Nigam to distribute the quality CFLs to its consumers at concessional
prices or on easy payment terms.
- For instance, in Delhi, BSES is promoting CFLs through “Buy One Get 1 Free
CFL Offer”. There is no restriction on the number of CFL bulbs a customer
can buy.
Municipal Corporation, Faridabad may initiate a dialogue with the power utility for
introducing rebate on electricity tariff for the domestic consumers, which employ
solar devices.
To begin with, the energy conservation measures in the municipal services may be
taken up immediately.
Master plan to develop Faridabad as a “Solar City”
8
At least 20% of the energy needed for water heating in the residential and
commercial buildings may be required to come from solar energy, by 2012.
Utilizing central government schemes, MCF may initiate installation of solar-based
LED traffic lights, solar street lights, building integrated solar PV, and other relevant
solar products on a priority basis.
MCF may mount a focused and sustained campaign on “Solar City” covering all
media resources - including print, radio, and television.
In order to showcase Faridabad City as a Solar City, the following may be taken up on priority.
- Urja Park: Energy– cum–Science Park may be established in a central location
in Faridabad as an inviting place for social gatherings and to provide public education about issues of sustainable energy in a friendly, non-technical
atmosphere.
- Urja Bhawan: MCF office and Solar City Cell may be housed in a new building, constructed in accordance with ECBC and other efficient/green
building concepts.
The following projects may be taken up through public-private partnership:
- Setting up solar powered, LED Display Boards at the strategic locations in the
City. These boards would not only display the fact that Faridabad is a `Solar
City‟ but also display pollution levels, temperatures updates, and messages useful to general public.
- Provision of solar powered lights and fountains in the prominent public
gardens and parks (like Town Park of the city, MCF campus etc.) in the city.
Prominent office complexes may also have solar powered displays as well as battery
operated vehicles for intra-complex transportation.
MCF along with HAREDA and power utilities may begin engaging the public through sustained awareness campaigns about the benefits of energy conservation
and renewable energy; including local elected representatives and school children.
In Delhi, BSES has been educating its consumers about the need to conserve power though
Synergy – its bi-monthly, bi-lingual newsletter, newspaper inserts, and pamphlets distributed
at meals from time to time.
Likewise, NDPL has launched Energy Conservation campaign in Schools.
MCF along with HAREDA may start organizing a series of training programme on
`Green buildings‟ for the planners; architects; electrical, Heating Ventilation and Air
Conditioning (HVAC), and lighting consultants; and engineers involved in the
building sector.
MCF, in close cooperation with the BEE and HAREDA, may initiate creation of
accredited certifiers who can then be engaged by the house owners/builders/developers for obtaining the energy conservation compliance
certificates.
MCF may initiate public-private partnership (e.g. working closely with the associations of the local traders and manufacturers) to propagate energy efficient
appliances, which include ‟Energy Star‟ appliances.
Executive summary
9
Under Solar City endeavour, one of the key action points could be to replace traffic
signals having incandescent lamps with those with energy saving LEDs, along with solar controllers. Similarly, CFL based streetlights; lights in the parks, gardens, and
roundabouts may be replaced with solar lights.
To encourage adoption of energy conservation, energy efficient equipment/appliances, as well as renewable energy systems; MCF may introduce
specific, time-bound financial incentives for Faridabad.
Towards this, the route of Energy Services Company (ESCOs) may also be explored.
MCF may assist Engineering and other concerned departments in accessing capital
for energy conservation and efficiency projects at favourable terms. For this purpose,
State Energy Conservation Fund, as prescribed by EC Act 2001, may be accessed.
The industrial sector is also one of the major energy consuming sectors. MCF may
enhance the present scheme for promoting energy audits in the industrial sector.
Further MCF may undertake awareness campaign in industries in Faridabad for energy conservation. This can be undertaken in partnership with the local industry
association and HAREDA.
Capacity building and awareness generation
In order to inculcate energy conservation techniques in the common architecture. It is
essential that all the practitioners be properly trained in energy-efficient or “Green”
architecture. MCF in association with HAREDA may, therefore, organize a series of training programme for the planners; architects; electrical, HVAC, and lighting
consultants; and engineers involved in the building sector, These courses, tailor-
made to suit different levels, would have to be imparted to all the professionals, in public as well as in private sector – on a regular basis.
Suitable training modules, including the regular updates, may have to be developed
and delivered for
- accreditation of professionals for building certification and
- for the quality improvement of the accredited certifiers.
Of particular importance is the training for front-line workers and technicians regarding energy conservation and efficiency, this would not only ensure successful
implementation of such measures but also their sustainability and replication.
Specific training programmes are required for those in the supervisory role, for effective monitoring of energy demand, enabling them to take preventive/corrective
actions in time.
The public awareness and education being central to successful changeover to solar city, it is imperative for MCF to engage the public through sustained awareness
campaigns and communicate the benefits of energy conservation and renewable
energy to different user-groups; including local elected representatives.
MCF along with HAREDA may mount a focused and sustained campaign on “Solar
City” and its features encompassing all media resources - including print, radio, and
television. Apart from specific recommendations, such campaigns must inform public about the places from energy efficient/renewable energy devices and services
can be procured.

Master plan to develop Faridabad as a “Solar City”
10
A key component of the awareness creation campaign would be to capture school
children‟s attention towards energy-efficiency and clean future. Thus, the campaign for the school children will include the following elements:
- Inter-school essay and drawing competitions
- Inter-school quizzes
- Workshops and seminars
- Exhibitions and demonstrations
- Field trips
The information propagation can be achieved in a way that power utilities have taken up, by
putting advertisements and information on back of the monthly bills that were sent to the
consumers. In the same way, mount a public campaign on energy conservation utilizing through regular communication could be a way.

11
11.. IInnttrroodduuccttiioonn
Climate change and fossil fuel depletion are the two major concerns of the current
millennium that threaten our ability to survive on this planet. The fundamental problems pertain to an excessive dependence on fossil fuels to meet increasingly, energy-intensive life
styles. There is a large difference in „energy consumption‟ between the urban and rural area.
Indeed, the urbanization coupled with the rising income levels leads to higher energy requirements. It has been observed that the household energy accounts for about half of
India's total energy consumption. It is seen that every year there is an increase of 20-30% in
energy requirement in the residential sector and 10-15% increase in commercial sector. This has led to a situation where there are both, energy as well as peak deficits.
Haryana was the first state in India to achieve 100 per cent rural electrification way back in
the year 1970. By 31 December 2010, the state had the installed capacity to generate 5926.94
MW1 Energy is mainly generated from thermal power. Out of the total installed capacity
4377.20 MW is by thermal power plants, 70.10 MW from hydel2 power plants.
The state accounts for 78 percent consumption of power and its per capita consumption of electricity is 660 kWh, which is higher than the average national consumption. In order to
meet increasing energy needs, the state government is encouraging investments from the
private sector for capacity generation, improvement in operational efficiency and extension of distribution network. Recently Haryana Power Generation Corporation Ltd (HPGCL) has
signed contracts for several independent power projects (IPPs). Jindal Power and Weizen
Pvt Ltd will set up gas based plants having 1,000 MW and 600 MW capacities, respectively. The state has also signed up a long-term power purchase agreement with North Eastern
Electric Power Corporation.
As per Dakshin Haryana Bijli Vitran Nigam (DHBVN) Faridabad, the maximum electricity
demand of the city has been reported as 1851 MW; which is pre-dominantly by the
industrial sector (around 55 %) followed by the residential sector (around 28 %). The total
electricity consumption has been reported as 18865 Lacs units (LU) during 2008 in the city. On the basis of past three recent year‟s data it has been estimated that the total electricity
consumption of the city will increase to 41191 LU by 2018. Faridabad city had small
electricity generating capacityfrom the power plant based on fossil fuels (coal) and had very small PLF and Faridabad administration is planning to shift/close these units.
In addition the transmission and distribution losses have been reported more than 20 % by
DHBVN, Faridabad.
However, it is obvious that this trend is not sustainable in the long run. Therefore, measures
such as reducing energy demands and switching from fossil fuel to renewable energy
technologies to complement the conventional energy sources have become imperative.
Ministry of New and Renewable Energy, Government of India took the initiative to develop
60 cities of India as solar city. MCF has been given the mandate to prepare and implement
the plan to achieve this objective for Faridabad.
This Master Plan for Solar City is a dynamic document meant to change with time,
experience, and need. The development of master plan has benefited from the active
participation of Municipal Corporation Faridabad, Public Works Department, Municipal
1 http://www.cea.nic.in/reports/planning/power_scenario.pdf 2 http://mospi.nic.in/mospi_new/upload/energy_stats_2011.pdf
Master plan to develop Faridabad as a “Solar City”
12
Water Supply Department, Haryana Urban Development Authority (HUDA), Forest
Department, power utilities, Dakshin Haryana Bijli Vitran Nigam (DHBVN); and other agencies with energy-related responsibilities.
The philosophy behind Master Plan is to ensure that Faridabad‟s energy demands are met in
affordable, technologically advanced, and environmental friendly manner. It means that after cost-effective efficiency and demand response, the city relies on renewable sources of
power and distributed generation, to the extent possible.
Methodology
The whole exercise of developing a Master Plan for making Faridabad a solar city has been a
collaborative endeavour of TERI and MCF, along with all the other major stakeholders in the
city. Developing the city, as a solar city requires an integrated urban planning approach, which simultaneously involves reducing reliance on fossil fuels by the application of energy
conservation and efficiency measures and by replacing/complementing the conventional
energy generation with the renewable energy. As decided in the beginning, this exercise did not include the industrial and transportation sectors. The key components of the study
comprised;
Baseline determination
Energy planning including renewable energy resource assessment, and
Developing a Master Plan
Baseline determination
In this initial phase, all the information was collected to prepare the energy base line for
Faridabad.
General information on infrastructure, population and its distribution, household income, education, employment
Energy demand – Data on sectoral energy demand in residential, commercial,
municipal services, and industrial sectors
For the residential sector detailed statistical review, interaction with various
government officials of Faridabad Administration, Municipal Corporation (viz.
Housing Board, City Planning Department etc.) was carried out to understand the demand in various sectors.
Energy audit has been carried out of the following municipal services
- Street lighting and
- Water pumping and sewerage
Resource assessment for solar, wind, biomass as well as municipal solid waste
Review of renewable energy and energy efficiency programs and policies
Energy planning
Using energy planning tools like RETScreen and LEAP softwares, different scenarios were
developed and analyzed in order to explore the opportunities of

1. Introduction
13
Reducing the demand based on energy conservation and energy efficiency measures
and
Meeting the energy requirements through renewable based systems.
This was followed by a techno-economic evaluation of various energy conservation and
renewable energy options; and finally, setting up targets for energy consumption and GHG emissions for the city.
The detailed optimization and analysis for energy conservation and GHG emission are given
in chapter 5 of this report.
Master Plan
The Master Plan has been developed on the basis of different energy saving and renewable
energy options, along with those technological options that are feasible in long term only.


15
22.. RReevviieeww ooff gglloobbaall „„SSoollaarr CCiittyy‟‟ pprroojjeeccttss
Introduction
A large proportion of the world's population lives in cities, towns and urban regions, in which three-quarters of the overall energy consumption occurs. Urbanization and economic
development are leading to a rapid rise in energy demand in urban areas. The urban areas
are heavily dependent on fossil fuels for the maintaining of essential public services, for powering homes, transport, infrastructure, industry and commerce etc. It is generally
recognised that a transformation of the present energy system is required in order to secure
the energy supply and to mitigate the risks of climate change. The transformation can be possible by a shift towards renewable energy systems (RES) and a more rational use of
energy (RUE). One of the ways/approach to achieve such a transformation might be to
convert more number of cities into Solar Cities.
Solar cities in a broader term include several initiatives, activities and technologies, which
includes renewable energy, energy efficiency, sustainable transport options, architectural
innovations etc. The term “Solar cities” defined by several initiatives such as International
Solar cities Initiatives and European Solar cities initiatives also include a "climate-
stabilization" aspect, whereby cities responsibly set per-capital targets for future
greenhouse-gas emissions at levels consistent with stabilizing future levels of
atmospheric carbon-dioxide and other greenhouse gases and also includes introduction of
greenhouse gas emissions reduction over long term time frame.
Institutions involved on Solar Cities
Several institutions working on solar cities are given below:
International Solar Cities Initiatives (ISCI)
European Solar cities Initiatives (ESCI)
Solar city Task force
International Solar Energy Society (ISES), European Solar cities Projects
European Green Cities Network
Energie Cites Association
ICLEI-Local Governments for Sustainability
Ministry of New and Renewable Energy (MNRE)
The following section discusses briefly about the initiatives and activities undertaken by
these institutions.
International Solar Cities Initiatives (ISCI)
International solar cities initiative is the group who had organized the first International
solar Cities Congress in Daegu, Korea in 2004.The primary focus of ISCI is to set up the target for introduction of renewable energy and reduction of greenhouse gas emissions on a
longer term.

Master plan to develop Faridabad as a “Solar City”
16
European Solar Cities Initiatives
The aim of the initiative is to support the European energy and climate policy by stimulating the interests of European "high performance" cities and surrounding regions (prospective
"Solar Cities"), the European research community and the European sustainable energy
industry.
The Initiative will mobilise a critical mass of participants to find efficient and rapid ways to
implement RES and RUE in European cities through research, development, demonstration
and information dissemination activities and through stakeholder participation (citizen and others). The goal is to speed up the transformation of the European cities into Solar Cities.
A working definition of a Solar City is a city that aims at reducing the level of greenhouse
gas emissions through a holistic strategy for the introduction of RES and RUE to a climate¬-stable and thus sustainable level in the year 2050.
The scientific and technical objectives are:
To better understand the energy needs of cities for different energy qualities and for different European regions,
To better understand the potential of different forms of RES for and for RUE in cities
in different European regions,
To identify or develop optimal strategies for rapid integration of RES and RUE in the
energy systems of cities for different regions in Europe,
To identify RES and RUE best suited for different categories of urban areas and different city surface uses,
To optimise the performance of RES and RUE for city applications,
To find ways of improving the adoption of RES and REU technology by small and
medium-sized enterprises (SMEs),
To identify the different actors in a community and identify their needs, possibilities
and limitations
Solar city task force
Solar city task force is an advisory service to assist towns, cities etc integrating renewable
energy technologies, and energy conservation and efficiency measures in order to reduce the greenhouse gas emission. A general methodology has been developed based on the
experiences and best practices adopted by different institutions internationally for providing
such services.
European solar cities projects
The European Solar Cities Project (EU Solar Cities) aims at promoting the wider and large-
scale use of renewable energy (RE) within the context of long-term planning for sustainable urban development. It is basically a study that addresses the planning and application of
technologies for utilizing Renewable Energy Sources (RES) and Rational Use of Energy
(RUE)(in other words adopting Energy efficiency measures) in an urban context and their relevance for reducing CO2 emissions.
Solar city is seen as a city that has made firm commitments in order to reduce greenhouse
gas emission targets while incorporating renewable energy technologies.

2. Review of global „Solar City‟ projects
17
Within the scope of this project several activities were conducted:
The collection and assessment of information about different activities and programmes of selected European cities and city networks, with a description on
their implementation and an assessment of their impact.
The examination of these activities assisted in the development of two guide books for city actors, namely:
- Good Practice Guide
- Guide on CO2 Reduction Potential in Cities
The results encompass a range of informative materials, with recommendations for
replication to city actors and local governments.
The Good Practice Guide is useful for city actors that require ideas and information for planning their own activities and strategies to implement clean energy sources and promote
the reduction of harmful emissions. A set of generic good practices have been identified,
which represent a good starting point for cities that require an introduction to the concept of implementing RES and RUE strategies and activities.
The CO2 Reduction Potential Assessment and Issues Impacting on CO2 balances, is a
comprehensive report that addresses reduction targets and baseline studies. This is particularly useful for guiding cities interested in implementing a strategy, with basic steps
identified to assist this process.
It has to be noted that there are many different approaches that are, and can be, used by cities, with different baselines and varied ways of presenting emissions reduction results.
Although scientists are not unanimous in agreeing to the best way to measure emissions, or
the most effective way to calculate emissions reduction, the project team has the view that a delay in implementing strategies and activities that will adequately reduce harmful
emissions is in itself the most damaging approach.
Under this study, eight cities were identified. Cities were selected from Austria, Belgium, Denmark, France, Germany and Italy. Sixty-three city good practices from seven cities and
one housing association have been identified. Every city needs to consider the result of its
actions in terms of energy used and the effect it has on the environment.
A range of good practices recommended for replication have been identified, and present a
guide to urban actions that contribute to sustainability in cities, and actions that strengthen
networks.
63 city good practices
22 city network good practices
Energie-Cités Association
Energie-Cités was established as an association of European local authorities in 1990 in order
to implement the following at the local level.
Reducing energy consumption while reducing local emissions and effluents,
Stimulate local growth by making use of locally available resources,
Developing innovative town or city
Master plan to develop Faridabad as a “Solar City”
18
Energie-Cités builds European projects for helping its members to develop a local
sustainable energy policy.
With over 140 members in 24 countries and representing more than 500 towns and cities,
Energie-Cités is the association of European local authorities for the promotion of local
sustainable energy policies.
ICLEI-Local Governments for Sustainability
ICLEI is a democratically governed membership association of cities, towns, counties,
metropolitan governments, and local government associations. Its mission is to "build and serve a worldwide movement of local governments to achieve tangible improvements in
global sustainability with special focus on environmental conditions through cumulative
local actions." Within ICLEI the Cities for Climate Protection campaign, a "performance-oriented campaign that offers a framework for local governments to develop a strategic
agenda to reduce global warming and air pollution emissions." That campaign now has over
500 local government participants representing 8% of global carbon-dioxide emissions.
Programme on solar cities
Australia National Solar Cities Program
Australia National Solar Cities Program was launched in 2004, providing 75 million Australian dollors in funding over eight years for solar city related projects at least in four
Australian cities. The solar cities programme will run from 2004-05 to 2012/13, with the
focus on programme design and site selection in the first year. The programme aims to support at least four solar city projects in grid-connected urban centres across Australia.
Three cities have already been identified (i.e. Adelaide, Townsville, Blacktown) Solar cities
will be implemented by the Department of the Environment and Heritage in an purpose of
demonstrating that how solar power, smart meters, energy efficiency and new approaches to
electricity pricing can combine to provide a sustainable energy future in urban locations
throughout Australia.
„Solar Cities‟ Programme in India
India‟s first initiative towards solar city was undertaken by the Government of Gujarat,
which decided to make its capital city „Gandhinagar‟ as a Solar City. A Master Plan for the same was prepared by TERI in 2007 and now its implementation is being carried out.
Ministry of New and Renewable Energy (MNRE), Government of India recently announced
a program for development of solar cities. A total of 60 cities or towns are proposed to develop as solar city during the 11th five year plan period of MNRE.
Under the Solar City Scheme, MNRE is providing following financial support
Up to of Rs 50 lakh for each city is provided for preparation of the Master Plan (up to Rs 10 lakh), setting up of Solar City Cell in the City (up to Rs 10 lakh) oversight of its
implementation (up to `10 lakh) and organizing other promotional activities (up to
Rs 20 lakh).
Apart from 60 Solar Cities, 50 new Small townships/Campuses duly
notified/permitted by the concerned Authorities being developed by the
promoters/builders, SEZs/ industrial towns, Institutional campus etc. will be developed as Solar Township/Solar Campus. The financial support up to 10.00 lakh

2. Review of global „Solar City‟ projects
19
will be provided for each new small townships/campuses for preparation of Master
Plan/DPR including the action plan for renewable energy installations, green campus development, awareness generation and trainings etc.
TERI has prepared the „Master Plan to Develop Chandigarh as Solar City‟ with Chandigarh
Renewable Energy Promotion Society (CREST) of Department of Science and Technology, Chandigarh Administration under the „Solar City‟ scheme of Ministry of New and
Renewable Energy1. Chandigarh has been identified to be developing as „Modern Solar
City‟ by MNRE.
Case studies2
Solar city: Adelaide, Australia
It is the first solar city project in Australia. The Adelaide green city program has formulated
within the contest of several other planning and strategic agendas. Adelaide City Council in
2004 adopted a three-year strategic city management plan in order to make the city as green
city.
The primary goal in the Adelaide programme is
Zero net greenhouse gas emission in building by 2012 and in transport by 2020
Recognized internationally as a green city by 2010
The green city programme is financed partly by new national government A$ 75 million
fund for solar cities, partly by South Australia state government and partly by the city
government.
The green city project in Adelaide includes incorporation of
Solar technology: Solar PV systems have been installed in major public building
such as museum, art gallery, parliament house, schools etc. Grid interactive system with smart electricity meter are being considered in the residential sector which can
sell power back in to the grid at peak times.
Energy efficiency measures in commercial buildings: Under the project, ten major commercial office buildings are considered for conducting the energy audit in each
of the building. Each building is then assigned with an “energy star” rating of one to
five. The objective of the audit is to increase the rating of each building by at least one star.
Eco-housing
Energy audit
Solar city, Barcelona, Spain
Solar city concept in Barcelona was started with the “Barcelona solar thermal ordinance”
which represents a major milestone in Urban Energy Policy. The ordinance is a part of “energy improvement plan to the year 2010 for renewable energy and energy efficiency”. As
per the ordinance, at least 60% of the domestic hot water energy demand and 100% of
1 http://www.indianexpress.com/news/chandigarh-solar-city-plan-ready/486526/ 2 Case studies are taken from Renewable Energy Information on Markets, policy, investment and future pathways by Eric Martinot from following references; http://www.martinot.info/solarcities, www.solarcity.com/

Master plan to develop Faridabad as a “Solar City”
20
swimming pool heating of all new buildings above a certain size (292MJ/day of hot water
energy consumption) has to be met through solar thermal collectors.
Before the ordinance, Barcelona had 1650 m2 of solar thermal collectors installed or 1.1
m2/1000 people and with the enactment of the ordinance and by 2004, it had increased to
21,500 m2 or 16.5 m2/people. The city‟s objective is to install 96,000 m2 of solar hot water system by 2010.
Besides Barcelona, other cities in Spain such as Madrid, Burgos, Sevilla, Onil etc had also
adopted solar thermal ordinance. Although the current ordinance takes care of solar hot water system only, it is expected that future revision might take place with incorporation of
other renewable energy applications as well.
Solar city, Linz, Austria
It is an integrated solar village for 1300 households on the outskirts of Linz. The city
administration and 12 separate building contractors jointly developed the village design.
This solar village consists of 2-4 storey buildings with south facing facades, passive solar heating while ensuring energy efficient constructions. It also includes installation of solar PV
systems for electricity generation.
The total construction cost of the project is 200 million euros.
Solar city, Cape Town, South Africa
A solar city initiative in Cape Town was started with its Integrated Metropolitan
Environmental Policy (IMEP), which envisages several targets, vision statements etc.
The following 4 primary targets are set in order to realize the vision for Cape Town in 2020:
1. 10% contribution from renewable energy sources by 2020
2. 10% households have solar water heater by 2010
3. 90% of households have CFL by 2010
4. 5% reduction in local government electricity consumption by 2010
It was found that transport sector contributes half of the total energy consumption of the city and the most significant greenhouse gas emissions from city and public facilities were from
landfill gas, streetlights and city government buildings and vehicles. Hence initial projects
have focused on landfill sites, city government buildings and vehicles.
In Cape Town pilot projects and full-scale implementation are planned in various sectors
such as residential, commercial, industrial, transport etc.
Solar city, Daegu, Korea
Daegu solar city programme is based on its master plan to the year 2050, which has
systematically incorporated renewable energy into city development. In 2002, the center for
solar city Daegu was established by the city and Kyungpook National University for research, planning, financial sourcing, linking local policy with national policy etc.
Solar city programme includes installation of following
Solar hot water system. About 3400 m2 have been installed since 2002 in public facilities like orphanages and nursing homes.

2. Review of global „Solar City‟ projects
21
Solar photovoltaic system. 635 kW of PV have been installed in schools, parks, and
other public buildings.
About 550 out of 1700 buses are already run through CNG and the target is to
convert all buses to CNG-fueled by 2008.
Wind, small hydro, and landfill gas projects are planned. A "green village" is planned, along with a "solar campus" program to apply solar technologies to schools
and universities.
Solar city, Oxford, UK
The Oxford Solar Initiative was started in 2002 as a partnership between the city, Oxford
Brooks University, and the local community. The primary target of the initiative is to convert
10% of all homes in the city to have solar energy by 2010. Some short-term targets such as installation of energy efficiency measures, solar hot water system, reduction of CO2
emission, capacity building for the local government are also included in the initiatives.
The oxford solar city initiatives have three primary goals as mentioned below.
1. To add a sustainable energy element to urban planning strategies;
2. To set targets, conduct baseline studies, and develop long-term scenarios; and
3. To develop sustainable urban energy technologies
As part of the initiative, Oxford has been conducting analyses of the CO2 emissions of its
built environment using geographic information systems (GIS) to predict baseline energy
use for each house.
Oxford has also introduced the concept of “solar street" in which all the homes on one street
have solar hot water and solar power. These solar power systems are connected to the
electric grid via a "power gate" that allows the community to obtain Renewables Obligation Certificates (ROC) from the utility for the power generated.
As far as the availability of financial assistance to homeowners is concerned, following two
types of assistance are available.
1. For energy efficiency improvements, the grants cover typically 60-100% of the full
cost of wall and loft insulation, hot water tank insulation, condensing boilers, heating
controls, and efficient light bulbs (which are provided free of charge).
2. For renewable energy, the grants cover up to 50% of the full cost of solar electric
systems and up to £500 for solar hot water systems.
Solar city, Freiburg, Germany
In 1996, a greenhouse gas emissions target was set, at 25% below 1992 levels by 2010 in
Freiburg. In 2002, the city council set another target, 10% of all electricity from renewables
by 2010 (in 2002 the level was 3.7%). The policy measures include city-financed solar projects, other demonstration projects, leasing of roof surfaces to solar power generators,
research, subsidies, zoning, urban planning, and education. There are 3.5 MW of PV and
8700 m2 of SHW in the city currently.
Solar City, Gelsenkirchen, Germany
The city of Gelsenkirchen itself is a coal-and-steel industrial city that advocates are hoping to
transform into an "energy city." The city has begun to incorporate solar into housing plans

Master plan to develop Faridabad as a “Solar City”
22
and conduct information and marketing campaigns and training programs, as well as
assisting local businesses.
The Gelsenkirchen Science Park was home in 1995 to the largest roof-mounted solar PV
plant, 210 kW that existed at the time. Since then, the park is being transformed into a base
for local production and R&D for clean energy technologies.
Solar City, Goteborg, Sweden
Göteborg city has a long-term commitment to sustainable energy, including energy-efficient
buildings, renewable energy, energy-efficient urban planning, and ultimately "energy storage in a hydrogen society." The project Göteborg 2050 is developing long-term visions of
a future city and region.
The project is a collaborative effort between universities, the city government, and the city's energy utility; which includes research, scenario development, support for strategic
planning, dialogue with the public, and demonstration projects. The project calls its
methodology "backcasting", in which one starts with a description of the present situation and trends, then considers alternative scenarios for the future that are considered more
sustainable, and then works backwards to consider processes for changing current trends,
strategic planning, and Master Plan s that will lead along pathways to the alternative scenarios. The city has also pioneered the design and construction of a number of
demonstration homes that use only solar energy for heating and hot water, even in the
winter.
Gwangju, Korea
Gwangju receives the most sunlight of any Korean city. The city anticipates solar heating
and power will be key technologies. Collective-heat systems and other innovations in energy supply will accompany the demand-side and renewables investments. There are also public
education programs, research on energy efficiency improvements, and technology R&D
programs to develop the city's own industry towards solar and other clean energy. The policies promoting the use of solar energy were adopted in 2004. The city of Gwangju has a
target to reduce greenhouse gas emissions by 20% by 2020. Intermediate goals are an 8%
reduction in energy demand by 2011 [baseline not stated], and renewable energy targets for 1% of energy supply by 2011 and 2% by 2020; while the share of renewables, in 2004, was
0.5%.
The Hague, Netherlands
The Hague commissioned a profile of the carbon dioxide emissions from the city in 2001. It
found that for the 220,000 homes, residential emissions were 1.1 Mt/year, or about 5
tons/home. Transport emissions were 0.4 Mt, or about 2 tons/home and the combined
emissions of industry, commercial, and public sectors were 1.0 Mt/year. The Hague, a city
with very little heavy industry, are 2.5 Mt/year for 463,000 residents, or 5.4 tons
CO2/person/year. The Hague published an environmental policy planed in 2001. The basic objectives are to make the municipal government "CO2-neutral" by 2006 and the entire city
CO2-neutral in the longer-term. "CO2-neutral" means that all CO2 emissions are either
eliminated or offset by emissions reductions elsewhere.
The city is currently trying to learn the lessons from 15 demonstration projects that have
been described in a "sustainable projects construction book" issued in September 2004. It
envisions future visions, policies, grant schemes, and oversight of both the overall process

2. Review of global „Solar City‟ projects
23
and individual projects implemented by the private sector. The city has allocated budget for
sustainability, and has one million euros to spend from 2004-2008. One project moving ahead is a district-heating supply plant utilizing seawater heat pumps. The city's approach is
to lead but to allow the private sector to do the bulk of the work. As the Vice Mayor wrote,
"When the municipality takes on the role of lead player, it is surprising to see how many organizations in the community and how many private companies are willing to join in
efforts towards sustainable development". Households in The Hague are already significant
consumers of green power; 30% of all households are buying green power.
Minneapolis, USA
The city currently purchases 10% of its municipal power as green power from renewable
energy. It has a renewable energy development fund of $8.5 million annually. With this, the city plans to encourage development of small-scale renewable energy projects in the future,
including use of renewables in schools, libraries, and parks. It would like to create a
distributed generation grid that can be islanded from the main utility system when necessary. The city sees the benefits of renewables in terms of public safety (backup for
emergencies), lower costs for some public works, and a tool for community development.
The city is also developing two pilot biomass projects using wood and agricultural wastes. Local power utilities are required to invest 2% of the revenue from power sales into energy
conservation programs.
Portland, USA
Portland has an extensive history of land-use and transportation planning, based on its
urban growth boundary, created some 30 years ago. The boundary has concentrated growth
and allowed greater use of public transit, bicycles, and walking, reducing energy consumption in transport. Zoning codes provide incentives for building along transit
corridors and parking limits for new construction.
Portland adopted a local energy policy back in the late 1970s, the first of its kind in the United States. Portland's first greenhouse gas reduction plan was adopted in 1993, also the
first local plan in the United States. The plan was updated in 2001 with a goal of reducing
greenhouse gas emissions to 10% below 1990 levels by 2010. The plan also includes a target of supplying 100% of the municipal government's electricity needs from renewable energy
by 2010 (the level was 10% in 2004).
From 1990 to 2003, Portland's per-capita greenhouse gas emissions decreased by 13%. Total emissions are only slightly above 1990 levels, despite a 16% increase in population. Gasoline
use fell by 8% per capita. Electricity use for households fell by 10%.
Incentives for renewable energy include a 25% residential energy tax credit, a 35% commercial business tax credit, and funds from the Energy Trust of Oregon. The Energy
Trust of Oregon collects a 3% "public purpose" tax on utility bills, about $60 million/year.
$10 million/year of that goes to renewable energy projects. Other funding comes from carbon offsets, green certificataes, and municipal bonds.
Portland's "green building" program integrates energy and water conservation with recycled
building materials and other environmental strategies. The city requires all new city facilities to meet LEED, the standard of the US Green Building Council. Any private construction
project that uses city funding for affordable housing or major commercial development must
also satisfy the LEED standard. Portland now has more LEED-certified buildings finished or underway than any other city in the United States.

Master plan to develop Faridabad as a “Solar City”
24
Qingdao, China
Qingdao is promoting four types of renewable energy:
Solar hot water and power. The use of solar hot water in Qingdao has been growing
at 15% per year, and there are now 150,000 m2 installed (equal to roughly 0.03
m2/person).
Seawater heat pumps. The first pilot project is being developed.
Wind power. There are now 16 MW installed.
Biomass gasification. There are 15 biomass gasification plants operating, utilizing waste crop stalks and supplying gas to 3000 households.
Santa Monica, USA
In 1994, Santa Monica adopted a Sustainable City Plan which includes goals for greenhouse
gas emissions reductions. Since then, the city has increased renewable energy generation
and purchases, improved energy efficiency, and fostered alternative fuel vehicles. The city
now purchases 100% of municipal electricity needs from green power suppliers. In addition, the city has 300 kW of solar PV installed. There are green building guidelines and a mandate
for green buildings for new city facilities. The city has converted its fleet of garbage trucks
and buses to run on natural gas. Other city vehicles are natural gas fuelled or electric/gas hybrids. Electric vehicle charging stations exist around the city. Together, the above
measures by 2000 had reduced greenhouse gas emissions by 5% below 1990 levels. For the
future, a new Community Energy Independence Initiative proposes to generate 100% of the city's energy needs within city borders, based on cogeneration and renewable energy.
Sapporo, Japan
The city of Sapporo has a stated goal of a 10% reductions in CO2 emissions per capita by 2012 (relative to 1990 levels). This is consistent with Japan's overall 6% emissions reducation
target under the Kyoto Protocol. However, Sapporo's emissions in 2000 were 16% above
1990 levels, meaning a substantial reduction will be required in the future (a situation typical of virtually all Kyoto Protocol signatories). The city groups its activities into four categories:
public awareness (called "sense of crisis"), measures aimed at stimulating citizen initiative
(called "movement"), incentives (called "propagation to citizens and business operators"), and city-sponsored activities (called "initiatives of the city government").
The city has purchased 55 low-emissions vehicles for its use, including 34 natural-gas cars
and garbage trucks. There are five solar power demonstration projects in schools (typically 10kW size, providing 7-8% of school's power consumption), as well as other public facilities
like the zoo. As for private development, one suburban residential complex with 500 homes
to be constructed by 2008 is expected to have 1500 kW PV (3 kW per home). In the future,
the city plans to use snow in wintertime to displace cooling energy demand and continue
R&D on fuel cells and hydrogen, including hydrogen transport and storage and efficient
natural gas reforming.
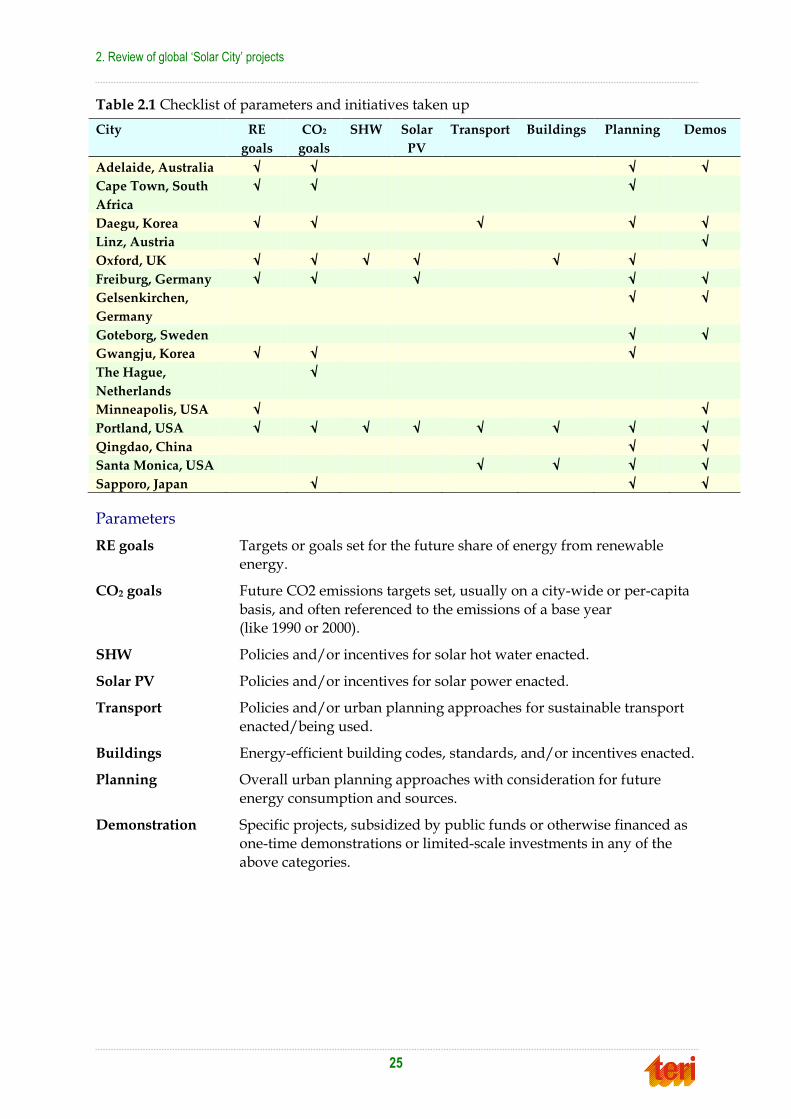
To summarize, Table 2.1 gives a checklist of parameters/activities, which have been
included in different case studies.
2. Review of global „Solar City‟ projects
25
Table 2.1 Checklist of parameters and initiatives taken up
City RE
goals
CO2
goals
SHW Solar
PV
Transport Buildings Planning Demos
Adelaide, Australia √ √ √ √
Cape Town, South
Africa
√ √ √
Daegu, Korea √ √ √ √ √
Linz, Austria √
Oxford, UK √ √ √ √ √ √
Freiburg, Germany √ √ √ √ √
Gelsenkirchen,
Germany
√ √
Goteborg, Sweden √ √
Gwangju, Korea √ √ √
The Hague,
Netherlands
√
Minneapolis, USA √ √
Portland, USA √ √ √ √ √ √ √ √
Qingdao, China √ √
Santa Monica, USA √ √ √ √
Sapporo, Japan √ √ √
Parameters
RE goals Targets or goals set for the future share of energy from renewable energy.
CO2 goals Future CO2 emissions targets set, usually on a city-wide or per-capita
basis, and often referenced to the emissions of a base year (like 1990 or 2000).
SHW Policies and/or incentives for solar hot water enacted.
Solar PV Policies and/or incentives for solar power enacted.
Transport Policies and/or urban planning approaches for sustainable transport
enacted/being used.
Buildings Energy-efficient building codes, standards, and/or incentives enacted.
Planning Overall urban planning approaches with consideration for future
energy consumption and sources.
Demonstration Specific projects, subsidized by public funds or otherwise financed as
one-time demonstrations or limited-scale investments in any of the
above categories.


27
33.. NNaattiioonnaall aanndd iinntteerrnnaattiioonnaall pprraaccttiicceess
Energy conservation in buildings
Residential, public and commercial buildings consume a large amount of energy mostly for lighting, appliances, space heating and water heating. In order to improve energy efficiency
and conserve energy through the concept of the „solar city‟, existing buildings and new
buildings must evolve to incorporate energy efficiency and energy conservation measures.
To encourage global best practice in Faridabad, this section considers how energy efficiency
is incorporated into building codes in Australia, Canada, the U.S.A and India, and how
building practices are managed internationally and in India. These countries are considered as they are some of the world‟s leaders in energy efficient building design and also have a
similar climate to India.
Strategies to achieve energy efficient buildings according to international practice will be discussed here for the main components of a building in order to achieve energy efficiency
and conservation in the developing „solar city‟ of Faridabad. Information on technologies
and energy saving methods outlined in this chapter aim to assist the Municipal Corporation of Faridabad in going beyond basic energy efficiency strategies and to provide more the
tools for innovative designs for new and retrofit buildings.
Achieving energy efficient buildings
As Faridabad lies in the composite climate1, any energy efficient building system must be
designed according to this climate. This should also be a major consideration when looking
at international practices that /are suitable to follow.
Energy conservation regulations
Australia
Building controls and regulations in Australia are the responsibility of the States and Territories. The BCA provides a nationally uniform code for technical requirements in
buildings. The BCA 1996 (the current BCA) is a performance-based code subject to State and
Territory variations. Local councils and private certifiers are responsible for administering the BCA and some local councils use planning legislation to enforce energy efficiency
measures for buildings in their region.
In Australia there exists the Green Building Council of Australia (GBCA), which considers best practice for building energy. They have a Memorandum of Understanding with
Building Construction Interchange and they have ensured that energy efficiency is
incorporated into their Building Codes of Australia (BCA). They promote sustainable
buildings by recognising them through the Green Star rating system, which ranks buildings
according to certain ecological and environmental criteria2. It is based on the British
BREEAM (Building Research Establishment Environmental Assessment Method) and America‟s LEED (Leadership in Energy and Environmental Design). This system was
created for the property industry to encourage green building design and create awareness
of the benefits. Not only can they market green buildings to consumers on the basis of cost
1 according to ECBC 2006 climate zone map of India 2 http://www.gbcaus.org/gbc.asp?sectionid=15&docid=881#a

Master plan to develop Faridabad as a “Solar City”
28
savings, but also green buildings have an attached sense of leadership in the property
industry at present.
Currently the system of rating is for office buildings, followed by health centres and
educational facilities. Soon it will also be developed for some multi-unit residential
complexes but has yet to be developed for housing.
The main reason that commercial buildings have been targeted first is due to their huge
contribution to emissions in Australia. They contribute 8.8% (particularly offices and
hospitals) to total emissions and this must be reduced in order for Australia to meet their international emissions obligations1. For residential buildings it is suitable to refer to
guidelines by the Australian Greenhouse Office2.
The GBCA also works closely with the Canadian Green Building Council (CaGBC) but have not developed sustainable practices as far as the Canadian Council.
Canada
In Canada there exists the National Building Code of Canada 2005 (NBC 2005). This is for use by officials, educators and construction professionals. However this code does not
directly deal with energy conservation and hence there is a separate Model National Energy
Code for Houses 1997 (MNECH) and Model National Energy Code for Buildings 1997 (MNECB). The MNECH allows designers the freedom to choose the level of energy
efficiency they wish to achieve for a given climate and type of fuel used in the home. This
code is applicable to residential buildings up to three storeys high and additions to buildings up to 10m2. The MNECB considers minimum requirements for building features, which
dictate energy efficiency. It considers regional construction costs, regional heating fuel types
and costs, and regional climatic differences. This code considers the building envelope, water heating, lighting, HVAC systems, and electrical power.
For best practice in Canada for residential buildings there is the EnerGuide offered by the
government and also R-2000 houses scheme. Both these offer buildings that are achieve best practices in energy efficiency and builders who engage with these schemes will do so to
provide high quality housing for buyers and a reduction in energy costs for the buyer.
Several provinces/territories are currently considering incorporating the MNECB in their building regulations. If adopted by a province, territory or municipality, the provisions of
the MNECB will become law in that region. The same is the case for MNECH. These energy
efficiency codes are to be used alongside the NBC 2005.
Some of the Canadian provinces and the Government have energy efficiency acts and the
MNECB and MNECH refer to these and give minimum energy requirements. If local
legislation exists then this is followed. If it does not exist at federal or province level then the MNECB/MNECH is followed. However the codes are not mandatory unless stated in local
legislation.
The CaGBC have chapters across Canada that work to promote green building concepts in their respective local areas. They use the LEED rating system for Canada and help local
property developers understand how to make buildings more energy efficient. The CaGBC
also aims to take building practice beyond the MNECB and MNECH.
1 http://www.gbcaus.org/gbc.asp?sectionid=90&docid=954 2 http://hia.com.au/hia/channel/Builder/region/National/classification/Greensmart/Resources/Passive%20Design.aspx

3. National and international practices
29
U.S.A
In the U.S.A building codes vary across the country from State to State. There are three tiers of National, State and Local level all of which can have legislation that applies to buildings
in a specific region. Depending on the State, building codes can apply directly to green
building design or can incorporate features such as energy efficiency without directly referring to green building design. Some states (earlier Washington offered subsidies)
subsidise the use of renewable energy in buildings to encourage people to invest.
In the US there exists International Energy Codes (IEC) and the American National Standards Institute/American Society of Heating, Refrigerating and Air-Conditioning
Engineers standards (ANSI/ASHRAE/IESNA Standard 90.1) requirements. There has been
a Building Energy Codes program, which encourages the adoption of building energy codes by state governments1.
India
In India there exist the National Building Codes 2005 (NBC 2005) and the new Energy Conservation of Buildings Codes 2006 (ECBC 2006). The national building codes only
consider regulations in building construction primarily for the purposes of regulating
administration, health and safety, materials and construction requirements and building and plumbing services whereas the ECBC 2006 consider energy conservation and energy
efficiency in buildings „to provide minimum requirements for the energy-efficient design
and construction of buildings.‟ The NBC 2005 refers to a wide variety of building type and ownership (government, non-government etc.) whereas ECBC 2005 only refers to
commercial buildings and some building complexes.
The ECBC 2006 mainly considers administration and enforcement, the building envelope, HVAC, service hot water and pumping, lighting and electric power to encourage
conservation of energy. These are considered in new buildings and additions to existing
buildings.
At present the Energy Conservation Act 2001 empowers the state governments to adjust the
codes according to local conditions. This encourages inconsistency in building practices
across to country and can lead to huge deviations from the existing codes. There are currently state designated agencies for implementation of this code for example in
Faridabad, the Haryana Renewable Energy Development Agency (HAREDA) is the state
nodal agency for implementing the Energy Conservation Act 2001 and hence ECBC 2006. In Pondicherry and the Andaman and Nikobar Islands, the local Electricity Department is
responsible for enforcing energy conservation policy and regulations at local level. The
regulating authority is different for each state and is responsible for enforcing the adapted building codes for that state. Experts (architects and engineers) check the plans for new
buildings or changes to existing buildings and permit the builder to carry out construction if
the designs meet code requirements. They are rejected and sent for alteration if they do not
meet requirements. After the building is built it must again be certified as complete by the
state designated agency before it is used.
The Bureau of Energy Efficiency is working on certifying Energy Auditing Agencies in order to evaluate buildings energy use, which will enable better regulation of energy conservation
in buildings.
1 http://www.energycodes.gov/implement/pdfs/ta_com.pdf

Master plan to develop Faridabad as a “Solar City”
30
In order to encourage green rating practices of buildings, The Energy and Resources
Institute (TERI) has developed the TERI-GRIHA rating.
Points are given for different criterion at the site planning, building planning and
construction, and the building operation and maintenance stages of the building life cycle.
All buildings, except for industrial complexes and housing colonies, which are in the design stage, are eligible for certification under the TERI system. Buildings include offices, retail
spaces, institutional buildings, hotels, hospital buildings, healthcare facilities, residences,
and multi-family high-rise buildings.
Buildings are evaluated and rated in a three-tier process. The preliminary evaluation is done
to estimate the number of points the project is likely to get. Then relevant documents will be
submitted for each criteria (format provided by TERI-GRIHA). Then the documents will be evaluated and re-evaluated after adjustment by the TERI evaluation committee. The
evaluation committee awards the final score for the project, which is then presented to an
advisory committee. The final rating is valid for a period of 5 years from the date of commissioning of the building.
Each criterion has a number of points assigned to it. The system is a 100-point system
consisting of some core points, which are mandatory (or partly mandatory) and the rest are optional. There is then a one to five star certification system to finally rate the building1.
In India, as has been the case with the introduction of wide-scale introduction of renewable
energy technologies for a variety of applications Ministry of New and Renewable Energy announced the scheme „Development of Solar Cities‟ under which an indicative target of 60
cities/towns with at least one in each State has been set for the 11th Plan period. The
Ministry of New and Renewable Energy (MNRE) proposed to develop 60 such cities during the current Plan period (2007-12). The targets will be achieved by providing support for
preparation of a Master Plan for their city; setting up of a „Solar City Cell‟ in the
Council/Administration, organizing training programmes/ workshops/ business meets for various stakeholders such as elected representatives of the municipal bodies, municipal
officials, architects/engineers, builders and developers, financial institutions, NGOs,
technical institutions, manufactures and suppliers, RWAs etc. and on creation of public information and awareness.
Lighting
Lighting is a component of buildings that contributes up to 20% of buildings electricity consumption in an air-conditioned building. In a non-air-conditioned building it is the most
significant source of energy consumption.
When designing a lighting system, the critical factors according to U.S.A based Energy Design Resources are as follows.
Design according to lighting demand and distribute any glare that is present.
Maximise use of natural daylight but avoid direct sunlight and install appropriate controls for lights.
Use high-efficiency fluorescent systems for commercial spaces.
For further lighting requirements (e.g. atmospheric) use incandescent and compact fluorescence sources.
1 reference TERI-GRIHA document

3. National and international practices
31
Make use of high intensity discharge systems such as pulse start metal halide for
outdoor systems, and ceramic metal halide if colour quality is a concern (such as in retail outlets)1.
TERI-GRIHA rating system contains a set of basic requirements in order to optimise the
buildings design for reducing energy demand from lighting. The main aim is to apply passive solar techniques to buildings to enhance the use of natural sunlight in order reduce
energy consumption from lighting.
The criteria commitments outlined in the TERI-GRIHA are as shown in the box below.
Criteria for lighting 12.1.1 Arrange spaces with respect to favourable orientations 12.1.2. Shade the east-west walls using shading devices 12.1.3. Do solar path analysis to arrive at an appropriate size of shading device for each orientation or, use shading norms prescribed in SP 41: 1987 – Functional requirement of buildings. Also adhere to Solar Heat Gain Coefficient as per ECBC 2006. 12.1.4. Perform daylight simulation and ensure that all living spaces shall have a minimum of 75% area with daylight factor as prescribed in Bureau of Indian Standards (SP41:1987 Functional requirement of buildings) under overcast conditions. 12.1.5. Perform lighting simulation to demonstrate that the lighting levels in indoor spaces are maintained as recommended in National Building Code 2005, Bureau of Indian Standards, Part-8 building services, Section 1, Lighting and ventilation, Table 8.
Source: TERI-GRIHA
The majority of these practices refer more to commercial buildings because lighting systems in households are less complex. For the residential sector the largest saving potential is by
replacing all incandescent lights with compact fluorescent lighting (CFL)2, which produces a
saving of approximately 75-85%. Those commercial buildings that have already made this switch and must incorporate better-designed lighting systems according to the information
outlined in this section in order to improve efficiency and maximise use of natural sunlight.
The Canadian organisation, Natural Resources Canada offers advice for energy efficient measures that are summarised in the table below. These are suitable for the Faridabad‟s hot-
dry climate and also those that directly have an effect on energy consumption.
Table 3.1 Suggested energy efficiency measures for commercial buildings
Technology Description Building use and type Benefit and limitations
External
Shading Device
Incorporated in building
façade to limit internal heat
gain from solar radiation.
Often in the form of
horizontal sunshades
attached above windows on
south facing walls. Vertical
louvers for east and west
facing windows are also
effective
High rise office; low rise
office; low rise
apartment; retail; food
service; institutional;
arena; used for new and
existing buildings
Reduces cooling loads but
does increase capital costs
and maintenance.
Shading with
Vegetation
Deciduous vegetation
planted primarily on
High rise office; low rise
office; high rise
Reduces air conditioning
needs and creates a cooler
1 http://www.energydesignresources.com/docs/db-01-lighting.pdf 2 Sustainable Building Design Manual, Volume 2, Published by TERI

Master plan to develop Faridabad as a “Solar City”
32
Technology Description Building use and type Benefit and limitations
southwest and west side of
building to block sun.
apartment; low rise
apartment; retail; food
service; institutional;
arena
building climate. Reduces
heat loss from wind also.
However plants must be
chosen to adapt to local
climate. It requires
maintenance also and it needs
space available for planting.
High Intensity
Discharge
(HID) Lamps
Produce light by striking an
electrical arc across
tungsten electrodes housed
inside a specially designed
inner glass tube. Typically
used when large amount of
light for large area is
required.
High rise office;
institutional; retail; arena;
parking garage; food
service; warehouse and
industry; residential;
used in new and existing
buildings
Increases energy efficiency of
lighting. Initial cost is higher
than conventional lamps but
energy saving is 15 to 25% for
these energy saving lamps.
Dimmable
Compact
Fluorescent
lamps (CFL’s)
and electronic
dimmable
ballasts
Dimming results in lower
energy usage
High rise office; low rise
office; low rise
apartment; arena;
institutional; retail; food
service; used in new and
existing buildings
Lowers energy consumption
and has longer lamp life.
However, higher cost and
larger fixtures required.
Daylighting
controls
Controls that respond to
levels of natural light by
dimming or turning off
electric light
High rise office; low rise
office; retail; food service;
institutional; used in new
and retrofit buildings.
High costs and rapid change
in lighting can be disturbing.
However it reduces electricity
use.
T8 fluorescent
lamps
16mm diameter high-
efficiency fluorescent lamp
produced in metric sizes.
High rise office; low rise
office; low rise
apartment; retail; food
service; institutional;
arena; used in new and
existing buildings.
Increases energy efficiency
and lower operating costs.
However may increase glare.
Indirect
lighting
systems
Direct indoor lighting to
floors and ceilings where it
is reflected back to room
High rise office; low rise
office; retail; food service;
institutional; used in new
and existing buildings
Eliminates glare and
shadows, reduces electricity
use and cooling loads, and
reduces required light levels.
However, requires high
ceiling height and perhaps
higher initial costs.
Information adapted from Canadian strategies for commercial buildings1 and Sustainable Building Design
Manual2 (a collaboration of UK, Spain and Indian expertise in energy efficiency)
1 www.advancedbuildings.org 2 Sustainable Building Design Manual, Volume 2, Published by TERI
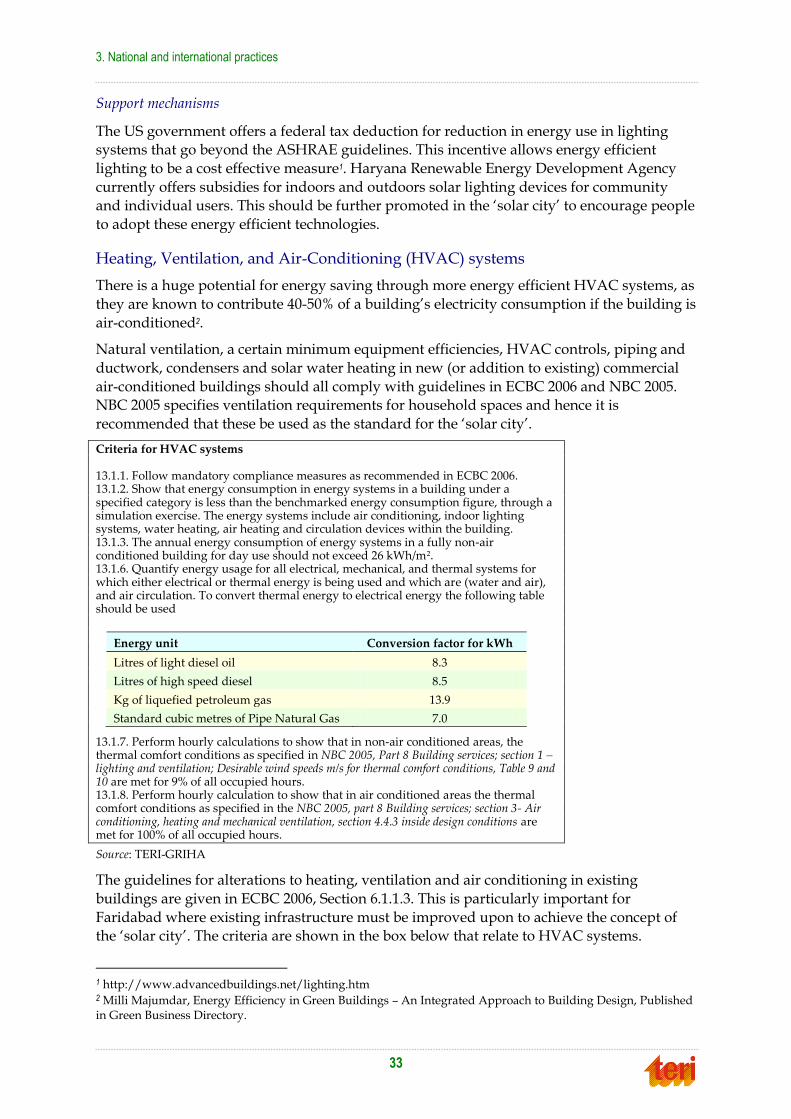
3. National and international practices
33
Support mechanisms
The US government offers a federal tax deduction for reduction in energy use in lighting systems that go beyond the ASHRAE guidelines. This incentive allows energy efficient
lighting to be a cost effective measure1. Haryana Renewable Energy Development Agency
currently offers subsidies for indoors and outdoors solar lighting devices for community and individual users. This should be further promoted in the „solar city‟ to encourage people
to adopt these energy efficient technologies.
Heating, Ventilation, and Air-Conditioning (HVAC) systems
There is a huge potential for energy saving through more energy efficient HVAC systems, as
they are known to contribute 40-50% of a building‟s electricity consumption if the building is
air-conditioned2.
Natural ventilation, a certain minimum equipment efficiencies, HVAC controls, piping and
ductwork, condensers and solar water heating in new (or addition to existing) commercial
air-conditioned buildings should all comply with guidelines in ECBC 2006 and NBC 2005. NBC 2005 specifies ventilation requirements for household spaces and hence it is
recommended that these be used as the standard for the „solar city‟.
Criteria for HVAC systems 13.1.1. Follow mandatory compliance measures as recommended in ECBC 2006. 13.1.2. Show that energy consumption in energy systems in a building under a specified category is less than the benchmarked energy consumption figure, through a simulation exercise. The energy systems include air conditioning, indoor lighting systems, water heating, air heating and circulation devices within the building. 13.1.3. The annual energy consumption of energy systems in a fully non-air conditioned building for day use should not exceed 26 kWh/m2. 13.1.6. Quantify energy usage for all electrical, mechanical, and thermal systems for which either electrical or thermal energy is being used and which are (water and air), and air circulation. To convert thermal energy to electrical energy the following table should be used 13.1.7. Perform hourly calculations to show that in non-air conditioned areas, the thermal comfort conditions as specified in NBC 2005, Part 8 Building services; section 1 – lighting and ventilation; Desirable wind speeds m/s for thermal comfort conditions, Table 9 and 10 are met for 9% of all occupied hours. 13.1.8. Perform hourly calculation to show that in air conditioned areas the thermal comfort conditions as specified in the NBC 2005, part 8 Building services; section 3- Air conditioning, heating and mechanical ventilation, section 4.4.3 inside design conditions are met for 100% of all occupied hours.
Source: TERI-GRIHA
The guidelines for alterations to heating, ventilation and air conditioning in existing
buildings are given in ECBC 2006, Section 6.1.1.3. This is particularly important for
Faridabad where existing infrastructure must be improved upon to achieve the concept of the „solar city‟. The criteria are shown in the box below that relate to HVAC systems.
1 http://www.advancedbuildings.net/lighting.htm 2 Milli Majumdar, Energy Efficiency in Green Buildings – An Integrated Approach to Building Design, Published in Green Business Directory.
Energy unit Conversion factor for kWh
Litres of light diesel oil 8.3
Litres of high speed diesel 8.5
Kg of liquefied petroleum gas 13.9 Standard cubic metres of Pipe Natural Gas 7.0
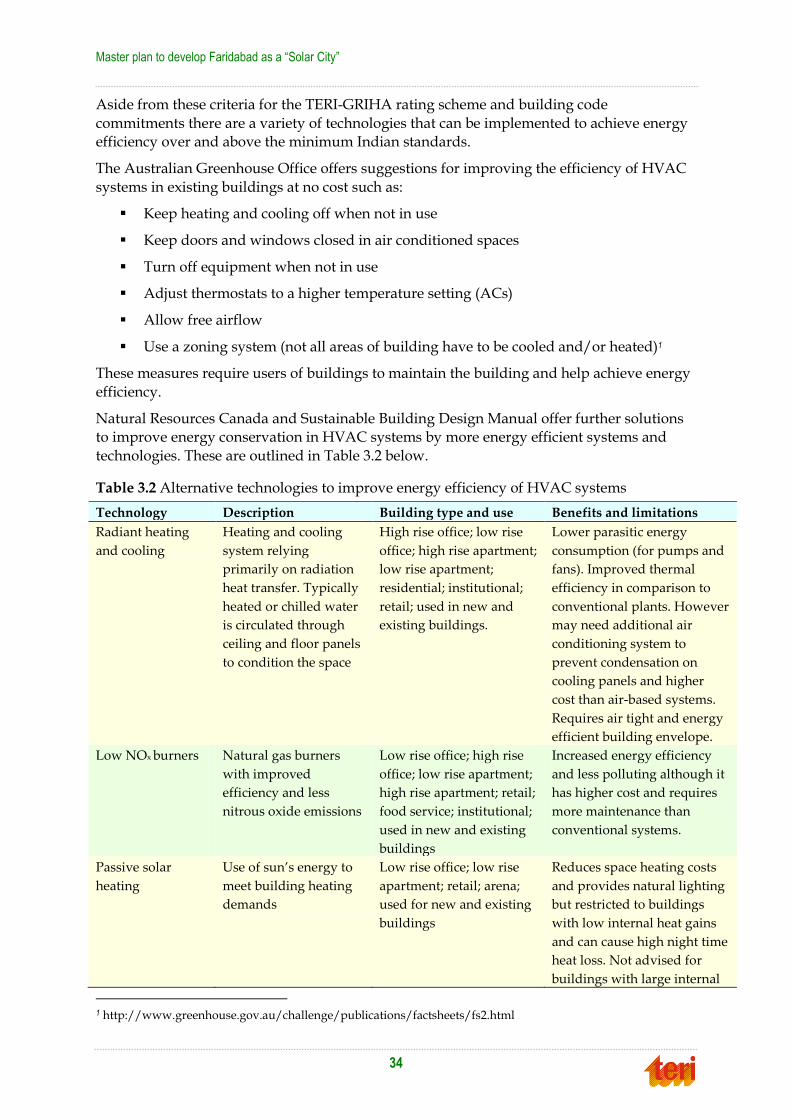
Master plan to develop Faridabad as a “Solar City”
34
Aside from these criteria for the TERI-GRIHA rating scheme and building code
commitments there are a variety of technologies that can be implemented to achieve energy efficiency over and above the minimum Indian standards.
The Australian Greenhouse Office offers suggestions for improving the efficiency of HVAC
systems in existing buildings at no cost such as:
Keep heating and cooling off when not in use
Keep doors and windows closed in air conditioned spaces
Turn off equipment when not in use
Adjust thermostats to a higher temperature setting (ACs)
Allow free airflow
Use a zoning system (not all areas of building have to be cooled and/or heated)1
These measures require users of buildings to maintain the building and help achieve energy
efficiency.
Natural Resources Canada and Sustainable Building Design Manual offer further solutions to improve energy conservation in HVAC systems by more energy efficient systems and
technologies. These are outlined in Table 3.2 below.
Table 3.2 Alternative technologies to improve energy efficiency of HVAC systems
Technology Description Building type and use Benefits and limitations
Radiant heating
and cooling
Heating and cooling
system relying
primarily on radiation
heat transfer. Typically
heated or chilled water
is circulated through
ceiling and floor panels
to condition the space
High rise office; low rise
office; high rise apartment;
low rise apartment;
residential; institutional;
retail; used in new and
existing buildings.
Lower parasitic energy
consumption (for pumps and
fans). Improved thermal
efficiency in comparison to
conventional plants. However
may need additional air
conditioning system to
prevent condensation on
cooling panels and higher
cost than air-based systems.
Requires air tight and energy
efficient building envelope.
Low NOx burners Natural gas burners
with improved
efficiency and less
nitrous oxide emissions
Low rise office; high rise
office; low rise apartment;
high rise apartment; retail;
food service; institutional;
used in new and existing
buildings
Increased energy efficiency
and less polluting although it
has higher cost and requires
more maintenance than
conventional systems.
Passive solar
heating
Use of sun’s energy to
meet building heating
demands
Low rise office; low rise
apartment; retail; arena;
used for new and existing
buildings
Reduces space heating costs
and provides natural lighting
but restricted to buildings
with low internal heat gains
and can cause high night time
heat loss. Not advised for
buildings with large internal
1 http://www.greenhouse.gov.au/challenge/publications/factsheets/fs2.html

3. National and international practices
35
Technology Description Building type and use Benefits and limitations
heat gains.
Gas Engine-driven
chillers
An air-conditioning
chiller powered by a
natural gas engine
High rise office; high rise
apartment; retail;
institutional; used in new
and existing buildings
Lower peak electricity
demand, lower cooling costs,
and free heat recovery
however uses refrigerants
and requires greater
maintenance.
Alternative
refrigerants
Refrigerants that do not
destroy the earth’s
ozone layer
High rise office; low rise
office; high rise apartment;
low rise apartment; retail;
food service; arena;
institutional; used in new
and existing buildings
Conserves atmospheric ozone
and lowers greenhouse gas
emissions but may be less
efficient and less stable.
Gas fired
chiller/heater
A natural-gas powered
mechanical appliance
that supplies chilled
water for air-
conditioning or for
process cooling, as well
as hot water for space
heating
High rise office; high rise
apartment; retail; food
service; institutional; used
for new and existing
buildings
Eliminates the use of ozone-
depleting refrigerants and
reduces air conditioning
costs. However, it has a
higher initial cost and there
are physical constraints when
installing in existing
buildings.
Desiccant Cooling/
Dehumidification
Use of chemical or
physical absorption of
water vapour to
dehumidify air and
reduce the latent
cooling load in a
building HVAC system
High rise office; low rise
office; high rise apartment;
arena; used in new and
existing buildings.
Reduces energy required to
dehumidify and cool
ventilation air and reduces
condensation. Improves
efficiency of refrigeration
equipment by operating at
higher evaporator
temperatures and higher
Coefficient of Performance.
Also allows alternative AC
approaches. However it has
high initial cost and most
effective in large building
with centralised HVAC
equipment.
Enthalpy heat
exchangers
Transfers sensible and
latent heat between two
air streams.
High rise office; low rise
office; high rise apartment;
low rise apartment; retail;
food service; institutional;
arena; used for new and
existing buildings.
Conserves sensible and latent
heat. Reduces cooling load
during summer and doesn’t
require heat for regeneration.
However it has a large and
bulky configuration.
Energy recovery
ventilators
Device providing
ventilation for dilution
or source-control
applications.
High rise office; low rise
office; high rise apartment;
low rise apartment; food
service; arena;
institutional; retail; used
in new and existing
Improves internal air quality,
energy efficiency and lowers
peak energy demand.

Master plan to develop Faridabad as a “Solar City”
36
Technology Description Building type and use Benefits and limitations
buildings.
Natural
ventilation and
cooling
Use of outdoor airflow
into buildings to
provide ventilation and
space cooling.
High rise office; low rise
office; high rise apartment;
low rise apartment; retail;
food service; institutional;
industrial; only for new
buildings
Provides ventilation without
using fans and free cooling
without mechanical systems.
Reduces construction and
operating costs of building
and no fan noise. However
less easy to control and larger
temperature fluctuations.
Occupants must adjust
windows to encourage the
effect.
Most of these systems are suitable for commercial buildings. Due to the composite climate of
Faridabad is important to prioritise the avoidance of passive heating in buildings and
installing energy efficient cooling equipment.
Support mechanisms
Faridabad does not currently offer subsidies for most energy efficient HVAC systems. There
is a subsidy for natural water coolers at present. Various states in the U.S.A, such as California1, offer financial incentives for more energy efficient HVAC systems. This
encourages their use in new buildings and when retrofitting existing buildings.
Service hot water and pumping
In terms of energy consumption, water heating accounts for approximately 20% of
residential energy use and about 7% of commercial energy use2. The use of energy by
systems in a building can be reduced by using more energy efficient hot water heating and pumping systems as well as better maintenance of existing systems so that they are only in
use when required.
ECBC 2006 gives minimum equipment efficiencies, and piping insulation criteria to encourage energy efficiency in service hot water and pumping systems for new and existing
commercial buildings.
It is particularly important to note ECBC‟s requirement that 1/5th of the design capacity
for water heating in residential facilities, hotels, and hospitals with centralised heating
systems, should be provided by solar water heating systems.
Moreover, Haryana Renewable Energy Development Agency (HAREDA) has made it
mandatory for multi-storey apartments to have solar water heating system. According to
the new regulations which came in January, 2011, after reconsideration on earlier
regulation for mandatory solar water heating system for all the building; due to
insufficient shadow-free roof area available in many cases, the new regulation gives the
new capacity norms for buildings which have stories more than ground plus four floors3.
1 http://www.green.ca.gov/EnergyPrograms/Rebates.htm#hvac 2 http://www.advancedbuildings.org/_frames/fr_t_heat_water_loop.htm 3 http://tcpharyana.gov.in/Notifications%20&%20Judgements/Solar%20Water%20Heating%20Instructions%20HAREDA%2018.1.11.pdf

3. National and international practices
37
To go beyond basic equipment energy efficiency requirements in building codes and
regulations, one can look further to international standards.
The Australian Greenhouse Office gives no cost suggestions to save energy in water heating
and pumping,
Reduce thermostat settings so it is not unnecessarily high.
Turn water heaters off when not required in building.
If using a circulating pump then this should be turned off outside of usage hours.
Only switch on extra water heaters when needed for the specific tasks that they are installed for rather than continuously running them1.
The Sustainable Building Design Manual and Natural Resources Canada website offer
solutions to saving energy using more energy efficient technologies in water heating and pumping. Potential technologies are given in Table 3.3 below.
Table 3.3 Potential technologies for water heating
Technology Description Building type and use Benefits and limitations
Direct
contact water
heaters
This is a water
heating device
without a heat
exchanger and in
which flue gases are
in direct contact
with the water
High rise apartment;
food service;
institution; used in new
and existing buildings
Increased efficiency and
reduced NOx and CO
emissions. However it has a
higher cost and is less
effective in closed loop
applications.
Ground
source heat
pumps
(geothermal
heating)
Extracts heat stored
in the upper layers
of the earth.
Low rise office; low rise
apartment; retail; food
service; institutional;
used in new and
existing buildings.
Can reduce energy for
space heating, cooling,
water heating in large
buildings by as much as
50%. Require less
mechanical room space,
and has reduced operation
and maintenance costs.
However initial and design
costs are higher. Requires
additional site coordination
and supervision.
Solar water
heating
The use of the sun’s
energy to heat
water rather than
gas or electricity.
Residential; high rise
office; low rise office;
high rise apartment;
low rise apartment;
retail; food service;
institutional; arena;
used in new and
existing buildings.
At minimum operational
costs it can provide most of
a buildings hot water
requirements. Reduces use
of electricity and/or fossil
fuels. However will need a
conventional back up
system to boost
temperature but use will be
limited in a hot dry climate
such as that of Faridabad.
1 http://www.greenhouse.gov.au/challenge/publications/factsheets/fs8.html

Master plan to develop Faridabad as a “Solar City”
38
The savings will mostly be in commercial buildings because the cost of implementing these
technologies in each residence will be costly.
Support mechanisms
There are no subsidy support mechanisms for solar heating systems in particular which will
be the preferred option for Faridabad due to this technology being suitable in the climate of the proposed „solar city‟.
Building envelope
The building envelope includes fenestration (including vertical fenestration and glazing), opaque construction, building envelope sealing (affects air leakage), roofs, walls and
skylights (for commercial buildings).
The Sustainable Building Design Manual recommends that the ECBC 2006, which is mostly based on the ASHRAE codes of the U.S.A, should be used for insulation values and SHGC
values in the building envelope in particular.
Electric power
Some savings in energy can also be achieved through improving electric power systems of
buildings. ECBC 2006 suggests suitable maximum transformer power losses for air-
conditioned commercial buildings in India and encourages the use of energy efficient motors.
Policy review
In the context of developing Faridabad as a Solar City, an exercise has been undertaken to review the pertinent policies, legislations, and regulations that have bearing on the planning
and implementation processes. Essentially this review has been carried out to give a sense of
the measures already in place that could be used for (a) facilitation, (b) enforcement, and (c) implementation of solar city plans. The main areas of the focus were policies and legislation
that promote energy conservation and renewable energy utilization. The following section
describes key features of such measures as applicable to Faridabad.
Energy conservation and efficiency
As per Energy Conservation Act 2001, the state government is empowered with a number of
enforcing powers such as:
The State Government may, by notification, in consultation with the Bureau of
Energy Efficiency (BEE) amend the energy conservation building codes to suit the
local climatic conditions specify and notify energy conservation building codes with respect to use of energy in the buildings.
Direct every owner or occupier of a building or building complex to comply with the
provisions of the energy conservation building codes.
Direct, if considered necessary for efficient use of energy and its conservation, any
consumer referred to get energy audit conducted by an accredited energy auditor
Take all measures necessary to create awareness and disseminate information for efficient use of energy and its conservation.

3. National and international practices
39
Arrange and organise training of personnel and specialists in the energy
conservation techniques for efficient use of energy and its conservation.
Take steps to encourage preferential treatment for use of energy efficient equipment
or appliances.
Besides, the EC Act 2001 mandates the State Government to constitute the State Energy Conservation Fund for the purposes of promotion of efficient use of energy and its
conservation within the State.
On its part, Haryana government provides financial assistance at 50% of the investment grade energy audit cost with maximum limit of Rs. 50,000 for private, government, semi-
government, industrial and commercial buildings1.
„Development of Solar Cities‟ scheme of MNRE
Ministry of New and Renewable Energy of India recently announced a program for
„Development of solar cities‟. A total of 60 cities/towns covering all parts of the country are
proposed to be developed as solar cities during the 11th five year plan period of MNRE. A criterion has also been developed in the scheme for selection of the cities. The major
activities of the programme are
Preparation of master plan
Setting up of „Solar City Cell‟ in the city
Organize training programme /workshops/business meets/awareness camps etc.
Preparation of proposals for carbon financing and
Organizing publicity and awareness campaign through media.
The indicative guidelines for preparation of master plan are given as following;
a. Projection for energy demand and supply for 10 years
Sector wise, including hotels, school and colleges, hospitals etc.
Total
b. baseline of energy utilization & GHG emissions
Residential
Commercial / industrial
Institutional
Municipal Services
GHG Emission
c. Energy Planning (Sector wise)
Resources
Option for energy saving & demand reduction
Supply side option based on renewables
Techno-economics of energy conservation & measures
1 http://hareda.gov.in/?model=pages&nid=130

Master plan to develop Faridabad as a “Solar City”
40
d. Year wise goals of saving in conservation energy through demand side management
& supply side measures based on renewables
e. Master Plan for achieving the set goals and expected GHG abatements
f. Budget estimates and potential sources of funding from respective sources (both
public and private)
„GRIHA‟ scheme
GRIHA is an indigenous green building rating system developed for the Indian construction
scenario. It was developed by The Energy and Resources Institute (TERI) and has now been adopted by the Ministry of New and Renewable Energy (MNRE) as the National Green
Building Rating System for India. GRIHA incorporates within itself various other building
codes and guidelines like the National Building Code, Energy Conservation Building Code, Ministry of Environment and Forests clearance for construction, Pollution Control
guidelines by the Central Pollution Control Board etc.
GRIHA is a rating system which assesses the environmental performance of buildings on a scale of 0-104 points with a minimum of 50 points required for a building to be certified a
GRIHA building. On the basis of number of points scored, a building can be rated between 1
& 5 stars, I star being the lowest and 5 star being the highest level of environmental performance. GRIHA evaluates green building performance on the basis of various aspects
like water and waste management, energy, site preservation, indoor comfort and air quality
and innovation points. The maximum weight is given on the points for energy, 43 out of a total of 104 points are dedicated towards energy. There are three broad aspects within
energy which are tackled in GRIHA namely:
1. Embodied Energy: This is the energy which goes into the construction of the building and building materials. This usually forms almost 20% of the total energy consumed
by buildings over their complete life cycle. Thus using low energy materials which
are locally available for construction and have low embodied energy leads to energy savings.
2. Operational Energy: This constitutes almost 80% of the total energy consumed by
buildings over their entire life. At present most of the initiatives being taken up by various stakeholders are dedicated towards reducing the operational energy
requirement of buildings by adopting various energy efficiency measures. Various
features like solar passive building design and mechanical systems with high energy efficiency can help in reducing the amount of energy required during the operation
of the building.
3. Renewable Energy: After reducing the energy requirement of the building, the next step is to ensure that this energy has least possible carbon footprint. Renewable
sources of energy like solar power, wind power etc. assist in providing energy to
buildings and reduce the amount of energy required from conventional sources, thereby further reducing their carbon footprint and GHG emissions.
Site preservation and reduction the negative impacts of site interventions form the next most
important aspect of GRIHA. The process of constructing buildings has a negative impact on the site and its surrounding habitat. Construction of buildings leads to destruction of
habitat, loss of fertile soil, felling of trees etc. There are various criteria within GRIHA
dedicated towards ensuring that the impact of constructing the building on a particular site

3. National and international practices
41
is minimized. Various aspects like site selection, top soil preservation, air pollution control,
tree plantation, reduction of heat island effect are taken into consideration.
GRIHA also covers aspects of green buildings like waste and water management. There are
various standards to follow in order to reduce building water consumption while
simultaneously recycling water and recharging ground aquifers. GRIHA lays emphasis on the various national water quality standards as well. Waste is required to be managed,
recycled, reused and appropriately and sensitively disposed. A green building which is
unable to provide good comfort levels to its users and creates an unhealthy environment for them is not desirable. Thus GRIHA has criteria dedicated towards maintaining good indoor
comfort levels and air quality.
GRIHA as a rating tool emphasizes upon using traditional construction techniques and knowledge in order to construct green buildings. This promotes and encourages the
principles of traditional building systems which have been gathered and refined over
centuries. Another unique feature of GRIHA is that it rates non air-conditioned, semi air-conditioned as well as fully air-conditioned buildings. This promotes the use of natural
ventilation as a design strategy breaks the paradigm that green buildings are necessarily air-
conditioned.
Renewable energy
The policy directives for promotion of renewable energy prescribed by
MNRE/HAREDA/MCF are as follows.
Solar photovoltaic systems
New and emerging applications of SPV technology and other applications will be
supported on case-to-case basis.
For the purchase of Solar Photovoltaic (SPV) systems and power plants, soft loans are
offered. The scheme is implemented through IREDA and designated banks.
Streetlight Solar Control Systems: MNRE supports municipal corporation to install a maximum of 20 numbers of `Streetlight Solar Control Systems‟ of 5 Wp SPV module
capacity; with up to 100 streetlights per system, with a grant limited to 25% of the
cost (or Rs.5, 000 per system).
Dusk-to-dawn solar street lighting systems: Solar street lighting systems of 74/75Wp
SPV modules and 11 W/ 18 W CFLs are supported with MNRE grant limited to 50%
of the cost (or Rs.10,000 for 11 W CFL/Rs. 12,000 for 18 W CFL, whichever is less). Maximum 100 streetlights per Municipal Corporation will be supported.
Solar illuminated hoardings: Solar PV systems up to 1 kWp of SPV module capacity
illuminating a minimum of 2 sq.m. of hoarding area, at least for 6 hours, are
supported with MNRE grant limited to 50% of the cost (or @ Rs. 15,000/100Wp
hoarding, whichever is less). A maximum of 20 such hoardings will be supported per
Municipal Corporation.
Solar Traffic Signals: Solar traffic systems with minimum 500 Wp SPV modules for
four- road junctions will be supported with MNRE grant limited to 50% of the cost
(or Rs.2.5 lakhs whichever is less). A maximum of 5 such systems per state capital will be supported.

Master plan to develop Faridabad as a “Solar City”
42
Solar Blinkers: Solar Blinkers with minimum 37 Wp module capacity and 24 hour
operation will be supported with MNRE grant limited to 50% of the cost (or Rs.7,500, whichever is less). A maximum of 100 solar blinkers will be supported.
Solar water heating systems
Soft loan up to 85% of solar water heating system cost is available from the Indian Renewable Energy Development Agency (IREDA) and designated banks, for a
maximum of 5 years duration. The applicable rate of interest is
2% to domestic users
3% to institutional users not availing accelerated depreciation
5% to industrial/commercial users availing depreciation
Capital Subsidy of Rs 825 per sq. m for commercial establishments and Rs 1100 per
sq. m for institutions is available as Central Financial Incentives from MNRE
The Haryana State Govt. is providing a rebate in the electricity bills to the users of
solar water heating systems in the domestic sector @ Rs. 100/- per 100LPD capacity solar water heating system per month upto 300 LPD capacity. The rebate shall be of
Rs. 1200/- annually for 100 LPD systems, Rs. 2400/- for 200 LPD systems and Rs.
3600/- for 300 LPD systems. This rebate would remain effective for a period of 3 years. In addition to above state subsidy, the MNRE, GOI capital subsidy at Rs. 3300
per sq. meter in case of FPC and at Rs. 3000 per sq. meter in case of ETC based
system limited to 30% of the system cost shall also be admissible on installation of SWHS in domestic sector1.
Roof Top Solar PV systems for diesel abatement
To promote Solar Power Generation, Ministry of New & Renewable Energy (MNRE), Govt. of India has launched Jawaharlal Nehru National Solar Mission (JNNSM). Under this
mission, besides Solar Power Generation in MW scale, SPV rooftop power plants of
maximum capacities ranging upto 100 kWp for the industries, commercial buildings and individuals households can be promoted under the guidelines of scheme named “Off grid
Decentralized Solar Applications Programme”. It is proposed to promote the roof top solar
power plants and solar hybrid inverters for diesel abatement in industrial, commercial and domestic sectors in the solar cities.
The MNRE, will provide Central Financial Assistance (CFA) @ Rs. 57/- per watt (without
battery backup) and Rs. 81/- per watt (with battery backup).
The State government will provide Rs. 33/- per watt for both the categories and the
remaining cost shall be borne by the beneficiaries.
Generation based incentives scheme of MNRE
MNRE is actively promoting the establishment of grid connected solar power plants of large
capacity (megawatt scale) by providing generation based incentives for the first time. The
purpose is to develop and demonstrate the technical performance of grid-interactive solar power generation so as to bring down the cost of the grid connected solar systems. The
silent features of the incentive schemes are as following;
1 http://hareda.gov.in//store/document/hareda159105988.pdf

3. National and international practices
43
a. MNRE may provide, via IREDA (Indian Renewable Energy Development Agency), a
generation based incentive of Rs 12.41 per kWh to the state utilities that would directly purchase solar power from eligible projects; the cost paid to the project
developers would be 17.91 per kWh, who have successfully commissioned the
project by 31st December 2009. This will be done after taking into account the power purchase rate (per kWh) provided by the SERC (State Electricity Regulatory
Commission) or a utility for that project.
b. Further the incentive will continue to decrease, as and when the utility signs a PPA (power purchase agreement) for power purchase at a higher level. The proposad
annual escalations agreed with the utility, as in force, should be reflected in the PPA.
c. The incentive approved for a project may be available for a maximum period of 25 years from the date of approval and regular power generation from the project. This
will be subject to the condition that the utility under consideration continuous to
purchase power from the grid-interactive power plant.
Special Area Development Scheme for 2009-10 of MNRE
The objective of the programme would be to create publicity of the renewable energy
technologies, systems and also to disseminate information on technological developments and promotional activities taking place in the area of the New and Renewable energy. Under
Special Area Demonstration Project Scheme, additional components has been introduced on
demonstration of Renewable Energy Systems/devices at places of National and International Importance, at centralized kitchens and at roadside eating joints and
restaurants where large flow of people and tourists takes place every day with an
objective to popularize the renewable energy system and devices to create greater awareness.
The Special Area Demonstration Project Scheme is proposed to be implemented into two
parts firstly the Modified Energy Park Scheme and secondly the SADP scheme;
Energy Park Scheme
The Scheme was initiated with the objectives of demonstration of various new and
renewable sources of energy technologies and creation of awareness and publicity amongst students, teachers, rural and urban masses about the use and benefits of renewable energy
systems and devices. Two types of Energy Park projects, namely, State level and District
level, were propagated under the Scheme.
Demonstration of Renewable Energy Systems at Prominent Places
Under Special Area Demonstration Project (SADP) Scheme, additional components has been
introduced on demonstration of Renewable Energy Systems/devices at places of National
and International Importance, at centralized kitchens and at roadside eating joints and
restaurants where large flow of people and tourists takes place every day. The objective is
to popularize the renewable energy system and devices to create greater awareness. The scheme will have following three components:
Demonstration of Renewable Energy Systems at places of National and Inter
National Importance
Demonstration of Renewable Energy Systems and devices at Centralised kitchens.

Master plan to develop Faridabad as a “Solar City”
44
Demonstration of Renewable Energy Systems at roadside eating joints, and
restaurants.
The Central Financial Assistance will be provided by the Ministry up to 50% of the cost of
biomass based/ solar cooking system, recovery and use of biogas from kitchen
waste/effluent treatment plant, solar hot water systems in case of government/ state / autonomous bodies / NGOs and up to 25% of the cost in case of private bodies.
Implementation Arrangements
Demonstration of Renewable Energy Systems/devices at places of National and International Importance
Demonstration of Renewable Energy Systems/devices at centralized kitchens.
Demonstration of Renewable Energy Systems/devices at roadside eating joints, and restaurants.
The implementation of the proposed component will be carried out through State Nodal
Agencies. The beneficiary organizations will be responsible for operation and maintenance of the systems and devices installed in these locations. A five year AMC contract with the
turnkey contractor is mandatory.
25% of the funds will be released at the time of the approval of the project proposal. Another 50% of the eligible CFA will be released on receipt of the equipment/devices. The balance
25% amount will be released after successful commissioning of the project and submission
of UC for the funds already released, SOE and the project completion report. The administrative charges will be released at the time of release of the third instalment of CFA,
on commissioning of the system.
The Ministry will regularly monitor progress of implementation of the projects through SNA, officers of the Ministry or any other organization authorized by MNRE.
JNNSM
Jawaharlal Nehru National Solar Mission is a major initiative of the Government of India and State Governments to promote ecologically sustainable growth while addressing India‟s
energy security challenge. It will also constitute a major contribution by India to the global
effort to meet the challenges of climate change.
To create an enabling policy framework for the deployment of 20,000 MW of solar
power by 2022.
To ramp up capacity of grid-connected solar power generation to 1000 MW within three years – by 2013; an additional 3000 MW by 2017 through the mandatory use of
the renewable purchase obligation by utilities backed with a preferential tariff. This
capacity can be more than doubled – reaching 10,000MW installed power by 2017 or
more, based on the enhanced and enabled international finance and technology
transfer. The ambitious target for 2022 of 20,000 MW or more, will be dependent on
the „learning‟ of the first two phases, which if successful, could lead to conditions of grid-competitive solar power. The transition could be appropriately up scaled, based
on availability of international finance and technology.
To promote programmes for off grid applications, reaching 1000 MW by 2017 and 2000 MW by 2022.

3. National and international practices
45
To achieve 15 million sq. meters solar thermal collector area by 2017 and 20 million
by 2022.
To deploy 20 million solar lighting systems for rural areas by 2022.
The targets of the JNNSM covers roof top solar PV, large solar PV and solar collectors for
supplying heat for thermal energy applications; which can be aligned with the tasks of solar city as much as possible and depending upon feasibility, financial viability and degree of
reliability.
JNNURM
The Jawaharlal Nehru National Urban Renewal Mission (JNNURM) is a project of the
central government. Through this project, the central government will fund cities for
developing urban infrastructure and services. The cities will have to carry out mandated reforms in return. The aim is to encourage reforms and fast track planned development of
identified cities. Focus is to be on efficiency in urban infrastructure and service delivery
mechanisms, community participation, and accountability of ULBs / Parastatal agencies towards citizens.
The mission will last for a period of seven years starting December 2005. The total central
government funding will be Rs. 50,000 crores. Adding the contribution of states and municipalities, the amount will go up to to Rs. 1,25,000 crores over the seven year period.
The objectives of the JNNURM are to ensure that the following are achieved in the urban
sector;
a. Focused attention to integrated development of infrastructure services in cities
covered under the Mission
b. Establishment of linkages between asset-creation and asset-management through a slew of reforms for long-term project sustainability
c. Ensuring adequate funds to meet the deficiencies in urban infrastructural services
d. Planned development of identified cities including peri-urban areas, outgrowths and urban corridors leading to dispersed urbanisation
e. Scale-up delivery of civic amenities and provision of utilities with emphasis on
universal access to the urban poor
f. Special focus on urban renewal programme for the old city areas to reduce
congestion
The JNNURM is designated to support;
a. Water supply including setting up of desalination plants
b. Sewerage and sanitation
c. Solid waste management including hospital waste management
d. Construction and improvement of drains and storm-water drainage system
e. Road network
f. Urban transport
g. Construction and development of bus and truck terminals
h. Renewal and re-development of inner city areas

Master plan to develop Faridabad as a “Solar City”
46
i. Development of heritage areas
j. Preservation of water bodies
k. Integrated development of slums
l. Provision of basic services to the urban poor &
m. Street lighting
Thus, it is clear that there exist many provisions that empower Municipal Corporation,
Faridabad, to translate solar city integrated plan in to action. This is further facilitated by the
existing policy directives for the promotion of energy conservation and renewable energy.

47
44.. EEnneerrggyy bbaasseelliinnee ooff FFaarriiddaabbaadd
Energy baseline is essentially the amount of energy that would be consumed annually
without implementation of energy conservation measures based on historical metered data, engineering calculations, sub metering of buildings or energy consuming systems, building
load simulation models, statistical regression analysis, or some combination of these
methods. Baseline study is essential to study the energy conservation measures in a city based on the profile of energy consumption under Business as Usual scenario (BAU). This
chapter focuses on the present energy consumption in residential, commercial and industrial
sector with its overall energy consumption scenario for Faridabad.
Figure 4.1(a) Map of Faridabad District1
About the city
Faridabad is the biggest urban agglomeration of Haryana consisting of old municipal towns
of Faridabad, Ballabhgarh, new industrial town along with 38 revenue villages.
1 http://www.mapsofindia.com/maps/haryana/faridabad.htm

Master plan to develop Faridabad as a “Solar City”
48
It is a south-eastern town in the state of Haryana; which is the most populated and
industrialized city in the whole of Haryana. Faridabad alone generates about 60 percent of the revenues of Haryana with its large number of industrial units.
On the front of agriculture, Faridabad was famous for production of Heena, but now days it
has left with very limited production. Tractors, motorcycles, switch gears, refrigerators, shoes and tyres are other well-known industrial products of the city. Economy of Faridabad
is more or less dependent on Industry. The Badkhal Lake tourist complex, the Suraj Kund
Tourist Complex, the Aravali Golf Club, the Raja Nahar Singh Palace and Dabchick are famous tourist spots of the city. The map of Faridabad district is presented in Figure 4.1(a);
while Figure 4.1(b) presents the city map of Faridabad.
Figure 4.1(b) City Map of Faridabad1
Geography
Faridabad is situated on the Delhi–Mathura National Highway No- 2 at a distance of 32 km.
from Delhi, at 28o 25' 16" North latitude and 77o 18' 28" East longitude. The town is bounded
on the north by Delhi State, Palwal district on South, by Agra and the Gurgaon canals on the east and by the Aravali Hills on the west. The Yamuna flows very near to the city at its
northern side and moves away as it goes south.
Climate
Faridabad is located in the „Composite Climatic Zone1‟ of India. The city experiences a semi-
arid climate which is characterized by wide temperature variations and scanty and irregular
1 http://faridabad.nic.in/maps.htm

4. Energy baseline of Faridabad
49
rainfall. During summer, temperature may reach up to 450 C in June while in winter it drops
to 1.90 C in February. May and June are the hottest and driest months, when dust storms from the west prevail with high speed. The average wind velocity is 2.1 km/hours during
June and 1.3 km. /hour during November. The relative humidity is maximum during
August (up to 84 percent) and minimum during May (up to 16 percent).
The average annual rainfall recorded at the Faridabad rain gauge station is 845 mm as
computed from the data of 1978 to 1997. Maximum rainfall occurs during July to September
on account of the south – east monsoon. The number of actual rainy days varies between 7 and 22 in a year. Table 4.1 presents the monthly pattern of meteorological parameters in
Faridabad.
Table 4.1 Meteorological Parameters of Faridabad2
Month Air
temperature
(oC)
Relative
humidity
(%)
Wind
speed
(10 m)
Earth
temperature
(oC)
January 13.4 51.8% 2.2 14.1
February 16.6 46.3% 2.5 18.2
March 22.7 36.0% 2.7 25.9
April 28.1 31.4% 3.1 32.8
May 31.2 38.2% 3.2 36.3
June 31.7 53.3% 3.2 36.1
July 29.2 74.7% 2.7 31.3
August 28.0 79.0% 2.3 29.2
September 26.8 71.9% 2.2 28.0
October 23.8 52.9% 1.7 25.1
November 19.3 42.3% 1.4 20.1
December 14.8 47.9% 1.9 15.2
Annual 23.8 52.1% 2.4 26.0
In order to identify the energy conservation potential in Faridabad, it is important to
understand the profile of energy consumption under the Business As Usual (BAU) scenario. This chapter focuses on the present energy consumption in residential, commercial and
industrial sectors of the city with its overall energy consumption scenario. Electricity,
Kerosene and LPG have been taken base case as energy options for the study.
Population
The population of Faridabad has been reported as 10, 55,968 as per census 2001. Figure
4.2(a) graphically presents the cumulative population of Faridabad up to 2001, which shows
gradual increase trend in the population over the last four decades. The decreasing trends of
population growth rate have been observed as 171.2 percent in 1971, 88.9 percent in 1981,
68.9 percent in 1991 and 51.2 in 2001 in Faridabad.
1 There are six climatic zones in India namely composite (i.e. New Delgi, Indore), hot & dry (Jodhpur, Jaiselmer), warm & humid (Chennai, Mumbai), cold & cloudy (Shimla, Srinagar), cold & sunny (Leh) and moderate (Pune). 2 NASA Surface meteorology and Solar Energy: RETScreen Data

Master plan to develop Faridabad as a “Solar City”
50
Figure 4.2(a) Population growths in Faridabad from 1961 to 20011
Figure 4.2(b) Population density in Faridabad from 1961 to 20012
The population density is very high in the district; and still increasing. Presently around 45%
of the population of the city is living in slums. The trends of population growth of last four decades are presented in Figure 4.2(b). Presently the population density3 of the city is more
than 6000 persons/km2; which was 3466 during 1991.
1 Census of India 2001 2 Census of India 2001 3 http://www.spaenvis.nic.in/pdfs/city-profiles/faridabad.pdf

4. Energy baseline of Faridabad
51
Land use pattern
The city has a clearly defined linear shape due to its evolution along the linear and parallel transit corridors. There are large industrial plots lined up along both sides of these corridors.
Land use picture of the city of last three decades is presented in Table 4.2; which shows that
the residential sector land is slightly reducing while industrial and commercial sector are improving.
Table 4.2 Changing land use structure in the city1
Category 1981 1991 2001 2011*
Value % Value % Value % Value %
Residential 5500 52.9 14703 55.2 16450 51 19262 49.7
Industrial 1530 14.7 5118 19.2 6335 19.7 7749 20
Commercial 440 4.2 1088 4.1 1536 4.7 1910 4.9
Public/Semi
public
380 3.6 388 1.4 1100 3.4 1310 3.4
Utilities 110 1.0 120 0.5 323 1.0 382 1.0
Recreation/Green
space
675 6.6 1859 7 2250 7 3199 8.2
Transport 755 7.3 2271 8.5 2150 9.8 3840 10
Special Zone 1000 9.7 1091 4.1 1091 3.4 1091 2.8
Total 10390 100 26638 100 32235 100 38743 100
Faridabad city covers an area of approximately 178 km2 (i.e. 43984.58 acres). The city is
connected with south part of New Delhi and a good amount of area of Faridabad has been
included in National Capital Region (NCR). The city has more than half of total area for residential sector (51%), followed by industrial sector (19.7%). In addition 25.42 km2 of hilly
catchments area is declared as Wildlife Sanctuary. The other sectors namely commercial
(4.7%), transportation (9.8%), recreation & green space (7%) etc. cover around 30% of the area. The land use pattern of Faridabad city is presented in Figure 4.3.
The City Development Plan of Faridabad prepared by JNNURM has proposed an area of
19262 acres/77.95 km2 reserved for residential purposes on the basis of average residential density of 90 persons per area. However the proposed residential density for the residential
sectors adjoining the industrial areas was fixed at 120 persons per acre to accommodate the
population of the Economical Weaker Section (EWS) and Low Income Group (LIG). In addition an area of 1910 acre (7.73 km2) is proposed for commercial and 7749 acres (31.36
km2) for industrial sectors respectively.
1 Revised Master Plan, 1991 and Town Planning Department, Faridabad, *2011 values are proposed land use

Master plan to develop Faridabad as a “Solar City”
52
Figure 4.3 Land use pattern of Faridabad1
Grid availability
Faridabad city has good electrical transmission system. Faridabad division of Dakshin
Haryana Bijli Vitran Nigam (DHBVN) has distributed Haryana state in district circles. Faridabad circle comprises Old Faridabad, OP Faridabad, and Ballabhgarh substations.
Table 4.3 presents the division wise sub-stations of Faridabad district.
Table 4.3 Sub-stations in Faridabad Circle2
S.
No.
Name of
Division
No. of S/Stn. In kV Total
400 220 132 66 33
1 Old
Faridabad
- 1 - 7 2 10
2 OP
Faridabad
- - - 4 - 4
3 Ballabhgarh 1 2 - 11 1 15
Total 1 3 22 3 29
The electricity grid-map of Faridabad city is presented in Figure 4.4.
1 City Profile of Faridabad, Revised Master Plan, 1991 and Town Planning Department, Faridabad 2 www.dhbvn.com

4. Energy baseline of Faridabad
53
Figure 4.4 Grid Map of Faridabad1
Electricity consumption scenario
The electricity consumption of Faridabad is being met from different Central/State
Generating stations2. The connected load of Faridabad is mainly because of industries.
In order to estimate per capita electricity availability the ratio of electricity supplied and
population gives an overestimated number which is due to large fraction of electricity consumption by industries. Hence the per capita electricity consumption has been taken
similar as it is for Haryana state; which seems realistic.
1 www.dhbvn.com, Faridabad 2 http://www.pppinindia.com/infrastructure-haryana.asp

Master plan to develop Faridabad as a “Solar City”
54
Faridabad city has continuously increasing Human Development Index1, (0.36 in 1981, 0.44
in 1991 and 0.51 in 2001) quality of life and e-readiness; hence per capita electricity consumption of the city is also increasing in the city.
The per capita consumption of electricity in Faridabad has increased from 501 kWh in 2001
to 700 kWh in 2007-08; which is slightly better than the average consumption of the country. Figure 4.5 presents the pattern of per capita electricity consumption in Faridabad from the
year 2000 to 2006.
The major energy consuming categories of the city are industrial, residential, commercial/Institutional (offices and shops), agricultural, and others including municipal
services and transport. In the energy baseline study, all the above sectors except
transportation have been considered. For this energy consumption study, the electricity consumption details for three zones namely NIT, Old Faridabad and Ballabhgarh Urban
area has been collected from DHVVN offices. The data collected involves the annual
electricity supplied by DHBVN in these three zones under the following categories a) Domestic b) Non-Domestic or commercial c) industrial d) street lighting e) water pumping f)
agricultural and others. The details of the data provided by these three DHBVN offices for
their respective zones are given in Annexure-1. Within the selected sectors i.e. residential, commercial and municipal services, the major energy sources are electricity, LPG, and
kerosene. The petroleum products (LDO, Diesel etc.) are mainly used in transportation
sector followed by industries. Figure 4.6, Figure 4.7 and Figure 4.8, depicts sector wise unit (kWh) consumption of electricity in NIT, Ballabhghar and Old Faridabad region of
Faridabad respectively for three consecutive years.
Figure 4.5 Per capita electricity consumption at Faridabad
1 The Human Development Index (HDI) is an index used to rank countries by level of "human development", which usually also implies to determine whether a country is a developed, developing, or underdeveloped country. http://ncw.nic.in/pdfreports/Gender%20Profile-Haryana.pdf
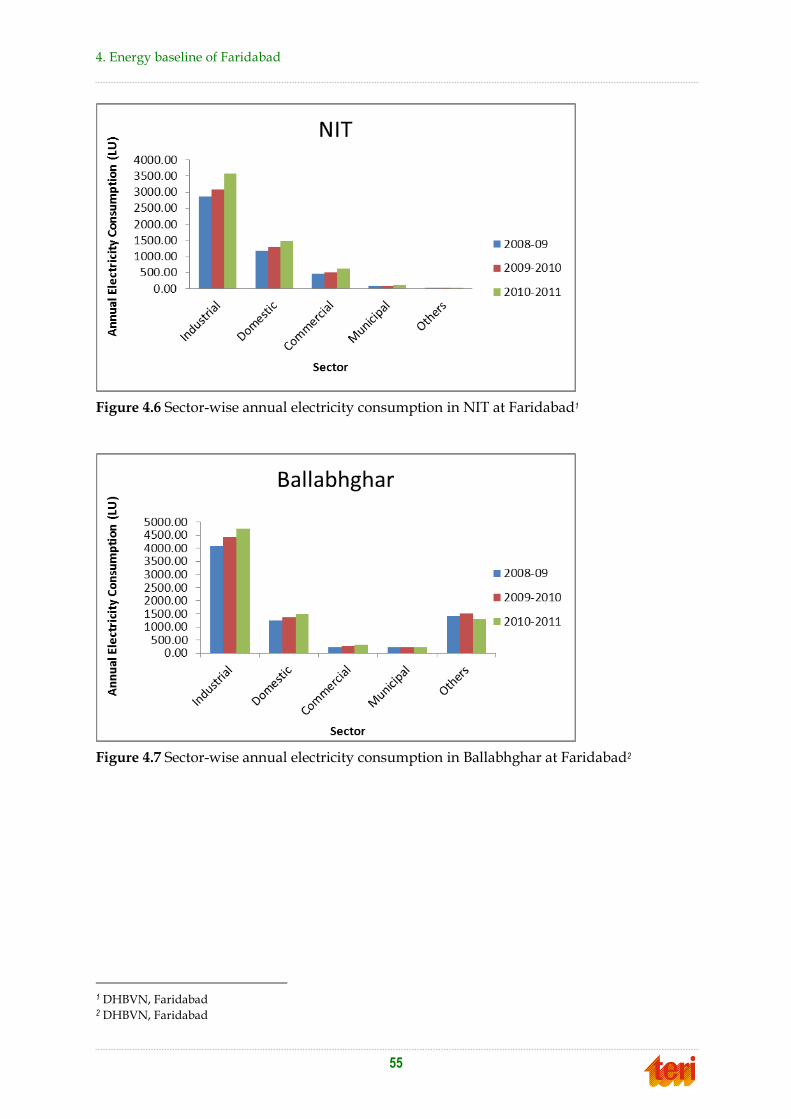
4. Energy baseline of Faridabad
55
Figure 4.6 Sector-wise annual electricity consumption in NIT at Faridabad1
Figure 4.7 Sector-wise annual electricity consumption in Ballabhghar at Faridabad2
1 DHBVN, Faridabad 2 DHBVN, Faridabad
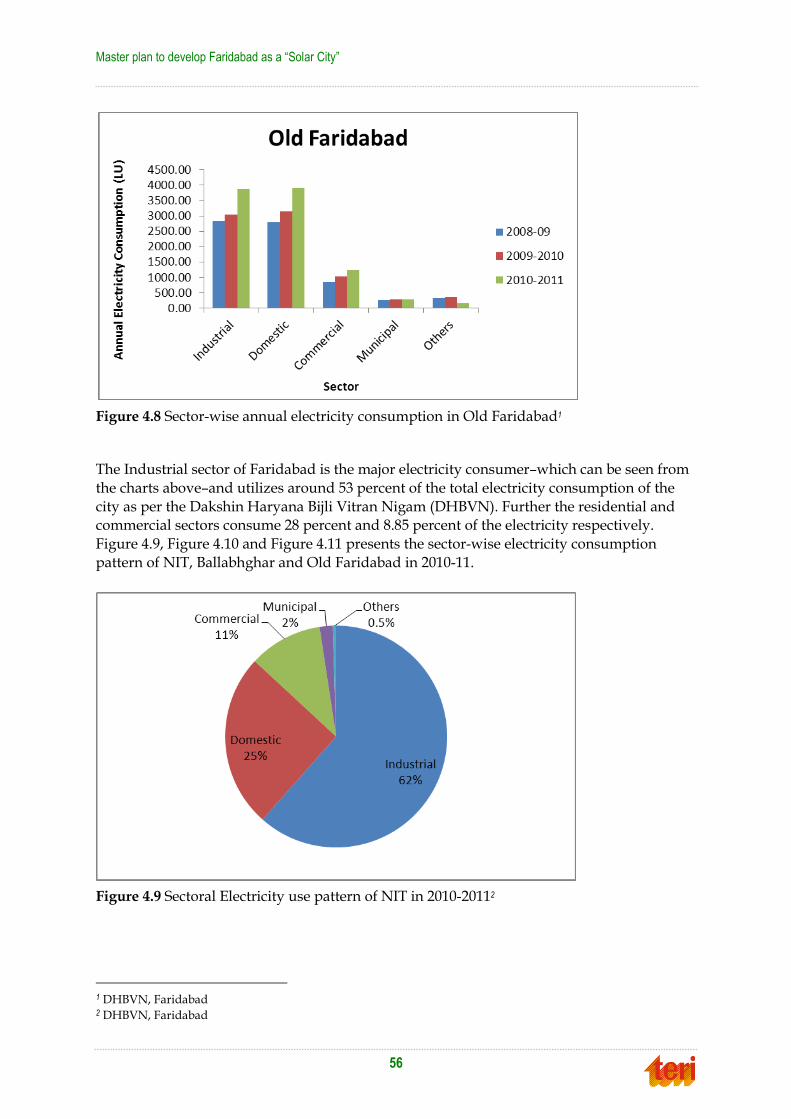
Master plan to develop Faridabad as a “Solar City”
56
Figure 4.8 Sector-wise annual electricity consumption in Old Faridabad1
The Industrial sector of Faridabad is the major electricity consumer–which can be seen from
the charts above–and utilizes around 53 percent of the total electricity consumption of the
city as per the Dakshin Haryana Bijli Vitran Nigam (DHBVN). Further the residential and commercial sectors consume 28 percent and 8.85 percent of the electricity respectively.
Figure 4.9, Figure 4.10 and Figure 4.11 presents the sector-wise electricity consumption
pattern of NIT, Ballabhghar and Old Faridabad in 2010-11.
Figure 4.9 Sectoral Electricity use pattern of NIT in 2010-20112
1 DHBVN, Faridabad 2 DHBVN, Faridabad

4. Energy baseline of Faridabad
57
Figure 4.10 Sectoral Electricity use pattern of Ballabhghar in 2010-20111
Figure 4.11 Sectoral Electricity use pattern of Old Faridabad in 2010-20112
As shown in Figure 4.12, Figure 4.13 and Figure 4.14, the annual electricity consumption of
NIT, Ballabhghar and Old Faridabad regions of Faridabad is growing. The total electricity
consumption has been reported as 2336.11 MU during 2010-11. The daily average power requirement was reported to be around 6.4 MU.
1 DHBVN, Faridabad 2 DHBVN, Faridabad

Master plan to develop Faridabad as a “Solar City”
58
Figure 4.12 Annual electricity consumption in NIT (LU)1
Figure 4.13 Annual electricity consumption in Ballabhghar (LU)2
1 DHBVN, Faridabad 2 DHBVN, Faridabad

4. Energy baseline of Faridabad
59
Figure 4.14 Annual electricity consumption in Old Faridabad (LU)1
Residential sector
Faridabad has mixed kind of income groups as some part of the city is developed under
master plan and whereas other are not well planned and has high population density.
According to Census 2001 there are 200659 houses in Faridabad2; out of which 177020 are permanent, 16279 are semi-permanent, and 6901 are temporary. Figure 4.15 presents the
categories of census houses of Faridabad; which indicates that around 88.2 percent houses
are permanent type, 8.34 percent are semi-permanent and around 3 percent are temporary.
Figure 4.15 House type pattern of Faridabad3
1 DHBVN, Faridabad 2 www.censusindia.net 3 Census of India 2001

Master plan to develop Faridabad as a “Solar City”
60
Distribution of census houses
As pet the census 2001, it has been noticed that residential sector comprises more than 95 percent houses of the city followed by 5 percent by residence-cum-other-use category. Out
of 200659 houses, 192545 houses are being used for residential purposes; while 8114 houses
are in use for residence-cum-other-uses.
The distribution of total households of the city has been made on the basis of number of
members and numbers of dwelling room in the house. The city has maximum one dwelling
room houses (37.68 %) followed by two rooms (28.71%), three rooms (16.13 %, four rooms and above (8.36 %) and above (9.11%). It has been observed that the average family size
(population divided by number of households) of the city is around 5.3 persons per
household.
Figure 4.16 presents the distribution of houses in Faridabad by number of dwelling rooms,
which indicates that out of 200659 census houses 75613 house are of one room followed by
57616 of two rooms etc.
Figure 4.16 Distributions of households by number of dwelling rooms1
The distribution of households by family size has been presented in Figure 4.17; which
indicates that six members family size are maximum in the city followed by five members,
and four and three members etc.
1 Census of India 2001

4. Energy baseline of Faridabad
61
Figure 4.17 Distribution of households by family sizes1
Status of electrification
The residential houses of the Faridabad city are almost fully electrified. As there are 200659
total number of households in the city; out of which 86.06 percent were electrified in 2001 (as
per census of India 2001); and using electricity for lighting application. Kerosene (12.57%) was in use for lighting application in rural area of the city. Figure 4.18 present the
distribution of households by source of lighting as per Census 2001. With the increased rate
of electrification in the city it can be considered that almost 100% households have been
electrified and the kerosene use have been abolished.
Figure 4.18 Distribution of households by source of lighting
1 Census of India 2001

Master plan to develop Faridabad as a “Solar City”
62
The residential (domestic) sector of Faridabad is one of the major energy consuming sectors
which consume 28 percent of its total annual electricity consumption. The electricity consumption in residential sector of Faridabad is rapidly increasing; as it has been shown in
Figure 4.19, the rising consumption of electricity in in Faridabad. The aggregate electricity
consumption in residential sector of the three regions in Faridabad was reported as 6888.84 LU in 2010-2011; while it was 5822.86 LU in 2009-2010.
Figure 4.19 Total electricity consumption in the domestic sector of Faridabad1
Figure 4.20 presents the trends of electricity consumption in the residential sectors of three
different zones of Faridabad city.
Figure 4.20 Electricity consumption pattern of domestic sectors in Faridabad
1 Census of India
0
1000
2000
3000
4000
5000
6000
7000
8000
2008-2009 2009-2010 2010-2011
An
nu
al E
lect
rici
ty C
on
sum
pti
on
(LU
)
Year
Annual Electricity consumption in Domestic Sector of Faridabad (LU)

4. Energy baseline of Faridabad
63
Electricity Use Pattern in Residential Sector
The load distribution pattern in residential sector of Faridabad has been assumed similar to a planned city; which shows energy consumption pattern in domestic applications. TERI has conducted surveys in residential sector of three regions in Faridabad, namely – NIT, Ballabhgarh and Old Faridabad. The breakup of electricity consumption in residential sector is presented in Figure 4.21; which shows that cooling and lighting consumes more than 70 percent of the electricity in residential sector.
Figure 4.21 Electricity consumption pattern in residential sector1
In the survey conducted by TERI in different types of residential dwellings, the bottom line
was the floor area and the number of inhabitants. As shown in Figure 4.22, the trend in electricity consumption in the surveyed households – with increase in the floor area (or
inhabitants) the electricity consumption is increasing.
Figure 4.22 Electricity consumption pattern in different types of households 2
1 Residential Survey Results 2 Residential survey results

Master plan to develop Faridabad as a “Solar City”
64
Energy use for cooking application
The residential sector use fuel mix for cooking application in the city. As per census 2001 59.38 percent household use LPG for cooking application, followed by kerosene (17.72
percent), firewood (11.58 percent), etc. The fuel type use pattern for cooking application in
residential sector of Faridabad is presented in Figure 4.23.
Figure 4.23 Fuel type use pattern for cooking in residential sector1
LPG
LPG is being used in most of the houses of the city for domestic/cooking application in the
city. The LPG consumption has been estimated as using a realistic assumption.
As per the census 2001 around 60 percent households were using LPG for cooking
application. There is an effective shift from traditional fuels to LPG in the city due to
following reasons;
Improved supply chain and easy process of getting PLG connections
Improved income levels of users
Rapid urbanization
Assuming 2 LPG cylinders consumption per month for each household of 14 kg each, the
maximum total annual LPG consumption in residential sector of the city has been estimated
to be 67421.42 tonnes for the year 2001. Taking the growth rate of households similar as
population (present annual population growth rate has been estimated as 5.12%) the number
of households has been obtained as 284614 in 2008. Adopting the above approach it has been
obtained that the LPG consumption was 1338824 tonnes for the year 2008.
Presently there are 28 distributor companies working in Faridabad as per Food & Supply
Department.
1 Census of India 2001

4. Energy baseline of Faridabad
65
Kerosene
As per Census 2001, a number of households were surviving below the poverty in the Faridabad and has the BPL cards (this card is issued for the households which are below the
poverty line). Most of these families use Kerosene as prime fuel for cooking application.
Presently there are 762 kilo liters of the monthly demand of kerosene oil in the city1. It shows that the annual kerosene consumption (if assumed at flat rate) is around 9504 kilo liters in
the city.
The electrification status of the city is improving effectively hence people are shifting from kerosene to electricity especially for lighting purposes. In addition, with the increase in the
use of LPG for cooking application in residential sector, the consumption of kerosene is
reducing slightly.
Commercial sector
The commercial sector of Faridabad is small energy consumer as compared with the
industrial and residential sectors. As the commercial consumers are increasing along with the annual electricity consumption in the commercial sector, the per capita electricity
consumption in commercial sector is estimated based on the time from 2006 to 2008. It has
been obtained as 4166 kWh in 2008; while it was 3151 kWh in 2006. The per capita electricity consumption in commercial sector of Faridabad has been presented in Figure 4.24
from the year 2006 to 2008.
Figure 4.24 Per Capita electricity consumption in commercial sector2
1 http://info.faridabadmetro.com/2009/08/08/kerosene-is-a-challenge-for-poor-in-faridabad 2 DHBVN, Faridabad
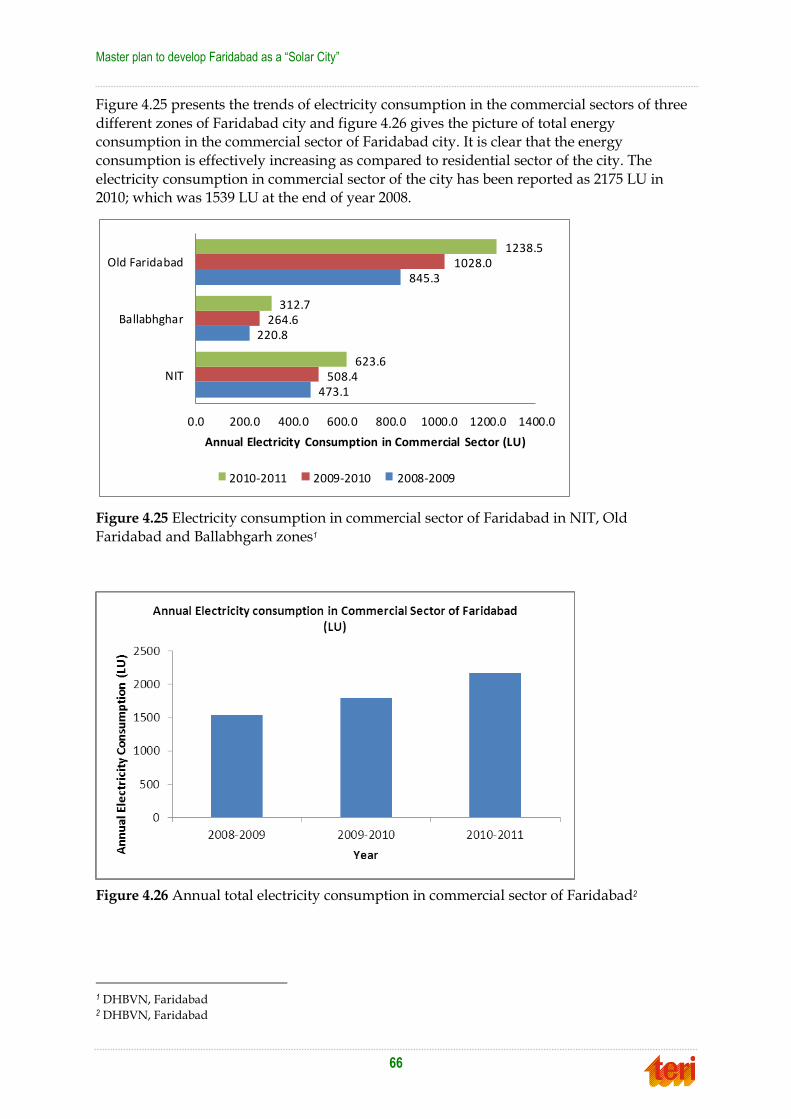
Master plan to develop Faridabad as a “Solar City”
66
Figure 4.25 presents the trends of electricity consumption in the commercial sectors of three
different zones of Faridabad city and figure 4.26 gives the picture of total energy consumption in the commercial sector of Faridabad city. It is clear that the energy
consumption is effectively increasing as compared to residential sector of the city. The
electricity consumption in commercial sector of the city has been reported as 2175 LU in 2010; which was 1539 LU at the end of year 2008.
Figure 4.25 Electricity consumption in commercial sector of Faridabad in NIT, Old
Faridabad and Ballabhgarh zones1
Figure 4.26 Annual total electricity consumption in commercial sector of Faridabad2
1 DHBVN, Faridabad 2 DHBVN, Faridabad
473.1
220.8
845.3
508.4
264.6
1028.0
623.6
312.7
1238.5
0.0 200.0 400.0 600.0 800.0 1000.0 1200.0 1400.0
NIT
Ballabhghar
Old Faridabad
Annual Electricity Consumption in Commercial Sector (LU)
2010-2011 2009-2010 2008-2009

4. Energy baseline of Faridabad
67
Industrial sector
Faridabad is the biggest industrial town of Haryana. The Faridabad-Ballabhgarh-Palwal Industrial Complex occupies a significantly important place on the Industrial map of India
with its own individuality and personality. Faridabad is the 9th biggest industrial town of
India. Initially there were 4-5 industries, however over time this has phenomenally grown to over 250 of small, medium and large scale industries employing 5 lakh people1. It has
various types of industries which are manufacturing products ranging from hypodermic
syringes to huge mechanized Loaders, Tractors, Motorcycles, Air-conditioners, Tyres, Footwear etc. Significant enough are its products like special alloy steel casting, forgings,
vacuum glass flasks, refrigerators, LPG stoves etc. It is also noteworthy that during the last
few years, about 100 units of textiles, dyeing and printing have come up in this Industrial Complex; as a result a large number of garments exporters switched over to Faridabad from
other parts of the country. The combined turnover of these industries is around Rs. 15000
crore2, accounting for about 60% of revenue of Haryana3.
Presently Faridabad can boast of having a large number of foreign collaborations. The range
of products being exported from this district is widening every day and foreign market for
the same is expanding; which is due to the fact that products manufactured here are technically superior and incorporate the latest advanced technology. The products which are
exported from this district are machinery, electric equipment, tractor, industrial units,
helmets, tyres, footwear etc. A large number of industrial units have collaborations with foreign countries apart from wholly owned foreign companies. Figure 4.27 presents the
growth pattern of the industrial sector of Faridabad.
Figure 4.27 Growth pattern on the Industrial Sector of Faridabad
1 Indian Express, Awaiting better connectivity, http://www.expressindia.com/news/print.php?newsid=76916, retrieved on August 19 2009. 2 National Informatics Centre, District Faridabad, http://faridabad.nic.in/, retrieved on August 19 2009. 3 Times of India, Faridabad, http://timesofindia.indiatimes.com/articleshow/msid-831218,prtpage-1.cms, retrieved on August 19 2009.

Master plan to develop Faridabad as a “Solar City”
68
The industrial sector of Faridabad city uses electricity as well as petroleum products as fuel
depending upon the type of industry. Maximum petroleum products are used by industrial and transportation sectors in the city. As per DHBVN data the industrial sector consumes
around 53% of its total electricity consumption. The electricity consumption in industrial
sector was reported as 12195 LU during 2010-2011; which was 10538.65 LU during 2009-2010. Figure 4.28 present the electricity consumption in industrial sector in three different
zones of Faridabad city from 2008-09 to 2010-11. And Figure 4.29 gives the total electricity
consumption by industrial sector in Faridabad city.
Figure 4.28 Electricity consumption in Industrial Sector in NIT, Old Faridabad and
Ballabhgarh Zones of Faridabad city1
Figure 4.29 Annual total electricity consumption in Industrial Sector of Faridabad city2
1 DHBVN, Faridabad 2 DHBVN, Faridabad
0
2000
4000
6000
8000
10000
12000
14000
2008-2009 2009-2010 2010-2011
An
nu
al E
lect
rici
ty C
on
sum
pti
on
(LU
)
Year
Annual Electricity consumption in Industrial Sector of Faridabad (LU)
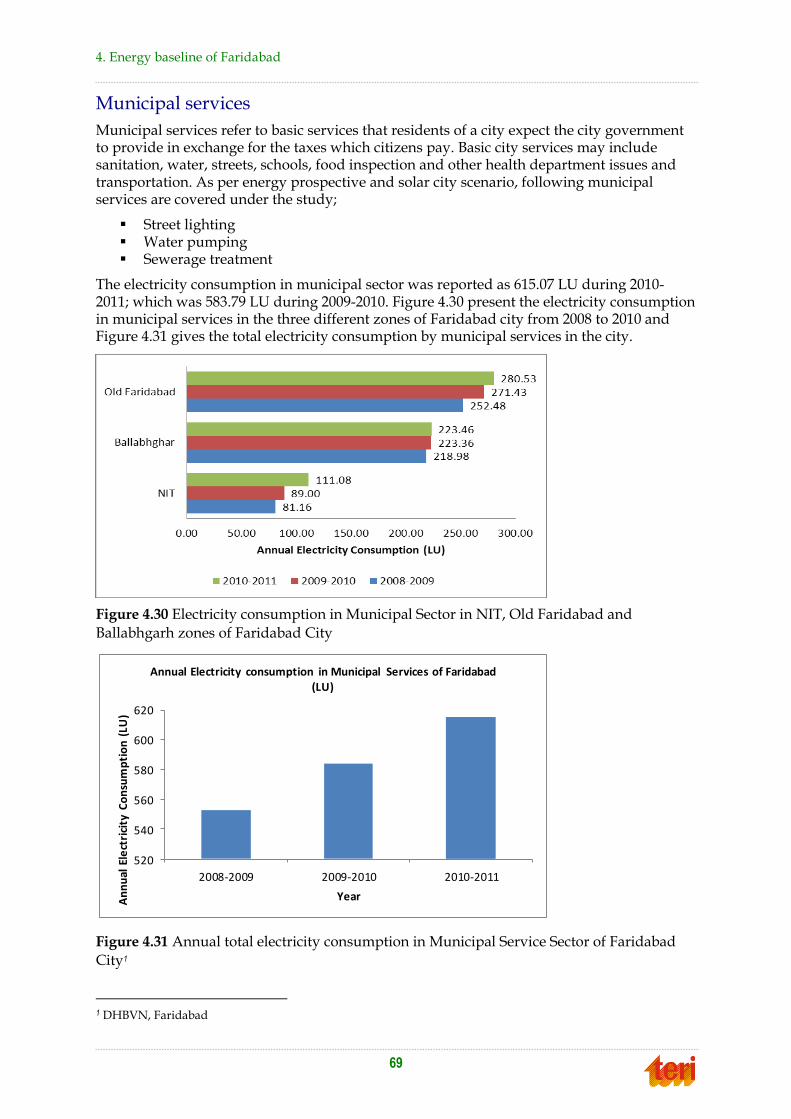
4. Energy baseline of Faridabad
69
Municipal services
Municipal services refer to basic services that residents of a city expect the city government to provide in exchange for the taxes which citizens pay. Basic city services may include sanitation, water, streets, schools, food inspection and other health department issues and transportation. As per energy prospective and solar city scenario, following municipal services are covered under the study;
Street lighting Water pumping Sewerage treatment
The electricity consumption in municipal sector was reported as 615.07 LU during 2010-2011; which was 583.79 LU during 2009-2010. Figure 4.30 present the electricity consumption in municipal services in the three different zones of Faridabad city from 2008 to 2010 and Figure 4.31 gives the total electricity consumption by municipal services in the city.
Figure 4.30 Electricity consumption in Municipal Sector in NIT, Old Faridabad and
Ballabhgarh zones of Faridabad City
Figure 4.31 Annual total electricity consumption in Municipal Service Sector of Faridabad
City1
1 DHBVN, Faridabad
520
540
560
580
600
620
2008-2009 2009-2010 2010-2011
An
nu
al E
lect
rici
ty C
on
sum
pti
on
(LU
)
Year
Annual Electricity consumption in Municipal Services of Faridabad (LU)

Master plan to develop Faridabad as a “Solar City”
70
Street lighting
A detailed survey and energy audit study on street lighting of Faridabad City was carried out by TERI. It has been noticed that the provision and maintenance of streetlights is an
obligatory function of Municipal Corporation; while is also responsible for installation,
replacement, repairs, maintenance of streetlights in the city. Around 1218 km road area is under Municipal Corporation where street lighting is essential.
Figure 4.32 Street lights in Faridabad
Presently there are about 39170 installed street lights by MCF in Faridabad city with
different types of electrical fixtures which comprise of total number of 41978 bulbs/tubelights; out of them around 65 percent of the fixtures are tube lights and 35
percent are high power lamps, including sodium and mercury vapour pressure lamps of
various wattages. There are more street lights in the city which have been installed by HUDA, but the details of the same could not be collected. Table 4.4 presents specifications of
street lighting system installed by MCF;
Table 4.4 Types of street lights used in Faridabad
S. No. Specifications Wattage Number
1 Tube lights (T12) 40W 20468
2 Tube lights 28 w 500
3 Tube lights 36 w 2400
4 Tube lights 4x24 w 560
5 Sodium Vapour Lamp 150 w 575
6 Sodium Vapour Lamp 250 w 12806
7 Compact Florescent Lamp (CFL) 2x11 w 450
8 Compact Florescent Lamp (CFL) 18 w 317
9 Compact Florescent Lamp (CFL) 2x36 w 100
Compact Florescent Lamp (CFL) 2x55 w 100
10 High Mast 400 w 32
11 HPMV 250 w 762
Total 39170
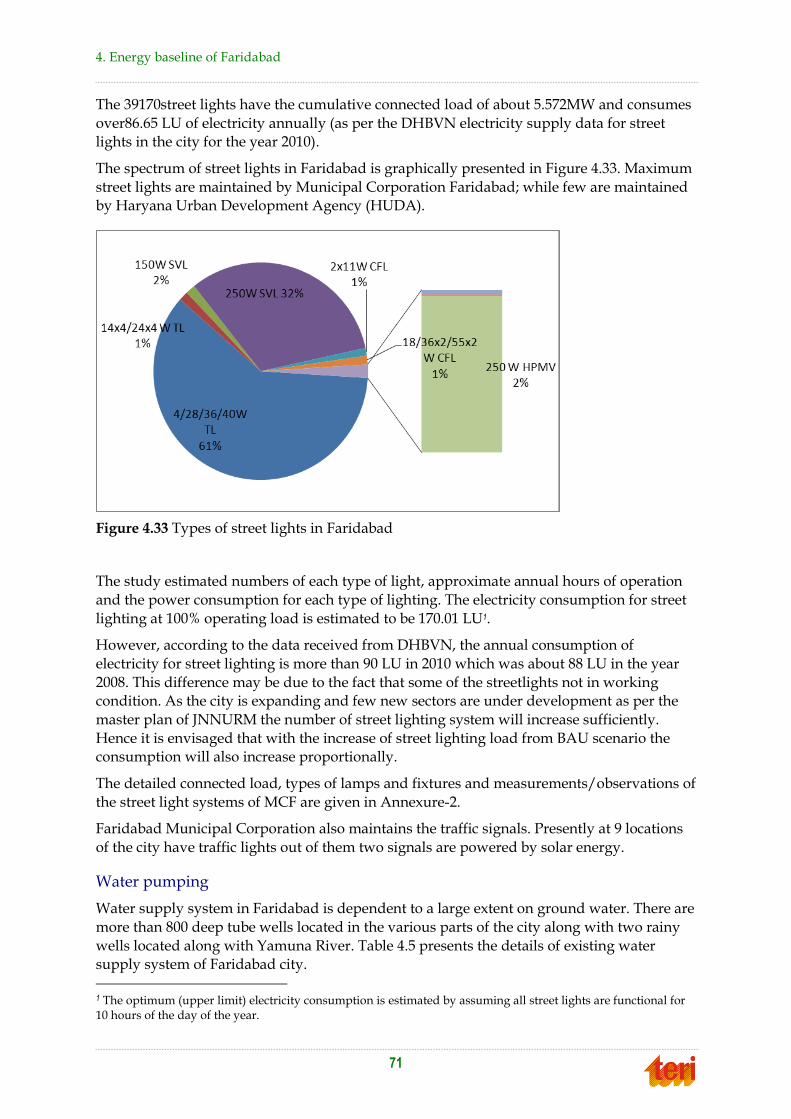
4. Energy baseline of Faridabad
71
The 39170street lights have the cumulative connected load of about 5.572MW and consumes
over86.65 LU of electricity annually (as per the DHBVN electricity supply data for street lights in the city for the year 2010).
The spectrum of street lights in Faridabad is graphically presented in Figure 4.33. Maximum
street lights are maintained by Municipal Corporation Faridabad; while few are maintained by Haryana Urban Development Agency (HUDA).
Figure 4.33 Types of street lights in Faridabad
The study estimated numbers of each type of light, approximate annual hours of operation
and the power consumption for each type of lighting. The electricity consumption for street
lighting at 100% operating load is estimated to be 170.01 LU1.
However, according to the data received from DHBVN, the annual consumption of
electricity for street lighting is more than 90 LU in 2010 which was about 88 LU in the year
2008. This difference may be due to the fact that some of the streetlights not in working condition. As the city is expanding and few new sectors are under development as per the
master plan of JNNURM the number of street lighting system will increase sufficiently.
Hence it is envisaged that with the increase of street lighting load from BAU scenario the consumption will also increase proportionally.
The detailed connected load, types of lamps and fixtures and measurements/observations of
the street light systems of MCF are given in Annexure-2.
Faridabad Municipal Corporation also maintains the traffic signals. Presently at 9 locations
of the city have traffic lights out of them two signals are powered by solar energy.
Water pumping
Water supply system in Faridabad is dependent to a large extent on ground water. There are
more than 800 deep tube wells located in the various parts of the city along with two rainy
wells located along with Yamuna River. Table 4.5 presents the details of existing water supply system of Faridabad city. 1 The optimum (upper limit) electricity consumption is estimated by assuming all street lights are functional for 10 hours of the day of the year.

Master plan to develop Faridabad as a “Solar City”
72
Table 4.5 Water supply system of Faridabad1
S. No. Type Quantity
1 T.Ws with pump chamber 862Nos*
2 Underground Tanks 22 Nos
3 Over Head Service Reservoir
(OHSR)
15 Nos
4 Water Supply Pipeline 910 Kms
5 Ranney Wells 2 Nos
It has been noticed that the cumulative connected load of various tube wells is
approximately 7.4 MW. The total installed capacity of the tube wells is 345 MLD and that of the two rainy wells is 45 MLD, leading to a total capacity of 390 MLD. The city is utilizing
the entire installed capacity to cater to the demands of the residential, commercial and
industrial areas.
Tube wells are drilled to a depth of 200 ft. to 350 ft. and the discharge from the tube well
varies from 2500 gallons per hour to 15000 gallons per hour. The water demand pattern of
the city in various sectors is presented in Table 4.6.
Table 4.6 Water demand pattern of Faridabad2
S. No. Type Quantity
1 Domestic 266 MLD
2 Industrial 20 MLD
3 Commercial 10 MLD
4 Institutional 34 MLD
5 Stand Post 30 MLD
6 Parks 27 MLD
Total 387 MLD
The quality of ground water being extracted at present needs disinfection only. Hence only
chlorination is being done before the water is distributed for uses; however in future the sand filter-based treatment might be essential.
Presently the raw water is transmitted from the tube wells and the rainy wells to various
underground reservoirs through rising mains and transmission mains which run to a total length of 40.39 km before pumping into the elevated reservoirs for further distribution3.
There are 22 ground level storage reservoirs (GLSR) fitted with boosting stations. The total
capacity of the GLSRs is 54.55 ML, which is 23 percent of the installed capacity of the water supply system. These GLSRS are located across the city in line with the location of the tube
wells. The distribution system in the city is based on the division of the entire city into
primarily three zones - Old Faridabad, Ballabhgarh and NIT. These zones are sub-divided into various sectors/ colonies (mentioned above) for further distribution. Each such sub-
division is catered to by an elevated service reservoir of 1 lakh gallon (4.55 ML) capacity.
1 www.mcfbd.org, *Data was collecte from Municipal Corporation of Faridabad, MCF 2 www.mcfbd.org 3 City Development Plan 2006-2012, Faridabad developed by JNNURM
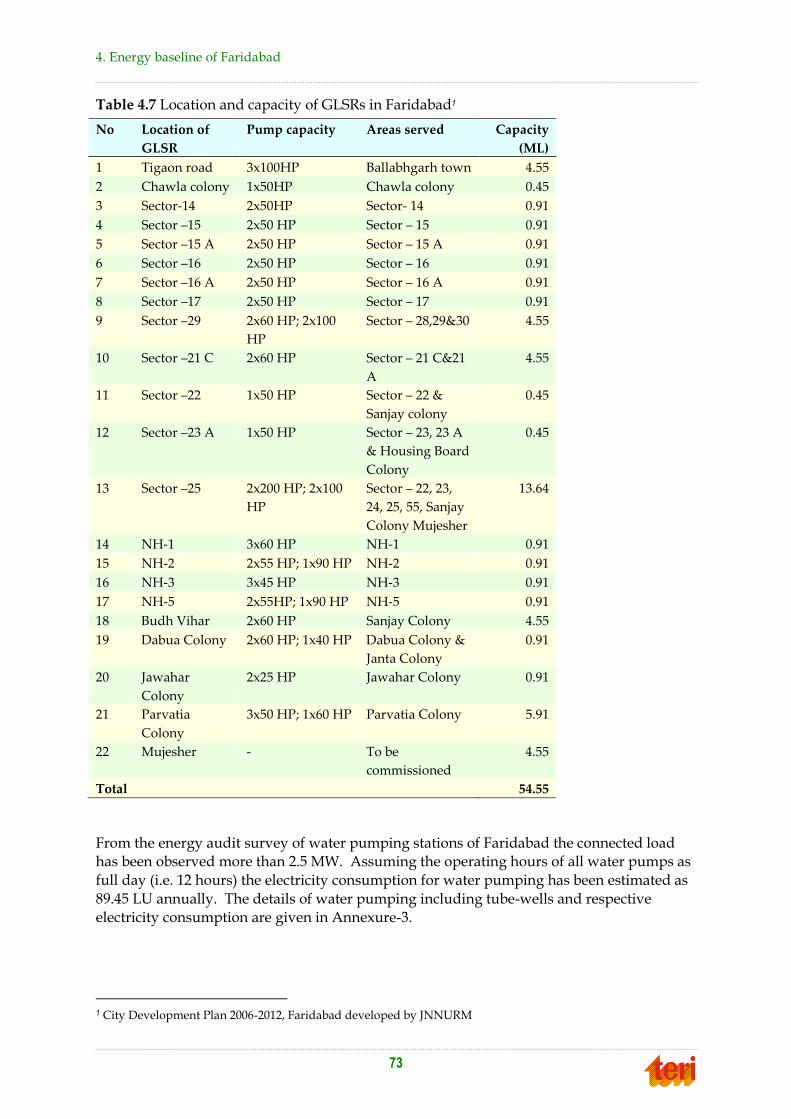
4. Energy baseline of Faridabad
73
Table 4.7 Location and capacity of GLSRs in Faridabad1
No Location of
GLSR
Pump capacity Areas served Capacity
(ML)
1 Tigaon road 3x100HP Ballabhgarh town 4.55
2 Chawla colony 1x50HP Chawla colony 0.45
3 Sector-14 2x50HP Sector- 14 0.91
4 Sector –15 2x50 HP Sector – 15 0.91
5 Sector –15 A 2x50 HP Sector – 15 A 0.91
6 Sector –16 2x50 HP Sector – 16 0.91
7 Sector –16 A 2x50 HP Sector – 16 A 0.91
8 Sector –17 2x50 HP Sector – 17 0.91
9 Sector –29 2x60 HP; 2x100
HP
Sector – 28,29&30 4.55
10 Sector –21 C 2x60 HP Sector – 21 C&21
A
4.55
11 Sector –22 1x50 HP Sector – 22 &
Sanjay colony
0.45
12 Sector –23 A 1x50 HP Sector – 23, 23 A
& Housing Board
Colony
0.45
13 Sector –25 2x200 HP; 2x100
HP
Sector – 22, 23,
24, 25, 55, Sanjay
Colony Mujesher
13.64
14 NH-1 3x60 HP NH-1 0.91
15 NH-2 2x55 HP; 1x90 HP NH-2 0.91
16 NH-3 3x45 HP NH-3 0.91
17 NH-5 2x55HP; 1x90 HP NH-5 0.91
18 Budh Vihar 2x60 HP Sanjay Colony 4.55
19 Dabua Colony 2x60 HP; 1x40 HP Dabua Colony &
Janta Colony
0.91
20 Jawahar
Colony
2x25 HP Jawahar Colony 0.91
21 Parvatia
Colony
3x50 HP; 1x60 HP Parvatia Colony 5.91
22 Mujesher - To be
commissioned
4.55
Total 54.55
From the energy audit survey of water pumping stations of Faridabad the connected load has been observed more than 2.5 MW. Assuming the operating hours of all water pumps as
full day (i.e. 12 hours) the electricity consumption for water pumping has been estimated as
89.45 LU annually. The details of water pumping including tube-wells and respective electricity consumption are given in Annexure-3.
1 City Development Plan 2006-2012, Faridabad developed by JNNURM

Master plan to develop Faridabad as a “Solar City”
74
Sewerage
The Sewerage master plan was prepared in 1992 to cover the urbanisable area proposed in the Development Plan for Faridabad. The city has been divided into four sewerage zones on
the basis of the topography of the area and other major barriers. Table 4.8 presents the
sectors falling within each zone;
Table 4.8 Details of sewerage system of Faridabad
City Zone Sectors falling under the zone
Zone – I - 27B, 27C, 27D, 32 to 45, 21A, 21B, 21C, 21D, 46 to
part of 49 and 84 to 91
Zone – II - 1 to 20, 27A, 28 to 31 and 60 to 65.
Zone – III - 22 to 25, part of 49 to 59, HIT 1 to III and V and
RUA colonies
Zone – IV - 66 to 83
The present quantum of sewerage generated in the city is understood to be in the range of
200 MLD which is approximately 80 percent of the water supply. To convey this sewerage to
various intermediate and main pumping stations for treatment purposes, there is a sewerage network of about 638 km. covering 52 percent of the total road network of the city.
Presently there are over 90 sewerage pumps and 45 pumping stations of various capacities
in the city. As per Municipal Corporation of the city the average operating hours of the pumps are three hours. The connected load and annual electricity consumption of sewerage
pumps has been obtained as 2.9 MW and 45.44 LU respectively. The details of sewerage
pump systems and their electricity consumption have been provided in Annexure – 3.
GHG emissions
Faridabad receives electricity through Dakshin Haryana Bijli Vitran Nigam (DHBVN). It has
been observed that maximum power supplied to Faridabad is through thermal power plants which are the source of GHG emissions. Indian electricity system is now divided into two
main grids, namely New Integrated Northern, Eastern, Western, and North-Eastern regional
grids (NEWNE) and the Southern Grid. In Faridabad city, the power is drawn from the NEWNE Grid. The average specific emission factor for NEWNE grid has been reported as
0.81tCO2/MWh as per Central Electricity Authority1.
The LPG consumption has been estimated for year 208 based on the population growth rate (5.12% annual) and assumed that per family 2 cylinders of 14 kg are required per month. It
has been estimated that the LPG consumption during 2008 in Faridabad was 93630 tonnes.
The GHG emission has been estimated based on total electricity consumption and LPG
consumption by the city up to 2010 and 2008 respectively. The emission factor (EF) as
0.81tCO2/MWh for electricity generation; while the emission factors2 71.5 tCO2/ TJ has been
taken for LPG.
1 http://cea.nic.in/planning/c%20and%20e/Government%20of%20India%20website.htm 2 http://cdm.unfccc.int/UserManagement/FileStorage/6HGTVUO4OT44ZX5O5BQBHK1AEEAOI1
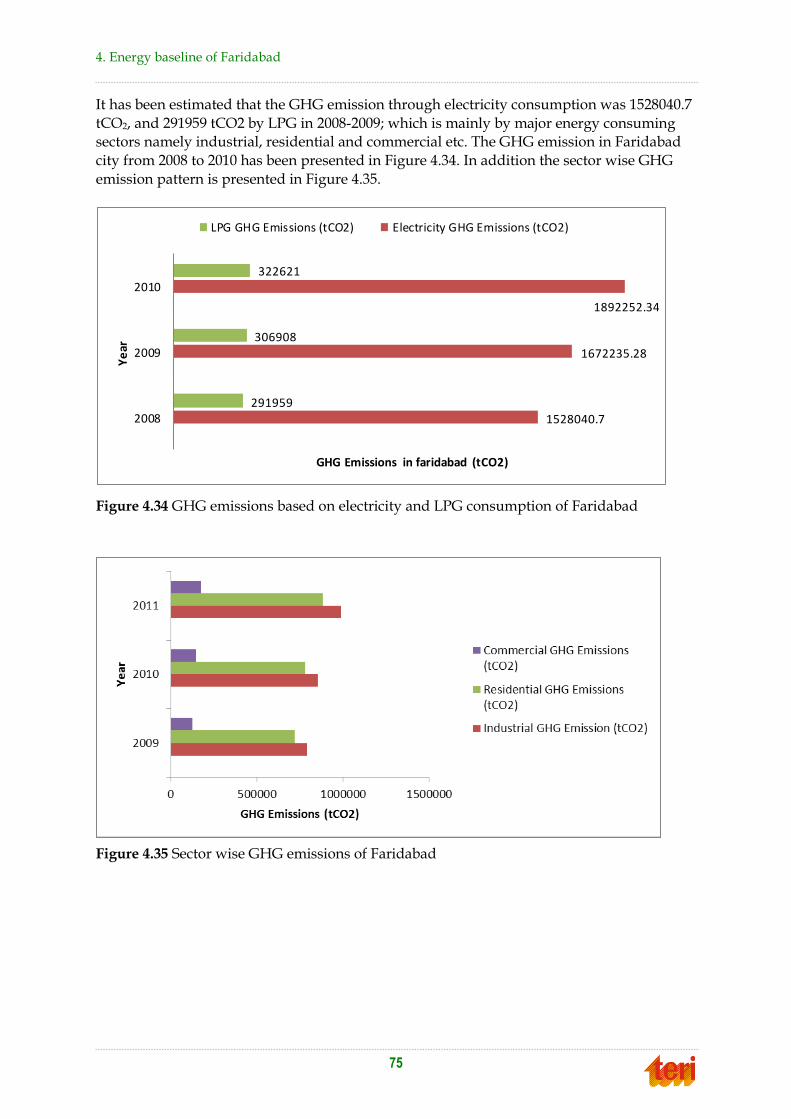
4. Energy baseline of Faridabad
75
It has been estimated that the GHG emission through electricity consumption was 1528040.7
tCO2, and 291959 tCO2 by LPG in 2008-2009; which is mainly by major energy consuming sectors namely industrial, residential and commercial etc. The GHG emission in Faridabad
city from 2008 to 2010 has been presented in Figure 4.34. In addition the sector wise GHG
emission pattern is presented in Figure 4.35.
Figure 4.34 GHG emissions based on electricity and LPG consumption of Faridabad
Figure 4.35 Sector wise GHG emissions of Faridabad
1528040.7
1672235.28
1892252.34
291959
306908
322621
2008
2009
2010
GHG Emissions in faridabad (tCO2)
Ye
ar
LPG GHG Emissions (tCO2) Electricity GHG Emissions (tCO2)

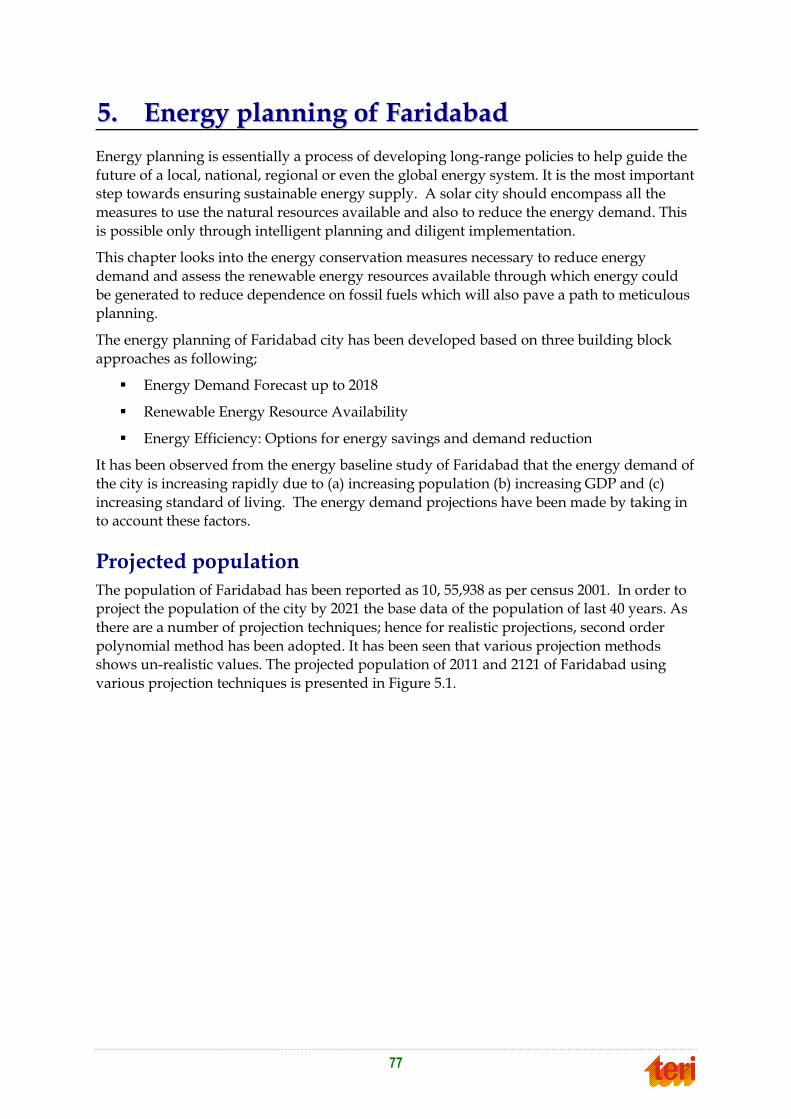
77
55.. EEnneerrggyy ppllaannnniinngg ooff FFaarriiddaabbaadd
Energy planning is essentially a process of developing long-range policies to help guide the
future of a local, national, regional or even the global energy system. It is the most important step towards ensuring sustainable energy supply. A solar city should encompass all the
measures to use the natural resources available and also to reduce the energy demand. This
is possible only through intelligent planning and diligent implementation.
This chapter looks into the energy conservation measures necessary to reduce energy
demand and assess the renewable energy resources available through which energy could
be generated to reduce dependence on fossil fuels which will also pave a path to meticulous planning.
The energy planning of Faridabad city has been developed based on three building block
approaches as following;
Energy Demand Forecast up to 2018
Renewable Energy Resource Availability
Energy Efficiency: Options for energy savings and demand reduction
It has been observed from the energy baseline study of Faridabad that the energy demand of
the city is increasing rapidly due to (a) increasing population (b) increasing GDP and (c)
increasing standard of living. The energy demand projections have been made by taking in to account these factors.
Projected population
The population of Faridabad has been reported as 10, 55,938 as per census 2001. In order to
project the population of the city by 2021 the base data of the population of last 40 years. As
there are a number of projection techniques; hence for realistic projections, second order
polynomial method has been adopted. It has been seen that various projection methods shows un-realistic values. The projected population of 2011 and 2121 of Faridabad using
various projection techniques is presented in Figure 5.1.

Master plan to develop Faridabad as a “Solar City”
78
Figure 5.1 Population projection of Faridabad using various methods
An exponential trend in the population growth has been obtained when projected based on
the census data of the years from 1961 to 2001 using polynomial second order method. The
trend of population growth rate is also projected over the selected period.
The population projections have been carried out on the basis of time series data from 1961
to 2001. The demographic data indicates that between 1961 and 1971 the population
increased by 172.2percent. According to the 1981 census it grew by another 88.9percent followed by 68.9percent in 1991; 51.2percent in 2001(with a total population of 1055938), and
projected as 41.2 percent by 2011. Figure 5.2 graphically presents the projection of
cumulative population and population growth rate up to 2021.
It has been noticed that the population growth rate is gradually decreasing since last four
decades and is predicted to be around 34.3 percent up to 2021. On the basis of time series
data the population of the city up to 2021 is predicted as 2254233. The present annual growth rate has been estimated from the population data of 2001 and project data of 2011;
which given the present annual growth rate as 5.12 percent.

5. Energy planning of Faridabad
79
1055938
625085
56000
330864
122000
1596403
2254233
0
300000
600000
900000
1200000
1500000
1800000
2100000
1961 1971 1981 1991 2001 2011 2021
Year
Po
pu
lati
on
25.0
45.0
65.0
85.0
105.0
125.0
145.0
165.0
185.0
Po
pu
lati
on
Gro
wth
Ra
te (
%)
Population Population Growth Rate
Figure 5.2 Population growth trends in Faridabad from 1961 to 2021
Haryana state has effectively increasing annual income levels per capita. A significant
difference has been obtained between the per capita income of Faridabad and India1. During
1999-2000 the per capita income of Haryana was Rs. 21966.00 while the same for India was Rs. 15881.00. The per capita income of at current prices has reached to Rs. 58531.0 in 2008-09,
whereas for India2 the same is reached up to Rs. 374900.0. Faridabad city more or less have
the similar trends of the per capita annual income. Hence the human development index
and quality of life in the city is quite well as compared with the rural areas of the state.
Figure 5.3 presents the trends of increase in the per capita income of Haryana (NSDP-Net
State Domestic Product) from 2000 to 2008. Faridabad has almost double per capita annual income as compared with of the country; hence the per capita energy consumption is
comparably very high.
1 According to the IMF, the estimated GDP per capita of India in 2008 was $1,016. Other sources like the World Bank and the CIA are in a similar ball park. 2 http://www.tradechakra.com/indian-economy/per-capita-income.html

Master plan to develop Faridabad as a “Solar City”
80
Figure 5.3 Per capita income of Haryana1
Energy demand forecast up to 2018
The energy demand forecast of Faridabad has been carried out using time series data of last
three years. The trend analysis statistical methodology has been adopted for projections.
Statistically the projections are assumed as of best reliability if the correlation coefficient (R2)
comes more than 0.95. In the present projections the correlation coefficient has obtained
always more than 0.95 up to 1.0; which shows very high level of confidence level of the projections. All projections have been made up to 2018. A brief detail of statistical
methodology adopted for projections has been described in Annexure-4.
Per capita electricity consumption
In has been observed that the per capita consumption of electricity in Haryana has increased
from 507 kWh in 2000 to 700 kWh in 2007. On the basis of time series based data of last
seven years it is estimated that the per capita electricity consumption will be increased up to 1148 kWh in 2012 (short term); 1532 kWh by 2015 (medium term); and up to 2018 (long term)
it will be 1996 kWh. Hence the per capita electricity will be increased more than twice of its
present value by 2018. The projection trend of per capita electricity consumption with years is presented in Figure 5.4.
1 www.indiastat.com
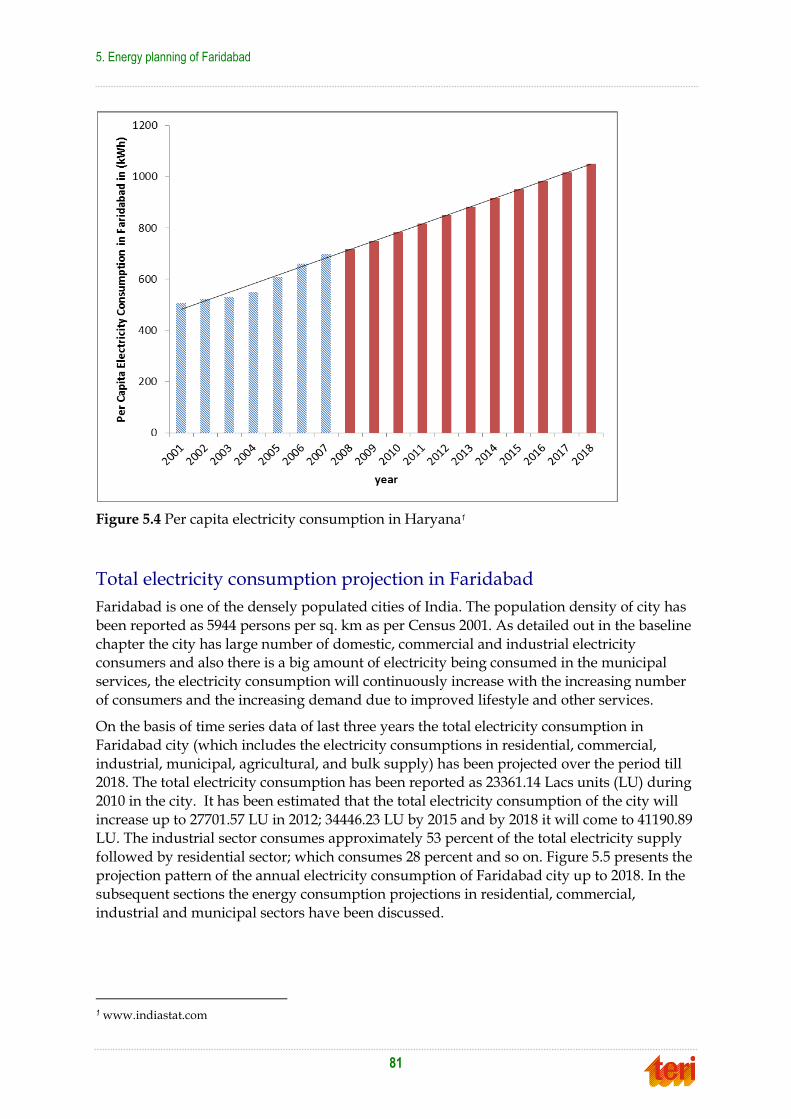
5. Energy planning of Faridabad
81
Figure 5.4 Per capita electricity consumption in Haryana1
Total electricity consumption projection in Faridabad
Faridabad is one of the densely populated cities of India. The population density of city has
been reported as 5944 persons per sq. km as per Census 2001. As detailed out in the baseline
chapter the city has large number of domestic, commercial and industrial electricity consumers and also there is a big amount of electricity being consumed in the municipal
services, the electricity consumption will continuously increase with the increasing number
of consumers and the increasing demand due to improved lifestyle and other services.
On the basis of time series data of last three years the total electricity consumption in
Faridabad city (which includes the electricity consumptions in residential, commercial,
industrial, municipal, agricultural, and bulk supply) has been projected over the period till 2018. The total electricity consumption has been reported as 23361.14 Lacs units (LU) during
2010 in the city. It has been estimated that the total electricity consumption of the city will
increase up to 27701.57 LU in 2012; 34446.23 LU by 2015 and by 2018 it will come to 41190.89 LU. The industrial sector consumes approximately 53 percent of the total electricity supply
followed by residential sector; which consumes 28 percent and so on. Figure 5.5 presents the
projection pattern of the annual electricity consumption of Faridabad city up to 2018. In the subsequent sections the energy consumption projections in residential, commercial,
industrial and municipal sectors have been discussed.
1 www.indiastat.com

Master plan to develop Faridabad as a “Solar City”
82
Figure 5.5 Annual electricity consumption (in LU) of Faridabad
Energy scenario of residential sector
Electricity consumption
The time series forecasting has been made on basis of the data of electricity consumption in residential sector from 2008 to 2010. It is estimated that the total electricity consumption in
residential sector will increase up to 8457.265 LU in 2012; 10930.66 LU by 2015 and 13404.055
LU in 2018; while it was reported as 5239.91 LU in 2008. Figure 5.6 presents the projection of
electricity demand in residential sector up to 2018.
Figure 5.6 Total electricity consumption in the residential sector up to 2018
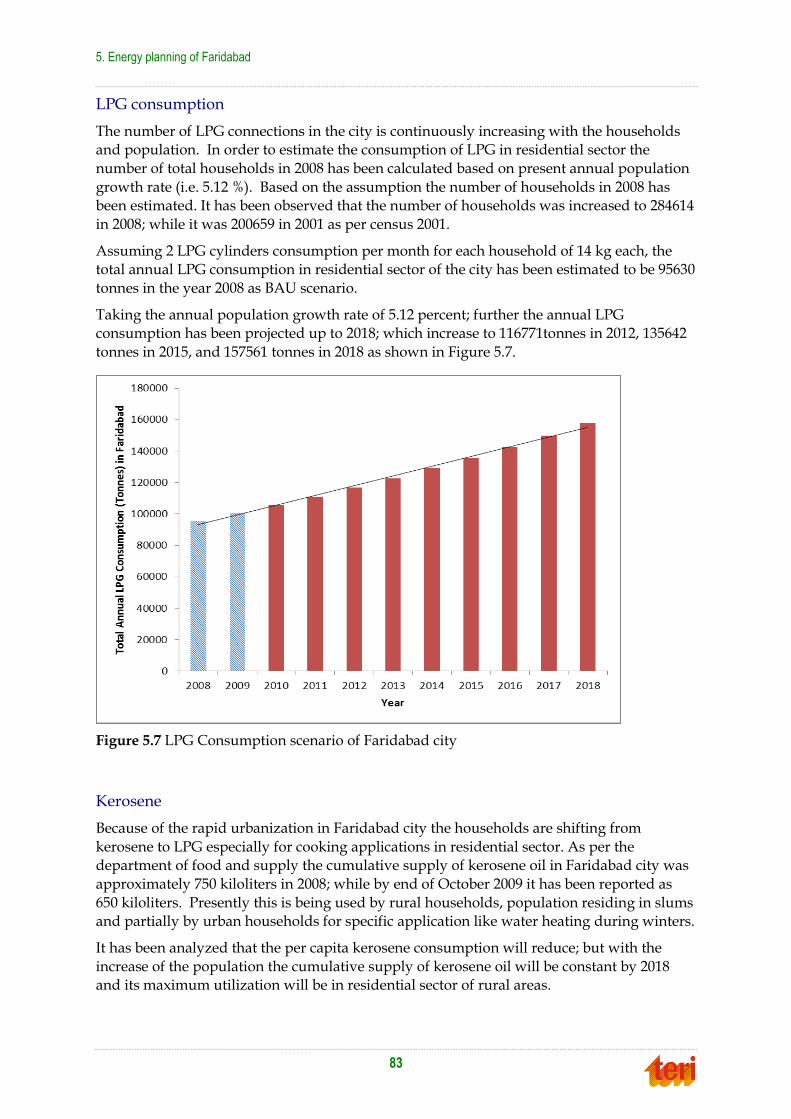
5. Energy planning of Faridabad
83
LPG consumption
The number of LPG connections in the city is continuously increasing with the households and population. In order to estimate the consumption of LPG in residential sector the
number of total households in 2008 has been calculated based on present annual population
growth rate (i.e. 5.12 %). Based on the assumption the number of households in 2008 has been estimated. It has been observed that the number of households was increased to 284614
in 2008; while it was 200659 in 2001 as per census 2001.
Assuming 2 LPG cylinders consumption per month for each household of 14 kg each, the total annual LPG consumption in residential sector of the city has been estimated to be 95630
tonnes in the year 2008 as BAU scenario.
Taking the annual population growth rate of 5.12 percent; further the annual LPG consumption has been projected up to 2018; which increase to 116771tonnes in 2012, 135642
tonnes in 2015, and 157561 tonnes in 2018 as shown in Figure 5.7.
Figure 5.7 LPG Consumption scenario of Faridabad city
Kerosene
Because of the rapid urbanization in Faridabad city the households are shifting from
kerosene to LPG especially for cooking applications in residential sector. As per the department of food and supply the cumulative supply of kerosene oil in Faridabad city was
approximately 750 kiloliters in 2008; while by end of October 2009 it has been reported as
650 kiloliters. Presently this is being used by rural households, population residing in slums and partially by urban households for specific application like water heating during winters.
It has been analyzed that the per capita kerosene consumption will reduce; but with the
increase of the population the cumulative supply of kerosene oil will be constant by 2018 and its maximum utilization will be in residential sector of rural areas.

Master plan to develop Faridabad as a “Solar City”
84
Energy scenario of commercial sector
The commercial sector of Faridabad is growing drastically as earlier the city was known for industrial processes; which is because of the announcement of National Capital Region
(NCR) and economic development. JNNURM has proposed an area of 7.73 km2 for
commercial purposes in the development plan of Faridabad by 2012. The electricity consumers and consumption in the commercial sector of Faridabad is increasing
exponentially. Along with swanky residential projects, there are a lot of Commercial projects
that have got developed or are still on the progress, in Faridabad. These commercial projects are also as vast and as elegant as the residential projects. Many shopping arcades and malls
are functional as of now and still more are in the pipeline.
Commercial sector electricity consumption
On the basis of recent last three years data of electricity consumption in commercial sector it
has been projected that the commercial electricity consumption will be increased by 2791.85
LU in 2012, 3745.39 LU in 2015 and 4698.921 LU in 2018; while it was 1539.15 LU in 2008. Figure 5.8 presents the short term, medium term and long term scenarios of electricity
consumption in commercial sector of Faridabad.
Figure 5.8 Total Annual Electricity consumption in commercial sector (LU)
Energy scenario of industrial sector
Faridabad industrial zone falls under the Faridabad-Ballabhgarh-Palwal industrial Complex
which is the 9thlargest industrial estate in Asia. This industrial estate accommodates over
15,000 small, medium and large industries ranging from small metal industry, dying,
electroplating units, chemical plants etc to large manufacturing units like tractors, automobile tyres, refrigerator and shoe making units. This industrial estate is providing
direct and indirect employment to nearly half a million people. There are over 15 large scale
industries in Faridabad. The combined turnover is estimated to be about Rs. 1500 billion. The total land are occupied by the industries is about 6948 hectares. The Industrial sector is
the major power consumer of the city and due to expansion of the sector the electricity
demand and consumption is increasing effectively.
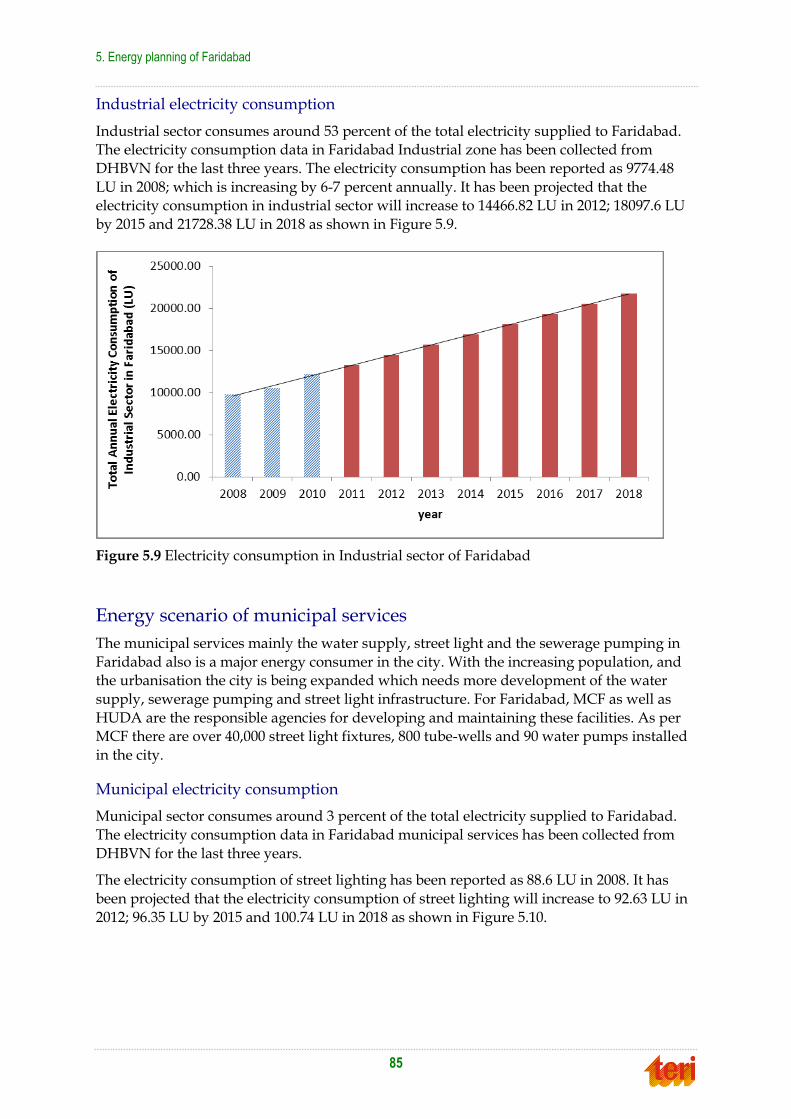
5. Energy planning of Faridabad
85
Industrial electricity consumption
Industrial sector consumes around 53 percent of the total electricity supplied to Faridabad. The electricity consumption data in Faridabad Industrial zone has been collected from
DHBVN for the last three years. The electricity consumption has been reported as 9774.48
LU in 2008; which is increasing by 6-7 percent annually. It has been projected that the electricity consumption in industrial sector will increase to 14466.82 LU in 2012; 18097.6 LU
by 2015 and 21728.38 LU in 2018 as shown in Figure 5.9.
Figure 5.9 Electricity consumption in Industrial sector of Faridabad
Energy scenario of municipal services
The municipal services mainly the water supply, street light and the sewerage pumping in
Faridabad also is a major energy consumer in the city. With the increasing population, and the urbanisation the city is being expanded which needs more development of the water
supply, sewerage pumping and street light infrastructure. For Faridabad, MCF as well as
HUDA are the responsible agencies for developing and maintaining these facilities. As per MCF there are over 40,000 street light fixtures, 800 tube-wells and 90 water pumps installed
in the city.
Municipal electricity consumption
Municipal sector consumes around 3 percent of the total electricity supplied to Faridabad.
The electricity consumption data in Faridabad municipal services has been collected from
DHBVN for the last three years.
The electricity consumption of street lighting has been reported as 88.6 LU in 2008. It has
been projected that the electricity consumption of street lighting will increase to 92.63 LU in
2012; 96.35 LU by 2015 and 100.74 LU in 2018 as shown in Figure 5.10.

Master plan to develop Faridabad as a “Solar City”
86
Figure 5.10 Annual Electricity consumption of street lighting in Faridabad
Similarly, electricity consumption of municipal water pumping has been projected. The electrical consumption of municipal water pumping is reported as 464 LU in 2008. It has
been projected that the electricity consumption in municipal sector will increase to 613 LU in
2012; 712 LU by 2015 and 827 LU in 2018 as shown in Figure 5.11.
Figure 5.11 Annual Electricity consumption of water pumping in Faridabad
In aggregate, the electricity consumption of municipal services has been reported as 553 LU in 2008. It has been projected that the electricity consumption in municipal sector will
increase to 677.5 LU in 2012; 771 LU by 2015 and 865 LU in 2018 as shown in Figure 5.12.

5. Energy planning of Faridabad
87
Figure 5.12 Annual Electricity consumption in municipal sector of Faridabad
Based on the above projections, industrial sector has been found the major energy consumer
sector in the city followed by residential and commercial sectors etc. Figure 5.13 presents the
annual electricity consumption projection in residential, commercial, and industrial sectors of Faridabad city with the total electricity consumption up to 2018.
Figure 5.13 Annual Electricity consumption in various sectors of Faridabad
GHG emission
As the power is drawn from the NEWNE Grid in Faridabad city the average specific
emission factor for NEWNE grid (i.e. 0.81tCO2/MWh) has been considered for estimation of GHG emission projection. Similarly the emission factors for LPG and kerosene have been
considered as 71.5 tCO2/TJ and 63.0 tCO2/TJ respectively.

Master plan to develop Faridabad as a “Solar City”
88
The city was emitting 1528040.7 tCO2 through electricity, 291959 tCO2 through LPG and
1787 tCO2 through kerosene in 2008. On the basis of time series projection of total electricity requirement of the city and its multiplication with the average emission factor of NEWNE
grid it has been projected that the GHG emission will be increased as 2243826.9 tCO2 by
2012; 2790144.36 tCO2 by 2015 and 3336461.82 tCO2 in 2018. The GHG emission through LPG will be increased by 356503 tCO2 by 2012; 414114 tCO2 by 2015 and 470280 tCO2 by
2018. Similarly the GHG emission through Kerosene will be constant as 1787 tCO2 by 2018.
Hence it has been estimated that the total (electricity, LPG and kerosene) GHG emission in Faridabad will increase to 2602117 tCO2 in 2012, 3206045 tCO2 in 2015 and 3808529 tCO2 in
2018. The Fuel wise and sector wise GHG emission by 2018 in Faridabad has been presented
in Figures 5.14 and 5.15 respectively.
Figure 5.14 Fuel wise GHG emissions projection for Faridabad
Figure 5.15 Sector wise GHG emissions projection for Faridabad

5. Energy planning of Faridabad
89
Renewable energy resource availability
Biomass
Faridabad city has limited forest cover which is reserve forest and hence the biomass of the
forest could not be used for any application. However Faridabad district have agriculture
land and there is some possibility of agro-waste which can be used for energy generation. It has been observed that the agro-waste is generally used by the nearby industries and hence
due to limited availability and improper collection mechanism biomass has not been
identified as potential renewable energy resource for Faridabad. Further the bagasse of the sugar industries which were earlier present in Faridabad was being used by the industries
their self, but now since there are no sugar plants existing in Faridabad, there is no further
scope of biomass availability and usage.
Municipal solid waste
Rapid urbanisation, increasing commercial and industrial activities and changing life styles
in Faridabad are leading to a steady increase in the generation of solid waste. Municipal Corporation of Faridabad is responsible for the collection, transportation and disposal of all
solid waste generated in the city, except the untreated bio-medical waste and hazardous
industrial waste, which is taken care of by the respective generators. MCF organizes the collection and transportation of the waste through a team of its own conservancy workers
and a fleet of vehicles and dumper-placers. The waste collected is disposed at various
dumping yards without any treatment.
Municipal solid waste includes predominantly household or domestic waste with sometime
the addition of commercial wastes; which are in either solid or semisolid form. The collected
municipal waste is still to be separated out or reprocessed. Essentially the MSW is divided in to following categories;
Biodegradable waste: food and kitchen waste, green waste and paper
Recyclable material: paper, glass, bottles, cans, and certain plastics
Inert waste: construction and demolition waste, dirt, rocks and debris
Composite waste: waste clothing, tetra packs and plastic and
Domestic hazardous water and toxic waste: medicines, paints, chemicals etc.
The primary sources of solid waste in Faridabad are local households, commercial
establishments, industries, markets, hotels, restaurants, and hospitals. The total quantity of waste generated per day is in the order of 480 tonnes per day (TPD). No significant seasonal
variation in the quantity of waste generated is observed. Of the waste generated, only 450
MT is reported to be collected and transported to temporary dumping places after the partial sorting out recyclable materials. All the municipal solid wastes were being dumped
without any proper treatment1 and segregation in the 5 open landfill sites which were
temporary in nature. The major landfill sites are – Bharat colony, Uncha Gaon etc.
At present there is only partiallyorganized door-to-door collection system. It is being done
by few NGOs like NAYA SAVERA, PATHEY etc. on behalf of MCF. After collecting the
1 Faridabad- City Development Plan 2006-2012, developed by JNNURM, 2006.
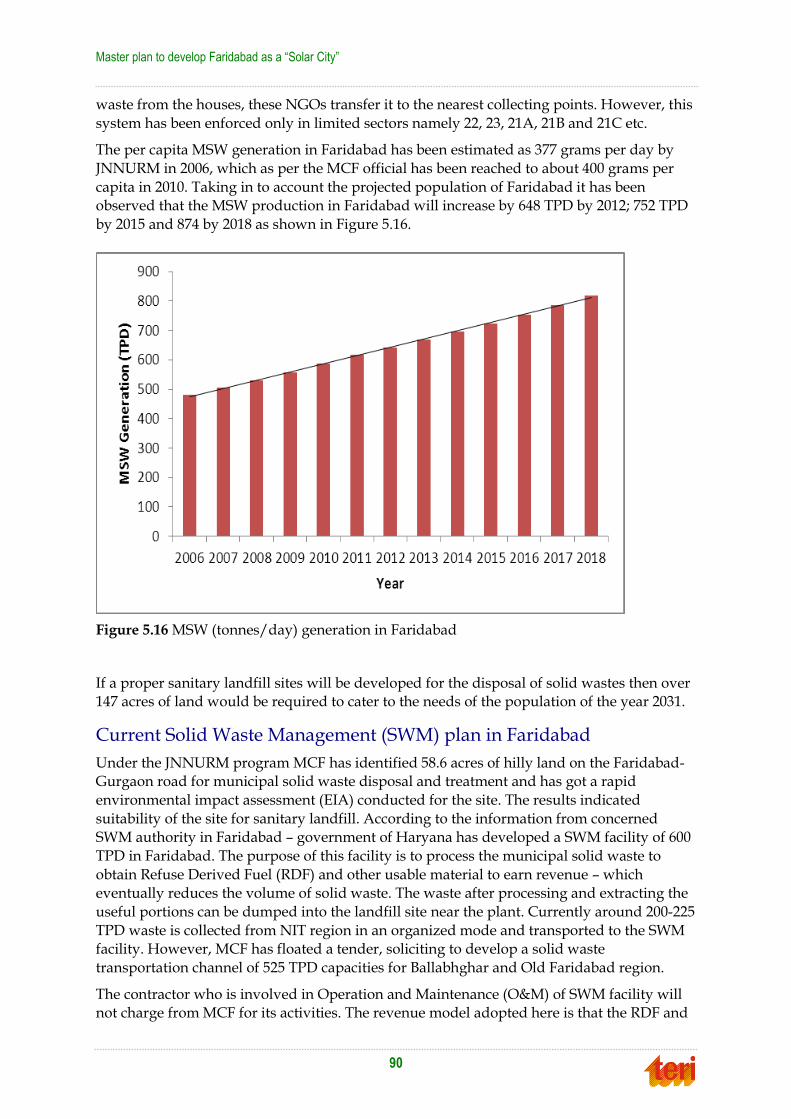
Master plan to develop Faridabad as a “Solar City”
90
waste from the houses, these NGOs transfer it to the nearest collecting points. However, this
system has been enforced only in limited sectors namely 22, 23, 21A, 21B and 21C etc.
The per capita MSW generation in Faridabad has been estimated as 377 grams per day by
JNNURM in 2006, which as per the MCF official has been reached to about 400 grams per
capita in 2010. Taking in to account the projected population of Faridabad it has been observed that the MSW production in Faridabad will increase by 648 TPD by 2012; 752 TPD
by 2015 and 874 by 2018 as shown in Figure 5.16.
Figure 5.16 MSW (tonnes/day) generation in Faridabad
If a proper sanitary landfill sites will be developed for the disposal of solid wastes then over 147 acres of land would be required to cater to the needs of the population of the year 2031.
Current Solid Waste Management (SWM) plan in Faridabad
Under the JNNURM program MCF has identified 58.6 acres of hilly land on the Faridabad-Gurgaon road for municipal solid waste disposal and treatment and has got a rapid
environmental impact assessment (EIA) conducted for the site. The results indicated
suitability of the site for sanitary landfill. According to the information from concerned SWM authority in Faridabad – government of Haryana has developed a SWM facility of 600
TPD in Faridabad. The purpose of this facility is to process the municipal solid waste to
obtain Refuse Derived Fuel (RDF) and other usable material to earn revenue – which eventually reduces the volume of solid waste. The waste after processing and extracting the
useful portions can be dumped into the landfill site near the plant. Currently around 200-225
TPD waste is collected from NIT region in an organized mode and transported to the SWM facility. However, MCF has floated a tender, soliciting to develop a solid waste
transportation channel of 525 TPD capacities for Ballabhghar and Old Faridabad region.
The contractor who is involved in Operation and Maintenance (O&M) of SWM facility will not charge from MCF for its activities. The revenue model adopted here is that the RDF and

5. Energy planning of Faridabad
91
other recyclable materials derived from MSW can be sold and revenue can be earned, where
MCF has no role, no intervention and the contractor holds no obligations in selling of the derived products.
The products from the solid waste treatment plant like Refused Derived Fuels may either be
used by the local industries as their energy sources replacing some amount of coal, or can be used for the small thermal power generation.
Kitchen waste based biogas systems
Biodegradable organic wastes such as kitchen waste, paper, grass and dry plant leaves generated in residential complexes, institutions, hotels and public places like gardens etc can
be one of the source for developing the biogas plants in the societies and large individual
institutional campuses. The plant can provide biogas as a fuel to generate the electricity and thermal energy and also the organic manure that can be used in the gardens and agriculture
farms.
In Faridabad, there are generally 7-8 towers in one residential society developed by the colonizers. Each tower has the occupancy of 70 - 80 households and each household having
4 to 5 family members, which generate about1.20 to 1.5 Kg of kitchen waste every day.
Therefore, approx. 100 to 120 kg kitchen waste is being generated daily in each tower and for the campus of 7-8 towers, the kitchen waste about 750 Kg to 1000 kg is being generated
every day.
Based on the research it has been found that the anaerobic digestion of food wastes can generate about 50 to 100 m3 of biogas per tonne of waste depending upon the characteristics
of waste, digester design and operating conditions etc. Per m3 of biogas may generate about
1.5 to 2 kWh of electricity. So for each residential society being developed in Faridabad, It is proposed to install the centralized kitchen waste based bio gas plant of 75 to 100 cu meter
capacity to run 12 to 15 KW electricity generating set. The electricity generated shall be used
for the campus lighting of the towers. The plant shall also generate 750 kg dry fertilizer every day which shall be utilized for the gardening of the campus.
Apart from these residential complexes, The institutions like YMCA Institute of Engineering
and Technology, Manav Rachna University, Manav Rachna College of Engineering, Lingya‟s Institute of Management and Technology, DAV Centenary College and other big institutions
with hostel and canteen facilities etc and the hospitals like BK Hospital, Fortis Hospital etc
also are the major source of kitchen waste generation. As per the survey conducted for the purpose of master plan preparation it is estimated that each big hospital generates about 50
kg to 150 kg per day of kitchen wastes and the institutions with hostel may generate kitchen
wastes from 25 to 50 kg per day. Most of these wastes are being dumped as solid waste by all these institutions. There may be a possibility of installing a centralised kitchen waste
based biogas generation plant by proper collection mechanism. However it was not possible
to estimate the total quantity of the kitchen wastes generated in the city due to the lack of information available for all the institutions and hospitals etc.
It is proposed that each institution, hospitals, hotels and other commercial establishments
shall be promoted to use their kitchen waste for the biogas generation and hence for the utilisation of energy generated from this.

Master plan to develop Faridabad as a “Solar City”
92
Solar energy
Faridabad is located in the sunny belt of the country and receives a good amount of solar radiation over the year. It has been observed that the annual global solar radiation over the
city1 is 1846 kWh/m2. The global solar radiation over the inclined surface2 (at latitude) is
estimated as 2017 kWh/m2 annually. Figure 5.17 presents the daily values of solar radiation on horizontal and inclined surface in Faridabad for of each month.
Figure 5.17 Solar Radiation pattern of Faridabad3
The performance of solar systems essentially depends upon the solar radiation availability
and the number of sunshine hours over the location. The average number of sunshine hours
has been observed from 8-10 hours over the year in Faridabad. Figure 5.18 shows a typical sun-path diagram at Faridabad plotted in ECOTECH software.
1 http://eosweb.larc.nasa.gov/sse/RETScreen/ 2 The solar radiation on inclined surface (latitude) is estimated as maximum solar collectors/PV modules are installed as inclined. 3 Handbook of Solar Radiation written by A Mani, Allied Publisher, 1980
0
50
100
150
200
250
Jan Feb Mar Apr May Jun Jul Aug Sep Oct Nov Dec
So
lar
Ra
dia
tio
n (
kW
h/m
2)
Solar Radiation on Horizontal (kWh/m2) Solar Radiation on Latitude (kWh/m2)

5. Energy planning of Faridabad
93
Figure 5.18 Sun path diagram of Faridabad (ECOTECH)
The month-wise daily and monthly pattern of solar radiation received over Faridabad on
horizontal and inclined surface are summarized in Table 5.1.
Table 5.1 Daily and monthly pattern of solar radiation over Faridabad
Month
Daily Monthly
Global Solar
Radiation
(kWh/m2)
Global Solar
Radiation on
Latitude
(kWh/m2)
Global Solar
Radiation
(kWh/m2)
Global Solar
Radiation on
Latitude
(kWh/m2)
Jan 3.80 5.23 117.8 162.2
Feb 4.68 5.84 131.0 163.6
Mar 5.80 6.47 179.8 200.7
Apr 6.30 6.28 189.0 188.5
May 6.42 5.93 199.0 183.8
Jun 6.07 5.44 182.1 163.2
Jul 5.22 4.78 161.8 148.2
Aug 4.81 4.64 149.1 143.8
Sep 5.06 5.32 151.8 159.6
Oct 4.83 5.77 149.7 178.9
Nov 4.18 5.66 125.4 169.7
Dec 3.52 4.99 109.1 154.7

Master plan to develop Faridabad as a “Solar City”
94
Wind energy
Faridabad does not receive good wind speed in point of view of the power generation. The monthly average daily wind speed over Faridabad1 varies from 1.4 m/s (Nov-Dec) to 3.2
m/s (May-June) over the year. Table 5.2 shows the wind speed pattern over Faridabad.
Table 5.2 Wind speed over Faridabad (10m)
Month Wind Speed
(m/s)
Jan 2.2
Feb 2.5
Mar 2.7
Apr 3.1
May 3.2
Jun 3.2
Jul 2.7
Aug 2.3
Sep 2.2
Oct 1.7
Nov 1.4
Dec 1.9
Annual average (m/s) 2.5
Biomass resource and wind resources (speed and density) are not favourable in Faridabad
for electricity generation. Solar energy and Solid waste are two promising renewable
resources identified in Faridabad which can be used for energy generation.
Annexure 5 contains the details of existing renewable energy installations in Faridabad city.
Energy efficiency: Options for energy savings and demand reduction
Energy efficiency is essentially using less energy/electricity to perform the same function. It
is critical for reducing energy or demand requirements without reducing the end-use
benefits. It plays a critical role in minimising the societal and environmental impacts of economic growth in developing and developed nations.
Residential sector
The residential sector of Faridabad is one of the major consumers of electricity after industrial sector. The current electricity consumption (year 2010) of the residential sector is
6888.84 LU which constitutes 28 % of the total electricity consumption. The share of the
residential sector in the total connected load and consumption is continuously growing. The energy consumption in Faridabad residential sector is projected as 13404 LU by 2018.
From the energy use pattern study of the city it has been observed that the residential sector
of composite climatic zones2 consumes more than 40 per cent of its total energy requirement for cooling application by using Fans, coolers, and ACs depending upon the income level of
1 http://eosweb.larc.nasa.gov/sse/RETScreen/ 2 There are six major climatic zones in India namely Composite (New Delhi), hot & dry (Jodhpur), cold & cloudy (Shimla), cold & sunny (Leh), warm & humid (Mumbai) and moderate (Pune).

5. Energy planning of Faridabad
95
the households (Kindly refer Figure 4.20). The discomfort is essentially governed by the
ambient temperature and relative humidity of the location. Figure 5.19 presents the annual hourly variation of ambient temperature and relative humidity (governing parameters of
AC load), which emphasize on the cooling requirement in the city. Reduction in the demand
of residential sector would help in conservation of energy.
Figure 5.19 Pattern of ambient temperature and Relative Humidity in Faridabad
Energy saving measures: The major energy saving measures in residential sector is as
follows:
Replacing the conventional T-12 (40 Watt) copper ballast tube lights with the energy efficient T-5 (28 Watt) electronic ballast tube lights. The saving would be about 42%
per tube light.
Replacing the conventional Ceiling Fans which consumes (70-80 watt) with energy efficient Fans (which consumes 50 Watt). The savings that occur will be 37% per fan.
Replacing the existing unitary air conditioners with the BEE star labelled Air
conditioners. The saving potential would be 20% considering selection of air conditioning is 3 -star rated.
The overall electricity saving which can be achieved by implementing all above measures
would be approximately 22% of the total consumption in residential sector of the city.
If the energy efficient devices, as mentioned above are used in residential sector, the total
consumption would reduce up to 6596.67 LU from 8457.26 LU in 2012 as BAU scenario.
However, the 100% replacement would be difficult and not possible to achieve in short term. With active promotion and facilitation the process can be accelerated.
0
10
20
30
40
50
60
70
80
90
100
0 1000 2000 3000 4000 5000 6000 7000 8000 9000
Hours
Rel
ati
ve
Hu
mid
ity
(%
)
0
5
10
15
20
25
30
35
40
45
50
Am
bie
nt
Tem
per
atu
re (oC
)
Heating Required
Cooling Required (>25oC)
0
10
20
30
40
50
60
70
80
90
100
0 1000 2000 3000 4000 5000 6000 7000 8000 9000
Hours
Rel
ati
ve
Hu
mid
ity
(%
)
0
5
10
15
20
25
30
35
40
45
50
Am
bie
nt
Tem
per
atu
re (oC
)
Heating Required
Cooling Required (>25oC)

Master plan to develop Faridabad as a “Solar City”
96
It has been assumed that by 2012(short term), there would be 5% replacement only and
therefore the electricity consumption in 2012 would be 8364 LU compared with 8457 LU consumption in BAU scenario. Similarly 50% replacement has been assumed by 2015
(medium term) and 75% by 2018 (long term). Under the medium term it has been obtained
that the electricity consumption in residential sector will be reduced up to 9728 LU under SC scenario as it is projected 10930LU under BAU scenario by 2015. Similarly in long term
prospective the electricity consumption will be reduced by 11192 LU against 13404 LU
projected under BAU scenario by 2018.
The electrical energy demand after incorporating the energy saving options in residential
sector in solar city scenario is shown in Figure 5.20.
Figure 5.20 Business as usual (BAU) and solar city (SC) scenario of residential sector
Commercial sector
According to DHBVN the electricity consumption in commercial sector of Faridabad was
2174.84 LU by the end of year 2010; which is about 8.84% of the total electricity
consumption.
The energy efficiency in commercial sector plays a very important role in managing city‟s
electrical energy demand. Energy systems in commercial sector mainly include lighting and
space cooling system (fans, air conditioners etc.). Many studies indicate that not much attention has been paid towards energy efficiency in the design of these energy systems.
Such energy systems therefore, waste energy in commercial buildings due to poor efficiency,
poor operating practices. Lack of appropriate controls adds to the energy wastage. Hence there exists a significant potential to improve energy efficiency in existing commercial
buildings and subsequent reduction of commercial sector electrical energy demand at city
level.

5. Energy planning of Faridabad
97
Box: CFL programme of BSES, Delhi
BSES Yamuna, one of the distribution companies in Delhi launched on October 25, 2006 “Buy One, Get One Free CFL” scheme. As per BSES, this scheme launched in association with Indo Asian Fusegear Limited (a CFL manufacturer) has exceeded all expectations. In about five months’ time over 3.5 lakh CFLs have been sold. Savings accruing from these CFLs is estimated to result in a reduction in maximum demand by nearly 23 MW at a given point of time – enough to power eight average shopping malls in Delhi and saving of over 33 million units of electricity annually.
An interesting trend observed was that the 15 Watt CFL is the most popular among the customers (over 1.47 lakh CFLs bought) followed by the 20 W CFL (over 1 lakh CFLs sold).
Energy saving measures: According to ECBC 2007 the major energy saving measures in
commercial sector is as follows:
Optimising the building envelope as per ECBC 2007 standard.
Replacing the conventional T-12 (40 Watt) copper ballast tube lights with the energy
efficient T-5 (28 Watt) electronic ballast tube lights. It will give a saving of 42% per
tube light.
Replacing or optimising the existing HVAC system as per ECBC standard and BEE
star rated.
Replacing the existing unitary air conditioners with the BEE label Air conditioners. The saving potential would be 20% considering selection of air conditioning is 3-star
rated.
The overall saving which can be achieved by implementing all those measures would be 20% of the total consumption. If the energy efficient devices, as mentioned above are used in
commercial sector, the total consumption would reduce up to 2233.5 LU from 2791.85 LU in
2012. Full 100% replacement of these devices would be practically difficult due to resource constraints. However, these could be attempted through an Energy Services Company
(ESCO) mode where, the ESCO would make the investment for energy conservation
measures and recover the investment through energy savings. Taking into account the fact of adoption of energy efficient measures might be easier in commercial sector as compared
with the residential sector the total replacement potential has been decides as 90 percent by
2018.
The ESCO route could be tried in the office complex initially for ease of implementation.
Further, in addition to ESCO mode, the use of energy efficient devices should be promoted
through public private partnership. Such an example is in Delhi implemented by the Delhi Transco with manufacturer of CFLs. The details of the „Buy One get One‟ programme for
promotion of CFLs, being implemented in Delhi, as well as BEE‟s „Bachat Lamp Yojana‟ are
given in Annexure-6.
It has been assumed that the commercial sector of Faridabad will replace above suggested
devices in following manner; 30 percent by 2012 (short term), 60 percent by 2015, and
90percent by 2018. Thus the electricity consumption will be reduced to 2624 LU in SC scenario from 2792MU in BAU scenario in 2012 (short term). In 2015 (medium term) the
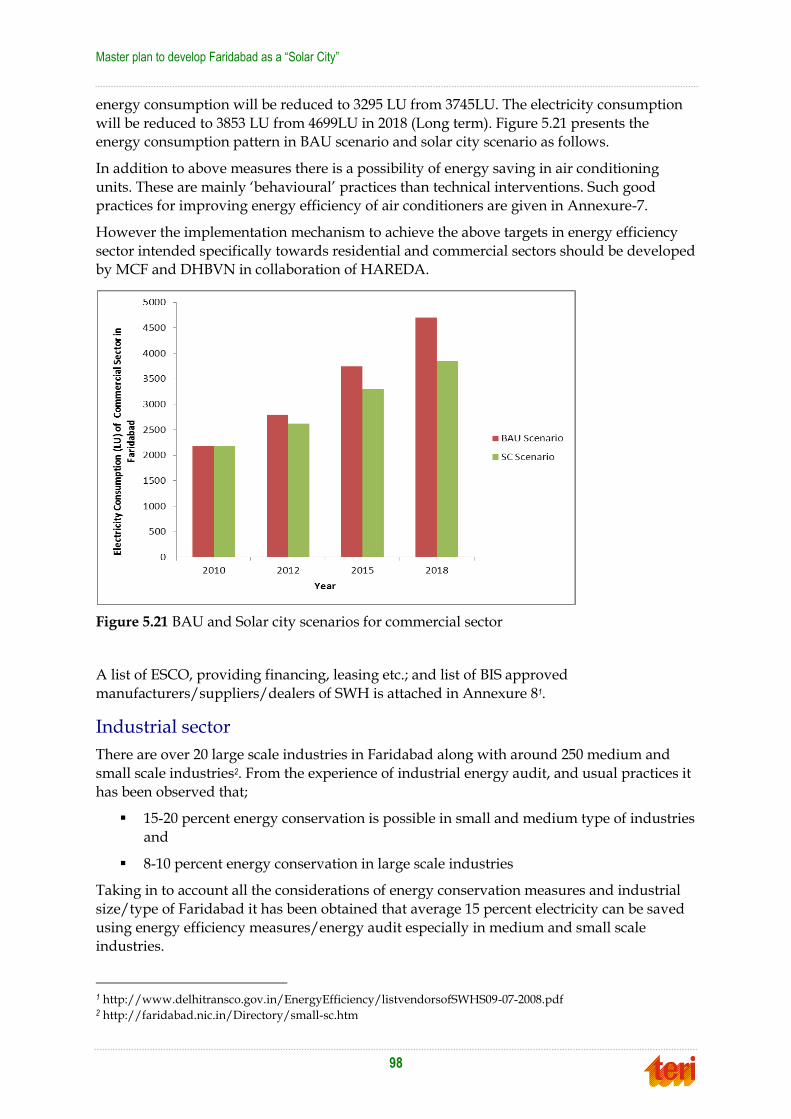
Master plan to develop Faridabad as a “Solar City”
98
energy consumption will be reduced to 3295 LU from 3745LU. The electricity consumption
will be reduced to 3853 LU from 4699LU in 2018 (Long term). Figure 5.21 presents the energy consumption pattern in BAU scenario and solar city scenario as follows.
In addition to above measures there is a possibility of energy saving in air conditioning
units. These are mainly „behavioural‟ practices than technical interventions. Such good practices for improving energy efficiency of air conditioners are given in Annexure-7.
However the implementation mechanism to achieve the above targets in energy efficiency
sector intended specifically towards residential and commercial sectors should be developed by MCF and DHBVN in collaboration of HAREDA.
Figure 5.21 BAU and Solar city scenarios for commercial sector
A list of ESCO, providing financing, leasing etc.; and list of BIS approved
manufacturers/suppliers/dealers of SWH is attached in Annexure 81.
Industrial sector
There are over 20 large scale industries in Faridabad along with around 250 medium and
small scale industries2. From the experience of industrial energy audit, and usual practices it
has been observed that;
15-20 percent energy conservation is possible in small and medium type of industries
and
8-10 percent energy conservation in large scale industries
Taking in to account all the considerations of energy conservation measures and industrial
size/type of Faridabad it has been obtained that average 15 percent electricity can be saved
using energy efficiency measures/energy audit especially in medium and small scale industries.
1 http://www.delhitransco.gov.in/EnergyEfficiency/listvendorsofSWHS09-07-2008.pdf 2 http://faridabad.nic.in/Directory/small-sc.htm

5. Energy planning of Faridabad
99
With respect to the opportunities to save energy in industries (in general), following areas
have been found (after preliminary walk through audit) where the potential of saving energy is high and upfront – in most of the cases – and can be achieved with least possible
efforts and investment,
a. Compressors – compressors have been found to be utilized in most of the industries, irrespective of the scale of the industry, and are major consumer of electricity.
Besides its presence, „compressors system‟ in most of the cases has been found major
source of leakage of energy.
The lines carrying compressed air to the utility point had been seen leaking in many
cases, which can be treated prudently, to save an enormous amount of energy.
Besides this, compressed air storage, if atomized carefully, can save additional energy.
b. Air conditioners – with a general walk through audit it has been found that most of
the air conditioning systems, both space and industrial cooling systems lines were not suitably insulated and therefore loosing valuable cooling. This measure can be
taken to save energy.
c. Electrical energy – It has been found in many cases that power factor drop occurs in the electrical lines causing loss of energy. With the usage of capacitor bank or
suitable power factor control measure, such losses can be avoided. Such measures
can be taken easily with a minimal investment.
d. Variable frequency operation – there are many compressors and motors which not
always are required to run on fixed speed. In other words, in many cases it has been
seen that the motors or compressors work on part load, leading to loss in efficiency and therefore energy. VFDs is a matured technology and can be applied using less
cost, leading to visible and quantifiable results in terms of energy saving.
e. Induction lamps – replacement of inefficient and power consuming High Pressure Sodium Vapour (HPSV) and High Pressure Mercury Vapour (HPMV) lamp with
Induction lamp.
For all these, MCF may follow up with the industries and suggest them for the energy audit of their facilities as per the BEE guidelines. As the industrial sector of Faridabad consumes
approximately 50 percent of total electricity annually; hence energy efficiency measures are
very critical in this sector towards electricity conservation.
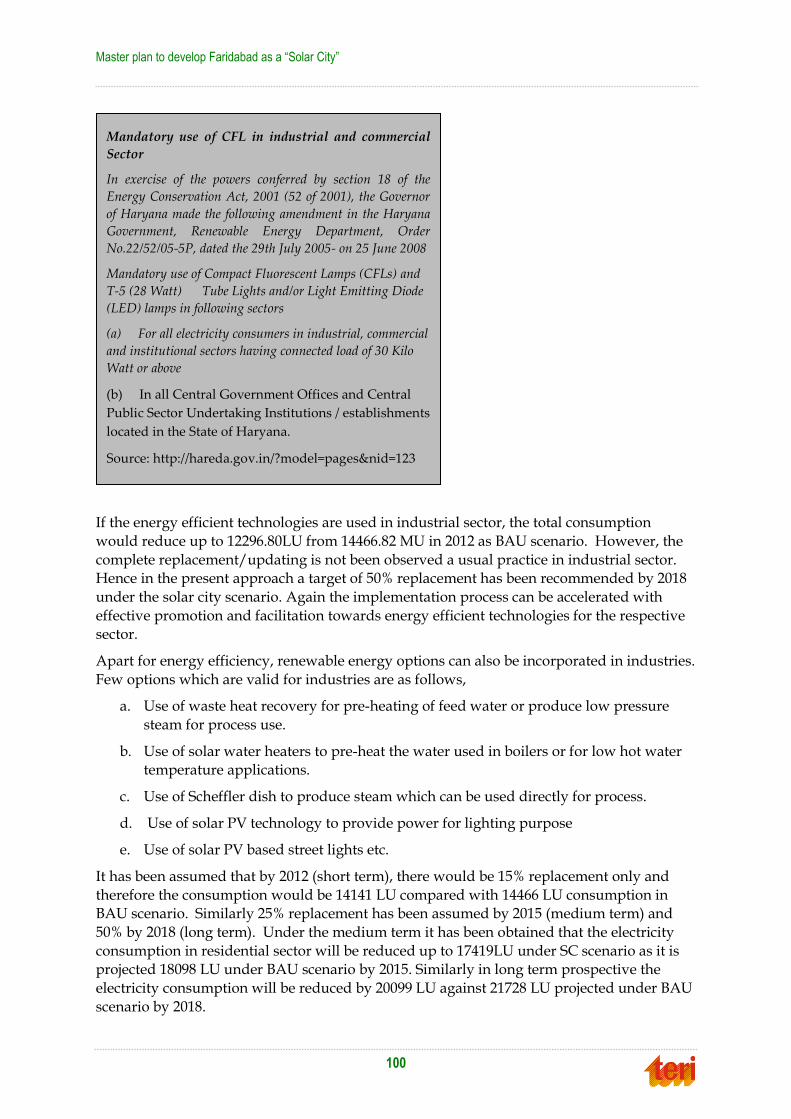
Master plan to develop Faridabad as a “Solar City”
100
If the energy efficient technologies are used in industrial sector, the total consumption
would reduce up to 12296.80LU from 14466.82 MU in 2012 as BAU scenario. However, the
complete replacement/updating is not been observed a usual practice in industrial sector. Hence in the present approach a target of 50% replacement has been recommended by 2018
under the solar city scenario. Again the implementation process can be accelerated with
effective promotion and facilitation towards energy efficient technologies for the respective sector.
Apart for energy efficiency, renewable energy options can also be incorporated in industries.
Few options which are valid for industries are as follows,
a. Use of waste heat recovery for pre-heating of feed water or produce low pressure
steam for process use.
b. Use of solar water heaters to pre-heat the water used in boilers or for low hot water temperature applications.
c. Use of Scheffler dish to produce steam which can be used directly for process.
d. Use of solar PV technology to provide power for lighting purpose
e. Use of solar PV based street lights etc.
It has been assumed that by 2012 (short term), there would be 15% replacement only and
therefore the consumption would be 14141 LU compared with 14466 LU consumption in BAU scenario. Similarly 25% replacement has been assumed by 2015 (medium term) and
50% by 2018 (long term). Under the medium term it has been obtained that the electricity
consumption in residential sector will be reduced up to 17419LU under SC scenario as it is projected 18098 LU under BAU scenario by 2015. Similarly in long term prospective the
electricity consumption will be reduced by 20099 LU against 21728 LU projected under BAU
scenario by 2018.
Mandatory use of CFL in industrial and commercial
Sector
In exercise of the powers conferred by section 18 of the
Energy Conservation Act, 2001 (52 of 2001), the Governor
of Haryana made the following amendment in the Haryana
Government, Renewable Energy Department, Order
No.22/52/05-5P, dated the 29th July 2005- on 25 June 2008
Mandatory use of Compact Fluorescent Lamps (CFLs) and
T-5 (28 Watt) Tube Lights and/or Light Emitting Diode
(LED) lamps in following sectors
(a) For all electricity consumers in industrial, commercial
and institutional sectors having connected load of 30 Kilo
Watt or above
(b) In all Central Government Offices and Central
Public Sector Undertaking Institutions / establishments
located in the State of Haryana.
Source: http://hareda.gov.in/?model=pages&nid=123

5. Energy planning of Faridabad
101
The electrical energy consumption after incorporating the energy saving options in
industrial sector in solar city scenario is shown in Figure 5.22.
Figure 5.22 BAU and Solar city scenarios for Industrial sector
Street lighting
Activity
Field survey of lighting scheme: This includes data collection and information gathering on
street lighting system.
Lamp inventory data has been provided by the electrical department of MCF and fixture survey has been performed, street lighting control mechanism has been
verified.
Lighting levels measurement has been conducted at a particular street with a digital lux meter and levels has been compared with the recommended levels.
Lighting load monitoring of existing system with the help of the electrical power
meter. The electrical parameter like Voltage (V), Ampere (I), and Power factor (PF), kW etc. has been monitored.
This has enabled the present scenario of electrical demand and energy consumption of
existing lighting. The design, installation and maintenance of the street lighting are controlled by MCF. The specifications and types of lamps being used in various roads of the
city has been given in table 5.3.
Table 5.3 List of lamps in street lights installed by MCF in Faridabad (till March 31, 2011)
S No. Particulars No. of
Fixture
No. of
Lamp
1 4/28/36/40W Tube lamp 24028 25708
2 14x4/24x4 W Tube Lamp 560 2240

Master plan to develop Faridabad as a “Solar City”
102
S No. Particulars No. of
Fixture
No. of
Lamp
3 150W Sodium Vapor Lamp 575 575
4 250W Sodium Vapor Lamp 12806 12806
5 2x11W Compact fluorescent
lamp
450 900
6 18/36x2/55x2 W Compact
fluorescent lamp
517 717
7 400W high Mast 21 378
8 400 W Halogen 11 132
9 250 W HPMV 762 762
Total 39370 44218
Identification of roads
Based on the energy audit of street lighting and the data collected from the Municipal
Corporation of Faridabad (MCF) it has been observed that the street lighting design is based
on the rule of thumb. From the energy audit it has been revealed that the roads are classified as
i) highway road
ii) commercial area road
iii) residential area road and
iv) service road
Presently inefficient fixtures with the conventional ballasts have been installed in most of the roads of the city. In addition there is no automatic control strategy installed in the feeder
pillar(s).
Figure 5.23 presents the sample photographs of few existing fixtures in Faridabad.
Box. ‘Bachat Lamp Yojana’ of BEE
Bachat Lamp Yojana, which is a CDM based CFL scheme is an innovative initiative put in place by the Central Government to enhance lighting efficiency in the Indian household sector by making Compact Fluorescent Lamps available at prices comparable to that of Incandescent Lamps. The scheme seeks to leverage the high cost of the CFLs through the CERs generated out of the project.
This is a public-private partnership between the Government of India, Private sector CFL Manufactures /Traders (Project Developers) and State level Electricity Distribution Companies to provide the framework to distribute high quality CFLs at about Rs.15 per piece to the households of the country. Under the scheme only 60 Watt and 100 Watt incandescent Lamps have to be replaced with 11to15 Watt and 20 -25 Watt CFLs respectively.
The Government would develop a programmatic approach (PoA) within which, individual CFL supplier would develop CDM projects. The Bureau of Energy Efficiency (BEE), being the statutory body set up under the Energy Conservation Act, 2001 by the Government of India, will coordinate the Small-Scale Programme of Activities (SSC-PoA) and will facilitate implementation of the programme in various States through their respective Electricity Distribution Companies (DISCOMs) with the assistance of the CFL suppliers. The development of the SSC-PoA is a voluntary action on the part of BEE and it would not seek any commercial revenues from the SSC-PoA. On the other hand, it will on behalf of the Government of India take the responsibility of monitoring of all project areas after the DISCOMs and the CFL suppliers have entered into a tripartite agreement (TPA) with BEE.

5. Energy planning of Faridabad
103
Figure 5.23 A typical fixture along with the lamp and ballast specifications
Existing lighting scheme
Street lighting design data have been collected for New Metro road of Faridabad during the
energy audit. For carrying out the analysis the street lighting design parameters of existing
street lighting schemes of the city has been considered.
During the field survey, the analysis has been compared with the Indian standard IS: 1944
(Parts I & II)1 recommended for lighting levels which is given in the Table 5.4.
Table 5.4 Lighting design requirement as per Indian standard
Classificat
ion of
lighting
installatio
n
Type of road Average
level of
illumination
on road
surface
Ratio
minimum/
average
illuminatio
n
Group A1 Important traffic routes
carrying fast traffic
30 0.4
Group A2 Other main roads carrying
mixed traffic like main city
streets, arterial roads,
throughways, etc
15 0.4
Group B1 Secondary roads with
considerable traffic like
principal local traffic routes,
shopping streets, etc
8 0.3
Group B2 Secondary roads with light
traffic
4 0.3
1 IS:1944 (Parts I &II)- Code of practice for lighting of public thoroughfares The standard for road lighting developed by Bureau of Indian Standards (BIS), Government of India.

Master plan to develop Faridabad as a “Solar City”
104
Simulation of street lighting using AGI-32
In order to access the performance of various street lighting technologies in Faridabad a simulation model has been developed using a computer software AGI-32; which essentially
estimates
Illumination level (lux) Uniformity of lighting level
Energy consumption
The computer simulation result shows that the existing lighting system is capable of producing average lighting levels around 10.3 Lux which is far less than the IS codes. The
coefficient of uniformity, which is the ration of minimum to average illumination, has been
found 0.6. Figure 5.24 presents distribution of lighting levels for a typical streetlight in Faridabad. The figure indicates that the blue patches signify the lower illumination level
achieved in the existing lighting systems. The average illumination level has been measured
as 10.3 Lux during the energy audit.
Figure 5.24 Distribution of lighting levels for a typical streetlight in Faridabad1
As the maximum roads of the city have similar street lighting schemes hence the
illumination levels are not standardized as per the IS: 1944. The Candela power curve of the same street lighting system is presented in Figure 5.25; which shows the downward
distribution of light.
Figure 5.25 Polar distribution curve for a typical streetlight in Faridabad
1 AGI-32

5. Energy planning of Faridabad
105
The energy efficient street lights improve the illumination levels along with the less energy
consumption. The distribution pattern of one desired streetlight system has been presented in Figure 5.26; which shows the uniformity of flux distribution and comprises less energy as
compared with the earlier one.
Figure 5.26 Distribution of lighting levels of recommended streetlight in Faridabad1
The simulation exercise has been carried out for T-5, LED based streetlights along with
Sodium Vapor Pressure lamps with electronic ballast instead of magnetic ballast.
Energy saving options: There is a considerable amount of energy saving potential exist in
this sector.
Annexure 9 contain specifications of street lighting mentioned in a tender document released by HAREDA2.
Appropriate measures and recommendations is to adopt electronic multi tab ballast instead
of magnetic ballast with astronomical timer switch. The brief details of astronomical timer switch technique are presented in Annexure-10. The recommendations for energy saving in
street lighting are
a. Replacing existing ballast with energy saving multi-tab ballast with astronomical switch
During the audit it has been observed that the operating load remains same throughout the
night. Keeping this in mind it is suggested to install the multi tab ballast which varies the load of the lamp according to the traffic load during the night. Multi tab ballast comes with a
facility of setting the time for which the lamp will run up to its full capacity. So, during the
evening operating hours the timer is set for the full loading of lamp and during midnight onwards it will be set for 50% loading of the lamp. Astronomical timer switch will help in
reducing the wastage of lighting consumption as due to seasonal variation the operating
hours of street lighting does change. So, the switch doesn‟t allow street light to get on before the dusk and after the dawn.
1 AGI-32 2 http://hareda.gov.in/store/document/hareda604321396.pdf

Master plan to develop Faridabad as a “Solar City”
106
With the initiatives of HAREDA the MCF has already started using some of the energy
efficient street lighting fixtures and lamps in the city. As the city has already adopted energy efficient lamps hence the potential of energy savings are limited (approximately 25%) in the
city.
Use of LED based street lights
Although not very much commercialised, the Light Emitting Diode (LED) based street
lighting systems can be one of the major potential source for the energy saving in street
lighting systems. Life of the LED fixtures is more about 100,000 hours as compared to conventional fixtures besides these consumes 50% less power with conventional fixtures.
Based on the capacity and the specific luminaries requirements the LED street light systems
can save about 50 to 70% of energy. Further if the LED based solar powered street lights would be used then the almost zero carbon emission in street lighting can be achieved.
Projected load for street lighting
The influx of population in the city requires augmentation of streetlights. Presently (till December 2009) there are approximately 39730 street lights in Faridabad. The number of
street lights and hence the load may be increase with increasing population and expansion
of the city. Taking in to account the present population growth rate it has been estimated that there will be 41764 street lights in 2010, 45711 Nos. by 2012, 51597 Nos. by 2015 and
58241 Nos. in 2018 respectively. Simultaneously the connected load of street lighting will
increase to 6.41 MW in 2012, 7.24 MW in 2015 and 8.17 MW in 2018; which is 5.57 MW presently.
The electricity consumption in street lighting in Faridabad city has been reported as 86.65
LU by the end of 2009 by Municipal Corporation. Assuming the present use pattern of street lighting in the city the consumption pattern has been estimated as 100 LU to 2012, 113 in
2015 and 127 MU in 2018.
Energy saving potential
At present the total electricity consumption in exiting street lighting system is reported as
approximately 90.31 LU (for the year 2010). Based on the energy audit and analysis of the
existing street lighting system, the cumulative potential to reduce electricity consumption of street lighting systems is observed as 39 percent approximately.
Hence using above energy efficiency measure in street lighting the electricity consumption
can be reduced to 55 LU in Solar City Scenario from 90.31 LU in BAU scenario.
Further it has been assumed that 100 percent implementation of suggested energy efficient
measure will be carried out by 2015 and further similar approach has been adopted for
medium term and long term projections. Hence solar city scenario will remain constant
along with increased demand of electricity for street lighting in the city.
Hence under the solar city scenario the cumulative savings through energy efficiency
measures in street lighting will save a significant quantum of energy. It has been obtained that the electricity consumption in this sector will be 80.5 LU against 100 LU by 2012 (50
percent replacement); while it is will be 68.93 LU by 2015 (100 percent replacement) as it is
predicted as 113 LU as per BAU scenario.

5. Energy planning of Faridabad
107
It has to be noted that the impact of LED based street lighting has not been taken into
account to estimate the savings through energy efficiency measures in the above analysis ; while a detailed analysis for LED based street lights has been given in Annexure-11.
As a pilot project for demonstration, following two street lighting projects have been identified to be implemented under Faridabad Solar City program by the year 2011-12
1. Energy Efficiency in municipal street lighting through renewable energy
It is proposed to replace existing conventional 100 street lights with LED based Solar Lights of 120 watt that operate with centrally installed three solar power plants of 8 KW capacities.
Presently LED lamps with efficacy of 100-120 lumens per watt are available in the market.
Since LED lamps provide directional light and better color rendering index (CRI) besides no light pollution. LED lamp has no mercury content.
To install 100 nos LED based Solar Lights of 120 watt capacities operational with centrally
installed three solar power plants of 8 KW capacities , the MNRE/GOI , HAREDA and users financial assistance may be proposed as under:-
Table 5.5 LED based Solar powered energy efficient street lighting project identified for
implementation under the solar city project
Sr.
No.
Description
(capacity)
Capacity Total
cost
MNRE
/GOI
share.
@ Rs.
81/
watt
State Govt. share (Rs lakh) Total
(Rs
lakh)
HAREDA User
Dept /
Agency
Private
Sector
1. Energy Efficiency
in Municipal
Street Lights ( 100
nos LED Based
Solar Lights of 120
3x 8 KW
capacity
centrally
solar power
plants
99.00 19.44 39.78 39.78 0.00 99.00
Mandatory use of energy efficient Street Lights in haryana
In exercise of the powers conferred by section 18 of the Energy Conservation Act,
2001 (52 of 2001), the Governor of Haryana made the following amendment in the
Haryana Government, Renewable Energy Department, Order No.22/52/05-5P,
dated the 29th July 2005- on 25 June 2008
It shall be mandatory that the street lighting in all existing and new colonies and
urban areas notified by the Urban Local Bodies Department, Haryana Urban
Development Authority sectors, Haryana State Industrial & Infrastructure
Development Corporation industrial estates, housing complexes, colonies and
townships developed by private / semi government/ autonomous institutions shall
use energy efficient street lighting fixtures using T-5 tube lights/ Light Emitting
Diode (LED) Lamps/ Low Pressure Sodium Vapour (LPSV)/ High Pressure
Sodium Vapour (HPSV) / induction arc lamps.
Source: http://hareda.gov.in/?model=pages&nid=123

Master plan to develop Faridabad as a “Solar City”
108
Sr.
No.
Description
(capacity)
Capacity Total
cost
MNRE
/GOI
share.
@ Rs.
81/
watt
State Govt. share (Rs lakh) Total
(Rs
lakh)
HAREDA User
Dept /
Agency
Private
Sector
watt from B K
Chowk to
Hardware chowk)
2. Energy conservation in municipal street lighting through installation of LED/Induction arc lamps with automatic controllers.
It is proposed to replace existing conventional inefficient street lights fixtures in Faridabad
with 120 watt LED lights / 80 watt Induction Arc Lamps with Microprocessor controlled
ON/OFF timer from Bata Chowk to Hitkari Chowk.
To install 200 LED / Induction Arc Lamps with the MNRE/GOI and BEE/ GOI financial
assistance may be proposed as under:-
Table 5.6 Microprocessor controller based energy efficient street lighting project identified
for implementation under the solar city project
Sr.
No.
Description Capacity Total
cost
MNRE/
GOI
share. @
Rs. 81/
watt
BEE/G
OI
State Govt. share (Rs Lakh) Total
(Rs
lakh)
HAREDA User
Dept /
Agency
Private
Sector
1. Energy Efficiency
in Municipal
Street Lighting
through LED /
Induction Arc
fixtures (Qty 200
nos) from Bata
Chowk to Hitkari
Chowk with
Microprocessor
controlled
ON/OFF timer.
120 Watt
LED / 80
Watt
Induction
Arc
Lamps.
30.00 15.00 15.00 0.00 0.00 0.00 30.00
Annexure 12 contains technical specifications of energy efficient lighting given by HAREDA. For more information, please visit footnoted link1.
Annexure 13 contains technical information of Induction Lamp.
1 Source: http://hareda.gov.in/store/document/hareda895565292.pdf

5. Energy planning of Faridabad
109
Municipal water pumping
A detailed energy audit of pumps supplying water to Faridabad city was undertaken by TERI in order to assess the electricity consumption in pumping for the city. The Faridabad
city is being supplied from two sources of water i.e. river water and Tube well. The water
from the river is being supplied from water pumping station. It has been observed that the total annual operating energy consumption of water pumping is approximately 555 LU
(2010-2011); while the connected load for water pumping by 2008 has been reported as 12.8
MW. The electrical energy demand reduction and conservation option is discussed below.
Replacing existing inefficient pumps (water pumping station and tube well) with energy efficient pumps
It has been observed that the cumulative number of pumps in water pumping station is 53; out of which 11 pumps have been installed before the year 2000. From the energy audit
exercise it has been observed that the energy efficiency measures will be recommended only
for the pumps in water pumping station installed before the year 2000. The electrical load for these 11 water pumps has been obtained as 548.3 kW; while rest pumps comprise 2.01 MW
connected load. The same measures are proposed for tube-wells also. During the energy
audit it has been observed that the water pumps (water pumping stations and tube-wells) installed are running at 55% efficiency. The operating electrical demand of water pumping
was 555 LU (source: DHBVN). Using energy efficiency measures in the respective sector the
electricity consumption could have been reduced up to 338 LU.
The option given above could be implemented in the municipal water-pumping sector up to
2018 with 15 % replacement per year. The electricity required for water pumping by 2018
has been estimated based on the population growth rate of the city. It has been obtained that the electricity consumption for water pumping systems will be increased to 613 LU by 2012,
712 LU in 2015 and 827 in 2018.
It was observed that the energy consumption calculated from the data given by MCF is more than the energy consumption data provided by DHBVN. A conclusion was drawn that the
running time in the data given by MCF is inclusive of other activities involved like
maintenance etc. due to which the calculated kWh were more.
From the above energy efficiency and conservation measures it is estimated that the
electricity consumption can be reduced by 8.9 percent of the total annual electricity
consumption by to 2018. Table 5.7 presents the summary of electricity consumption under BAU and solar city scenarios under short, medium and long term durations.
Table 5.7 Summary of electricity consumption in BAU scenario and solar city scenario
Year Scenario(s) Residential
sector
(LU)
Commercial
Sector (LU)
Industrial
Sector (LU)
Street
lighting
(LU)
Water
pumping
(LU)
BAU SC BAU SC BAU SC BAU SC BAU SC
2012 Short term 8457 8364 2791 2624 14466 14141 100 80 613 601
2015 Medium
term
10930 9728 3745 3296 18097 17419 113 68 712 644
2018 Long term 13404 11192 4698 3853 21728 20098 127 77 827 703
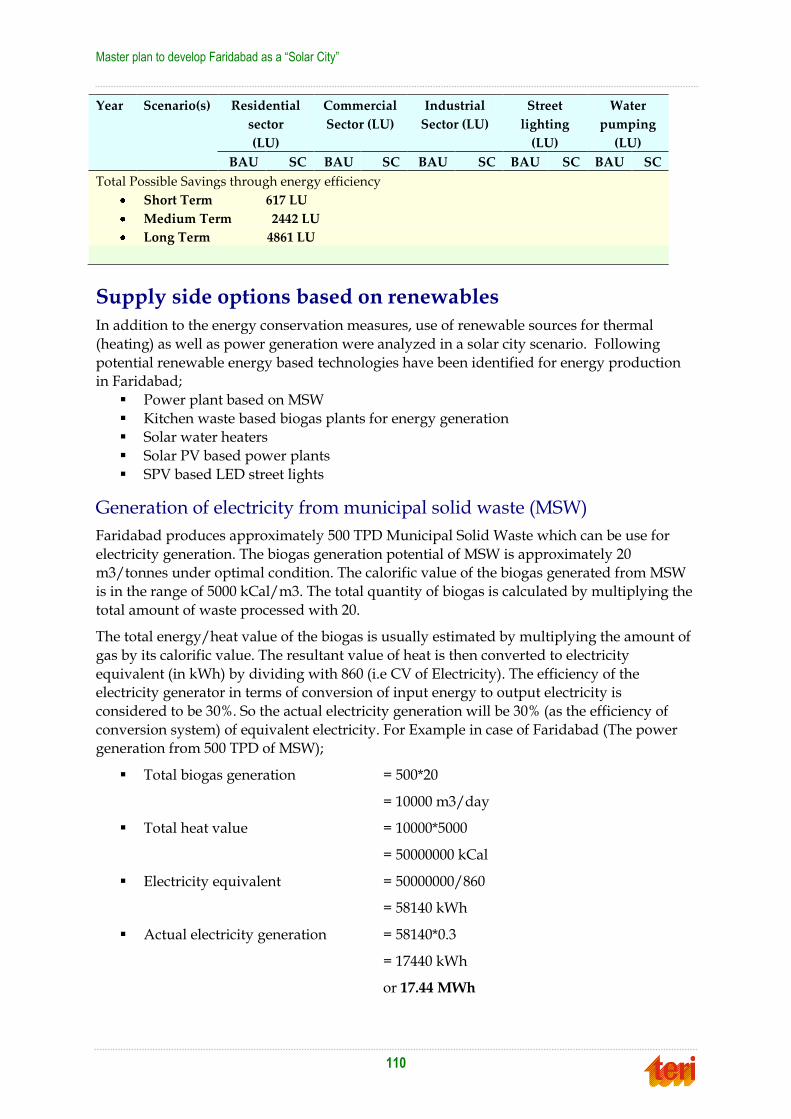
Master plan to develop Faridabad as a “Solar City”
110
Year Scenario(s) Residential
sector
(LU)
Commercial
Sector (LU)
Industrial
Sector (LU)
Street
lighting
(LU)
Water
pumping
(LU)
BAU SC BAU SC BAU SC BAU SC BAU SC
Total Possible Savings through energy efficiency
Short Term 617 LU
Medium Term 2442 LU
Long Term 4861 LU
Supply side options based on renewables
In addition to the energy conservation measures, use of renewable sources for thermal
(heating) as well as power generation were analyzed in a solar city scenario. Following
potential renewable energy based technologies have been identified for energy production in Faridabad;
Power plant based on MSW
Kitchen waste based biogas plants for energy generation Solar water heaters
Solar PV based power plants
SPV based LED street lights
Generation of electricity from municipal solid waste (MSW)
Faridabad produces approximately 500 TPD Municipal Solid Waste which can be use for
electricity generation. The biogas generation potential of MSW is approximately 20 m3/tonnes under optimal condition. The calorific value of the biogas generated from MSW
is in the range of 5000 kCal/m3. The total quantity of biogas is calculated by multiplying the
total amount of waste processed with 20.
The total energy/heat value of the biogas is usually estimated by multiplying the amount of
gas by its calorific value. The resultant value of heat is then converted to electricity
equivalent (in kWh) by dividing with 860 (i.e CV of Electricity). The efficiency of the electricity generator in terms of conversion of input energy to output electricity is
considered to be 30%. So the actual electricity generation will be 30% (as the efficiency of
conversion system) of equivalent electricity. For Example in case of Faridabad (The power generation from 500 TPD of MSW);
Total biogas generation = 500*20
= 10000 m3/day
Total heat value = 10000*5000
= 50000000 kCal
Electricity equivalent = 50000000/860
= 58140 kWh
Actual electricity generation = 58140*0.3
= 17440 kWh
or 17.44 MWh

5. Energy planning of Faridabad
111
Assuming 16 hours of operation of MSW power plant a power plant of the capacity of 1 MW
can be installed in Faridabad which will generate 17.44 MWh (0.1744 LU) electricity per day. Hence the MSW power project of above capacity will generate 63.66 LU electricity annually.
The performance of MSW will indirectly govern by the MSW collection efficiency. As the
MSW capacity is increasing in Faridabad; the capacity of the plant may further increase.
Figure 5.27 presents the process flow diagram as well as layout of the power plant based on
MSW.
Figure 5.27 Schematic process diagram and MSW power Plant

Master plan to develop Faridabad as a “Solar City”
112
Kitchen waste based Biogas plants for energy generation in Residential Society
In Faridabad, new urbanisation areas, there are generally 7-8 towers in one residential
society developed by the colonizers. Each tower has the occupancy of 70 - 80 households
and each household having 4 to 5 family members, which generate about1.20 to 1.5 Kg of kitchen waste every day. Therefore, approx. 100 to 120 kg kitchen waste is being generated
daily in each tower and for the campus of 7-8 towers; the kitchen waste of about 750 Kg to
1000 kg is being generated every day.
Based on the research it has been found that the anaerobic digestion of food wastes can
generate about 50 to 150 m3 of biogas per tonne of waste depending upon the characteristics
of waste, digester design and operating conditions etc. The calorific value of this biogas Is in the range of 5000 to 6000 kCal/m3. Asuming that by using advanced digester design and
optimum digestion conditions, the food wastes (750 kg/day) in Faridabad can generate
about 80 m3/day of biogas. And the 30% conversion efficiency of gas based electricity generation plant, it is estimated that for each colony of 7-8 residential towers approximately
15kW capacity power plant may be installed. A calculation of power plant capacity based on
750 kg/day kitchen waste is given below
Quantity of kitchen waste = 750 kg/day
Total biogas generation = 80 m3/day
Total heat value = 80*5000 kCal
= 400000 kCal
Electricity equivalent = 400000/860
= 465 kWh
Actual electricity generation = 465*0.3 kWh
= 139 kWh
Assuming 8 to 9 hours of operation of kitchen waste based power plant a power plant of the
capacity of about 15 kW capacity can be installed in each housing society which will
generate about 139 kWh of electricity daily. The electricity generated shall be used for the campus lighting of the towers and society complex. The plant shall also generate about 750
kg dry fertilizer every day which shall be utilized for the gardening of the campus.
Moreover, on the bases of survey conducted elsewhere i.e. in hostels, institutions, hotels, hospitals, and restaurants, followings results have been obtained,
a. In restaurants, it has been found that although they produce a large quantity of
waste, the problem exist regarding space for installation of the biogas unit.
A compact biogas plant which is produced by organizations like Arti and companies
like Syntex may also be considered, however, there are concerns regarding the
connection of plant to the usage point, aesthetics and especially space.
b. Many hostels have found to be buying food from outside instead of having their own
messes. Therefore, the total organic waste being produced was very less in those
hostels however some large institutions having hostels with mess facilities need to be
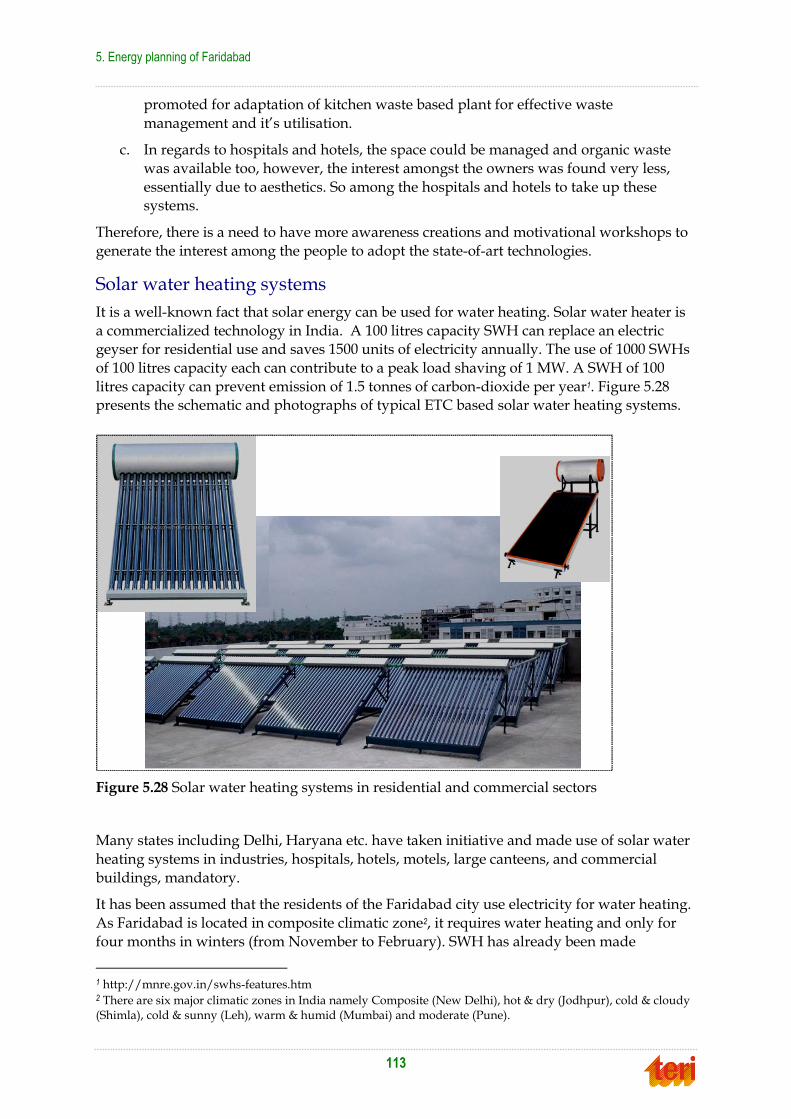
5. Energy planning of Faridabad
113
promoted for adaptation of kitchen waste based plant for effective waste
management and it‟s utilisation.
c. In regards to hospitals and hotels, the space could be managed and organic waste
was available too, however, the interest amongst the owners was found very less,
essentially due to aesthetics. So among the hospitals and hotels to take up these systems.
Therefore, there is a need to have more awareness creations and motivational workshops to
generate the interest among the people to adopt the state-of-art technologies.
Solar water heating systems
It is a well-known fact that solar energy can be used for water heating. Solar water heater is
a commercialized technology in India. A 100 litres capacity SWH can replace an electric geyser for residential use and saves 1500 units of electricity annually. The use of 1000 SWHs
of 100 litres capacity each can contribute to a peak load shaving of 1 MW. A SWH of 100
litres capacity can prevent emission of 1.5 tonnes of carbon-dioxide per year1. Figure 5.28 presents the schematic and photographs of typical ETC based solar water heating systems.
Figure 5.28 Solar water heating systems in residential and commercial sectors
Many states including Delhi, Haryana etc. have taken initiative and made use of solar water
heating systems in industries, hospitals, hotels, motels, large canteens, and commercial
buildings, mandatory.
It has been assumed that the residents of the Faridabad city use electricity for water heating.
As Faridabad is located in composite climatic zone2, it requires water heating and only for
four months in winters (from November to February). SWH has already been made
1 http://mnre.gov.in/swhs-features.htm 2 There are six major climatic zones in India namely Composite (New Delhi), hot & dry (Jodhpur), cold & cloudy (Shimla), cold & sunny (Leh), warm & humid (Mumbai) and moderate (Pune).

Master plan to develop Faridabad as a “Solar City”
114
mandatory in domestic and commercial sectors by HAREDA, which is also specified in
previous chapters. Apart from that MCF has also made the use of SWH mandatory in the same categories as specified by HAREDA with the release of bye-laws, as attached in the
subsequent annexures. The implementation of the policy should be focused on, so that more
deployment of SWH can be achieved. In addition depending upon the type and size of industries solar water heater could be recommended for industrial sector too.
It has been noticed from „energy use pattern‟ in residential sector of composite climatic
zone1, and also from the residential sector survey conducted for this project, that the water
heating application consumes approximately 26% of the total energy. On the basis of electricity consumption data it has been observed that the electricity consumption for water
heating application in the city is 1362.4 LU in 2008 (BAU scenario).
1 Jain Manisha (2006), Energy Efficiency in Residential Sector of Delhi, in proceedings of Workshop on ;Developing an energy efficiency and conservation program for Delhi‟, TERI New Delhi, India.
Mandatory use of Solar Water Heating System
The provision in section-347, 349 and 392 (D) of Faridabad municipal bye-laws has made mandatory use
of SWH system which are conforming to BIS (Bureau of Indian Standards) as per Specification IS 12933,
for building plans of the buildings namely, industries with hot water requirement for processing, hospitals,
nursing homes, hotels, motels, banquet halls, guest houses, lodges, barat ghars, kalian mandaps and
buildings of similar use, barracks of armed forces, paramilitary forces, police canteens, group housing
society complexes, residential buildings on a plot of 500 square yards and above and all Government
buildings, hostels of schools, colleges, technical/vocational institutions, tourist complexes and universities.

5. Energy planning of Faridabad
115
Steps taken by Govt. of National Capital Territory of Delhi towards implementation of Solar Water Heaters
Govt. of NCT Delhi has notified, vide office order no. F/ No.11(149)/2004/Power/2387 dated 28.09.06 for mandatory use of solar water heating system in following categories of the buildings- 1) Industries where water is required for processing, 2) Hospitals and nursing homes, 3) Hotels and Motels, 4) Jail Barracks, 5) Large canteens 6) Corporate buildings with plot area greater than 500 m2 , 7) Residential buildings having an area of 500 m2 or above excluding Delhi Cantonment Area 8) all govt. department buildings of NCT of Delhi, schools, educational institutions etc. Govt. also made mandatory the use of ISI marked motor pump sets, power capacitors foot valves in agriculture sector. Govt. ordered that all discoms and municipal council of Delhi shall make the amendments in the load demand notice for new connections to ensure use of only ISI marked pumps its accessories and other ISI marked pumps in NCT of Delhi. It asked the designated agency to ensure the implementation of these directions in the NCT of Delhi as per the provisions of the Energy Conservation Act 2001.
Apart from this mandating of the use of SWH the govt. of NCT of Delhi is promoting the use of SWH by granting cost subsidy as an incentive to domestic consumers only. Accordingly govt. of NCT of Delhi has decided to give a subsidy of Rs. 6000/- per consumer as lump sum grant (Rs. 100 per month for a period of 5 years). The subsidy amount id provided through Delhi Energy Efficiency and Renewable Energy Management Centre of Delhi Transco Limited after conducting third party inspection.
Financial Incentives from Central Government:
The central govt. through Ministry of New and Renewable Energy provides interest subsidy to make soft loans available @ 2% interest to domestic users, 3% to industrial users not availing accelerated depreciation and 5% to industrial/commercial users availing accelerated depreciation from IREDA, public/private sector banks, RBI approved non-banking agencies etc.
Solar Water Heating is one of the technologies being promoted by Haryana Renewable
Energy Development Agency (HAREDA) in the state. Realizing the need of power, Haryana Govt. has made the installation of solar water heating systems mandatory in
process industries, hotels, hospitals and nursing homes, group housing societies and
residential houses built on plots of size 500 sq.yds. & above in the municipal and HUDA controlled areas. As demand side management measure, the State Govt. is providing a
rebate in the electricity bills to the users of solar water heating systems in the domestic sector
@ Rs. 100/- per 100LPD capacity solar water heating system per month upto 300 LPD capacity. The rebate shall be of Rs. 1200/- annually for 100 LPD systems, Rs. 2400/- for 200
LPD systems and Rs. 3600/- for 300 LPD systems. This rebate would remain effective for a
period of 3 years. The state government is also providing the subsidy of Rs 2000 per sq. mtr. For FPC subject to a maximum of 4 sq. mtr collector area and Rs 1000 per sq. mtr. For ETC,
limited to Rs 3000 or 200 lpd capacity on a 100 lpd system and Rs 10000 on a 200 lpd system1.
As per the JNNSM guidelines, MNRE/GOI shall provide subsidy to the residents of solar
cities @Rs.3300/- per sq.m. for Flat Plate Collector and Rs.3000/- for the Evacuated Tube
Collector based systems. . The detail of the subsidy scheme on solar water heating system of
HAREDA is given in Annexure- 14. As per the information provided by DRDA/HAREDA
approximately 20000 LPD domestic Solar Water Heating Systems of different capacities have been supplied, installed and commissioned by the Department through the different BIS
approved manufacturers in Faridabad.
The MCF/Solar City cell may take initiatives and plan few pilot projects for the installation of SWH systems in the government buildings and institutions like government housing
society, Individual houses, jail, government schools/college hostels etc. by availing the state
as well as central government subsidies and promote the private sectors too through awareness creations about the SWH benefits and the available subsidies.
1 http://hareda.gov.in//store/document/hareda159105988.pdf (Order dated 29-08-11, on continuation of state subsidy on domestic solar water heating system for the year 2011-12)

Master plan to develop Faridabad as a “Solar City”
116
However it would take some time by which all the households could make a changeover to
solar water heating systems (SWHs). In BAU scenario it has been assumed that all water heating in the city is through the electricity. Therefore, it is assumed that solar water heating
technology will be adopted by 5 percent residents by 2012. It is presumed that well adoption
and successful implementations of the technology will accelerate the use of SWHs. In the
medium term the implementation of SWHs has been decided as 10 percent by 2015. The
assumption has been made that the 25 percent households will be using SWHs up to 2018.
Figure 5.29 presents the reduction in electricity consumption due to the use of solar water heating systems in BAU as well as solar city scenario up to the 2018.
Figure 5.29 Solar water heating options under BAU and solar city scenarios
It has been estimated that implementing above targets for solar water heaters in Faridabad
city the energy savings will be 110 LU by 2012, 240 LU by 2015 and 737 LU by 2018.
Other opportunities of application of SWH
Apart from residential sector, opportunities of application and use of SWH in other areas
were analysed too. It has been found that SWH can be installed in commercial kitchens,
laundries, car washing, hotels, hostels, restaurants, hospitals and societies. The rationale
behind the possibility of use in these areas is based on the requirement of hot water.
A categorical list of application areas and facilities in Faridabad where SWH can be installed
is given in Annexure 15.
Also see Annexure 16, containing technical specifications provided by HAREDA in one of its
tender document.

5. Energy planning of Faridabad
117
A survey was conducted in few representative facilities to validate the potential of
application of SWH and to obtain other information. The survey results are summarized below:
1. In terms of available roof area for installation of SWH, hostels and institutions
are the ones having maximum available roof area in proportion to the hot water demand. This is followed by hotels, hospitals, societies and restaurants,
where roof area is available but it is less in proportion to the hot water
demand.
2. In case of restaurants, it has been found that in most of the cases the roof
ownership is not available with the restaurant.
3. Hotel sector has a lot of potential of use of SWH due to continuous and large demand. Furthermore, it has been found that many hotel owners know about
SWHS, but only handful had actually gone forward for installation. In
substantial cases, hotel owners were unwilling to install SWHs because of issues faced by some hotel – which has proliferated – including continuous
hot water availability, system down time due to issues like hard water etc.,
longer paybacks etc.
4. In hospitals the places of hot water consumption are kitchen and laundry.
Most of the hospitals did have boilers for producing steam which is used
during laundry, dry-cleaning, and for other purposes. However, most of the hospitals did not want to couple it with any renewable energy mechanics due
to criticality of the application as well as because of a notion related to
uncertainty of resource and non-continuous supply.
5. In societies, albeit substantial requirement/demand of hot water, the interest
within the members was found less. The reason being the hot water
requirement in proportion to the available area where SWHS can be installed, in very less, and therefore, there shall be disparity regarding allocation of the
resource. This part was well understood by the society members and that‟s
why not many steps have been taken in this regard.
Rooftop solar PV
The New Faridabad is well planned with proper orientation of the building of residential as
well as commercial/Institutional sectors. It has been observed that the residential & commercial sectors cover approximately 99.68 km2 area in the city out of total area of 178
km2. Roof top solar PV based grid connected SPV system might be well feasible in the city.
It has been observed that the individual houses, housing societies, commercial building, institutional buildings, Government buildings, markets etc. have very large roof areas which
are not being used. The grid connected solar PV systems of 100 to 500 kW capacities are
technically feasible in commercial buildings while up to 10 kW capacity systems might be feasible in residential sector.
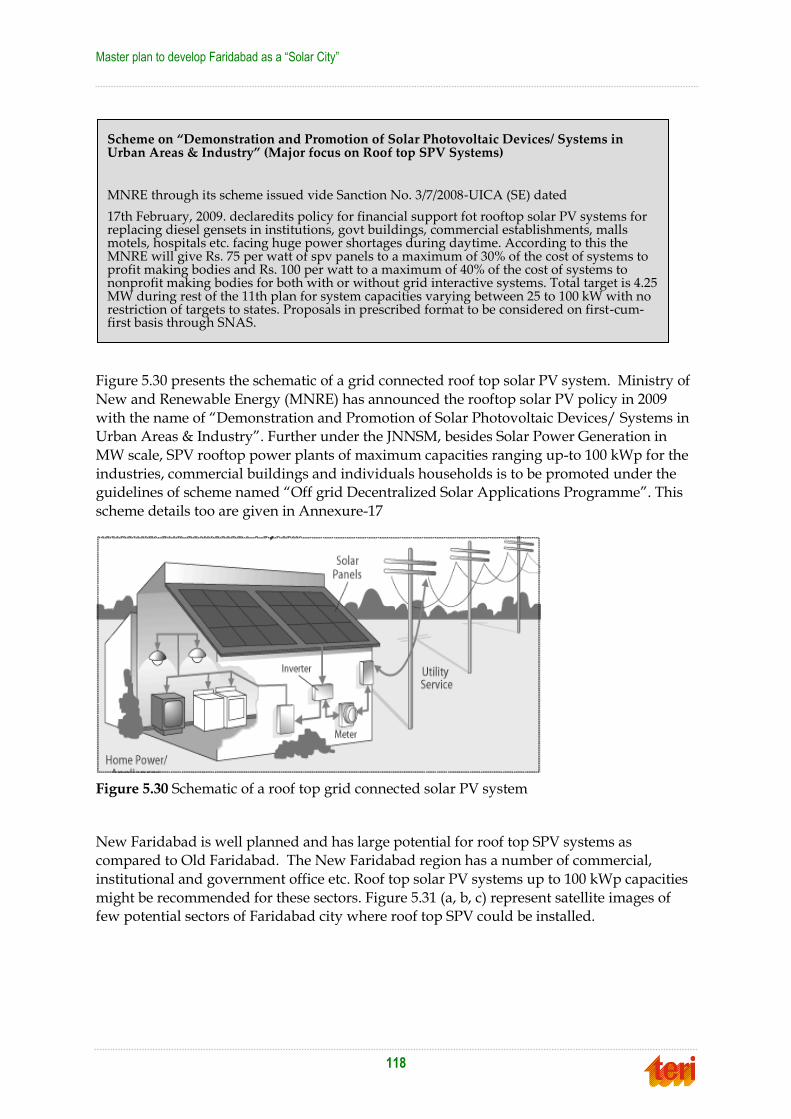
Master plan to develop Faridabad as a “Solar City”
118
Figure 5.30 presents the schematic of a grid connected roof top solar PV system. Ministry of
New and Renewable Energy (MNRE) has announced the rooftop solar PV policy in 2009
with the name of “Demonstration and Promotion of Solar Photovoltaic Devices/ Systems in Urban Areas & Industry”. Further under the JNNSM, besides Solar Power Generation in
MW scale, SPV rooftop power plants of maximum capacities ranging up-to 100 kWp for the
industries, commercial buildings and individuals households is to be promoted under the guidelines of scheme named “Off grid Decentralized Solar Applications Programme”. This
scheme details too are given in Annexure-17
Figure 5.30 Schematic of a roof top grid connected solar PV system
New Faridabad is well planned and has large potential for roof top SPV systems as
compared to Old Faridabad. The New Faridabad region has a number of commercial,
institutional and government office etc. Roof top solar PV systems up to 100 kWp capacities
might be recommended for these sectors. Figure 5.31 (a, b, c) represent satellite images of few potential sectors of Faridabad city where roof top SPV could be installed.
Scheme on ‚Demonstration and Promotion of Solar Photovoltaic Devices/ Systems in Urban Areas & Industry‛ (Major focus on Roof top SPV Systems)
MNRE through its scheme issued vide Sanction No. 3/7/2008-UICA (SE) dated
17th February, 2009. declaredits policy for financial support fot rooftop solar PV systems for replacing diesel gensets in institutions, govt buildings, commercial establishments, malls motels, hospitals etc. facing huge power shortages during daytime. According to this the MNRE will give Rs. 75 per watt of spv panels to a maximum of 30% of the cost of systems to profit making bodies and Rs. 100 per watt to a maximum of 40% of the cost of systems to nonprofit making bodies for both with or without grid interactive systems. Total target is 4.25 MW during rest of the 11th plan for system capacities varying between 25 to 100 kW with no restriction of targets to states. Proposals in prescribed format to be considered on first-cum-first basis through SNAS.

5. Energy planning of Faridabad
119

Master plan to develop Faridabad as a “Solar City”
120
Figure 5.31 (a, b, c) Satellite view of few potential sectors in Faridabad for roof top SPV
In order to evaluate the performance of grid connected roof top Solar PV in Faridabad city, a
computer simulation program has been developed using RETScreen software. The capacities
of the SPV systems have been chosen from 25 kWp to 500 kWp. The annual electricity generated by the SPV system of above capacities has been presented in Figure 5.32. The
cumulative roof area required for setting up 2 MWp solar PV based power plant(s) in the
city has been determined using RETScreen software and is given in Figure 5.33. In order to determine the annual electrical output and area requirement the calculation has been made
for the solar cell model of BP at the efficiency of 14.3%; which is available in Indian market.
Figure 5.32 Performance of Roof top SPV Systems in Faridabad estimated through
RETScreen Software
41.09
80.49
160.98
394.12
771.73
0
100
200
300
400
500
600
700
800
25 kWp 50 kWp 100 kWp 250 kWp 500 kWp
Capacity (kWp)
An
nu
am
l E
lectr
icit
y G
en
era
tio
n (
MW
h)
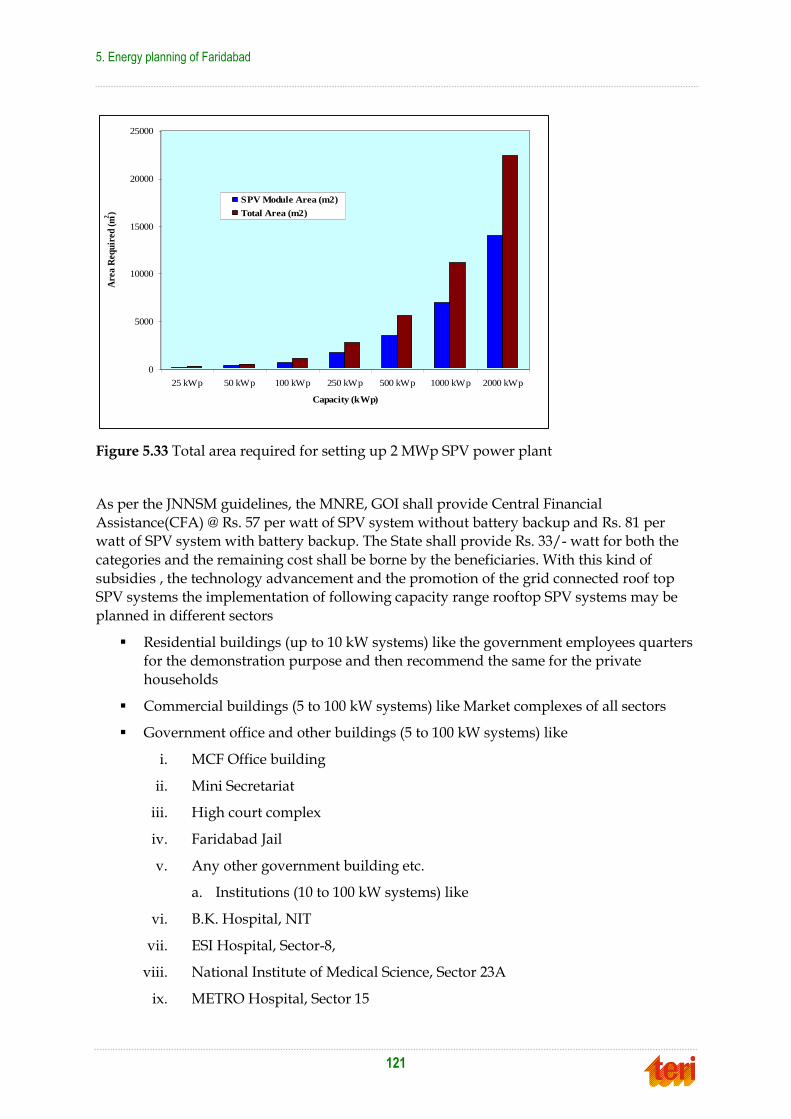
5. Energy planning of Faridabad
121
Figure 5.33 Total area required for setting up 2 MWp SPV power plant
As per the JNNSM guidelines, the MNRE, GOI shall provide Central Financial
Assistance(CFA) @ Rs. 57 per watt of SPV system without battery backup and Rs. 81 per watt of SPV system with battery backup. The State shall provide Rs. 33/- watt for both the
categories and the remaining cost shall be borne by the beneficiaries. With this kind of
subsidies , the technology advancement and the promotion of the grid connected roof top SPV systems the implementation of following capacity range rooftop SPV systems may be
planned in different sectors
Residential buildings (up to 10 kW systems) like the government employees quarters for the demonstration purpose and then recommend the same for the private
households
Commercial buildings (5 to 100 kW systems) like Market complexes of all sectors
Government office and other buildings (5 to 100 kW systems) like
i. MCF Office building
ii. Mini Secretariat
iii. High court complex
iv. Faridabad Jail
v. Any other government building etc.
a. Institutions (10 to 100 kW systems) like
vi. B.K. Hospital, NIT
vii. ESI Hospital, Sector-8,
viii. National Institute of Medical Science, Sector 23A
ix. METRO Hospital, Sector 15
0
5000
10000
15000
20000
25000
25 kWp 50 kWp 100 kWp 250 kWp 500 kWp 1000 kWp 2000 kWp
Capacity (kWp)
Are
a R
equ
ired
(m
2)
SPV Module Area (m2)
Total Area (m2)
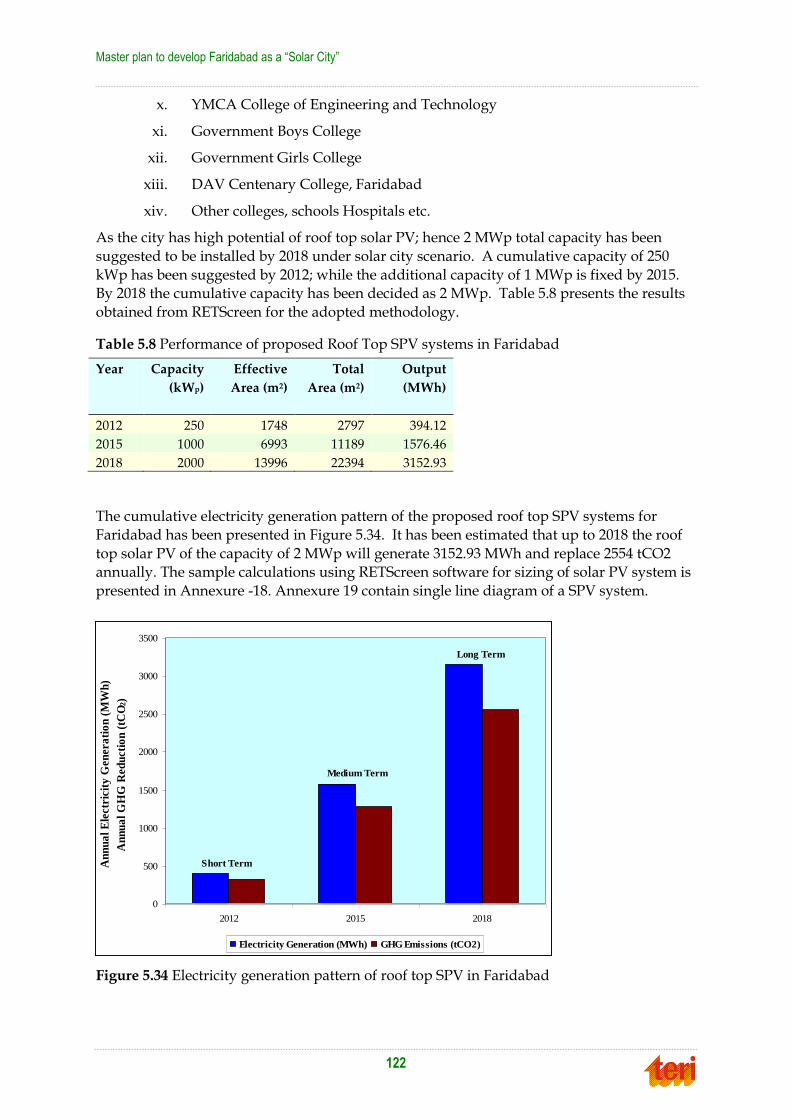
Master plan to develop Faridabad as a “Solar City”
122
x. YMCA College of Engineering and Technology
xi. Government Boys College
xii. Government Girls College
xiii. DAV Centenary College, Faridabad
xiv. Other colleges, schools Hospitals etc.
As the city has high potential of roof top solar PV; hence 2 MWp total capacity has been
suggested to be installed by 2018 under solar city scenario. A cumulative capacity of 250
kWp has been suggested by 2012; while the additional capacity of 1 MWp is fixed by 2015. By 2018 the cumulative capacity has been decided as 2 MWp. Table 5.8 presents the results
obtained from RETScreen for the adopted methodology.
Table 5.8 Performance of proposed Roof Top SPV systems in Faridabad
Year Capacity
(kWp)
Effective
Area (m2)
Total
Area (m2)
Output
(MWh)
2012 250 1748 2797 394.12
2015 1000 6993 11189 1576.46
2018 2000 13996 22394 3152.93
The cumulative electricity generation pattern of the proposed roof top SPV systems for
Faridabad has been presented in Figure 5.34. It has been estimated that up to 2018 the roof
top solar PV of the capacity of 2 MWp will generate 3152.93 MWh and replace 2554 tCO2 annually. The sample calculations using RETScreen software for sizing of solar PV system is
presented in Annexure -18. Annexure 19 contain single line diagram of a SPV system.
Figure 5.34 Electricity generation pattern of roof top SPV in Faridabad
Long Term
Medium Term
Short Term
0
500
1000
1500
2000
2500
3000
3500
2012 2015 2018
An
nu
al
Ele
ctr
icit
y G
en
era
tio
n (
MW
h)
An
nu
al
GH
G R
ed
ucti
on
(tC
O2)
Electricity Generation (MWh) GHG Emissions (tCO2)

5. Energy planning of Faridabad
123
Innovative Concepts
There is a frequent power cut in the city due to insufficient power available with the DHBVN. Keeping this in mind HAREDA has developed an innovative idea which is specific
to the city for residential sector. It has been suggested to use a hybrid inverters in the homes
which will be connected to the SPV panels as well as to the grid electricity in such a way that the priority will be given to the SPV panels to charge the deep discharge batteries and if case
solar insolation is not available and grid is available grid will charge the batteries. This way
solar energy will be harnessed and continuous power to the residential consumer will be provided.
A copy of the proposal is attached in Annexure 20.
Grid connected solar PV power plants
Larger grid connected solar PV based power plants might be another renewable energy
based option for Faridabad. A grid connected power plant of the capacity of 5 MWp has
been recommended for the city. The Municipal Corporation Faridabad can provide the land for setting up of this grid connected plant or the land can be purchased from the private
land owner. It has been determined that under the climatic and solar radiation conditions of
Faridabad, a solar PV based power plant of 5 MWp capacity will require around 56000 m2 area based on the best available solar cell technology; which will generate approximately
7,467,462 kWh of electricity annually in Faridabad. The power project of 5 MW through SPV
might be installed in public private partnership (PPP) mode.
As the cost of land is very expensive in Faridabad therefore it is may possible to get a
separate piece of land in the city. Hence the stable landfill area1 of Faridabad could be used
for this purpose. Duringt the discussions it is also found that the old thermal power plant land may also be a potential land for solar PV plant installation.
Table 5.9 presents the electricity generation through SPV power plant of 1 MW to 5 MW
along with area required and GHG savings.
Table 5.9 Performance of proposed 5MWp SPV systems in Faridabad
Capacity
(MWp)
Annual
Electricity
Generation
(LU)
PV Module
Area
Required
(m2)
Total Area
Required
(m2)
GHG
Emission
(tCO2)
1 14.93 6993 11189 1209.7
2 29.87 13986 22378 2419.5
3 44.80 20979 33566 3629.2
4 59.74 27972 44755 4838.9
5 74.67 34965 55944 6048.6
It has been proposed that there will be 1 MWp SPV installation in Faridabad by 2012,
additional 2 MWp by 2015 and rest 2 MWp by 2018. The implementation strategy of 5 MWp SPV based power plant under Solar City Scenario is presented in Figure 5.35.
1 The major landfill sites of Faridabad city are – Bharat colony, Uncha Gaon and recently planned site in Faridabad Gurgaon highway etc.
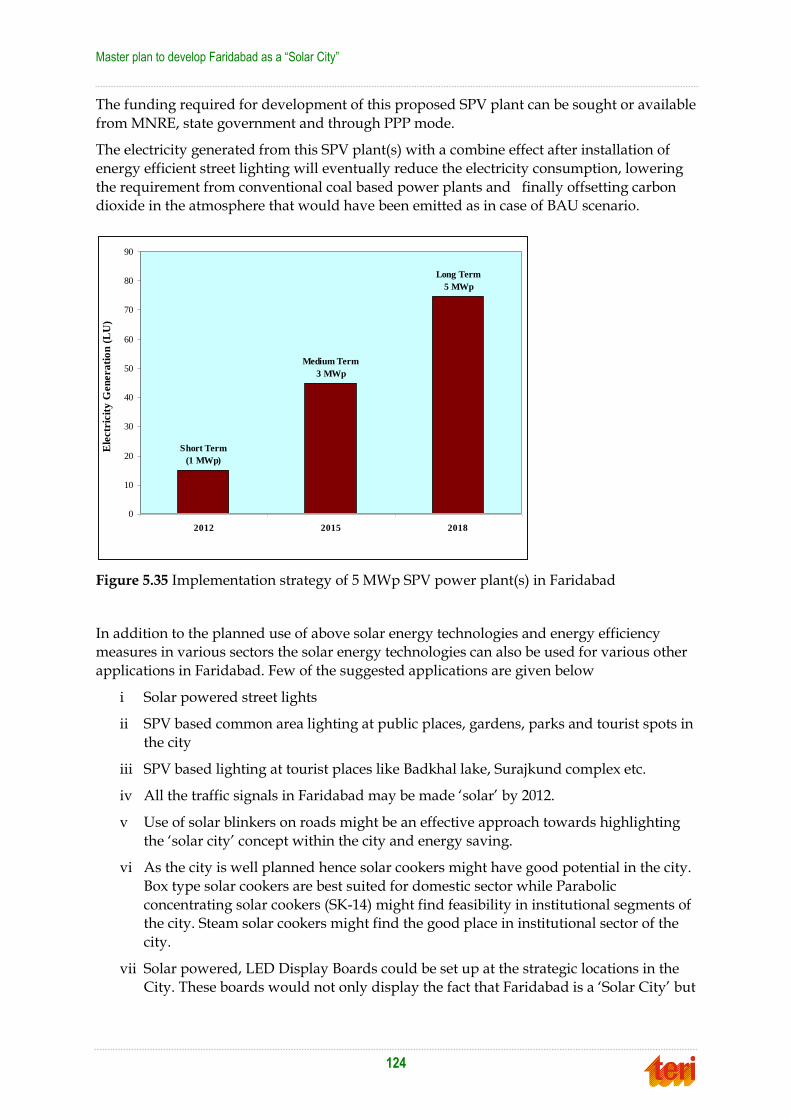
Master plan to develop Faridabad as a “Solar City”
124
The funding required for development of this proposed SPV plant can be sought or available
from MNRE, state government and through PPP mode.
The electricity generated from this SPV plant(s) with a combine effect after installation of
energy efficient street lighting will eventually reduce the electricity consumption, lowering
the requirement from conventional coal based power plants and finally offsetting carbon dioxide in the atmosphere that would have been emitted as in case of BAU scenario.
Figure 5.35 Implementation strategy of 5 MWp SPV power plant(s) in Faridabad
In addition to the planned use of above solar energy technologies and energy efficiency measures in various sectors the solar energy technologies can also be used for various other
applications in Faridabad. Few of the suggested applications are given below
i Solar powered street lights
ii SPV based common area lighting at public places, gardens, parks and tourist spots in
the city
iii SPV based lighting at tourist places like Badkhal lake, Surajkund complex etc.
iv All the traffic signals in Faridabad may be made „solar‟ by 2012.
v Use of solar blinkers on roads might be an effective approach towards highlighting
the „solar city‟ concept within the city and energy saving.
vi As the city is well planned hence solar cookers might have good potential in the city.
Box type solar cookers are best suited for domestic sector while Parabolic
concentrating solar cookers (SK-14) might find feasibility in institutional segments of the city. Steam solar cookers might find the good place in institutional sector of the
city.
vii Solar powered, LED Display Boards could be set up at the strategic locations in the City. These boards would not only display the fact that Faridabad is a „Solar City‟ but
Long Term
5 MWp
Medium Term
3 MWp
Short Term
(1 MWp)
0
10
20
30
40
50
60
70
80
90
2012 2015 2018
Ele
ctr
icit
y G
en
era
tio
n (
LU
)
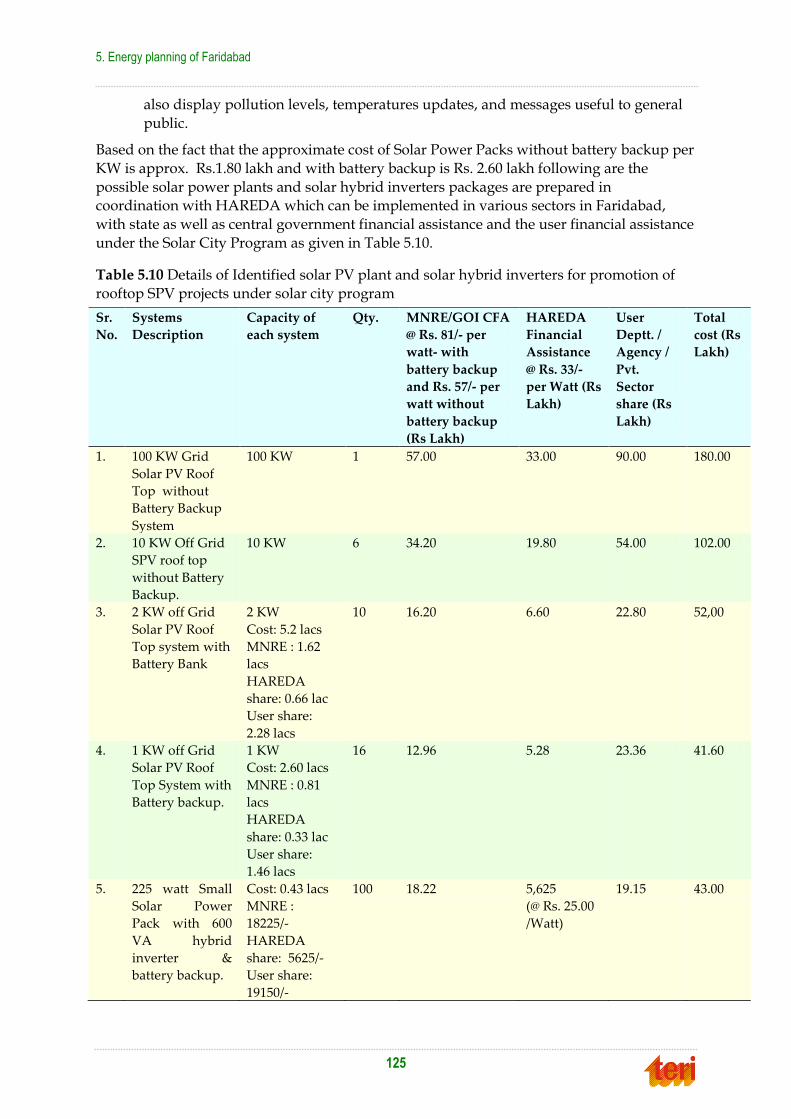
5. Energy planning of Faridabad
125
also display pollution levels, temperatures updates, and messages useful to general
public.
Based on the fact that the approximate cost of Solar Power Packs without battery backup per
KW is approx. Rs.1.80 lakh and with battery backup is Rs. 2.60 lakh following are the
possible solar power plants and solar hybrid inverters packages are prepared in coordination with HAREDA which can be implemented in various sectors in Faridabad,
with state as well as central government financial assistance and the user financial assistance
under the Solar City Program as given in Table 5.10.
Table 5.10 Details of Identified solar PV plant and solar hybrid inverters for promotion of
rooftop SPV projects under solar city program
Sr.
No.
Systems
Description
Capacity of
each system
Qty. MNRE/GOI CFA
@ Rs. 81/- per
watt- with
battery backup
and Rs. 57/- per
watt without
battery backup
(Rs Lakh)
HAREDA
Financial
Assistance
@ Rs. 33/-
per Watt (Rs
Lakh)
User
Deptt. /
Agency /
Pvt.
Sector
share (Rs
Lakh)
Total
cost (Rs
Lakh)
1. 100 KW Grid
Solar PV Roof
Top without
Battery Backup
System
100 KW 1 57.00 33.00 90.00 180.00
2. 10 KW Off Grid
SPV roof top
without Battery
Backup.
10 KW 6 34.20 19.80 54.00 102.00
3. 2 KW off Grid
Solar PV Roof
Top system with
Battery Bank
2 KW
Cost: 5.2 lacs
MNRE : 1.62
lacs
HAREDA
share: 0.66 lac
User share:
2.28 lacs
10 16.20 6.60 22.80 52,00
4. 1 KW off Grid
Solar PV Roof
Top System with
Battery backup.
1 KW
Cost: 2.60 lacs
MNRE : 0.81
lacs
HAREDA
share: 0.33 lac
User share:
1.46 lacs
16 12.96 5.28 23.36 41.60
5. 225 watt Small
Solar Power
Pack with 600
VA hybrid
inverter &
battery backup.
Cost: 0.43 lacs
MNRE :
18225/-
HAREDA
share: 5625/-
User share:
19150/-
100 18.22 5,625
(@ Rs. 25.00
/Watt)
19.15 43.00
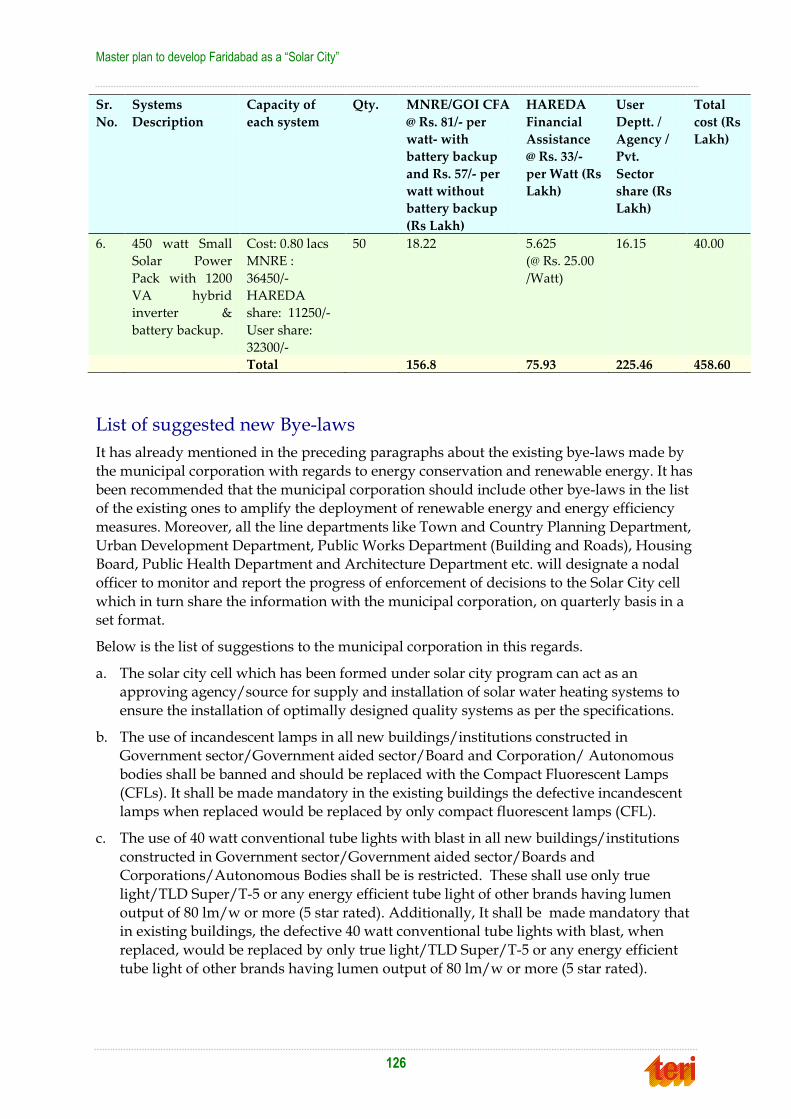
Master plan to develop Faridabad as a “Solar City”
126
Sr.
No.
Systems
Description
Capacity of
each system
Qty. MNRE/GOI CFA
@ Rs. 81/- per
watt- with
battery backup
and Rs. 57/- per
watt without
battery backup
(Rs Lakh)
HAREDA
Financial
Assistance
@ Rs. 33/-
per Watt (Rs
Lakh)
User
Deptt. /
Agency /
Pvt.
Sector
share (Rs
Lakh)
Total
cost (Rs
Lakh)
6. 450 watt Small
Solar Power
Pack with 1200
VA hybrid
inverter &
battery backup.
Cost: 0.80 lacs
MNRE :
36450/-
HAREDA
share: 11250/-
User share:
32300/-
50 18.22 5.625
(@ Rs. 25.00
/Watt)
16.15 40.00
Total 156.8 75.93 225.46 458.60
List of suggested new Bye-laws
It has already mentioned in the preceding paragraphs about the existing bye-laws made by
the municipal corporation with regards to energy conservation and renewable energy. It has
been recommended that the municipal corporation should include other bye-laws in the list of the existing ones to amplify the deployment of renewable energy and energy efficiency
measures. Moreover, all the line departments like Town and Country Planning Department,
Urban Development Department, Public Works Department (Building and Roads), Housing Board, Public Health Department and Architecture Department etc. will designate a nodal
officer to monitor and report the progress of enforcement of decisions to the Solar City cell
which in turn share the information with the municipal corporation, on quarterly basis in a set format.
Below is the list of suggestions to the municipal corporation in this regards.
a. The solar city cell which has been formed under solar city program can act as an approving agency/source for supply and installation of solar water heating systems to
ensure the installation of optimally designed quality systems as per the specifications.
b. The use of incandescent lamps in all new buildings/institutions constructed in Government sector/Government aided sector/Board and Corporation/ Autonomous
bodies shall be banned and should be replaced with the Compact Fluorescent Lamps
(CFLs). It shall be made mandatory in the existing buildings the defective incandescent lamps when replaced would be replaced by only compact fluorescent lamps (CFL).
c. The use of 40 watt conventional tube lights with blast in all new buildings/institutions
constructed in Government sector/Government aided sector/Boards and Corporations/Autonomous Bodies shall be is restricted. These shall use only true
light/TLD Super/T-5 or any energy efficient tube light of other brands having lumen
output of 80 lm/w or more (5 star rated). Additionally, It shall be made mandatory that in existing buildings, the defective 40 watt conventional tube lights with blast, when
replaced, would be replaced by only true light/TLD Super/T-5 or any energy efficient
tube light of other brands having lumen output of 80 lm/w or more (5 star rated).

5. Energy planning of Faridabad
127
d. It shall be made mandatory that in existing building using conventional fluorescent
tubes fitted with wire wound ballasts (chokes) to replace these ballasts with electronic ballasts.
e. The use of Compact Fluorescent Lamps (CFLs) and /or T-5 (28 watt) energy efficient
tube lights and/or Light Emitting Diode (LED) lamps shall be mandatory for all electricity consumers in industrial, commercial and institutional sectors having
connected load of 30 kW or above. This shall also be followed in all Central Government
Offices and Central Public Sector Undertaking Institutions/establishments
f. Mandatory use of ISI marked Motor pump sets, Power capacitor, Foot/Reflex valves in
Agriculture Sector. For all new tube well connections, the use of ISI marked pump sets
and accessories will be mandatory.
g. All the new buildings to be constructed in the Government/Government Aided Sector
will incorporate energy efficient building design incorporating Renewable Energy
Technologies.
h. The Architecture Department will ensure the incorporation of energy efficient building
design concepts in all buildings to be constructed in future in the
Government/Government Aided Sector. A committee shall be formed in the Architecture Department to examine all new building plans/drawings to be constructed
in the Government/Government Aided sector to ensure that all the features of the
energy efficient building design concepts, have been incorporated.
i. All such buildings should have GRIHA rating. GRIHA is an indigenous and green rating
system for buildings and is promoted by MNRE.
j. It shall be made mandatory that the street lighting in all existing and new sectors and elsewhere including in Residential sectors, Industrial estates, housing complexes,
colonies and townships developed by private/semi government/autonomous
institutions shall use energy efficient street lighting fixtures using T-5 tube lights/Light Emitting Diode (LED) Lamps/High Pressure Sodium Vapour (HPSV) only.
Techno-economics of Energy conservation measures
Residential and commercial sector
Retrofit options for common area lighting and their life cycle costs have been undertaken. As
per the information provided by Municipal Corporation Faridabad the consumer tariff of Rs
4.70/kWh (municipal services) have been taken in order to carry out the life cycle cost analysis for the retrofits.
1. Replacement of incandescent lamps with compact fluorescent lamps (CFL) in
common area lighting within the building. Common area lighting includes portico,
reception, and lift landing area, corridors and staircases.
2. Replacement of existing fluorescent lamps in common areas with T-5 lamps
Street lighting
Replacement of existing ballast with the multi tab ballast with astronomical timer switch.
Street lighting
Replacement of existing ballast with the multi tab ballast with astronomical timer switch.
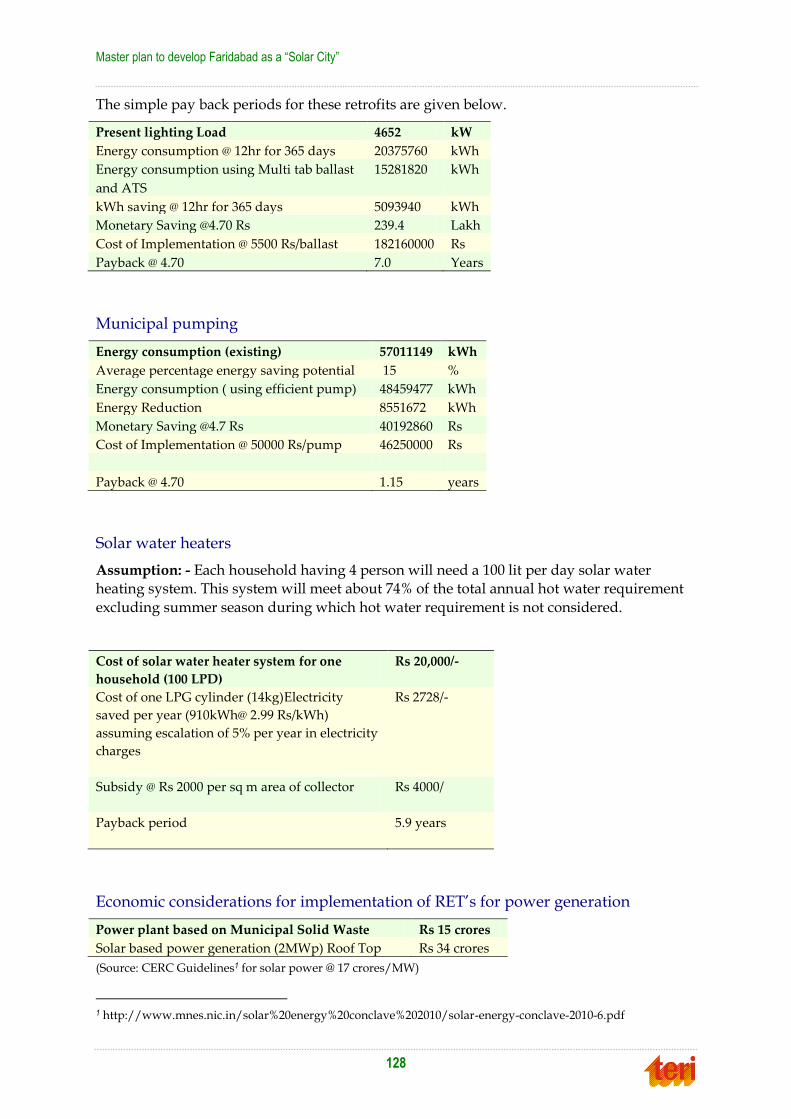
Master plan to develop Faridabad as a “Solar City”
128
The simple pay back periods for these retrofits are given below.
Present lighting Load 4652 kW
Energy consumption @ 12hr for 365 days 20375760 kWh
Energy consumption using Multi tab ballast
and ATS
15281820 kWh
kWh saving @ 12hr for 365 days 5093940 kWh
Monetary Saving @4.70 Rs 239.4 Lakh
Cost of Implementation @ 5500 Rs/ballast 182160000 Rs
Payback @ 4.70 7.0 Years
Municipal pumping
Energy consumption (existing) 57011149 kWh
Average percentage energy saving potential 15 %
Energy consumption ( using efficient pump) 48459477 kWh
Energy Reduction 8551672 kWh
Monetary Saving @4.7 Rs 40192860 Rs
Cost of Implementation @ 50000 Rs/pump 46250000 Rs
Payback @ 4.70 1.15 years
Solar water heaters
Assumption: - Each household having 4 person will need a 100 lit per day solar water heating system. This system will meet about 74% of the total annual hot water requirement
excluding summer season during which hot water requirement is not considered.
Cost of solar water heater system for one
household (100 LPD)
Rs 20,000/-
Cost of one LPG cylinder (14kg)Electricity
saved per year (910kWh@ 2.99 Rs/kWh)
assuming escalation of 5% per year in electricity
charges
Rs 2728/-
Subsidy @ Rs 2000 per sq m area of collector
Rs 4000/
Payback period
5.9 years
Economic considerations for implementation of RET‟s for power generation
Power plant based on Municipal Solid Waste Rs 15 crores
Solar based power generation (2MWp) Roof Top Rs 34 crores
(Source: CERC Guidelines1 for solar power @ 17 crores/MW)
1 http://www.mnes.nic.in/solar%20energy%20conclave%202010/solar-energy-conclave-2010-6.pdf
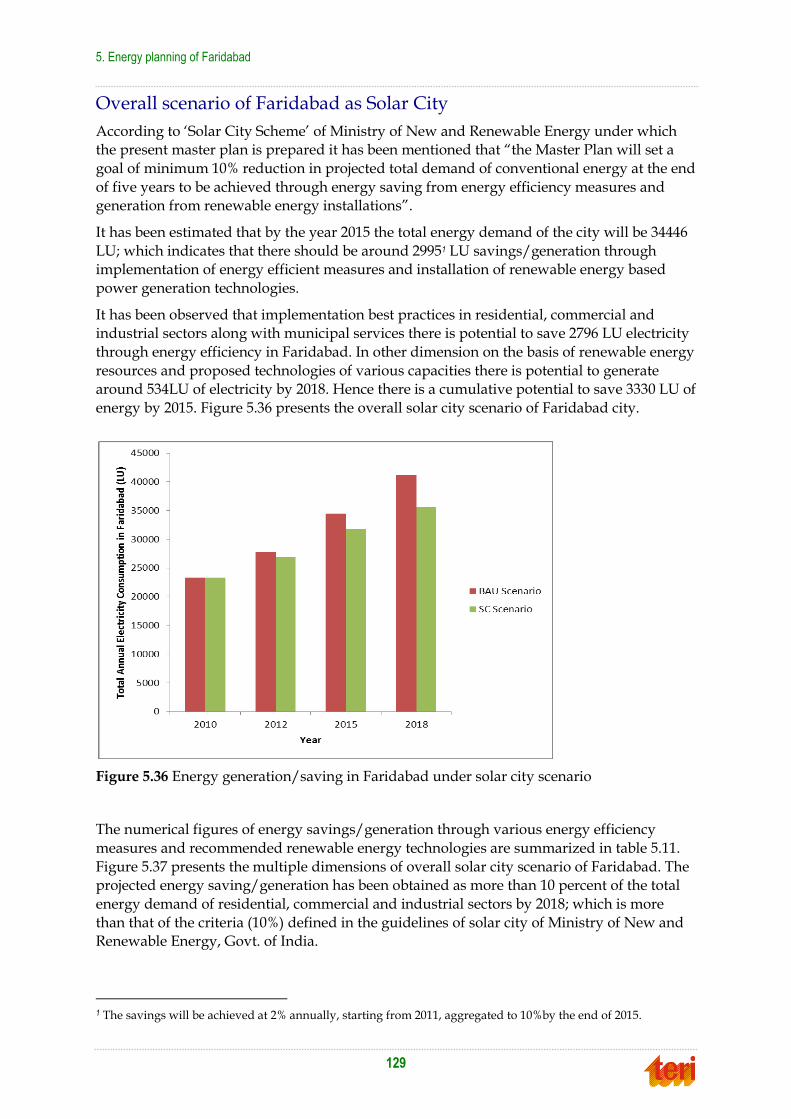
5. Energy planning of Faridabad
129
Overall scenario of Faridabad as Solar City
According to „Solar City Scheme‟ of Ministry of New and Renewable Energy under which the present master plan is prepared it has been mentioned that “the Master Plan will set a
goal of minimum 10% reduction in projected total demand of conventional energy at the end
of five years to be achieved through energy saving from energy efficiency measures and generation from renewable energy installations”.
It has been estimated that by the year 2015 the total energy demand of the city will be 34446
LU; which indicates that there should be around 29951 LU savings/generation through implementation of energy efficient measures and installation of renewable energy based
power generation technologies.
It has been observed that implementation best practices in residential, commercial and industrial sectors along with municipal services there is potential to save 2796 LU electricity
through energy efficiency in Faridabad. In other dimension on the basis of renewable energy
resources and proposed technologies of various capacities there is potential to generate around 534LU of electricity by 2018. Hence there is a cumulative potential to save 3330 LU of
energy by 2015. Figure 5.36 presents the overall solar city scenario of Faridabad city.
Figure 5.36 Energy generation/saving in Faridabad under solar city scenario
The numerical figures of energy savings/generation through various energy efficiency
measures and recommended renewable energy technologies are summarized in table 5.11.
Figure 5.37 presents the multiple dimensions of overall solar city scenario of Faridabad. The projected energy saving/generation has been obtained as more than 10 percent of the total
energy demand of residential, commercial and industrial sectors by 2018; which is more
than that of the criteria (10%) defined in the guidelines of solar city of Ministry of New and Renewable Energy, Govt. of India.
1 The savings will be achieved at 2% annually, starting from 2011, aggregated to 10%by the end of 2015.

Master plan to develop Faridabad as a “Solar City”
130
Table 5.11 Overall scenario of Faridabad as solar city
Sectors/Technolog
ies
Energy Saving/Generation (LU) by
Short
Term 2012
Medium
Term 2015
Long
Term 2018
Energy
Efficiency
(EE)
Residential sector 93 1202 2212
Commercial Sector 168 449 846
Industrial Sector 325 679 1629
Street lighting 19.5 44 49
Water pumping 12 68 124
RE Sources
based
Energy
Generation
Solar Water
Heaters
110 240 737
Roof Top SPV 3.9 15.8 31.5
MSW 0.20 0.20 0.20
Large SPV 14.9 44.8 74.7
Total Energy Saving/Generation 746.5 2742.8 5703.4
Figure 5.37 Overall scenario of Faridabad as solar city
Pilot project study for BK hospital, Faridabad
BK hospital Faridabad is a 200 bed hospital which has many clinical facilities in various field
of medical science. The Hospital is under the up-gradation phase with the planning to accommodate more sophisticated equipment for the modern quality of the treatments. Some
of these up-gradation activities are the increase in the number of operation theatres from just
one to 5 numbers. The Hospital require lot of hot water and steam for it‟s clinical activities as

5. Energy planning of Faridabad
131
well as for some other activities such as for laundries, CSSD system for the sterilisation of
the equipment etc. These hot water requirements can be met by installing the solar water heater systems in the hospital area. Also the roof tops of the various buildings in the hospital
can be utilised for the installation of the solar PV system to meet a fraction of the total in-
house lighting requirement of the hospital. It is recommended that the Solar water heaters of about 1000 lpd may be installed in the hospital to meet the hot water requirements in
laundry, patient rooms and for the other clinical uses. A minimum of 50 kW solar PV system
is recommended in the hospital campus to meet the electricity requirement for lighting and fans.


133
66.. AAccttiioonn ppllaann
To meet the growing energy needs of Faridabad city, optimizing energy conservation and
resource efficiency is needed which would thus reduce per capita electricity demand. This would minimize the need for new generation and reduce GHG emissions. It would enable a
cleaner environment with reduced greenhouse gases and other pollutants, thereby
addressing the environmental concerns.
As a matter of priority, in order to develop Faridabad as a Solar City, the principal
government agencies should be committed to:
Discussing critical energy issues jointly through open meetings and ongoing informal communication.
Sharing of information and analyses to minimize duplication, maximize a common
understanding and ensure a broad basis for decision-making.
Continuing progress in meeting the environmental goals and standards, including
minimizing the energy sector‟s impact on local and global environment.
Based on the analysis of potential for demand side measures along with that of supply side augmentation through renewable energy technologies, the following targets are proposed
for Faridabad in order to develop it as a “Solar City”. These targets are based on the detailed
energy audits in Faridabad and renewable resource potential assessment.
Table 6.1 Targets for energy conservation generation and greenhouse gas emission
reduction
Description Target
Short Term
(till 2012)
Medium Term
(till 2015)
Long Term (till
2018)
1. Energy Conservation* Reduction in present energy consumption
1.1 Residential sector 1.05 % 10.96% 15.5
1.2 Commercial sector 5.66% 12 16.78
1.3 Industrial Sector 2.15 3.75 7.08
1.3 a Municipal sector (Water pumping) 2.02 % 9.58% 15%
1.3 a Municipal sector (Street lighting) 19.5 % 39.0% Continue total
savings achieved
in medium term
2. Energy Generation** Generation of Electricity/Heat
2.1 Power Plant based on Municipal Solid
Waste
1 MW No Medium and Long term targets
2.2. Coverage of solar water heating
systems (as a proportion of total heating
demand in residential sector)
5.0 % 10.0 % 25.0%
2.3. Roof Top solar energy based
electricity generation
250 kW 1.0 MW 2.0 MW
2.4. Large solar energy based electricity
generation
1.0 MW 3.0 MW 5.0 MW
Total Energy Saving & Generation (LU) 746.5LU 2742.8LU 5703.4 LU
GHG emission reduction (tCO2/annum) 60466.5 222166.8 461975.4
*As a percentage of reduction in energy consumption over projected consumption in BAU scenario
**As a percentage of energy should be generated through renewable energy technologies

Master plan to develop Faridabad as a “Solar City”
134
Implementation plan
A “Solar City Cell” may be established within Municipal Corporation Faridabad. The Solar City Cell will Comprise of a) One Project Officer who will take overall
responsibility of the solar city cell functioning i.e. preparing the proposals and plans
for the implementation of the measures and activities suggested in Solar City master plan, implementation of the activities and the monitoring of the projects
implemented under the solar city plan b) Two technical officers who will help the
Project officer by preparing the proposals and plans to be implemented under solar city
For implementation of Solar City project, an empowered committee may be set up to
provide overall guidance under the chairmanship of the Municipal Commissioner.
The Solar City Cell may take advantage of programmes like Jawaharlal Nehru
National Urban Renewal Mission (JNNURM) and recently announced Jawaharlal
Nehru National Solar Mission (JNNSM) under the National Action Plan of Climate Change (NAPCC) for implementation of the master plan.
The Solar City Cell may also seek for financial support (for energy consultancy as
well as incremental cost of building construction for a few buildings) from Bureau of Energy Efficiency (BEE) to design a few pilot energy efficient buildings in the city, in
accordance with Energy Conservation Building Code (ECBC). The possibility of
availing incentives provided by the central government for Green Rating for Integrated Habitat Assessment (GRIHA) rated buildings may also be explored.
The Solar City Cell may work proactively:
- To get ECBC notified immediately
- To ensure that the building bye-laws are changed in accordance with it
- To ensure that all upcoming non-residential buildings are brought under the
ambit of ECBC and incorporate the relevant green buildings elements.
- To ensure that the major new public buildings and commercial complexes
including those for ITES services are „GRIHA‟ rated.
The Municipal Corporation Faridabad may join hands with the Dakshin Haryana Bijli Vitran Nigam to distribute the quality CFLs and LED lamps to its consumers at
concessional prices or on easy payment terms.
- For instance, in Delhi, BSES is promoting CFLs through “Buy One Get 1 Free
CFL Offer”. There is no restriction on the number of CFL bulbs a customer can
buy.
Municipal Corporation, Faridabad in coordinatith with HAREDA, may initiate a
dialogue with the power utility for introducing rebate on electricity tariff for the
domestic consumers, which employ solar devices.
To begin with, the energy conservation measures in the municipal services may be taken up immediately.
At least 20% of the energy needed for water heating in the residential and
commercial buildings may be required to come from solar energy, by 2012.

6. Action plan
135
Utilizing central government schemes, MCF may initiate installation of solar-based
LED traffic lights, solar street lights, building integrated solar PV, and other relevant solar products on a priority basis.
MCF may mount a focused and sustained campaign on “Solar City” covering all
media resources - including print, radio, and television.
In order to showcase Faridabad City as a Solar City, the following may be taken up
on priority.
- Urja Park: Energy– cum–Science Park may be established in a central location in Faridabad as an inviting place for social gatherings and to provide public
education about issues of sustainable energy in a friendly, non-technical
atmosphere.
- Urja Bhawan: MCF office and Solar City Cell may be housed in a new building,
constructed in accordance with ECBC and other efficient/green building
concepts.
The following projects may be taken up through public-private partnership:
- Setting up solar powered, LED Display Boards at the strategic locations in the
City. These boards would not only display the fact that Faridabad is a `Solar City‟ but also display pollution levels, temperatures updates, and messages useful to
general public.
- Provision of solar powered lights and fountains in the prominent public gardens and parks (like Town Park of the city, MCF campus etc.) in the city.
- Kitchen waste based biogas generation plants in large housing societies for the
electricity generation
Prominent office complexes may also have solar powered displays as well as battery
operated vehicles for intra-complex transportation.
MCF along with HAREDA and power utilities may begin engaging the public through sustained awareness campaigns about the benefits of energy conservation
and renewable energy; including local elected representatives and school children.
In Delhi, BSES has been educating its consumers about the need to conserve power though
Synergy – its bi-monthly, bi-lingual newsletter, newspaper inserts, and pamphlets distributed
at meals from time to time.
Likewise, NDPL has launched Energy Conservation campaign in Schools.
MCF along with HAREDA may organise interaction meetings with industries,
institutions, real estate developers etc to promote the renewable energy options
Solar City cell may involve consultants to prepare specific feasibility studies for renewable energy projects in different sectors such as kitchen waste based biogas
plants and roof-top SPV systems in big housing societies, school/colleges with hostel
facilities, hotels etc. and also for the Solar PV based LED street lighting systems.
MCF along with HAREDA may start organizing a series of training programme on
`Green buildings‟ for the planners; architects; electrical, Heating Ventilation and Air
Conditioning (HVAC), and lighting consultants; and engineers involved in the building sector.

Master plan to develop Faridabad as a “Solar City”
136
MCF, in close cooperation with the BEE and HAREDA, may initiate creation of
accredited certifiers who can then be engaged by the house owners/builders/developers for obtaining the energy conservation compliance
certificates.
MCF may initiate public-private partnership (e.g. working closely with the associations of the local traders and manufacturers) to propagate energy efficient
appliances, which include ‟Energy Star‟ appliances.
Under Solar City endeavour, one of the key action points could be to replace traffic signals having incandescent lamps with those with energy saving LEDs, along with
solar controllers. Similarly, CFL based streetlights; lights in the parks, gardens, and
roundabouts may be replaced with solar lights.
To encourage adoption of energy conservation, energy efficient
equipment/appliances, as well as renewable energy systems; MCF may introduce
specific, time-bound financial incentives for Faridabad.
Towards this, the route of Energy Services Company (ESCOs) may also be explored.
MCF may assist Engineering and other concerned departments in accessing capital
for energy conservation and efficiency projects at favourable terms. For this purpose, State Energy Conservation Fund, as prescribed by EC Act 2001, may be accessed.
The industrial sector is also one of the major energy consuming sectors. MCF may enhance
the present scheme for promoting energy audits in the industrial sector. Further MCF may undertake awareness campaign in industries in Faridabad for energy conservation. This can
be undertaken in partnership with the local industry association and HAREDA.Capacity
building and awareness generation
In order to inculcate energy conservation techniques in the common architecture. It is
essential that all the practitioners be properly trained in energy-efficient or “Green”
architecture. MCF in association with HAREDA may, therefore, organize a series of training programme for the planners; architects; electrical, HVAC, and lighting
consultants; and engineers involved in the building sector, These courses, tailor-
made to suit different levels, would have to be imparted to all the professionals, in public as well as in private sector – on a regular basis.
Suitable training modules, including the regular updates, may have to be developed
and delivered for
- accreditation of professionals for building certification and
- for the quality improvement of the accredited certifiers.
Of particular importance is the training for front-line workers and technicians
regarding energy conservation and efficiency, this would not only ensure successful
implementation of such measures but also their sustainability and replication.
Specific training programmes are required for those in the supervisory role, for effective monitoring of energy demand, enabling them to take preventive/corrective
actions in time.
The public awareness and education being central to successful changeover to solar city, it is imperative for MCF to engage the public through sustained awareness
campaigns and communicate the benefits of energy conservation and renewable
energy to different user-groups; including local elected representatives.

6. Action plan
137
MCF along with HAREDA may mount a focused and sustained campaign on “Solar
City” and its features encompassing all media resources - including print, radio, and television. Apart from specific recommendations, such campaigns must inform
public about the places from energy efficient/renewable energy devices and services
can be procured.
A key component of the awareness creation campaign would be to capture school
children‟s attention towards energy-efficiency and clean future. Thus, the campaign
for the school children will include the following elements:
- Inter-school essay and drawing competitions
- Inter-school quizzes
- Workshops and seminars
- Exhibitions and demonstrations
- Field trips
The information propagation can be achieved in a way that power utilities have taken up, by putting advertisements and information on back of the monthly bills that were sent to the
consumers. In the same way, mount a public campaign on energy conservation utilizing
through regular communication could be a way.
Budget estimation for Solar City initiative
The action plan for making Faridabad has various components and actions which include
implementation of energy conservation in Government buildings, as well as commercial and residential sectors. Further the action plan also includes activities related to implementation
of different renewable energy technologies for different applications. These actions are of
different types like direct implementation, awareness creation, providing subsidy and other promotional measures. Based on the different activities/ initiatives suggested in the action
plan a tentative budget for undertaking these activities has been prepared for short term (till
2012), medium term (till 2015) and long term (till 2018). The budget estimated for making Faridabad as a solar city is given in Table 6.2.
Table 6.2 Budget estimated for implementation of different activities for making Faridabad
as a Solar City
Sector (s) Proposed
Measures
Targets Role of
MCF/Faridabad
Administration
2012
(Short Term)
(Million Rs)
2015
(Medium
term)
(Million
Rs)
2018
(Long
Term)
(Million
Rs)
Source
of
Funding
Solar water
heating
systems
200, 100 lit per
day capacity
systems (1
percent
households)
in 2010-11.
Increase up to
25% by 2018
(average 3
percent every
1.Promotion
and awareness
creation
2.Providing
subsidy support
in initial phase
through
HAREDA and
MNRE(first
30.17 60.42 60.50 Jawaharl
al Nehru
National
Solar
Mission
(JNNSM)
, MNRE,
HARED
A

Master plan to develop Faridabad as a “Solar City”
138
Sector (s) Proposed
Measures
Targets Role of
MCF/Faridabad
Administration
2012
(Short Term)
(Million Rs)
2015
(Medium
term)
(Million
Rs)
2018
(Long
Term)
(Million
Rs)
Source
of
Funding
Residential
year) 100000 lit
capacity
systems
Promote
use of
efficient
LPG stoves
and
efficient
cooking
devices
such as
microwave
s
Achieve 10%
reduction in
projected LPG
consumption
as compared
to BAU
Awareness
creation
1.5 ( 1.5 ---- Oil
marketin
g
compani
es,
private
compani
es
Promote
use of
alternate
lighting
systems
such as
SPV
systems in
rural areas
of the city
to reduce
kerosene
consumptio
n
Targets can be
decided by
MCF after
survey of
requirements
Awareness
creation.
Subsidy for five
years for say
1500 Solar
Home Systems
4.5 3.0 ---- JNNSM
Promote
use of roof
top solar
PV systems
2 MWp
capacity
systems by
2018
Subsidy support
for first 2 MWp
capacity
systems of up to
100kWp
capacity as per
MNRE
guidelines
1.5 Extent of the assistance
will depend on the
policies of MNRE and
state government
JNNSM
Promote
energy
conservatio
n through
promotion
of energy
efficient
devices
(CFL, air
Increased use
of these
devices in the
city
Awareness
creation, specific
support
schemes for CFL
and Air
conditioners?
4.5 3.0 ---- BEE/state
energy
conserva
tion fund

6. Action plan
139
Sector (s) Proposed
Measures
Targets Role of
MCF/Faridabad
Administration
2012
(Short Term)
(Million Rs)
2015
(Medium
term)
(Million
Rs)
2018
(Long
Term)
(Million
Rs)
Source
of
Funding
conditioner
s,
microwave
s, washing
machines,
TV, etc)
Commerci
al
Promotion
of energy
efficiency
through
awareness
creation
achieve 10%
share of
energy
efficient
devices in the
city
Promotional
schemes and
awareness
creation
7.5 5.0 BEE/state
energy
conserva
tion fund
Promotion
of solar
water
heating
systems in
industries,
hotels,
hostels etc
100000 lit per
day capacity
systems in
three years
Subsidy and
awareness
creation ,
providing soft
loans /
reduction in
electricity bills/
cess for others
1.69 0.56 ---- MNRE-
GEF
SWHS
program
me,
JNNSM
Promotion
of energy
efficient
green
buildings
At least 50%
of the new
building are
certified
under GRIHA
or similar
rating systems
Implementation
of Schemes
through
facilitation and
cost sharing
schemes
7.5 5.0 ---- MNRE/H
AREDA
& Private
investme
nt
Promotion
of roof top
systems in
commercial
/governme
nt,
institutiona
l and
industrial
buildings
Total 2 MWp
capacity solar
systems
Financial
support to the
utility for
purchase of
power at higher
rate/
preferential
tariff
50.0 150.0 200.0 JNNSM
Municipal
Sector
(Street
Lighting
and Water
Pumping)
Replaceme
nt of
existing
ballasts by
efficient
ballasts in
all street
lights
100%
replacement
of ballasts
Investments/
financial
support MCF
(Faridabad
Municipal
Corporation)
9.12 9.12 Jawaharl
al Nehru
National
Urban
Renewal
Mission
(JNNUR
M)
Replaceme Replacement Investments/ 0.46 0.46 0.16 JNNUR

Master plan to develop Faridabad as a “Solar City”
140
Sector (s) Proposed
Measures
Targets Role of
MCF/Faridabad
Administration
2012
(Short Term)
(Million Rs)
2015
(Medium
term)
(Million
Rs)
2018
(Long
Term)
(Million
Rs)
Source
of
Funding
nt of tube
wells/
water/sewe
rage
pumps in
water
schemes
with
energy
efficient
pumps
of 230 nos. of
pumps with
energy
efficient
pumps
financial
support to MCF
M
Power
generation
MSW
Power
Plant
1 MWp power
plant based
on Municipal
Solid Waste
Subsidy support
/ Capital
investments /
preferential
tariff / Soft loans
75.0 ---- ---- MNRE/H
AREDA
Solar PV
power
plant
5 MWp power
plants in
phased
manner
Subsidy support
/ Capital
investments /
preferential
tariff / Soft loans
85.0 170.0 170.0 JNNSM/
Private
investor
Promotion
of kitchen
waste
based
biogas
plants for
energy
generation
in housing
societies
Atleast 1 plant
by year 2012,
3 plants by
2015 and 5
plants by year
2018
Awareness
creation,
feasibility and
subsidy
supports
through
MNRE/state
government
2.4 4.8 4.8 MNRE/H
AREDA/
USER
SOCIET
Y
Awareness
creation
and study
for solar
city plan
implement
ation
Establishm
ent of
'Faridabad
Solar City
Cell'
To set up
Solar City Cell
to develop,
implement
and monitor
various
schemes, to
coordinate the
development
of Faridabad
as Model
Solar City
Funding ,
creation and
establishment of
the cell and
monitor its
working
7.5 7.5
7.5
MNRE/H
AREDA/
MCF
under
Solar
City
Scheme
Interaction
meet with
stakeholder
One
interaction
meet to
Make
arrangements
for the meetings
MNRE/H
AREDA/
MCF

6. Action plan
141
Sector (s) Proposed
Measures
Targets Role of
MCF/Faridabad
Administration
2012
(Short Term)
(Million Rs)
2015
(Medium
term)
(Million
Rs)
2018
(Long
Term)
(Million
Rs)
Source
of
Funding
s that
include
industry,
institutions
, hospitals
and real
estate
sector
appraise the
stakeholders
about the
solar city
scheme and
various
projects to be
implemented
under
Solar
City
Scheme
To identify
the scope of
Solar
Thermal &
PV system
application
in
industries
and
prepare
feasibility
for biogas
power
genaration
in real
estate
societies
Study on solar
thermal and
PV
application in
atleast
Electroplating,
dying and
textile units
get completed
Selection of
industry and the
consultant in
coordination
with HAREDA
for the
preparation of
detailed study
MNRE/H
AREDA/
MCF
under
Solar
City
Scheme
Awareness
creation for
all
schemes,
developme
nt of solar
city park
and
exhibitions
Awareness
creation
Develop and
fund awareness
creation/promot
ional schemes
(included in the
above)
MNRE/H
AREDA/
MCF
under
Solar
City
Scheme
Total
288.34(Millio
n Rupees)
420.37(Mil
lion
Rupees)
442.96(M
illion
Rupees)
The year wise breaks up of above activities are given in Annexure- 21. Table 6.3 gives the
budget estimates, for few pilot project activities to be implemented by the year 2012 under
the solar city program for Faridabad solar City. The detailed list of these pilot projects with the budget breakups are given in Annexure-21.

Master plan to develop Faridabad as a “Solar City”
142
Table 6.3 Cost estimated for pilot renewable energy and energy efficiency projects to be
implemented under Faridabad Solar City action plan by year 2012.
Sr.No. Description Total
cost
MNRE
/ GOI
share
BEE/GOI Cost sharing (Rs lakh)
HAREDA User
Deptt. /
Agency
Private
Sector
A Rooftop Solar PV
Systems for Diesel
Abatement. (for
industries,
commercial and
residential sectors)
458.60 156.80 - 75.93 0.00 225.46
B Solar Water Heating
System (about 80000
lpd capacity)
130.00 46.20 - 28.00 0.00 55.80
C Kitchen Waste
Management (about
15 kW plant)
24.00 6.00 - 6.00 0.00 12.00
D Energy Efficiency in
Municipal Street
Lighting through SPV
based LED lights. (100
street lights)
99.00 19.44 - 39.78 39.78 0.00
E Energy Efficiency in
Municipal Street
Lighting through
energy conservation
with installation of
LED/ Induction Arc
lamps with Micro-
processor controlled
ON/OFF timer
switches. (200 street
lights)
30.00 15.00 15.00 0.00 0.00 0.00
F Awareness / Study 13.00 6.50 - 5.50 1.00 0.00
Total 754.60 249.94 15.00 155.21 40.78 293.26

143
AAnnnneexxuurree 11 EElleeccttrriicciittyy CCoonnssuummppttiioonn ddaattaa iinn
FFaarriiddaabbaadd
Following tables gives the electricity consumption in various sectors in Faridabad for the
year 2008, 2009 and 2010
Electricity Consumption data in Old Faridabad (2008-09)
Account
Code No.
Description Opening
Balance
in Units
(in Lacs )
During the
Month
(March 2011)
in Units
(in Lacs)
Progressive
Total in
Units
(in Lacs)
92.6 Units Sold to State Consumers
92.601 Domestic upto 40 units 393.91 54.83 448.74
92.602 Domestic 41 to 300 1167.24 99.25 1266.49
92.631 Domestic above 300 1009.83 73.35 1083.18
92.603 Non Domestic Supply 786.55 58.70 845.25
92.604 HT Industry 70KW & above 1949.23 150.00 2099.23
92.605 HT Industry Furnace 32.99 5.92 38.91
92.606 Lift Irrigation 5.34 0.50 5.84
92.607 HT Industry Spl. Agreement Normal Units 0.00 0.00
92.608 HT Industry Spl. Agreement Low Surcharge 0.00 0.00
92.609 HT Industry Spl. Agreement High Surcharge 0.00 0.00
92.610 LT Industry less than 70KW 655.20 47.71 702.91
92.611 Agri. Metered Supply upto 100 89.35 6.80 96.15
92.612 Agri Metered Supply 101' to 150' 0.00 0.00
92.613 Agri Metered Supply 151' to 200' 0.00 0.00
92.614 Agri Metered Supply 200' 0.00 0.00
92.615 Agri. Unmetered Supply upto 100' 39.81 2.49 42.30
92.616 Agri. Unmetered Supply 100' to 150' 0.00 0.00
92.617 Agri. Unmetered Supply 151' to 200' 0.00 0.00
92.618 Agri. Unmetered Supply 200' 0.00 0.00
92.619 Bulk Supply Domestic 0.00 0.00
92.620 Bulk Supply Non Domestic 0.00 0.00
92.621 Bulk Supply Others 167.36 10.81 178.17
92.622 Village Chaupal Upto 40 Units 0.00 0.00
92.623 Village Chaupal Others 0.00 0.00
92.624 Railway Traction 0.00 0.00
92.625 Street Lighting 46.16 4.54 50.70
92.626 MITC Tubewells Direct Irr. T/W 0.00 0.00
92.627 MITC Tubewells Augmentation Canals 0.00 0.00
92.628 Public Water Works 184.28 17.50 201.78
92.629 Common Pool Supplies 0.00 0.00
92.630 Free Supply 0.00 0.00
TOTAL 6527.25 532.40 7059.65

Master plan to develop Faridabad as a “Solar City”
144
Electricity Consumption data in Old Faridabad (2009-10)
Account
Code
No.
Description Opening
Balance in
Units (in
Lacs)
During the
Month in
Units
(in Lacs)
Progressive
Total in
Units (in
Lacs)
92.6 Units Sold to State Consumers
92.601 Domestic upto 40 units 476.91 44.49 521.40
92.602 Domestic 41 to 300 1167.06 108.44 1275.50
92.631 Domestic above 300 1271.12 84.26 1355.38
92.603 Non Domestic Supply 951.49 76.48 1027.97
92.604 HT Industry 70KW & above 2028.16 201.88 2230.04
92.605 HT Industry Furnace 68.38 5.95 74.33
92.606 Lift Irrigation 6.76 0.49 7.25
92.607 HT Industry Spl. Agreement Normal Units 0.00 0.00
92.608 HT Industry Spl. Agreement Low Surcharge 0.00 0.00
92.609 HT Industry Spl. Agreement High Surcharge 0.00 0.00
92.610 LT Industry less than 70KW 678.75 61.83 740.58
92.611 Agri. Metered Supply upto 100 84.51 8.88 93.39
92.612 Agri Metered Supply 101' to 150' 0.00 0.00
92.613 Agri Metered Supply 151' to 200' 0.00 0.00
92.614 Agri Metered Supply 200' 0.00 0.00
92.615 Agri. Unmetered Supply upto 100' 34.30 3.48 37.78
92.616 Agri. Unmetered Supply 100' to 150' 0.00 0.00
92.617 Agri. Unmetered Supply 151' to 200' 0.00 0.00
92.618 Agri. Unmetered Supply 200' 0.00 0.00
92.619 Bulk Supply Domestic 0.00 0.00
92.620 Bulk Supply Non Domestic 0.00 0.00
92.621 Bulk Supply Others 213.40 14.31 227.71
92.622 Village Chaupal Upto 40 Units 0.00 0.00
92.623 Village Chaupal Others 0.00 0.00
92.624 Railway Traction 0.00 0.00
92.625 Street Lighting 43.55 3.89 47.44
92.626 MITC Tubewells Direct Irr. T/W 0.00 0.00
92.627 MITC Tubewells Augmentation Canals 0.00 0.00
92.628 Public Water Works 205.90 18.09 223.99
92.629 Common Pool Supplies 0.00 0.00
92.630 Free Supply 0.00 0.00
TOTAL 7230.29 632.47 7862.76
Source: DHBVN Old Faridabad
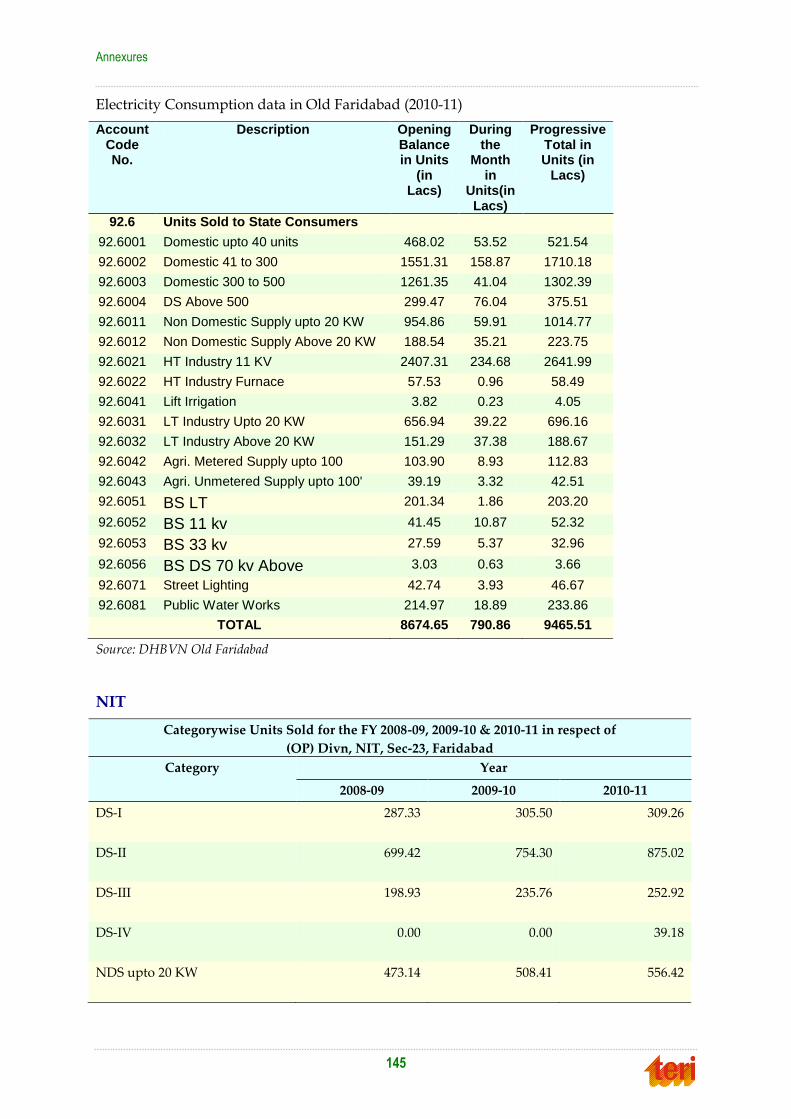
Annexures
145
Electricity Consumption data in Old Faridabad (2010-11)
Account Code No.
Description Opening Balance in Units
(in Lacs)
During the
Month in
Units(in Lacs)
Progressive Total in Units (in
Lacs)
92.6 Units Sold to State Consumers
92.6001 Domestic upto 40 units 468.02 53.52 521.54
92.6002 Domestic 41 to 300 1551.31 158.87 1710.18
92.6003 Domestic 300 to 500 1261.35 41.04 1302.39
92.6004 DS Above 500 299.47 76.04 375.51
92.6011 Non Domestic Supply upto 20 KW 954.86 59.91 1014.77
92.6012 Non Domestic Supply Above 20 KW 188.54 35.21 223.75
92.6021 HT Industry 11 KV 2407.31 234.68 2641.99
92.6022 HT Industry Furnace 57.53 0.96 58.49
92.6041 Lift Irrigation 3.82 0.23 4.05
92.6031 LT Industry Upto 20 KW 656.94 39.22 696.16
92.6032 LT Industry Above 20 KW 151.29 37.38 188.67
92.6042 Agri. Metered Supply upto 100 103.90 8.93 112.83
92.6043 Agri. Unmetered Supply upto 100' 39.19 3.32 42.51
92.6051 BS LT 201.34 1.86 203.20
92.6052 BS 11 kv 41.45 10.87 52.32
92.6053 BS 33 kv 27.59 5.37 32.96
92.6056 BS DS 70 kv Above 3.03 0.63 3.66
92.6071 Street Lighting 42.74 3.93 46.67
92.6081 Public Water Works 214.97 18.89 233.86
TOTAL 8674.65 790.86 9465.51
Source: DHBVN Old Faridabad
NIT
Categorywise Units Sold for the FY 2008-09, 2009-10 & 2010-11 in respect of
(OP) Divn, NIT, Sec-23, Faridabad
Category Year
2008-09 2009-10 2010-11
DS-I 287.33 305.50 309.26
DS-II 699.42 754.30 875.02
DS-III 198.93 235.76 252.92
DS-IV 0.00 0.00 39.18
NDS upto 20 KW 473.14 508.41 556.42

Master plan to develop Faridabad as a “Solar City”
146
Categorywise Units Sold for the FY 2008-09, 2009-10 & 2010-11 in respect of
(OP) Divn, NIT, Sec-23, Faridabad
Category Year
2008-09 2009-10 2010-11
NDS above 20 KW 0.00 0.00 67.22
LT upto 20 KW 961.79 986.60 904.41
LT above 20 KW 0.00 0.00 250.92
HT 1892.46 2085.22 2429.00
AP(M) 0.07 0.26 0.17
ST/L 20.74 20.40 23.59
PWW 60.42 68.60 87.49
Bulk 31.51 29.26 28.52
Total 4625.81 4994.31 5824.12
Source: DHBVN Circle office, NIT, Faridabad
Electricity Consumption data in Ballabhgarh zone (2008-09)
Memorandum of Accounts for units generated and sold during the month 3/09
Sr.
No.
A/C
Code
Description Opening Balance During the month Closing Balance Budget
Urban Rural Total Urban Rural Total Urban Rural Total Prop. Budget
1 92.601 DS Upto 40
Units
225.26 102.93 328.19 15.82 8.55 24.37 241.08 111.48 352.56
2 92.602 DS 41 to 300
units
680.39 105.41 785.80 53.93 8.37 62.30 734.32 113.78 848.10
3 92.631 DS above 300
units
265.75 13.94 279.69 14.67 0.97 15.64 280.42 14.91 295.33
4 92.603 NDS 205.59 33.97 239.56 15.17 2.79 17.96 220.76 36.76 257.52
5 92.604 HT IND 70 KW
& above
3011.05 355.92 3366.97 225.35 32.72 258.07 3236.40 388.64 3625.04
6 92.605 HT IND
furnace
202.91 12.45 215.36 17.49 1.23 18.72 220.40 13.68 234.08
7 92.606 Lift irrigation 0.00 1.87 1.87 0.31 0.31 0.00 2.18 2.18
8 92.610 LT IND less
than 70 KW
581.39 125.72 707.11 40.99 10.68 51.67 622.38 136.40 758.78
9 92.611 AP metered
upto 100
12.52 485.64 498.16 1.17 48.68 49.85 13.69 534.32 548.01
10 92.615 AP UN
metered upto
0.00 180.49 180.49 14.59 14.59 0.00 195.08 195.08

Annexures
147
Memorandum of Accounts for units generated and sold during the month 3/09
Sr.
No.
A/C
Code
Description Opening Balance During the month Closing Balance Budget
Urban Rural Total Urban Rural Total Urban Rural Total Prop. Budget
100
11 92.621 Bulk suply 37.43 0.97 38.40 2.98 0.14 3.12 40.41 1.11 41.52
12 92.624 RLY traction 1238.61 0.00 1238.61 111.79 111.79 1350.40 0.00 1350.40
13 92.625 S.L 15.94 0.00 15.94 1.50 1.50 17.44 0.00 17.44
14 92.628 PWW 184.44 37.34 221.78 17.10 3.62 20.72 201.54 40.96 242.50
0.00
Total 6661.28 1456.65 8117.93 517.96 132.65 650.61 7179.24 1589.30 8768.54 0.00 0.00
Electricity Consumption data in Ballabhgarh zone (2009-10)
Memorandum of Accounts for units generated and sold during the month 3/10
Sr.
No.
A/C
Code
Description Opening Balance During the month Closing Balance Budget
Urban Rural Total Urban Rural Total Urban Rural Total Prop. Budget
1 92.601 DS upto 40
units
224.00 113.29 337.29 18.20 8.34 26.54 242.20 121.63 363.83
2 92.602 DS up to 300
units
735.71 123.04 858.75 55.72 10.05 65.77 791.43 133.09 924.52
3 92.631 DS above 322.40 17.81 340.21 18.99 2.62 21.61 341.39 20.43 361.82
4 92.603 NDS 246.44 40.17 286.61 18.14 4.17 22.31 264.58 44.34 308.92
5 92.604 HT Indl 70
kW and above
3131.67 347.76 3479.43 351.23 36.12 387.35 3482.90 383.88 3866.78
6 92.605 HT Indl. Steel
furnance
200.85 14.73 215.58 20.65 1.46 22.11 221.50 16.19 237.69
7 92.606 Lift irrigation 0.00 3.16 3.16 0.68 0.68 0.00 3.84 3.84
8 92.610 LT Indl less
than 70 kW
655.43 122.23 777.66 62.05 11.51 73.56 717.48 133.74 851.22
9 92.611 AP metered
supply up to
100
14.07 586.93 601.00 1.07 55.24 56.31 15.14 642.17 657.31
10 92.615 AP unmetered
supply up to
100
0.00 137.50 137.50 12.08 12.08 0.00 149.58 149.58
11 92.621 Bulk suply 40.14 2.22 42.36 2.88 0.68 3.56 43.02 2.90 45.92
12 92.624 Railway
traction
1328.60 0.00 1328.60 116.21 116.21 1444.81 0.00 1444.81
13 92.625 Street light 17.29 0.00 17.29 1.52 1.52 18.81 0.00 18.81
14 92.628 Public water
works
186.95 37.33 224.28 17.60 3.08 20.68 204.55 40.41 244.96
TOTAL 7103.55 1546.17 8649.72 684.26 146.03 830.29 7787.81 1692.20 9480.01
Source: DHBVN, Ballabhgarh zone, Faridabad

Master plan to develop Faridabad as a “Solar City”
148
Electricity Consumption data in Ballabhgarh zone (2010-11)
Memorandum of Accounts for unit generated and and sold during the month 2/11
S.
No.
A/c code Desciption Opening Balance During the monh Closing balance
Urban Rural Total Urban Rural Total Urban Rural Total
1 92.6001 DS up to 40 units 207.66 104.64 312.3 15.91 8.2 24.11 223.57 112.84 336.41
2 92.6002 DS up to 300 units 798.82 152.66 951.48 59.18 16.16 75.34 858 168.82 1026.82
3 92.6003 DS up to 500 340.3 21.98 362.28 9.65 1.1 10.75 349.95 23.08 373.03
4 92.6004 DS above 500 61.08 4.46 65.54 6.58 1.32 7.9 67.66 5.78 73.44
5 92.6011 NDS up to 20 kW 271 58.74 329.74 22.14 12.31 34.45 293.14 71.05 364.19
6 92.6012 NDS above 20 kW 14.86 0 14.86 4.68 4.68 19.54 0 19.54
7 92.6021 HT Indl. 70 kW and
above
3316.81 418.26 3735.07 353.39 43.08 396.47 3670.2 461.34 4131.54
8 92.6022 HT Indl. steel furnace
33 KV
232.18 16.78 248.96 29.85 29.85 262.03 16.78 278.81
9 92.6023 HT Indl. 66 KV 41.26 18.51 59.77 5.26 11.96 17.22 46.52 30.47 76.99
10 92.6041 Lift irrigation 0.05 2.49 2.54 0.01 0.23 0.24 0.06 2.72 2.78
11 92.6031 LT Indl. Less than 70
kW
570.23 107.66 677.89 26.99 7.34 34.33 597.22 115 712.22
12 92.6032 LT Indl. above 20 kW 117.08 35.89 152.97 43.83 11.57 55.4 160.91 47.46 208.37
13 92.6042 AP metered supply to
100'
13.54 599.13 612.67 1.49 56.33 57.82 15.03 655.46 670.49
14 92.6043 AP unmetered supply
up to 100'
0 127.75 127.75 12.4 12.4 0 140.15 140.15
15 92.6051 Bulk supply LT 30.26 7.86 38.12 0.11 0.11 30.26 7.97 38.23
16 92.6052 BS HT 9.89 2.28 12.17 3.61 0.77 4.38 13.5 3.05 16.55
17 92.6063 Railway traction 1134.48 0 1134.48 105.98 105.98 1240.46 0 1240.46
18 92.6071 Street light 16.6 0 16.6 1.78 1.78 18.38 0 18.38
19 92.6081 Public water works 187.04 33.99 221.03 18.04 3.34 21.38 205.08 37.33 242.41
Total 7363.14 1713.08 9076.22 708.37 186.22 894.59 8071.51 1899.3 9970.81
Source: DHBVN, Ballabhgarh zone, Faridabad
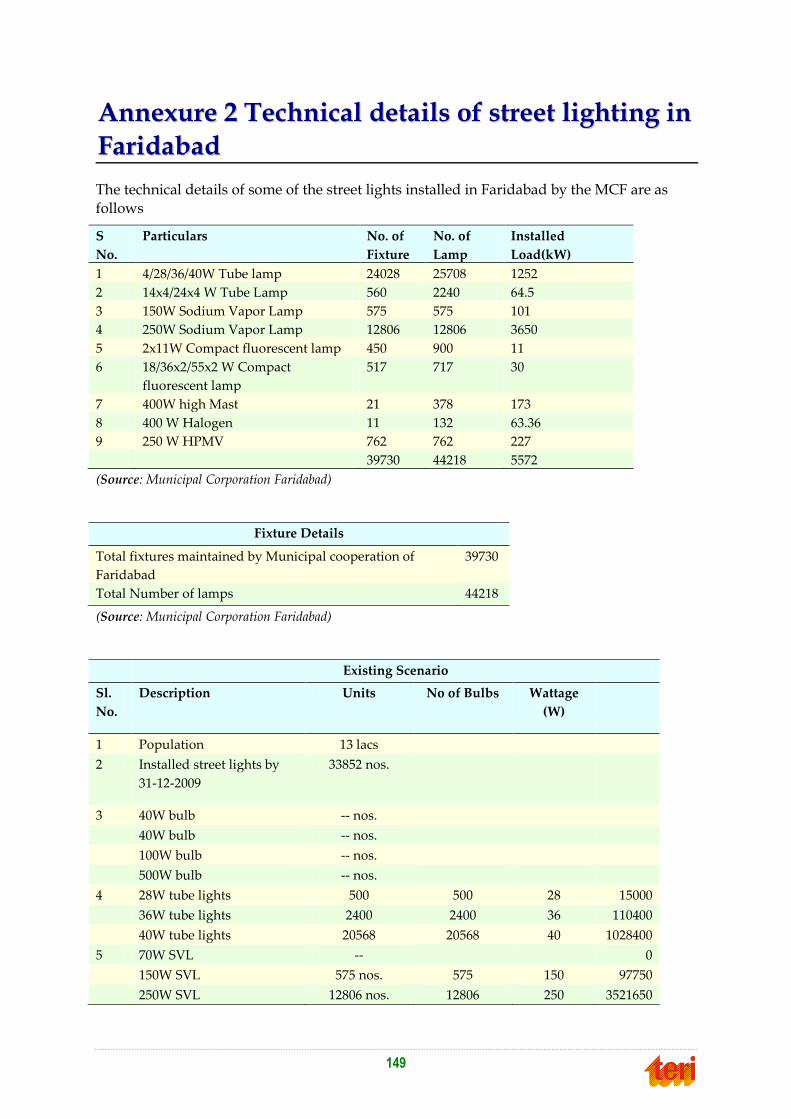
149
AAnnnneexxuurree 22 TTeecchhnniiccaall ddeettaaiillss ooff ssttrreeeett lliigghhttiinngg iinn
FFaarriiddaabbaadd
The technical details of some of the street lights installed in Faridabad by the MCF are as
follows
S
No.
Particulars No. of
Fixture
No. of
Lamp
Installed
Load(kW)
1 4/28/36/40W Tube lamp 24028 25708 1252
2 14x4/24x4 W Tube Lamp 560 2240 64.5
3 150W Sodium Vapor Lamp 575 575 101
4 250W Sodium Vapor Lamp 12806 12806 3650
5 2x11W Compact fluorescent lamp 450 900 11
6 18/36x2/55x2 W Compact
fluorescent lamp
517 717 30
7 400W high Mast 21 378 173
8 400 W Halogen 11 132 63.36
9 250 W HPMV 762 762 227
39730 44218 5572
(Source: Municipal Corporation Faridabad)
Fixture Details
Total fixtures maintained by Municipal cooperation of
Faridabad
39730
Total Number of lamps 44218
(Source: Municipal Corporation Faridabad)
Existing Scenario
Sl.
No.
Description Units No of Bulbs Wattage
(W)
1 Population 13 lacs
2 Installed street lights by
31-12-2009
33852 nos.
3 40W bulb -- nos.
40W bulb -- nos.
100W bulb -- nos.
500W bulb -- nos.
4 28W tube lights 500 500 28 15000
36W tube lights 2400 2400 36 110400
40W tube lights 20568 20568 40 1028400
5 70W SVL -- 0
150W SVL 575 nos. 575 150 97750
250W SVL 12806 nos. 12806 250 3521650

Master plan to develop Faridabad as a “Solar City”
150
Existing Scenario
Sl.
No.
Description Units No of Bulbs Wattage
(W)
6 11W CFL -- 0
450 nos. 900 11 14400
18W CFL 317 nos. 317 18 7291
36W CFL -- 0
100 nos. 200 36 8600
100 nos. 200 55 13000
7 -- 0
560 nos. 2240 24 64960
8 125W HPMV -- 0
9 400W High mast (21 nos.
of 20 mtrs. each) (9 fittings
each 2 nos. bulb)
21 nos. 378 400 164430
10 400W Halogen (11 nos. of
12.5 mtrs.each) (6 fittings
each 2 nos bulbs)
11 nos. 132 400 57420
1000W Halogen - 0
11 Any other light point
(please specify with full
details) 250W HPMV
762 nos. 762 250 209550
12 TOTAL 39170 41978 5312
(Source: Municipal Corporation Faridabad)
The possible replacement options are made available and the percentage energy savings are calculated and list out in the table
Replacement Scenario
S. No. Description Units No of
Bulbs
Wattage
(W)
Total Load (W) Percentage
Energy
saving (%)
Payback
period**
(yr)
4 28W tube
lights
500 500 28 15000 0
28W tube
lights
2400 2400 28 72000 35 3
28W tube
lights
20568 20568 28 617040 40 2.5

Annexures
151
Replacement Scenario
S. No. Description Units No of
Bulbs
Wattage
(W)
Total Load (W) Percentage
Energy
saving (%)
Payback
period**
(yr)
5 90 Watt LED 575 575 90 52900 46 10
120 Watt
LED
12806 12806 120 1562332 56 10
6 11W CFL -- 0
11 450
nos.
900 11 14400 0
18W CFL 317
nos.
317 18 7291 0
36W CFL -- 0
100
nos.
200 36 8600 0
100
nos.
200 55 13000 0
7
lights
-- 0
lights
560
nos.
2240 24 64960 0
8 125W
HPMV
-- 0
9 400W High
mast (21
nos. of 20
mtrs. each)
(9 fittings
each 2 nos.
bulb)
21 nos. 378 400 164430 0
10 400W
Halogen (11
nos. of 12.5
mtrs.each) (6
fittings each
2 nos bulbs)
11 nos. 132 400 57420 0
1000W
Halogen
- 0
11 Any other
light point
(please
specify with
full details)
250W
HPMV
762
nos.
762 250 209550 0
TOTAL 39170 41978 2858.923 46
Note: The replacement Of LED options are based on the manufacturer inputs only. It may vary from case to case.
**The payback period has been done on the basis of the LCC method.

Master plan to develop Faridabad as a “Solar City”
152
The Overall energy savings can be achieved by 46%
Recommendations:
1. It is recommended to replace the 36W/40W tube lamp to 28W T5 lamp with proper
fixture and ballast
2. Recommended to replace with 150W sodium vapour /metal halide lamp with 90W LED lamp fixture.
3. Recommended to replace with 250W sodium vapor lamp with 120W LED fixture.
4. Under the scotopic vision (night time) the lighting levels can be compromised because the LED lighting designed for scotopic vision only.
Specific case for street lighting at Faridabad
Lighting levels analysis with various replacement options of LED fixtures. The figure shows
the different photometry for the luminaire.
The lighting levels analysis has been carried out by using the software tools and its
distributions are given below.
90W LED with Oval lens 90W LED without lens 150W HPSV

Annexures
153
The results are shown in the table below
Case Existing Option 1 Option 2
Lamp 150W HPSV Lamp 120W LED with no
lens
120W LED with
oval lens
Lumen output (lm) 17500 9677 9677
Wattage of system 161 121 121
Achieved average
lighting levels (lux)
26 23 30
Uniformity (minimum
Lux/average Lux)
0.44 0.54 0.66
CRI 20-30 70-80 70-80
CCT 4000K-6500K 4000K-6500K 3000K
Life time (Hr)( Yr) 15000-20000hr (3 -4 yrs) 50000hr (10yrs) 50000hr (10yrs)
The sample picture of the installed LED fixture in comparison to HPSV lamp.

Master plan to develop Faridabad as a “Solar City”
154
Street lighting with 90W LED lamp Street lighting with 150W HPSV lamp
Economic analysis:
The economic analysis has been done in Faridabad solar city project. A life cycle cost analysis (LCCA) is being carried out to show the LED lighting payback period.
Life cycle cost analysis is an economic method of project evaluation in which all cost arising
from owning, operating, maintaining and ultimately disposing of a project are considered to be potentially important to that decision.
Life-cycle costing (LCC) is a method for assessing the total cost of facility ownership. It takes
into account all costs of acquiring, owning, and disposing of lighting systems. LCC is especially useful when project alternatives that fulfill the same performance requirements,
but differ with respect to initial costs and operating costs, have to be compared in order to
select the one that maximizes net savings.
One case study shows that the high pressure sodium vapor lamp with LED life cycle costing
The payback period is 10Yrs.
The various factors have been taken into consideration for LCC cost calculation
Parameters Notation Values
Nominal Discount Rate D 10.0%
Real Discount Rate d 4.9%
Inflation rate I 4.9%
Nominal Escalation Rate E 7.6%
Real Escalation Rate e 2.6%
The sample calculation with results are shown in the below table
Summary of Life cycle cost with payback period
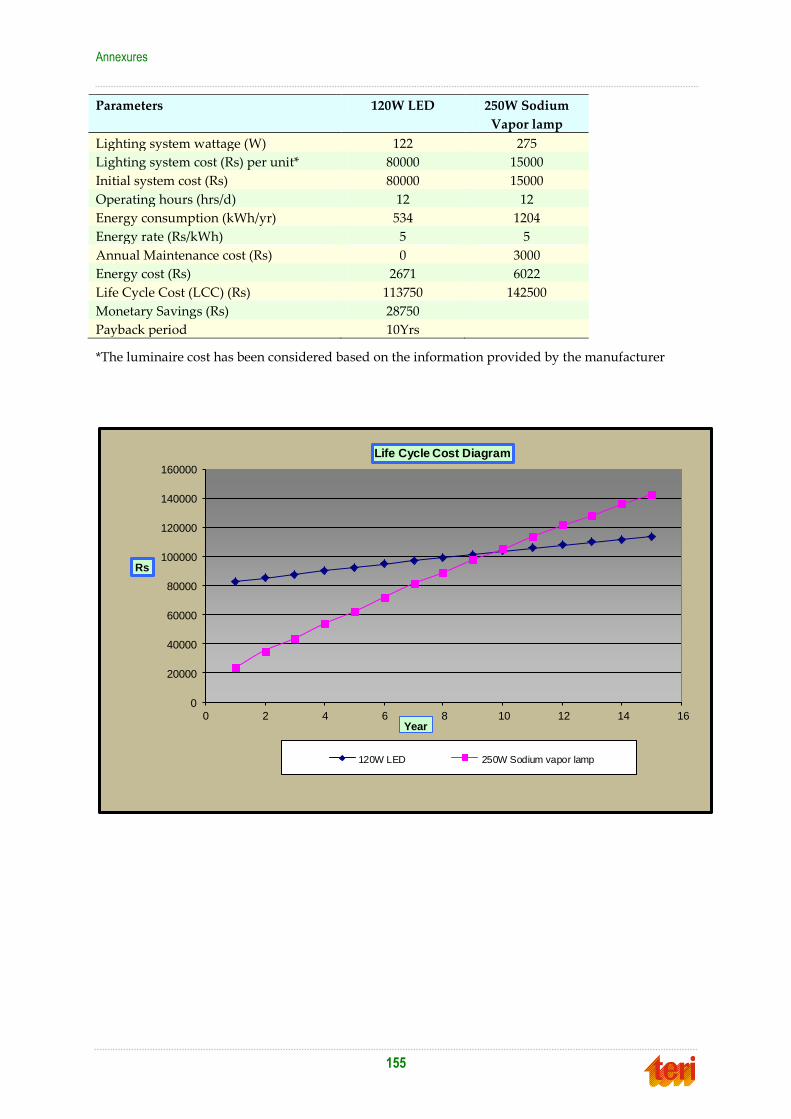
Annexures
155
Parameters 120W LED 250W Sodium
Vapor lamp
Lighting system wattage (W) 122 275
Lighting system cost (Rs) per unit* 80000 15000
Initial system cost (Rs) 80000 15000
Operating hours (hrs/d) 12 12
Energy consumption (kWh/yr) 534 1204
Energy rate (Rs/kWh) 5 5
Annual Maintenance cost (Rs) 0 3000
Energy cost (Rs) 2671 6022
Life Cycle Cost (LCC) (Rs) 113750 142500
Monetary Savings (Rs) 28750
Payback period 10Yrs
*The luminaire cost has been considered based on the information provided by the manufacturer
0
20000
40000
60000
80000
100000
120000
140000
160000
0 2 4 6 8 10 12 14 16
Rs
Year
Life Cycle Cost Diagram
120W LED 250W Sodium vapor lamp


157
AAnnnneexxuurree 33 TTeecchhnniiccaall ddeettaaiillss ooff mmuunniicciippaall wwaatteerr
ppuummppiinngg iinn FFaarriiddaabbaadd
Water Pumping station(s)
S No. Location of
Pump
Pump
Power
Capacity Number Year of
Installation
(HP) (ML)
1 Tigaon Road 100 4.55 3 1993
2 Chawla Colony 50 0.45 1 1993
3 Sector-14 50 0.91 2 2003
4 Sector 15 50 0.91 2 2003
5 Sector 15A 50 0.91 2 2003
6 Sector 16 50 0.91 2 2003
7 Sector 16A 50 0.91 2 2003
8 Sector 17 50 0.91 2 2003
9 Sector 29 60 4.55 2 2003
100 2
10 Sector 21C 60 4.55 2 1990
11 Sector 22 50 0.45 1 1998
12 Sector 23A 50 0.45 1 1998
13 Sector 25 200 13.64 2 2005
100 2
14 NH-1 60 0.91 3 2007
15 NH-2 55 0.91 3 2007
90 1
16 NH-3 45 0.91 3 2005
17 NH-5 55 0.91 3 1994
90 1
18 Budh Vihar 60 4.55 2 2003
19 Dabua Colony 60 0.91 2 2003
40 1
20 Jawahar Colony 25 0.91 2 2003
21 Parvatiya Colony 50 5.91 3 2003
60 1
(Source: Municipal Corporation Faridabad)

Master plan to develop Faridabad as a “Solar City”
158
Sewerage water pump(s)
S No. Site Pump
Power
(HP)
Number
1 Sector-23A Disposal 30 2
2 Mujesor Disposal 100 5
5 2
3 Sector-22 Disposal 30 2
4 Piyali Chowk 30 2
5 Janta Colony 30 2
6 SGM Nagar 20 1
7 Sector-24 Sohna more 100 2
8 Parivatiya Colony Disposal 20 2
9 Jhar Sently Disposal 30 1
10 Sector-37 Disposal 40 1
11 Disposal Vill. Palla 30 2
12 Disposal Palla chowk back side
Kanishka tower
100 2
30 1
1 1
13 Disposal at TW No. 5 Sector-37 60 1
14 Disposal Sector-18 100 2
60 1
75 2
5 2
15 Sector-14 Disposal 50 4
30 1
3 1
16 Disposal Sector-21A 15 3
20 2
30 2
17 Disposal Sector-28 10 1
18 Sector-3 Tigaon road Disposal 75 2
100 1
60 1
50 1
20 1
5 1
19 Chandawly Village Disposal 30 1
20 1
20 Holigate Tigaon road 20 1
21 Sector-6 & 7 dividing road 60 1
22 Sector-11Disposal 20 1
10 1
23 Sector-7 main Disposal 100 4
24 Sector-7 storm water disposal 60 1
50 2

Annexures
159
Sewerage water pump(s)
S No. Site Pump
Power
(HP)
Number
25 Sector-9 main disposal 100 4
26 Sector-8 storm water disposal 100 2
27 Sector 18 100 6
28 Sector 33 100 6
29 Sector 29 100 6
Note:
Sewage treatment plants:
a) PWD, Pratapgarh, capacity 45 MLD
b) PWD, Mujedi, capacity 50 MLD
c) Badshapur, (PWD – 20 MLD and MCF – 45 MLD)
Details of Tube Wells in Faridabad
W.No. Sr.
No.
T.well
No.
Details of
tube wells
Capacity
of T.W.
motor
pump
(hp)
Discharge
in
Gallon/hr.
Energy
meter
details
Average
daily
running
hours
(hr/day)
Remarks.
Location of
T.W.
Main/Mini
DTH
Account
No.
Monthly
Energy
Consumption
(unit)
1 1 101 Green belt,
Sec-8-9
Main 20 11360 MCPW
0021
8832 Av. 24 hours.
2 102 Green belt,
Sec-8-9
Main 17.5 12000 MCPW
0017
8064 Av. 24 hours.
3 103 Green belt,
Sec-8-9
Main 15 8182 MCPW
0016
6144 Av. 24 hours.
4 104 Green belt,
Sec-8-9
Main 20 11360 MCPW
0009
7680 Av. 24 hours.
5 105 Green belt,
Sec-8-9
Main 17.5 12000 MCPW
0018
7680 Av. 24 hours.
6 106 Green belt,
Sec-8-9
Main 17.5 12000 MCPW
0019
6912 Av. 24 hours.
7 107 Green belt,
Sec-8-9
Main 20 11360 MCPW
0020
6912 Av. 24 hours.
8 108 Green belt,
Sec-8-9
Main Dismental. MCPW
0001
8832 Av. 24 hours. Under
repair.
9 109 Green belt,
Sec-8-9
Main 15 12000 MCPW
0002
8832 Av. 24 hours.

Master plan to develop Faridabad as a “Solar City”
160
W.No. Sr.
No.
T.well
No.
Details of
tube wells
Capacity
of T.W.
motor
pump
(hp)
Discharge
in
Gallon/hr.
Energy
meter
details
Average
daily
running
hours
(hr/day)
Remarks.
Location of
T.W.
Main/Mini
DTH
Account
No.
Monthly
Energy
Consumption
(unit)
10 110 Green belt,
Sec-8-9
Main 17.5 12000 MCPW
0003
8832 Av. 24 hours.
11 111 Green belt,
Sec-8-9
Main 20 11360 MCPW
0004
8832 Av. 24 hours.
12 112 Green belt,
Sec-8-9
Main 15 12000 MCPW
0005
8832 Av. 24 hours.
13 113 Green belt,
Sec-8-9
Main 20 11360 MCPW
0006
8832 Av. 24 hours.
14 114 Green belt,
Sec-8-9
Main 17.5 12000 MCPW
0007
8832 Av. 24 hours.
15 115 Green belt,
Sec-8-9
Main 15 12000 MCPW
0008
8832 Av. 24 hours.
16 116 Green belt,
Sec-8-9
Main 20 11360 58 PW
0010
8064 Av. 24 hours.
17 117 Green belt,
Sec-8-9
Main 20 11360 58 PW
0011
8064 Av. 24 hours.
18 118 Green belt,
Sec-8-9
Main 20 11360 MCPW
0010
7296 Av. 24 hours.
19 120 Green belt,
Sec-8-9
Main 15 3000 58 PW
0012
6144 Av. 24 hours. Re-bore
estimate
under
approval.
20 121 Green belt,
Sec-8-9
Main 17.5 6000 58 PW
0013
6144 Av. 24 hours.
21 122 Green belt,
Sec-8-9
Main 17.5 12000 59 PW
0010
4669 Av. 24 hours.
22 123 Green belt,
Sec-8-9
Main 20 11360 58 PW
0017
7296 Av. 24 hours.
23 124 Green belt,
Sec-8-9
Main 20 11360 58 PW
0018
7296 Av. 24 hours.
24 125 Green belt,
Sec-8-9
Main 20 11360 59 PW
0011
6144 Av. 24 hours.
25 126 Green belt,
Sec-8-9
Main 20 11360 58 PW
0019
7296 Av. 24 hours.
26 127 Green belt,
Sec-8-9
Main 17.5 12000 58 PW
0020
7296 Av. 24 hours.
27 128 Green belt,
Sec-8-9
Main 17.5 12000 58 PW
0021
7680 Av. 24 hours.
28 129 Green belt,
Sec-8-9
Main 25 14220 58 PW
0022
7680 Av. 24 hours.

Annexures
161
W.No. Sr.
No.
T.well
No.
Details of
tube wells
Capacity
of T.W.
motor
pump
(hp)
Discharge
in
Gallon/hr.
Energy
meter
details
Average
daily
running
hours
(hr/day)
Remarks.
Location of
T.W.
Main/Mini
DTH
Account
No.
Monthly
Energy
Consumption
(unit)
29 130 Green belt,
Sec-8-9
Main 17.5 12000 58 PW
0023
7680 Av. 24 hours.
30 131 Green belt,
Sec-8-9
Main 20 11360 58 PW
0024
7680 Av. 24 hours.
31 132 Green belt,
Sec-8-9
Main 17.5 12000 58 PW
0025
7680 Av. 24 hours.
32 133 Green belt,
Sec-8-9
Main 17.5 12000 58 PW
0026
7680 Av. 24 hours.
33 Village
Sahupura
Main 25 14318 UMS 1 5000 Av. 24 hours.
34 Village
Jharsently,
Sec-58
Main 10 5727 JSP 13 5443 Av. 12 hours.
35 Village
Jharsently,
Sec-58
Mini 7.5 4090 JSP 88 1000 02 hours.
36 Village
Jharsently,
near Sec-58
Mini 10 4090 New
connection
now not
billing run
by
Generator.
37 Village
Jharsently,
near Sec-58
Mini 7.5 4090 New
connection
now not
billing run
by
Generator.
38 Village
Jharsently,
near Sec-58
Mini 7.5 4090 New
connection
now not
billing run
by
Generator.
39 Village
Jharsently,
near Sec-58
Mini 7.5 4090 New
connection
now not
billing run
by
Generator.

Master plan to develop Faridabad as a “Solar City”
162
W.N
o.
Sr.
No.
T.well
No.
Details of tube wells Capacity
of T.W.
motor
pump
(hp)
Discharge
in
Gallon/hr.
Energy meter details Average
daily
running
hours
(hr/day)
Remarks.
Location of
T.W.
Main/Mini
DTH
Account
No.
Monthly
Energy
Consumption
(unit)
2 1 T.W-2 D.M Road
near Bata
More,
Main 20 H.P 8182 1LPW0002 AV 6144 24 Hr.
2 T.W-3 D.M Road
near Bata
More
Main 20 HP 11360 ESI-276 AV 7335 24 Hr.
3 T.W-1 Subji
mandi
Mujesser
Mini 5 HP 2000 PWW-686 M.M.C 04 Hr.
4 T.W-2 Lamba
Mohalla
mujesser
Mini 5 HP 2000 PWW-683 M.M.C 06 Hr.
5 T.W-3 Dayanand
Public
School
Mujesser
Mini 5 HP 2000 PWW-674 M.M.C 06 Hr.
6 T.W-1 Auto Pin
Jhuggi
Mini 5 HP 2000 P.P-244 M.M.C 06 Hr.
7 T.W-1 Rajiv
Colony
Jhuggi
Mini 5 HP 2000 PWW-685 M.M.C 06 Hr.
8 T.W-1 Subhash
Colony
Mini 5 HP 2000 PP-243 M.M.C 06 Hr.
9 T.W-5 Govt. High
School
Mujesser
Main 20 HP 11360 14MS-2HU
768
AV 4300 06 Hr.
10 T.W-2 Rajiv
Nagar
Jhuggi
Mini 5 HP 2000 06 Hr. New
connectio
n not
billing
11 T.W-1 Azad
Nagar
Jhuggi
Mini 5 HP 2000 06 Hr. New
connectio
n not
billing
12 T.W-4 D.M road
near
Hyundai
Showroom
Bata Fly
over
Main 20 HP 2000 06 Hr. New
connectio
n not
billing.

Annexures
163
List of water supply Mini T/W
Ward No 3
S.No. Area Bore Moter Dishcharge
1 Gali No 40 - 22 Road Sanjay Colony 8" 7.5 HP 2"
2 Gali No 37 - 22 Road S/Colony 8" 5 HP 2"
3 Gali No 32, 33 -22 Road S/Colony 8" 5 HP 2"
4 Gali No 16 -33 Road S/Colony Near Rajender Chock 8" 7.5 HP 2"
5 Gali No 17 Near Rajender Chock 33 Road S/Colony 8" 7.5 HP 2"
6 Gali No 18 - 22 Road S/Colony 8" 5 HP 2"
7 Community Centre 33 Road S/Colony Near Sohna Road 8" 7.5 HP 2"
8 Community Centre Sec 23A 8" 7.5 HP 2"
9 Sec 23A, Housing Board Colony EWS Park 8" 5 HP 2"
Sr.
No.
Ward
No.
Details of tubewell Capacity of
tubewell motor
pump(hp)
Discharge in
Gallon/hr
Average Dually
Running Hours
(Hr/Day)
1 4 Sec-22 (H.No. 50) 7.5 4090 8
2 4 Sec-22 (H.No. 525) 7.5 4090 8
3 4 Sec-22 (H.No. 221) 7.5 4090 6
4 4 Sec-22 (H.No.634)
(Chamber)
7.5 4090 6
5 4 Shiv Colony Tw No. 1 7.5 4090 10
5 4 Shiv Colony Tw No. 2 7.5 4090 10
6 4 Mata Vaishno Devi
Mandir Backside (Sanjay
Colony)
7.5 4090 10
7 4 Gali No. 69 (Sanjay
Colony)
7.5 4090 10
8 4 Gali No. 66 (Sanjay
Colony)
7.5 4090 10
9 4 Gali No. 79 (Sanjay
Colony)
7.5 4090 10
10 4 Gali No. 56 (Sanjay
Colony)
7.5 4090 10
11 4 Gali No. 54 (Sanjay
Colony)
7.5 4090 10
12 4 Gali No. 58 (Sanjay
Colony)
5 2000 10
13 4 Gali No. 61 (Sanjay
Colony)
7.5 4090 10
14 4 Gali No. 53 (Sanjay
Colony)
7.5 4090 10
15 4 Gali No. 52 (Sanjay
Colony)
7.5 4090 10
16 4 Gali No. 48 (Sanjay
Colony)
5 2000 10
17 4 East India Colony 7.5 4090 10
18 4 Fish Market (Chamber) 7.5 4090 5
19 4 Sec 23 (H.No. 632) 7.5 4090 6

Master plan to develop Faridabad as a “Solar City”
164
Sr.
No.
Ward
No.
Details of tubewell Capacity of
tubewell motor
pump(hp)
Discharge in
Gallon/hr
Average Dually
Running Hours
(Hr/Day)
20 4 Sec 23 (H.No. 225) 7.5 4090 7
21 4 Sec 23 (H.No. 74) MIG 7.5 4090 7
22 4 Sec 23 (H.No. 279)
Community Centre
7.5 4090 5
Ward No 5
1 Janta Colony TW
No 4 Near Sabji
Mandi
Main
12"ө
10 2500 - - 16
2 Janta Colony TW
No 5
Main
12"ө
10 2500 - - 16
3 Janta Colony TW
No 3 Mother
Dairy Park
Main
12"ө
7.5 2000 - - 16
4 Dayanand TW
Near Dayanand
School J.Colony
Main
12"ө
7.5 2500 - - 16
5 Ram Mandir TW I Mini
8"ө
5 1000 - - 10
6 Ram Mandir TW
II
Mini
8"ө
7.5 1500 - - 10
7 TW Gadariya
Mohhalla
Mini
8"ө
7.5 1500 - - 16
8 Kalavati Centre
TW Saaran Talab
Road Community
Centre JC
Mini
8"ө
7.5 1000 - - 12
9 Saaran Talab TW Main
12"ө
10 2500 - - 14
10 Saaran School TW
Jawahar Colony
Govt. School
Main
12"ө
15 3200 - - 14
11 Gali No 6 Main
Chowk 60 Road
Mini
8"ө
10 3000 - - 6
12 Parmaar Road
Jawahar Colony
TW
Mini
8"ө
10 2500 - - 10
13 Gochhi Nala TW
Jawahar Colony
Mini
8"ө
7.5 2000 - - 16
14 Shiv Park TW Mini
8"ө
7.5 1500 - - 10
15 Parshuram
Boosting
Parshuram Park
Jawahar Colony
- 25 5

Annexures
165
Ward No 5
15 Parshuram
Boosting
Parshuram Park
Jawahar Colony
- 30 6
15 Parshuram
Boosting
Parshuram Park
Jawahar Colony
- 20 6
15 Parshuram
Boosting
Parshuram Park
Jawahar Colony
- 7.5 4
Ward 6
1 Nekpur TW No 1
Near Rawal School
Nekpur
Main 12" 10 HP 3000 - - 18
2 Nekpur TW No 2 Main 12" 5 HP 1500 - - 18
3 Nekpur TW No 3 Main 12" 10 HP 2500 - - 18
4 Nekpur TW No 5 Main 12" 10 HP 3000 - - 18
5 Nekpur TW No 6 Main 12" 10 HP 2500 - - 18
6 Nekpur TW No 7 Main 12" 10 HP 3000 - - 18
7 Nekpur TW No 8
Balmiki Basti Nangla Sohna Road
Main
12"ө
10 HP 3000 - - 18
8 Nangla Sarkari School Main
12"ө
10 HP 2000 - - 10
9 Community Centre 33 Road Sanjay Colony Mini 8" 7.5 HP 2000 - - 12
10 Radhakrishn Mandir
Gali No 28
33 Road Sanjay Colony
Mini 8" ө 7.5 HP 2000 - - 16
11 B B N School Road TW Lal Kothi Mini 8" ө 10 HP 2500 - - 10
12 Sulabh Sochalaya Sanjay Colony 8" ө 10 HP 2500 - - 16
13 Sec-52, Mandir TW Sanjay Colony 12" ө 10 HP 2000 - - 4
14 Bharat Hardware Store Sanjay Colony Gochhi Nala 8" 7.5 HP 2000 - - 12
15 Gali No 41 33 Road Sanjay Colony 8" 7.5 HP 2000 - - 12
16 Vaid Road Parvatiya Colony 8" 7.5 HP 2000 - - 16
17 Bhagwati Mandir Gali Saaran School Road Parvtiya Colony 8" 7.5 HP 2000 - - 16
18 Mother Dairy Kamau
Mandir Road Parvatiya Colony
8" 10 HP 2500 - - 18
19 Golawali Gali Saaran School Road Parvatiya Colony 8" 10 HP 2500 - - 16
20 Joshiwali Gali Netram Sariyawali Road Parvatiya Colony 8" 7.5 HP 2000 - - 12
21 Shiv Mandir Netram Sariyawala Road Parvatiya Colony 8" 10 HP 2500 - - 16
22 Parshuram Dharamshala Parvatiya Colony 8" 7.5 HP 2000 - - 16
23 Parvatiya Colony Boosting MCF 25 HP
50 HP
Spar
100
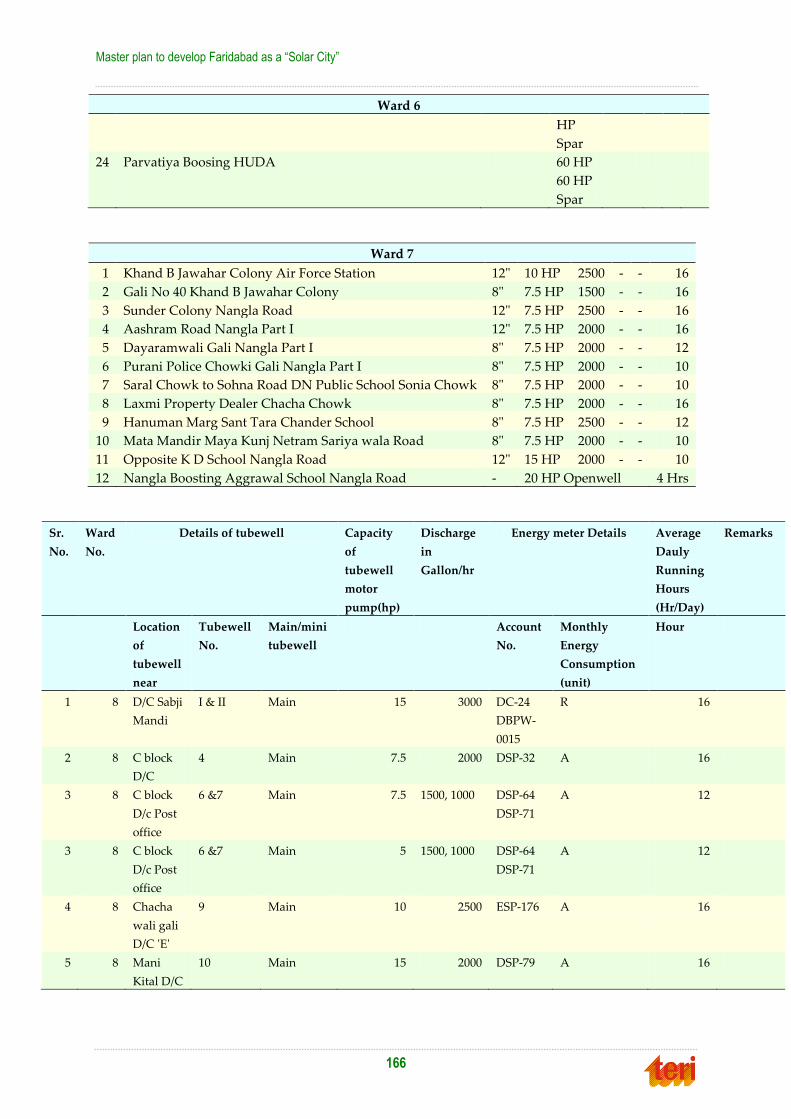
Master plan to develop Faridabad as a “Solar City”
166
Ward 6
HP
Spar
24 Parvatiya Boosing HUDA 60 HP
60 HP
Spar
Ward 7
1 Khand B Jawahar Colony Air Force Station 12" 10 HP 2500 - - 16
2 Gali No 40 Khand B Jawahar Colony 8" 7.5 HP 1500 - - 16
3 Sunder Colony Nangla Road 12" 7.5 HP 2500 - - 16
4 Aashram Road Nangla Part I 12" 7.5 HP 2000 - - 16
5 Dayaramwali Gali Nangla Part I 8" 7.5 HP 2000 - - 12
6 Purani Police Chowki Gali Nangla Part I 8" 7.5 HP 2000 - - 10
7 Saral Chowk to Sohna Road DN Public School Sonia Chowk 8" 7.5 HP 2000 - - 10
8 Laxmi Property Dealer Chacha Chowk 8" 7.5 HP 2000 - - 16
9 Hanuman Marg Sant Tara Chander School 8" 7.5 HP 2500 - - 12
10 Mata Mandir Maya Kunj Netram Sariya wala Road 8" 7.5 HP 2000 - - 10
11 Opposite K D School Nangla Road 12" 15 HP 2000 - - 10
12 Nangla Boosting Aggrawal School Nangla Road - 20 HP Openwell 4 Hrs
Sr.
No.
Ward
No.
Details of tubewell Capacity
of
tubewell
motor
pump(hp)
Discharge
in
Gallon/hr
Energy meter Details Average
Dauly
Running
Hours
(Hr/Day)
Remarks
Location
of
tubewell
near
Tubewell
No.
Main/mini
tubewell
Account
No.
Monthly
Energy
Consumption
(unit)
Hour
1 8 D/C Sabji
Mandi
I & II Main 15 3000 DC-24
DBPW-
0015
R 16
2 8 C block
D/C
4 Main 7.5 2000 DSP-32 A 16
3 8 C block
D/c Post
office
6 &7 Main 7.5 1500, 1000 DSP-64
DSP-71
A 12
3 8 C block
D/c Post
office
6 &7 Main 5 1500, 1000 DSP-64
DSP-71
A 12
4 8 Chacha
wali gali
D/C 'E'
9 Main 10 2500 ESP-176 A 16
5 8 Mani
Kital D/C
10 Main 15 2000 DSP-79 A 16

Annexures
167
Sr.
No.
Ward
No.
Details of tubewell Capacity
of
tubewell
motor
pump(hp)
Discharge
in
Gallon/hr
Energy meter Details Average
Dauly
Running
Hours
(Hr/Day)
Remarks
Location
of
tubewell
near
Tubewell
No.
Main/mini
tubewell
Account
No.
Monthly
Energy
Consumption
(unit)
Hour
6 8 E block
School
D/C
11 Main 10 2500 ESP-181 A 16
7 8 Kapra
Calus
12 Main 10 1500 ESP-198 A 16
8 8 Kapra
Calus
I, II Mini 7.5 2000 ESP-13 A 16
9 8 Vill.
Saran
3 Main 7.5 2500 35SP-29 R 10
10 8 Janta
Colony
I, II Mini 5.5 1500 32SO-
346
MFPW-
40
A 16
11 8 Sec-7 1,2,3 Mini 7.5 1500 ESP-208
40SP-5
MFPW-
47
A 16
11 8 Sec-7 1,2,3 Mini 5.5 1500 ESP-208
40SP-5
MFPW-
47
A 16
Sr.
No.
Ward
No.
Details of tubewell Capacity
of
tubewell
motor
pump(hp)
Discharge
in
Gallon/hr
Energy meter Details Average
Dauly
Running
Hours
(Hr/Day)
Remarks
Location of
tubewell
near
Tubewell
No.
Main/mini
tubewell
Account
No.
Monthly
Energy
Consumpt
ion (unit)
Hour
1 9 Nangla
School
1-2 Main 5 HP
15 HP
1000 G
3000 G
NSP 129
NSP 146
16
2 9 Near Nangla
School
3-4 Main
Main
5 HP
10 HP
1500 G
2000 G
NSP 198
NSP 252
16
3 9 Nangla
Mandir
1 Main 15 HP 3000 G 16
4 9 Village TW
Near
I Main 15 HP 3000 G NSP 256 16

Master plan to develop Faridabad as a “Solar City”
168
Sr.
No.
Ward
No.
Details of tubewell Capacity
of
tubewell
motor
pump(hp)
Discharge
in
Gallon/hr
Energy meter Details Average
Dauly
Running
Hours
(Hr/Day)
Remarks
Gazipur
5 9 TW Ved
Mandir
I Main 10 HP 2000 G BKPW
0007
16
6 9 Shiv Mandir
Nangla Part
2
II Main 15 HP 3000 G PSP 183 16
7 9 Gazipur
Puliya II
II Main 10 HP 3000 G GSP 177
0017
16
8 9 Bhanupratap
Udana
Chowk
I Mini 5 HP 1500 G BSPW 18 16
9 9 Uttam Nagar
Ram
Snanghar
I Main 15 HP 3000 G KPW
0004
16
10 9 Dabua
Village
Harizan
Basti
I Main 15 HP 2500 G 16
11 9 K D School
TW DC
I-II Main
Mini
15 HP
7.5 HP
2000 G
1000 G
CSP 95 16
12 9 Ratiram
Marg Khan
DC
I Mini 7.5 HP 1500 G DBPW
0018
16
13 9 Pt. Jagdish
wali Gali DC
I Mini 7.5 HP 1500 G DBSP
275
16
14 9 Ratiram
Marg Amrit
Bagh DC
I Mini 7.5 HP 1500 G 16
15 9 27 Red Rati
Gali DC
I Mini 7.5 HP 2000 G 16
16 9 Ramesh wali
Gali DC
I Mini 7.5 HP 1500 G 16
17 9 Titu wali
Gali DC
I Mini 5 HP 1500 G DBPW
0019
16
18 9 Sec 2 Mika
School DC
I Mini 5 HP 1000 G 16
19 9 Ashok
Bharat Daash
Gali DC
I Mini 7.5 HP 1000 G 16
20 9 Janta
Nursing
Home Gali
DC
I Mini 10 HP 1500 G DBPW
0016
16

Annexures
169
Sr.
No.
Ward
No.
Details of tubewell Capacity
of
tubewell
motor
pump(hp)
Discharge
in
Gallon/hr
Energy meter Details Average
Dauly
Running
Hours
(Hr/Day)
Remarks
21 9 Gazipur
Village 1-2
I-II Main
Mini
10 HP 2000 G
2000 G
BKPW
0010
16
Sr.
No.
Ward
No.
Details of tubewell Capacity
of
tubewell
motor
pump(hp)
Discharge
in
Gallon/hr
Energy meter Details Average
Dauly
Running
Hours
(Hr/Day)
Remarks
Location of
tubewell
near
Tubewell
No.
Main/mini
tubewell
Monthly
Energy
Consumption
(unit)
Hour
1 10 Fagna
Chowk D/C
'B' Block
2 Main 15 3000 P R P W 5 R 16
2 10 A Block D/C
Police
Chowk
3 Main
Main
7.5 2000 D SP 117 A 16
3 10 D/C
boosting
5 Main 10 2000 P R P 63 R 16
4 10 A Block D/C
Anay
Godaw
8 Main 10 1500 P R P 317 A 16
5 10 B Block D/C
Bijli board
14 Main 10 1500 P R P 181 R 16
6 10 Jain Mandir
D/C
1 Main 7.5 1500 D S P 108 R 16
7 10 Vill Dabua
Govt. School
1 Mini 5 1000 B K P W
001
R 16
8 10 Vill Dabua
Johad
2 Main 25 4000 D B S P
274
R 16
9 10 Vill Dabua
Johad
3 Main 10 2000 D B S P
281
A 16
10 10 Vill Nawada 1 Main 10 2000 P L P W 2 A 16
11 10 Vill Nawada 2 Mini 5 1500 B K P W 5 A 16
12 10 Nawada
Colony
1 Mini 10 2000 P L P W 4 A 16
13 10 Vill Bhanbai 1 Main 10 2500 H S P 215 A 16
14 10 Vill Bhanbai
Asharam
2 Main 7.5 2000 H S P 229 A 16
15 10 Vill Bhanbai
Hanuman
Mandir
3 Mini 5 1000 P L P W 1 A 16
16a 10 Arawali
Vihar
1 Main 7.5 1500 15.5. i 737 A 16
16b 10 Arawali 2 Main 5 1500 15.5.i A

Master plan to develop Faridabad as a “Solar City”
170
Sr.
No.
Ward
No.
Details of tubewell Capacity
of
tubewell
motor
pump(hp)
Discharge
in
Gallon/hr
Energy meter Details Average
Dauly
Running
Hours
(Hr/Day)
Remarks
Location of
tubewell
near
Tubewell
No.
Main/mini
tubewell
Monthly
Energy
Consumption
(unit)
Hour
Vihar
16c 10 Arawali
Vihar
3 Main 7.5 1500 A
17a 10 Nehru
Colony
1 Mini 5 1000 15.5i - 720 A 16
17b 10 Nehru
Colony
2 Mini 1.5 1000 15.5i - 721 A
17c 10 Nehru
Colony
3 Mini 1.5 1000 15.5i - 722 A
18a 10 Nehru
Colony
4 Mini 1.5 1000 16
18b 10 Nehru
Colony
5 Mini 1.5 1000
19a 10 Nehru
Colony
6 Mini 1.5 1000 16
19b 10 Nehru
Colony
7 Mini 1.5 1000
20 10 A Block 17
No. Chungi
1 Mini 5 1500 D R P W 9 R 16
21 10 A Block D/C
Prakash
Bhanti
1 Mini 10 2500 D R P W 6 R 16
22 10 A Block D/C 1 Mini 5 2000 P R P W 8 A 16
23 10 A Block D/C
Prata
Bainsla
1 Mini 5 1500 P R P W
38
A 10
24 10 D/C
boosting
Boosting Main 60 30000 15.M.S
141
R 10
S.No Ward
no.
Details of tube well Capacity
of tube
well
motor
pump
(hp)
Discharge
in
Gallon/hr
Energy meter details Average
daily
running
hours
(Hr/Day)
Location of tube well Main/
mini DTH
Account
no.
Monthly Energy
Consumption
(unit)
1 11 In 2A park Main 10 3000 N-2-PW-10 Meter working 16
2 11 In 2B park Main 15 4000 N-2-PW-2 meter working 16
3 11 In 2C park Main 15 4000 N-2-PW-8 Meter not
working
16
4 11 In 2C WH park Main 75 25000 N-2-PW-4 Meter working 16
5 11 In 2C WH park Main 5 2000 16
6 11 In 2C block policy choky Main 5 2000 16

Annexures
171
S.No Ward
no.
Details of tube well Capacity
of tube
well
motor
pump
(hp)
Discharge
in
Gallon/hr
Energy meter details Average
daily
running
hours
(Hr/Day)
Location of tube well Main/
mini DTH
Account
no.
Monthly Energy
Consumption
(unit)
7 11 In 2D block Main 10 3000 N-2-PW-
0006
Meter working 16
8 11 In 2E park-I Main 5 5000 N-2-PW-
0001
Meter working 16
9 11 In 2E park-II Main 7.5 2500 N-2-PW-
0009
16
10 11 In 2F Park Main 10 3000 N-2-PW-
0005
Meter working 16
11 11 In 2H park Main 10 3000 N-2-PW-
0011
Meter working 16
12 11 In 2J park Main 7.5 2500 16
13 11 In 2J wh park Main 10 3000 N-2-PW-
0007
Meter working 16
14 11 In 2J park Main 5 2000 MT-PW-
0002
Meter not
working
16
15 11 In 2N park Main 15 4000 MT-PW-
0001
Meter working 16
16 11 In phabda singh Main 5 2000 ISMS-0017 Meter working 16
17 11 In tikona park Main 10 3000 ISMS-0003 Meter working 16
18 11 In 1F park Main 7.5 2500 NI-PW-4 Meter not
working
16
19 11 In 1E, wh Mkt park Main 10 3000 IS-PW00004 Meter working 16
20 11 In 1E wh Main 7.5 2500 NI-PW-7 Meter working 16
21 11 In rose garden 1 Main 15 4000 N-2-PW-
0040
Meter working 16
22 11 In rose garden 2 Main 5 2000 N-2-PW-
0012
Meter working 16
23 11 In football ground Main 15 4000 N-2-PW-
0003
To check the
meter
16
24 11 In stadium Main 10 3000 N-2-PW-
0013
Meter working 16
25 11 In 1E wh near community
centre
Main 5 2000 16
26 11 2C Janta Colony Main 10 30000 16
27 11 2E Block Main 5 2000 16
S.No Ward
no.
Details of tube well Capacity
of tube
well
motor
pump
(hp)
Discharge
in
Gallon/hr
Energy meter details Average
daily
running
hours
(Hr/Day)
Remarks
Location of tube well Main/ mini
DTH
Account
no.
Monthly
Energy
Consumption
(unit)

Master plan to develop Faridabad as a “Solar City”
172
S.No Ward
no.
Details of tube well Capacity
of tube
well
motor
pump
(hp)
Discharge
in
Gallon/hr
Energy meter details Average
daily
running
hours
(Hr/Day)
Remarks
Location of tube well Main/ mini
DTH
Account
no.
Monthly
Energy
Consumption
(unit)
1 12 In 1A park Main 10 3000 16 to apply
2 12 In 1A park Main 5 2000 NL-PW-
0002
Meter working 16
3 12 In 1B Bata tikona Main 10 3000 NL-PW-
5
Meter working 16
4 12 In B Bata petrol Pump Main 10 3000 ML-PW-
6
Meter working 16
5 12 In 1B Vijay ramlila Main 10 3000 NL-PW-
3
Meter not
working
16
6 12 In 1B vijay ramlila Mini 5 2000 to apply
7 12 In 1C Main 10 3000 TP-PW-
0001
Meter working 16
8 12 In 1CD Main 10 3000 TP-PW-
2
Meter working 16
9 12 In 1D park chander
bhatia
Main 15 4500 TP-BW-
5
Meter not
working
16
10 12 In 1D park renu
bhatia
Main 10 3000 TP-PW-
3
Meter working 16
11 12 1G park Main 10 3000 N-1-PW-
0006
Meter working 16
12 12 In 1G new Main 15 4500 16 to apply
13 12 In 1H park Main 7.5 2500 16 to apply
14 12 In 1H park Main 5 2000 N-1-PW-
0001
Meter working 16
15 12 In 1J park Main 10 3000 NL-PW-
0007
Meter not
working
16
16 12 In 1K park Main 10 3000 TP-PW-
0008
Meter not
working
16
17 12 In nehru ground
P.N.B
Main 10 3000 TS-PW-
0006
Meter working 16
18 12 Nehru ground
community centre
Main 15 4500 TS-PW-
0009
Meter not
working
16
19 12 Nehru ground fire
station
Main 5 2000 NL-PW-
0001
Meter working 16
20 12 AC nagar Main 10 3000 TS-PW-
0011
Meter not
working
16
21 12 In AC nagar slaughter Main 10 3000 TS-P-
0007
Meter working 16
22 12 In1 JK t. well in school Main TS-PW-
0005
16 to
disconne
ct

Annexures
173
S.N
o
Ward
no.
Details of tube well Capacity
of tube
well
motor
pump
(hp)
Discharge
in
Gallon/hr
Energy meter details Average
daily
running
hours
(Hr/Day)
Remarks
Location of tube
well
Main/
mini
DTH
Account no. Monthly
Energy
Consumption
(unit)
1 13 Indra colony park
1
Main 10 3000 Meter not
working
16
2 13 Indra colony park
2
Main 10 3000 Meter not
working
16
3 13 Millhad Main 10 3000 Meter not
working
16
4 13 Ram nagar 1 Main 10 3000 Meter not
working
16
5 13 Ram nagar 2 Main 10 3000 16 Applied
6 13 Krishna colony 1 Mini 10 3500 Meter not
working
7 13 Krishna colony 2 Main 15 4500 16 Applied
8 13 Octori T.well Main 5 2000 16
9 13 A.c nagar sulabhy Main 10 3000 Meter not
working
16
10 13 A.C nagar ram
dharam kaata
Main 10 2000 Meter not
working
16
11 13 A.C nagar dharam
kaata
Mini 5 2000 16 to apply
12 13 A.C nagar near
nalla
Mini 5 2000 Meter working 16
13 13 A.C nagar sabji
mandi
Mini 5 2000 Meter working 16
14 13 A.C nagar kabari Mini 5 2000 Meter working 16
15 13 Nehru colony Mini 15 500 16 to apply
16 13 A.C Nagar T. well
1
Mini TW-PW-0012 Meter working
17 13 A.C Nagar T. well
2
Mini TW-PW-0013 Meter working
18 13 A.C Nagar T. well
3
Mini TW-PW-0014 Meter not
working
19 13 A.C Nagar T. well
4
Mini TW-PW-0015 Meter not
working
20 13 A.C Nagar T. well
5
Mini TW-PW-0016 Meter working
21 13 A.C Nagar T. well
6
Mini TW-PW-0017 Meter working
22 13 A.C Nagar T. well
7
Mini TW-PW-0018 Meter working
23 13 A.C Nagar T. well
8
Mini TW-PW-0019 Meter not
working
24 13 A.C Nagar T. well
9
Mini TW-PW-0020 Meter working

Master plan to develop Faridabad as a “Solar City”
174
S.N
o
Ward
no.
Details of tube well Capacity
of tube
well
motor
pump
(hp)
Discharge
in
Gallon/hr
Energy meter details Average
daily
running
hours
(Hr/Day)
Remarks
Location of tube
well
Main/
mini
DTH
Account no. Monthly
Energy
Consumption
(unit)
25 13 A.C Nagar T. well
10
Mini TW-PW-0021 Meter not
working
26 13 A.C Nagar T. well
11
Mini TW-PW-0022 Meter working
27 13 A.C Nagar T. well
12
Mini TW-PW-0023 Meter working
S.No Ward
no.
Details of tube well Capacity
of tube
well
motor
pump
(hp)
Discharge
in
Gallon/hr
Energy meter details Average
daily
running
hours
(Hr/Day)
Location of tube well Main/miniDTH Account
no.
Monthly
Energy
Consumption
(unit)
1 14 5A Park 12’’dia 10H.p
3500g/h
N5 PW
0010
Av=4000 16
2 14 5A Park 12’’dia 10H.p
3500g/h
N5 PW
0010
Av=4994 16
3 14 Opp police thanna 12’’dia 10H.p
3500g/h
16
4 14 5C Park 12’’dia 10H.p
3500g/h
N5 PW
0013
Av=3000 to
4000
16
5 14 5D Park 12’’dia 10H.p
3000g/h
N5 PW
0022
Av=300 16
6 14 5F Park 12’’dia 10H.p
3500g/h
N5 PW
0019
Av=3000 16
7 14 5G Park 12’’dia 7.5H.p
2800g/h
N5 PW
00015
Av=4000 16
8 14 5G Park 12’’dia 10H.p
3500g/h
N5 PW
0015
Av=4000 16
9 14 5H Park near Kabari
Mohalla
12’’dia 10H.p
3500g/h
N5 PW
0002
Av=4000 16
10 14 Park near Janta Band 12’’dia 10H.p
3500g/h
N5 PW
0008
Av=3000 16
11 14 5J Park 12’’dia 10H.p 3500g/h N5 PW
0021
Av=3072 16
12 14 5J Park 12’’dia 15H.p 4000g/h 21 Av=3072 16
13 14 5K Park T.W 12’’dia 7.5H.p 2800g/h 14 Av=2517 16
14 14 5L Park T.W 12’’dia 10H.p 3500g/h 4 Av=3000 16
15 14 5L Park 12’’dia 10H.p 3500g/h N5 PW
0004
Av=3000 16
16 14 5M Park 12’’dia 10H.p 3500g/h 19 Av=3000 16
17 14 5N Park 12’’dia 10H.p 3500g/h 20 Av=4000 16

Annexures
175
S.No Ward
no.
Details of tube well Capacity
of tube
well
motor
pump
(hp)
Discharge
in
Gallon/hr
Energy meter details Average
daily
running
hours
(Hr/Day)
Location of tube well Main/miniDTH Account
no.
Monthly
Energy
Consumption
(unit)
18 14 5N T.W near Mayor
office
12’’dia 10H.p 3500g/h 16
19 14 5P T.W Park 12’’dia 10H.p 3500g/h 1 Av=3000 16
20 14 Wid home park 12’’dia 15H.p 4000g/h 16
21 14 Shiva ji park T.W 12’’dia 10H.p 3500g/h 15SI-703 Av=2000 16
14 K.C road T.W near
gurudwara
8’’Dia mini 7.5H.p 2800g/h 16
S.No Ward
no.
Details of tube well Capacity of
tube well
motor
pump (hp)
Discharge
in
Gallon/hr
Energy meter details Average
daily
running
hours
(Hr/Day)
Location of tube
well
Main/miniDTH Account
no.
Monthly
Energy
Consumption
(unit)
1 15 3A Park DTH 7.5H.p 2000 15SI-567 20
2 15 3A small park DTH 10H.p Apply
3 15 3A WH park DTH 10H.p 3500 15SI-713
4 15 MCF colony NH-3 DTH 10H.p 3400 15SI-715 20
5 15 Sport complex DTH 5H.p 1500 15SI-717 18
6 15 Sport complex DTH 10H.p 3000 20
7 15 3C Park DTH 5H.p 1200 15SI-480 18
8 15 3C park DTH 10H.p 3500 15SI-565 18
9 15 3D-1 Park DTH 10H.p 4000 15SI-334 22
10 15 3D-2 Park DTH 15H.p 4200 15MS-20 20
11 15 3E Park DTH 5H.p 1500 18
12 15 3F Park DTH 7.5H.p 2200 15SI-478 20
13 15 3G Park DTH 10H.p 3000 20
14 15 Mulla hotel near DTH 5H.p 1000 12
15 15 Outer road DTH 5H.p 2000 15SI-564 12
16 15 Outer road DTH 7.5 H.p 2000 15SI-481 12
17 15 Outer road DTH 10H.p 2000 12
18 15 Outer road DTH 5H.p 1500 18
19 15 Rahul colony DTH 10H.p 2000 12
20 15 Rahul colony DTH 15H.p 4500 14
21 15 Central green DTH 15H.p 5000 16
22 15 E.S.I boosting DTH 7.5H.p 2800 16
23 15 E.S.I boosting DTH 10H.p 3200 16
24 15 Bodh vihar
boosting
DTH 10H.p 2800 16
25 15 3B-near DTH 7.5H.p 2000 10
26 15 Near E.S.I Chowk Booster pump 45H.p 15LS-24
3nos
27 15 Bodh vihar outer Bodh vihar 60H.p 3nos

Master plan to develop Faridabad as a “Solar City”
176
S.No Ward
no.
Details of tube well Capacity of
tube well
motor
pump (hp)
Discharge
in
Gallon/hr
Energy meter details Average
daily
running
hours
(Hr/Day)
Location of tube
well
Main/miniDTH Account
no.
Monthly
Energy
Consumption
(unit)
road boosting
28 15 Kalyan puri DTH 7.5H.p 2500 15SI-482 16
29 15 Kalyan puri DTH 5H.p 2000 16
30 15 Adarsh colony Mini 5H.p 1400 14
31 15 Adarsh colony Mini 5H.p 1800 16
32 15 Adarsh colony Mini 5H.p 2000 16
33 15 SGM nagar DTH 7.5H.p 2000 14
34 15 SGM nagar, C-
block
DTH 7.5H.p 2000 16
35 15 SGM nagar, C-
block
Mini 5H.p 1600 14
36 15 SGM nagar, C-
block
Mini 5H.p 1600 14
37 15 SGM nagar, C-
block
Mini 5H.p 2000 12
38 15 SGM nagar, C-
block
DTH 7.5H.p 2000 14
39 15 SGM nagar, E-block Mini 1.5H.p 1000 8
40 15 HN-3 Mini 1.5H.p 1000 8
41 15 C-block SGM nagar Mini 5H.p 1800 12
S.
No.
Ward
no.
Details of tube well Capacity
of tube
well
motor
pump
(hp)
Discharge
in
Gallon/hr
Energy meter details Average
daily
running
hours
(Hr/Day)
Location
of tube
well
Main/miniDTH Account
no.
Monthly
Energy
Consumption
(unit)
1 16 Raja
Chowk A
block
DTH 7.5H.p 2000 20
2 16 Band road
near
Disposal
DTH 7.5 H.p 2200 18
3 16 Band road
near
Bhatia
Hospital
DTH 7.5H.p 2000 18
4 16 Kutia wala
A block
DTH 7.5H.p 1500 16
5 16 A block 27’
road
DTH 5H.p 1400 16
6 16 Gali no-10 Mini 5H.p 1500 14
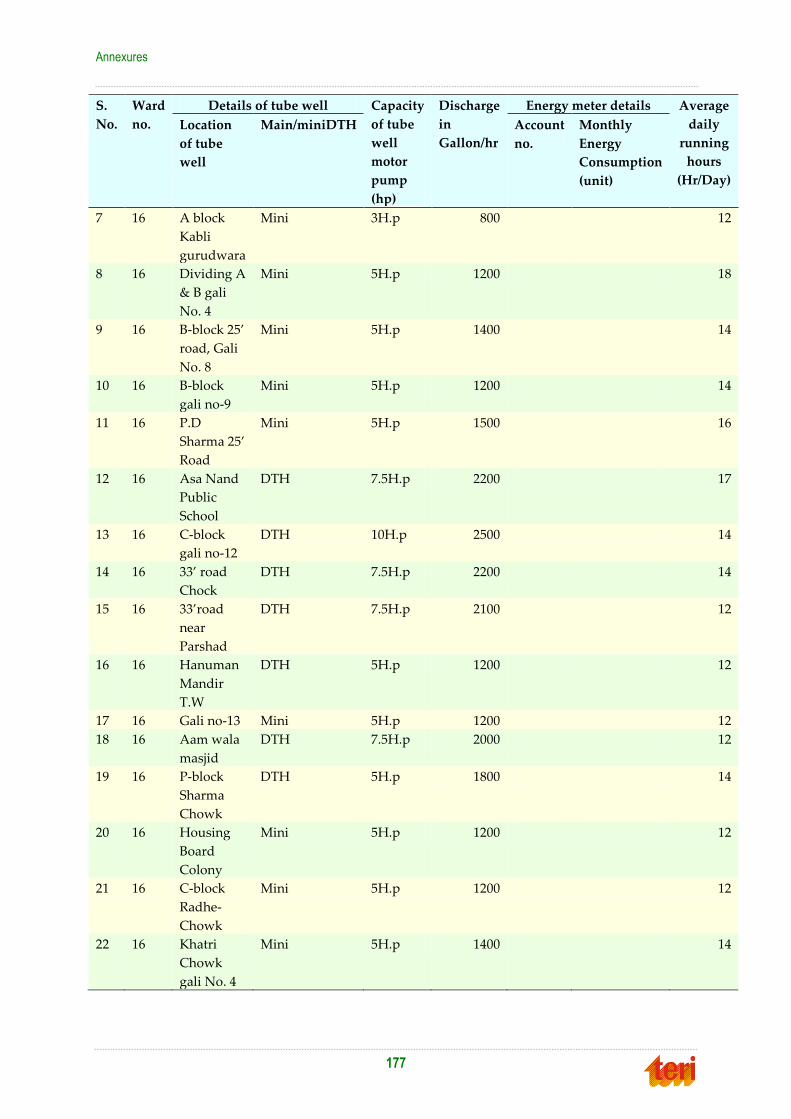
Annexures
177
S.
No.
Ward
no.
Details of tube well Capacity
of tube
well
motor
pump
(hp)
Discharge
in
Gallon/hr
Energy meter details Average
daily
running
hours
(Hr/Day)
Location
of tube
well
Main/miniDTH Account
no.
Monthly
Energy
Consumption
(unit)
7 16 A block
Kabli
gurudwara
Mini 3H.p 800 12
8 16 Dividing A
& B gali
No. 4
Mini 5H.p 1200 18
9 16 B-block 25’
road, Gali
No. 8
Mini 5H.p 1400 14
10 16 B-block
gali no-9
Mini 5H.p 1200 14
11 16 P.D
Sharma 25’
Road
Mini 5H.p 1500 16
12 16 Asa Nand
Public
School
DTH 7.5H.p 2200 17
13 16 C-block
gali no-12
DTH 10H.p 2500 14
14 16 33’ road
Chock
DTH 7.5H.p 2200 14
15 16 33’road
near
Parshad
DTH 7.5H.p 2100 12
16 16 Hanuman
Mandir
T.W
DTH 5H.p 1200 12
17 16 Gali no-13 Mini 5H.p 1200 12
18 16 Aam wala
masjid
DTH 7.5H.p 2000 12
19 16 P-block
Sharma
Chowk
DTH 5H.p 1800 14
20 16 Housing
Board
Colony
Mini 5H.p 1200 12
21 16 C-block
Radhe-
Chowk
Mini 5H.p 1200 12
22 16 Khatri
Chowk
gali No. 4
Mini 5H.p 1400 14

Master plan to develop Faridabad as a “Solar City”
178
S.
No.
Ward
no.
Details of tube well Capacity
of tube
well
motor
pump
(hp)
Discharge
in
Gallon/hr
Energy meter details Average
daily
running
hours
(Hr/Day)
Location
of tube
well
Main/miniDTH Account
no.
Monthly
Energy
Consumption
(unit)
23 16 Gali no-2
B-block
Mini 5H.p 1000 15
S.
No.
Ward
no.
Details of tube well Capacity
of tube
well
motor
pump
(hp)
Discharge
in
Gallon/hr
Energy meter details Average
daily
running
hours
(Hr/Day)
Location of tube well Main/ mini
DTH
Account
no.
Monthly
Energy
Consumption
(unit)
1 17 N/bagh 1st 12’’dia 15H.p
4000g/h
N5 PW
0018
Av=3000 16
2 17 N/bagh 2nd 12’’dia 10H.p
3500g/h
15LS-602 Av=5000 16
3 17 N/bagh 3rd 12’’dia 15H.p
4000g/h
15LS-602 Av=5000 16
4 17 Gandhi colony near police
station
12’’dia 15H.p
4000g/h
P 5 PW
0012
Av=2200 16
5 17 New colony vaternity
hospital
12’’dia 10H.p
3500g/h
N5 PW
0007
Av=5000 16
6 17 Gandhi colony nagar wala
T.W
12’’dia 10H.p
3500g/h
N5 PW
0023
Av=3000 16
7 17 Gandhi colony jeeva park
T.W
12’’dia 5H.p
1500g/h
12
8 17 Gandhi colony, Sani Dev
Mandir T.W
8’’dia 5H.p
1500g/h
N5 PW
0021
Av=3072 12
9 17 Gandhi colony ITI Park 8’’dia 5H.p
1500g/h
N5 PW
0009
Av=2470 12
10 17 Gandhi colony, Topi wala
doctor T.W
8’’dia 5H.p
1500g/h
12
11 17 Sant nagar, Ram bali wala
T.W
8’’dia 5H.p 1500g/h A/F 12
12 17 Sant nagar, Santi saroop
T.W
12’’dia 10H.p 3500g/h A/F 16
13 17 Mata devi Mandir T.W,
Gandhi Colony
4’’dia 2H.p 700g/h 8
14 17 Gandhi colony, Near S.P
Sharma Residence
4’’dia 1H.p 400g/h 8
15 17 Gandhi colony,
Nirajanwala T.W.
8’’dia 5H.p 1500g/h 12
16 17 New colony, Bua ka
mandir T.W
8’’dia 5H.p 1500g/h 12
17 17 Gandhi colony, Sagar auto 4’’dia 1H.p 400g/h 10

Annexures
179
S.
No.
Ward
no.
Details of tube well Capacity
of tube
well
motor
pump
(hp)
Discharge
in
Gallon/hr
Energy meter details Average
daily
running
hours
(Hr/Day)
Location of tube well Main/ mini
DTH
Account
no.
Monthly
Energy
Consumption
(unit)
wali gali
18 17 Sant nagar pir wala T.W 8’’dia 5H.p 1500g/h A/F 12
19 17 Munshi wala T.W sant
nagar
8’’dia 5H.p 1500g/h A/F 12
20 17 Crown plaza T.W 12’’dia 7.5H.p 2800g/h E.S.I-209 Av=5436 16
21 17 Kori colony sochalaya
near
4’’dia 1H.p 400g/h 8
22 17 Vivekanand Park, Sector
21B
REV 10 ISP-44 MMC
23 17 Sector 21B, Allahabad
Bank
REV 7.5 ISP-49 2642 AV
24 17 Sector 21B, Diva Park DTH 7.5 ASP-52 2145 Reading
25 17 Sector 21B, Near H.No.
204
REV 10 ISSI-735 3313 AV
26 17 Sector 21B, Reyan School REV 5 21MS-3 4200 Reading
27 17 Sector 21B Park REV 10 ISSI-730 MMC
28 17 Sector 21B, Near D Anand
House
REV 10 ISSI-738 2985 AV
29 17 Fatehpur, Near Subhas
House
REV 7.5 FSP-119 1341 AV
30 17 Fatehpur, Near Jayram
Nuberdar House
Mini 5 FSP-120 MMC
31 17 Fatehpu, Near Sura House Mini 5
32 17 Fatehpur, Near Devendar
House
Mini 5
33 17 Fatehpur, Aashmani
Mohalla
Mini 5
34 17 Fathepur, Near Bhuniya
Kua wala
Mini 5
35 17 Fatehpur, Harijan Chopal Mini 1.5
36 17 Fatehpur, Langda Ghon
Wala
Mini 1.5
37 17 I.G. Colony, Hanuman
Manadir
REV 7.5 FSP-121 MMC
38 17 I.G colony, Near Mangal
House
Mini 5 ISSI-736 MMC
39 17 Fathehpur, Babu STD DTH 10 21 MS-2 4200 Reading
40 17 Fatehpur , Chopal
(Bhediya Mohalla)
Mini 5 -
41 17 Sector 21B, Near House
No. 28
DTH 10 ISSI-739 3120 Reading
42 17 Park, Near Panchayat
Ghar
Revers+DTH 7.5
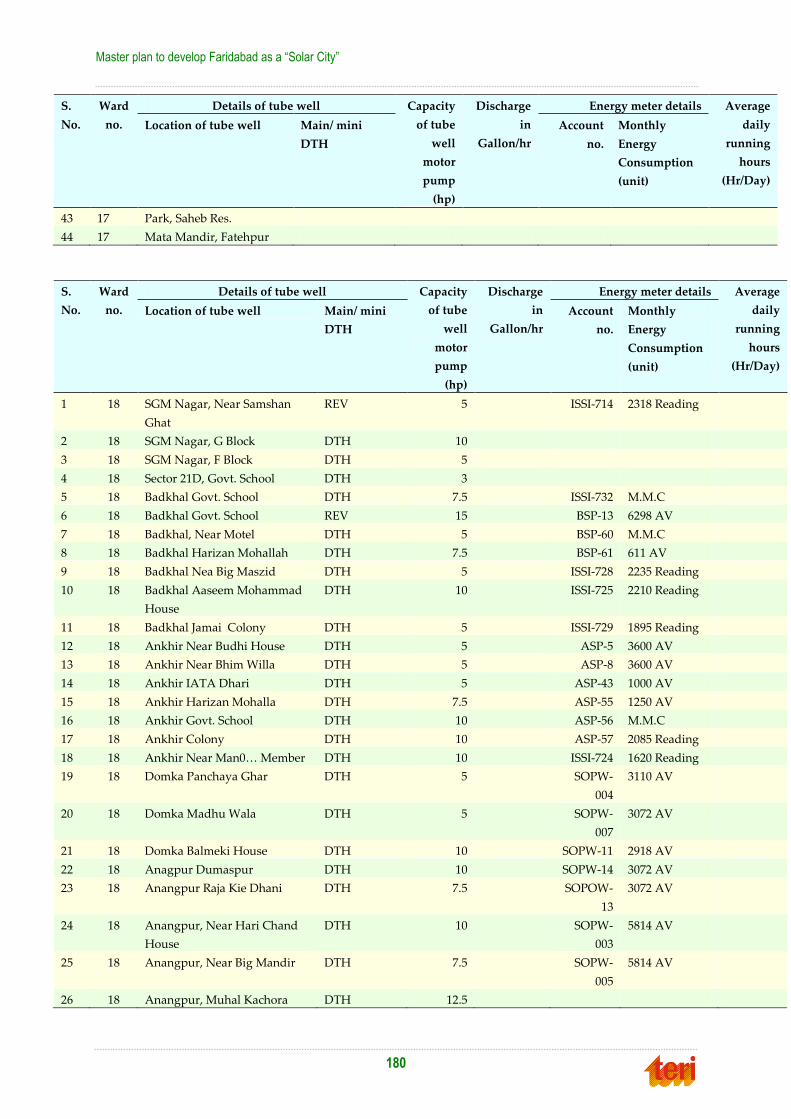
Master plan to develop Faridabad as a “Solar City”
180
S.
No.
Ward
no.
Details of tube well Capacity
of tube
well
motor
pump
(hp)
Discharge
in
Gallon/hr
Energy meter details Average
daily
running
hours
(Hr/Day)
Location of tube well Main/ mini
DTH
Account
no.
Monthly
Energy
Consumption
(unit)
43 17 Park, Saheb Res.
44 17 Mata Mandir, Fatehpur
S.
No.
Ward
no.
Details of tube well Capacity
of tube
well
motor
pump
(hp)
Discharge
in
Gallon/hr
Energy meter details Average
daily
running
hours
(Hr/Day)
Location of tube well Main/ mini
DTH
Account
no.
Monthly
Energy
Consumption
(unit)
1 18 SGM Nagar, Near Samshan
Ghat
REV 5 ISSI-714 2318 Reading
2 18 SGM Nagar, G Block DTH 10
3 18 SGM Nagar, F Block DTH 5
4 18 Sector 21D, Govt. School DTH 3
5 18 Badkhal Govt. School DTH 7.5 ISSI-732 M.M.C
6 18 Badkhal Govt. School REV 15 BSP-13 6298 AV
7 18 Badkhal, Near Motel DTH 5 BSP-60 M.M.C
8 18 Badkhal Harizan Mohallah DTH 7.5 BSP-61 611 AV
9 18 Badkhal Nea Big Maszid DTH 5 ISSI-728 2235 Reading
10 18 Badkhal Aaseem Mohammad
House
DTH 10 ISSI-725 2210 Reading
11 18 Badkhal Jamai Colony DTH 5 ISSI-729 1895 Reading
12 18 Ankhir Near Budhi House DTH 5 ASP-5 3600 AV
13 18 Ankhir Near Bhim Willa DTH 5 ASP-8 3600 AV
14 18 Ankhir IATA Dhari DTH 5 ASP-43 1000 AV
15 18 Ankhir Harizan Mohalla DTH 7.5 ASP-55 1250 AV
16 18 Ankhir Govt. School DTH 10 ASP-56 M.M.C
17 18 Ankhir Colony DTH 10 ASP-57 2085 Reading
18 18 Ankhir Near Man0… Member DTH 10 ISSI-724 1620 Reading
19 18 Domka Panchaya Ghar DTH 5 SOPW-
004
3110 AV
20 18 Domka Madhu Wala DTH 5 SOPW-
007
3072 AV
21 18 Domka Balmeki House DTH 10 SOPW-11 2918 AV
22 18 Anagpur Dumaspur DTH 10 SOPW-14 3072 AV
23 18 Anangpur Raja Kie Dhani DTH 7.5 SOPOW-
13
3072 AV
24 18 Anangpur, Near Hari Chand
House
DTH 10 SOPW-
003
5814 AV
25 18 Anangpur, Near Big Mandir DTH 7.5 SOPW-
005
5814 AV
26 18 Anangpur, Muhal Kachora DTH 12.5
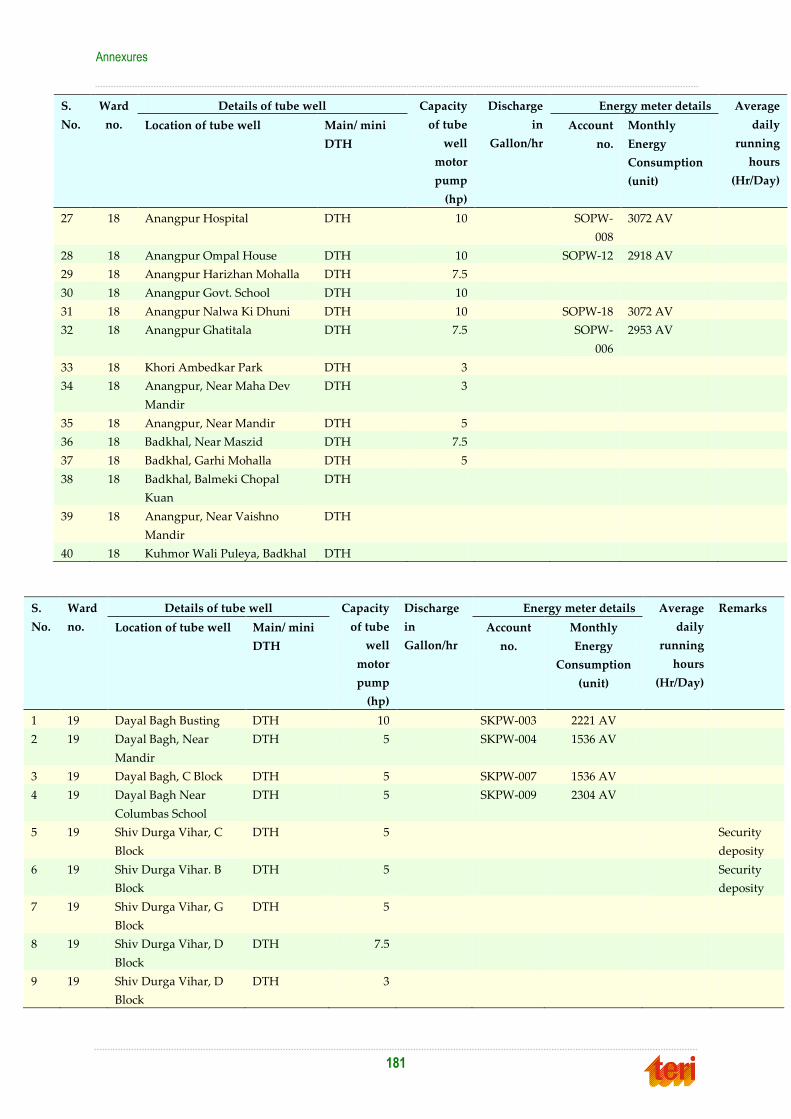
Annexures
181
S.
No.
Ward
no.
Details of tube well Capacity
of tube
well
motor
pump
(hp)
Discharge
in
Gallon/hr
Energy meter details Average
daily
running
hours
(Hr/Day)
Location of tube well Main/ mini
DTH
Account
no.
Monthly
Energy
Consumption
(unit)
27 18 Anangpur Hospital DTH 10 SOPW-
008
3072 AV
28 18 Anangpur Ompal House DTH 10 SOPW-12 2918 AV
29 18 Anangpur Harizhan Mohalla DTH 7.5
30 18 Anangpur Govt. School DTH 10
31 18 Anangpur Nalwa Ki Dhuni DTH 10 SOPW-18 3072 AV
32 18 Anangpur Ghatitala DTH 7.5 SOPW-
006
2953 AV
33 18 Khori Ambedkar Park DTH 3
34 18 Anangpur, Near Maha Dev
Mandir
DTH 3
35 18 Anangpur, Near Mandir DTH 5
36 18 Badkhal, Near Maszid DTH 7.5
37 18 Badkhal, Garhi Mohalla DTH 5
38 18 Badkhal, Balmeki Chopal
Kuan
DTH
39 18 Anangpur, Near Vaishno
Mandir
DTH
40 18 Kuhmor Wali Puleya, Badkhal DTH
S.
No.
Ward
no.
Details of tube well Capacity
of tube
well
motor
pump
(hp)
Discharge
in
Gallon/hr
Energy meter details Average
daily
running
hours
(Hr/Day)
Remarks
Location of tube well Main/ mini
DTH
Account
no.
Monthly
Energy
Consumption
(unit)
1 19 Dayal Bagh Busting DTH 10 SKPW-003 2221 AV
2 19 Dayal Bagh, Near
Mandir
DTH 5 SKPW-004 1536 AV
3 19 Dayal Bagh, C Block DTH 5 SKPW-007 1536 AV
4 19 Dayal Bagh Near
Columbas School
DTH 5 SKPW-009 2304 AV
5 19 Shiv Durga Vihar, C
Block
DTH 5 Security
deposity
6 19 Shiv Durga Vihar. B
Block
DTH 5 Security
deposity
7 19 Shiv Durga Vihar, G
Block
DTH 5
8 19 Shiv Durga Vihar, D
Block
DTH 7.5
9 19 Shiv Durga Vihar, D
Block
DTH 3

Master plan to develop Faridabad as a “Solar City”
182
S.
No.
Ward
no.
Details of tube well Capacity
of tube
well
motor
pump
(hp)
Discharge
in
Gallon/hr
Energy meter details Average
daily
running
hours
(Hr/Day)
Remarks
Location of tube well Main/ mini
DTH
Account
no.
Monthly
Energy
Consumption
(unit)
10 19 Shiv Durga Vihar, F
Block
DTH 1.5
11 19 Shiv Durga Vihar, A
Block
DTH 5
12 19 Shiv Durga Vihar, E
Block
DTH 3 Security
deposit
13 19 Shiv Durga Vihar, E
Block
DTH 3 Security
deposit
14 19 Sharda Nand Basti DTH 5 SKPW-006 3072 AV
15 19 Dayal Nagar,
Ambedkar Park
DTH 7.5 SOPW-001 2300 AV
16 19 Dayal Nagar, TW 2
Gajji
DTH 5 SOPW-002 1536 AV
17 19 Dayala Nagar, Dayalu
Baba Mandir
DTH 5 SOPW-
0010
2934 AV
18 19 Dayal Nagar, Dube
Wala
DTH 7.5 SOPW-
0015
1536 AV
19 19 Dayal Nagar,
Ambedkar Park
DTH 5 SOPW-
0017
1536 AV
20 19 Dayal Nagar, Govt.
School
DTH 5 Meter
installed
21 19 Sector 27A, Railway
Line
DTH 5 Meter
installed
22 19 M M Pur, Big
mMandir
DTH 5 4SP33 4608 AV
23 19 M M Pur, Ravi Wala REV 5 ASP-53 6695 Reading
24 19 M M Pur, Govt. School DTH 10 ISSI-726 2273 Reading
25 19 M M Pur, Near Pond DTH 5 ISSI-727 2385 Reading
26 19 M M Pur, Near Govt.
School
DTH 5 ISSI-731 MMC
27 19 M M Puri, Harizan
Mohalla
Mini 5 4SP-24 Agains
T.Wall
28 19 M M Pur, Near
Surendar Chaprana
Mini 2 Security
deposit
29 19 Friends Colony REV 5 Security
deposit
30 19 Friends Colony, Near
Bhola House
REV 5 Security
deposit
31 19 Friends Colony, Near
Kashana House
Mini 2 Security
deposit
32 19 Sector 21A Disposal -- 30 ISP-25 1839 AV
33 19 Sector 21A, H.N. 97
Park
REV 7.5 ASP-54 3840 AV

Annexures
183
S.
No.
Ward
no.
Details of tube well Capacity
of tube
well
motor
pump
(hp)
Discharge
in
Gallon/hr
Energy meter details Average
daily
running
hours
(Hr/Day)
Remarks
Location of tube well Main/ mini
DTH
Account
no.
Monthly
Energy
Consumption
(unit)
34 19 Sector 21, Green Belt REV 10 4SP-42 MMC
35 19 Sector 21, Green Belt REV 10 ISP-53 MMC
36 19 Sector 21A, Mishra
Park
REV 10 ASP-51 2210 Reading
37 19 Sector 21A, Mishra
Park
DTH 5 ISSI-733 1390 Reading
38 19 Sector 21A,
Community Centre
DTH 10 ISP-50 2295 Reading
39 19 Sector 21A,
Community Centre
DTH 10 ISP-51 MMC
40 19 Sector 21A,
Community Centre
DTH 10 ISP-52 MMC
41 19 Sector 21A,
Community Centre
DTH 7.5 Security
deposit
42 19 Sector 21A, H.N. 519 REV 15 Security
deposit
43 19 Sector 21C, C P Office DTH 10 Security
deposit
44 19 Sector 21C, Kapil
Vihar
DTH 5 ISSI-734 2588 Reading
45 19 Deshraj Colony, Catan
Pahari
DTH 2
46 19 Lakkarpur, Govt.
School
DTH 7.5 SKPW-001 5814 AV
47 19 Lakarpur, Near
Express Hotel
DTH 5 SKPW-002 2926 AV
48 19 Lakkarpur Dispensary DTH 5 EGPW-001 2934 AV
49 19 Lakkarpur, Near
Guhar House
DTH 5 SKPW-008 2304 AV
50 19 Lakkarpur, Shanidev
Mandrir
DTH 1.5 SKPW-005 1494 AV
51 19 Lakkarpur, Taj Express DTH 10 SKPW-
0010
1536 AV
52 19 Lakkarpur, Near Phool
Singh House
DTH 5 SKPW-
0011
1536 AV
53 19 Dayal Nagar, Near
Masjed
DTH 3 Seurity
deposit
54 19 Shiv Durga Vihar, E
Block
DTH 3 Seurity
deposit
55 19 Shiv Durga Vihar, D
Block
DTH 3 Seurity
deposit
56 19 Ekta Nagar, Near
Budiya Nala
DTH Seurity
deposit

Master plan to develop Faridabad as a “Solar City”
184
S.
No.
Ward
no.
Details of tube well Capacity
of tube
well
motor
pump
(hp)
Discharge
in
Gallon/hr
Energy meter details Average
daily
running
hours
(Hr/Day)
Remarks
Location of tube well Main/ mini
DTH
Account
no.
Monthly
Energy
Consumption
(unit)
57 19 Dhruva Dera DTH Seurity
deposit
58 19 Shiv Durga Vihar, C
Block
DTH 3
59 19 Mathruseva DTH Seurity
deposit
60 19 Jaswant Park Seurity
deposit
Sr.
No.
Ward
No.
Details of tubewell Capacity
of
tubewell
motor
pump(hp)
Discharge
in
Gallon/hr
Energy meter Details Average
Dauly
Running
Hours
(Hr/Day)
Remarks
Location of
tubewell
near
Tubewell
No.
Main/mini
tubewell
Account
No.
Monthly
Energy
Consumption
(unit)
Hour
1 20 211/37 1/37 Main 15 4000 AFPW-04 4880 16:00
2 20 1291/37 2/37 Main 15 6000 AFPW-05 4370 16:00
3 20 170/37 3/37 Main 20 7000 37PW-4 5975 16:00
4 20 1295/37 6/37 Main 10 5000 37PW-6 7294 16:00
5 20 1348/37 7/37 Main 20 7000 37PW-8 7294 16:00
6 20 865/37 8/37 Main 15 6000 AFPW-13 5957 16:00
7 20 535/37 9/37 Main 5 4000 37PW-13 6144 16:00
8 20 1247/37 10/37 Main 15 6000 37PW-15 4608 16:00
9 20 1257/37 11/37 Main New T.W. Board Not stated
10 20 1182/37 12/37 Main New T.W. Board Not stated
11 20 1190/37 2/A.D. Main 7.5 3500 STPW-2 3056 16:00 SECURITY
APPLIED
12 20 1230/37 3/A.D. Main 20 7000 STPW-1 3006 16:00 SECURITY
APPLIED
13 20 1220/37 4/A.D. Main 5 3500 37PW-12 3072 16:00
14 20 G. School 5/A.D. Main 10 New T.W. Board
15 20 1240/37 6/A.D. Main 15 New T.W. Board
16 20 Satbiz Park 1/Sarai Main 20 6000 37PW-7 7294 16:00
17 20 Lalla
Chowk
2/Sarai Main 20 6000 AFPW-12 5957 16:00
18 20 Satbiz Park 3/Sarai Main 15 5000 AFPQ-16 4608 16:00
19 20 Huda DIS 4/Sarai Main 10 6000 DISPOSAL CAMPUS 16:00
20 20 School Z.
Mkt
5/Sarai Main 15 New T.W. Board SECURITY
APPLIED

Annexures
185
Sr.
No.
Ward
No.
Details of tubewell Capacity
of
tubewell
motor
pump(hp)
Discharge
in
Gallon/hr
Energy meter Details Average
Dauly
Running
Hours
(Hr/Day)
Remarks
Location of
tubewell
near
Tubewell
No.
Main/mini
tubewell
Account
No.
Monthly
Energy
Consumption
(unit)
Hour
21 20 Mata wali
Johad
6/Sarai Mini New T.W. Board Not stated
22 20 Subhash
Nagar
1/S. Nagar Mini 5 3500 LMPW-2 6144 16:00
23 20 A-59/AEII 5/AEII Main 20 6000 AFPW-9 7294 16:00
24 20 C-14/AEII 6/AEII Main 10 5000 AFPW-8 7294 16:00
25 20 B107/AEII 8/AEII Main 20 6000 37PW-10 6134 16:00
26 20 A-82/AEII 9/AEII Main 10 5000 37PW-9 6134 16:00
27 20 16/AE(M) 10/AE(M) Main 10 4000 AFPW-11 6100 16:00
28 20 Geeta
Bhanu AEII
11/AEII Main 7.5 4000 37PW-14 4608 16:00
29 20 New
Sulabh
Sochalya
12/AE(M) Main 10 4000 AFPW-14 3072 16:00
30 20 C-68/AEII 13/AEII Main 20 New T.W. Board SECURITY
APPLIED
31 20 250/AE(M) 14/AE(M) Main 7.5 New T.W. Board SECURITY
APPLIED
32 20 Near Loliz
chooki
Palla
1/Palla Main 20 5000 TPPW-3 6912 16:00
33 20 OHSR 1/AEIII Main 10 4000 AS31-28 4350 16:00
34 20 212/AEIII 2/AEIII Main 10 4000 16:00
35 20 550/AEIII 3/AEIII Main 10 4000 16:00
36 20 130/AEIII 4/AEIII Main 5 3500 16:00
37 20 GREEN
BELT
5/AEIII Main 15 7000 16:00
38 20 10/AEIII 6/AEIII Main 10 New T.W. Board SECURITY
APPLIED
39 20 368/AEIII 7/AEIII Main 15 New T.W. Board SECURITY
APPLIED
40 20 26/AEIII 8/AEIII Main 15 New T.W. Board SECURITY
APPLIED

Master plan to develop Faridabad as a “Solar City”
186
Sr.
No.
Ward
No.
Details of tubewell Capacity
of
tubewell
motor
pump(hp)
Discharge
in
Gallon/hr
Energy meter Details Average
Dauly
Running
Hours
(Hr/Day)
Remarks
Location
of
tubewell
near
Tubewell
No.
Main/mini
tubewell
Account
No.
Monthly
Energy
Consumption
(unit)
Hour
1 21 Near
HNo. 79
SN Ist
1 Main 20 H.P. 7000 PAPW-1 7292 16:00
2 21 Near
HNo.32
SN IInd
2 Main 15 H.P. 6000 PAPW-2 7292 16:00
3 21 Near
HNo.540
SN IInd
3 Main _ - - - SECURITY
APPLIED
4 21 SN IInd
Near
HNo. 662
4 Main _ - - - -
5 21 Near
Mandir
Sehtpur
1/Sehatpur Main 10 H.P. 5000 PAPW-3 6789 16:00
6 21 Near 1/S
Nagar Ist
2/Sehtpur Main 10 H.P. 5000 - - -
7 21 Agwanpur 1 Main 15 H.P. 6000 PAPW-4 5967 16:00
8 21 Ismilpur 1 Main 7.5 H.P. 4000 PAPW-5 6144 16:00
9 21 Basantpur 1 Main - - - -
10 21 Panchsil
Colony
(MP LAD)
1 Main 7.5 H.P. 4000 - - - SECURITY
APPLIED
11 21 Near
Bandh
Sehtpur
(MP LAD)
1 Main 7.5 H.P. 4000 - - - SECURITY
APPLIED
Sr.
No.
Ward
No.
Details of tubewell Capacity
of
tubewell
motor
pump(hp)
Discharge
in
Gallon/hr
Energy meter Details Average
Dauly
Running
Hours
(Hr/Day)
Location of
tubewell
near
Tubewell
No.
Main/mini
tubewell
Account No. Monthly
Energy
Consumption
(unit)
Hour
1 22 127/28 1 Main 15 H.P. 5000 LTR 28PW 0003 4320 16:00
2 22 266/28 2 Main 10 H.P. 4000 LTR 28PW 0004 6840 16:00
3 22 807/28 3 Main 15 H.P. 5000 LTR - - 16:00

Annexures
187
Sr.
No.
Ward
No.
Details of tubewell Capacity
of
tubewell
motor
pump(hp)
Discharge
in
Gallon/hr
Energy meter Details Average
Dauly
Running
Hours
(Hr/Day)
Location of
tubewell
near
Tubewell
No.
Main/mini
tubewell
Account No. Monthly
Energy
Consumption
(unit)
Hour
4 22 1513/28 4 Main 15 H.P. 5000 LTR 28PW 0011 6840 16:00
5 22 Community
Centre
6 Main 15 H.P. 5000 LTR 28PW 0016 4297 16:00
6 22 1707/28 10 Main 10 H.P. 4000 LTR 28PW 0018 2636 16:00
7 22 634/28 11 Main 15 H.P. 5000 LTR 28PW 0017 5400 16:00
8 22 2296 12 Main 20 H.P. 6000 LTR PW12 0035 3189 16:00
9 22 Mother
Dairy
13 Main 15 H.P. 5000 LTR PW12 0039 4608 16:00
10 22 385/28 15/28 Main 10 H.P. 4000 LTR PW12 0031 4608 16:00
11 22 688/28 16 Main 15 H.P. 5000 LTR PW12 0032 5760 16:00
12 22 156/28 17 Main 15 H.P. 5000 LTR - - 16:00
13 22 2041/28 18 Main 15 H.P. 5000 LTR - - 16:00
14 22 464/28 19 Main 15 H.P. 5000 LTR - - 16:00
15 22 1607/28 20 Main 15 H.P. 5000 LTR - - 16:00
16 22 2085/28 21 Main 15 H.P. 5000 LTR - - 16:00
17 22 2082 22 Main 15 H.P. 5000 LTR - - 16:00
18 22 Fair Street
Sec 31
1 Main 15 H.P. 5000 LTR - - 16:00
19 22 S F Colony
1/19
1 Main 5 H.P. 1000 LTR 28PW 0095 1024 16:00
20 22 S F Colony
6/16
2 Main 15 H.P. 5000 LTR ESPW 0002 5210 16:00
21 22 Community
Centre
3 Main 15 H.P. 5000 LTR - - 16:00
22 22 Bangal
Suiting
4 Main 15 H.P. 5000 LTR - - 16:00
23 22 S F Colony 5 Main 10 H.P. 4000 LTR - - 16:00
24 22 Police
Chowki Park
DLF
1 Mini 5 H.P. 1500 LTR - - 16:00
25 22 DLF Busting 2 Mini 5 H.P. 1500 LTR - - 16:00
26 22 DLF Rajib
Nagar
4 Mini 10 H.P. 4000 LTR DFPW 0003 4838 16:00
27 22 DLF Santosh
Nagar
5 Main 20 H.P. 8000 LTR ESPW 0003 4796 16:00
28 22 DLF N/A 6 Main 15 H.P. 5000 LTR DFPW 0004 4608 16:00
29 22 Power
House
7 Main 5 H.P. 2000 LTR DFPW 0005 4477 16:00
30 22 DLF Rajib
Nagar
8 Main 10 H.P. 4000 LTR - - 16:00
31 22 Santosh
Nargar DLF
9 Main 15 H.P. 5000 LTR - - 16:00

Master plan to develop Faridabad as a “Solar City”
188
Sr.
No.
Ward
No.
Details of tubewell Capacity
of
tubewell
motor
pump(hp)
Discharge
in
Gallon/hr
Energy meter Details Average
Dauly
Running
Hours
(Hr/Day)
Location of
tubewell
near
Tubewell
No.
Main/mini
tubewell
Account No. Monthly
Energy
Consumption
(unit)
Hour
32 22 Santosh
Nargar DLF
10 Mini 5 H.P. 1500 LTR - - 16:00
33 22 Ashok I
Main Park
Water Tank
1 Main 15 H.P. 5000 LTR - - 16:00
34 22 Ashok I 2 Main 15 H.P. 5000 LTR - - 16:00
35 22 Ashok 280 7 Main 5 H.P. 300 LTR - - 16:00
36 22 Ashok 90 9 Main 15 H.P. 5000 LTR - - 16:00
37 22 Ashok I H.
No 262
12 Main 15 H.P. 5000 LTR - - 16:00
38 22 Palla Colony
Power
House
1 Main 15 H.P. 5000 LTR - - 16:00
39 22 Pusik Nagar
Sulabh
Sochalaya
Mini 2 H.P. 200 LTR BB21 208 Reading 16:00
40 22 Santos Nagar Mini 2 H.P. 200 LTR BB21 218 Reading 16:00
Sr.
No.
Ward
No.
Details of tubewell Capacity
of
tubewell
motor
pump(hp)
Discharge
in
Gallon/hr
Energy meter Details Average
Dauly
Running
Hours
(Hr/Day)
Location of
tubewell
near
Tubewell
No.
Main/mini
tubewell
Account No. Monthly
Energy
Consumption
(unit)
Hour
1 23 5-0-5 By Pass 3/29 Main 15 H.P. 5000 28PW 0007 6840 16:00
2 23 H.No 1578 6/29 Main 15 H.P. 5000 28PW 00015 5760 16:00
3 23 H.No 55 7/29 Main 10 H.P. 4000 PW12 0091 M.U 16:00
4 23 606/29 8/29 Main 15 H.P. 5000 19PW 0008 3221 16:00
5 23 26/29 9/29 Main 15 H.P. 5000 PW12 0097 584 16:00
6 23 326/29 10/29 Main 15 H.P. 5000 - - 16:00
7 23 786/29 11/29 Main 15 H.P. 5000 PW12 0030 5184 16:00
8 23 H.No 1575 12/29 Main 15 H.P. 5000 - - 16:00
9 23 Etmadpor 1 Main 15 H.P. 5000 28PW 0001 5760 16:00
10 23 Palla Vill 2 Main 15 H.P. 5000 - - 16:00
11 23 Palla Vill 3 Main 15 H.P. 5000 - - -
12 23 Vill Mawai 1 Main 15 H.P. 5000 PKPW 0001 3600 16:00

Annexures
189
Sr.
No.
Ward
No.
Details of tubewell Capacity
of
tubewell
motor
pump(hp)
Discharge
in
Gallon/hr
Energy meter Details Average
Dauly
Running
Hours
(Hr/Day)
Location of
tubewell
near
Tubewell
No.
Main/mini
tubewell
Account No. Monthly
Energy
Consumption
(unit)
Hour
13 23 Vill Mawai 2 Main 15 H.P. 5000 PKPW 0002 2600 16:00
14 23 Vill Mawai 3 Main 15 H.P. 5000 PKPW 0004 1238 16:00
15 23 Shamshaan
Ghat
1 Mini 3 H.P. 600 - - 2:00
16 23 Mawai
Shamshaan
Ghat
2 Mini 5 H.P. 1000 - - 2:00
17 23 Bajirpur Vill 1 Main 15 H.P. 5000 ICPW 0004 3600 16:00
18 23 Badosapur
STP Plant
1 Main 20 H.P. 8000 2LS 4 Reading 16:00
19 23 Badosapur
STP Plant
2 Main 20 H.P. 8000 2LS 4 Reading 16:00
20 23 Badosapur
STP Plant
3 Main 20 H.P. 8000 2LS 4 Reading 16:00
21 23 Badosapur
STP Plant
4 Main 20 H.P. 8000 2LS 4 Reading 16:00
22 23 Badosapur
STP Plant
5 Main 20 H.P. 8000 2LS 4 Reading 16:00
23 23 DipoJat Sec
29
1 - - - 2LS 231 Reading -
Sr.
No.
Ward
No.
Details of tubewell Capacity
of
tubewell
motor
pump(hp)
Discharge
in
Gallon/hr
Energy meter Details Average
Dauly
Running
Hours
(Hr/Day)
Remarks
Location
of
tubewell
near
Tubewell
No.
Main/mini
tubewell
Account
No.
Monthly
Energy
Consumption
(unit)
Hour
1 24 Sec-19 5 Main 15 4000 ESI-179
A
5760 18
2 24 Sec-19 7 Main 15 4000 ESI-199 6840 18
3 24 Near
H.No.
763/19
Main 15 5000 ESI-211 5760 18
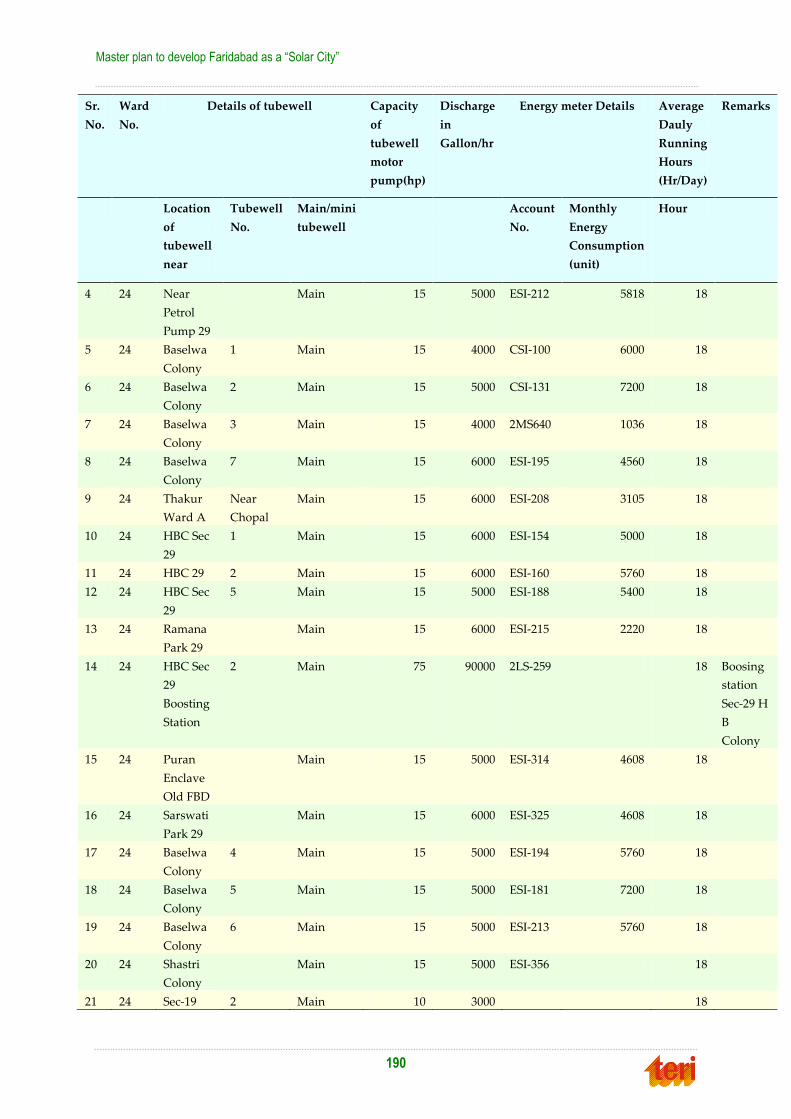
Master plan to develop Faridabad as a “Solar City”
190
Sr.
No.
Ward
No.
Details of tubewell Capacity
of
tubewell
motor
pump(hp)
Discharge
in
Gallon/hr
Energy meter Details Average
Dauly
Running
Hours
(Hr/Day)
Remarks
Location
of
tubewell
near
Tubewell
No.
Main/mini
tubewell
Account
No.
Monthly
Energy
Consumption
(unit)
Hour
4 24 Near
Petrol
Pump 29
Main 15 5000 ESI-212 5818 18
5 24 Baselwa
Colony
1 Main 15 4000 CSI-100 6000 18
6 24 Baselwa
Colony
2 Main 15 5000 CSI-131 7200 18
7 24 Baselwa
Colony
3 Main 15 4000 2MS640 1036 18
8 24 Baselwa
Colony
7 Main 15 6000 ESI-195 4560 18
9 24 Thakur
Ward A
Near
Chopal
Main 15 6000 ESI-208 3105 18
10 24 HBC Sec
29
1 Main 15 6000 ESI-154 5000 18
11 24 HBC 29 2 Main 15 6000 ESI-160 5760 18
12 24 HBC Sec
29
5 Main 15 5000 ESI-188 5400 18
13 24 Ramana
Park 29
Main 15 6000 ESI-215 2220 18
14 24 HBC Sec
29
Boosting
Station
2 Main 75 90000 2LS-259 18 Boosing
station
Sec-29 H
B
Colony
15 24 Puran
Enclave
Old FBD
Main 15 5000 ESI-314 4608 18
16 24 Sarswati
Park 29
Main 15 6000 ESI-325 4608 18
17 24 Baselwa
Colony
4 Main 15 5000 ESI-194 5760 18
18 24 Baselwa
Colony
5 Main 15 5000 ESI-181 7200 18
19 24 Baselwa
Colony
6 Main 15 5000 ESI-213 5760 18
20 24 Shastri
Colony
Main 15 5000 ESI-356 18
21 24 Sec-19 2 Main 10 3000 18
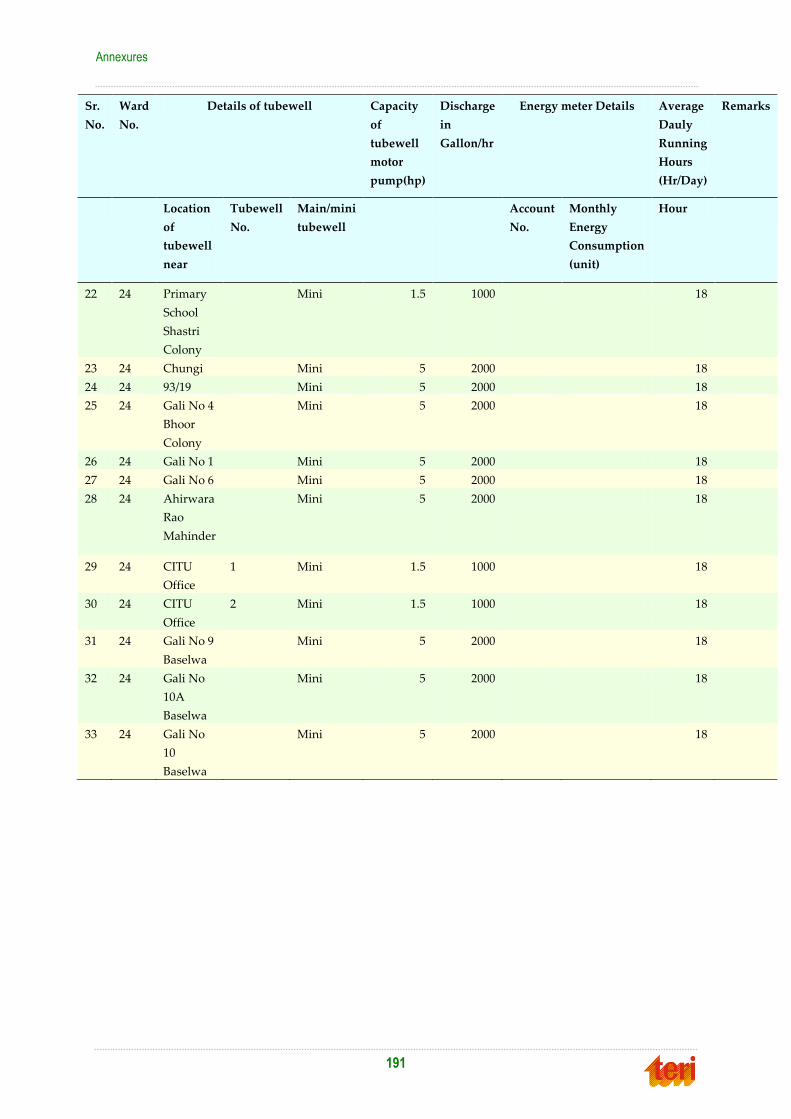
Annexures
191
Sr.
No.
Ward
No.
Details of tubewell Capacity
of
tubewell
motor
pump(hp)
Discharge
in
Gallon/hr
Energy meter Details Average
Dauly
Running
Hours
(Hr/Day)
Remarks
Location
of
tubewell
near
Tubewell
No.
Main/mini
tubewell
Account
No.
Monthly
Energy
Consumption
(unit)
Hour
22 24 Primary
School
Shastri
Colony
Mini 1.5 1000 18
23 24 Chungi Mini 5 2000 18
24 24 93/19 Mini 5 2000 18
25 24 Gali No 4
Bhoor
Colony
Mini 5 2000 18
26 24 Gali No 1 Mini 5 2000 18
27 24 Gali No 6 Mini 5 2000 18
28 24 Ahirwara
Rao
Mahinder
Mini 5 2000 18
29 24 CITU
Office
1 Mini 1.5 1000 18
30 24 CITU
Office
2 Mini 1.5 1000 18
31 24 Gali No 9
Baselwa
Mini 5 2000 18
32 24 Gali No
10A
Baselwa
Mini 5 2000 18
33 24 Gali No
10
Baselwa
Mini 5 2000 18
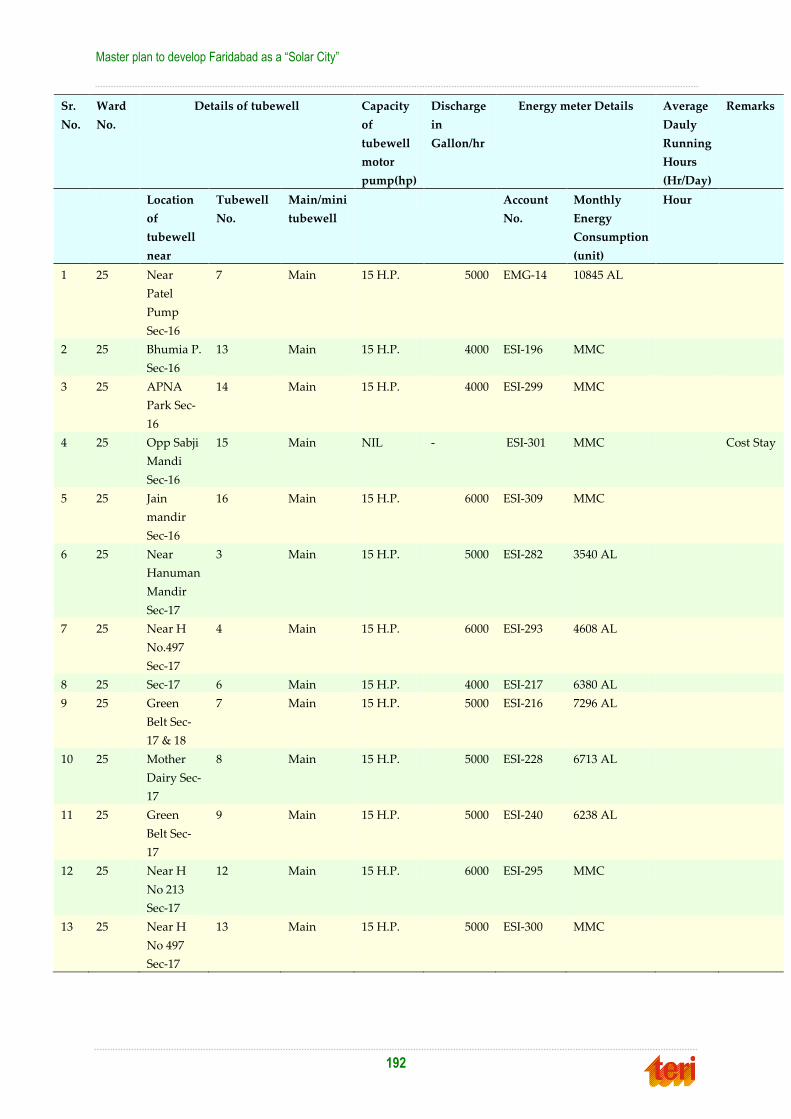
Master plan to develop Faridabad as a “Solar City”
192
Sr.
No.
Ward
No.
Details of tubewell Capacity
of
tubewell
motor
pump(hp)
Discharge
in
Gallon/hr
Energy meter Details Average
Dauly
Running
Hours
(Hr/Day)
Remarks
Location
of
tubewell
near
Tubewell
No.
Main/mini
tubewell
Account
No.
Monthly
Energy
Consumption
(unit)
Hour
1 25 Near
Patel
Pump
Sec-16
7 Main 15 H.P. 5000 EMG-14 10845 AL
2 25 Bhumia P.
Sec-16
13 Main 15 H.P. 4000 ESI-196 MMC
3 25 APNA
Park Sec-
16
14 Main 15 H.P. 4000 ESI-299 MMC
4 25 Opp Sabji
Mandi
Sec-16
15 Main NIL - ESI-301 MMC Cost Stay
5 25 Jain
mandir
Sec-16
16 Main 15 H.P. 6000 ESI-309 MMC
6 25 Near
Hanuman
Mandir
Sec-17
3 Main 15 H.P. 5000 ESI-282 3540 AL
7 25 Near H
No.497
Sec-17
4 Main 15 H.P. 6000 ESI-293 4608 AL
8 25 Sec-17 6 Main 15 H.P. 4000 ESI-217 6380 AL
9 25 Green
Belt Sec-
17 & 18
7 Main 15 H.P. 5000 ESI-216 7296 AL
10 25 Mother
Dairy Sec-
17
8 Main 15 H.P. 5000 ESI-228 6713 AL
11 25 Green
Belt Sec-
17
9 Main 15 H.P. 5000 ESI-240 6238 AL
12 25 Near H
No 213
Sec-17
12 Main 15 H.P. 6000 ESI-295 MMC
13 25 Near H
No 497
Sec-17
13 Main 15 H.P. 5000 ESI-300 MMC

Annexures
193
Sr.
No.
Ward
No.
Details of tubewell Capacity
of
tubewell
motor
pump(hp)
Discharge
in
Gallon/hr
Energy meter Details Average
Dauly
Running
Hours
(Hr/Day)
Location of
tubewell
near
Tubewell
No.
Main/mini
tubewell
Account No. Monthly
Energy
Consumption
(unit)
Hour
1 25 W Balmaki Park 1 Main 10 H.P. 3000 ESI-125 3425 AL
2 25 W Balmaki Park 2 Main 15 H.P. 5000 ESI-201 5000 AL
3 25 W Old Office ddFBD Main 15 H.P. 3000 2MS641 9720 AL
4 25 W Near ITI Sec-
18A
Main 15 H.P. 4000 ESI-186 6840 AL
5 25 W Farida Park 1 Main 10 H.P. 3000 ESI-207 6800 AL
6 25 W Barahi Talab 2 Main 10 H.P. 3000 ESI-187 6840 AL
7 25 W Barahi Talab 3 Main 5 H.P. 5000 ESI-202 5760 AL
8 25 W Old OCTROI Main 5 H.P. 2000 ESI-101 6000 AL
9 25 W Waterworks
Sec 28
1 Main 10 H.P. 3000 BSI-35 1037 AL
10 25 W Waterworks
Sec 28
2 Main 15 H.P. 5000 BSI-68 5040 AL
11 25 W Khadi Road
Old FBD
2 Main 15 H.P. 5000 ESI-315 4608 AL
12 25 W Gandi
Colony
Boostinn Main 20 H.P. ESI-316 5184 AL
Sr.
No.
Ward
No.
Details of tubewell Capacity
of
tubewell
motor
pump(hp)
Discharge
in
Gallon/hr
Energy meter Details Average
Dauly
Running
Hours
(Hr/Day)
Location of
tubewell
near
Tubewell
No.
Main/mini
tubewell
Account No. Monthly
Energy
Consumption
(unit)
Hour
1 26 Water work 1/16 Main 10 H.P. 550 LPM ESI 29 6421 AL 10 HR
2 26 Water work 2/16 Main 20 H.P. 450 LPM ESI 281 4189 AL 10 HR
3 26 Z Park 3/16 Main 7.5 H.P. 500 LPM ESI 48 6422 AL 10 HR
4 26 Near Yadve 5/16 Main 10 H.P. 550 LPM ESI 158 7008 AL 10 HR
5 26 Dharmsala
Near
H.N/116
8/16 Main 15 H.P. 500 LPM EMG 15 12050 AL 10 HR

Master plan to develop Faridabad as a “Solar City”
194
Sr.
No.
Ward
No.
Details of tubewell Capacity
of
tubewell
motor
pump(hp)
Discharge
in
Gallon/hr
Energy meter Details Average
Dauly
Running
Hours
(Hr/Day)
Location of
tubewell
near
Tubewell
No.
Main/mini
tubewell
Account No. Monthly
Energy
Consumption
(unit)
Hour
6 26 H.1333 Z
Park
9/16 Main 10 H.P. 250 LPM ESI 225 6761 AL 10 HR
7 26 Green belt
(9 Park)
10/16 Main 10 H.P. 500 LPM ESI 238 6761 AL 10 HR
8 26 Near
Hanuman
Mandir Z
Park
11/16 Main 20 H.P. 500 LPM ESI 279 MMC 10 HR
9 26 Opp. Green
Chanal
12/16 Main 20 H.P. 300 LPM ESI 280 MMC 10 HR
10 26 Near H.N.
865/16
17/16 Main 15 H.P. 500 LPM ESI 313 MMC 10 HR
11 26 12/19 Main 12 H.P. 450 LPM ESI 312 10 HR
12 26 Near H.N.
611/19
10/19 Main 15 H.P. 450 LPM ESI 225 NIL 10 HR
13 26 Bazahi 4 Main 10 H.P. 300 LPM ESI 313 NIL 10 HR
14 26 653/19 15/19 Main 15 H.P. 400 LPM ESI 319 4800 AL 10 HR
15 26 1281/19 13/19 Main 10 H.P. 300 LPM ESI 317 4608 AL 10 HR
16 26 466/19 14/19 Main 10 H.P. 300 LPM ESI 318 5700 AL 10 HR
17 26 Friends
Colony
Main 15 H.P. 300 LPM ESI 323 5184 AL 10 HR
Sr.
No.
Ward
No.
Details of tubewell Capacity
of
tubewell
motor
pump(hp)
Discharge
in
Gallon/hr
Energy meter Details Average
Dauly
Running
Hours
(Hr/Day)
Location
of
tubewell
near
Tubewell
No.
Main/mini
tubewell
Account No. Monthly
Energy
Consumption
(unit)
Hour
1 26 Near H.N.
485/19
1/19 Main - 350LPM ESI 205 6840 AL 10 HR
2 26 Near D.P
She
3/19 Main 15 H.P. 350LPM 2MS 221 9600 AL 10 HR
3 26 Near
325/19
4/19 Main 10 H.P. 200 LPM CS 149 7410 AL 10 HR
4 26 Near Mkt 6/19 Main 15 H.P. 250 LPM ESI 198 5000 10 HR
5 26 Near H.N.
1156
8/19 Main 15 H.P. 250 LPM ESI 219 2500 AL 10 HR
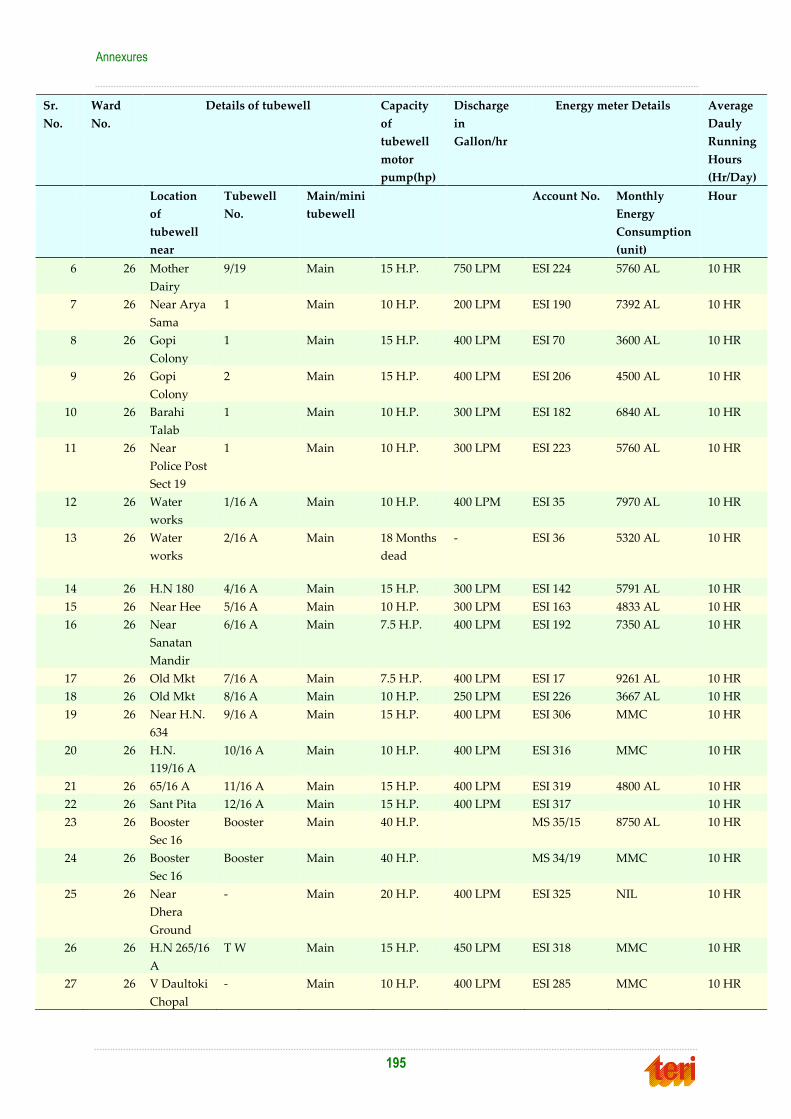
Annexures
195
Sr.
No.
Ward
No.
Details of tubewell Capacity
of
tubewell
motor
pump(hp)
Discharge
in
Gallon/hr
Energy meter Details Average
Dauly
Running
Hours
(Hr/Day)
Location
of
tubewell
near
Tubewell
No.
Main/mini
tubewell
Account No. Monthly
Energy
Consumption
(unit)
Hour
6 26 Mother
Dairy
9/19 Main 15 H.P. 750 LPM ESI 224 5760 AL 10 HR
7 26 Near Arya
Sama
1 Main 10 H.P. 200 LPM ESI 190 7392 AL 10 HR
8 26 Gopi
Colony
1 Main 15 H.P. 400 LPM ESI 70 3600 AL 10 HR
9 26 Gopi
Colony
2 Main 15 H.P. 400 LPM ESI 206 4500 AL 10 HR
10 26 Barahi
Talab
1 Main 10 H.P. 300 LPM ESI 182 6840 AL 10 HR
11 26 Near
Police Post
Sect 19
1 Main 10 H.P. 300 LPM ESI 223 5760 AL 10 HR
12 26 Water
works
1/16 A Main 10 H.P. 400 LPM ESI 35 7970 AL 10 HR
13 26 Water
works
2/16 A Main 18 Months
dead
- ESI 36 5320 AL 10 HR
14 26 H.N 180 4/16 A Main 15 H.P. 300 LPM ESI 142 5791 AL 10 HR
15 26 Near Hee 5/16 A Main 10 H.P. 300 LPM ESI 163 4833 AL 10 HR
16 26 Near
Sanatan
Mandir
6/16 A Main 7.5 H.P. 400 LPM ESI 192 7350 AL 10 HR
17 26 Old Mkt 7/16 A Main 7.5 H.P. 400 LPM ESI 17 9261 AL 10 HR
18 26 Old Mkt 8/16 A Main 10 H.P. 250 LPM ESI 226 3667 AL 10 HR
19 26 Near H.N.
634
9/16 A Main 15 H.P. 400 LPM ESI 306 MMC 10 HR
20 26 H.N.
119/16 A
10/16 A Main 10 H.P. 400 LPM ESI 316 MMC 10 HR
21 26 65/16 A 11/16 A Main 15 H.P. 400 LPM ESI 319 4800 AL 10 HR
22 26 Sant Pita 12/16 A Main 15 H.P. 400 LPM ESI 317 10 HR
23 26 Booster
Sec 16
Booster Main 40 H.P. MS 35/15 8750 AL 10 HR
24 26 Booster
Sec 16
Booster Main 40 H.P. MS 34/19 MMC 10 HR
25 26 Near
Dhera
Ground
- Main 20 H.P. 400 LPM ESI 325 NIL 10 HR
26 26 H.N 265/16
A
T W Main 15 H.P. 450 LPM ESI 318 MMC 10 HR
27 26 V Daultoki
Chopal
- Main 10 H.P. 400 LPM ESI 285 MMC 10 HR

Master plan to develop Faridabad as a “Solar City”
196
Sr.
No.
Ward
No.
Details of tubewell Capacity
of
tubewell
motor
pump(hp)
Discharge
in
Gallon/hr
Energy meter Details Average
Dauly
Running
Hours
(Hr/Day)
Remarks
Location of
tubewell
near
Tubewell
No.
Main/mini
tubewell
Account
No.
Monthly
Energy
Consumption
(unit)
Hour
1 27 Water
works
1/14 Main 15 H.P. 300 LPM ESI 41 6715 AL 10 HR
2 27 Water
works
2/14 Main 10 H.P. 30 LPM ESI 45 6714 AL 10 HR
3 27 Near
H.N1284/14
3/14 Main 15 H.P. 30 LPM ESI 283 MMC 10 HR
4 27 Near
.N.300
4/14 Main 15 H.P. 300 LPM ESI 60 6347 AL 10 HR
5 27 Near
Mother
Dairy
5/14 Main 15 H.P. 250 LPM ESI 166 7177 AL 10 HR
6 27 D/R Sec
14/17
6/14 Main 10 H.P. 250 LPM ESI 193 MMC 10 HR
7 27 Children
Park Sec 14
7/14 Main 10 H.P. 200 LPM ESI 277 5779 AL 10 HR
8 27 Near H.N.
120/14
8/14 Main 12 H 300 LPM ESI 302 MMC 10 HR
9 27 Near H.N.
1507/14
9/14 Main 5 H.P. 200 LPM ESI 322 MMC 10 HR
10 27 Near H.N.
913/14
10/14 Main 20 H.P. 450 LPM ESI MMC 10 HR
11 27 Water
Works
Gurudwara
1/15 Main 10 H.P. 300 LPM ESI 23 7246 AL 10 HR
12 27 Water
Works
Gurudwara
2/15 Main 10 H.P. 300 LPM ESI 24 5256 AL 10 HR
13 27 Near Geeta
Mandir
3/15 Main 15 H.P. 350 LPM ESI 38 MMC 10 HR
14 27 Near H.N.
834/15
4/15 Main 15 H.P. 350 LPM ESI 140 5613 AL 10 HR
15 27 Near H.N.
143/15
5/15 Main 15 H.P. 350 LPM ESI 159 7238 AL 10 HR
16 27 Near A.P.J.
School
6/15 Main 15 H.P. 350 LPM ESI 256 MMC 10 HR
17 27 Near
Kanya
Sadan
7/15 Main 15 H.P. 350 LPM ESI 284 7296 AL 10 HR

Annexures
197
Sr.
No.
Ward
No.
Details of tubewell Capacity
of
tubewell
motor
pump(hp)
Discharge
in
Gallon/hr
Energy meter Details Average
Dauly
Running
Hours
(Hr/Day)
Remarks
Location of
tubewell
near
Tubewell
No.
Main/mini
tubewell
Account
No.
Monthly
Energy
Consumption
(unit)
Hour
18 27 Near H.N.
621
8/15 Main 20 H.P. 400 LPM ESI 298 MMC 10 HR
19 27 Central
Park
9/15 Main 15 H.P. 350 LPM ESI 303 MMC 10 HR
20 27 Near h.N.
1016/15
10/15 Main 10 H.P. 300 LPM ESI 310 MMC 10 HR
21 27 Near H.N.
571/15
11/15 Main 10 H.P. 300 LPM ESI 311 MMC 10 HR
22 27 Near H.N.
865
1/15A Main 15 H.P. 300 LPM ESI 100 5292 AL 10 HR
23 27 Near H.N.
936
2/15A Main 10 H.P. 300 LPM ESI 162 7239 AL 10 HR
24 27 Water
Works 15 A
3/15A Main 15 H.P. 350 LPM ESI 50 6933 AL 10 HR
25 27 Water
Works 15 A
4/15A Main 15 H.P. 350 LPM ESI 270 5264 10 HR
26 27 Near Gumi
Khanna
Club
5/15A Main 20 H.P. 350 LPM ESI 169A 7247 AL 10 HR
27 27 Near Old
ADC Office
6/15A Main 7.5 H.P. 350 LPM ESI 156A 5468 AL 10 HR
28 27 Fire Station 7/15A Main 10 H.P. 300 LPM ESI 248 5474 AL 10 HR
29 27 Officers
Colony
8/15A Main 5 H.P. 200 LPM ESI 249 5474 AL 10 HR
30 27 Near Little
Colombus
9/15A Main 10 H.P. 250 LPM ESI 304 MMC 10 HR
31 27 H.N. Near
65/15 A
10/15A Main 10 H.P. 250 LPM ESI 305 MMC 10 HR
32 27 Vi.
Asronda
Near
Radha
Swami
Satsang
V.
Asranda
Main 10 H.P. 250 LPM ESI 287 6144 AL 10 HR
33 27 Water
Works
Near Pro
office
1/17 Main 10 H.P. 250 LPM ESI 256 6470 AL 10 HR

Master plan to develop Faridabad as a “Solar City”
198
Sr.
No.
Ward
No.
Details of tubewell Capacity
of
tubewell
motor
pump(hp)
Discharge
in
Gallon/hr
Energy meter Details Average
Dauly
Running
Hours
(Hr/Day)
Remarks
Location of
tubewell
near
Tubewell
No.
Main/mini
tubewell
Account
No.
Monthly
Energy
Consumption
(unit)
Hour
34 27 Water
Works
Near Pro
office
2/17 Main 20 H.P. 450 LPM ESI 40 5647 AL 10 HR
35 27 Near H.N.
1106/17
5/17 Main 15 H.P. 300 LPM ESI 171 7087 AL 10 HR
36 27 Near
Market
Mode
10/17 Main 10 H.P. 300 LPM ESI 269 7296 AL 10 HR
37 27 Near Police
Post
11/17 Main 20 H.P. 350 LPM ESI 227 NIL 10 HR
38 27 Near H.N.
797/17
14/17 Main 10 H.P. 300 LPM ESI 308 MMC 10 HR
39 27 Near H.N.
1028
15/17 Main 15 H.P. 300 LPM ESI 307 MMC 10 HR
40 27 Water
Works Sec
14
Booster
Sec 14
Main 40 H.P. MS 37/4 7525 AL 10 HR
41 27 sector 15 Booster
Sec 15
Main 40 H.P. MS 36/10 MMC 10 HR
42 27 sector 17 Booster
Sec 17
Main 40 H.P. MS
34/118
11904 AL 10 HR
Sr.
No.
Ward
No.
Details of tubewell Capacity of
tubewell
motor
pump(hp)
Discharge
in
Gallon/hr
Energy meter Details Average
Dauly
Running
Hours
(Hr/Day)
Location of
tubewell
near
Tubewell
No.
Main/mini
tubewell
Account No. Monthly
Energy
Consumption
(unit)
Hour
1 28 H.B. Colony 1/18 Main 15 H.P. 440 LPM ESI 132 6120 AL 10 HR
2 28 H.B. Colony 2/18 Main 10 H.P. 300 LPM ESI 189 7250 AL 10 HR
3 28 H.B. C. 3/18 Main 15 H.P. 400 LPM ESI 203 4385 AL 10 HR
4 28 Vill Bhudua - Main 10 H.P. 250 LPM ICPW 0001 4500 AL 10 HR
5 28 Sam Sanghat - Main 15 H.P. 300 LPM ICPW 0002 1200 AL 10 HR

Annexures
199
Sr.
No.
Ward
No.
Details of tubewell Capacity of
tubewell
motor
pump(hp)
Discharge
in
Gallon/hr
Energy meter Details Average
Dauly
Running
Hours
(Hr/Day)
Location of
tubewell
near
Tubewell
No.
Main/mini
tubewell
Account No. Monthly
Energy
Consumption
(unit)
Hour
6 28 Dairy Yojna - Main 10 H.P. 250 LPM ICPW 0003 2500 AL 10 HR
7 28 Bestnakong
V Bhudena
- Main 10 H.P. 200 LPM ICPW 0005 2500 AL 10 HR
Sr.
No.
Ward
No.
Details of tubewell Capacity
of
tubewell
motor
pump(hp)
Discharge
in
Gallon/hr
Energy meter Details Average
Dauly
Running
Hours
(Hr/Day)
Location
of
tubewell
near
Tubewell
No.
Main/mini
tubewell
Account No. Monthly
Energy
Consumption
(unit)
Hour
1 29 Sec - 9 29/9 Main 15 H.P. 5000 59PW 0009 4608 16 hr/day
2 29 Sec - 9 25/9 Main 10 H.P. 4000 59PW 0001 4608 16 hr/day
3 29 Sec - 9 27/9 Main 15 H.P. 5000 59PW 0002 2159 16 hr/day
4 29 Sec - 9 26/9 Main 10 H.P. 4000 59PW 0003 4608 16 hr/day
5 29 Sec - 9 28/9 Main 5 H.P. 2500 59PW 0004 7680 16 hr/day
6 29 Sec - 9 30/9 Main 15 H.P. 5000 59PW 0005 5182 16 hr/day
7 29 Sec - 9 21/9 Main 10 H.P. 4000 59PW 0007 4608 16 hr/day
8 29 Sec - 9 31/9 Main 15 H.P. 5000 59PW 0008 7012 16 hr/day
9 29 Sec - 9 21A/9 Main 15 H.P. 5000 ESI 265 4608 16 hr/day
10 29 Sec - 9 34/9 Main 15 H.P. 5000 59PW 0006 6144 16 hr/day
11 29 H.No.
516/9
Sec - 9 Main 15 H.P. 5000 59PW 0012 4608 16 hr/day
12 29 1112/9 Sec - 9 Main 15 H.P. 5000 59PW 0013 4608 16 hr/day
13 29 262/9 Sec - 9 Main 15 H.P. 5000 59PW 0014 5383 16 hr/day
14 29 1771/9 Sec - 9 Main 10 H.P. 4000 59PW 0015 1440 16 hr/day

Master plan to develop Faridabad as a “Solar City”
200
Sr.
No.
Ward
No.
Details of tubewell Capacity
of
tubewell
motor
pump(hp)
Discharge
in
Gallon/hr
Energy meter Details Average
Dauly
Running
Hours
(Hr/Day)
Location
of
tubewell
near
Tubewell
No.
Main/mini
tubewell
Account No. Monthly
Energy
Consumption
(unit)
Hour
15 29 1321/9 Sec - 9 Main 15 H.P. 5000 59PW 0016 6144 16 hr/day
16 29 2265/9 Sec - 9 Main 10 H.P. 4000 59PW 0017 2743 16 hr/day
17 29 1391/9 Sec - 9 Main 15 H.P. 5000 59PW 0018 4462 16 hr/day
18 29 2319/9 Sec - 9 Main 15 H.P. 5000 59PW 0020 5123 16 hr/day
19 29 1908/9 Sec - 9 Main 15 H.P. 5000 59PW 0019 10211 16 hr/day
20 29 1193/9 Sec - 9 Main 15 H.P. 5000 59PW 0022 NEW 16 hr/day
21 29 32/9 Sec - 9 Main 15 H.P. 5000 59PW 0021 NEW 16 hr/day
22 29 3/10 3/10 Main 15 H.P. 5000 55PW 0004 4608 16 hr/day
23 29 4/10 4/10 Main 15 H.P. 5000 54PW 0003 5144 16 hr/day
24 29 I Block Sec-10 Main 15 H.P. 5000 55PW 0005 4608 16 hr/day
25 29 7/10 7/10 Main 15 H.P. 5000 55PW 0006 4608 16 hr/day
26 29 18J/10 J/10 Main 7.5 H.P. 3000 54PW 0004 4608 16 hr/day
27 29 9/10 9/10 Main 15 H.P. 4000 MCPW 0012 4608 16 hr/day
28 29 375/10 375/10 Main 15 H.P. 5000 55PW 0011 New MMC 16 hr/day
29 29 1/21 DLF DLF/10 Main 10 H.P. 4000 55PW 0010 3012 16 hr/day
30 29 J/27/10 J/27/10 Main 15 H.P. 5000 55PW 0012 New 250 16 hr/day
31 29 1/11D 1/11 Main 10 H.P. 4000 ESI-14 2930 16 hr/day
32 29 2/11B 2/11 Main 10 H.P. 4000 ESI-42 2683 16 hr/day
33 29 4/11B 4/11 Main 15 H.P. 5000 ESI-63 3360 16 hr/day
34 29 7/11 7/11 Main 10 H.P. 4000 ESI-286 6762 16 hr/day
35 29 Cricket
Academy
Sec 11 Main 15 H.P. 5000 ESI-289 MMC 16 hr/day
36 29 Cricket
Academy
Sec 11 Main 15 H.P. 5000 ESI-294 MMC 16 hr/day

Annexures
201
Sr.
No.
Ward
No.
Details of tubewell Capacity
of
tubewell
motor
pump(hp)
Discharge
in
Gallon/hr
Energy meter Details Average
Dauly
Running
Hours
(Hr/Day)
Location
of
tubewell
near
Tubewell
No.
Main/mini
tubewell
Account No. Monthly
Energy
Consumption
(unit)
Hour
37 29 New/11 Sec 11 Main 15 H.P. 5000 ESI-288 MMC 16 hr/day
38 29 B/69/11 Sec 11 Main 15 H.P. 5000 ESI-314 MMC 16 hr/day
39 29 264/11P Sec 11 Main 15 H.P. 5000 ESI-320 MMC 16 hr/day
40 29 910/11E Sec 11 Main 15 H.P. 5000 ESI-321 MMC 16 hr/day
41 29 Sec 11 Sec 11 Main 15 H.P. 5000 ESI-209 5437 16 hr/day
42 29 D69/11 Sec 11 Main 15 H.P. 5000 ESI-322 MMC 16 hr/day
43 29 B/45/11 Sec 11 Main 15 H.P. 5000 ESI-323 MMC 16 hr/day
Sr.
No.
Ward
No.
Details of tubewell Capacity
of
tubewell
motor
pump(hp)
Discharge
in
Gallon/hr
Energy meter Details Average
Dauly
Running
Hours
(Hr/Day)
Location of
tubewell
near
Tubewell
No.
Main/mini
tubewell
Account
No.
Monthly
Energy
Consumption
(unit)
Hour
1 30 Sec-7-D Main 15 H.P. 5000 57PW 0015 4608 16 hr/day
2 30 Sec-7 7/7 Main 15 H.P. 5000 57PW 0010 1269 16 hr/day
3 30 Sec-7 12/7 Main 15 H.P. 5000 57PW 0011 4608 16 hr/day
4 30 Sec-7 5/7 Main 15 H.P. 5000 PHPW
0002
4608 16 hr/day
5 30 Sec-7-8 6/7 Main 12.5 H.P. 3000 PHPW
0003
4608 16 hr/day
6 30 Sec-7 14/7 Main 10 H.P. 4000 57PW 0012 MMC 16 hr/day
7 30 Sec-7 15/7 Main 10 H.P. 4000 57PW 0013 MMC 16 hr/day
8 30 Sec-7 16/7 Main 15 H.P. 5000 57PW 0014 MMC 16 hr/day
9 30 Sec-7 13/7 Main 15 H.P. 5000 57PW 0001 3371 16 hr/day

Master plan to develop Faridabad as a “Solar City”
202
Sr.
No.
Ward
No.
Details of tubewell Capacity
of
tubewell
motor
pump(hp)
Discharge
in
Gallon/hr
Energy meter Details Average
Dauly
Running
Hours
(Hr/Day)
Location of
tubewell
near
Tubewell
No.
Main/mini
tubewell
Account
No.
Monthly
Energy
Consumption
(unit)
Hour
10 30 Sec-7 11/7 Main Old Bore 5
H.P.
4000 57PW 0002 4608 16 hr/day
11 30 Sec-7 6/7 Main Bore /
15H.P.
4000 57PW 0003 4608 16 hr/day
12 30 Sec-7 8/7 Main 15 H.P. 5000 57PW 0004 4608 16 hr/day
13 30 Sec-7 17/7 Main 12.5 H.P. 4000 57PW 0005 5430 16 hr/day
14 30 Sec-7 18/7 Main 10 H.P. 4000 57PW 0006 4018 16 hr/day
15 30 Sec-7 19/7 Main 7.5 H.P. 3000 57PW 0007 3562 16 hr/day
16 30 Sec-7 20/7 Main 15 H.P. 5000 57PW 0008 5400 16 hr/day
17 30 Sec-7 9/7 Main 15 H.P. 5000 57PW 0009 5814 16 hr/day
18 30 Sec-7 C 22/7 Main Salty
Water
- MCPW
0011
4608 16 hr/day
19 30 H.No 1321/7 Main 15 H.P. 5000 59PW 0016 1620 16 hr/day
20 30 H.No 330/7A 7A Main 15 H.P. 5000 57PW 0017 4608 16 hr/day
21 30 Near 10/7 New Twell Main 15 H.P. 5000 57PW 0019 - 16 hr/day
22 30 Near Office 7E Main 15 H.P. 5000 57PW 0020 339 16 hr/day
23 30 H.No 160/7A Twell Main 15 H.P. 4000 57PW 0021 MMC 16 hr/day
24 30 1585/7E 7E Main 15 H.P. 5000 57PW 0022 New 16 hr/day
25 30 450/7B 7B Main 15 H.P. 5000 57PW 0023 MMC 16 hr/day
26 30 Sec-8 4/8 Main 10 H.P. 4000 58PW 0007 4608 16 hr/day
27 30 Sec-8 6/8 Main 15 H.P. 5000 58PW 0008 4608 16 hr/day
28 30 Sec-8 3/8 Main 15 H.P. 5000 58PW 0014 2473 16 hr/day
29 30 Sec-8 1/8 Main 15 H.P. 4000 58PW 0001 4608 16 hr/day
30 30 Sec-8 2/8 Main 10 H.P. 4000 58PW 0002 4608 16 hr/day
31 30 Sec-8 7/8 Main 10 H.P. 3500 58PW 0003 4608 16 hr/day

Annexures
203
Sr.
No.
Ward
No.
Details of tubewell Capacity
of
tubewell
motor
pump(hp)
Discharge
in
Gallon/hr
Energy meter Details Average
Dauly
Running
Hours
(Hr/Day)
Location of
tubewell
near
Tubewell
No.
Main/mini
tubewell
Account
No.
Monthly
Energy
Consumption
(unit)
Hour
32 30 Sec-8 8/8 Main 15 H.P. 4000 PHPW
0008
4608 16 hr/day
33 30 Sec-8 5/8 Main 15 H.P. 4000 58PW 0004 4608 16 hr/day
34 30 Sec-8 9/8 Main 15 H.P. 5000 MCPW
0013
5760 16 hr/day
35 30 H.No 2080/8 8 Main 15 H.P. 5000 58PW 0027 4608 16 hr/day
36 30 Near Twell-3 8 Main 15 H.P. 5000 58PW 0030 New 16 hr/day
37 30 H.No 599/8 New/8 Main 15 H.P. 5000 58PW 0033 New 16 hr/day
38 30 2315/8 New/8 Main 15 H.P. 5000 58PW 0034 New 16 hr/day
39 30 1165/8 New/8 Main 15 H.P. 5000 58PW 0035 New 16 hr/day
40 30 2105/8 New Main 15 H.P. 5000 58PW 0036 New 16 hr/day
41 30 Sihi 1 Main 15 H.P. 5000 58PW 0016 4608 16 hr/day
42 30 Sihi 3 Main 15 H.P. 5000 58PW 0009 4608 16 hr/day
43 30 Sihi 4 Main 15 H.P. 5000 55PW 0003 4608 16 hr/day
44 30 Sihi 5 Main 15 H.P. 5000 58PW 0005 4608 16 hr/day
45 30 Sihi 6 Main 15 H.P. 5000 58PW 0015 4608 16 hr/day
46 30 Sihi Tompal Main 15 H.P. 5000 58PW 0028 MMC 16 hr/day
47 30 Sihi Guhli Park Main 15 H.P. 5000 58PW 0031 New 16 hr/day
48 30 Sihi Panchayat
Ghar
Main 15 H.P. 5000 58PW 0032 6839 16 hr/day
49 30 Polytechnik
College
Sec-8 Main 15 H.P. 4000 58PW 0029 4384 16 hr/day

Master plan to develop Faridabad as a “Solar City”
204
W.No. Sr.
No.
T.well
No.
Details of tube wells Capacity
of T.W.
motor
pump
(hp)
Discharge
in
Gallon/hr.
Energy meter details Average
daily
running
hours
(hr/day)
Remarks.
Location of
T.W.
Main/Mini
DTH
Account
No.
Monthly
Energy
Consumption
(unit)
31 1 100’road
Near Bikaner
Sweet.
Mini 7.5 2000 CCPW-
0013
3250 08 Hr.
2 Rishi Nagar
near Vinod
Gas Agency
Mini 7.5 1800 CCPW-
0010
MMC 08 Hr.
3 Kahra No.131
near Vishav
Bharti School.
Mini 7.5 1900 CCPW-
0007
3840 08 Hr.
4 East chawla
colony near
Himanshu
school
33’road.
Mini 7.5 1750 CCPW-
0009
4661 08 Hr.
5 Bhagat Singh
colony
block- A
Mini 7.5 2000 CCPW-
0008
3387 08 Hr.
6 Gadwali
colony block-
D
Mini 7.5 1500 CCPW-
0011
2412 08 Hr.
7 Near Kushak
Vatika.
Mini 7.5 1800 GCPW-
0001
3840 08 Hr.
8 Nahar Singh
colony near
Jaat
Dharamshala,
Sec-3
Mini 7.5 2000 SCPW-
0015
2961 08 Hr.

Annexures
205
W.No. Sr.
No.
T.well
No.
Details of tube wells Capacity
of T.W.
motor
pump
(hp)
Discharge
in
Gallon/hr.
Energy meter details Average
daily
running
hours
(hr/day)
Remarks.
Location of
T.W.
Main/Mini
DTH
Account
No.
Monthly
Energy
Consumption
(unit)
9 Nahar Singh
colony road
near Petrol
pump, Sec-3.
Mini 7.5 1600 CCPW-
0016
3075 08 Hr.
10 Near Chawla
colony
Boosting.
Mini 7.5 2200 CCPW-
0004
MMC 08 Hr.
11 2 Sec-4,Ind.
Near O.H.T.
Mini 7.5 1500 54PW-
0007
2558 08 Hr.
12 3 Sec-4,R
Jhuggi.
Mini 7.5 1500 54PW-
0008
2688 08 Hr.
13 1 Gurgaon
canal near
Sec-3 bridge,
chawla
colony.
Main 10 1600 GCPW-
0005
5760 16 Hr.
14 2 Gurgaon
canal near
Saw mill ,
chawla col.
Main 25 7000 GCPW-
0003
5760 16 Hr.
15 3 Near Bhajan
Vatika.
Main 20 5000 GCPW-
0004
5760 16 Hr.
16 4 Near Kushak
Vatika.
Main 15 5000 GCPW-
0002
5760 16 Hr.
31 17 7 Sec-4R,
Disposal
Main 10 2000 16 Hr. Connecting
through
Disposal.
18 3 Sector-4R Main 10 2500 54PW-
0006
3840 Av. 16 Hr.
19 4 Sector-4R Main 10 2500 PHPW- 4608 Av. 16 Hr.

Master plan to develop Faridabad as a “Solar City”
206
W.No. Sr.
No.
T.well
No.
Details of tube wells Capacity
of T.W.
motor
pump
(hp)
Discharge
in
Gallon/hr.
Energy meter details Average
daily
running
hours
(hr/day)
Remarks.
Location of
T.W.
Main/Mini
DTH
Account
No.
Monthly
Energy
Consumption
(unit)
0001
20 5 Sector-4R Main 10 2500 PHPW-
0005
13066 Unit. 16 Hr.
21 6 Sector-4R Main 10 2200 PHPW-
0004
5730 Unit. 16 Hr.
22 1 Gadwali
colony.
Main 10 3500 CCPW-
0001
4610 Av. 16 Hr.
23 2 Gadwali
colony.
Main 10 4000 CCPW-
0002
4610 Av. 16 Hr.
W.No. Sr.
No.
T.well
No.
Details of tube wells Capacity
of T.W.
motor
pump
(hp)
Discharge
in
Gallon/hr.
Energy meter details Average
daily
running
hours
(hr/day)
Remarks.
Location of
T.W.
Main/Mini
DTH
Account
No.
Monthly
Energy
Consumption
(unit)
32 1 13/3 Near Shiv
Mandir,
Sec-3
Main 15 4000 SCPW-
0002
4610 Av. 16 Hr.
2 13B/3 Near Guru
Nanak
park, Sec-3
Main. 10 2000 SCPW-
0003
6307 Unit. 16 Hr.
3 15/3 Near Royal
Farm Sec-3
new bridge
road.
Main. 15 3500 SCPW-
0009
4610 Av 16 Hr.
4 16/3 Near new
bridge, Sec-
3
Main. 15 2500 SCPW-
0005
4610 Av 16 Hr.
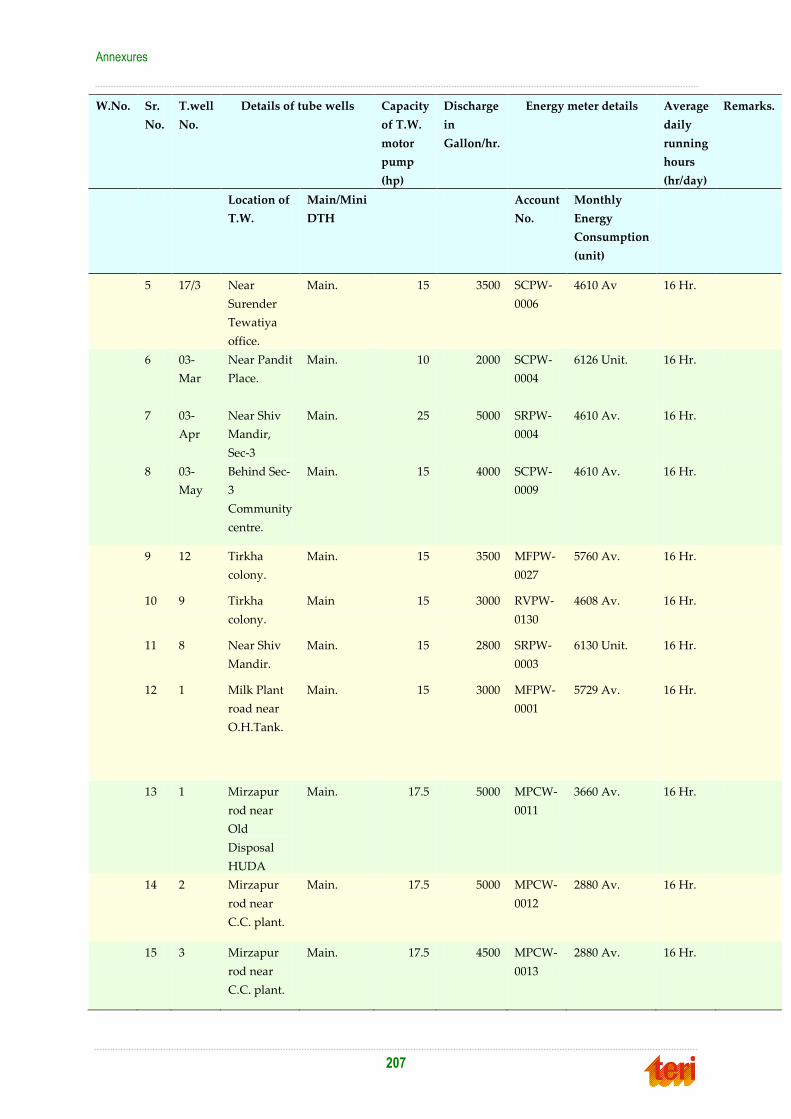
Annexures
207
W.No. Sr.
No.
T.well
No.
Details of tube wells Capacity
of T.W.
motor
pump
(hp)
Discharge
in
Gallon/hr.
Energy meter details Average
daily
running
hours
(hr/day)
Remarks.
Location of
T.W.
Main/Mini
DTH
Account
No.
Monthly
Energy
Consumption
(unit)
5 17/3 Near
Surender
Tewatiya
office.
Main. 15 3500 SCPW-
0006
4610 Av 16 Hr.
6 03-
Mar
Near Pandit
Place.
Main. 10 2000 SCPW-
0004
6126 Unit. 16 Hr.
7 03-
Apr
Near Shiv
Mandir,
Sec-3
Main. 25 5000 SRPW-
0004
4610 Av. 16 Hr.
8 03-
May
Behind Sec-
3
Community
centre.
Main. 15 4000 SCPW-
0009
4610 Av. 16 Hr.
9 12 Tirkha
colony.
Main. 15 3500 MFPW-
0027
5760 Av. 16 Hr.
10 9 Tirkha
colony.
Main 15 3000 RVPW-
0130
4608 Av. 16 Hr.
11 8 Near Shiv
Mandir.
Main. 15 2800 SRPW-
0003
6130 Unit. 16 Hr.
12 1 Milk Plant
road near
O.H.Tank.
Main. 15 3000 MFPW-
0001
5729 Av. 16 Hr.
13 1 Mirzapur
rod near
Old
Disposal
HUDA
Main. 17.5 5000 MPCW-
0011
3660 Av. 16 Hr.
14 2 Mirzapur
rod near
C.C. plant.
Main. 17.5 5000 MPCW-
0012
2880 Av. 16 Hr.
15 3 Mirzapur
rod near
C.C. plant.
Main. 17.5 4500 MPCW-
0013
2880 Av. 16 Hr.
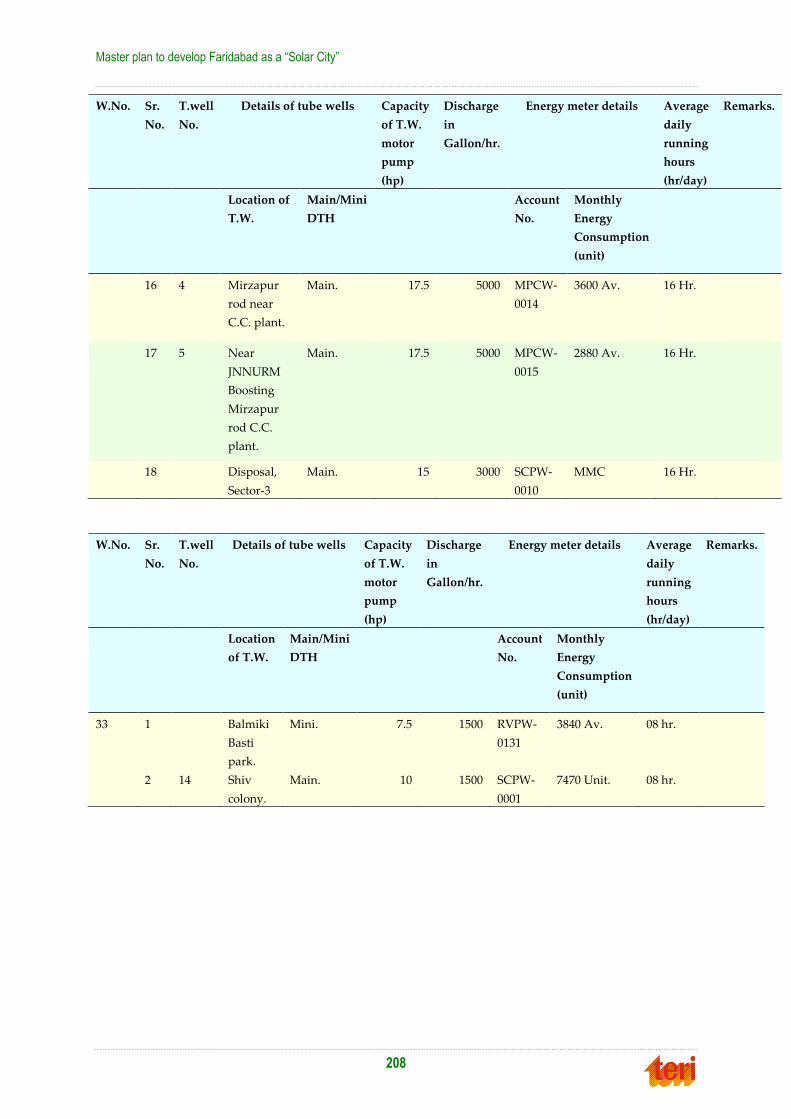
Master plan to develop Faridabad as a “Solar City”
208
W.No. Sr.
No.
T.well
No.
Details of tube wells Capacity
of T.W.
motor
pump
(hp)
Discharge
in
Gallon/hr.
Energy meter details Average
daily
running
hours
(hr/day)
Remarks.
Location of
T.W.
Main/Mini
DTH
Account
No.
Monthly
Energy
Consumption
(unit)
16 4 Mirzapur
rod near
C.C. plant.
Main. 17.5 5000 MPCW-
0014
3600 Av. 16 Hr.
17 5 Near
JNNURM
Boosting
Mirzapur
rod C.C.
plant.
Main. 17.5 5000 MPCW-
0015
2880 Av. 16 Hr.
18 Disposal,
Sector-3
Main. 15 3000 SCPW-
0010
MMC 16 Hr.
W.No. Sr.
No.
T.well
No.
Details of tube wells Capacity
of T.W.
motor
pump
(hp)
Discharge
in
Gallon/hr.
Energy meter details Average
daily
running
hours
(hr/day)
Remarks.
Location
of T.W.
Main/Mini
DTH
Account
No.
Monthly
Energy
Consumption
(unit)
33 1 Balmiki
Basti
park.
Mini. 7.5 1500 RVPW-
0131
3840 Av. 08 hr.
2 14 Shiv
colony.
Main. 10 1500 SCPW-
0001
7470 Unit. 08 hr.
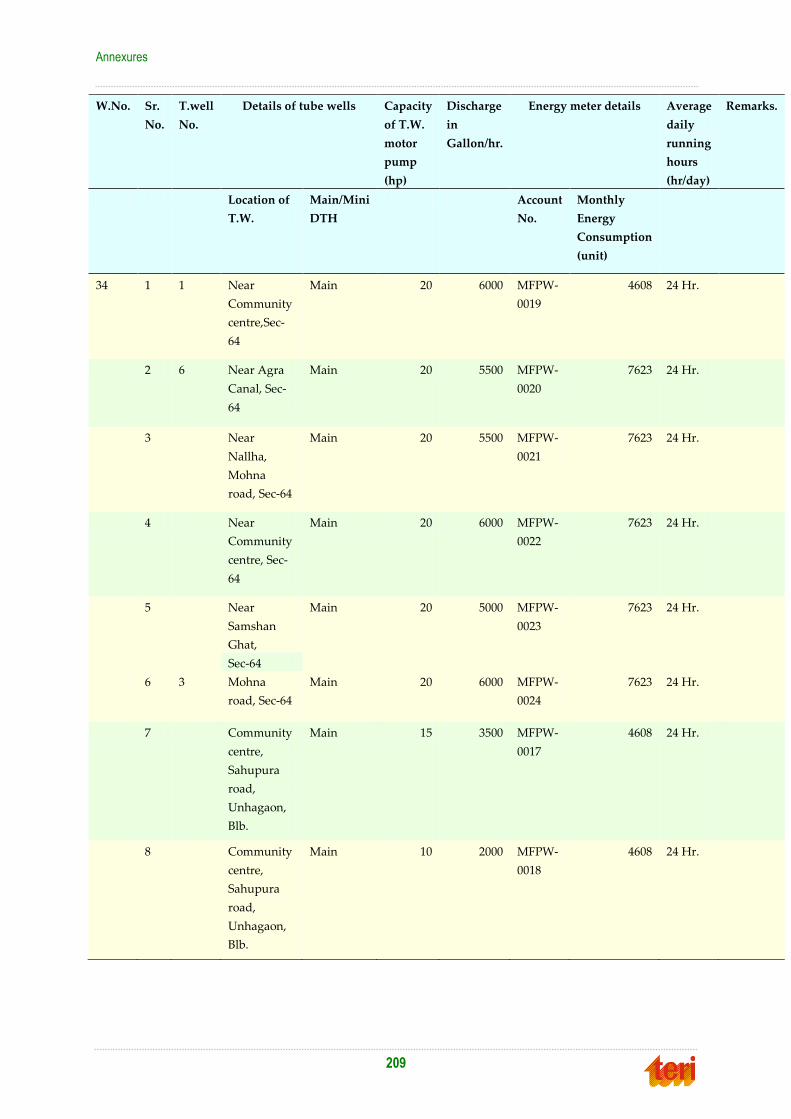
Annexures
209
W.No. Sr.
No.
T.well
No.
Details of tube wells Capacity
of T.W.
motor
pump
(hp)
Discharge
in
Gallon/hr.
Energy meter details Average
daily
running
hours
(hr/day)
Remarks.
Location of
T.W.
Main/Mini
DTH
Account
No.
Monthly
Energy
Consumption
(unit)
34 1 1 Near
Community
centre,Sec-
64
Main 20 6000 MFPW-
0019
4608 24 Hr.
2 6 Near Agra
Canal, Sec-
64
Main 20 5500 MFPW-
0020
7623 24 Hr.
3 Near
Nallha,
Mohna
road, Sec-64
Main 20 5500 MFPW-
0021
7623 24 Hr.
4 Near
Community
centre, Sec-
64
Main 20 6000 MFPW-
0022
7623 24 Hr.
5 Near
Samshan
Ghat,
Main 20 5000 MFPW-
0023
7623 24 Hr.
Sec-64
6 3 Mohna
road, Sec-64
Main 20 6000 MFPW-
0024
7623 24 Hr.
7 Community
centre,
Sahupura
road,
Unhagaon,
Blb.
Main 15 3500 MFPW-
0017
4608 24 Hr.
8 Community
centre,
Sahupura
road,
Unhagaon,
Blb.
Main 10 2000 MFPW-
0018
4608 24 Hr.

Master plan to develop Faridabad as a “Solar City”
210
W.No. Sr.
No.
T.well
No.
Details of tube wells Capacity
of T.W.
motor
pump
(hp)
Discharge
in
Gallon/hr.
Energy meter details Average
daily
running
hours
(hr/day)
Remarks.
Location of
T.W.
Main/Mini
DTH
Account
No.
Monthly
Energy
Consumption
(unit)
9 Phirni road,
Unhagaon,
Blb.
Main. 20 4500 MFPW-
0014
4608 24 Hr.
10 Phirni road,
Unhagaon,
Blb.
Main. 15 4000 MFPW-
0015
4608 24 Hr.
11 Sahupura
road,
Unchagaon,
Blb.
Main. 20 5000 MFPW-
0015
4608 24 Hr.
12 Garg
colony, Blb.
Mini. 10 2000 B3PW-
0004
4608 06 Hr.
13 Garg
colony, Blb.
Mini. 10 2000 B3PW -
0005
2342 06 Hr.
14 Near Back
side of
Akash
Cinema.
Mini. 10 1800 B3PW –
0006
2206 06 Hr.
15 Citi Park,
Ballabhgarh.
Mini. 10 2000 B3PW –
0001
3172 06 Hr.
16 JCB
residence,
Blb.
Mini 10 1500 SRPW –
0013
2570 06 Hr.
17 Nahar Singh
park, Blb.
Mini 10 1800 SRPW –
0001
880 06 Hr.
18 Devi Lal
Park, Blb.
Mini. 10 2000 SRPW –
0002
1302 06 Hr.
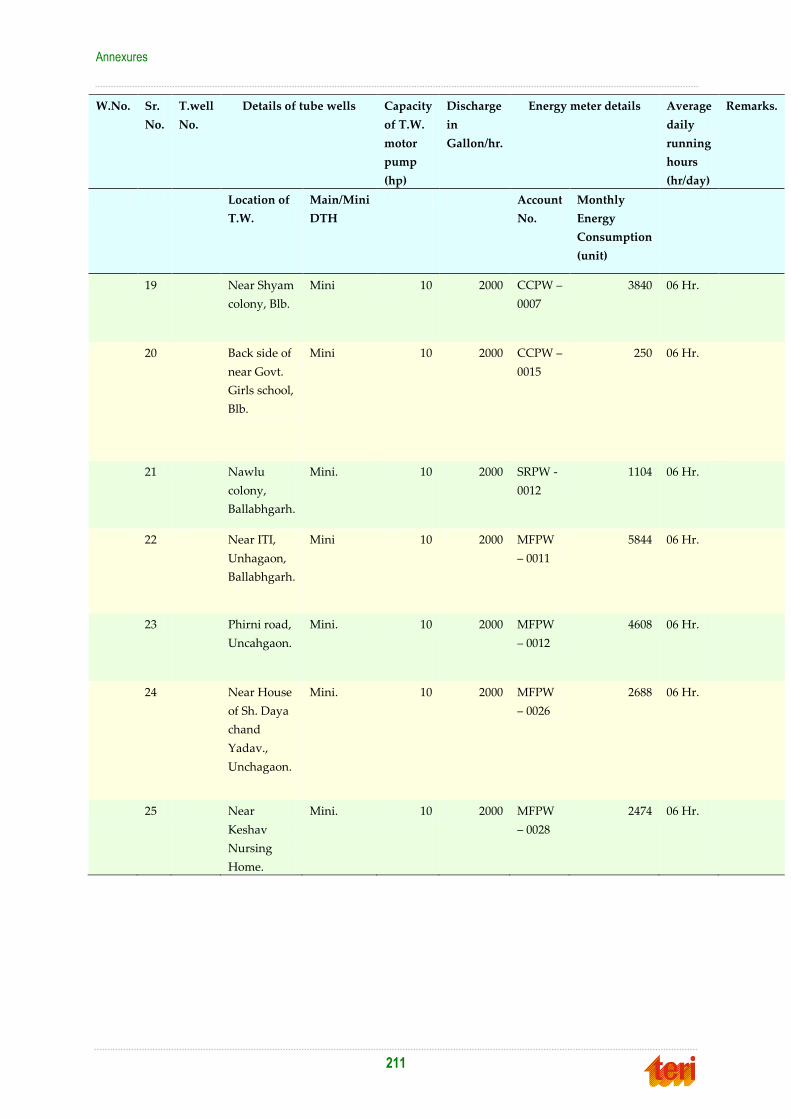
Annexures
211
W.No. Sr.
No.
T.well
No.
Details of tube wells Capacity
of T.W.
motor
pump
(hp)
Discharge
in
Gallon/hr.
Energy meter details Average
daily
running
hours
(hr/day)
Remarks.
Location of
T.W.
Main/Mini
DTH
Account
No.
Monthly
Energy
Consumption
(unit)
19 Near Shyam
colony, Blb.
Mini 10 2000 CCPW –
0007
3840 06 Hr.
20 Back side of
near Govt.
Girls school,
Blb.
Mini 10 2000 CCPW –
0015
250 06 Hr.
21 Nawlu
colony,
Ballabhgarh.
Mini. 10 2000 SRPW -
0012
1104 06 Hr.
22 Near ITI,
Unhagaon,
Ballabhgarh.
Mini 10 2000 MFPW
– 0011
5844 06 Hr.
23 Phirni road,
Uncahgaon.
Mini. 10 2000 MFPW
– 0012
4608 06 Hr.
24 Near House
of Sh. Daya
chand
Yadav.,
Unchagaon.
Mini. 10 2000 MFPW
– 0026
2688 06 Hr.
25 Near
Keshav
Nursing
Home.
Mini. 10 2000 MFPW
– 0028
2474 06 Hr.

Master plan to develop Faridabad as a “Solar City”
212
W.
No.
Sr.
No.
T.well
No.
Details of tube wells Capacity
of T.W.
motor
pump
(hp)
Discharge
in
Gallon/hr.
Energy meter details Average
daily
running
hours
(hr/day)
Remarks.
Location of
T.W.
Main/Mini
DTH
Account
No.
Monthly
Energy
Consumption
(unit)
35 1 Pragati
Vihar,
Ballabhgarh.
Main. 15 5000 SNPW –
0006
MMC 06 Hr. Not paid
2 Bapu Nagar,
Ballabhgarh.
Main. 7.5 2000 SNPW –
0004
MMC 06 Hr. Not paid
3 Fire station
opp. JCB
machine.
Mini. 10 1800 SNPW –
0007
MMC 06 Hr. Not paid.
4 Subhash
colony,
Ballabhgarh.
Mini. 10 2500 SNPW –
0005
3812 06 Hr.
5 Subhash
colony,
Ballabhgarh.
Mini. 10 2500 SNPW –
0006
3812 06 Hr.
(Source: Municipal Corporation Faridabad)
Installed Consumption
Raw
water
pump
Sewerage
water
pump
Tube
well/Booster
Pumps
Total kW 2577 2856 6947.5
Operating hours 12 3 16
Number of days 365 365 365
Energy consumption (lakh unit) 89.45 45.44 435.22
Total Installed consumption (lakh
unit)
570.11
(Source: Municipal Corporation Faridabad)

Annexures
213
Figure A2.1 Water pumping station in Faridabad


215
AAnnnneexxuurree 44 „„TTrreenndd aannaallyyssiiss‟‟ -- MMeetthhooddoollooggyy
aaddoopptteedd ffoorr pprroojjeeccttiioonn
„Trend analysis‟ is a well-known statistical tool used for projection of time series data. The
exercise is usually carried out in a built in tool box on MS-EXCEL which requires time series
data as base values. A graph of time series data is plotted in which time is selected as X-axis value and the data which has to be projected is selected as Y-axis value. Higher quantum of
input values is recommended for high level of projection. Figure A3.1 presents a sample of
trend analysis.
Figure A4.1 Sample of trend analysis using MS-EXCEL1
In the first step the graph of time series is plotted. Further the trend line over the data points
is added which might be linear, polynomial of n degree (n=1,2,3….), logarithmic etc. The reliability and best fitting of trend line is given on the basis of correlation coefficient (R2);
which is essentially the strength and direction of a mathematical relationship between a set
of time series data. The confidence interval of the projected values found very high if the value of R2 is more than 0.95.
1 http://www.uniphiz.com/findgraph/eur-usd-740-600.gif

Master plan to develop Faridabad as a “Solar City”
216
When the correlation coefficient is found suitable for projections that the mathematical
equation of trend line is obtained, which is a function of the values on X and Y axis. Now if one has to project the ground data for a longer period the value of X-axis parameter is
changed and new values obtained for the pre-specified time/year. Following steps are
involved in trend analysis in MS-EXCEL for time series projection:
1. Selection of data
2. Graph between Two set of value in which X-axis is time dependent
3. Addition of the trend line over the line of graph
4. Estimation of correlation coefficient of trend line
5. Estimation of mathematical equation of trend line
6. projection of value based on trend line equation
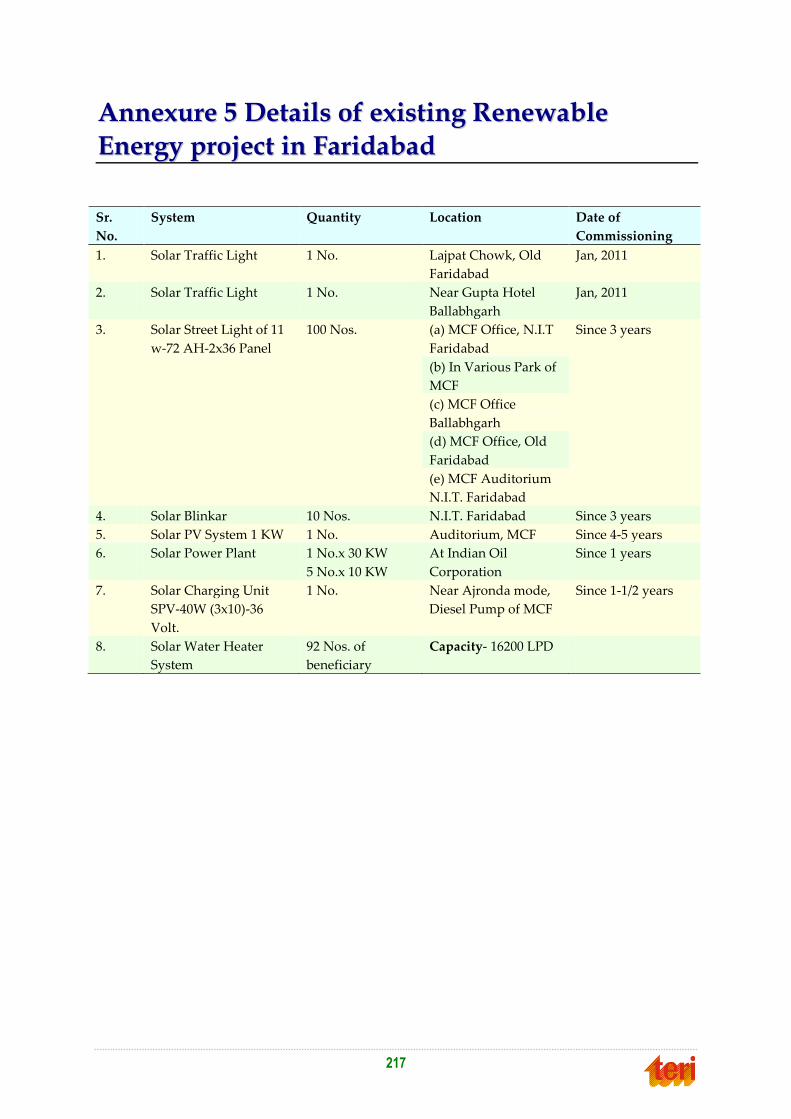
217
AAnnnneexxuurree 55 DDeettaaiillss ooff eexxiissttiinngg RReenneewwaabbllee
EEnneerrggyy pprroojjeecctt iinn FFaarriiddaabbaadd
Sr.
No.
System Quantity Location Date of
Commissioning
1. Solar Traffic Light 1 No. Lajpat Chowk, Old
Faridabad
Jan, 2011
2. Solar Traffic Light 1 No. Near Gupta Hotel
Ballabhgarh
Jan, 2011
3. Solar Street Light of 11
w-72 AH-2x36 Panel
100 Nos. (a) MCF Office, N.I.T
Faridabad
Since 3 years
(b) In Various Park of
MCF
(c) MCF Office
Ballabhgarh
(d) MCF Office, Old
Faridabad
(e) MCF Auditorium
N.I.T. Faridabad
4. Solar Blinkar 10 Nos. N.I.T. Faridabad Since 3 years
5. Solar PV System 1 KW 1 No. Auditorium, MCF Since 4-5 years
6. Solar Power Plant 1 No.x 30 KW
5 No.x 10 KW
At Indian Oil
Corporation
Since 1 years
7. Solar Charging Unit
SPV-40W (3x10)-36
Volt.
1 No. Near Ajronda mode,
Diesel Pump of MCF
Since 1-1/2 years
8. Solar Water Heater
System
92 Nos. of
beneficiary
Capacity- 16200 LPD


219
AAnnnneexxuurree 66 EEnneerrggyy eeffffiicciieenntt sscchheemmeess ooff BBEEEE aanndd
BBSSEESS
„Bachat Lamp Yojana‟ of Bureau of Energy Efficiency
Lighting accounts for almost 20% of the total electricity demand in the country, and
contributes almost fully to the peak load as well. The vast amount of lighting in the country is provided by incandescent bulbs, which are extremely energy inefficient. Only about 5%
of the electricity is converted into light, the rest is lost as heat. In recent years, energy
efficient lamps have been introduced into the Indian market, with the Compact Fluorescent Lamp (CFL) providing an energy-efficient alternative to the incandescent lamp. A CFL uses
only one-fifth as much electricity as an incandescent lamp to provide the same level of
illumination. CFLs have almost completely penetrated the commercial market, and the sales
of CFLs in India have grown from about 20 million in 2003 to more than 100 million in 2007.
However, penetration into households has been very limited, largely because of the high
price of the CFLs. The price of CFLs is still in the Rs.80-100 price range, whereas the incandescent bulbs are in the Rs.10-15 price range.
Initiatives to help decrease the price of CFLs to be comparable with that of incandescent
bulbs are therefore necessary in order to enhance the penetration of CFLs in households and are a policy goal that has been spelt out in the agreed action points in the meeting of all State
Chief Ministers chaired by the Prime Minister of India. It is estimated that about 400 million
light points in India today are lighted by incandescent bulbs; their replacement by CFLs would lead to a reduction of over 10,000 MW in electricity demand. This would not only
reduce emissions by way of efficient end use of electricity, but would also result in the
reduction of peak load in the country which currently faces a shortage of upto 15%. The
price barrier, as indicated above, will be overcome by using the CDM revenue stream to
enable faster penetration.
“Bachat Lamp Yojana” seeks to utilize the Clean Development Mechanism (CDM) of the Kyoto Protocol to bring-down the price of CFLs. This public-private partnership between
the Government of India, Private sector CFL Manufactures /Traders (Project Developers)
and State level Electricity Distribution Companies would provide the framework to distribute high quality CFLs at about Rs.15 per piece to the households of the country.
Under the scheme only 60 Watt and 100 Watt incandescent Lamps have to be replaced with
11to15 Watt and 20 -25 Watt CFLs respectively.
The Government would develop a programmatic approach (PoA) within which individual
CFL supplier would develop CDM projects. The Bureau of Energy Efficiency (BEE), being
the statutory body set up under the Energy Conservation Act, 2001 by the Government of
India, will coordinate the Small-Scale Programme of Activities (SSC-PoA) and will facilitate
implementation of the programme in various States through their respective Electricity
Distribution Companies (DISCOMs) with the assistance of the CFL suppliers. The
development of the SSC-PoA is a voluntary action on the part of BEE and it would not
seek any commercial revenues from the SSC-PoA. On the other hand, it will on behalf of
the Government of India take the responsibility of monitoring of all project areas after the DISCOMs and the CFL suppliers have entered into a tripartite agreement (TPA) with BEE.
The main roles of the three parties are listed below:

Master plan to develop Faridabad as a “Solar City”
220
CFL manufacturers and traders
Providing CFLs with lumen output +/- 10% of the baseline i.e. (lumen output of 100
Watt & 60 Watt ) Incandescent Lamps at price comparable to those of Incandescent
Lamps (i.e. Rs 15), in exchange for functioning Incandescent Lamps that are
currently being used in the households. A maximum of 4 CFLs shall be replaced per household. These CFLs shall be compliant with the existing National Regulations in
force.
Free replacement of fused distributed CFLs, within 2 years for 6000 hour CFL and within 3 years for 10000-hour lamps, during the life of the CDM Project.
Collection of fused CFLs through buy-back schemes, and arrangements for their safe
disposal.
Pre-project survey to estimate the annual electricity saving potential and baseline
penetration of CFL in a selected SSC-CPA area.
Distribution of CFLs in association with DISCOM within its customer area.
Securing financing of initial investment for the cost differential (no subsidy form the
Govt. of India towards reducing cost of the CFL lamps).
Preparing CDM Small-Scale Programme Activity Design Documents (SSC-CPA-DD) for their CDM Small-Scale Programme Activity (SSC-CPA) and submitting it to BEE.
Getting the SSC-CPA–PDD validated by a Designated Operational Entity of CDM
Executive Board.
Getting the SSC-CPA –PDD registered with the UNFCCC (including payment of any
fees to UNFCCC).
DISCOM in SSC-CPA area
Extend facilities to the SSC-CPA project investor to
Define geographic boundary of customer area of a DISCOM.
Define a residential household based on State level definition and tariff category.
Safe storage of replaced ILBs for independent inspection and safe disposal.
Prepare database of all grid connected residential households to include name of
users/ address/ average annual electricity consumption for each SSC-CPA project area
Selection of Baseline Survey Group (BSG), Project sample monitoring group
(PSMG), Project spot-check group (PSCG).
BEE
Extensive awareness and information campaign in association with DISCOMs.
Development of Small-Scale Programme of Activities Design Document (SSC-PoA-DD).
Registration of the SSC-PoA with UNFCCC CDM Executive Board.

Annexures
221
Managing the monitoring of lighting appliance utilization hours within the PSMG
households using the approved small scale methodology of the UNFCCC (EB) and analysis of the monitored data.
Supporting the CFL suppliers/ DISCOMs to prepare SSC-CPA-DDs.
Inclusion of SSC-CPAs to the SSC-PoA upon satisfaction of the eligibility criteria stipulated in the SSC-PoA-DD.
Official communication with the CDM–EB, DOE and Indian DNA.
Allocation of CERs to the SSC-CPA project participant / DISCOMs according to their share in emissions reductions in a specified period.
Decide any transaction cost on SSC-CPA for functioning as managing entity for SSC-
CPA
„Buy One Get One‟ programme of BSES
BSES' “Buy One Get 1 Free CFL Offer” gets enthusiastic response Over 96,000 CFL pieces
sold in little over one month
BSES‟s drive for judicious use of electricity receives tremendous response
Proves consumers aware of the need for energy conservation
Over 96,000 CFLs already sold – this in effect should reduce power demand by over 6 MW
15 W CFL (equivalent to 75 W) is the most popular category
West Delhi has maximum takers for the CFL energy conservation scheme, closely followed by South Delhi
Yellow light emitting 1+1 CFL option will now be made available to customers – at
same price
BSES‟ innovative energy conserving scheme – Buy One Get One Free CFL offer – has been
received very enthusiastically by its consumers. The scheme not only helps Delhi conserve
scarce and precious electricity but also helps BSES customers make substantial monetary saving.
The scheme launched in tandem with Indo Asian Fusegear Limited – one of India‟s largest
manufacturers and exporters of CFL – on the auspicious day of Eid (October 24, 2006) by the Hon‟ble Power Minister Shri Haroon Yusuf has turned out to be a big hit. In little over one
month over 96,000 CFL‟s have been bought by thousands of BSES customers from the 52
special kiosks put up at BSES Customer Care Centres and select Cash Counters. “This discounted rate CFL offer for energy saving is available only till December 31, 2006”, said a
BSES official.
Area 11 W 15 W 20W Total
West 10040 15122 9164 34326
South 9868 13130 8644 31642
East 6474 9854 6682 23010
Central 1340 3346 2400 7086
Total 27722 41452 26890 96064

Master plan to develop Faridabad as a “Solar City”
222
The data collated has revealed interesting trends. The data indicates BSES‟ West Delhi
customers have taken the lead in energy conservation with over 34,000 CFL‟s being sold. South Delhi is a close second with over 31,500 CFL‟s being bought from the stalls. East and
Central are at the third and the fourth spot with over 23,000 and 7000 CFL‟s being bought.
Another interesting trend observed was that the 15 Watt CFL (equivalent to 75 Watt at Rs 150 for 2) is the most popular among the customers - with over 41,000 being sold. The 11 W
CFL (equivalent to 60 W at Rs 135 for 2) sold nearly 27,000 pieces closely followed by the 20
W CFL (equivalent to 100 W at Rs 200 for 2) which sold over 26,500 CFL‟s
“Substituting the normal incandescent bulbs with these low consumption, high brightness
output CFL‟s will lead to massive savings. Savings accruing from the over 96,000CFL‟s sold
from BSES‟ outlets will lead to a reduction in maximum demand by of over 6.2 MW at a given point of time– enough to power two average shopping malls in Delhi and lead to
energy saving of over 9 million units annually” said a BSES official.
In view of the encouraging response to the scheme, BSES has now decided to put on offer
the yellow light emitting CFL‟s at the same price and wattage, said the BSES
spokesperson. To avail the existing as well as new offer of yellow light emitting CFLs, all
that a customer has to do is visit any of BSES‟ 33 Customer Care Centers and 32 select Cash Counters, show copy of their last paid bill (from September 1 onwards) and avail the offer.
Also there is no restriction on the number of CFL bulbs a customer can buy”
“A recent study has shown that Delhi can save around 450 MW of electricity by simply switching over to CFL bulbs. Additional 175 MW electricity can be saved by just switching
off electrical gadgets from the mains, instead of the keeping them in the standby mode” said
a BSES official and added Savings of up to Rs 391 per year can accrue with just one CFL bulb. Imagine the magnitude of savings accruing to a family if all the bulbs are replaced
with CFL‟s.
According to a BSES spokesperson “BSES has been educating its consumers about the need to conserve power though Synergy – its bi-monthly, bi-lingual newsletter that goes to its 23
lakh customers, newspaper inserts and pamphlets distributed at melas from time to time.
We request our consumers to avail this special limited period offer that will not only help Delhi overcome the power crisis but also bring about substantial monetary savings”
BSES, Delhi‟s premier power distribution company, is committed to ensuring quality and
reliable electricity supply to all its consumers.

223
AAnnnneexxuurree 77 EEnneerrggyy eeffffiicciieennccyy mmeeaassuurreess ffoorr aaiirr
ccoonnddiittiioonniinngg
Energy conservation measures for air conditioners
In addition to the above mentioned energy conservation measures, there are certain
„Behavioural best Practices” which can reduce energy consumption in air conditioners. These measures are explained below. The analysis in solar city scenario does not consider
energy saving due to these measures as it is difficult to quantify the energy saving that
would be achieved. Further, these measures need awarness creation so that these measures are adopted by general public, thus a awarness campaign has been suggested for these
measures.
Option-A Changing the set point in window ACs
The efficiency of window ACs can be enhanced by increasing the temperature of the air
supplied into the room. This is based on the principle that the efficiency of the system
decreases to produce lower air temperatures. Therefore it is recommended to increase the temperature of the supply air from window AC. It was observed that the thermostat
position in most of the window ACs was in the „coolest‟ mode. The reason for the extreme
setting is to achieve cooling in the shortest time. This may lead to excessive cooling and also the AC runs at a low efficiency in the „coolest mode‟. The lesser the temperature difference
between indoors and outdoors, the higher the efficiency of the AC system. So, it is always
recommended to set the thermostat as high as possible so as to achieve comfortable indoor conditions.
Studies have shown that 3.6 % reduction in energy consumption is achieved for every
degree Centigrade raise in the supply air temperature for a window AC. It was observed that a few windows ACs in Old Sachivalaya building were operating at a supply air
temperature of 8.5 deg C. At this temperature the efficiency of the AC could be very low.
Also, for maintaining comfortable indoor conditions, it is recommended to have the supply air temperature at 13 deg C. The estimated energy savings by increasing the supply air
temperature is given in the table below.
Table A7.1 Energy savings in window ACs
Supply air
temperature
measured
Supply air
temperature
recommended
Increase in
temperature
Estimated
energy
savings per
AC
8.5 deg C 13 deg C 4.5 deg C 16%
Supply air temperature of 8.5 deg C corresponds to the „coolest‟ temperature setting in the window AC. And a supply air temperature of 13 deg C corresponds to a „medium‟
temperature setting in the window AC. It was observed during the study that the supply air
temperature in the various window ACs at old Sachivalaya building varied between 8.5 deg C and 14.5 deg C, though a majority of the ACs were operating with supply temperature in
the lower range (less than 10 deg C).
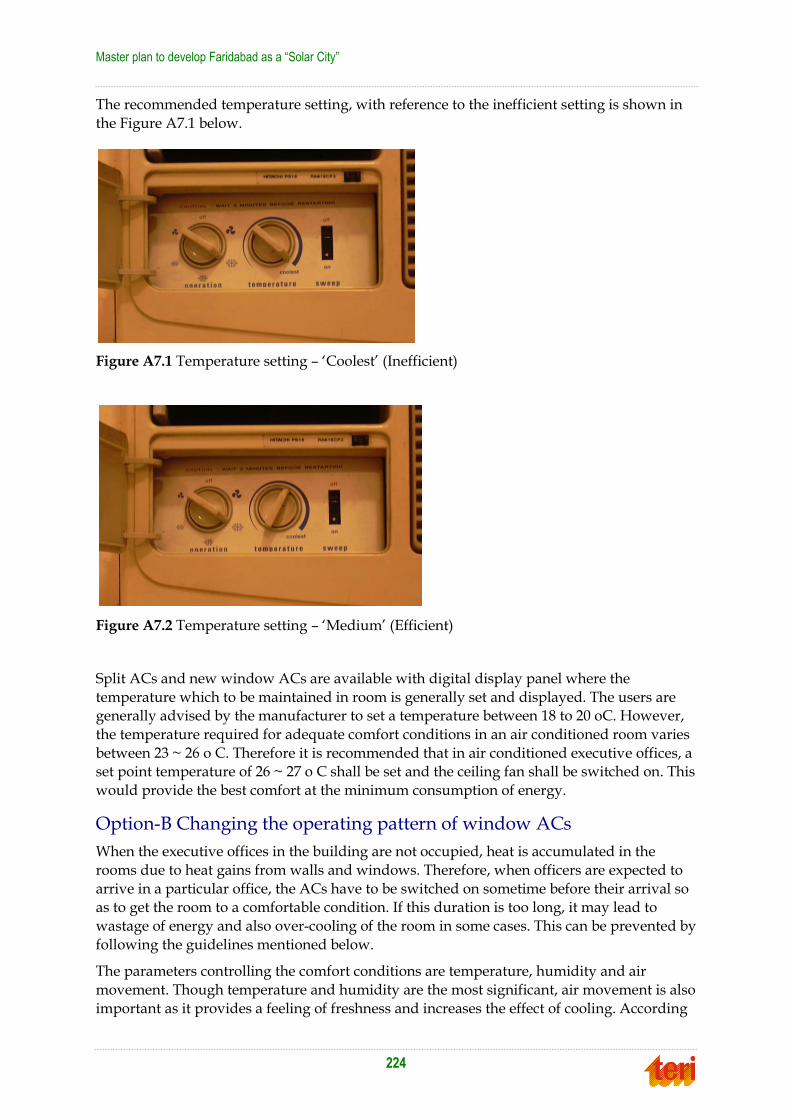
Master plan to develop Faridabad as a “Solar City”
224
The recommended temperature setting, with reference to the inefficient setting is shown in
the Figure A7.1 below.
Figure A7.1 Temperature setting – „Coolest‟ (Inefficient)
Figure A7.2 Temperature setting – „Medium‟ (Efficient)
Split ACs and new window ACs are available with digital display panel where the
temperature which to be maintained in room is generally set and displayed. The users are generally advised by the manufacturer to set a temperature between 18 to 20 oC. However,
the temperature required for adequate comfort conditions in an air conditioned room varies
between 23 ~ 26 o C. Therefore it is recommended that in air conditioned executive offices, a set point temperature of 26 ~ 27 o C shall be set and the ceiling fan shall be switched on. This
would provide the best comfort at the minimum consumption of energy.
Option-B Changing the operating pattern of window ACs
When the executive offices in the building are not occupied, heat is accumulated in the
rooms due to heat gains from walls and windows. Therefore, when officers are expected to
arrive in a particular office, the ACs have to be switched on sometime before their arrival so as to get the room to a comfortable condition. If this duration is too long, it may lead to
wastage of energy and also over-cooling of the room in some cases. This can be prevented by
following the guidelines mentioned below.
The parameters controlling the comfort conditions are temperature, humidity and air
movement. Though temperature and humidity are the most significant, air movement is also
important as it provides a feeling of freshness and increases the effect of cooling. According

Annexures
225
to the National Building Code of India 2005, the thermal comfort of a person lies between
the temperature range 25 – 30 0C. In hot and dry climates like Faridabad, air movement would be necessary to achieve adequate thermal comfort. Table A6.2 gives the desirable
wind speeds for thermal comfort at different temperature and humidity conditions. For
achieving wind speeds greater than 2 m/s, mechanical means of ventilation such as fans are required.
Table A7.2 Desirable wind speeds (m/s) for thermal comfort conditions1
Dry bulb
temperature
(deg C)
Relative humidity (%)
30 40 50 60 70 80 90
28 * * * * * * *
29 * * * * * 0.06 0.19
30 * * * 0.06 0.24 0.53 0.85
31 * 0.06 0.24 0.53 1.04 1.47 2.10
32 0.20 0.46 0.94 1.59 2.26 3.04 **
33 0.77 1.36 2.12 3.00 ** ** **
34 1.85 2.72 ** ** ** ** **
35 3.20 ** ** ** ** ** **
*None
** Higher than those acceptable in practice
Figure A7.3 Window AC with Ginie
In the offices, it is recommended that the ACs are switched on about 30 minutes before the
arrival of the officers with the temperature setting in the „medium‟ position as shown in the previous section, and by switching on the ceiling fans. Ceiling fans induce air movement
and result in uniform distribution of cool air inside the room. They also enhance the cooling
effect produced by the ACs and thus help in achieving comfortable indoor conditions for the guests. This measure results in energy savings (though not quantifiable) and does not
require any investment.
1 Part 8, Section 1, National Building Code of India 2005

Master plan to develop Faridabad as a “Solar City”
226
Option-C Installation of energy saving equipment on window ACs
A power saving equipment (genie) can be installed on the existing window or split AC to enhance the performance of the unit. The principle behind the working of this equipment is
that it increases the area of the condenser thereby reducing the condenser temperature. This
results in an increased efficiency of the cooling system. The estimated energy savings through this equipment is 10 to 20% as per the manufacturer), which is achieved through:
1. Direct fall in amperage
2. Fall in grill temperature
One of the manufacturers of such a device (Genie) is given below.
Option D Location of equipments near the window AC
It was observed at a few places that file boxes and tables etc. were placed very near to the
window AC. This affects the performance of the AC because they obstruct the air flow and
the temperature sensed by the thermostat. Even though the room temperature is
uncomfortable, the temperature sensed by the thermostat is lower and results in the AC running for a shorter duration than required. The occupant feels that the AC is not
performing well and he immediately changes the set point temperature to lower value
which leads to the energy wastage. So, care has to be taken to ensure that no equipments are placed very near to the ACs.

227
AAnnnneexxuurree 88 LLiisstt ooff EEnneerrggyy SSeerrvviiccee CCoommppaanniieess
((EESSCCOO)) aanndd BBIISS aapppprroovveedd mmaannuuffaaccttuurreerr ooff ssoollaarr
wwaatteerr hheeaatteerrss

Master plan to develop Faridabad as a “Solar City”
228

Annexures
229
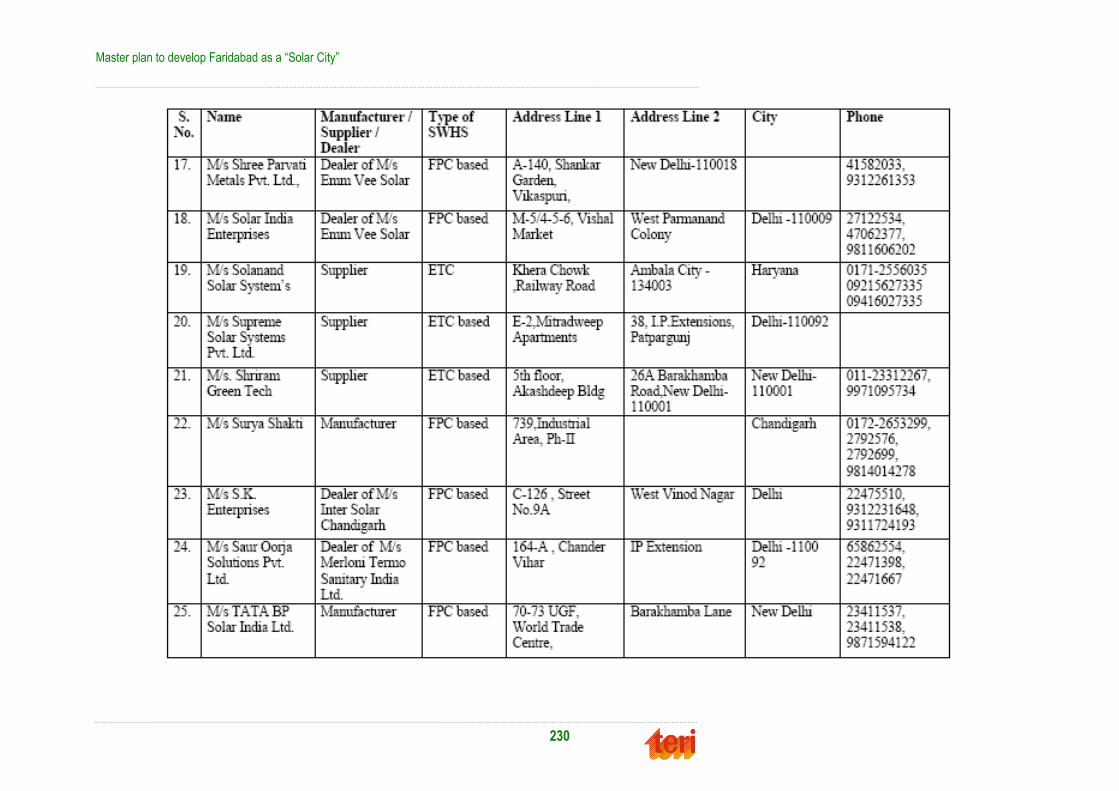
Master plan to develop Faridabad as a “Solar City”
230
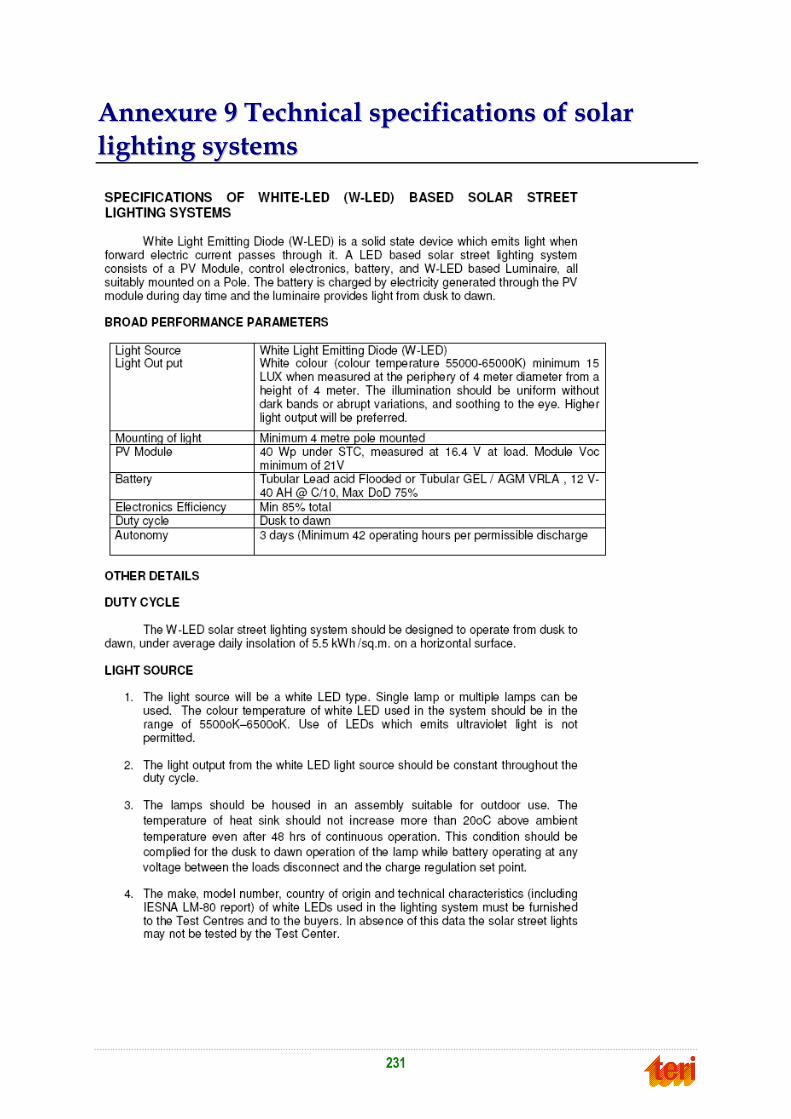
231
AAnnnneexxuurree 99 TTeecchhnniiccaall ssppeecciiffiiccaattiioonnss ooff ssoollaarr
lliigghhttiinngg ssyysstteemmss

Master plan to develop Faridabad as a “Solar City”
232

Annexures
233

Master plan to develop Faridabad as a “Solar City”
234

Annexures
235

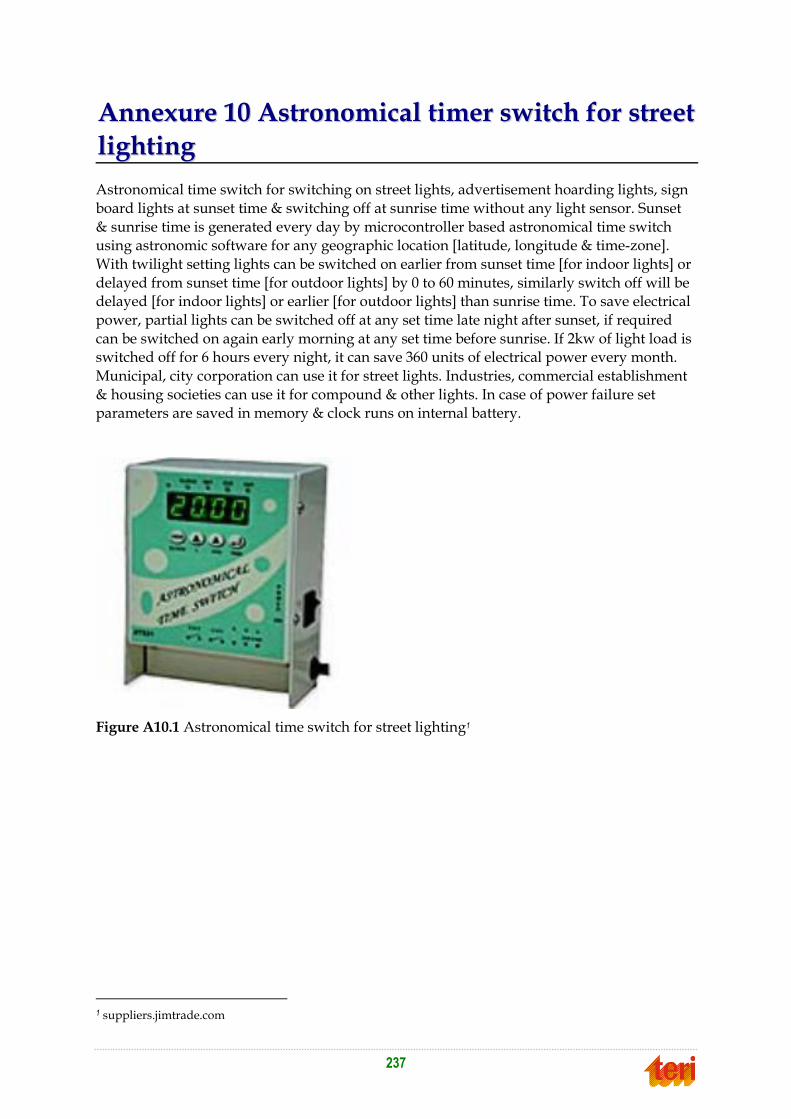
237
AAnnnneexxuurree 1100 AAssttrroonnoommiiccaall ttiimmeerr sswwiittcchh ffoorr ssttrreeeett
lliigghhttiinngg
Astronomical time switch for switching on street lights, advertisement hoarding lights, sign
board lights at sunset time & switching off at sunrise time without any light sensor. Sunset
& sunrise time is generated every day by microcontroller based astronomical time switch using astronomic software for any geographic location [latitude, longitude & time-zone].
With twilight setting lights can be switched on earlier from sunset time [for indoor lights] or
delayed from sunset time [for outdoor lights] by 0 to 60 minutes, similarly switch off will be delayed [for indoor lights] or earlier [for outdoor lights] than sunrise time. To save electrical
power, partial lights can be switched off at any set time late night after sunset, if required
can be switched on again early morning at any set time before sunrise. If 2kw of light load is switched off for 6 hours every night, it can save 360 units of electrical power every month.
Municipal, city corporation can use it for street lights. Industries, commercial establishment
& housing societies can use it for compound & other lights. In case of power failure set parameters are saved in memory & clock runs on internal battery.
Figure A10.1 Astronomical time switch for street lighting1
1 suppliers.jimtrade.com


239
AAnnnneexxuurree 1111 AAnnaallyyssiiss ffoorr LLEEDD bbaasseedd SSttrreeeett
LLiigghhttiinngg
Introduction
Many cities have effectively introduced programmes to make street lighting more efficient
through replacing Mercury vapour lamp to efficient high pressure sodium vapour (HPS). HPS light uses HPS lights use as little as 50% of the power of MV lights and last up to 6000
hours longer.
Cities are now beginning to investigate and implement programs to try and make public lighting more efficient by replacing traditional High Intensity Discharge (HID) lights with
more energy efficient and longer lasting LED (Light Emitting Diodes) Lights.
Although lifetime costs are yet to be established, this update aims to provide cities with an overview of the technology including advantages and possible challenges. It also outlines
steps which cities can take to evaluate the viability of LED street lighting.
LED Technology
An LED (light-emitting diode) is a semiconductor light source that generates light at a
precise wavelength when a current is applied; multiple LEDs are networked together in a
single fixture to in combination generate the appropriate light output for each particular application. Each LED is usually smaller than 0.5 cm2 so hundreds of them are used in an
array to produce enough light for large applications.
In recent years LEDs have begun to penetrate the street and area lighting market; rapid improvement in the efficacy of white-light LEDs, innovations in fixture design particularly
optical efficiency and thermal management and extended fixture warranties have together
contributed to this market growth. Many modern LED fixtures boast warranty lifetimes of 50,000 hours, or almost 11.5 years when operated 12 hours per night. Unlike all other street
lighting technologies save incandescent, LED fixtures contain no mercury.
Some of the benefits of LED street lights over regular street light fixtures are
Use 30-90% less electricity for a similar light output than HPS lights
Have up to five times the life expectancy
Light is controllable (dimmable and can be instantly turned on and off)
Light is highly directional
Contain no mercury or other hazardous materials
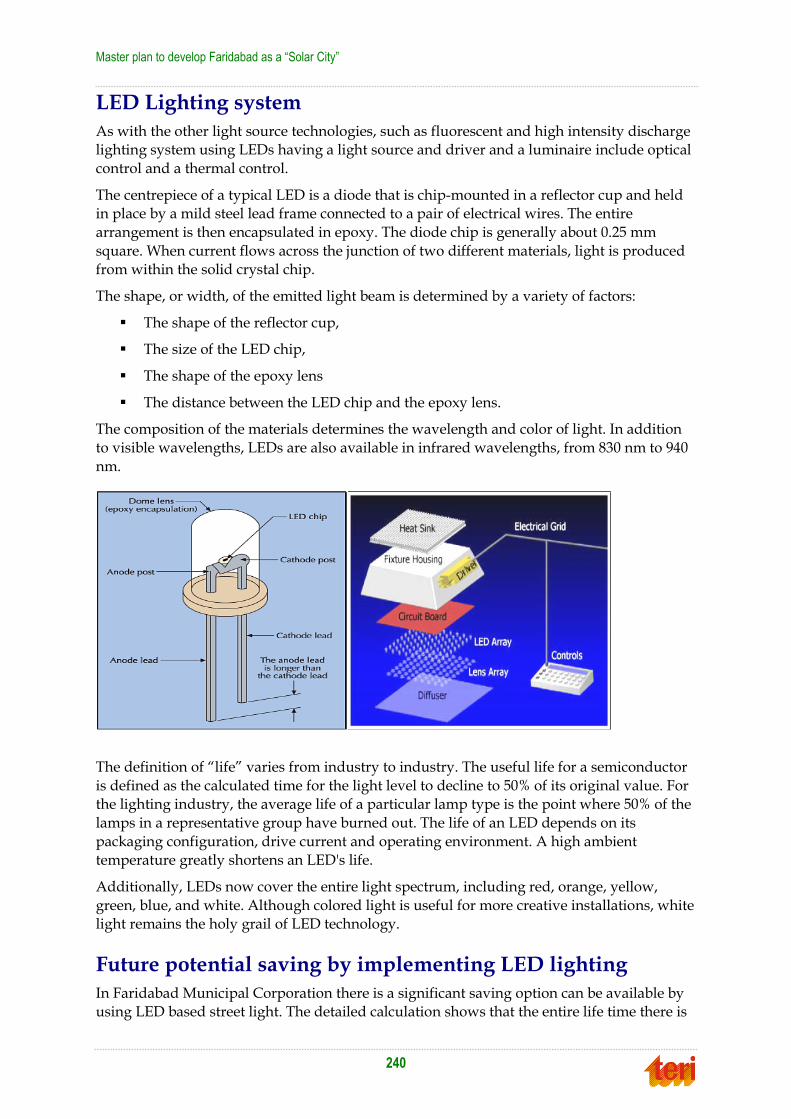
Master plan to develop Faridabad as a “Solar City”
240
LED Lighting system
As with the other light source technologies, such as fluorescent and high intensity discharge lighting system using LEDs having a light source and driver and a luminaire include optical
control and a thermal control.
The centrepiece of a typical LED is a diode that is chip-mounted in a reflector cup and held in place by a mild steel lead frame connected to a pair of electrical wires. The entire
arrangement is then encapsulated in epoxy. The diode chip is generally about 0.25 mm
square. When current flows across the junction of two different materials, light is produced from within the solid crystal chip.
The shape, or width, of the emitted light beam is determined by a variety of factors:
The shape of the reflector cup,
The size of the LED chip,
The shape of the epoxy lens
The distance between the LED chip and the epoxy lens.
The composition of the materials determines the wavelength and color of light. In addition
to visible wavelengths, LEDs are also available in infrared wavelengths, from 830 nm to 940
nm.
The definition of “life” varies from industry to industry. The useful life for a semiconductor
is defined as the calculated time for the light level to decline to 50% of its original value. For the lighting industry, the average life of a particular lamp type is the point where 50% of the
lamps in a representative group have burned out. The life of an LED depends on its
packaging configuration, drive current and operating environment. A high ambient
temperature greatly shortens an LED's life.
Additionally, LEDs now cover the entire light spectrum, including red, orange, yellow,
green, blue, and white. Although colored light is useful for more creative installations, white light remains the holy grail of LED technology.
Future potential saving by implementing LED lighting
In Faridabad Municipal Corporation there is a significant saving option can be available by using LED based street light. The detailed calculation shows that the entire life time there is
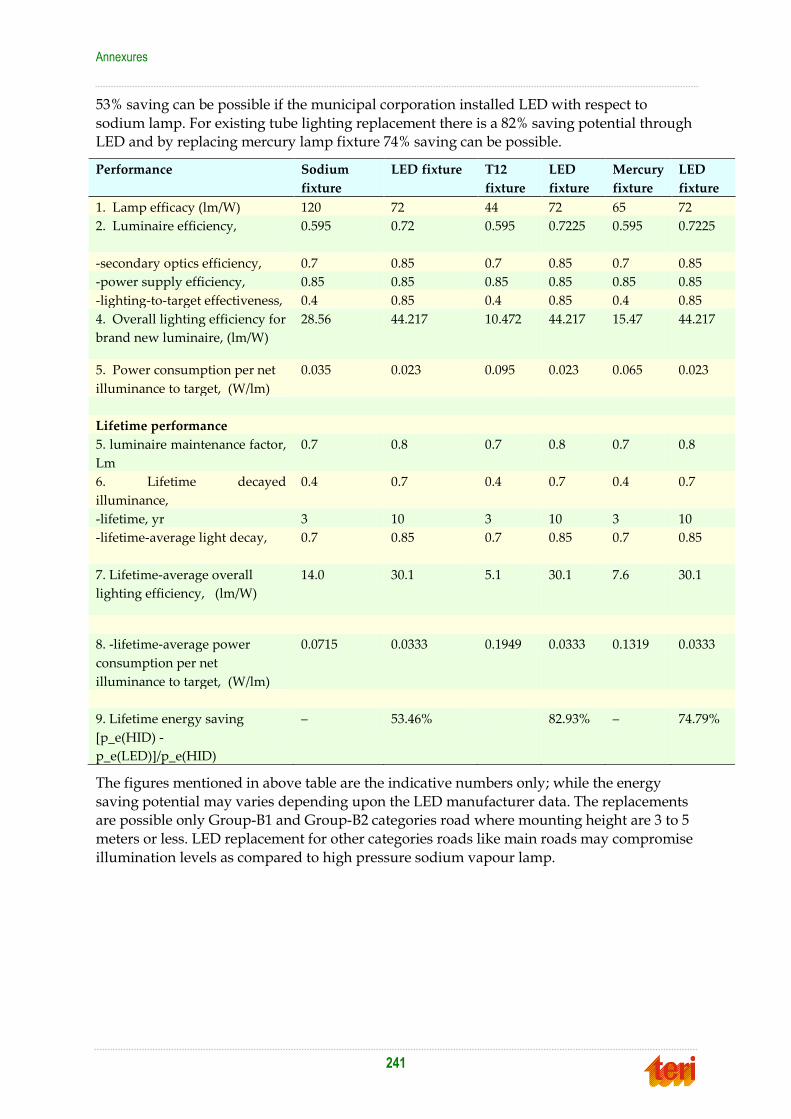
Annexures
241
53% saving can be possible if the municipal corporation installed LED with respect to
sodium lamp. For existing tube lighting replacement there is a 82% saving potential through LED and by replacing mercury lamp fixture 74% saving can be possible.
Performance
Sodium
fixture
LED fixture T12
fixture
LED
fixture
Mercury
fixture
LED
fixture
1. Lamp efficacy (lm/W) 120 72 44 72 65 72
2. Luminaire efficiency,
0.595 0.72 0.595 0.7225 0.595 0.7225
-secondary optics efficiency, 0.7 0.85 0.7 0.85 0.7 0.85
-power supply efficiency, 0.85 0.85 0.85 0.85 0.85 0.85
-lighting-to-target effectiveness, 0.4 0.85 0.4 0.85 0.4 0.85
4. Overall lighting efficiency for
brand new luminaire, (lm/W)
28.56 44.217 10.472 44.217 15.47 44.217
5. Power consumption per net
illuminance to target, (W/lm)
0.035 0.023 0.095 0.023 0.065 0.023
Lifetime performance
5. luminaire maintenance factor,
Lm
0.7 0.8 0.7 0.8 0.7 0.8
6. Lifetime decayed
illuminance,
0.4 0.7 0.4 0.7 0.4 0.7
-lifetime, yr 3 10 3 10 3 10
-lifetime-average light decay,
0.7 0.85 0.7 0.85 0.7 0.85
7. Lifetime-average overall
lighting efficiency, (lm/W)
14.0 30.1 5.1 30.1 7.6 30.1
8. -lifetime-average power
consumption per net
illuminance to target, (W/lm)
0.0715 0.0333 0.1949 0.0333 0.1319 0.0333
9. Lifetime energy saving
[p_e(HID) -
p_e(LED)]/p_e(HID)
– 53.46% 82.93% – 74.79%
The figures mentioned in above table are the indicative numbers only; while the energy
saving potential may varies depending upon the LED manufacturer data. The replacements are possible only Group-B1 and Group-B2 categories road where mounting height are 3 to 5
meters or less. LED replacement for other categories roads like main roads may compromise
illumination levels as compared to high pressure sodium vapour lamp.


243
AAnnnneexxuurree 1122 TTeecchhnniiccaall ssppeecciiffiiccaattiioonnss ooff eenneerrggyy
eeffffiicciieenntt lliigghhttiinngg

Master plan to develop Faridabad as a “Solar City”
244

Annexures
245

Master plan to develop Faridabad as a “Solar City”
246

Annexures
247

Master plan to develop Faridabad as a “Solar City”
248

Annexures
249
Master plan to develop Faridabad as a “Solar City”
250

Annexures
251

Master plan to develop Faridabad as a “Solar City”
252
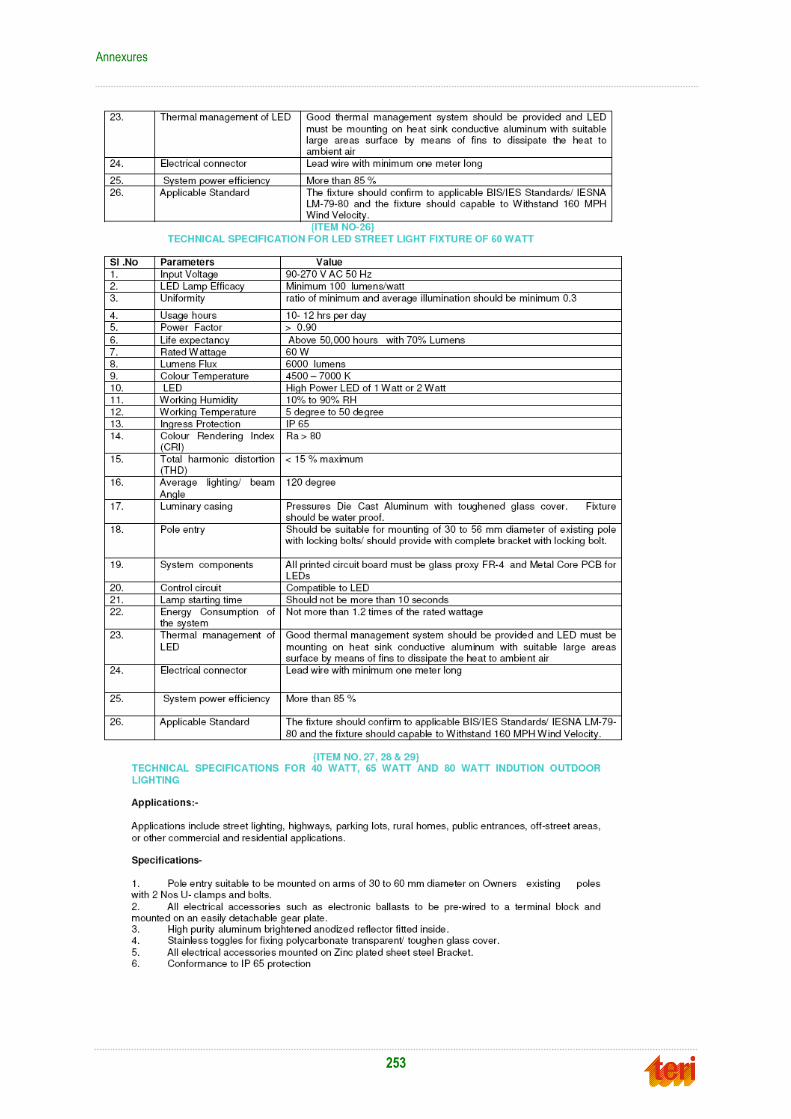
Annexures
253

Master plan to develop Faridabad as a “Solar City”
254

255
AAnnnneexxuurree 1133 TTeecchhnniiccaall ssppeecciiffiiccaattiioonnss aanndd
aannaallyyssiiss ooff IInndduuccttiioonn llaammppss
With increasing cost of energy, developers and scientists are indulging in devised new
technologies and methods to reduce the consumption of various energy consuming devices.
In the domain of lighting, with the passage of time many technologies have come across which consumes less energy, while still providing required energy level.
The most common form of lighting used for commercial and industrial application is High
Intensity Discharge lighting technologies such as Mercury Vapour (MV), High Pressure Sodium (HPS) and Metal Halide (MH) lamps. The HPS and LPS which are (still) used,
although have fallen out of favor due to their monochromatic orange light output and bad
color rendering index. Figure below shows list of different lighting technologies and the
preference of use1.
Due to various issues and enhanced R&D activities, induction lamp technology has found its way for commercial use in various lighting applications.
Induction Lamp technology
Induction lighting is based on the well-known principles of induction and light generation via a gas discharge. Induction is the energy transportation through magnetism. Practical
examples are transformers, which consist of ferrite cores or rings with primary coils and
secondary rings via the mercury vapour inside the lamps. An alternative current (Ip) through the primary coil induces an alternative magnetic field in the ferrite core or coil. The
alternative magnetic field in turn induces an alternative secondary current in the secondary
coil or ring (Is). The efficiency of the lamp is proportional to the operating frequency of the driving alternative current. The mercury vapour inside the induction lamp can be regarded
as the secondary coil of the system and the induced current circulate through the
vapour causing acceleration of free electrons, which collide with the mercury atoms and bring electrons to a higher orbit. Electrons from these excited atoms fall back from this
higher energy state to the lower stable level and consequently emit ultraviolet radiations.
1 http://promise.energyprojects.net/links/Information%20Brochure%20Suppliers%20Final.pdf

Master plan to develop Faridabad as a “Solar City”
256
The UV radiations interact with the fluorescent powder coated inside the lamp and convert
to visible light1.
Magnetic induction lamps require correctly matched electronic ballast for proper operation.
The ballast takes the incoming AC power and rectifies it to DC. Solid state circuitry then
converts this DC current to a very high frequency which is between 2.65 MHz and 13.6 MHz depending on the lamp design. This high frequency is fed to the induction coil wrapping
around the ferrite core of the lamp inductor. The high frequency creates a strong magnetic
field in the inductor, which couples the energy through the glass wall and into the mercury atoms inside the tube or lamp.
The ballasts contain control circuitry which regulates the frequency and current to the
induction coil to insure stable operation of the lamp. In addition, the ballasts have a circuit which produces a large “start pulse” to initially ionize the mercury atoms and thereby start
the lamp. Induction lamps do not start at 100% output as it take a few seconds for the
amalgam in the lamp to heat-up and release mercury atoms after the lamp starts. The lamp starts between 75% and 85% of output and warms up to full almost imperceptibly within a
minute or two.
Other factors
Power Consumption – Energy savings can extremely impact operation costs. Savings can be
delivered through the installation of new efficient Induction Lamp technologies which
consume only 50% +/- of what the conventional lighting system consumes. All existing lamps and fixtures should be considered for replacement, retrofit or upgrade to maximize
energy savings.
Lifetime – Durable Induction Lamps last 5 to 10 times longer than conventional light sources and exceed 100,000 hours of rated lifetime (that is over 22 years of 12 hours of ignition per
day). Thus the re-lamping costs can be cut it to a fraction of what is currently being spent on
maintenance costs or virtually eliminated. Those costs also apply to purchasing administration, logistics, warehousing, disposal etc.
Maintenance – The cost occurring during temporary suspension of operation because of
lighting system maintenance will not be simple to calculate. The overhead costs related with maintenance include costs of salary, training, logistics and insurance could be calculable.
Other costs if you are currently contracting out the maintenance include the cost of changing
out ballasts and lamps when needed, especially in those hard to reach locations. However, the total maintenance costs will often exceed energy savings. Induction Lamps can help
users minimize maintenance costs in terms of its longer lifetime.
Wearing Parts – Electrode-less design of Induction Lamps can completely avoid the damage of delicate components such as filaments or electrodes that are the primary causes of lamp
failure in conventional light sources including HID, Halogen, Incandescent and Fluorescent
lamps. Replacement for induction Lamps is therefore not required at all after vibration, accidental collision or weather storms and longtime of ignition as well.
Heat – Less heat generating from Induction Lamps can reduce a lot of cost including lighting
fixture maintenance costs and HVAC operation costs from ambient inefficient heat loss.
1 Induction Lamps; Weblink - http://www.econoluxindustries.com/Library/EconoLux%20Induction%20Lamps%20Vs%20HID%20Lamps.pdf; accessed 27. 06. 2010

Annexures
257
Color Perceived – Good color rendering index (CRI) is crucial to visibility, safety and
comfort. Induction Lamps having a natural color of light can illuminate much better than most conventional light sources. Because light color can greatly change appearance,
aesthetics and attractive qualities color options should be an important factor when
considering and evaluating light quality.
Hot Strike – Induction Lamps have good performance of instant re-strike without warming
up which will ensure that there isn't any additional utility costs from temporary suspensions
of power supply. This all will ensure safety and security for those applications where instant re-strike is required.
Cold Ignition – Induction Lamps can be ignited even under much colder circumstances with
temperatures lowering to -40 degrees C/-20 degrees F, thus being a preferable light source for cold storages and outdoor lighting applications in cold areas.
Flicker and Glare - Without flicker and glare Induction Lamps can dramatically improve
productivity, readability, eyesight and headaches when comparing with conventional light sources including HID and Fluorescent Lamps that generate much flicker.
Noise- With a very quiet and silent design Induction Lamps can make users comfortable
without a humming or buzzing.
Environmentally Safe – In Terms of higher energy efficiency Induction Lamps can be
adapted to promote energy saving policies and utilize the many Utility Saving Rebate
Programs that are available.
EMC – Induction Lamps are the best Lighting Products available for businesses when
completing a lighting project, since it can bring customers many benefits and a very high
ROI with less than 3 years. Induction Lamps are an exceptional cost –effective lighting solution that can replace the conventional lights sources.
Induction Comparison Chart1
Induction Lamps vs. H.I.D. Lamps
Comparison Induction Metal Halide High Pressure
Sodium
Warranty Compact: 5
years
None None
Life Hours Compact:
60,000
Separate:
100,000
6,000~20,000 24,000
Energy Saving
Efficiency
Excellent Lower Lower
Lumen Efficacy Photopic
Efficacy: 150
Plm/W
(Plm: Pupil
Lumen)
Traditional
Efficacy: 80
Lm/W
Photopic Efficacy:
110 Plm/W
(Plm: Pupil Lumen)
Traditional Efficacy:
75 Lm/W
Photopic Efficacy:
90 Plm/W
(Plm: Pupil
Lumen)
Traditional
Efficacy: 120
Lm/W
1 Comparison chart; Web link - http://www.imsasafety.org/journal/so04/7.pdf; accessed on 27. 06. 2010

Master plan to develop Faridabad as a “Solar City”
258
Induction Lamps vs. H.I.D. Lamps
Comparison Induction Metal Halide High Pressure
Sodium
Lumen
Depreciation
Rate %
5% @ 2,000
Hours
40% @ 2,000 Hours 30% @ 2,000 Hours
Lamp Operating
Temperature
Lower, <80°F
Reduces A/C
cost
Higher, >300° F
Increased A/C cost
Higher, >350° F
Increased A/C cost
CRI >80 (Ra) 65~80 (Ra) 60 (Ra)
Re-strike Instant Needs up to 10~15
minutes
Needs up to 10~15
minutes
Flicker None Much Much
Glare None Much Much
Environmental
Safety
Low mercury
No lamp waste
in 10 years
Contains mercury
Concern with much
lamp waste over 10
years
Contains mercury
Concern with
much lamp waste
over 10 years
Cost Comparison
S.No Quantity
(a)
Light
Source
(b)
kWh
consumption/hr
(c)
Working
Hrs/day
(d)
Working
days/yr
(e)
kWh
consumption/yr
(f=c*d*e)
Cost
per
kWh
(g)
Energy
cost/yr
(h=f*g)
I 1 400 W
Hight
Pressure
Mercury
Vapour
Lamp
0.44 8 365 1284.8 6 7708.8
II 1 165 W
Induction
Lamp
0.15 8 365 438 6 2628
Saving achieved on per energy cost per year: 5080.8
1) Cost of Luminary, Ballast & Dome Fixture
A Cost of 165 W LVD Induction Dome light 13275
B Cost of 400W mercury dome light 4500
Extra paid by the customer 8775
2) Payback period (excess paid)/(saving achieved per year) in Months 21
3) Warrantee period (Pending warrantee from 3yrs*saving per month) 6467.4
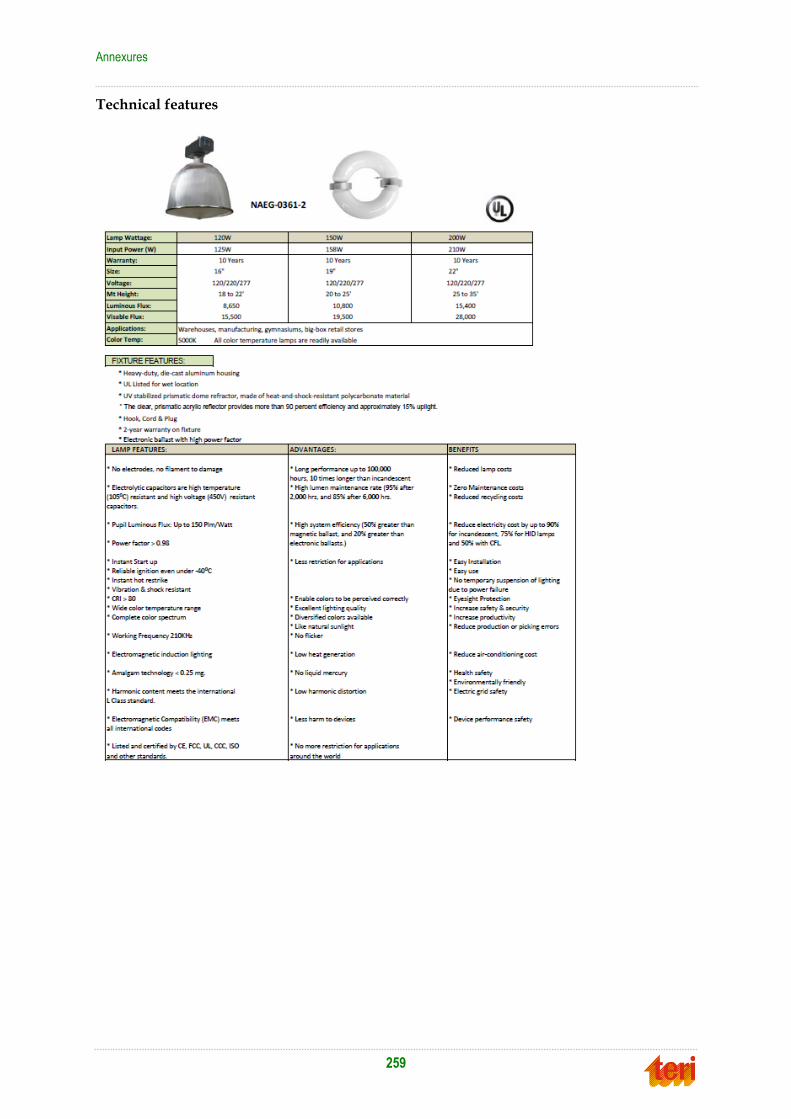
Annexures
259
Technical features

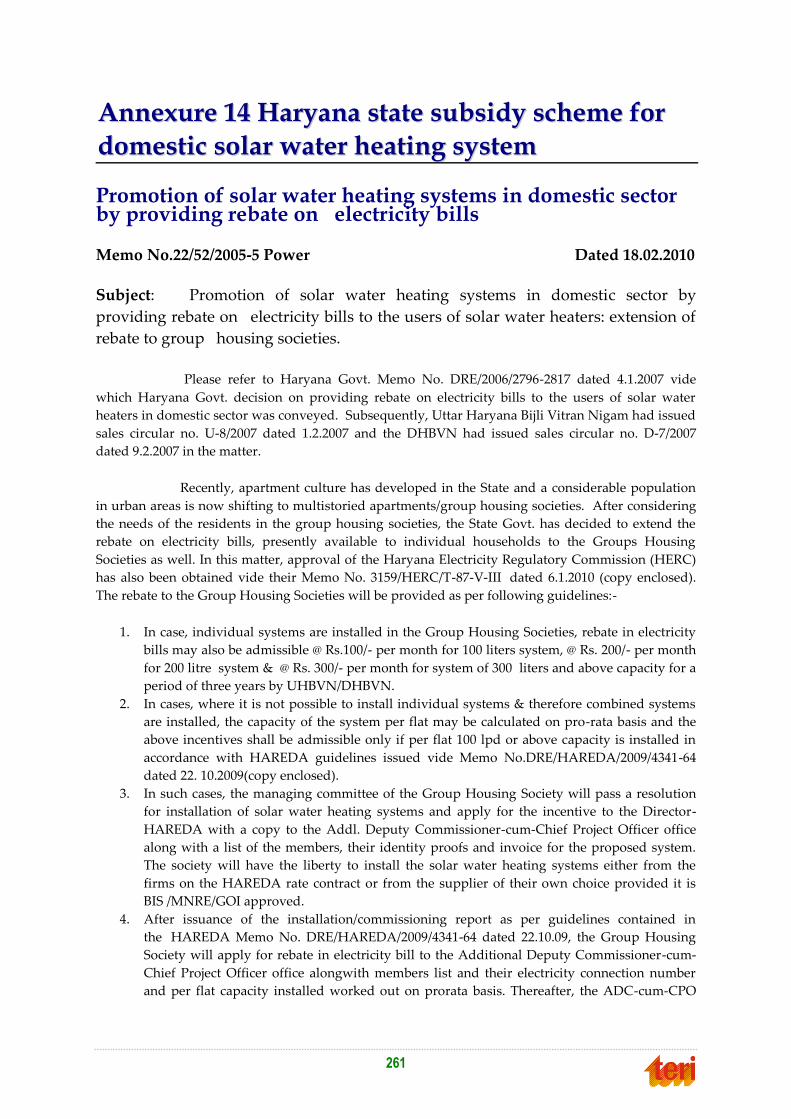
261
AAnnnneexxuurree 1144 HHaarryyaannaa ssttaattee ssuubbssiiddyy sscchheemmee ffoorr
ddoommeessttiicc ssoollaarr wwaatteerr hheeaattiinngg ssyysstteemm
Promotion of solar water heating systems in domestic sector by providing rebate on electricity bills
Memo No.22/52/2005-5 Power Dated 18.02.2010
Subject: Promotion of solar water heating systems in domestic sector by
providing rebate on electricity bills to the users of solar water heaters: extension of
rebate to group housing societies.
Please refer to Haryana Govt. Memo No. DRE/2006/2796-2817 dated 4.1.2007 vide
which Haryana Govt. decision on providing rebate on electricity bills to the users of solar water
heaters in domestic sector was conveyed. Subsequently, Uttar Haryana Bijli Vitran Nigam had issued
sales circular no. U-8/2007 dated 1.2.2007 and the DHBVN had issued sales circular no. D-7/2007
dated 9.2.2007 in the matter.
Recently, apartment culture has developed in the State and a considerable population
in urban areas is now shifting to multistoried apartments/group housing societies. After considering
the needs of the residents in the group housing societies, the State Govt. has decided to extend the
rebate on electricity bills, presently available to individual households to the Groups Housing
Societies as well. In this matter, approval of the Haryana Electricity Regulatory Commission (HERC)
has also been obtained vide their Memo No. 3159/HERC/T-87-V-III dated 6.1.2010 (copy enclosed).
The rebate to the Group Housing Societies will be provided as per following guidelines:-
1. In case, individual systems are installed in the Group Housing Societies, rebate in electricity
bills may also be admissible @ Rs.100/- per month for 100 liters system, @ Rs. 200/- per month
for 200 litre system & @ Rs. 300/- per month for system of 300 liters and above capacity for a
period of three years by UHBVN/DHBVN.
2. In cases, where it is not possible to install individual systems & therefore combined systems
are installed, the capacity of the system per flat may be calculated on pro-rata basis and the
above incentives shall be admissible only if per flat 100 lpd or above capacity is installed in
accordance with HAREDA guidelines issued vide Memo No.DRE/HAREDA/2009/4341-64
dated 22. 10.2009(copy enclosed).
3. In such cases, the managing committee of the Group Housing Society will pass a resolution
for installation of solar water heating systems and apply for the incentive to the Director-
HAREDA with a copy to the Addl. Deputy Commissioner-cum-Chief Project Officer office
along with a list of the members, their identity proofs and invoice for the proposed system.
The society will have the liberty to install the solar water heating systems either from the
firms on the HAREDA rate contract or from the supplier of their own choice provided it is
BIS /MNRE/GOI approved.
4. After issuance of the installation/commissioning report as per guidelines contained in
the HAREDA Memo No. DRE/HAREDA/2009/4341-64 dated 22.10.09, the Group Housing
Society will apply for rebate in electricity bill to the Additional Deputy Commissioner-cum-
Chief Project Officer office alongwith members list and their electricity connection number
and per flat capacity installed worked out on prorata basis. Thereafter, the ADC-cum-CPO
Master plan to develop Faridabad as a “Solar City”
262
will forward the application to the power utilities for grant of rebate under intimation to the
Director, HAREDA.
You are, therefore, requested to issue necessary order/instruction to operation circles under your
control to provide the above said rebate to the consumers in the electricity bills. A copy of the action
taken in this regard may also be sent to this office for onward appraisal to the State Govt.
Sd/-
Under Secretary(RE)
for Financial Commissioner & Principal Secretary
to Govt. Haryana, Renewable Energy Deptt. Chandigarh
Continuation of state subsidy on domestic solar water heating system for the year 2011-12
The Haryana Government continued it‟s subsidy for the domestic solar water heating
system installations in the state vide following order
From
The Director
Renewable Energy Deptt.,
Haryana, SCO 48, Sector 26,
Chandigarh.
To
The Additional Deputy Commissioner-cum-
Chief Project Officer,
District Rural & Development Agency,
Ambala, Bhiwani, Faridabad, Fatehbad, Gurgaon, Hisar,
Jhajjar, Jind, Kaithal, Karnal, Kurukeshtra, Mewat, Narnaul,
Panchkula, Panipat, Palwal, Rewari, Rohtak, Sirsa, Sonepat, Y. Nagar.
Memo No.DRE/2011/2038-58
Dated Chandigarh, the 29.08.2011.
SUBJECT: CONTINUATION OF STATE SUBSIDY ON DOMESTIC SOLAR WATER
HEATING SYSTEM FOR THE YEAR 2011-12

Annexures
263
Please refer to this office letter no.2098-2118 dated 30.06.2011 vide which the subsidy on
domestic Solar Water Heating System was withdrawn w.e.f. 30.06.2011.
In view of the availability of state fund with this office for installation of Solar Water
Heating System in domestic sector for the year 2011-12, the State Government has decided to
continue the State Subsidy on installation of Solar Water Heating System in domestic sector which was earlier withdrawn w.e.f. 30.06.2011.
Accordingly, I am directed to inform that the State Subsidy on installation of Solar Water
Heating System in domestic sector will be available on and after 01.07.2011. The subsidy pattern which will be enforce w.e.f. 01.07.2011 during the year 2011-12 is as under:
1. @ Rs. 2000/- per sq. mtr. for FPC subject of maximum 4 Sq. meter of the collector area of
FPC.
2. @ Rs. 1000/- per sq. mtr. for ETC limited to Rs.3000/- or 200 lpd capacity.
It is further informed that in addition to the above State subsidy, the MNRE, GOI capital
subsidy @ Rs.3300/- per sq. mtr. in case of FPC based systems and @ Rs.3000/- per sq. mtr. in case of ETC based systems limited to 30% of the system cost shall also be admissible on
installation of Solar Water Heating System in domestic sector.
It is requested that the above change in subsidy pattern may be widely publicized for compliance by all concerned Project Officer
for Director,
Renewable Energy Deptt.,
Haryana, Chandigarh


265
AAnnnneexxuurree 1155 LLiisstt ooff iiddeennttiiffiieedd ggoovveerrnnmmeenntt
bbuuiillddiinnggss ffoorr iinnssttaallllaattiioonn ooff RREE ssyysstteemmss


267
AAnnnneexxuurree 1166 TTeecchhnniiccaall ssppeecciiffiiccaattiioonnss ooff ssoollaarr
wwaatteerr ssoollaarr wwaatteerr hheeaattiinngg ssyysstteemmss

Master plan to develop Faridabad as a “Solar City”
268
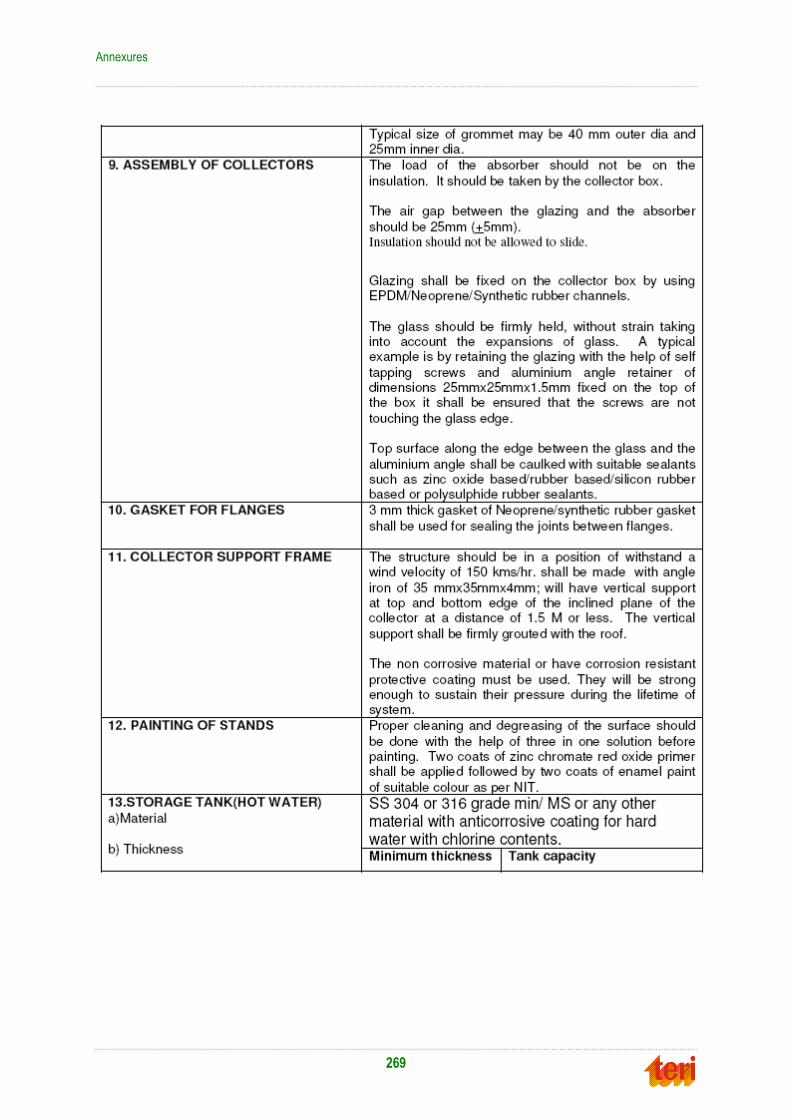
Annexures
269
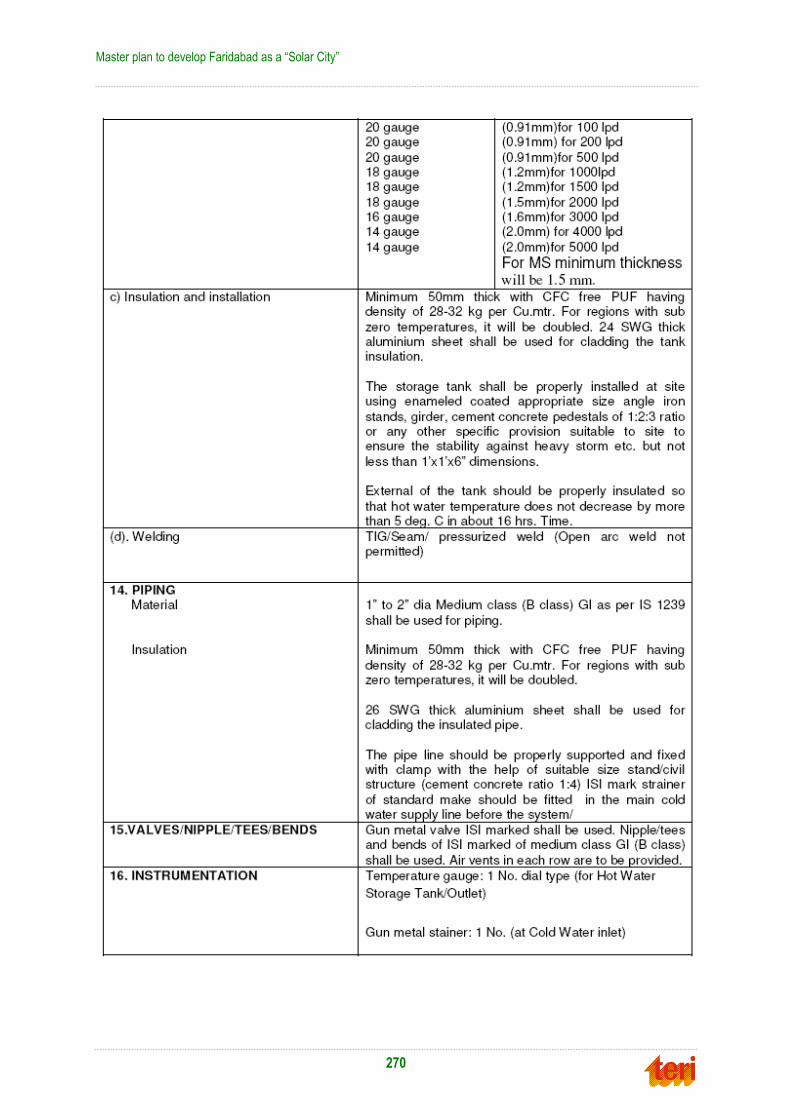
Master plan to develop Faridabad as a “Solar City”
270
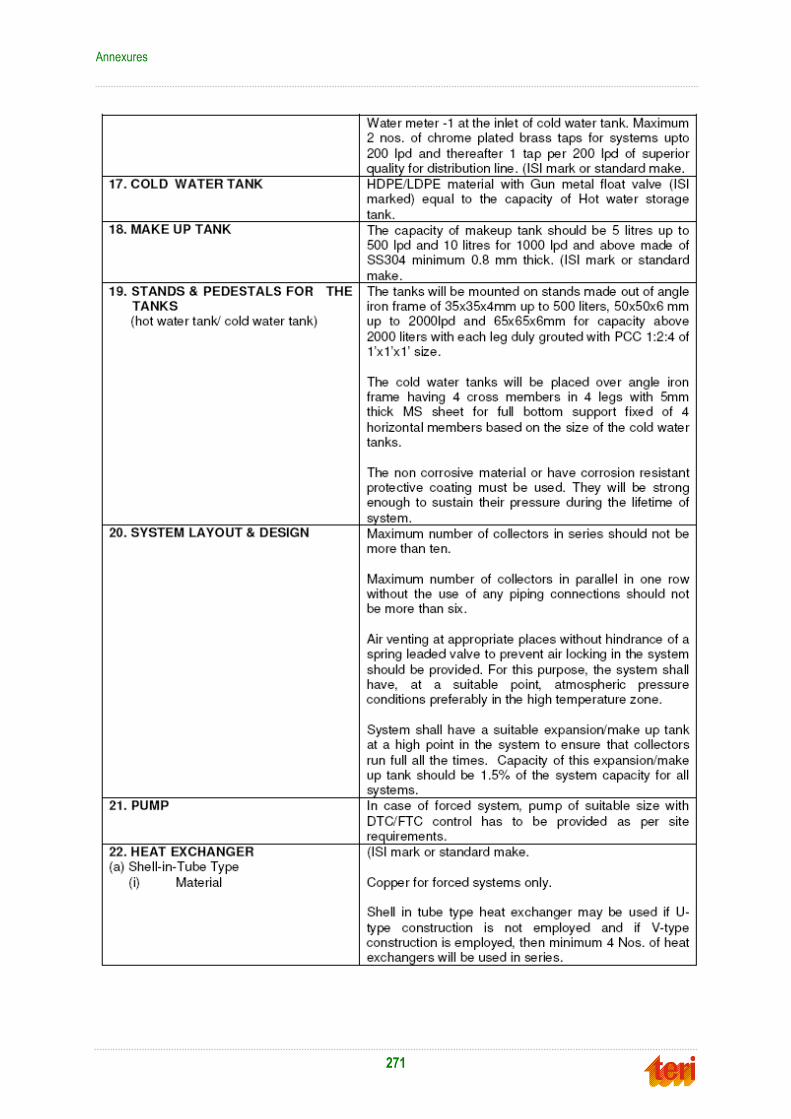
Annexures
271

Master plan to develop Faridabad as a “Solar City”
272

Annexures
273

Master plan to develop Faridabad as a “Solar City”
274

Annexures
275


277
AAnnnneexxuurree 1177 PPrrooggrraamm oonn OOffff--ggrriidd aanndd
DDeecceennttrraalliisseedd SSoollaarr AApppplliiccaattiioonnss

Master plan to develop Faridabad as a “Solar City”
278
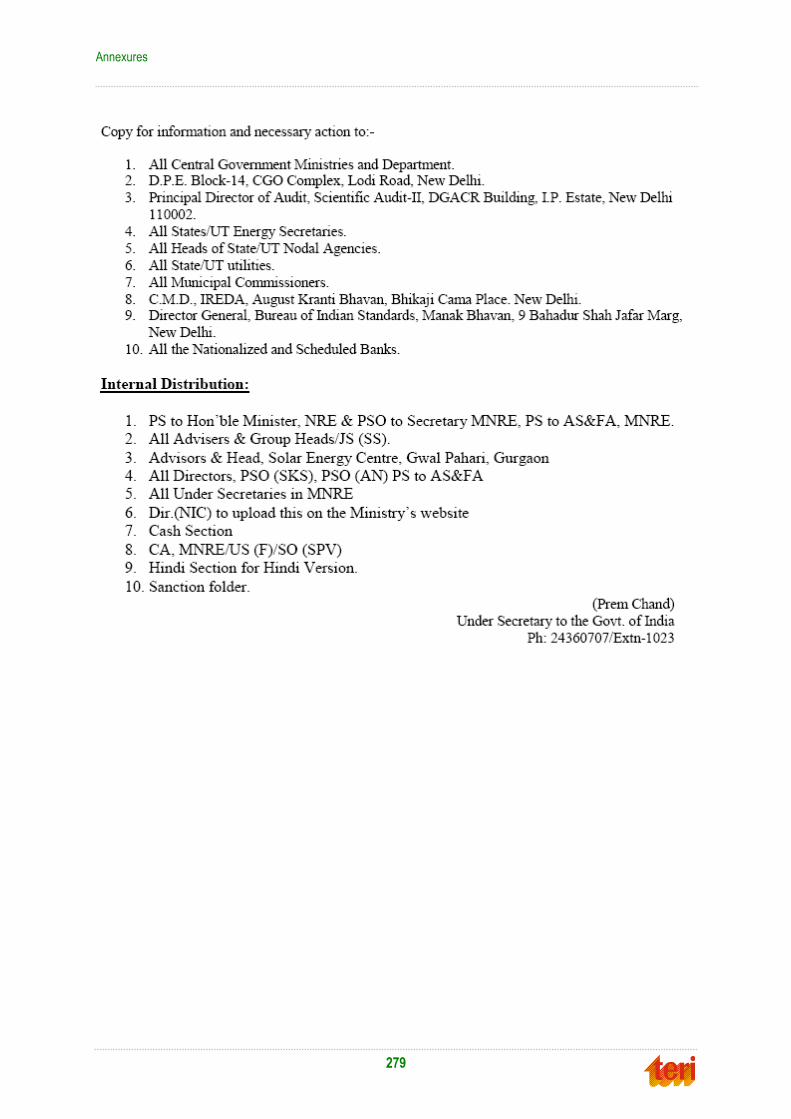
Annexures
279

Master plan to develop Faridabad as a “Solar City”
280

Annexures
281

Master plan to develop Faridabad as a “Solar City”
282

Annexures
283

Master plan to develop Faridabad as a “Solar City”
284

Annexures
285
Master plan to develop Faridabad as a “Solar City”
286

Annexures
287

Master plan to develop Faridabad as a “Solar City”
288

Annexures
289
Master plan to develop Faridabad as a “Solar City”
290
Annexures
291
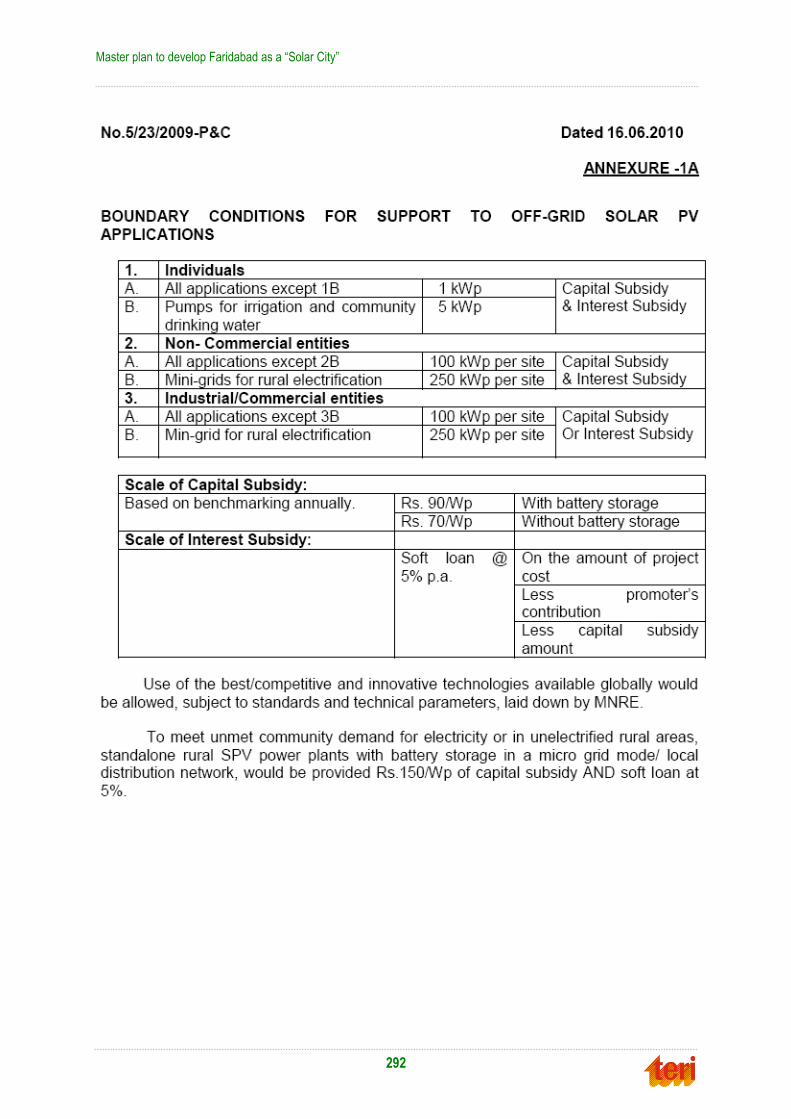
Master plan to develop Faridabad as a “Solar City”
292

Annexures
293

Master plan to develop Faridabad as a “Solar City”
294

Annexures
295

Master plan to develop Faridabad as a “Solar City”
296

Annexures
297

Master plan to develop Faridabad as a “Solar City”
298
Annexures
299
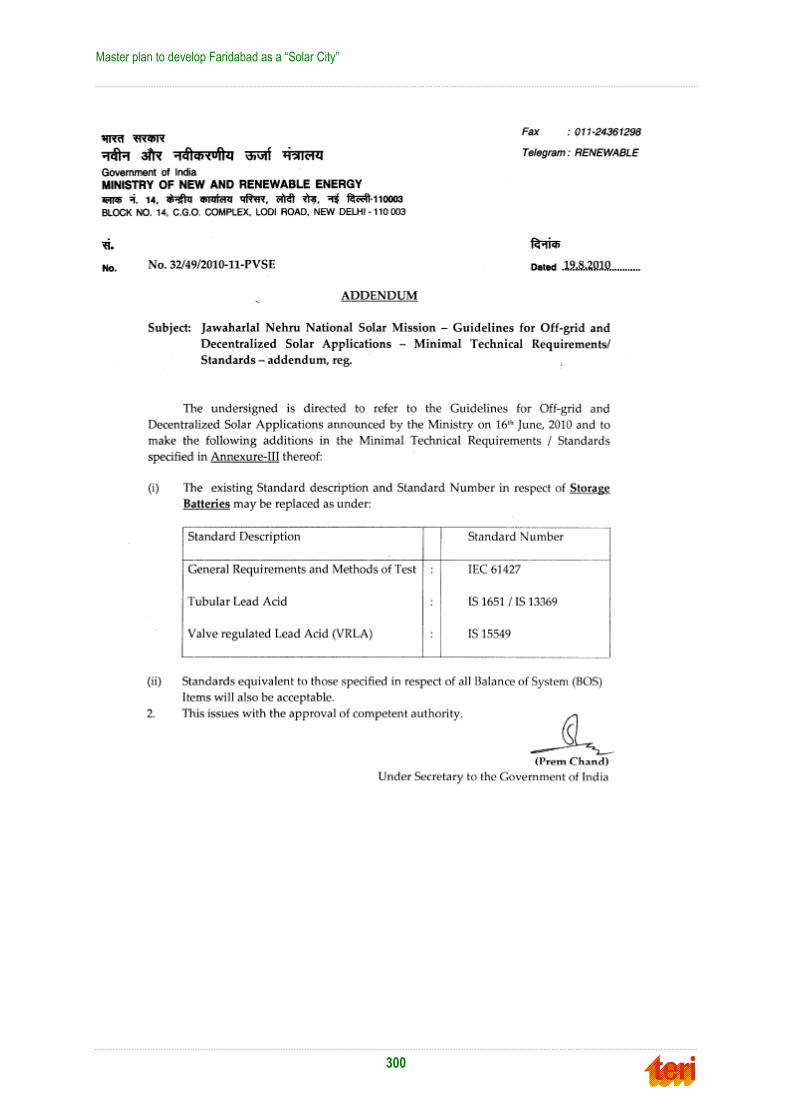
Master plan to develop Faridabad as a “Solar City”
300

301
AAnnnneexxuurree 1188 RREETTSSccrreeeenn WWoorrkksshheeeettss ffoorr SSPPVV
bbaasseedd ppoowweerr ggeenneerraattiioonn

Master plan to develop Faridabad as a “Solar City”
302

Annexures
303


305
AAnnnneexxuurree 1199 SSiinnggllee lliinnee ddiiaaggrraamm ooff aa ssoollaarr pphhoottoovvoollttaaiicc ppoowweerr ppllaanntt
50 Hz
BUS BAR
230V, 1ph,
AUXILIARY
LOAD
LOAD 1
LOAD 2
LOAD 3 SOLAR PV
ARRAY
ACDB
DCDB
CHARGE
CONTROLLER AJB
PSU
AUXILIARY
LOAD
LOAD 1
LOAD 2
LOAD 3
BATTERY BANK
120V DC
P N
120V DC


307
AAnnnneexxuurree 2200 TTeecchhnniiccaall ssppeecciiffiiccaattiioonnss ooff ssoollaarr
hhyybbrriidd iinnvveerrtteerr


309
AAnnnneexxuurree 2211 BBuuddggeett eessttiimmaatteess ffoorr iimmpplleemmeennttaattiioonn ooff ddiiffffeerreenntt aaccttiivviittiieess ttoo
mmaakkee FFaarriiddaabbaadd aass aa SSoollaarr CCiittyy
Budget for Faridabad solar city master plan implementation
Sector Proposed
measures
Targets Role of the
Solar City
Cell/MCF/Farid
abad
Administration
Budget for solar city plan implementation (Rs)
2010-11 2011-12 2012-13 2013-14 2014-15 2015-16 2016-17 2017-18 2018-19
Residential
Sector
Solar water
heating systems
201000 lit per
day capcity
systems in
2010-11.
Increase of
2.72% in
installed
capacity
every year
1.Promotion and
awareness
creation
2.Providing
subsidy support
in initial phase (
first 100000 lit
capacity
systems
6030000 12066000 12072000 18117000 18126000 24180000 24192000 24204000 12108000
Promote use of
efficient LPG
stoves and
efficient
cooking devices
such as
microwaves
Achieve 10%
reduction in
projected
LPG
consumption
as compared
to BAU
Awareness
creation
500000 500000 500000 500000 500000 500000
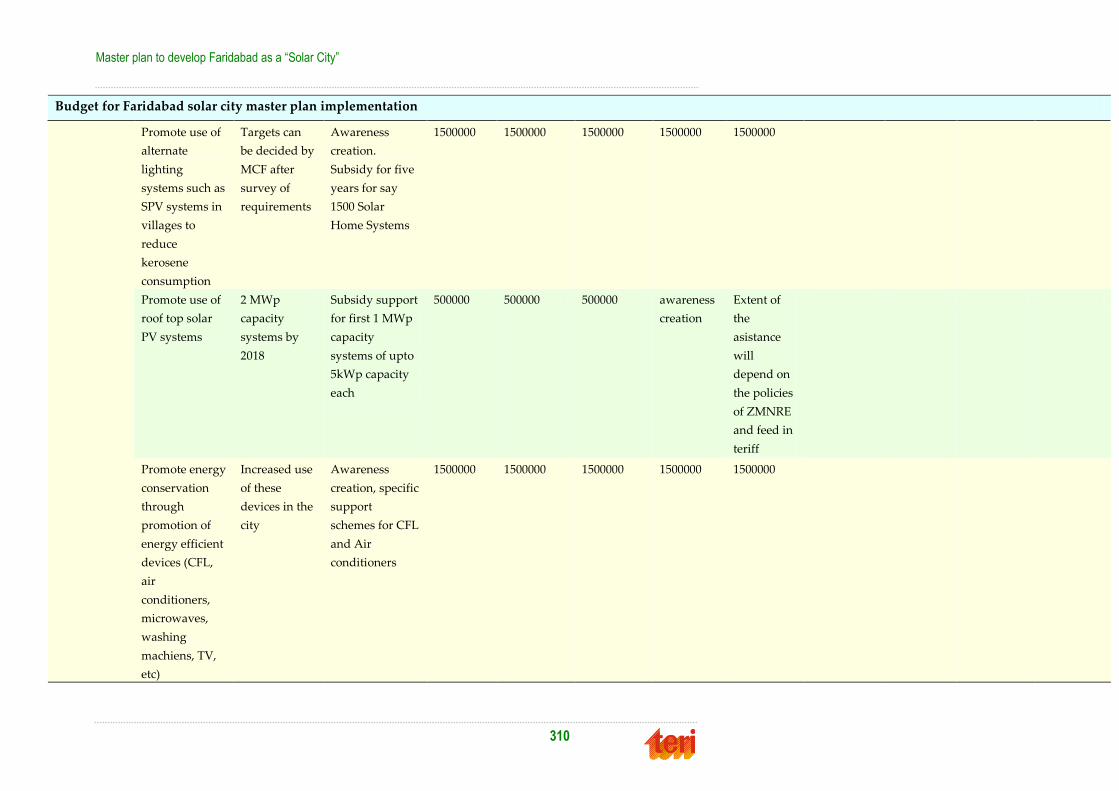
Master plan to develop Faridabad as a “Solar City”
310
Budget for Faridabad solar city master plan implementation
Promote use of
alternate
lighting
systems such as
SPV systems in
villages to
reduce
kerosene
consumption
Targets can
be decided by
MCF after
survey of
requirements
Awareness
creation.
Subsidy for five
years for say
1500 Solar
Home Systems
1500000 1500000 1500000 1500000 1500000
Promote use of
roof top solar
PV systems
2 MWp
capacity
systems by
2018
Subsidy support
for first 1 MWp
capacity
systems of upto
5kWp capacity
each
500000 500000 500000 awareness
creation
Extent of
the
asistance
will
depend on
the policies
of ZMNRE
and feed in
teriff
Promote energy
conservation
through
promotion of
energy efficient
devices (CFL,
air
conditioners,
microwaves,
washing
machiens, TV,
etc)
Increased use
of these
devices in the
city
Awareness
creation, specific
support
schemes for CFL
and Air
conditioners
1500000 1500000 1500000 1500000 1500000

Annexures
311
Budget for Faridabad solar city master plan implementation
Commercial/
industrial
sector
Promotion of
energy
efficiency
through
awareness
creation
achieve 10%
share of
energy
efficient
devices in the
city
Promotional
schemes and
awareness
creation
2500000 2500000 2500000 2500000 2500000
Promotion of
solar water
heating systems
in industries,
hotels, hostels
etc
100000 lit per
day capacity
systems in
four years
Subsidy and
aawareness
creation ,
providing soft
loans /
reduction in
electricity bills/
cess for others
562500 562500 562500 562500
Promotion of
energy efficient
green buildings
Atleast 50%
of the new
building are
certified
under GRIHA
or similar
rating
systems
Implementation
of Schemes
through
facilitation and
cost sharing
schemes
2500000 2500000 2500000 2500000 2500000
Promotion of
roof top
systems in
commercial
/government,
instituional and
industrial
buildings
Total 2 MWp
capacity solar
systems
Financil support
to the utility for
purchase of
power at higher
rate/
preferential
tariff
10000000 20000000 20000000 50000000 50000000 50000000 50000000 50000000 100000000

Master plan to develop Faridabad as a “Solar City”
312
Budget for Faridabad solar city master plan implementation
Municipal
Sector
Street
Lighting
Replacement of
existing ballasts
by efficient
ballasts in all
street lights
100%
replacement
of ballasts
Investments/
financial
support to
Municipal
Corporation
Faridabad
3040000 3040000 3040000 3040000 3040000 3040000
Water
Pumping
Replacement of
booster water
pumps in
drinking water
schemes with
energy efficient
pumps
Replacement
of water
pumps of
each 10 HP
capacity
Investments/
financial
support to CMC
155000 155000 155000 155000 155000 155000 80000 80000
Power
generation
Power Plant
based on
Municipal Solid
Waste
1 MWp
Power Plant
based on
Municipal
Solid Waste
Subsidy support
/ Capital
invetsments /
preferential
tariff / Soft loans
75000000
Solar PV power
plant
5 MWp
power plants
in phased
manner
Subsidy support
/ Capital
invetsments /
preferential
tariff / Soft loans
85000000 170000000 170000000
Promotion of
kitchen waste
based biogas
plants for
energy
Atleast 1
plant by year
2012, 3 plants
by 2015 and 5
plants by year
Awareness
creation,
feasibility and
subsidy
supports
2400000 2400000 2400000 2400000 2400000

Annexures
313
Budget for Faridabad solar city master plan implementation
generation in
housing
societies
2018 through
MNRE/state
government
Awareness
creation and
study
Establishemnt
of 'Faridabad
Solar City Cell'
To set up
Solar City
Cell to
develop,
implement
and monitor
various
schemes, to
coordinate
the
development
of
Chandigarh
as Model
Solar City
Funding,
creation and
establishment of
the cell and
monitor its
working.
2500000 2500000 2500000 2500000 2500000 2500000 2500000 2500000 2500000
Awarenes
creation fo all
schemes,
development of
solar city park
and exhibitions
Awareness
creations
Develop and
fund awareness
creation/promot
ional schemes
Interaction
meet with
stakeholders
that include
One
interaction
meet to
appraise the
Make
arrangements
for the meetings

Master plan to develop Faridabad as a “Solar City”
314
Budget for Faridabad solar city master plan implementation
industry,
institutions ,
hospitals and
real estate
sector
stakeholders
about the
solar city
scheme and
various
projects to be
implemented
To identify the
scope of Solar
Thermal & PV
system
application in
industries and
prepare
feasibility for
biogas power
genaration in
housing
colonies
Study on
solar thermal
and PV
application in
atleast
Electroplating
, dying and
textile units
get completed
and the
feasibility for
food waste
based biogas
power plant
completed
Selection of
industry and the
consultant in
coordination
with HAREDA
for the
preparation of
detailed study
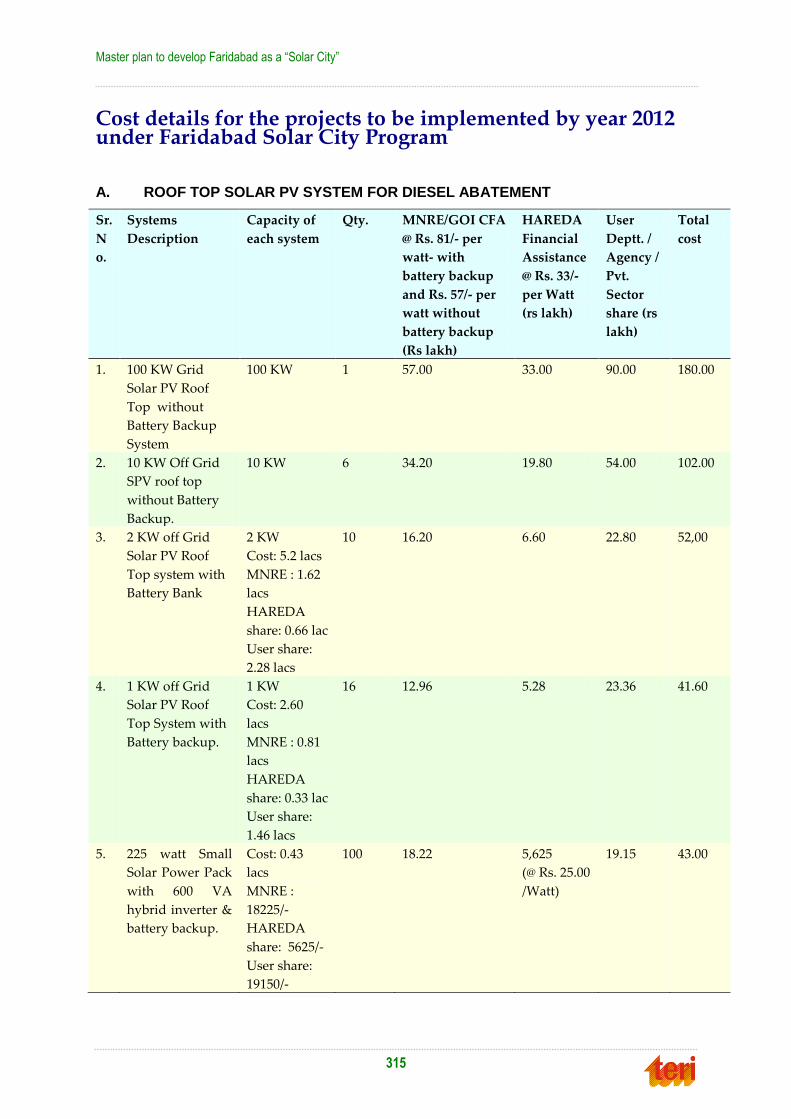
Master plan to develop Faridabad as a “Solar City”
315
Cost details for the projects to be implemented by year 2012 under Faridabad Solar City Program
A. ROOF TOP SOLAR PV SYSTEM FOR DIESEL ABATEMENT
Sr.
N
o.
Systems
Description
Capacity of
each system
Qty. MNRE/GOI CFA
@ Rs. 81/- per
watt- with
battery backup
and Rs. 57/- per
watt without
battery backup
(Rs lakh)
HAREDA
Financial
Assistance
@ Rs. 33/-
per Watt
(rs lakh)
User
Deptt. /
Agency /
Pvt.
Sector
share (rs
lakh)
Total
cost
1. 100 KW Grid
Solar PV Roof
Top without
Battery Backup
System
100 KW 1 57.00 33.00 90.00 180.00
2. 10 KW Off Grid
SPV roof top
without Battery
Backup.
10 KW 6 34.20 19.80 54.00 102.00
3. 2 KW off Grid
Solar PV Roof
Top system with
Battery Bank
2 KW
Cost: 5.2 lacs
MNRE : 1.62
lacs
HAREDA
share: 0.66 lac
User share:
2.28 lacs
10 16.20 6.60 22.80 52,00
4. 1 KW off Grid
Solar PV Roof
Top System with
Battery backup.
1 KW
Cost: 2.60
lacs
MNRE : 0.81
lacs
HAREDA
share: 0.33 lac
User share:
1.46 lacs
16 12.96 5.28 23.36 41.60
5. 225 watt Small
Solar Power Pack
with 600 VA
hybrid inverter &
battery backup.
Cost: 0.43
lacs
MNRE :
18225/-
HAREDA
share: 5625/-
User share:
19150/-
100 18.22 5,625
(@ Rs. 25.00
/Watt)
19.15 43.00

Master plan to develop Faridabad as a “Solar City”
316
Sr.
N
o.
Systems
Description
Capacity of
each system
Qty. MNRE/GOI CFA
@ Rs. 81/- per
watt- with
battery backup
and Rs. 57/- per
watt without
battery backup
(Rs lakh)
HAREDA
Financial
Assistance
@ Rs. 33/-
per Watt
(rs lakh)
User
Deptt. /
Agency /
Pvt.
Sector
share (rs
lakh)
Total
cost
6. 450 watt Small
Solar Power Pack
with 1200 VA
hybrid inverter &
battery backup.
Cost: 0.80
lacs
MNRE :
36450/-
HAREDA
share:
11250/-
User share:
32300/-
50 18.22 5.625
(@ Rs. 25.00
/Watt)
16.15 40.00
Total 156.8 75.93 225.46 458.60
B. SOLAR WATER HEATING SYSTEM
Sr.
No.
Description
(capacity)
Capacity MNRE/GOI
share. (Rs
lakh)
State Govt. share (rs lakh) Total
(Rs
lakh)
HAREDA User Dept
/ Agency
Private
Sector
1. Solar Water
Heating System
80,000
lpd
52.80 32.00 0.00 65.80 140.00
C. KITCHEN WASTE MANAGEMENT
Sr.
No.
Description
(capacity)
Capacity Total
cost (rs
lakh)
MNRE
/GOI
share.
(rs
lakh)
State Govt. share (Rs lakh) Total (rs
lakh)
HAREDA User
Dept /
Agency
Private
Sector
1 Kitchen
Waste Based
Biogas Plant
80 cu mtr plant
with 15 KW
electricity gen.
set.
24.00 6.00 6.00 0.00 12.00 24.00

Annexures
317
D. ENERGY EFFICIENCY IN MUNICIPAL STREET LIGHTING THROUGH
RENEWABLE ENERGY.
Sr.
No.
Description
(capacity)
Capacity Total
cost
(Rs
lakh)
MNRE/GOI
share. @ Rs.
81/ watt (Rs
lakh)
State Govt. share (Rs lakh) Total
(Rs
lakh)
HAREDA User
Dept /
Agency
Private
Sector
1. Energy
Efficiency in
Municipal
Street Lights (
100 nos LED
Based Solar
Lights of 120
watt from B K
Chowk to
Hardware
chowk)
3x 8 KW
capacity
centrally
solar power
plants
99.00 19.44 39.78 39.78 0.00 99.00
E. ENERGY EFFICIENCY IN MUNICIPAL STREET LIGHITNG THROUGH
ENERGY CONSERVATION WITH INSTALLATION OF LED / INDUCTION ARC
LAMPS WITH AUTOMATIC CONTROLLER.
Sr.
No.
Description Capacity Total
cost (rs
lakh)
MNRE/G
OI share.
@ Rs. 81/
watt (Rs
lakh)
BEE/G
OI (Rs
lakh)
State Govt. share (Rs lakh) Total
HAREDA User
Dept /
Agency
Private
Sector
1. Energy
Efficiency in
Municipal
Street Lighting
through LED /
Induction Arc
fixtures (Qty
200 nos ) from
Bata Chowk to
Hitkari Chowk
with
Microprocessor
controlled
ON/OFF
timer.
120 Watt
LED / 80
Watt
Induction
Arc
Lamps.
30.00 15.00 15.00 0.00 0.00 0.00 30.00

Master plan to develop Faridabad as a “Solar City”
318
F. AWARENESS / STUDY
Sr.N
o.
Event Nos Approx.
Total cost
(Rs in lacs)
MNRE, GOI
share (50%)
(Rs. in lacs)
State /
HARED
A share
(Rs. in
lacs)
User
Share
(Rs. in
lacs)
I. INTERACTION MEET
1. Interaction Meet for
Industrial Sector.
1 2.00 1.00 0.50 0.50
2. Interaction Meet for
Stakeholders of
Institutions / Hospitals /
real Estates
1 2.00 1.00 0.50 0.50
II. STUDIES / PREFEASIBILITIES / DPR
1. To identify the scope of
Solar Thermal & PV in
Electroplating Units.
1. 3.00 1.50 1.50 -
2. To identify the scope of
Solar Thermal & PV in
dyeing and textile units.
1 3.00 1.50 1.50 -
3. To study the potential of
Kitchen waste power
generation in Real Estate
Towers.
1 3.00 1.50 1.50 -
Total 13.00
6.50 5.50 1.00

The Solar city master plan is a comprehensive guide for the City administration
to take initiatives for the reduction in proportional energy consumption from
the through energy conservation measures in residential, commercial,
industrial as well as municipal sectors and implementation of renewable
energy devices such as solar water heating system, solar steam cookers, solar
PV systems, food waste based biogas plants etc. The Ministry of New and
Renewable Energy provides full support for the promotion of these renewable
energy systems for the development of Green and Clean city. Master plan can
be implemented by setting up a solar city cell and utilizing the Subsidies
available from various schemes of the Ministry, state government and other
relevant agencies.