soils: components and basic chemistry · basic chemistry justin scheiner, ph.d. ... • soil...
TRANSCRIPT

11/11/2016
1
Soils: Components and
basic chemistry
Justin Scheiner, Ph.D. Assistant Professor and
Extension Viticulture Specialist
Components of Soil
Minerals: decomposition of rock
Organic matter: decomposed plants, animals, & microbes
Water: atmosphere & soil reactions
Air: atmosphere
≥48%
25%
25%
≤2%

11/11/2016
2
Soil Formation
Parent material
Climate
Topography
Time
Living organisms
Soil Classification
9 soil orders
>1300 soil series

11/11/2016
3
Photo courtesy of Jim Kamas
Sample 1
Sample 2
Soil Profile
Horizons:
A: topsoil (minerals, organic matter)
B: subsoil (clay, low organic matter)
C: parent material
D: rock base
11/11/2016
4
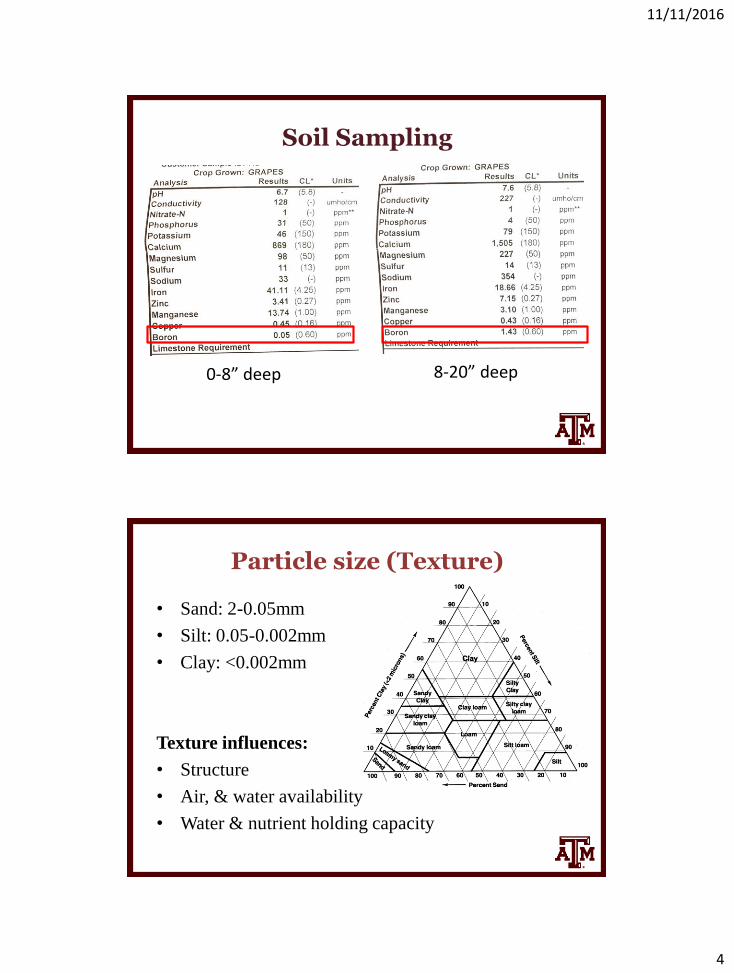
Soil Sampling
0-8” deep 8-20” deep
Particle size (Texture)
• Sand: 2-0.05mm
• Silt: 0.05-0.002mm
• Clay: <0.002mm
Texture influences:
• Structure
• Air, & water availability
• Water & nutrient holding capacity

11/11/2016
5
Sand Silt Clay
Loam Clay Loam Clay

11/11/2016
6
Soil Structure
The arrangement of primary particles into naturally
formed secondary particles (aggregates) due to the
particles tendency to stick together.
Massive Blocky Granular
Water Holding Capacity
Textural Class
Plant Available Water*
Clay 2.0
Clay Loam 2.4
Loam 2.1
Sandy Loam 1.8
Loamy Sand 1.2
Sand 0.5
*inches of water per foot of soil

11/11/2016
7
15 min
40 min
1 hour
24 hours 48 hours
24 hours
4 hours
Sandy Loam Clay Loam
Internal Soil Drainage
Adequate: 1.5” per hour
Excellent: 3” per hour

11/11/2016
8
Signs of Poor Drainage
Image from: http://soil-environment.blogspot.com/
Berming to modify drainage

11/11/2016
9
Soil Compaction
Many feeder roots are in the top 6” of soil

11/11/2016
10
Strategies to Improve/Maintain Soil Structure
• Cover cropping
• Organic matter additions
Restrictive Layers
Image from: northamericanfarmer.com Image from: agric.wa.gov.au

11/11/2016
11
Mineral Nutrition
Macro Nutrients
• Nitrogen
• Phosphorous
• Potassium
• Calcium
• Magnesium
• Sulfur
Micro Nutrients
• Iron
• Copper
• Manganese
• Boron
• Zinc
• Molybdenum

11/11/2016
12
Nutrient Useable Form(s) Mobility in Soil
Nitrogen NH4
+ (ammonium) and NO3-
(nitrate) Slightly mobile, mobile
Phosphorous H2PO4
- (dihydrogen phosphate) and HPO4
-2 (hydrogen phosphase) Immobile
Potassium K+ Slightly mobile
Calcium Ca+2 Slightly mobile
Magnesium Mg+2 Immobile
Sulfur SO4-2(sulfate) Mobile
Iron Fe+2 (ferrous) and Fe+3 (ferric) Immobile
Manganese Mn+2 and chelates Mobile
Copper Cu+2 Immobile
Boron H2BO3- (boric acid) Mobile
Zinc Zn+2 and chelates Mobile
Cation Exchange Capacity (CEC)
• Soil colloids have a net negative charge
Al3+ > Ca2+ > Mg2+ > K+ = NH4+ > Na+
strong attraction weak attraction
Clay – high CEC Sand – low CEC Organic matter – high CEC

11/11/2016
13
Sand Clay
Cation Exchange Capacity
Texture Cation Exchange
Capacity (cmol/kg)
Organic matter 40-200
Sand 1-5
Sandy loam 2-15
Silt loam 10-25
clay loam/silty clay loam 15-35
Clay 25-60

11/11/2016
14
Calcium, Potassium, and Magnesium compete for exchange sites

11/11/2016
15
Nutrient Pounds removed per ton of fruit
Pounds removed per 5 ton crop
Nitrogen 6.6 33
Phosphorous 0.88 4.4
Potassium 8.8 44
Calcium 2.2 6
Magnesium 0.44 2.2
Nutrients Removed with Harvest
From: M. Keller, Science of Grapevines
Target Values for Vineyard Soil Nutrients
Nutrient Target soil values (ppm) Target soil values (lbs/acre)
Potassium (K) 75-100 150-200
Phosphorus (P) 20-50 40-100
Calcium (Ca) 500-2,000 1,000-4,000
Magnesium (Mg) 100-250 200-500
Boron (B) 0.3-2 0.6-4
Iron (Fe) 20 40
Manganese (Mn) 20 40
Copper (Cu) 0.5 1.0
Zinc (Zn) 2 4
Organic Matter 3-5% -
From: T. Wolf, Winegrape Production Guide for Eastern North America

11/11/2016
16
Chemical Components of Soil
pH: concentration of H+ activity relative to OH-
• impacts nutrient availability
Nutrient Availability

11/11/2016
17
Interpreting Soil Tests
• Does not factor in availability
• Critical values may vary by lab (recommendations are
computer generated)
High pH Soils:
Iron
Zinc (unavailable at ≥ 9)
Potential for Deficiency
Sandy Soils:
Potassium
Others

11/11/2016
18
Rootstock and Soil Adaptability
Rootstock Drought
Tolerance
Tolerance to Poorly
Drained Soils
Lime Tolerance
Salinity Tolerance
Soil Adaption
SO4 Low Medium Medium Low Loams, clays, sandy clays
5BB Medium Low Medium Medium Sandy clays, loams, clays
5C Low Medium Medium Medium Finely textured soils
110R High Low Medium Medium Coarse soils
1103P Medium Medium Medium-
High Medium Widely adapted
Freedom Medium Low Medium Medium Sandy, well-drained
Harmony Medium Low Medium Medium Coarse, well-drained
Salt Creek Medium Medium Medium High Light sandy, infertile
Dog Ridge Medium Medium Medium Low Sands, clay loam, neutral to
mildly alkaline
101-14 Mgt Low Medium Low Low Sands to clays, neutral pH
3309C Low Medium Low Low Deep, well-drained
Riparia Gloire Low High Low Low Acid soils
Adapted from: Growing Grapes in Texas, J. Kamas
Organic Matter
• Decomposed plants, animals, and microbes
• Slow release of nutrients
• Variable composition

11/11/2016
19
Not all organic matter is created equal.
Organic Matter Composition
Organic Matter Source
Nitrogen* Phosphorus Potassium C:N Ratio
Cotton seed meal
7.7 2 1 7
Dry Chicken Litter
2.0-4.5 4.6-6 1.2-2.4 12-15
Dry Steer Manure
0.6-2.5 0.7-1.1 2.4-3.6 11-30
Poultry Compost
0.9 1.95 1.15 11
Wood Chips
0.1-0.5 - - 80-400
Grape Pomace** 1-2 2-3 0.1-0.3 <30
*percent by weight **from: Patti et al., 2004

11/11/2016
20
Faster decomposition in South
USDA-NRCS, Soil Food Web
“There are more soil microorganisms in a teaspoon of healthy soil than there are people on the earth” -USDA-NRCS
• Lactic acid-producing bacteria
• Mycorrhizal fungi
• Rhizobium bacteria
• Nitrobacter
• Beneficial nematodes
Microbial Activity

11/11/2016
21
Mulching
Benefits: soil moisture preservation, temporary weed
control, organic matter
Disadvantages: soil moisture preservation, nutrients?, $$$

11/11/2016
22
mulched mulched no mulch no mulch
6” deep 12” deep
Analysis (Salinity) No Problem Increasing Problem Severe Problem
EC dS/m or mmho/cm
1.5 to 2.5
2.5 to 4.0
4.0 to 7.0
TDS ppm or mg/L
960 to 1600
1600 to 2560
2560 to 5600
Sodium ppm or mg/L
- >690 -
Chloride ppm or mg/L
<350 350-1060 >1060
Boron ppm or mg/L
<1 1-3 >3
Guidelines for Interpreting Soil Suitability for Vineyards
Soil Salinity

11/11/2016
23
Guidelines for Interpreting Irrigation Suitability for Vineyards
Analysis (Salinity) No Problem Increasing Problem Severe Problem
EC dS/m or mmho/cm
< 1
1.0 to 2.7
>2.7
TDS ppm or mg/L
<640
640 to 1728
>1728
Sodium ppm or mg/L
<460 - -
Chloride ppm or mg/L
<140 140-525 >525
Boron <1 1-3 >3
Potential severity is a general guideline and will vary by:
• soil type
• rainfall
• irrigation frequency
Salinity in Irrigation Water
Toxicity symptoms often include marginal leaf burn and stunted growth.

11/11/2016
24
Sodium adsorption ratio (SAR)
• ratio of activity of sodium to calcium and magnesium
• calcium and magnesium compete with sodium for exchange
sites
Exchangeable sodium percentage (ESP)
• Percentage of CEC in soil occupied by sodium
SAR = √(Ca+++Mg++)/2
Na+
Analysis No Problem Increasing Problem Severe Problem
SAR < 6 6 to 9 >9
Guidelines for Interpreting Irrigation Suitability for Vineyards
Analysis No Problem Increasing Problem Severe Problem
ESP <10 10 to 15 >15
*High levels of carbonate and bicarbonate increase sodium hazard of water
Leaching
• Natural rainfall
• Irrigation in excess of vine needs
• Subsurface drainage below root zone
• Addition of soil amendments (Calcium)
Reclamation should be conducted when soil salts reach
threshold
• Winter months, following significant rainfall is more practical

11/11/2016
25
Leaching Requirement
Lr = Leaching requirement (how much water is
needed to leach salts)
Figure from: Food and Agriculture Organization (FAO)
Gypsum
Gypsum (CaSO4·2H2O) banded under vine row or injected
• calcium exchanges with sodium on soil exchange sites
• sodium can be leached beyond rooting zone
Gypsum Rate Based on Exchangeable Sodium Percentage
Table from: Arizona Cooperative Extension (AZ 1413)

11/11/2016
26
Non-traditional Soil Additives
Three major categories:
1. Soil conditioners or activators
2. Biological inoculants
3. Wetting agents
• Soil Physical Benefits:
– Benefits of addition of organic matter has long been
documented in agriculture
• Soil Chemical Benefits- Sequestering Agent
• Soil Biological Benefits?
– Increased Food Source for Microbes?
• App of 5-20 gal/A of Humic Material Provides 3-15 lbs of C/Acre
• Typical Corn Stubble Residue provides 4000 lbs C/Acre
Benefits of Humic Acids?
The addition of 2,000 per acre of humates would increase the organic material of a soil by 0.1%

11/11/2016
27
Biological Conditioners
Examples:
Mycorrhizae: fungi that live either on in or plants
roots and effectively extend the reach of the root hairs
• Potential benefits:
– nutrient uptake
– reduced nematode feeding
– disease suppression
• Dozens of mycorrhizae species occur in nature
Rhizobia (fix nitrogen from the air)
• only in legumes
Image from: urbanext.illinois.edu/
Wetting Agents
Break down the natural surface tension in water
• promoted as improving water penetration in soil,
drainage, and soil structure; control erosion and
reduce compaction
– have no effect on poor drainage due to hardpans,
compaction due to tillage or traffic, and fine textured soils
with very small pores (Hall and Sullivan, 2001)

11/11/2016
28