soil sample survey nassau co. - cornell university
TRANSCRIPT

Ketterings, Q.M., H. Krol, and W.S. Reid (2004). Nassau County Soil Sample Survey 1995-2001. CSS Extension Bulletin E04-20. 21 pages.
1
Soil Sample Survey
Nassau Co. Samples analyzed by CNAL in 1995-2001
Summary compiled by
Quirine M. Ketterings, Hettie Krol, and W. Shaw Reid
Nutrient Management Spear Program: http://nmsp.css.corne ll.edu/
Ketterings, Q.M., H. Krol, and W.S. Reid (2004). Nassau County Soil Sample Survey 1995-2001. CSS Extension Bulletin E04-20. 21 pages.
2
Soil Sample Survey
Nassau Co. Samples analyzed by CNAL in 1995-2001
Summary compiled by
Quirine Ketterings and Hettie Krol Nutrient Management Spear Program Department of Crop and Soil Sciences 817 Bradfield Hall, Cornell University
Ithaca NY 14853
and
W. Shaw Reid Professor Emeritus
Department of Crop and Soil Sciences
May 7, 2004
Correct Citation:
Ketterings, Q.M., H. Krol, and W.S. Reid (2004). Soil samples survey of Nassau County. Samples analyzed by the Cornell Nutrient Analysis Laboratory in 1995-2001. CSS Extension Bulletin E04-20. 21 pages.
Ketterings, Q.M., H. Krol, and W.S. Reid (2004). Nassau County Soil Sample Survey 1995-2001. CSS Extension Bulletin E04-20. 21 pages.
3
Table of Content
1. General Survey Summary................................................................................................4 2. Cropping Systems ............................................................................................................9 3. Soil Types ......................................................................................................................10 4. Organic Matter ...............................................................................................................11 5. pH ..................................................................................................................................12 6. Phosphorus.....................................................................................................................13 7. Potassium.......................................................................................................................14 8. Magnesium ....................................................................................................................17 9. Iron.................................................................................................................................18 10. Manganese ...................................................................................................................19 11. Zinc ..............................................................................................................................20 Appendix: Cornell Crop Codes .........................................................................................21
4
1. General Survey Summary
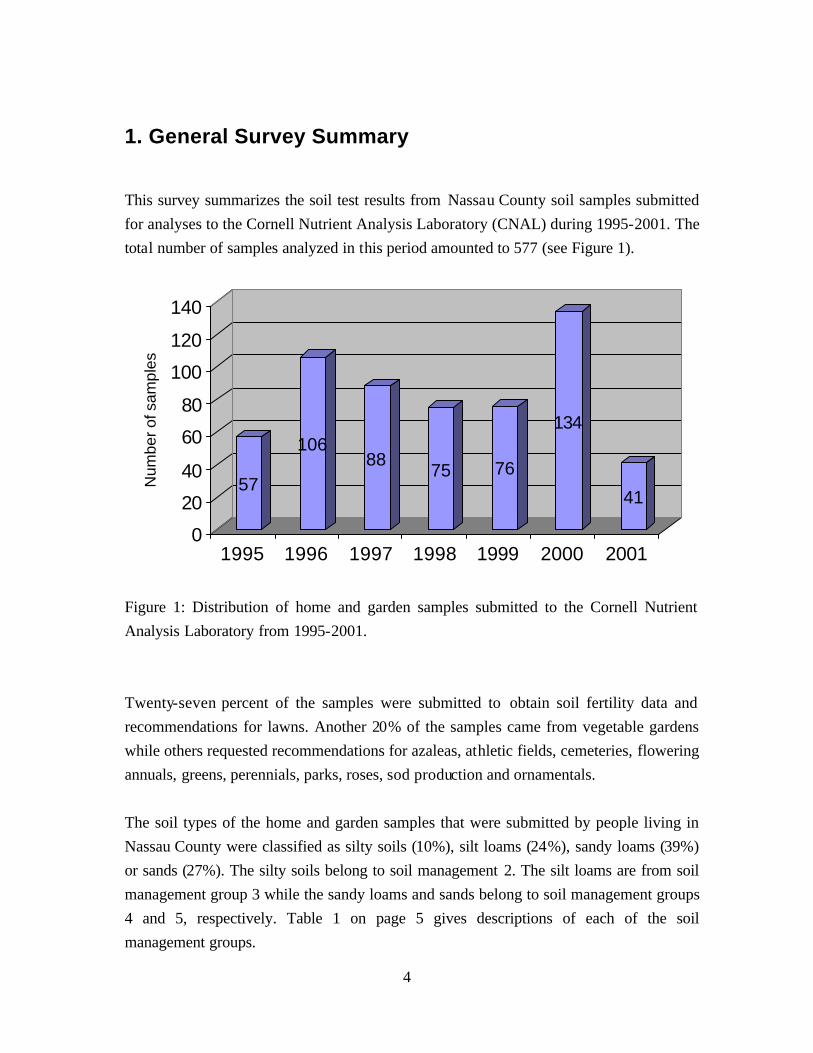
This survey summarizes the soil test results from Nassau County soil samples submitted for analyses to the Cornell Nutrient Analysis Laboratory (CNAL) during 1995-2001. The total number of samples analyzed in this period amounted to 577 (see Figure 1).
57
10688
75 76
134
41
0
20
40
60
80
100
120
140
Num
ber o
f sam
ples
1995 1996 1997 1998 1999 2000 2001
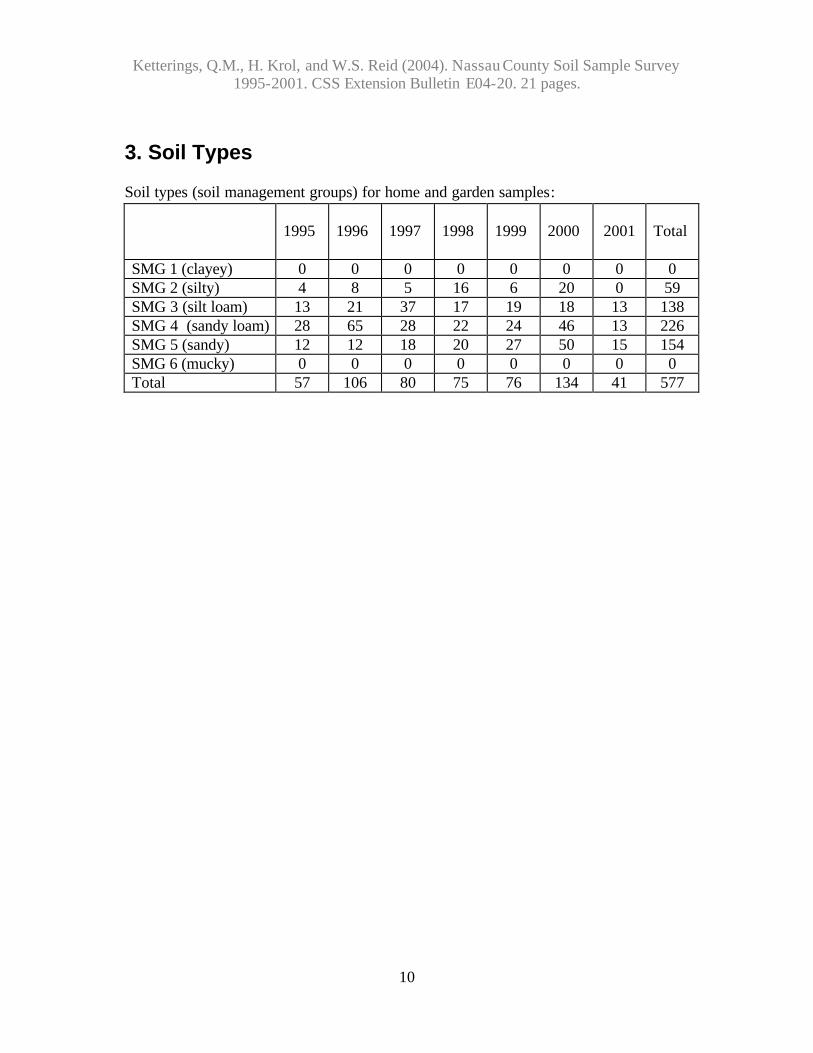
Figure 1: Distribution of home and garden samples submitted to the Cornell Nutrient Analysis Laboratory from 1995-2001. Twenty-seven percent of the samples were submitted to obtain soil fertility data and recommendations for lawns. Another 20% of the samples came from vegetable gardens while others requested recommendations for azaleas, athletic fields, cemeteries, flowering annuals, greens, perennials, parks, roses, sod production and ornamentals. The soil types of the home and garden samples that were submitted by people living in Nassau County were classified as silty soils (10%), silt loams (24%), sandy loams (39%) or sands (27%). The silty soils belong to soil management 2. The silt loams are from soil management group 3 while the sandy loams and sands belong to soil management groups 4 and 5, respectively. Table 1 on page 5 gives descriptions of each of the soil management groups.
Ketterings, Q.M., H. Krol, and W.S. Reid (2004). Nassau County Soil Sample Survey 1995-2001. CSS Extension Bulletin E04-20. 21 pages.
5
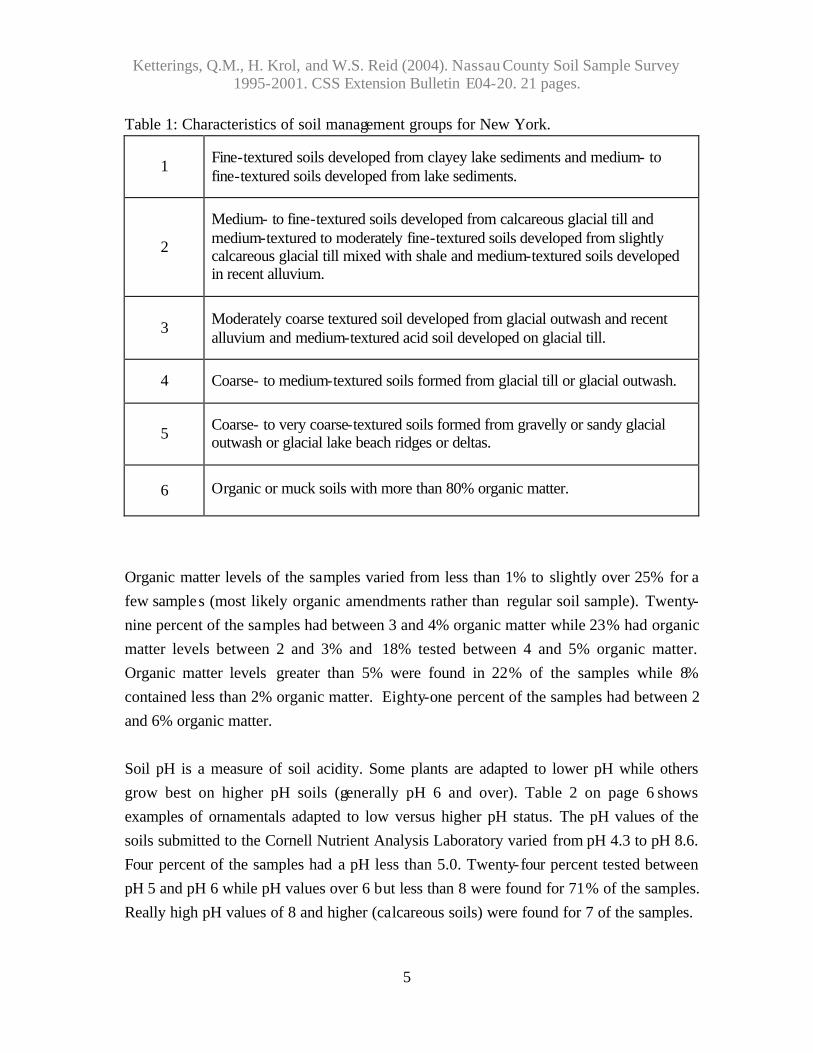
Table 1: Characteristics of soil management groups for New York.
1
Fine-textured soils developed from clayey lake sediments and medium- to fine-textured soils developed from lake sediments.
2
Medium- to fine-textured soils developed from calcareous glacial till and medium-textured to moderately fine-textured soils developed from slightly calcareous glacial till mixed with shale and medium-textured soils developed in recent alluvium.
3
Moderately coarse textured soil developed from glacial outwash and recent alluvium and medium-textured acid soil developed on glacial till.
4
Coarse- to medium-textured soils formed from glacial till or glacial outwash.
5
Coarse- to very coarse-textured soils formed from gravelly or sandy glacial outwash or glacial lake beach ridges or deltas.
6 Organic or muck soils with more than 80% organic matter.
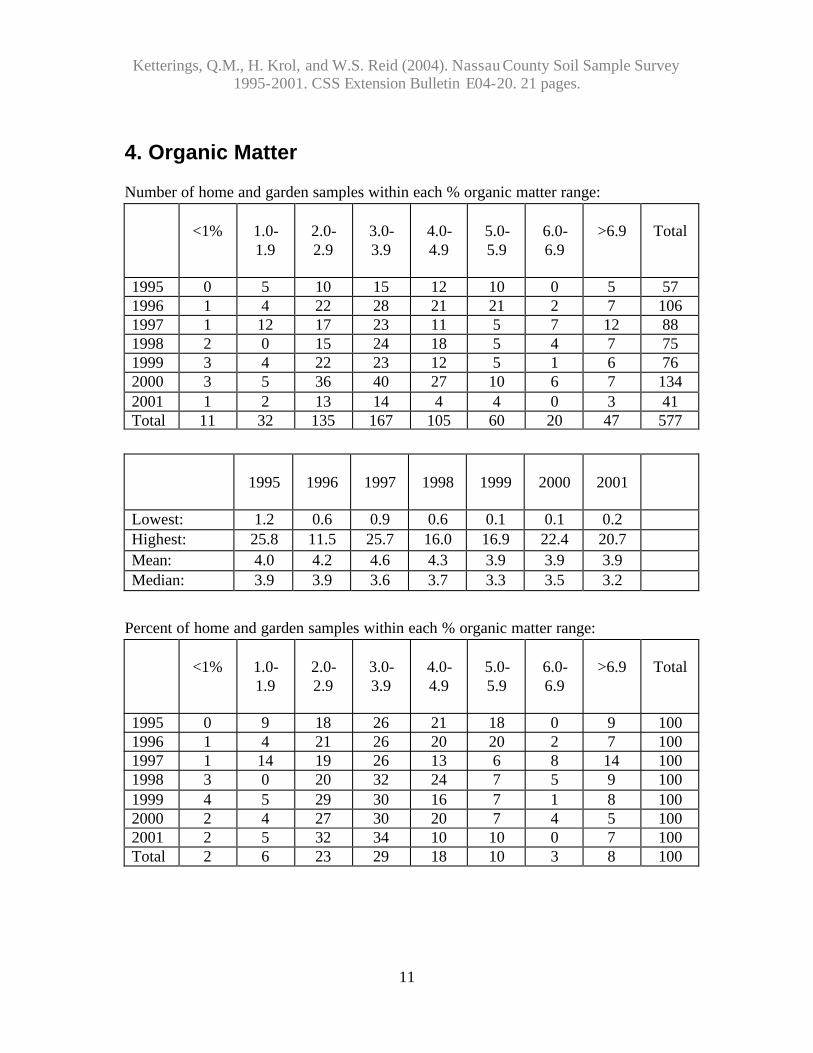
Organic matter levels of the samples varied from less than 1% to slightly over 25% for a few samples (most likely organic amendments rather than regular soil sample). Twenty-nine percent of the samples had between 3 and 4% organic matter while 23% had organic matter levels between 2 and 3% and 18% tested between 4 and 5% organic matter. Organic matter levels greater than 5% were found in 22% of the samples while 8% contained less than 2% organic matter. Eighty-one percent of the samples had between 2 and 6% organic matter. Soil pH is a measure of soil acidity. Some plants are adapted to lower pH while others grow best on higher pH soils (generally pH 6 and over). Table 2 on page 6 shows examples of ornamentals adapted to low versus higher pH status. The pH values of the soils submitted to the Cornell Nutrient Analysis Laboratory varied from pH 4.3 to pH 8.6. Four percent of the samples had a pH less than 5.0. Twenty-four percent tested between pH 5 and pH 6 while pH values over 6 but less than 8 were found for 71% of the samples. Really high pH values of 8 and higher (calcareous soils) were found for 7 of the samples.

Ketterings, Q.M., H. Krol, and W.S. Reid (2004). Nassau County Soil Sample Survey 1995-2001. CSS Extension Bulletin E04-20. 21 pages.
6
Table 2: Ornamentals adapted pH less than or greater than 6.0 Adapted to pH 4.5-6.0
Azalea, Bayberry, Chokeberry, Franklina, Holly, Inkberry, Leucothoe, Laurel, Oak, Pachistima, Pieris, Rhododendoron, Sheel Laurel, Snowball Hydrangea, Sourwood, Spicebush, Winter Holly
Adapted to pH 6.0-7.5
Abelia, Almond, Ajuga, Arborvitae, Ash, Barberry, Beautybush, Birch (White), Bittersweet, Boxwood, Chastetree, Chestnut, Clematis, Coralberry, Cotoneaster, Crabapple, Cranberry bush, Cypress, Daphne, Deutiza, Dogwood, Enkianthus, Euonymus, Firethorn, Fir, Forsythia, Fringe Tree, Germander, Ginko, Golden Chain, Hawthorn, Hemlock, Hollygrape, Honey Locust, Honeysuckle, Hornbeam, Hypericum, Ivy, Jetbead, Juniper, Larch, Lilac, Linden, Magnolia, Maple, Mockorange, Oak (English, Scarlet, Turkey), Pea Shrub, Pine, Plum (Flowering), Privet, Quince, Redbud, Rose of Sharon, Sassafras, Spirea, Spruce, Sweet Gum, Sweet Shrub, Sycamore, Tulip Tree, Tupello (Gum), Va. Creeper, Viburnum, Vinca, Walnut, Wayfaring Tree, Weigela, Willow, Wisteria, Witch Hazel, Yellow-wood, Yew.
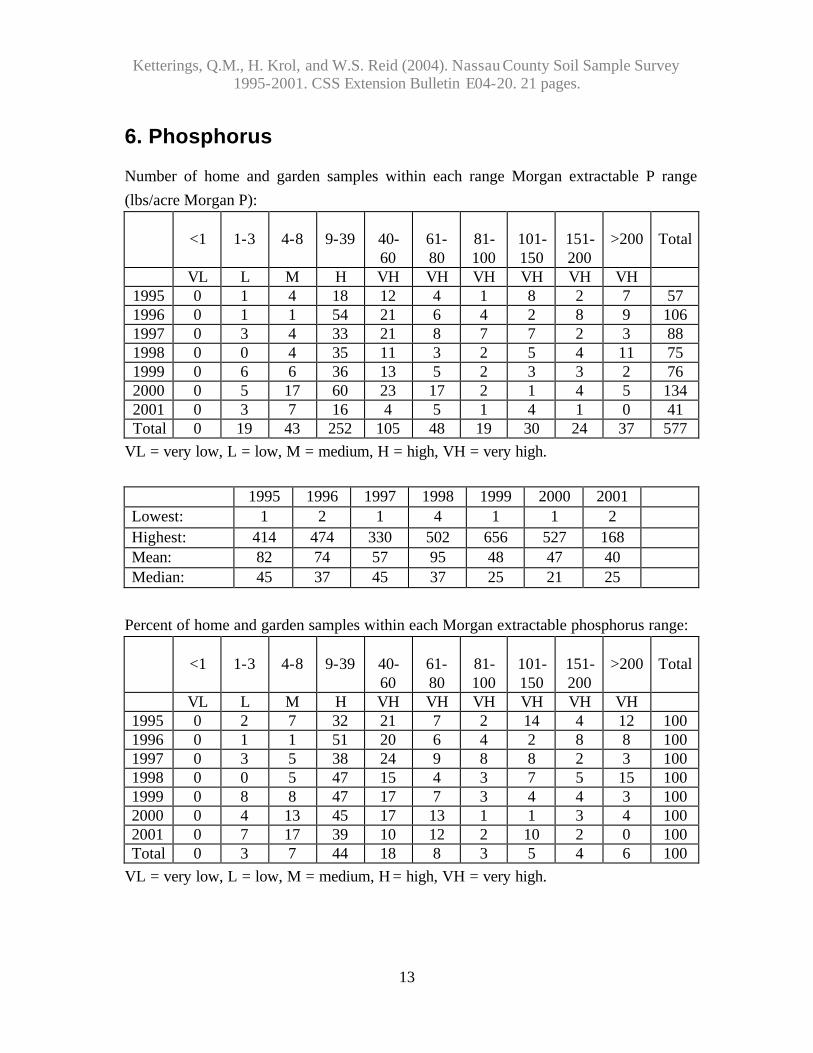
Extractable nutrients such as phosphorus (P), potassium (K), magnesium (Mg), iron (Fe), manganese (Mn), and zinc (Zn) were measured using the Morgan chemical extraction solution and method. This solution contains sodium acetate buffered at a pH of 4.8. Other extraction methods exist that give very different results. Soil test phosphorus levels of <1 lb P/acre are classified as very low. Between 1-3 lbs P/acre is low. Medium is between 4-8 lbs P/acre. High testing soils have P levels between 9 and 39 lbs P/acre and soils with 40 lbs P/acre or more are classified as very high. Of the home and garden samples that were submitted to the Cornell Nutrient Analysis Laboratory between 1995 and 2001, none tested very low in phosphorus. Three percent of the samples tested low in phosphorus while 7% were classified medium and almost 44% tested high in P. Just shy of 46% of the samples tested very high in phosphorus. This means that for 89% of the soils that were tested, for most plants, no additional phosphorus fertilizer would be needed. Classifications for potassium depend on soil management group. The fine-textured soils of soil management group 1 contain a lot of potassium containing clay and have as a result a greater K supplying capacity than the coarse textured sandy soils (soil management group 5). Because of these differences in potassium supplying capacity
Ketterings, Q.M., H. Krol, and W.S. Reid (2004). Nassau County Soil Sample Survey 1995-2001. CSS Extension Bulletin E04-20. 21 pages.
7
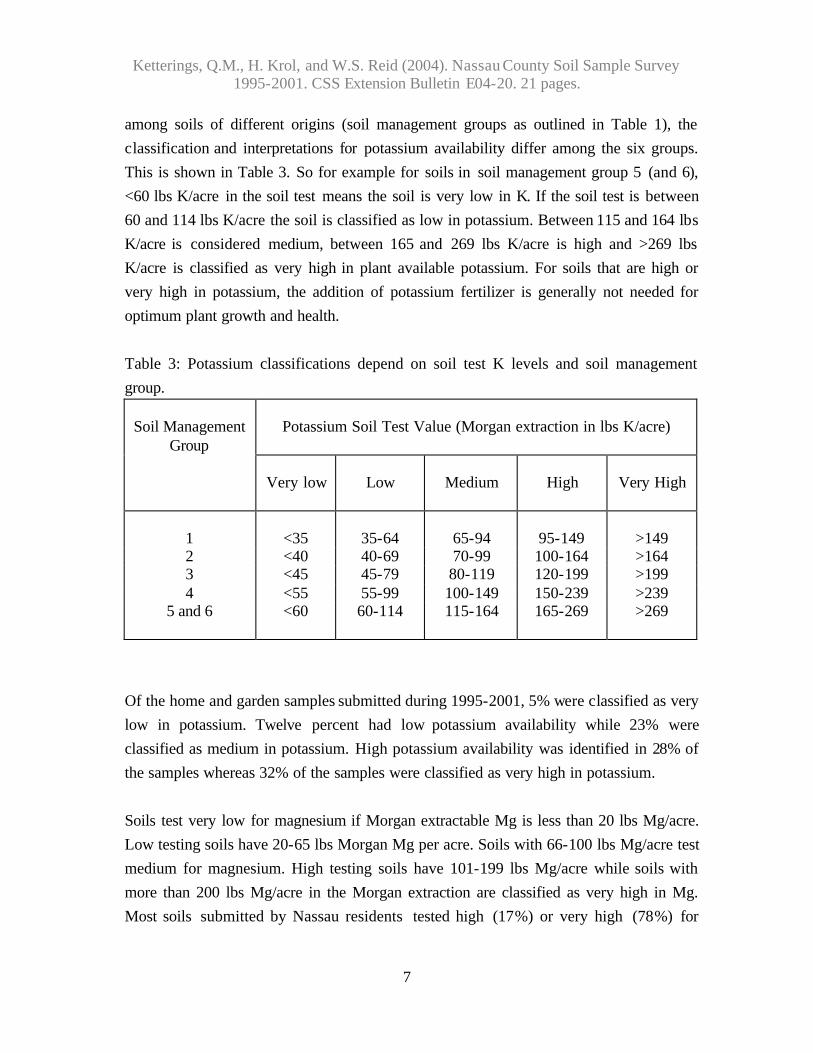
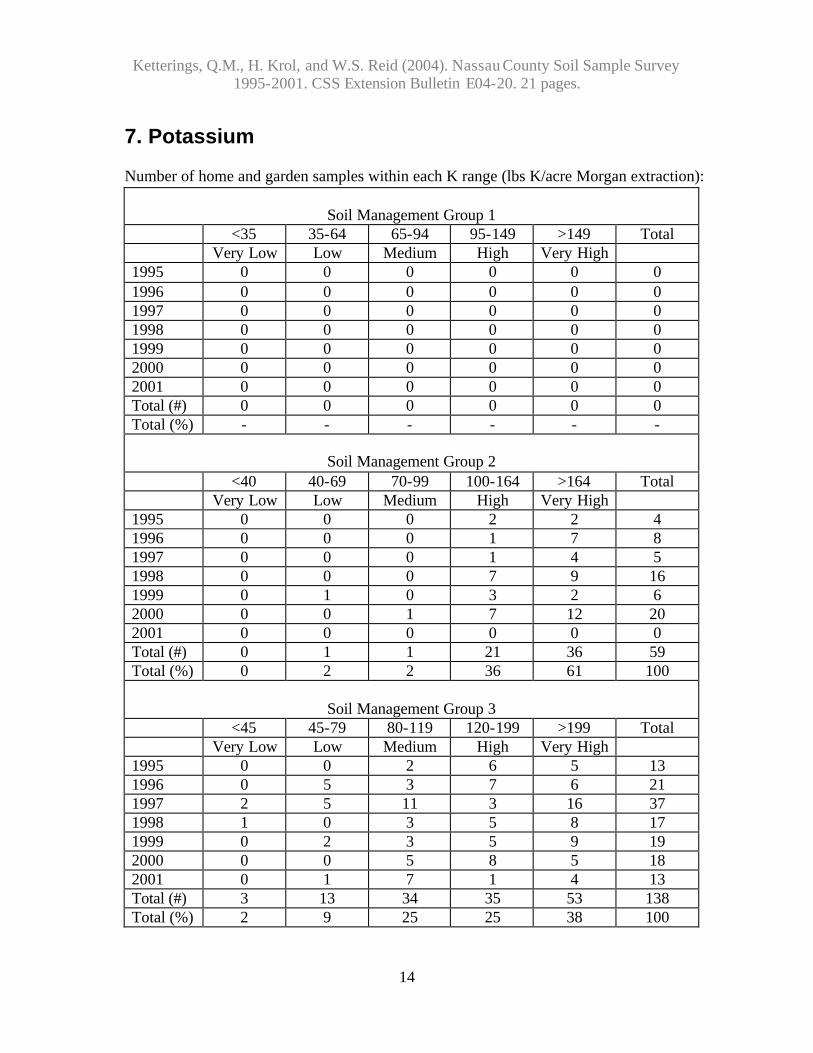
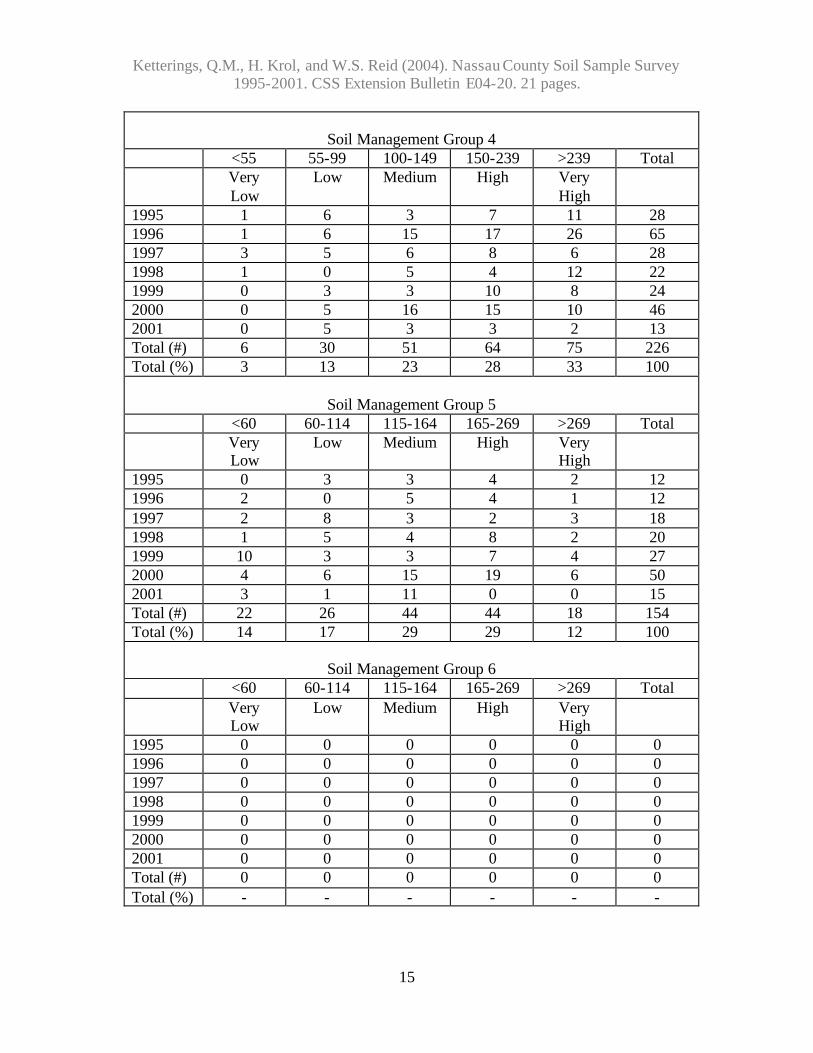
among soils of different origins (soil management groups as outlined in Table 1), the classification and interpretations for potassium availability differ among the six groups. This is shown in Table 3. So for example for soils in soil management group 5 (and 6), <60 lbs K/acre in the soil test means the soil is very low in K. If the soil test is between 60 and 114 lbs K/acre the soil is classified as low in potassium. Between 115 and 164 lbs K/acre is considered medium, between 165 and 269 lbs K/acre is high and >269 lbs K/acre is classified as very high in plant available potassium. For soils that are high or very high in potassium, the addition of potassium fertilizer is generally not needed for optimum plant growth and health. Table 3: Potassium classifications depend on soil test K levels and soil management group.
Potassium Soil Test Value (Morgan extraction in lbs K/acre)
Soil Management
Group
Very low
Low
Medium
High
Very High
1
<35
35-64
65-94
95-149
>149
2 <40 40-69 70-99 100-164 >164 3 <45 45-79 80-119 120-199 >199 4 <55 55-99 100-149 150-239 >239
5 and 6 <60 60-114 115-164 165-269 >269
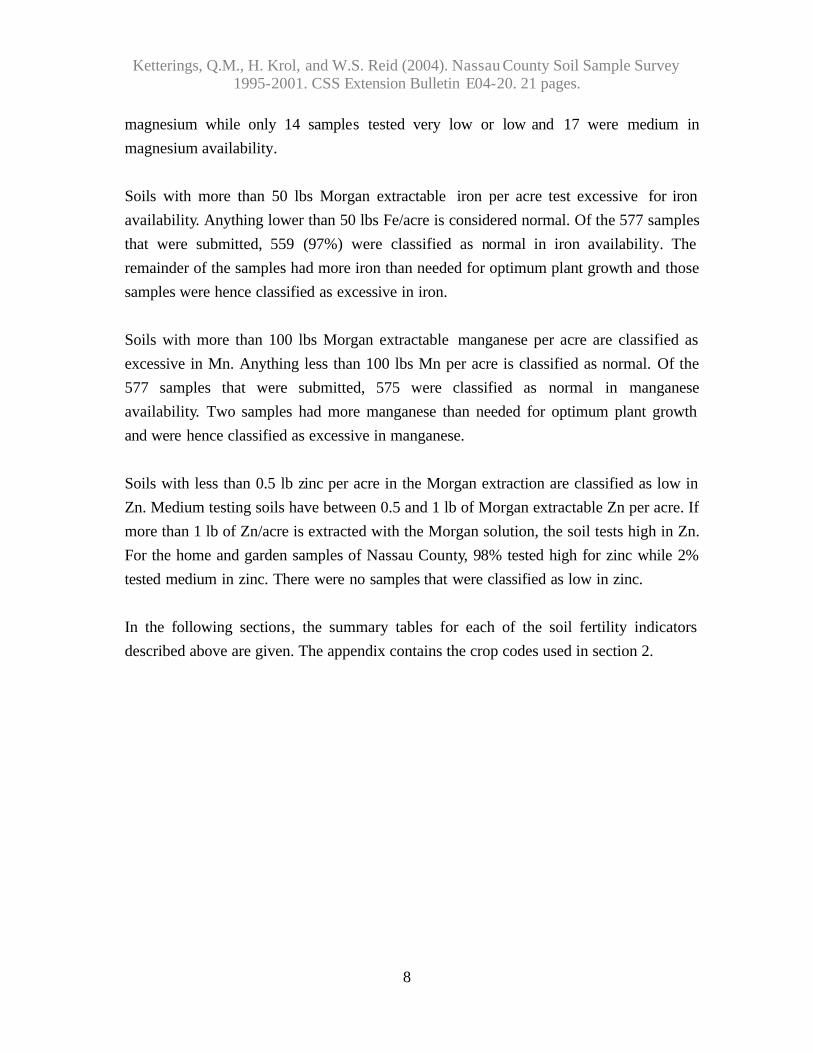
Of the home and garden samples submitted during 1995-2001, 5% were classified as very low in potassium. Twelve percent had low potassium availability while 23% were classified as medium in potassium. High potassium availability was identified in 28% of the samples whereas 32% of the samples were classified as very high in potassium. Soils test very low for magnesium if Morgan extractable Mg is less than 20 lbs Mg/acre. Low testing soils have 20-65 lbs Morgan Mg per acre. Soils with 66-100 lbs Mg/acre test medium for magnesium. High testing soils have 101-199 lbs Mg/acre while soils with more than 200 lbs Mg/acre in the Morgan extraction are classified as very high in Mg. Most soils submitted by Nassau residents tested high (17%) or very high (78%) for
Ketterings, Q.M., H. Krol, and W.S. Reid (2004). Nassau County Soil Sample Survey 1995-2001. CSS Extension Bulletin E04-20. 21 pages.
8
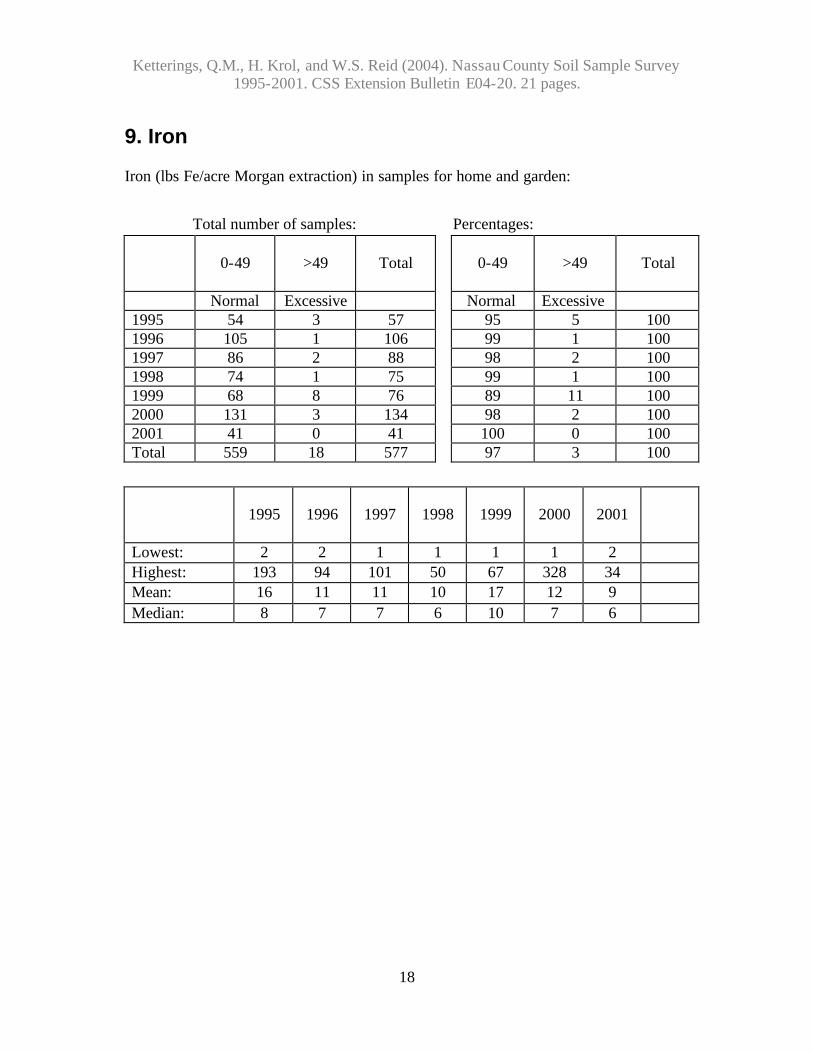
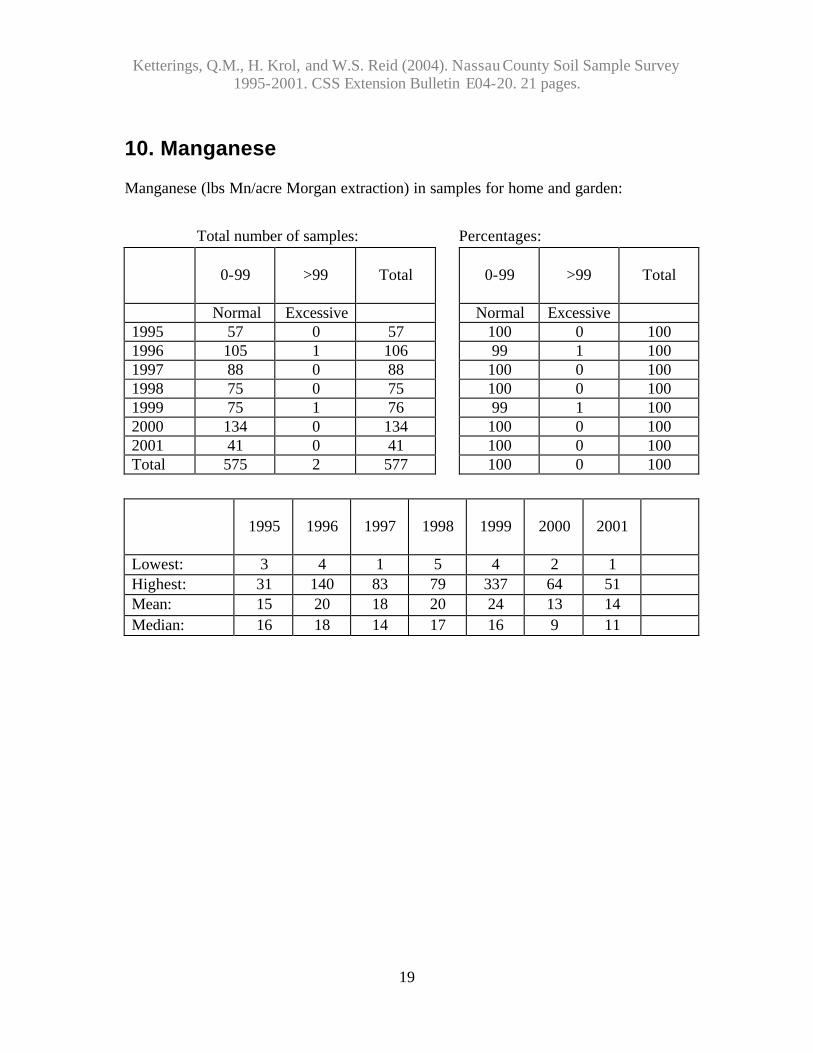
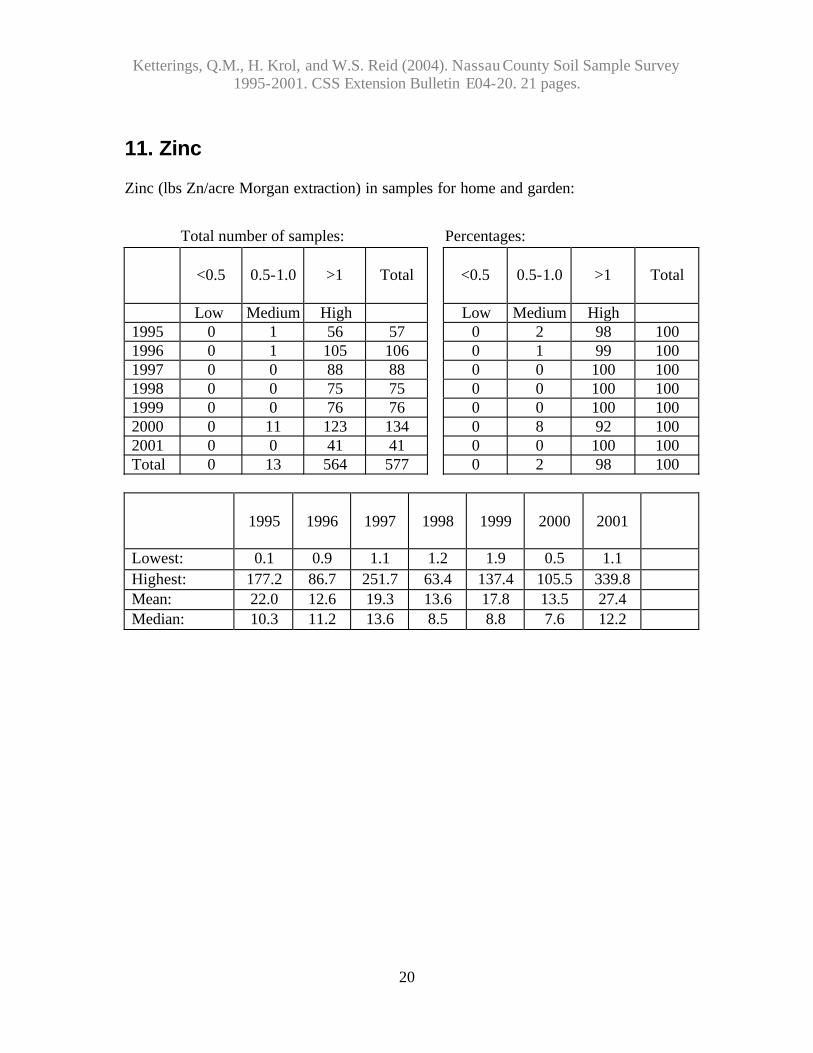
magnesium while only 14 samples tested very low or low and 17 were medium in magnesium availability. Soils with more than 50 lbs Morgan extractable iron per acre test excessive for iron availability. Anything lower than 50 lbs Fe/acre is considered normal. Of the 577 samples that were submitted, 559 (97%) were classified as normal in iron availability. The remainder of the samples had more iron than needed for optimum plant growth and those samples were hence classified as excessive in iron. Soils with more than 100 lbs Morgan extractable manganese per acre are classified as excessive in Mn. Anything less than 100 lbs Mn per acre is classified as normal. Of the 577 samples that were submitted, 575 were classified as normal in manganese availability. Two samples had more manganese than needed for optimum plant growth and were hence classified as excessive in manganese. Soils with less than 0.5 lb zinc per acre in the Morgan extraction are classified as low in Zn. Medium testing soils have between 0.5 and 1 lb of Morgan extractable Zn per acre. If more than 1 lb of Zn/acre is extracted with the Morgan solution, the soil tests high in Zn. For the home and garden samples of Nassau County, 98% tested high for zinc while 2% tested medium in zinc. There were no samples that were classified as low in zinc. In the following sections, the summary tables for each of the soil fertility indicators described above are given. The appendix contains the crop codes used in section 2.
Ketterings, Q.M., H. Krol, and W.S. Reid (2004). Nassau County Soil Sample Survey 1995-2001. CSS Extension Bulletin E04-20. 21 pages.
9
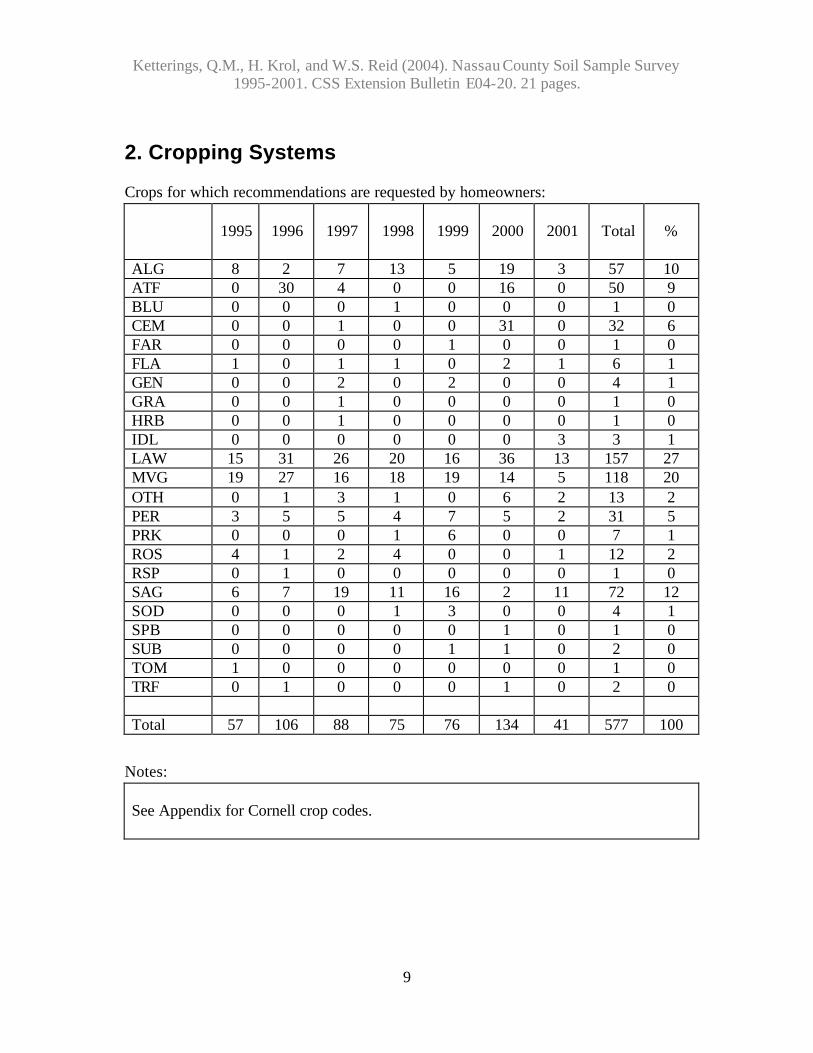
2. Cropping Systems
Crops for which recommendations are requested by homeowners:
1995
1996
1997
1998
1999
2000
2001
Total
%
ALG 8 2 7 13 5 19 3 57 10 ATF 0 30 4 0 0 16 0 50 9 BLU 0 0 0 1 0 0 0 1 0 CEM 0 0 1 0 0 31 0 32 6 FAR 0 0 0 0 1 0 0 1 0 FLA 1 0 1 1 0 2 1 6 1 GEN 0 0 2 0 2 0 0 4 1 GRA 0 0 1 0 0 0 0 1 0 HRB 0 0 1 0 0 0 0 1 0 IDL 0 0 0 0 0 0 3 3 1 LAW 15 31 26 20 16 36 13 157 27 MVG 19 27 16 18 19 14 5 118 20 OTH 0 1 3 1 0 6 2 13 2 PER 3 5 5 4 7 5 2 31 5 PRK 0 0 0 1 6 0 0 7 1 ROS 4 1 2 4 0 0 1 12 2 RSP 0 1 0 0 0 0 0 1 0 SAG 6 7 19 11 16 2 11 72 12 SOD 0 0 0 1 3 0 0 4 1 SPB 0 0 0 0 0 1 0 1 0 SUB 0 0 0 0 1 1 0 2 0 TOM 1 0 0 0 0 0 0 1 0 TRF 0 1 0 0 0 1 0 2 0 Total 57 106 88 75 76 134 41 577 100
Notes: See Appendix for Cornell crop codes.
Ketterings, Q.M., H. Krol, and W.S. Reid (2004). Nassau County Soil Sample Survey 1995-2001. CSS Extension Bulletin E04-20. 21 pages.
10
3. Soil Types
Soil types (soil management groups) for home and garden samples:
1995 1996
1997
1998
1999
2000
2001
Total
SMG 1 (clayey) 0 0 0 0 0 0 0 0 SMG 2 (silty) 4 8 5 16 6 20 0 59 SMG 3 (silt loam) 13 21 37 17 19 18 13 138 SMG 4 (sandy loam) 28 65 28 22 24 46 13 226 SMG 5 (sandy) 12 12 18 20 27 50 15 154 SMG 6 (mucky) 0 0 0 0 0 0 0 0 Total 57 106 80 75 76 134 41 577
Ketterings, Q.M., H. Krol, and W.S. Reid (2004). Nassau County Soil Sample Survey 1995-2001. CSS Extension Bulletin E04-20. 21 pages.
11
4. Organic Matter
Number of home and garden samples within each % organic matter range:
<1%
1.0-1.9
2.0-2.9
3.0-3.9
4.0-4.9
5.0-5.9
6.0-6.9
>6.9
Total
1995 0 5 10 15 12 10 0 5 57 1996 1 4 22 28 21 21 2 7 106 1997 1 12 17 23 11 5 7 12 88 1998 2 0 15 24 18 5 4 7 75 1999 3 4 22 23 12 5 1 6 76 2000 3 5 36 40 27 10 6 7 134 2001 1 2 13 14 4 4 0 3 41 Total 11 32 135 167 105 60 20 47 577
1995
1996
1997
1998
1999
2000
2001
Lowest: 1.2 0.6 0.9 0.6 0.1 0.1 0.2 Highest: 25.8 11.5 25.7 16.0 16.9 22.4 20.7 Mean: 4.0 4.2 4.6 4.3 3.9 3.9 3.9 Median: 3.9 3.9 3.6 3.7 3.3 3.5 3.2
Percent of home and garden samples within each % organic matter range:
<1%
1.0-1.9
2.0-2.9
3.0-3.9
4.0-4.9
5.0-5.9
6.0-6.9
>6.9
Total
1995 0 9 18 26 21 18 0 9 100 1996 1 4 21 26 20 20 2 7 100 1997 1 14 19 26 13 6 8 14 100 1998 3 0 20 32 24 7 5 9 100 1999 4 5 29 30 16 7 1 8 100 2000 2 4 27 30 20 7 4 5 100 2001 2 5 32 34 10 10 0 7 100 Total 2 6 23 29 18 10 3 8 100

Ketterings, Q.M., H. Krol, and W.S. Reid (2004). Nassau County Soil Sample Survey 1995-2001. CSS Extension Bulletin E04-20. 21 pages.
12
5. pH
Number of home and garden samples within each pH range:
1995
1996
1997
1998
1999
2000
2001
Lowest: 4.4 4.4 4.7 4.6 4.6 4.3 4.5 Highest: 8.0 7.9 7.4 7.6 8.1 8.6 8.2 Mean: - - - - - - - Median: 6.3 6.8 6.2 6.2 6.4 6.6 6.2
Percent of home and garden samples within each pH range:
<4.5
4.5-4.9
5.0-5.4
5.5-5.9
6.0-6.4
6.5-6.9
7.0-7.4
7.5-7.9
8.0-8.4
>8.4
Total
1995 4 4 5 19 25 23 12 7 2 0 100 1996 1 4 7 8 16 20 24 21 0 0 100 1997 0 2 13 23 23 28 11 0 0 0 100 1998 0 1 15 20 27 23 13 1 0 0 100 1999 0 7 11 21 14 22 24 0 1 0 100 2000 1 1 4 9 25 29 24 4 1 1 100 2001 0 10 7 17 39 17 5 2 2 0 100 Total 1 3 8 16 23 24 18 6 1 0 100
<4.5
4.5-4.9
5.0-5.4
5.5-5.9
6.0-6.4
6.5-6.9
7.0-7.4
7.5-7.9
8.0-8.4
>8.4
Total
1995 2 2 3 11 14 13 7 4 1 0 57 1996 1 4 7 9 17 21 25 22 0 0 106 1997 0 2 11 20 20 25 10 0 0 0 88 1998 0 1 11 15 20 17 10 1 0 0 75 1999 0 5 8 16 11 17 18 0 1 0 76 2000 1 1 6 12 34 39 32 5 2 2 134 2001 0 4 3 7 16 7 2 1 1 0 41 Total 4 19 49 90 132 139 104 33 5 2 577
Ketterings, Q.M., H. Krol, and W.S. Reid (2004). Nassau County Soil Sample Survey 1995-2001. CSS Extension Bulletin E04-20. 21 pages.
13
6. Phosphorus
Number of home and garden samples within each range Morgan extractable P range (lbs/acre Morgan P):
<1
1-3
4-8
9-39
40-60
61-80
81-100
101-150
151-200
>200
Total
VL L M H VH VH VH VH VH VH 1995 0 1 4 18 12 4 1 8 2 7 57 1996 0 1 1 54 21 6 4 2 8 9 106 1997 0 3 4 33 21 8 7 7 2 3 88 1998 0 0 4 35 11 3 2 5 4 11 75 1999 0 6 6 36 13 5 2 3 3 2 76 2000 0 5 17 60 23 17 2 1 4 5 134 2001 0 3 7 16 4 5 1 4 1 0 41 Total 0 19 43 252 105 48 19 30 24 37 577
VL = very low, L = low, M = medium, H = high, VH = very high.
1995 1996 1997 1998 1999 2000 2001 Lowest: 1 2 1 4 1 1 2 Highest: 414 474 330 502 656 527 168 Mean: 82 74 57 95 48 47 40 Median: 45 37 45 37 25 21 25
Percent of home and garden samples within each Morgan extractable phosphorus range:
<1
1-3
4-8
9-39
40-60
61-80
81-100
101-150
151-200
>200
Total
VL L M H VH VH VH VH VH VH 1995 0 2 7 32 21 7 2 14 4 12 100 1996 0 1 1 51 20 6 4 2 8 8 100 1997 0 3 5 38 24 9 8 8 2 3 100 1998 0 0 5 47 15 4 3 7 5 15 100 1999 0 8 8 47 17 7 3 4 4 3 100 2000 0 4 13 45 17 13 1 1 3 4 100 2001 0 7 17 39 10 12 2 10 2 0 100 Total 0 3 7 44 18 8 3 5 4 6 100
VL = very low, L = low, M = medium, H = high, VH = very high.
Ketterings, Q.M., H. Krol, and W.S. Reid (2004). Nassau County Soil Sample Survey 1995-2001. CSS Extension Bulletin E04-20. 21 pages.
14
7. Potassium
Number of home and garden samples within each K range (lbs K/acre Morgan extraction):
Soil Management Group 1 <35 35-64 65-94 95-149 >149 Total Very Low Low Medium High Very High 1995 0 0 0 0 0 0 1996 0 0 0 0 0 0 1997 0 0 0 0 0 0 1998 0 0 0 0 0 0 1999 0 0 0 0 0 0 2000 0 0 0 0 0 0 2001 0 0 0 0 0 0 Total (#) 0 0 0 0 0 0 Total (%) - - - - - -
Soil Management Group 2
<40 40-69 70-99 100-164 >164 Total Very Low Low Medium High Very High 1995 0 0 0 2 2 4 1996 0 0 0 1 7 8 1997 0 0 0 1 4 5 1998 0 0 0 7 9 16 1999 0 1 0 3 2 6 2000 0 0 1 7 12 20 2001 0 0 0 0 0 0 Total (#) 0 1 1 21 36 59 Total (%) 0 2 2 36 61 100
Soil Management Group 3
<45 45-79 80-119 120-199 >199 Total Very Low Low Medium High Very High 1995 0 0 2 6 5 13 1996 0 5 3 7 6 21 1997 2 5 11 3 16 37 1998 1 0 3 5 8 17 1999 0 2 3 5 9 19 2000 0 0 5 8 5 18 2001 0 1 7 1 4 13 Total (#) 3 13 34 35 53 138 Total (%) 2 9 25 25 38 100
Ketterings, Q.M., H. Krol, and W.S. Reid (2004). Nassau County Soil Sample Survey 1995-2001. CSS Extension Bulletin E04-20. 21 pages.
15
Soil Management Group 4
<55 55-99 100-149 150-239 >239 Total Very
Low Low Medium High Very
High
1995 1 6 3 7 11 28 1996 1 6 15 17 26 65 1997 3 5 6 8 6 28 1998 1 0 5 4 12 22 1999 0 3 3 10 8 24 2000 0 5 16 15 10 46 2001 0 5 3 3 2 13 Total (#) 6 30 51 64 75 226 Total (%) 3 13 23 28 33 100
Soil Management Group 5
<60 60-114 115-164 165-269 >269 Total Very
Low Low Medium High Very
High
1995 0 3 3 4 2 12 1996 2 0 5 4 1 12 1997 2 8 3 2 3 18 1998 1 5 4 8 2 20 1999 10 3 3 7 4 27 2000 4 6 15 19 6 50 2001 3 1 11 0 0 15 Total (#) 22 26 44 44 18 154 Total (%) 14 17 29 29 12 100
Soil Management Group 6
<60 60-114 115-164 165-269 >269 Total Very
Low Low Medium High Very
High
1995 0 0 0 0 0 0 1996 0 0 0 0 0 0 1997 0 0 0 0 0 0 1998 0 0 0 0 0 0 1999 0 0 0 0 0 0 2000 0 0 0 0 0 0 2001 0 0 0 0 0 0 Total (#) 0 0 0 0 0 0 Total (%) - - - - - -

Ketterings, Q.M., H. Krol, and W.S. Reid (2004). Nassau County Soil Sample Survey 1995-2001. CSS Extension Bulletin E04-20. 21 pages.
16
Number of home and garden samples within each potassium classification: Summary (#)
Very Low
Low
Medium
High
Very High
Total
1995 1 9 8 19 20 57 1996 3 11 23 29 40 106 1997 7 18 20 14 29 88 1998 3 5 12 24 31 75 1999 10 9 9 25 23 76 2000 4 11 37 49 33 134 2001 3 7 21 4 6 41 Total # 31 70 130 164 182 577
1995
1996
1997
1998
1999
2000
2001
Lowest: 54 35 38 35 27 27 17 Highest: 1359 709 1957 2296 1290 2274 1380 Mean: 224 222 221 247 221 214 171 Median: 176 189 133 182 177 161 122
Percent of samples submitted for home and garden within each potassium classification. Summary (%)
Very Low
Low
Medium
High
Very High
Total
1995 2 16 14 33 35 100 1996 3 10 22 27 38 100 1997 8 20 23 16 33 100 1998 4 7 16 32 41 100 1999 13 12 12 33 30 100 2000 3 8 28 37 25 100 2001 7 17 51 10 15 100 Grand Total 5 12 23 28 32 100

Ketterings, Q.M., H. Krol, and W.S. Reid (2004). Nassau County Soil Sample Survey 1995-2001. CSS Extension Bulletin E04-20. 21 pages.
17
8. Magnesium
Number of home and garden samples within each Mg range (lbs Morgan Mg/acre):
<20
20-65
66-100
101-199
>199
Total
Very Low
Low Medium High Very High
1995 0 0 4 12 41 57 1996 0 3 2 12 89 106 1997 0 2 3 15 68 88 1998 0 1 2 9 63 75 1999 0 3 3 17 53 76 2000 0 2 2 23 107 134 2001 1 2 1 8 29 41 Total 1 13 17 96 450 577
1995
1996
1997
1998
1999
2000
2001
Lowest: 85 29 54 32 47 50 13 Highest: 1814 1019 1594 2474 1587 12657 1191 Mean: 350 373 389 397 315 438 313 Median: 336 335 286 330 244 285 250
Percent of home and garden samples within each Mg range (lbs Morgan Mg/acre):
<20
20-65
66-100
101-199
>199
Total
Very Low
Low Medium High Very High
1995 0 0 7 21 72 100 1996 0 3 2 11 84 100 1997 0 2 3 17 77 100 1998 0 1 3 12 84 100 1999 0 4 4 22 70 100 2000 0 1 1 17 80 100 2001 2 5 2 20 71 100 Total 0 2 3 17 78 100
Ketterings, Q.M., H. Krol, and W.S. Reid (2004). Nassau County Soil Sample Survey 1995-2001. CSS Extension Bulletin E04-20. 21 pages.
18
9. Iron
Iron (lbs Fe/acre Morgan extraction) in samples for home and garden: Total number of samples: Percentages:
0-49
>49
Total
0-49
>49
Total
Normal Excessive Normal Excessive 1995 54 3 57 95 5 100 1996 105 1 106 99 1 100 1997 86 2 88 98 2 100 1998 74 1 75 99 1 100 1999 68 8 76 89 11 100 2000 131 3 134 98 2 100 2001 41 0 41 100 0 100 Total 559 18 577 97 3 100
1995
1996
1997
1998
1999
2000
2001
Lowest: 2 2 1 1 1 1 2 Highest: 193 94 101 50 67 328 34 Mean: 16 11 11 10 17 12 9 Median: 8 7 7 6 10 7 6
Ketterings, Q.M., H. Krol, and W.S. Reid (2004). Nassau County Soil Sample Survey 1995-2001. CSS Extension Bulletin E04-20. 21 pages.
19
10. Manganese
Manganese (lbs Mn/acre Morgan extraction) in samples for home and garden: Total number of samples: Percentages:
0-99
>99
Total
0-99
>99
Total
Normal Excessive Normal Excessive 1995 57 0 57 100 0 100 1996 105 1 106 99 1 100 1997 88 0 88 100 0 100 1998 75 0 75 100 0 100 1999 75 1 76 99 1 100 2000 134 0 134 100 0 100 2001 41 0 41 100 0 100 Total 575 2 577 100 0 100
1995
1996
1997
1998
1999
2000
2001
Lowest: 3 4 1 5 4 2 1 Highest: 31 140 83 79 337 64 51 Mean: 15 20 18 20 24 13 14 Median: 16 18 14 17 16 9 11
Ketterings, Q.M., H. Krol, and W.S. Reid (2004). Nassau County Soil Sample Survey 1995-2001. CSS Extension Bulletin E04-20. 21 pages.
20
11. Zinc
Zinc (lbs Zn/acre Morgan extraction) in samples for home and garden: Total number of samples: Percentages:
1995
1996
1997
1998
1999
2000
2001
Lowest: 0.1 0.9 1.1 1.2 1.9 0.5 1.1 Highest: 177.2 86.7 251.7 63.4 137.4 105.5 339.8 Mean: 22.0 12.6 19.3 13.6 17.8 13.5 27.4 Median: 10.3 11.2 13.6 8.5 8.8 7.6 12.2
<0.5
0.5-1.0
>1
Total
<0.5
0.5-1.0
>1
Total
Low Medium High Low Medium High 1995 0 1 56 57 0 2 98 100 1996 0 1 105 106 0 1 99 100 1997 0 0 88 88 0 0 100 100 1998 0 0 75 75 0 0 100 100 1999 0 0 76 76 0 0 100 100 2000 0 11 123 134 0 8 92 100 2001 0 0 41 41 0 0 100 100 Total 0 13 564 577 0 2 98 100
Ketterings, Q.M., H. Krol, and W.S. Reid (2004). Nassau County Soil Sample Survey 1995-2001. CSS Extension Bulletin E04-20. 21 pages.
21
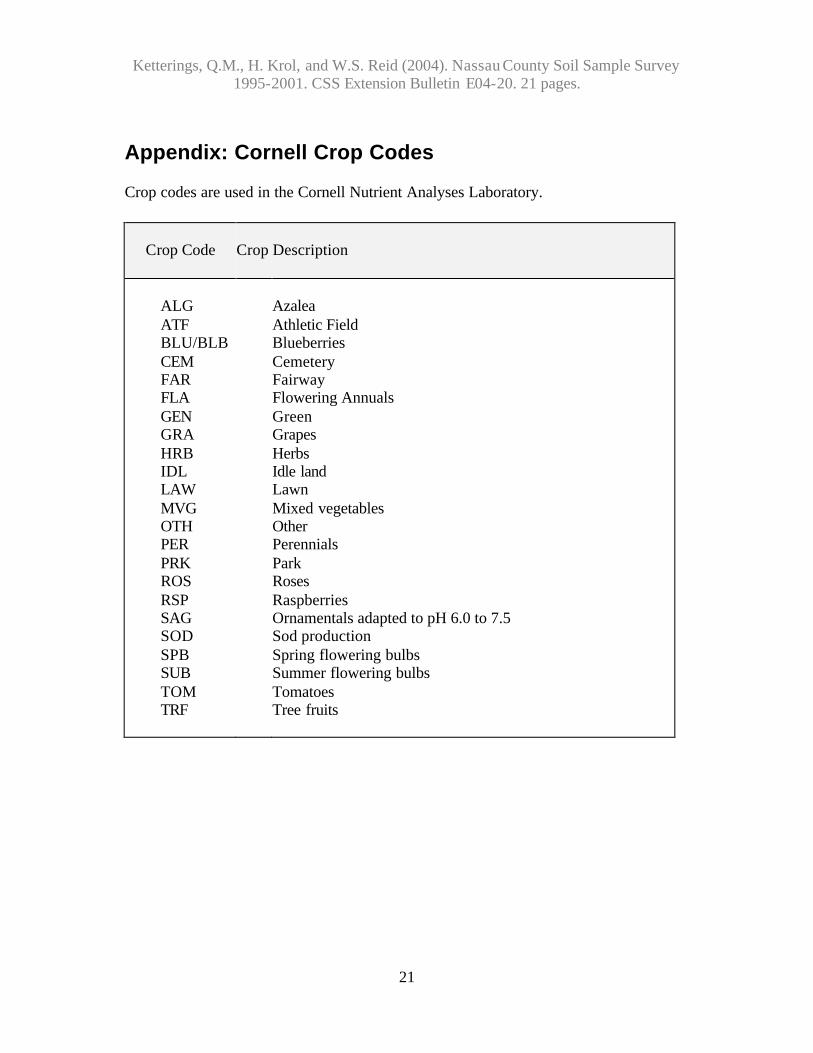
Appendix: Cornell Crop Codes
Crop codes are used in the Cornell Nutrient Analyses Laboratory.
Crop Code
Crop Description
ALG ATF BLU/BLB CEM FAR FLA GEN GRA HRB IDL LAW MVG OTH PER PRK ROS RSP SAG SOD SPB SUB TOM TRF
Azalea Athletic Field Blueberries Cemetery Fairway Flowering Annuals Green Grapes Herbs Idle land Lawn Mixed vegetables Other Perennials Park Roses Raspberries Ornamentals adapted to pH 6.0 to 7.5 Sod production Spring flowering bulbs Summer flowering bulbs Tomatoes Tree fruits