soil fertility and soil loss constraints on crop … fertility and soil loss constraints on crop...
TRANSCRIPT


Printed in the United States of America Available from: National Technical Information Service U.S. Department of Commerce 5285 Port Royal Road Springfield, VA 22161 Price:
Microfiche $3 .OO Printed Copy $ 4.50
NOTICE
This report was prepared as an account of work sponsored by the United States Government. Neither the United States nor the United States Department of Energy, nor any of their employees, aor any of their contractors, subcontractors, or their employees, makes any warranty, e-qress or implied, or assumes any legal iia- Siiity or responsibility for the accuracy, completeness or usefulness of any hformation, apparatus, product or process disclosed, Gr represents that its use would not infringe privately owned zighrs.

SILVIO F L A I M
JULY 1979
PREPARED UNDER TASK No. 3321.3
Solar Energy Research Institute 1536 Cole Boulevard Golden, Colorado 80401
A Division of Midwest Research lnstitlite
Prepared for the U.S. Department of Energy Contract No. EG .77C .01.4042

FOREWORD
This report is the first of a series concerning agricultural production of biomass feedstocks for energy conversion. The Analysis Division of the Solar Energy Research Institute is examining two agriculture-for-energy strategies: direct combustion of crop residues and conversion of corn to alcohol. Soil fertility and soil loss constraints on crop residue removal for energy production are necessary to estimate the costs of residue collection. This report presents estimates of the amount of residue that may be removed while maintaining maximum long-term soil productivity on two sample farms. Other reports in this series address the costs of residue collection, transportation, storage, and combustion; and a summary of the processes, products, and product values from conversion of corn to alcohol. These data will be employed in a macroeconomic analysis to determine the agricultural sector impacts of large-scale use of agricultural products for energy supply. The author acknowledges the helpful comments of Carl Strojan, Robert Inman, Bert Mason, and Kathryn Lawrence.
R
Economic Analysis Branch
Approved for:
SOLAR ENERGY RESEARCH INSTITUTE
ez---sd* Melvin K. Simmons, Assistant Director Analysis Division
iii

iv

SUMMARY
Federal research programs are currently examining the technical and economic potential of many different biomass feedstocks for energy conversion. The environmental conse- quences of producing and collecting each type of feedstock must be examined on an individual basis. This report presents estimates of the soil fertility and soil loss con- straints on crop residue removal for energy production.
The value of crop residues for fertility maintenance and erosion control is well documented for all agricultural regions in the United States (Larson 1979, p. 75). Crop residues contribute to soil fertility maintenance by increasing water infiltration, reducing evaporation losses, recycling minerals and nutrients, and promoting biological decomposition and soil aeration. Biological activities are very important in soil forma- tion, and physical and chemical weathering of substrate materials replenishes some nutrients lost by residue removal.
Nutrient losses by residue removal are dominated by the nutrients lost when soils are eroded (Barrows and Kilmer 1963, p. 303). Current cultivation practices contribute to the selective removal of the upper, more fertile portions of the soil.
Crop residues not only reduce erosion and maintain nutrient balances, but also conserve soil moisture (Hide 1954, p. 235). Residues increase water intake by preventing the formation of a compacted layer caused by raindrop impact on bare soil (Duley and Kelly 1939). The most economical treatment for controlling evaporation and soil loss is a crop residue mulch (Adams 1966, p. 110).
Wind and water erosion are the principal causes of soil loss in U.S. agriculture. The factors affecting water erosion have been researched thoroughly. These factors describe the soil characteristics (slope and erodibility), the amount and intensity of rainfall, and crop management practices. Crop management practices, including residue mulches, are the most important factors that determine soil loss by water erosion (Wischmeier and Smith 1965).
The factors affecting soil loss by wind erosion are understood well. These factors are similar to those for water erosion and relate principally to the soil's characteristics and wind regimes. Residue management practices are an effective means of controlling soil losses except when wind speeds exceed 20 mph (Woodruff and Siddoway 1965, p. 602).
Residue mulches used to control water erosion serve a double function of reducing soil losses by wind erosion. However, wind and water erosion constraints will seldom be binding at the same place at the same time. The larger amount of residues required will be the binding constraint on productivity maintenance. High levels of productivity can be maintained if soil losses are small because soils are constantly being formed. The rate at which soils are formed determines the "soil loss tolerance,'' the maximum rate of erosion that will permit a high level of soil productivity to be sustained economically and indefinitely . The most common methods to maintain soil fertility, conserve soil moisture, and control erosion are mulching, crop rotations, and reduced fillage practices. Crop residue mulches may be scattered across the soil surface or inserted vertically. Mulches increase water intake, reduce evaporation losses, recycle nutrients, and control erosion. Crop rotations control erosion losses and replenish nutrients (Taylor et al. 1964, p. 124).
V

Reduced tillage or conservation tillage practices in conjunction with residue mulches are the most effective means of maintaining a high level of soil productivity and reducing soil losses (Gupta et al. 1979, p. 78).
Crop residue mulches can have detrimental effects on soil productivity. These detrimen- tal effects include but are not limited to (1)reductions in soil temperatures which depress germination rates and delay plant maturity (Lawson et al. 1960), (2) reductions in nitrate formation (Adams 19651, (3) production of substances that are toxic to germina- tion, (4) increases in pesticide requirements, and ( 5 ) creation of substances that increase the potential for plant disease (Anderson and Russell 1964). The effects of items 2 through 5 on crop yields have not been quantitatively separable. Usually, residues have no deleterious effects with conventional residue management practices.
In general, one ton of residue per acre provides good protection from erosion but any nutrients lost by residue removal must be replaced. Minimum residue requirements depend upon climatic conditions, soil types, rainfall, wind regimes, previous erosion, and other factors. However, most soil scientists agree that the amount of residues available for energy conversion is determined largely by tillage practices. For the sample form situations described in this report, about 60% of all residues produced are available as a biomass feedstock with conventional tillage, and 80% are available with conservation tillage in north-central Oklahoma. For Iowa, the percentages are 65% and 86% for conventional tillage and conservation tillage respectively. Residue availability is defined by the Soil Conservation Service as the amount of residue that can be removed without exceeding soil loss tolerances.
vi

TABLE OF CONTENTS
Page
1.0 Introduction ......................................................... 1
2.0 Soil Fertility Constraints on the Collection of Crop Residues for Biomass Feedstocks ........................................ 5
2.1 Nutrient Depletion and Soil Tilth .................................. 5 2.2 Water Infiltration. Evaporation. and Soil
Productivity .................................................... 6
3.0 Soil Loss Constraints on the Collection of Crop Residues for Biomass Feedstocks ............................................... 9
3.1 Water Erosion .................................................. 9 3.2 Wind Erosion ................................................... 11
4.0 Crop and Residue Management Practices to Maintain Soil Fertility. Conserve Soil Moisture. and Control Erosion ............................................................. 13
4.1 Mulching with Conventional Tillage and Vertical Mulch Practices ................................................. 13
4.3 Reduced Tillage and Other Crop and Residue Management Practices ........................................... 17
4.4 Detrimental Effects of Excess Mulch .............................. 21
4.2 Crop Rotations ................................................. 14
5.0 Estimates of Acceptable Soil Loss Limits for Sample Farms .............................................................. 29
5.1 North-Central Oklahoma ......................................... 29 5.2 Central Iowa ................................................... 29
6.0 References .......................................................... 31
7.0 Bib~ography ......................................................... 35
vii

viii

LIST OF TABLES
Table Page
2-1 Percentages of N, P, and K in Crop Residues Compared with Those in Residues Plus Grain ............................................... 5
4-1 Comparison of Soil and Water Losses between Corn after Corn with Corn Stover Mulch and Corn, Oats, and Hay in 3-Year Rotation with Corn Residues Removed.............................................. 15
4-2 Comparison of Corn Yields between Corn after Corn with Corn Stover Mulch and Corn in a 3-Year Rotation of Corn, Oats, and Hay with Corn Residues Removed.............................................. 16
4-3 Residue Production by Crops in MLRAs ................................ 18
4-4 Percentage of Cultivated Land in Row Crops (Corn and Soybeans) by Slopeclassand MLRA ............................................... 18
4-5 Estimated Percentage of Total Cropland Area by Slope Class from Which Residues Can Be Removed without Exceeding the Erosion Tolerance Levels if Conventional and Conservation Tillage Areused.................................................... 19
4-6 Weighted Average Soil Loss, Soil Loss Tolerance Level (T), and Percentage of Cultivated Area That Is Less Than or Equal to T for the Tillage and Residue Systems Used in MLRAs in the Corn Belt.. ............................................ 20
4-7 Crop Residue Production in Eastern Oregon and Availability of Residues for Off-Site Use, Based on Need for Water Erosion Control in a Management System with 122-Meter Slope Length and Contour Tillage ..................................................... 22
4-8 Runoff, Infiltration, and Soil Loss from Cornstalk Residue Studies on 35-ft by 10-ft Plots of Warsaw Loam with 4-4.5% Slope,1958 .................................................. 23
4-9 Effect of Mulches on Weight, Height, and Yield of RS-610 Grain Sorghum in 1960 .................................................... 25
4-10 Yields (bu/a) of Spring Wheat Grown on Summer-Fallowed Plots Covered with Bright Straw Immediately after Seeding.. .................. 26
4-1 1 Yields (bu/a) of Winter Wheat Grown on Summer-Fallowed Plots Covered with Bright Straw Immediately after Seeding.. .................. 27
ix

X

SECTION 1.0
INTRODUCTION
The potential contribution of biomass to U.S. energy supplies is subject to wide specula- tion. The competitiveness of biomass products (and potential contribution) depends on the costs of conversion and feedstock production. Four sources of biomass feedstocks currently are being considered in federal programs:
0 agriculture - food - silvicultural krops - crop residues
- - ocean energy farming
- municipal solid waste (MSW) - sewage and manure
- standing forests - noncommercial timber - forest residues
0 aquaculture "water meadow" techniques for purifying sewage by growing fuel crops
0 wastes
0 silviculture
Each feedstock source has different technical and economic potential, and each can be used for a variety of conversion processes. The environmental consequences of producing and collecting each type of feedstock must be examined on an individual basis.
Biomass feedstocks produced by the agricultural sector pose difficult questions for Congressional policy makers. First, to what extent may subsidies to agriculture (about $5 billion in 1978) be redirected from limiting food production to stimulating production of energy crops? Second, if energy crops can be produced at a low enough cost to compete with conventional fuels, what are the impacts on consumer prices for food and fiber, if a large commitment is made to agricultural energy production? Third, in an attempt to substitute for expensive imported fuels, what are the consequences of a major crop failure if food and crop residues are committed to energy production? Fourth, can energy crops be produced and can crop residues be harvested without depleting soils and groundwater?
This research report specifically addresses the question of crop residue utilization, estimating the soil fertility and soil loss constraints on crop residue removal for energy production. In addition to uses for energy, crop residues may be used to make industrial chemicals, fed to livestock, or used for environmental protection to reduce soil loss and enhance soil fertility. When returned to the soil, crop residues retain plant nutrients and help maintain soil porosity and tilth for maximum soil productivity (Larson 1979, pp. 74- 76). Crop residues left on the soil surface increase water infiltration, which affects soil water storage and plant use (Larson et al. 1960, pp. 629-637). In addition, residues curtail soil detachment by raindrop impact, and by reducing the velocity of runoff which determines the potential to detach and transport soil (Borst and Woodburn 1942, p. 21). Proper use of crop residues can be the least expensive means to control wind and water
1

erosion and to maintain the quantity and quality of water runoff from agricultural land (Chepil et al. 1963, p. 319).
The usefulness of residues to control soil erosion by wind or water has been fairly well researched. Generally, one ton of residue per acre provides good protection, but mini- mum requirements depend upon climatic conditions, soil types, rainfall, wind regimes, and other factors (Larson 1979, p. 74). However, most soil scientists agree that the degree of effectiveness in conserving soils and the amount of residues available for energy conversion are determined largely by tillage practices (Lindstrom et al. 1978, pp. 1-10]. Tillage practice factors appear in the wind and water erosion equations used for empirical estimation, and to a large extent they determine whether or not any crop residues may be removed. Estimates of "safe" removal levels are in some cases 10 times higher with reduced tillage practices than crops produced by conventional means (Campbell et al. 1979, p. 84; Allmeras et al. 1979, p. 87). Reduced tillage practices not only increase the amount of residue available for energy production, but they also increase long-term soil productivity, improve the water characteristics of soils, and are substantially less energy intensive and less costly (Larson 1979, p. 75).
Generally, maximum conservation of residues is desirable for all of the above mentioned purposes. However, the deleterious effects of large quantities of residues also have been identified. A residue mulch influences soil temperature and net radiation by reflecting incident radiant energy, by insulation, and by reducing evaporation. In general, mulched soils are cooler in the spring and summer and warmer in the fal l and winter. Residues applied as mulches to a seeded crop have depressed the early growth of corn and delayed the maturity of spring wheat, primarily because the mulched soil remained cooler than a bare soil (Larson 1960, pp. 629-637).
Nitrate formation is depressed where residue is maintained on the surface or incorpo- rated into the soil (Adams 1965, p. 471). The depressive effects of a surface mulch occur over a longer period of t ime and are not as immediately apparent when residues are incorporated. However, placement studies have shown tha t the depressed early growth of corn, resulting from high rates of residue mulch, was not a consequence of nitrogen immobilization and occurred independently of nitrogen fertility levels (Anderson and Russell 1963, p. 109).
There is evidence that substances which are toxic to germination and growth are pro- duced during the early stages of decomposition of some residues. Plant diseases associ- ated with surface mulches also have been reported. However, these factors have an indiscernible influence on the growth stages of the crop under conventional management practices that use moderate levels of residue (Anderson and Russell 1963, p. 1109).
Crop residues may increase insect populations and require increased use of pesticides. This topic has not been well researched and conclusions are tentative at best (Pruess and Petty 1973; USDA 1975).
Crop residues applied at high rates appear to have few adverse impacts on soil moisture (Adams 1966, p. 110). Moisture conservation occurs primarily where the soil surface maintains a high moisture content due to frequent rainfall or a high water table. A residue mulch slows the rate of evaporation until the surface dries, and then assumes a less important role in controlling evaporation (Hanks and Woodruff 1958).
Surface mulches using crop residues have advantages and disadvantages tha t must be traded off to maintain long-term soil productivity. Optimum application rates can be
2

determined for a specific set of management practices and soil types, but also are dependent on the costs of application and the value of nutrients displaced.
Section 2.0 reviews the soil fertility aspects of removing crop residues. Section 3.0 reviews the methods and factors influencing soil loss by removing crop residues. Section 4.0 identifies the methods to maintain soil fertility, soil moisture, and control erosion. Section 5.0 presents the estimates of acceptable soil loss limits for the sample farms. A selected bibliography is included for those interested in pursuing further research.
3

4

SECTION 2.0
SOIL FERTILITY CONSTRAINTS ON THE COLLECTION OF CROP RESIDUES FOR BIOMASS FEEDSTOCKS
2.1 NUTRIENT DEPLETION AND SOIL TILTH
Soil information is the process in which native vegetation extracts chemical nutrients and water from the soil and returns the essential nutrients to the surface soil as the vegetation decays. Soil formation also depends on the physical and chemical weathering of substrate materials. Naturally fertile soils are formed over thousands of years. Modern agricultural practices have drastically altered this continuous recycling and concentration of materials essential for plant growth in two ways. First, harvesting removes some of the nutrients extracted from the soil and, second, cultivation techniques have accelerated erosion and residue decay. Soil fertility is maintained with the application of commercial fertilizers but cultivation contributes to the selective removal of the upper, more fertile portions of the soil.
Soil fertility is not simply a function of physical and chemical processes. Biological activities are also important, but are not discussed in detail here because of their complexity and because they are not well understood. For example, what effect does residue removal have on the soil organisms which are responsible for organic matter breakdown, humus formation, and mineral cycling? What effect does residue removal have on soil carbon: nitrogen ratios, which can influence the rate at which organic matter is broken down.
Biological processes are essential to soil remineralization. Witkamp (197 1, p. 87) identifies the associated biological processes for soil remineralization. These processes are: nutrient input, fragmentation and transportation by soil fauna, chemical decomposi- tion, remineralization by microflora, and output via root uptake. Biological processes also are essential to weathering of substrata, which contributes to soil formation (Jorgenson 1975, p. 401).
Table 2-1. PERCENTAGES OF N, P, AND K IN CROP RESIDUES COMPARED WITH THOSE IN RESIDUES PLUS GRAIN^
Crop N P K
Barley Corn Oats Rice
Sorghum Wheat Cotton Soybeans
Rye
30 43 33 38 30 57 29 47 38
22 41 43 33 43 45 15 31 36
76 78 84 88 72 86 70 70 48
aHolt 1979, p. 97.
5

Crop residues are a substantial reservoir of plant nutrients. Table 2-1 shows the per- centages of nitrogen (N), phosphorus (P), and potassium (K) in various crop residues as a percentage of nutrients in the entire plant. The figures in Table 2-1 represent the portion of nutrients that may be recycled after harvest. In total, more than half of all the nutrients in a single crop are removed when the grain is harvested.
The value of crop residues for erosion control and fertility maintenance is well documented in all regions of the United States (Larson 1979, pp. 74-76). Residues can directly affect the nutrient content of the surface soil. This effect is intensified by the selectivity of the erosion process. Eroded soil is richer in nutrients than the soil from which it was derived (Barrows and Kilmer 1963, pp. 303-316). Holt notes, "In the Corn Belt an opportunity exists to balance nutrient gains and losses through conservation tillage and residue management" (Holt 1979, p. 96). Under reduced till and no-till systems, soil losses are reduced to a point that removal of crop residues is possible but nutrients lost from residues must be replaced.
According to Holt's and others' calculations, if all the residues are removed from a 150 bu/acre corn crop and the average amounts of nutrients lost by water erosion are added, the total amount of nitrogen lost under conventional tillage would range from 131-191 lb/acre (Labon 1979, p. 75). This amounts to about $14.00 worth of applied N/acre. However, with crop rotations and improved crop management practices, these losses could be reduced to negligible amounts.
Nutrient loses under conventional tillage practices are dominated by the nutrients lost when soils are eroded. Reducing soil loss is the major contribution of crop residues t o maintain proper nutrient balances. Soil losses are more easily controlled by reduced till practices. Another possibility of maintaining nutrient balances is to apply the ashes of residues used in direct combustion applications to the land from which residues are removed. Several studies are examining the fertilizer value of residue ash but no conclusions are available yet.
Crop residues are necessary to maintain proper levels of tilth, the organic matter in the soil that allows aeration and promotes soil productivity. The levels of residue necessary to maintain optimum tilth depend on the soil type. If soils have been depleted by poor management practices, it may be necessary to return all residues to the soil to increase soil fertility and tilth. Few studies have examined the relationship between residue removal and optimum levels of tilth. Generally, land currently in production requires less residue for tilth maintenance than for erosion control. Tilth requirements are m e t if enough residues are used to control erosion.
2.2 WATER INFILTRATION, EVAPORATION, AND SOIL PRODUCTIVITY
The low rate of water infiltration and the resulting high rates of runoff and soil loss from cultivated land have been shown in many test plot studies. Crop residues not only reduce erosion and maintain nutrient balances but also conserve soil moisture, which can be a limiting factor in crop production even in wet humid areas. In dryland areas of the United States, stream flow and transpiration account for 25-30% of all precipitation and evaporation accounts for 70-75% (Hide 1954, p. 235). In dryland areas where summer droughts are common, any reduction of evaporation of soil moisture would be as bene- ficial to crop growth as additional water intake by the soil. Mulches of crop residues are useful in reducing evaporation and modifying soil temperatures.
6
Soil moisture evaporation occurs in three stages (Lemon 1956, p. 120). The first stage is a rapid steady loss dependent upon the rates of transmission through the soil and the aboveground external conditions; windspeed, temperature, relative humidity, etc. The second stage begins when a dry diffusional barrier develops between the soil and the atmosphere. The rate of evaporation loss declines rapidly as the soil reservoir is depleted. In the second stage, the intrinsic soil factors dominate the rate of evaporation by transmitting moisture to the surface. The third stage may be represented by extremely slow moisture movement . The greatest potential to reduce evaporation is during the first two stages of the evaporation process. Lemon investigated three potential ways to reduce evaporation: ll(a) decreasing the turbulent transfer of water vapor above the ground surface; (b) decreasing capillary continuity; and (c) decreasing the capillary conductance of water to the surface by the application of SurfacfantP (1956, p. 121).
Jacks et al. observed that a mulch reduced evaporation where the soil moisture content at the surface was maintained at a high level but had little influence on evaporation in less humid regions (1955, p. 87). Russell reported that straw mulches were very bene- ficial to soil moisture storage when runoff was a factor but were of little or no value when rains were few and scattered (1939, pp. 65-70).
Crop residue mulches also are useful to increase water intake. Duley and Kelly found that covering the soil surface with straw increases infiltration by preventing the forma- tion of a compacted layer caused by raindrop impact on bare soil (1939). Although the major contribution of a mulch in reducing erosion appears to be the elimination of the destructive effect of raindrop impact on the soil surface (Borst and Woodburn 1942a, pp. 19-22), the depth of water over the soil surface (surface detention) has been found to be greater and the rate of runoff less on mulched plots than bare plots (3orst and Woodburn 1942b).
Crop residues are not the only means available to control evaporation losses and increase water infiltration. Gravel, pebbles, and field stones have been shown to be more effective than crop residues in decreasing evaporation losses by reflecting heat and reducing the amount of soil surface exposed to external influences (Adams 1966, p. 110).
Certain organic chemicals can be used to increase the moisture retention characteristics of soils. Dioctadecyl dimethyl ammonium chloride (DDAC) is effective in reducing evaporation. Lemon has studied the effects of surfactants on surface tension at soil interfaces and has concluded that decreasing evaporation by chemically decreasing t h e wettability of soils is possible (1956, pp. 120-125). DDAC is more effective in reducing evaporation than gravel or straw mulches because it retards capillary movement. However, Adams concludes that the most economical treatment for controlling evapo- ration, runoff, and erosion is 8 2-in. straw (1966, p. 114).
Several studies have examined the effects of wind and other external conditions on evaporation from cultivated land to determine if crop residues are an effective means of conserving groundwater. Gardner and Gardner conclude that although external condi- tions affect evaporation in the very short term, the maximum average rate of drying is almost entirely determined by water movement within the soil, and water movement is only slightly influenced by temperature gradients (1969, p. 196). However, Hanks and Woodruff found mulches to be a very effective means of reducing evaporation losses (1958, p. 164). They further note that 96% of the potential reduction was brought about by increasing the depth of mulch from 0 to 1/4 in. and a 1/4-in. mulch appears to be almost as effective as a 1 1/2-in. mulch.
7

8

SECTION 3.0
SOIL LOSS CONSTRAINTS ON THE COLLECTION OF CROP RESIDUPS FOR BIOMASS FEEDSTOCKS
The effects on soil fertility arising from crop residue removal have been identified. The following section identifies the two principal causes of soil loss: water and wind erosion. Factors affecting soil loss rates and methods of estimating soil loss are identified.
Soil and water conservation require a knowledge of the factors that cause and abate soil and water loss. Since 1930, controlled studies on field plots and small watersheds have yielded valuable information on these causal factors. Since 1940, the development of a soil loss estimating procedure has helped identify the interrelating factors and quantify their impact on rates of soil loss.
Before discussing these factors, it is important to define the term %oil loss tolerance." Wischmeier and Smith note, "The term soil loss tolerance is used to denote the maximum rate of soil erosion that will permit a high level of crop productivity to be sustained eco- nomically and indefinitely1' (1965, p. 2).
Establishment of tolerances for specific soils and topography has been largely a matter of judgment, since both physical and economic factors are considered. Generally, for soils in the United States, the maximum soil loss rates range from one to five tons per year. Soil loss tolerances depend on soil depth, topography, and prior erosion.
3.1 WATER EROSION 1
The most common procedure to estimate soil loss by water erosion is the Universal Soil Loss Equation. Original estimations began about 1940, but no single individual is responsible for its development. The development of the functional form commonly used today has had many contributors; this description does not warrant listing them all here. The empirical application of the soil loss equation is possible in any location where numerical values of the equation factors can be obtained. Most agricultural regions of the United States have been classified by their soil characteristics. Tables and charts allow direct computation of soil loss for many soil types.
The Universal Soil Loss equation is
'
A = R K L S C P
where A is the computed soil loss per unit area, usually expressed in tons per acre, R is the rainfall factor, K is the soil erodibility factor, L is the slope-length factor, S is the slope gradient factor, C is the cropping management factor, and P is the erosion control practice factor.
~
The first factor identified as affecting soil loss rates is rainfall. Rainfall erosion depends on the amount of precipitation and on the frequency and intensity of storms. Borst and Woodburn note that the amount of water flowing overland is of little importance com- pared to drop impact (1942, p. 20). Borst and Woodburn further note that erosion control should center on cushioning drop impact and not preventing overland flow.
9
The rainfall factor, as measured by the universal soil-loss equation, is the number of erosion-index units in an average year's rain. The erosion index measures the erosive force of a specific rainfall. Sediment deposits observed after an unusually intense storm could lead to the conclusion that most erosion is associated with a few rare storms. However, 30 years of measurement have shown that the rainfall factor must include the effects of moderate-size storms as well as severe ones. The research data show that when factors other than rainfall are held constant, storm losses from cultivated fields are directly proportional to the product value of the total kinetic energy of the storm times its maximum 30-minute intensity (Wischmeier and Smith 1965, p. 3).
The second factor to be identified as affecting soil loss by water erosion is soil erodibil- ity. Soil erodibility is distinctly different from soil erosion, because some soils erode more rapidly than others even when slope, rainfall, cover, and crop management factors are the same, Wischmeier and Smith note, Y3oil properties that influence erodibility by water are (1) those that affect the infiltration rate, permeability, and total water capacity, and (2) those that resist the dispersion, splashing, abrasion, and transporting forces of the rainfall and runoff" (1965, p. 9).
The soil erodibility factor, as measured by the universal soil loss equation, is a quanti- tative value experimentally determined. The relative erodibility of different soils is difficult to judge from field observations because soils may have much different erosive characteristics when slope factors and rainfall are varied. The soil erodibility factor must be evaluated independently from the effects of the other factors.
The third and fourth factors to be identified as affecting soil loss by water erosion are measures of slope length and slope gradient. These two factors have been evaluated separately in research but usually are applied as a single topographic factor. The slope length-gradient factor is the expected ratio of soil loss per unit area on a field slope to corresponding loss from the base 9% slope, 72.6 f t long. Field slopes usually are either convex or concave. Although the effects of convexity or concavity have not been evaluated fully, limited data indicate that application of the average gradient of the entire slope length would substantially underestimate soil loss from the convex slopes and would overestimate the loss from concave slopes.
Slope length is defined as the distance from the point of origin of overland flow to either of the following two powers, whichever is limiting: the point at which the slope de- creases to the extent that deposition begins, or the point where runoff enters a well- defined channel. A well-defined channel may be part of a drainage network or a diver- sion ditch or terrace.
The fifth factor, the cropping management factor, is particularly important for this analysis because it directly relates to residue management practices. The effectiveness of management practices is difficult to evaluate independently because crops can be grown continuously or in an infinite number of different rotations, In addition, the ef- fectiveness of crop residue management will depend on how much residue there is, which in turn depends on soil fertility, rainfall, and the timing of management practices.
The cropping management factor is incorporated in the universal soil loss equation and is measured as the ratio of soil loss from land cropped under specific conditions to the cor- responding loss from tilled, continuous fallow. To determine the effectiveness of this factor as it relates to the timing of management practices, the cropping year is divided into five crop stage periods:
10

0 rough fallow, turn plowing to seeding; 0 seedling, seedbed preparation to one month after plowing;
0 establishment, from one to two months after spring or summer seeding except for fall-seeded crops, which includes all the winter months until April or May;
0 growing or maturing crop, end of period three until harvest; and
0 residue or stubble, crop harvest to plowing or new seeding.
Wischmeier and Smith note several relationships between crop management factors and soil erosion that have appeared in the soil conservation literature. The most notable of these relationships is between productivity level and soil loss. In general, soil loss de- creased as crop yields increased, Since high yields are associated with good forage growth, the canopy cover is better, and more residues are returned to the soil.
The final factor to be identified as affecting soil loss by water erosion is erosion control practices. The most important of these supporting practices for cropland are contour tillage, strip-cropping on the contour, terraces, and stabilized waterways. The erosion control practice factor is incorporated into the universal soil loss equation as the ratio of soil loss with the supporting practice to the soil loss with up- and downhill tillage prac- tices,
3.2 WIND EROSION
The most commonly employed method to estimate soil loss by wind erosion is the wind erosion equation developed by Dr. W. S. Chepil (Woodruff and Siddoway 1965, p. 602). The wind erosion equation has been under development for over 30 years. As for the universal soil loss equation, numerical values for many variables have been tabulated for field use,
The wind erosion equation is
E = I F K v M D R
where E is the amount of erosion, measured in tons per acre per year, I is the soil erodibility index, F is surface crust stability, K is soil ridge roughness, v is wind velocity, M is soil surface moisture, D is field distance, and R is vegetative cover.
The first factor to be identified as affecting soil-loss rates by wind erosion is the soil erodibility index. Soil erodibility is the potential soil loss (in tondacre) from a wide, unsheltered, isolated field with a bare, smooth, noncrusted surface (Woodruff and Siddo- way 1965, p. 602). The soil erodibility index was developed from wind tunnel experiments and field measures of erodibility based on climatic conditions for Garden City, Kansas during 1954-1956.
.
The second variable that must be measured to estimate soil-loss rates by wind erosion is surface crust stability. The mechanical stability of a surface crust, if a surface crust is present, matters very little because abrasion from windswept materials disintegrates the crust almost immediately. Surface crust stability is important when erodibility of soils for a given moment is considered. Average erodibility estimated over a longer period of time should disregard this condition.
11

The third variable of importance is the soil ridge roughness factor, a measure of soil surface roughness other than roughness caused by clods or vegetation. It is the natural or artificial roughness in the form of ridges or natural undulations and is usually estimated by actual measurements.
The fourth variable is the velocity of erosive wind. Woodruff and Siddoway have deter- mined that the rate of soil movement varies directly as the cube of wind velocity (1965, p. 603). If average annual soil determinations are desired, the mean annual wind velocity corrected to a standard height of 30 f t is used.
Soil surface moisture affects the rate of soil movement inversely as the square of effec- tive soil surface moisture, Soil surface moisture causes the soil to adhere to itself, thereby decreasing the erodibility of the soil.
Another factor affecting the rate of wind erosion is the measured distance along t h e prevailing wind direction, On an unprotected eroding field, the rate of soil flow is zero on the windward edge and increases with the distance to leeward. If the field is large enough, the flow reaches a maximum that a particular velocity can sustain. The distance required for soil flow to reach this maximum is the same for any erosive wind and varies only and inversely with the erodibility of a field surface. Wind erosion across a field surface is decreased if a barrier of any sort adjoins the field,
The last factor with a significant impact on wind erosion rates is vegetative cover, the type and quantity of cover, and its orientation to the prevailing wind. The quantity of cover is measured by sampling, cleaning, drying, and weighing the plant matter according to standardized procedures. The type of vegetative material is assigned different values according to its ability to resist erosion. The finer the material and the greater the sur- face area it covers, the more it reduces the wind velocity and the more it reduces ero- sion. The orientation of vegetative surface materials is essentially a vegetative surface roughness measurement. The more erect the vegetative matter, the higher it stands and the more it reduces wind velocity near the ground and wind erosion. Vegetation also affects wind erosion by the influence of its distribution.
Crop residue management is incorporated in wind erosion analyses only to the extent that it affects the preceding variables. Residue management affects soil surface moisture and the vegetative cover variables. Residues left to reduce water erosion serve a double function of reducing wind erosion. However, wind and water erosion constraints seldom will be binding in the same place at the same time. The larger amount of residues required will be the amount required to maintain a high level of crop productivity, eco- nomically and indefinitely.
12

SECTION 4.0
CROP AND RESIDUE MANAGEMENT PRACTICES TO MAINTAIN SOIL FERTILITY, CONSERVE SOIL MOISTURE, AND CONTROL EROSION
The effects on soil fertility and soil erosion arising from crop residue removal have been identified. The following section identifies methods to maintain fertility, conserve soil moisture, and control erosion. The most common of these methods is mulching with natural vegetative materials. Typical mulching practices usually involve separating grain from other plant materials during harvest and then redistributing plant matter on the soil surface. Plant materials are then left undisturbed or incorporated in the soil by one of several cultivation practices.
Methods other than mulching that are used to maintain long-term soil productivity are crop rotations, reduced tillage practices, use of chemicals and binders, and construction of terraces and microwatersheds. Costs of these conservation practices are identified wherever possible.
4.1 MULCHING WITH CONVENTIONAL TILLAGE AND VERTICAL MULCH PRAC- TICES
The value of natural mulches in conserving soil and water is well established. Unmulched cultivated land exhibits a low rate of water intake, high rates of runoff, and large amounts of soil loss. It has been noted that mulches are an effective means of control- ling evaporation losses, particularly during short periods after rain has fallen or after irrigation applications. Mulches increase water intake and prohibit the clogging of the pores in the soil surface. Soil Conservation Service workers have found that unmulched wheat land cultivated by conventional tillage practices lost 21.5 t/acre/yr of soil (Borst and Woodburn 1942, p. 2). When these plots were mulched with 1,000 lb/acre of wheat straw, erosion losses were neglible. The most important function of mulches is to protect cultivated land from the dispersive action of raindrops. Mulches control soil loss rather effectively but have little effect on runoff (Borst and Woodburn 1942, p. 22).
Relatively small rates of mulch are effective in reducing erosion on steeply sloping soils, even if these soils have less than moderate permeability (Meyer, Wischmeier, and Foster 1970, p. 928). Mulches increase the path length of runoff, thus decreasing the effective slope steepness and the average runoff velocity. Mulches that lie across a slope act as tiny reservoirs and collect sediment. Meyer et al. found that mulch rates as low as lt/acre reduced soil loss to one-third that of unmulched test plots on soils with slopes ranging from 13-17% (1970, p. 930).
The effectiveness of mulches to control wind erosion has been examined in detail. Chepil compared the effectiveness of mulches with stubble and concluded that, although stubble was less subject to removal by wind, stubble has less effective surface than mulch (1944, pp. 301-319). When anchored to the surface, straw is much more effective than stubble, regardless of wind velocity. However, when merely scattered on the ground, mulch is more effective than stubble, except when winds exceed 20 mph and the mulch is carried away.
Chepil et al. compared the effectiveness of vegetative and nonvegetative materials to control wind and water erosion (1963, pp. 86-89). The comparison included natural
.
13
vegetation, gravel, a resin emulsion, a latex emulsion, and an asphalt emulsion. Emulsion costs and their application ranged from $213-$335 (1963)/acre, and wheat straw applied at the rate of 4,000 lb/acre costs about $89/acre. They note, "None of the nonvegetative materials investigated in these and in previous experiments excelled the well-anchored prairie hay and wheat straw mulches from the standpoint of both cost and effectiveness in controlling wind and water erosion of denuded land" (Chepil et al. 1963, p. 89).
Mulches need not always be applied on the soil surface or incorporated with conventional tillage practices. Vertical mulches are an effective means of conserving soils and groundwater, particularly in arid regions, Fairbourn and Gardner found that a vertical mulch treatment saved 30-40% more water than a conventional furrow-mulch treatment (1972, p. 823). The vertical mulch had about twice the water storage efficiency of the furrow treatment . Microwatersheds used in conjunction with vertical mulches have a dramatic impact on grain sorghum yields because water is concentrated near the plants and infiltration is greater. Fairbourn and Gardner found that grain sorghum yields with vertical mulches and microwatersheds were 37-150% greater than conventional tillage practices (1974, p. 740). Wendt found that grain sorghum yields with vertical mulches exceeded yields with conventional tillage practices only under dryland conditions (1973).
4.2 CROP ROTATIONS
Crop rotations are an effective means of controlling soil and soil moisture losses while replenishing lost nutrients. Typically, crops like corn or cotton are grown in alternating years with grasses and legumes. Although a large part of the soil conservation literature is devoted to controlling soil losses by rotating crops, this short review compares contin- uous cropping with crop residues left for mulch with crops in rotation and residues removed.
Taylor et al. compared the effectiveness of corn, oats, and hay in a three-year rotation and all corn residues removed, with corn planted after corn with a stover and barnyard manure mulch (1964, pp. 123-125). These measurements were made on a number of test plots at Lacrosse and Madison, Wisconsin. Soil and water losses from the test plots are summarized in Table 4-1. The corn stover and barnyard manure mulch gave excellent control of soil and water losses from corn after corn at both locations. Losses from the mulched plots were similar to those measured from hay in rotation. Taylor et al. note, "In 12 of the 16 location-years, soil loss from the mulched plots was too small to measure" (1964, p. 124). Soil losses averaged 0.1 and 3.2 tons and 0.04 and 2.6 t/acre/yr from continuous corn and crops in rotation, respectively.
Table 4-2 summarizes corn yields for corn in rotation and continuous corn during the study period. Grain yields from continuous corn with the stover-manure mulch averaged 6,440 lb/acre with an average yield 168 lb higher for continuous corn than that for corn in rotation. The validity of the yield comparisons is subject to some speculation because of the differences in manure rates. However, the researchers felt that the differences in fertility levels had no great influence on the yield difference, With respect to rainfall and mulching, Taylor et al. note, "Generally, in years when rainfall during the growing season was above average, the yield from corn (SM) was lower than that from corn (R). However, this yield differential was compensated for by higher yields from corn (SM) during years when growing season rainfall was below average" (1964, p. 125). Mulches are more valuable in dry years.
14

Table 4-1. COMPARISON OF SOIL AND WATER LOSSES BETWEEN CORN AFTER CORN WITH CORN STOVER MULCH AND CORN, OATS, AND HAY IN 3-YEAR ROTATION WITH CORN RESIDUES REMOVED~
Runoff Soil loss
Corn 3-year rotation Corn 3-year rotation stover stover
Year mulch Corn Oats Hay mulch Corn Oats Hay
1954 1955 1956 1957 1958 1959 1960 1961 1962
Total Avg.
1955 1956 1957 1958 1959 1960 1961
Total Avg.
0.1 0.1 0.0 0.1 0.0 0.4 0.1 0.1 0.1
1.0 0.1
0.0 0.0 0.0 0.0 0.1 0.7 0.0
0.8 0.1
1.2 0.4 0.0 0.7 0.0 1.2 0.3 0.2 0.1
4.1 0.4
0.0 0.2 0.1 0.2 3.5 5.7 0.0
9.7 1.4
4.1 1.0 0.3 0.8 0.0 2.0 1.3 0.3 1.7
11.5 1.3
0.3 3.1 0.1 0.8 7.4 7.8 1.1
20.6 2.9
La Crosse
0.3 0.1 0.2 0.1 0.0 0.5 0.3 0.0 0.0
1.5 0.2
Madison
0.0 0.2 0.1 0.0 0.7 2.0 0.1
3.1 0.4
0.1 0.2 0.0 0.0 0.0 0.6 0.0 0.0 0.0
0.9 0.1
0.0 0.0 0.0 0.0 0.0 0.3 0.0
0.3 0.04
5.6 1.0 0.0 1.1 0.0 4.2 0.7 0.3 0.0
13.0 1.6
0.0 0.2 0.0 0.3 6.7 17.9 0.1
25.2 3.6
24.5 5.0 0.3 1.2 0.0 20.0 5.7 2.2 14.9
73.8 8.2
2.6 3.1 0.0 1.2 13.0 9.7 0.2
29.8 4.2
0.5 0.0 0.1 0.0 0.0 0.1 0.0 0.0 0.0
0.7 0.1
0.0 0.1 0.0 0.0 0.0 0.0 0.0
0.1 0.01
aTaylor et al. 1964, p. 124.
15

Table 4-2. COMPARISON OF CORN YIELDS BE- TWEEN CORN AFTER CORN WlTH CORN STOVER MULCH AND CORN IN A 3-YEAR ROTATION OF CORN, OATS, AND HAY WITH CORN RESIDUES REMOVED~
Year Corn (SM) Corn (R3
1954 1955 1956 1957 1958 1959 1960 1961 1962
1955 1956 1957 1958 1959 1960 1961
---------- pounds/acre----------
La Crosse
5,656 4,872 8,848 7,000 7,560 8,232 8,064 7,112 8,064
Madison
4,480 5,320 497p - 5,656 4,032 6,608
5,376 3,976 7,672 7,392 6,664 9,352 8,008 7,392 8,624
4,032 4,424 4 9 6 - 6,160 4,480 6,216
~~~~
&raylor et al. 1964, p. 124. bGophers and drought influenced yields.
16

4.3. REDUCED TILLAGE AND OTHER CROP AND RESIDUE MANAGEMENT PRAC- TICES
Crop and residue management practices can be an effective means of controlling soil and water losses and increasing long-term soil fertility. The following section outlines four studies on residue management and soil erosion. The subject areas are the Corn Belt, six southern states, and eastern Oregon. The amounts of residues that may be safely removed vary widely by region, cropping practice, and crops grown. All studies agree that conservation tillage practices reduce soil losses and increase the amount of residues available for energy production. Al l estimates were derived by using the Universal Soil Loss Equation.
Gupta et al. estimated soil loss under five tillage and residue management combinations: X1, conventional tillage using a moldboard plow with residues removed; X2 and X3, con- servation tillage practices with 1,500 and 3,500 lb/acre of corn residue left, respectively; X4 and X5, no till (no tillage except in the seed row) and 1,500 and 3,500 lb/acre of corn residues left, respectively (1979, pp. 77-79). According to their calculations, soil losses may be ranked according to the subscript used to identifv the tillage practice, X1 having the highest soil loss and X5 having the lowest.
Table 4-3 identifies residue production by crops for seven Major Land Resource Areas (MLRA) in Iowa, Illinois, Indiana, and Ohio. Table 4-4 shows the percentage of cultivated land in corn and soybeans by slope class and MLRA. Table 4-5 presents the estimated percentage of total crop land from which crop residues can be removed without exceed- ing the erosion tolerance levels if conventional and conservation tillage are used. Nearly all residues available for removal are in slope class A. Although some residues could be removed in slope class D, the actual amounts available would be negligible because there are so few acres of row crops (Table 4-4). Table 4-4 shows that conservation tillage increases residue yields over conventional tillage for all slope classes except Iowa.
Gupta, et al. fail to identify the amounts of residue available per acre in the preceding study. However, Lindstrom et al., who were working on a different part of the same study, use the same tillage assumptions to calculate a residue estimate for the entire Corn Belt (1979, pp. 80-82). Table 4-6 presents the weighted average soil loss and soil loss tolerance, T, values for the five tillage and residue systems by MLRA. Weighted average annual erosion for conventional tillage in the Corn Belt is 9.8 tons per acre (t/a), twice the Soil Conservation Service allowable limit of 4.5 t/a (Lindstrom et al. 1979, p. 81). Weighted average soil loss for conservation tillage (X, and X3) and no till (X4 and X5) is 6.9, 4.1, 5.4, and 5.1 t/a respectively. The effectiveness of residues in controlling soil erosion is indicated by the decrease in weighted average annual erosion and by the increase in percentage of cultivated area that is less than or equal to T. This percentage increases 36-78% from conventional tillage to no till crop management practices.
Lindstrom et al. estimate that only 35% of all crop residues in the Corn Belt are avail- able for removal under conventional tillage. Conservation tillage increases this percent- age by 10% to a total of 45% available for removal. Another ?% becomes available for removal under tillage practice, X3 (1979, p. 81). If all the residues in the Corn Belt were removed, energy produced from these residues would equal about 30 1,OOO-rvIW power plants (Alich and Inman 1974).
Campbell et al. calculated the crop residues needed for water erosion control in six southern states (1979, pp. 83-85). The percentage of crop residue needed for erosion control is lowest in the Atlantic Coastal Flatwoods of Georgia, where 75% of the
17

Table 4-3. RESIDUE PRODUCTION BY CROPS IN MLRAsa
Residue Production (t/a)
Major Land Resource Area
Small Corn Soybeans Grain
107 (Iowa) 107 (Iowa) 108 (Iowa) 108 (Illinois) 1 10 (Illinois) 111 (Indiana) 111 (Ohio)
2.38 2.90 2.70 3.1 8 2.84 2.50 2.36
1.50 2.98 1.54 3.1 0 1.48 2.22 1.60 2.42 1.48 2.42 1.45 2.54 1.32 2.29
'Gupta, Onstad, and Larson 1979, p. 78.
Table 4-4. PERCENTAGE OF CULTIVATED LAND IN ROW CROPS (CORN AND SOYBEANS) BY SLOPE CLASS AND MLRAa
Percentage of Land in Row Crops by Slope Class Major Land
Resource Area A (0-2%) B (34%) C (6-12%) D (>I 2%)
107 (Iowa) 103 (Iowa) 108 (Iowa) 108 (Illinois) 110 (Illinois) 11 1 (Indiana 111 (Ohio)
26 63 26 56 64 62 48
31 24 29 25 25 17 24
27 6
24 9 6 4 2
2
1 < I
<1 <1 <1 < 1
aGupta, Onstad, and Larson 1979, p. 78.
18
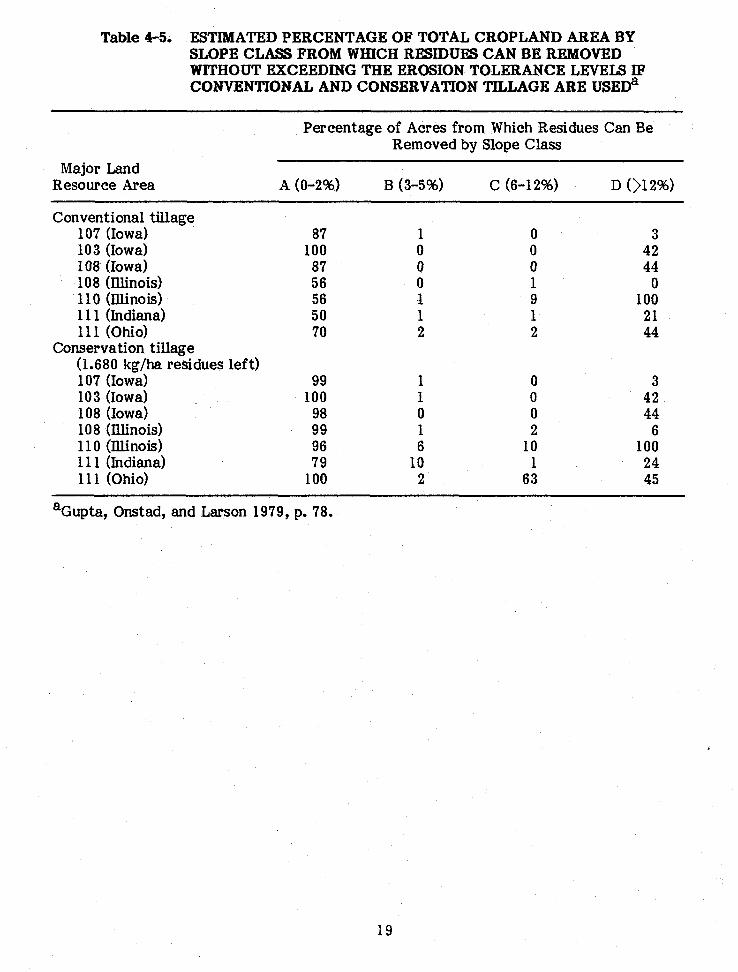
Table 4-5. ESTIlldATED PERCENTAGE OF TOTAL CROPLAND AREA BY SLOPE CLASS FROM WHICH RESIDUES CAN BE REMOVED WlTHOUT EXCEEDING THE EROSION TOLERANCE LEVELS IF CONVENTIONAL AND CONSERVATION TILLAGE ARE USED~
Major Land Resource Area
Percentage of Acres from Which Residues Can Be Removed by Slope Class
A (0-2%) B (3-5%) C (6-12%) D 012%)
Conventional tillage 107 (Iowa) 103 (Iowa) 108 (Iowa) 108 (Illinois) 110 (Illinois) 11 1 (Indiana) 111 (Ohio)
Conservation tillage (1.680 kg/ha residues left) 107 (Iowa) 103 (Iowa) 108 (Iowa) 108 (Illinois) 110 (Illinois) 11 1 (Indiana) 111 (Ohio)
87 100 87 56 56 50 70
99 100 98 99 96 79
100
1 1 0 1 6
10 2
0 0 0 2
10 1
63
3 42 44
0 100 21 44
3 42 44 6
100 24 45
'Gupta, Onstad, and Larson 1979, p. 78.
19

Table 4r6, WEIGHTED AVERAGE SOIL LOSS, SOIL LOSS TOLERANCE LEVEL (T), AND PERCENTAGE OF CULTIVATED AREA THAT IS LESS THAN OR EQUAL TO T FOR THE TILLAGE AND RESIDUE SYSTEMS USED IN MLRAS IN THE CORN BEL@
Tillage and Residue System
102 6.3 60 5.1 103 4.3 67 3.5 104 6.0 55 4.9
2 105 10.6 36 7.8 106 12.7 14 10.3 107 19.9 20 15.1 108 12.3 29 8.8 109 15.4 18 9.5 110 7.3 46 4.9 111 6.4 36 4.3 112 7.8 27 5.3 113 13.1 2 7.9 114 11.3 8 7.1 115 14.0 12 8.6
Weighted average of total area 36
66 71 57 48 20 36 46 33 67 57 43 16 32 48
50
3.1 2.0 2.9 4.8 5.3 8.6 5.1 5.8 2.8 2.8 2.8 4.5 4.2 5.3
81 98 78 64 34 37 62 52 79 73 75 49 62 61
69
4.1 2.8 3.2 5.8 8.6
11.4 6.8 7.4 4.2 3.5 4.3 5.8 5.2 6.3
72 93 63 61 22 31 46 47 68 65 49 40 41 53
59
2.5 1.8 2.4 3.7 4.5 7.1 3.9 4.3 1.9 1.8 2.0 2.9 2.9 3.5
86 98 94 78 54 42 67 60 89 91 92 59 73 73
78
4.9 4.9 4.6 4.5 4.2 4.9 4.7 4.1 4.4 4.1 4.0 3.6 3.9 4.5
aLindstrom et al. 1979, p. 81.
residues produced (700,000 tons) were available for other uses. In all states, conservation tillage greatly reduces potential soil losses. Georgia, North Carolina, South Carolina, and Virginia require 60% of all residues produced for erosion control. Alabama and IMississippi require 90% of all residues for erosion control.
Combinations of tillage and crop residue handling, terracing, and contouring were evalu- ated as water erosion control alternatives in eastern Oregon (Allmaras et al. 1979, pp. 85-89). Table 4-7 presents crop residues available for off-site use in eastern Oregon by MLRA, crop sequence, and crop. Soil erosion exceeded tolerance limits in the wheat fallow sequence on slopes over 20% even when using conservation tillage, terraces, and contour plowing. Tillage and residue management sufficed on slopes less than 12%. The three MLRAs in eastern Oregon produce 1.4 million tons of small grain residues annually, 50% of which can be harvested from 88% of the 850,000 acres harvested.
The effects of three methods of cornstalk residue management on runoff and erosion were studied by Mannering and Meyer in 1958 (1961, pp. 506-510). The methods compared were: (1) cornstalks as left by a cornpicker (check treatment); (2) cornstalks shredded after the corn was picked; and (3) cornstalks shredded and disked once. Soil losses from the shredded treatment were less than half the losses from the check treatment for both soil types (Table 4-8). Since runoff from the two treatments was nearlv identical, the reduction in soil loss was due to the lower soil content of the runoff. Mannering and Meyer conclude that shredding cornstalks can reduce soil losses significantly in winter months but that disking shredded cornstalks is undesirable from a soil conservation standpoint (1961, p. 506).
Two other methods of conservation tillage and management practices are quite common in American agriculture: contouring and terracing. The practice of plowing and planting on surface contours has been effective in reducing erosion. In limited field studies, con- touring has provided almost complete protection against erosion from individual storms of moderate to low intensity, but little or no protection from occasional severe storms (Wischmeier and Smith 1965, p. 36). Contouring provides its maximum protection on slopes of 3-7%. Contour strip-cropping, a practice in which contour strips of sod are alternated with strips of row crops, has proved to be a more effective practice than con- touring alone (Mannering and Meyer 1961, p. 507).
Terracing with contour farming is more effective as an erosion control practice than strip-cropping because the slope is divided into segments equal to the horizontal spacing. Dividing a slope length into four equal segments cuts the expected rate of soil loss in half.
4.4 DETRIMENTAL EFFECTS OF EXCESS MULCH
Soil and water conservation and maintenance of long-term soil fertility require that crop residues be returned to the soil at a rate determined by soil type, slope, and previous erosion. Each of the conservation practices noted require different rates of residue in- corporation. The detrimental effects of excess mulch have been identified. These det- rimental effects include but are not limited to the following: (1) reductions in soil tem- peratures that depress germination rates and delay plant maturity, (2) reductions in ni- trate formation, (3) production of substances toxic to germination, (4) increases in Desti- cide requirements, and (5) creation of substances that increase the potential for plant disease.
21

Table 4-7. CROP RESIDUE PRODUCTION IN EASTERN OREGON AND AVAILABILIPI'Y OF RESIDUES FOR OFF-SITE USE, BASED ON NEED FOR WATER EROSION CONTROL IN A MANAGEMENT SYSTEM WITH 122- METER SLOPE LENGTH AND CONTOUR TILLAGe
Residue Production Residues Available for
Off-site Use
MLRA Crop Sequence, and
B7, WFb B8, WF B9, WF B9 (Wallowa) WF B8 & B9, WP'
hl Crop c.3
Wheat Peas
Thousand Acres Thousand Maximum Yield Thousand Percentage of
Harvested Tons (t/d Tons Harvested Area
82.0 145 657.3 1068 50.7 96 21.3 39
39.3 39.3
73 54
1.66 1.52 1.80 1.76
1.54 1.38
106 648
25 33
48 35
100 90 53 92
82 82
aAllmaras et al. 1979, p. 89.
'WF = wheat-fallow. 'WP = wheat-peas.

Table 4-8. RUNOFF, INFILTRATION, AND SOIL LOSS FROM CORNSTALK RESlDUE STUDIES ON 35-FT BY 10-FT PLOTS OF WARSAW LOAM WITH 44.5% SLOPE, 19SSa
Soil moisture Total prior to run Water infil- soil soil
Treatment 0-5 inches appliedb Runoff tration contentC loss
% by wt. --------- inches--------- % tons/acre
Dry run (60 min)
Check 18.2 2.40 1.47 0.93 0.45 0.75 Shred 18.9 2.40 1.33 1.07 0.20 0.30 Shred and disk 18.1 2.40 0.76 1.64 0.40 0.35
Wet run (48 min)
Check 23.4 1.92 1.38 0.54 0.35 0.55 Shred 22.8 1.92 1.29 0.63 0.13 0.18 Shred and disk 23.6 1.92 0.97 0.95 0.30 0.33
‘Mannering and Meyer 1961, p. 507. bWater applied at intensity of 2.4 in./hr. ‘Percentage by weight of soil runoff = total soil loss/total runoff x 100.
23

Experiments have shown that, during the growing season, the average soil temperature is lower under mulched than unmulched soil. Larson, Burrows, and Willis found that surface mulches frequently retard corn growth early in the season and often result in reduced vields of corn grain (1960, pp. 629-637). They note, "In nearly all cases a mulch signifi- cantly reduced dry matter production during t h e first 6 to 8 weeks of growth following planting'! (Larson, Burrows, and Willis 1960, p. 634). Larson et al. further note, but do not support, the contention that mulches of plant residues frequently aggravate excessive soil moisture problems in the early growing season but retain higher soil moisture during stress periods which usually occur during the later growing season.
In related research, van Wijk, Larson, and Burrows found, "The data from Iowa, Minne- sota, and Ohio support a theory tha t early season growth is decreased by low tempera- tures caused by a mulch of crop residues. The data from South Carolina, where soil tem- peratures were considerably higher than in the three other states, showed that the mulch did not appreciably influence the growth rates" (1959, p. 428). In fact , the authors later state that, if temperatures ranged as high as 94OF, adding a mulch would increase the growth rate of corn by as much as 8%. In nine years of yield measurement in Wisconsin, Taylor et al. found that the presence of mulch had no apparent effect on corn height or color at anv time during the growing season (1964, p. 125).
The detrimental effects of reductions in nitrate formation, production of toxic sub- stances, increases in pesticide requirements, and plant disease potential have been exper- imentally determined although their impacts on yields have not been measured. The impact of these variables in aggregate has been identified in two separate studies.
Adams compared the effect of gravel and straw mulches with soil mulches treated with DDAC (pp. 471-474). The effect of the mulches on sorqhum development is shown in Table 4-9. The effect of treatments on plant height is not significant when the depth of the mulch is taken into consideration. Adams notes, "The yield of grain and forage aver- aged 1,980 and 3,070 lb/a respectively for all gravel mulched plots but 3,010 and 4,000 lb/a for al l bare plots. Yields from the straw mulch plot were slightly lower than the lowest yielding bare plot, 1/3 DDAC-B" (p. 473). Although evaporation losses were low- est in the bare DDAC-treated plots, the soil profile recharged available soil moisture faster under the straw mulch. Adam9 research indicates that a straw mulch is better than gravel mulch, but bare soils and DDAC-treated soils are much more effective in increasing grain sorghum yields, at least in the short run.
Anderson and Russell at tempted to measure the effects of different levels of mulch on spring and winter wheat grown on summer-fallowed plots (1964, pp. 109-118). Mean yields for both crops (Tables 4-10 and 4-11) were lowered in direct relation to the quan- t i ty of straw cover used. On spring wheat plots (Table 4-10) 4,000 lb/a of straw and on winter wheat plots (Table 4-11) 5,000 lb/a of straw were required to deoress mean yields significantly below that of the bare plots. A significant yield depression occurred at the 6,000-lb rate for spring wheat and at the 8,000-lb rate for winter wheat. Anderson and Russell note that heavy straw cover delayed emergency of the plants by one to three davs, delayed maturity by four to six days, and reduced plant populations (1964, pp. 112- 113).
24

Table 4-9. EFFECT OF MULCHES ON WEIGHT, HEIGHT, AND YIELD OF RS-610 GRAIN SORGHUM IN 1960'
Treatment
Average plant Average height,b Yield, wt. (May 261, g in. lb/acre
Forage Oven- May June June (oven-
Green dry 26 2 9 Grain' dry)
No surface cover Bare-check 1/3 DDAC-B 2/3 DDAC-B
Average 2-inch straw Gravel mulch cover
1 -inch gravel 2-inch gravel 1/3 DDAC + 2-inch gravel 2/3 DDAC + 2-inch gravel
Average
36.8 39.1 33.8 36.6 45.1
28.9 28.9 26.3 22.7 26.7d
4.1 4.6 3.5 4.1 4.8
3.0 2.7 2.6 2.0 2.6d
29.0 27.2 29.3 28.5 28.6
27.0 26.8 27.3 24.1 26.3
38.8 35.7 39.3 37.9 40.0
34.3 35.3 35.5 31.3 34.1
39.8 39.0 41.4 40.1 41.2
36.0 37.0 38.7 36.8 37.1
2,890 2,830 3,310 3,010 2,750
1,910 2,100 2,180 1,710d 1,980
3,880 3,930 4,180 4,000 3,380
3,120 3,310 3,280 2,580d 3,070
aAdams 1965, p. 472. bAverage of 1 2 plants per treatment each date. Plants measured from plot or mulch surface to the t ip of
'Corrected to 13% moisture. dDiffer at 1% level from the mean of no surface cover treatments.
extended leaves.
KEY: Bare check = soil with all residues removed. 1/3 DDAC-B = one-third of the surface area covered with a 1-in. layer of DDAC treated soil-bare. 2/3 DDAC-B = two-thirds of t h e surface area covered with a 1-in. layer of DDAC t rea ted soil-bare. 2 in. straw = straw mulch 2-in. thick. 1 in. gravel = gravel mulch 1-in. thick. 2 in. gravel = gravel mulch 2-in. thick. 1/3 DDAC + 2-in. gravel = one-third of the surface area covered with a 1-in. layer of DDAC treated soil + 2.
2/3 DDAC + 2-in. gravel = two thirds of the surface area covered with a 1-in. layer of DDAC treated soil - in. gravel mulch.
2-in. gravel mulch.
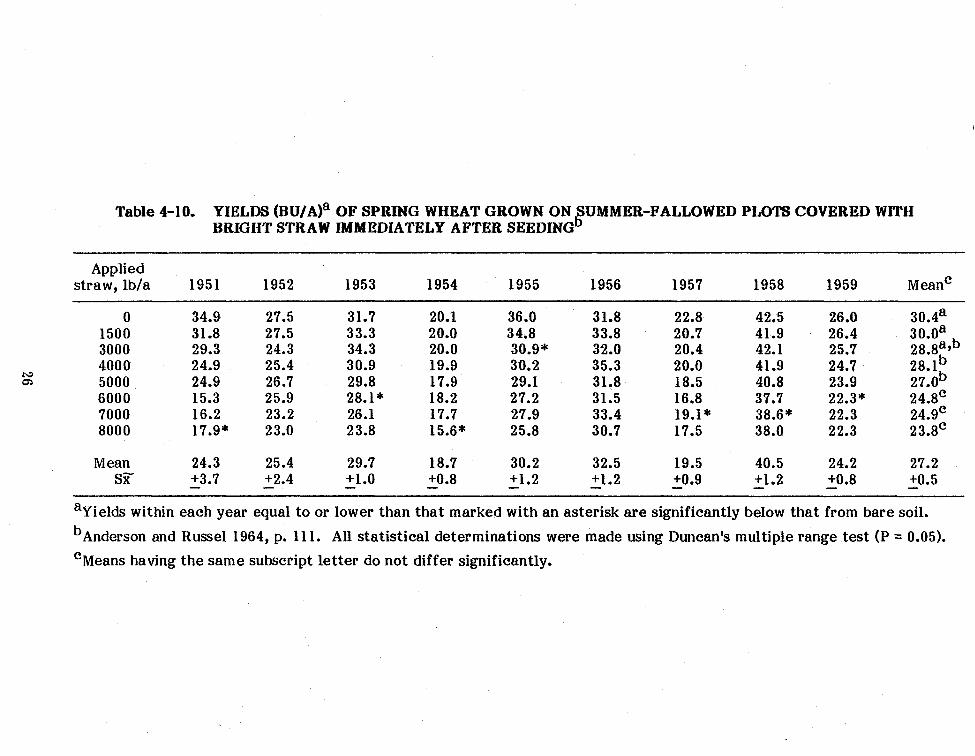
Table 4-10. YIELDS (BU/A)' OF SPRING WHEAT GROWN ON fUMMBR-FALLOWED PLOTS COVERED WITH BRIGHT STRAW IMMEDIATELY AFTER SEEDING
Applied straw, lbla 1951 1952 1953 1954 1955 1956 1957 1958 1959 MeanC
0 1500 3000 4000 5000 6000 7000 8000
N m
Mean SZ-
34.9 27.5 31.8 27.5 29.3 24.3 24.9 25.4 24.9 26.7 15.3 25.9 16.2 23.2 17.9* 2 3.0
24.3 25.4 +2.4 +3.7 - -
31.7 33.3 34.3 30.9 29.8 28.1* 26.1 23.8
29.7 +1.0 -
20.1 20.0 20.0 19.9 17.9 18.2 17.7 15.6"
18.7 +0.8 -
36.0 31.8 34.8 33.8 30.9* 32.0 30.2 35.3 29.1 31.8 27.2 31.5 27.9 33.4 25.8 30.7
30.2 32.5 - +1.2 - +1.2
22.8 20.7 20.4 20.0 18.5 16.8 19.1" 17.5
19.5 +0.9 -
42.5 41.9 42.1 41.9 40.8 37.7 38.6" 38.0
40.5 +1.2 -
26.0 26.4 25.7 24.7 23.9 22.3" 22.3 22.3
24.2 +0.8 -
30.4' 30.0" 28.8a9b 28.1b 27.0b 24.8' 24.9' 23.8'
27.2 +0.5 -
aYields within each year equal to or lower than t h a t marked with an asterisk are significantly below tha t from bare soil. bAnderson and Russel 1964, p. 11 1. All statistical determinations were made using Dunean's multiple range test (P = 0.05). 'Means having t h e same subscript l e t te r do not differ significantly.

Table 4-11. YIELDS (BU/A)' OF WINTER WHEAT GROWN ONtUMMER-FALLOWED PLOTS COVERED WITH BRIGHT STRAW IMMEDIATELY AFTER SEEDING
Applied straw, lb/a 1950 1951 1952 1953 1954 1955 1956 1957 1958 MeanC
0 1500 3000 4000 5000 6000 7000 800 0
28.6 30.0 33.4 18.4 24.1 30.6 24.5 22.8 29.8 20.1 24.6 * 29.8 20.3 21.9 27.4* 22.1 21.2 26.6 23.5 19.4* 27.0 15.6* 21.5 25.1
44.6 37.2 38.2 38.6 42.6 33.8 39.1 34.3*
28.0 29.2 29.1 29.3 29.2 27.0 27.4 27.2
38.1 33.2 29.8 27.8* 22.0 23.0 21.9 17.5
17.3 17.9 45.5 31.5a 17.1 15.9 40.3 27.3'9b 21.4 20.2 18.8 15.4 17.9 15.7
12.7 40.4 27.6"pP 14.2 40.6 27.3a,b 15.7 37.5 26.lbPc 18.4 39.5 25.2b,C 15.6 39.4 25.7b,C 16.6 34.8 23.0'
Mean SZ
21.6 23.4 28.7 +1.4 +2.6 +2.6 - - -
38.5 +2.4 -
28.3 +1.2 -
26.7 +2.8 -
18.0 15.9 39.7 26.7 +1.3 - +3.0 - - +2.2 - +2.2
aYields within' each year equal to or lower than tha t marked with an asterisk are significantly below tha t from bare soil. bAnderson and Russell 1964, p. 11 2. All s ta t is t ical determinations were made using Duncan's multiple range test (P = 0.05). 'Means having t h e same subscript letter do not differ significantly.

28

SECTION 5.0
FSTLMATES OF ACCEPTABLE SOIL LOSS LIMlTs FOR SAMPLE FARMS
This report has identified soil fertility and soil loss constraints on crop residue removal for energy production. The effects of residue removal, including nutrient depletion, soil tilth, water requirements, and water and wind erosion have been discussed. In addition, crop and residue management practices to maintain soil fertility, soil moisture, and to control erosion were presented. An overview of these findings is included in the Summary. In general, the following points can be made:
residues required for wind and water erosion usually exceed residues required for fertility maintenance for a given soil type;
o residues simultaneously satisfy fertility and erosion constraints; o the detrimental effects of residues are negligible with conventional and
conservation tillage practices; and 0 conservation tillage practices release more residues for energy production than
conventional tillage practices.
The following section identifies residue availability levels for the two sample farms in SERI's Analysis Division biomass research task; a wheat situation in north-central Okla- homa, and a corn-sogbeans situation in central Iowa. The estimates presented here are aggregated by MLRA and do not accurately reflect soil loss and fertility constraints for any specific soil type.
5.1 NORTH-CENTRAL OKLAHOMA
There are currently about 3.0 million acres of wheat grown in the MLRA, which includes north-central Oklahoma. On the average, there are approximately 1.5 t/a of residues produced (Lindstrom et al. 1978, p. 10). The amount of residue available for wheat, with a soil loss tolerance level of 5.0 t/a is 0.9 t/a with conventional tillage, 1.2 t/a with conservation tillage, and 1.4 t/a with conservation tillage and mulching (Lindstrom et al. 1975, pp. 12-14). Lindstrom et al. estimate that a removal level of 1.4 t/a would still give 100% protection from wind and water erosion within the 5.0 t/a soil tolerance limit set by the Soil Conservation Service. These availability estimates conform to estimates by Skidmore et al. to the second decimal point (1979, pp. 90-94).
5.2 CENTRAL IOWA
Central Iowa is part of l'41,RA 103 defined by the Soil Conservation Service. Corn is grown on 6.4 million acres with an average residue yield of 2.5 t/a and soybeans are grown on 4.4 million acres with an average residue yield of 1.4 t/a (Lindstrom et al. 1975, p. 9). For conventional tillage, Lindstrom estimates that a total of 4.4 million tons of corn residue and 1.1 million tons of sovbean residue can be removed from MLRA 103 without exceeding soil-loss tolerance limits. On a percentage basis, 65% of the residues are available for removal with conventional tillage and 86% are available with conservation tillage practices for both soybeans and corn.
29

30
SECTION 6.0
REFERENCES
Adams, John E. 1965. Wffect of Mulches on Soil Temperature and Grain Sorghum ne- velopment.fl Agronomy Journal. Vol. 57 (no. 5).
pletion." Soil Science Society of America Proceedings. Vol. 30.
Alich, Jr., 3. A.; Inman, R. E. 1974. Effective Utilization of Solar Energy to Produce Clean Fuel. Menlo Park, CA: Stanford Research Institute.
Allmaras, R. R.; Gupta, S. C.; Pikul, Jr., J. L.; Johnson, C. E. 1979. Tillage and Plant Residue Management for Water Erosion Control on Agricultural Land in Eastern Oregon." Journal of Soil and Water Conservation. Vol. 34 (no. 2): March-April.
Anderson, D. T.; Russell, G. C. 1964. llEffects of Various Quantities of Straw Mulch on the Growth and Yield of Spring and Winter Wheat." Canadian Journal of Soil Science. Vol. 44: February.
. 1966. Ynfluence of Mulches on Runoff, Erosion, and Soil Moisture De-
Barrows, H, L.; Kilmer, V. J. 1963. "Plant Nutrient Losses from Soils by Water Erosion.fr Advanced Agronomy. Vol. 15.
Borst, Harold L,; Woodburn, Russell. 1942a, Effect of Mulches and Surface Conditions on the Water Relations and Erosion of Muskingum Soils. USDA Technical 5ulletin. No. 825. Washington, DC: U.S. Dept, of Agriculture; July.
. 1942b. "The Effect of Mulching and Methods of Cultivation on Run-off and Erosion from Muskingum Silt Loam.71 Agricultural Engineering. Vol. 23: January.
Campbell, R. B.; Matheny, T. A.: Hunt, P. G.; Gupta, 3. C. 1979. T r o p Residue Re- quirements for Water Erosion Control in Six Southern States." Journal of soil and Water Conservation. Vol. 34 (no. 2): March-April.
Chepil, W. S. 1944. Wtilization of Crop Residues for Wind Erosion Control.ft Scientific Agriculture. Vol. 24 (no. 7): March,
CheDil, W. S.; Woodruff, N. P.; Siddowav, F. H.; Frvrear, D. W.; Armbrust, D. V. 1963. "Vegetative and Nonvegetative Materials to Control Wind and Water Erosion.11 - Soil Science Society of America Proceedings. Vol. 27.
Duley, F. L.; Kelly, L. L, 1939. Effect of Soil Type, Slope, and Surface Conditions on Intake of Water. Nebraska Agricultural Experiment Station Research Bulletin. No. 112. Lincoln, NB: Nebraska Dept. of Agriculture.
Fairbourn, Merle L.; Gardner, H. R. 1974. "Field Use of Microwatersheds with Vertical Mulch.I1 Agronomy Journal. Vol. 66. November-December.
. 1972. Vertical Mulch Effects on Soil Water Storage." Soil Science Society of American Proceedings. Vol. 36.
31

Gardner, H. R.; Gardner, W. 2. 1969. "Relation of Water Application to Evaporation and Storage of Soil Water." Soil Science Society of America Proceedings. Vol. 33.
Gupta, S. C.; Onstad, C. A.; Larson, W. E. 1979. "Predicting the Effects of Tillage and Crop Residue Management on Soil Erosion." Journal of Soil and Water Conservation. Vol. 34 (no. 2): March-April.
Hanks, R. J.; Woodruff, N. P. 1958. "Influence of Wind on Water Vapor Transfer through Soil, Gravel, and Straw Mulches." Soil Science. Vol. 86.
Hide, J. C. ture." Soil Science Society of America Proceedings. Vol. 18.
Holt, R. F. 1979. "Crop Residue, Soil Erosion, and Plant Nutrient Relationships,f1 Journal of Soil and Water Conservation. Vol. 34 (no. 2): March-April,
1954. "Observations on Factors Influencing the Evaporation of Soil Mois-
Jacks, G. V.; Brind, V. D.; Smith, R. 1955 Mulching: Commonwealth Sureau Soil Science Technology. Communications no. 49.
Larson, W. E. 1979. "Crop Residues: Energy Production or Erosion Control.11 Journal of Soil and Water Conservation." Vol. 34 (no. 2): March-April.
Larson, W. E.; Burrows, W. C.; Willis, W. 0. 1960. Toil Temperature, Soil Moisture, and Corn Growth as Influenced by Mulches of Crop Residues." 7th International Congress of Soil Science. Vol. 1.
Lemon, E. R. 1956. "The Potentialities for Decreasing Soil Moisture Evaporation Loss." Soil Science Society of America Proceedings. Vol. 20.
Lindstrom, M. J.; Gupta, S. C.; Onstad, C. A.; Larson, W. E.; Holt, R. F. 1979. "Tillage and Crop Residue Effects on Soil Erosion in the Corn Belt." Journal of Soil and Water Conservation. Vol. 34 (no. 2): March-April.
Lindstrom, M. J.; Skidmore, E. L.; Gupta, S. C.; Onstad, C. A. Veil Conservation Limitations on Removal of CroD Residues for Enerrrv Production." Proceedinm of the 33rd Annual Meeting of the Soil Conservation Soci& of America. July 3O-iugust 2, 1978. Denver, CO.
Mannering, 2. V.; Meyer, L. D. 1961. 'The Effects of Different Methods of Cornstalk Residue Management on Runoff and Erosion as Evaluated bv Simulated Rainfall." - Soil Science Society of America Proceedings. Vol. 25.
Meyer, L. D.; Wischmeier, W. H.; Foster, G. R. 1970. "Mulch Rates Required for Erosion Control on Steep Slopes." Soil. Science Society of America Proceedings. Vol. 34.
Pruess, K. P.; Petty, 13. 3. 1973. Conservation Tillage. Ankeny, IA: Soil Science qociety of America.
Russel, 3. C. 1939. T h e Effect of Surface Cover on Soil Moisture Losses by Evapora- tion." Soil Science Society of America Proceedings. Vol. 4.
Skidmore, E. L.; Fisher, P. S.; 'Woodruff, N. P. 1970. "Wind Erosion Equation: Computer Solution and Application." Soil Science Society of America Proceedings. 7/01. 34.
32

Skidmore, E. L.; Kumar, M.; Larson, W. E. 1979. "Crop Residue Management for Wind Erosion Control in the Great Plains." Journal of Soil and Water Conservation. Vol. 34 (no. 2): March-April.
Taylor, R. E.; Hays, 0. E.; Bay, C. E.; Dixon, R. M. 1964. Worn Stover R/lulch for Con- trol of Runoff and Erosion on Land Planted to Corn after Corn." Soil Science Society of America Proceedings. 1'01. 28.
U.S. Department of Agriculture, Office of Planning and Evaluation. 1975. Minimum Tillage: A Preliminary Technology Assessment. Washington, D.C.: U.S. Dept. of Agriculture.
Van Wijk, W. R.; Larson, W. E.; B U ~ O W S , W. C. 1959. "Soil Ternoerature and the Earlv Growth of Corn f rom Mulched and Unmulched Soil." Soil Science Society of America Proceedings. Vol. 23.
Wendt. C. W. 1973. Effects of a Minimum Tillagevertical Mulch ConceDt on Soil Mois- ture &d Yield of Grain Sorghum at Lubbock,-Texas, 1970-71. College Station, TX: Texas Agricultural Experiment Station, Texas A&M University; Progress Report PR-3 15 2; Februarv.
Wischmeier, Walter H.: Smith. Dwight D. 1965. Predicting Rainfall-Erosion Losses from Cropland East of the Rocky Mountah. USDA Agriculture bandbook. No. 282. Washing- ton, D.C.: U.S. Dept. of Agriculture; June.
Woodruff, N. P.; Siddoway, F. H. 1965. "A Wind Erosion Equation." Soil Science Society of America Proceedings. Vol. 29.
33

34

SECTION 7.0
BlBLIOGRAPRP
Brown, Paul L.; Schrader, W. D. "Grain Yields, Evapotranspiration, and Water Use Effi- ciency of Grain Sorghum under Different Cultural Practices.11 Agronomy Journal. VOl. 51: pp. 339-343.
Surges, Alan, 1967. "The Decomposition of Organic Matter in the Soil.11 Soil Biolog.
Edwards, C. A.; Reichle, D. E.; and Crossley, D. A., Jr. 1970. T h e Role of Soil Ecological Studies.
Jorgenson, Jacques R,; Wells, Carol G.; Metz, Louis J. 1975. "The Nutrient Cycle: Key
Macfayden, Amyan, 1961. VIetabolism of Soil Invertebrates in Relation to Soil
Mannering, J. V.; Meyer, L. D. 1963. "The Effects of Various Rates of Surface Mulch on Infiltration and Erosion." Soil Science Society of America Proceedings. Vol. 27: pp.
Invertebrates in Turnover of Organic Matter and Nutrients.'l Analysis and Synthesis. Vol. 1.
to Continuous Forest Production." Journal of Forestry.
Fertility." Proceedings of the Association of Applied Biologists. Vol. 49.
84-85.
Mever, L. D.; Mannering, J. V. 1961. flMinimum Tillage for Corn: Its Effect on - 1n.filtration and Er&ion.ll Agricultural Engineering, Vol. 42: pp. 72-75, 86;
February.
Onstad, C. A.; Otterby, M. A. 1979. Vrop Residue Effects on Runoff.ll Journal of Soil
Reichle, D. E. 1969. llEnergy and Nutrient Metabolism of Soil and Litter Proceedings of the Brussels Symposium on the Productivitv of
and Water Conservation. Vol. 34 (no. 2): pp. 94-96; March-April.
Invertebrates.1t Forest Ecosystems."
Witkamp, M. 1969. Tores t Soil Microflora and Mineral Cycling." Proceedings of the Brussels Symposium on the Productivity of Forest Ecosystems.
Witkamp, Martin. 1971. "Soils as Components of Ecosystems.11 Annual Review of Ecology and Systematics. Vol. 2.
35

.

12. NTlS Accession No. 13. Recipient’s Accession No. I Document Control I 1 . Report NO.
Page I RR-52-324 I 4 Title and Subtitle 5. Publication Date
7 Author(s)
9. Performing Organization Name and Address Si lv io Flaim
1 Solar Energy Research I n s t i t u t e 1536 Cole Boulevard
8. Performing Organization Rept. No.
10. Project/Task/Work Unit No. 3391 3 I 33L I . 3
12. Sponsoring Organization Name and Address
11. Contract (C) or Grant (G) No. -
13. Type of Report 8 Period Covered
14.
1 I Golden, CO 80401
18. Availability Statement 19. No. of Pages
O k ’ ~ ~ ~ ~ ~ f i e r s / O p e n - E n d e d Terms
c . L‘C Cateaories
20. Price
~