soil and site evaluation for onsite wastewater treatment ... · pdf filesoil and site...
TRANSCRIPT

Model Decentralized Wastewater Practitioner Curriculum Soil and Site Evaluation
Lindbo et. al. i
Model Decentralized Wastewater Practitioner Curriculum
Soil and Site Evaluation
Module Text
David Lindbo, NCSU Randy Miles, University of Missouri
Del Mokma, Michigan State University Mark Stolt, University of Rhode Island
Scott Greene, Guilford County Health Dept.
February 2005
Model Decentralized Wastewater Practitioner Curriculum Soil and Site Evaluation
Lindbo et. al. ii
NDWRCDP Disclaimer This work was supported by the National Decentralized Water Resources Capacity Development Project (NDWRCDP) with funding provided by the U.S. Environmental Protection Agency through a Cooperative Agreement (EPA No. CR827881-01-0) with Washington University in St. Louis. These materials have not been reviewed by the U.S. Environmental Protection Agency. These materials have been reviewed by representatives of the NDWRCDP. The contents of these materials do not necessarily reflect the views and policies of the NDWRCDP, Washington University, or the U.S. Environmental Protection Agency, nor does the mention of trade names or commercial products constitute their endorsement or recommendation for use.
CIDWT/University Disclaimer
These materials are the collective effort of individuals from academic, regulatory, and private sectors of the onsite/decentralized wastewater industry. These materials have been peer-reviewed and represent the current state of knowledge/science in this field. They were developed through a series of writing and review meetings with the goal of formulating a consensus on the materials presented. These materials do not necessarily reflect the views and policies of North Carolina State University, and/or the Consortium of Institutes for Decentralized Wastewater Treatment (CIDWT). The mention of trade names or commercial products does not constitute an endorsement or recommendation for use from these individuals or entities, nor does it constitute criticism for similar ones not mentioned.

Model Decentralized Wastewater Practitioner Curriculum Soil and Site Evaluation
Lindbo et. al. iii
Citation of Materials Lindbo, D.L., M. Stolt, R. Miles, D. Mokma, S. Greene, and M. Hoover. 2005. Soil Module Text. in (D.L. Lindbo and N. E. Deal eds.) Model Decentralized Wastewater Practitioner Curriculum. National Decentralized Water Resources Capacity Development Project. North Carolina State University, Raleigh, NC.

Model Decentralized Wastewater Practitioner Curriculum Soil and Site Evaluation
Lindbo et. al. 1
Soil and Site Evaluation for Onsite Wastewater Treatment and Dispersal Preface The Soil and Site Evaluation Module will address the use of soil morphology, landscape description, interpretation of data, and non-soil data for onsite wastewater applications. The module consists of a guide beginning with the basics of soil science (definitions, formation, and morphology) to details regarding specific problem areas (water table monitoring, restrictive horizons, mineralogy). Each chapter in the guide will consist of written reference materials (as follows) and a slide set with notes. Theses notes can in some cases be considered a script, but the authors feel each instructor should develop his/her own script to adjust their personal teaching style. Additionally the module will contain suggested agenda for numerous short courses. These materials will include details on soil morphology (soil horizons, color, texture - field and lab methods of determination, structure, consistence, redoximorphic features - mottles, landscape evaluation/slope type, drainage concerns and landscape position), soil and landscape relationships, and non-soil issues that must be considered for a complete site evaluation. Additionally, details on the use of county soil survey (NRCS) publications will be discussed. The following text is designed as a supplement for both lecturers and students. It is not meant to be a comprehensive discussion of soil morphology, genesis etc. These subjects are cover in great detail in excellent reference texts such as The Nature and Properties of Soils (Brady and Weil), Soil Science Made Simple, (Kohnke and Franzmeier), Environmental Soil Physics (Hillel), and Soil Classification and Genesis (Buol, Hole, McCracken and Southard). The following text should be viewed as a clarification of the slide sets and as additional information that relates soil properties directly to the subject of onsite wastewater treatment and dispersal. It is strongly suggested that those who instruct this material in a practitioner course be soil scientists with experience beyond the field of wastewater. This recommendation recognizes the concept the soil science is a multidisciplinary field requiring a wide breadth of knowledge in order to adequately understand and convey its principles to those who may only see soil as dirt. The authors fully intended there to be more material in this module than a practitioner could learn in a single 1 day session. It is our contention that by first illustrating the importance of soils fields beyond OSWW we can enhance the learning experience and provide the practitioner with a more complete understanding of the science. We also recognize that all do not share our view, thus the slide sets are not arranged always as stand alone short courses (although several could be presented as such). Instead we expect that an individual instructor will pick and choose the materials they see most fitting for their audience. This approach makes these materials highly flexible and adaptable for multiple skill levels and instructional techniques.

Model Decentralized Wastewater Practitioner Curriculum Soil and Site Evaluation
Lindbo et. al. 2
Chapter 1
Introduction A key part of landuse planning and development (which may also include land conservation and preservation) is the ability to evaluate the site and the soils on it. This evaluation is often the first data collected outside the office. In order to put this module and chapter into perspective one should consider, from a purely biological (scientific) viewpoint, what animal life needs to survive anywhere. For the most part if people are asked what they need to survive they will say “food and water”. Water is indeed is important, as we are 90+% water. We also need food, but there are several other items that are of even more importance. After water, we need oxygen (O2) to survive (Air – needed to breathe and respire) Next consider where our energy comes from; from sunlight. Without sunlight nothing would grow and the earth would be a cold rock in space. The last, and in the opinion of some soil scientists the most important, is soil. Soil is the source of food (plants and animals), clothing (plants and animals), and shelter (trees and bricks), thus we truly can not live without it. These four components are similar to the 4 elements of the medieval alchemists – earth, air, fire and water and they represent things we can not live without. Human activity interacts with soils since we are an integral part of the soil and landscape and do affect it on a daily basis. Agriculture is one major impact. Agriculture involves land clearing, chemical additions, irrigation etc. All are altering the soil and landscape. Any form of construct will compact the soil as well as reshape the local landscape. Affects may be minor and localized to quite widespread. Although these are extreme erosion may be subtle as well. Erosion is natural in some cases, but our land use practices my enhance it. Give examples. Landfills alter the landscape by filling and eventually resulting in hill. Animal wastes, while in the news are nothing new to the soil. Do you think that bears use sewer systems? However when the waste is concentrated in one small area its affect can be significant. Soils have a great capacity to treat wastewater but can be overwhelmed if not properly understood and utilized. Soils are a resource that often seems to be unlimited but if not factored into landuse planning the result can be tragic. We do affect the soils in many ways. Virtually all that we do can with proper planning and understanding of the soil have controlled impacts and potentially result in improvements. Soil science (aka Pedology) is a branch of science that looks at how soils form and how they can help in understanding land use. Soil scientists (or pedologists) view the world in its entirety as soils affect so much of everyday life and are affected by their natural surroundings. A soil scientist considers multiple factors when investigating soils. Looking at the big picture allows the one to consider how soils change across wide area such as a state or smaller areas such as a field. Integrating what is visible at the surface in way of topography, vegetation, colors etc. soil scientists can begin to piece together a conceptual model of how the landscape/soils were developed and may be utilized. All of these aspects are how the soils person sees the world. They take what they see and integrate the factors together to get a better understanding of the site. Thus a soil scientist must look far beyond the soil when a site is visited.

Model Decentralized Wastewater Practitioner Curriculum Soil and Site Evaluation
Lindbo et. al. 3
What is a soil? Groups that use soils for varying purposes define soil differently. A regulatory definition of soil for onsite systems may read as follows: “Soil is the naturally occurring body of porous mineral and organic materials on the land surface. Soil is composed of sand-, silt-, and clay-sized particles that are mixed with varying amounts larger fragments and some organic material. Soil contains less than 50 percent of its volume as rock, saprolite, or course-earth fraction (mineral particles greater than 2.0 millimeters). The upper limit of the soil is the land surface, and its lower limit is ‘rock’, ‘saprolite,’ or other parent materials.” Engineers define soil as “any unconsolidated material composed of discrete solid particles with gases and liquids between” (Sowers, 1979). Soil, as defined by geologists, is “that material which has been so modified and acted upon by physical, chemical, and biological agents that it will support rooted plants” (AGI, 1976). The most common academic definitions of soils and the one we shall use in this module follows “A soil is a porous natural body of mineral, air, water and organic matter that changes, or has changed, in response to climate, topography, time, and organisms”. Basically, it says that soils are dynamic and reflect the conditions that they formed under. Because they do reflect the environment in which they formed we can use their morphology to understand more about the environment. Thus soils can be like a very smart canary in the coal mine – if we know how to interpret their song. This and subsequent chapters on soils will present the basic knowledge needed to understated the rudiments of soil and site evaluation. Before considering how soil treats wastewater, consider the processes that occur at a wastewater treatment plant. In a treatment plant wastewater is treated in several ways. Biological treatment reduces or removes pathogenic organisms. Chemically the wastewater is aerobically treated to help convert NH4 to NO3. Physical treatment involves settling and filtration of suspended materials. Finally the treated water is dispersed back into the environment, or reused elsewhere. Lots of big cities such as New York have treatment plants. What is the largest? The answer may surprise you as the soil is the largest treatment plant or media in the country (maybe the world). In the US it accounts for 25+% of all sewage treatment. Just as in a wastewater treatment plant soils treat the wastewater I much the same way. Proper soil treatment requires that there be an aerobic zone (lots of O2 and unsaturated) zone beneath the trench bottom. Every state or local government has a set of regulation that indicates the number of inches of aerobic soil that are needed below the trench bottom or dispersal zone. This distance or thickness varies from 12 to 60”. In a saturated soil (often anaerobic), all the pores are filled with water. Bacteria (and other pathogens) move quickly through the big pores and are not removed in the soil. They may proceed directly to ground water. Under moist (aerobic) conditions the bacteria are treated better. More detail on soil treatment can be found in the Soil Water Movement and Treatment Module (Gustafson et al., 2004) in these materials What is in soil? Soil has two major components that can be subdivide into 5 five parts overall. Their relative amounts will alter the properties of the soil but no one is more important than another. The two components are solids and pore space. The solid component can be subdivided into mineral material, living organic material, and dead organic material. The pores can be subdivide into air filled and water filled.

Model Decentralized Wastewater Practitioner Curriculum Soil and Site Evaluation
Lindbo et. al. 4
How does soil form? Since soil is dynamic it is important to know how it forms. This will help us in interpreting the soil once we have described it. In general, soil formed under similar conditions will have similar properties. By altering one of the conditions under which the soil formed the properties will change. This can account for why on a given lot there are areas of soil suitable for OSWW systems and areas that are unsuitable for OSWW systems. By understanding a little about soil formation one can start to predict where the suitable areas may be. This knowledge can save time and money in during a field evaluation. When assessing suitability one must also take the system or system type into consideration. Thus an area unsuitable for a conventional system may be suitable for an advanced treatment system. Furthermore as technology advances and regulations change the classification of what is suitable or unsuitable will also change. There are several ways in which to investigate soils formation or genesis. The 2 most common are the factors of formation developed by Jenny (1942) and the inputs/outputs developed by Simonson (1971). Jenny described five factors of soil formation;
1. Parent material is the rock or other matter, which degrades into soil. Soils are very reflective of their parent material. For example, a soil developed from coarse textured rock will always have a coarse texture. 2. Topography refers to both the slope of land and the aspect (the direction in relation to the sun) of the surface. The most obvious influence of relief is through slope. Slope affects losses and additions and thus causes changes in soil depth. 3. Biology refers to the biological agents such as plants, fungi, and microorganisms that break down parent material into soil particles and also contribute organic matter to the soil. For example, the distribution, quantity, and type of organic matter in a soil developed under prairie vegetation are very different from a soil developed under forest vegetation. 4. Climate encompasses rainfall and snowfall, evaporation, and temperature. Climate controls some chemical and physical reactions and it can also affect the type of organisms in and on a given soil. Weathering of a soil is either hastened by a hot, moist climate, or retarded by a cold, dry climate. 5. Time is an important soil-forming factor because it modulates the other four factors. For example, a younger soil has had less time for its parent material to be changed, and for climate, relief, and organisms to affect the soil forming processes.
Some soil scientists add Anthropogenic (human activity) as a 6th factor due to the extreme and widespread influence man can have, others consider man as part of the biology factor. The soil forms through the interaction of these factors. No one factor is more important to the formation of a soil in the grand scheme but for the purposes of onsite wastewater site evaluation the influence of several individual factors may be paramount. Generally, these are parent material and topography. Parent material

Model Decentralized Wastewater Practitioner Curriculum Soil and Site Evaluation
Lindbo et. al. 5
Just as you and I have parents so do soils. Many of the soil properties as ours are inherited from their parents. Often these inherited properties can be the difference between a suitable vs. unsuitable soil for an onsite wastewater system. Parent materials can be broken into three basic groups; transported, residual, and organic. The group consisting of transported material is further subdivided based upon the media that transported the sediment or where the sediment was deposited; water (marine, fluvial/alluvial, and lacustrine), wind (aeolian), ice (glacial), gravity (colluvial). Transported Parent Material The most extensive group of parent materials is the group that has been moved from the place of origin and deposited elsewhere. The principal groups of transported materials are usually named according to the main agency responsible for their transport and deposition. In most places, sufficient evidence is available to make a clear determination; elsewhere, the precise origin is uncertain. Marine The areas adjacent to the coast contain multiple environments for sediment deposition. Sediments deposited in this area are termed Marine sediments and are deposited in salt to brackish water. Beaches are high energy zones thus will have coarse textured sediments. Long shore currents and wind may rework these sediments. Low energy environments result in fine texture sediments. The landscape in these zones is often flat and wet. Shell beds are also typical of a marine environment and may be fine textured as well as containing shells. The depositional environments in a marine setting are constantly shifting with the beaches over washing onto the marshes or mud flats etc. As sea level rises or fall these zones shift back and forth resulting in an unpredictable assemblage of sediments and textures with depth. Fluvial/Alluvial Fluvial deposits are sediments deposited either in the active stream channel or on the flood plain associated with the channel. The sediments are coarser near the channel where the water is moving the fastest. Active deposition occurs in the channel and the adjacent active flood plain. The channel is not static and meanders across the plain depositing and eroding material as it moves, thus the fluvial landscape has variably textured sediments across it. Sediments deposited in fluvial environments are often layered or stratified. Aeolian Aeolian or eolian materials are deposited by the wind. They range in size from sand to silt. Sand dunes are one such example of aeolian materials. The text of the material will be finer further from the source of the sediment. Colluvial

Model Decentralized Wastewater Practitioner Curriculum Soil and Site Evaluation
Lindbo et. al. 6
Colluvial materials are deposited by sediments transported down slope by gravity. If the movement is slow it is often difficult if not impossible to see any effect on the soil. However, when movement is rapid enough the existing soil may be mixed, reoriented etc. Colluvial material may look as if it was just dumped from the back of a dump truck. In time it may appear a bit more organized as soil processes act upon it. Often within a soil developed in colluvium, several events or depositions may be visible as in the soil on the left. Thus it is possible to have more than one parent material represent in a single soil. Lacustrine Lake deposited material is referred to as Lacustrine. At the margins of the lake coarser textures may abound but the majority of the sediments will be fine textured. In areas where the lake freezes over in the winter a distinct layering may occur. This layer is referred to a varve. The winter layer is composed of a finer textured material than the summer material. Glacial Several terms are used for material that has been moved and deposited by glacial processes. Glacial drift consists of all of the material picked up, mixed, disintegrated, transported, and deposited by glacial ice or by water from melting glaciers. Glacial till is glacial drift deposited directly by the ice with little or no transportation by water. It is generally an unstratified, heterogeneous mixture of clay, silt, sand, gravel, and sometimes boulders. Two types of tills are often described; basal or lodgement till: dense (compacted) till formed at the base of the glacier, and ablation till: loose (friable) till generally overlying the basal till. Glaciological deposits are material produced by glaciers and carried, sorted, and deposited by water that originated mainly from melting glacial ice. Glacial outwash is a term used for material swept out, sorted, and deposited beyond the glacial ice front by streams of melt water (sometimes referred to as proglacial outwash. Glacial beach deposits are rock fragments and sand that mark the beach lines of former glacial lakes. Depending on the character of the original drift, beach deposits may be sandy, gravelly, cobbly, or stony. Glaciolacustrine deposits are derived from glaciers but were reworked and laid down in glacial lakes. They range from fine clay to sand. Many of them are stratified or laminated. A varve consists of the deposition for a calendar year. The finer portion (darker in color) reflects slower deposition during the cold season and the coarser portion (lighter in color) reflects deposition during the warmer season when runoff is greater. Residual Parent Material Soils can also be developed in place from the underlying bedrock. These are referred to as residual materials. The soil developed from these materials inherits properties from the rock and the manner in which the rock weathers both physically and chemically. Residual soils developed from felsic materials weather to low activity clays (kaolinitic). These clays do not expand upon wetting as are suitable for onsite wastewater systems. Residual soils developed from sedimentary or mafic materials may weather to high activity clays (smectitic). These clays expand upon wetting, as are poorly suited or unsuitable for onsite wastewater systems.

Model Decentralized Wastewater Practitioner Curriculum Soil and Site Evaluation
Lindbo et. al. 7
Lithochromic colors are inherited from the parent rock. These colors tell us about the parent material and may confuse the interpretation of the soil. Soils may develop from multiple parent materials as well. A key principle in geology is the uniformitarianism or that the processes that are going on today are the same as the ones that have acted in the past. In other words modern features and processes can help us understand ancient ones. The photos here illustrate this. The upper left is a modern dune/beach ridge while the lower right is an ancient one. The properties of each (texture, mineralogy, etc.) are similar even though they are 70-120 thousand years (ka) different in age. Topography Topography or slope position can greatly influence soil development. Think if you would rather build a dream house on the top of a hill or the bottom. Why? The primary reason has to due with drainage and water movement. Soils developed on different parts of the landscape reflect the effects of drainage. In considering topography several aspects need to be considered. First, consider how water moves on a slope as well as through a soil. Second, consider how to describe the slope type and position in 2 and 3 dimensions. Finally, consider how landscapes vary and how that variation affects soil properties. Water movement on a site is controlled basically by the topography (external drainage) and by soil properties such as texture, structure, mineralogy, etc. (internal drainage). The upslope areas have good external drainage as water flow away from these zones whereas the lower portions of the landscape have poor external drainage as water flows into these zones. On a given landscape each part of the slope has a different name; summit, shoulder, side slope, foot slope, and toe slope. Dissected or rolling topography will have the well drained soils at the summit and the poorly drained soils at the low or toe slope areas. In contrast to rolling topographic areas the flat regions have the poor drained soils at the high points away from the drainage ways. The well-drained soils occur adjacent to the drainage ways. This is referred to as the dry edge effect. Biology of Vegetation Vegetation can have profound effects on differences between soils. However, on a given 1-acre site, the effects of vegetation/biology will generally be the same across it. Vegetation can be used to tell us several things about a site before looking at the soil. For example soil under coniferous vegetation will be acidic. The types of trees and shrubs growing on a site will be related to the wetness of that site thus can be good indicators of aspects of site suitability. Climate Climate, in particular, rainfall and temperature, can have profound effects on regional differences between soils. Climatic conditions on a given 1 acre site will generally be the same across it. The most noticeable effects of climate are therefore regional. Soils developed in humid climates typically show multiple horizons, have clay, Fe accumulation in the subsoil and organic accumulation at the surface.

Model Decentralized Wastewater Practitioner Curriculum Soil and Site Evaluation
Lindbo et. al. 8
Soils in arid climates lack the organic accumulation and generally have less distinct horizons visible. They may also have accumulation of salts or carbonates as there is insufficient water to leach these constituents. Time Time should be considered not only for how old a soil is but also in terms of long will it take for certain soil properties to develop or redevelop after a soil is disturbed. Freshly deposited material, such as sand dunes, shows little if any evidence of soil formation. Thus the question for looking at soils and landuse are: How long does it take for features to form. For example how long does it take for signs of soils wetness to appear or disappear from a soil; how long for structure to redevelop in a disturbed area? Finally, as these questions are asked one must also ask what the rate of formation may affect interpretation and various land uses. Anthropogenic Anthropogenic or man induced changes are often discussed in the same section as biology or vegetation. In the context on land use (onsite wastewater in particular), man induced changes can have a dramatic effect on the soil properties. These effects are often exhibited to a greater degree or with greater consequences that other biological effects. The effects of tillage can be quite dramatic for example 150 or so years of farming can remove over 3 feet of topsoil. Erosion caused by mans activity will remove material, dredging and filling may create new land. The new land created may be suitable or not depending on the properties of the material being deposited. Simonson's Generalized Theory Of Soil Genesis The basic concept is the soils form through a series of physical and chemical processes called pedogenesis. After the accumulation of soil parent material horizon differentiation (soil development) is ascribed to: a) Additions to the soil, b) Losses from the soil, c) Transfers within the soil, d) Transformations within the soil. This generalized theory may aid in understanding what the processes result in, therefore we make a better soil description. It assumes that the same narrow processes operate in most soils and that soil results from an integrated effect of many processes operating over a period of time. Finally, it recognizes that the lateral boundaries between different kinds of soil can be gradational. The theory considers several factors: 1) Parent materials, 2) Hydrodynamics, 3) Landscape position, 4) Additions, 5) Losses, 6) Transformations, 7) Transfers, and 8) The profile. Major Concepts

Model Decentralized Wastewater Practitioner Curriculum Soil and Site Evaluation
Lindbo et. al. 9
1) Soils form through a series of physical and chemical processes we call pedogenesis. 2) Understanding the processes will help us make a better description and interpretation of the soil because we have some form of understanding on what is going on. 3) A simple but effective approach is to group the soil forming processes into 4 classes: additions, losses, transfers, and transformations. These should be related to the parent material. We should think about these when we make a soil description. 4) There are 7 so called “narrow processes” that can be used to explain the soils we see. These are transformations of minerals and organic matter (OM); eluviation (leave); illuviation (accumulation); phyto- and bio cycling (cycling of elements important to plants and microbes); pedoturbation (mixing); erosion (soil losses at the surface); and deposition (soil gains at the surface). 5) Don’t forget about hydrologic and landscape effects.

Model Decentralized Wastewater Practitioner Curriculum Soil and Site Evaluation
Lindbo et. al. 10
Definitions
Transported Parent Material The most extensive group of parent materials is the group that has been moved from the place of origin and deposited elsewhere. The principal groups of transported materials are usually named according to the main agency responsible for their transport and deposition. In most places, sufficient evidence is available to make a clear determination; elsewhere, the precise origin is uncertain. Material Moved and Deposited By Water Alluvium: sediment deposited by running water. It may occur on terraces well above present streams or in the normally flooded bottom land of existing streams. Local alluvium: materials that have washed down slope (slope wash), rock fragments are absent. Lacustrine deposits: material that settled out of bodies of still water. Marine sediments: sediments settled out of the sea and commonly were reworked by currents and tides. These sediments may be influenced by fluvial processes (fluvial-marine). Along the seaboards these soil parent materials are often referred to as coastal plain sediments. Beach deposits: mark the present or former shorelines of the sea or lakes. These deposits are low ridges of sorted material and are commonly sandy, gravelly, cobbly, or stony. Material Moved and Deposited By Wind Windblown material can be divided into groups based on particle size or on origin. Volcanic ash, pumice, and cinders: sometimes regarded as unconsolidated igneous rock, but they have been moved from their place of origin. Most have been reworked by wind and, in places, by water. Ash is volcanic ejecta smaller than 2 millimeters. Ash smaller than 0.05 millimeters may be called "fine ash." Pumice and cinders are volcanic ejecta 2 millimeters or larger. Loess deposits: typically very silty but may contain significant amounts of clay and very fine sand. The material is generally calcareous, but this depends on the source rock for the glacial flour. Sand dunes: particularly in humid regions, characteristically consist of fine or medium sand that is high in quartz and low in clay-forming materials. Material Moved and Deposited By Ice

Model Decentralized Wastewater Practitioner Curriculum Soil and Site Evaluation
Lindbo et. al. 11
Several terms are used for material that has been moved and deposited by glacial processes. Glacial drift consists of all of the material picked up, mixed, disintegrated, transported, and deposited by glacial ice or by water from melting glaciers. Glacial till: glacial drift deposited directly by the ice with little or no transportation by water. It is generally an unstratified, heterogeneous mixture of clay, silt, sand, gravel, and sometimes boulders. basal or lodgement till: dense (compacted) till formed at the base of the glacier. ablation till: Loose (friable) till generally overlying the basal till. Glaciofluvial deposits: material produced by glaciers and carried, sorted, and deposited by water that originated mainly from melting glacial ice. Glacial outwash is a term used for material swept out, sorted, and deposited beyond the glacial ice front by streams of melt water (sometimes referred to as proglacial outwash. Glacial beach deposits: rock fragments and sand that mark the beach lines of former glacial lakes. Depending on the character of the original drift, beach deposits may be sandy, gravelly, cobbly, or stony. Glaciolacustrine deposits: derived from glaciers but were reworked and laid down in glacial lakes. They range from fine clay to sand. Many of them are stratified or laminated. A varve consists of the deposition for a calendar year. The finer portion (darker in color) reflects slower deposition during the cold season and the coarser portion (lighter in color) reflects deposition during the warmer season when runoff is greater. Material Moved and Deposited By Gravity Colluvium: poorly sorted debris that has accumulated at the base of slopes through gravity and soil creep. It consists largely of material that has rolled, slid, or fallen down the slope under the influence of gravity. Accumulations of rock fragments are called talus. Rock fragments in colluvium are usually angular, in contrast to the rounded, water-worn cobbles and stones in alluvium. In glacial landscapes, the distinction between colluvium and till is not clear. Thus, the term colluvium is rarely used in glaciated areas.

Model Decentralized Wastewater Practitioner Curriculum Soil and Site Evaluation
Lindbo et. al. 12
Chapter 2 Slopes, Landscape, and Landforms
Slopes and Landscapes Soil geomorphology combines the study of landscape with the study of soil genesis and strives to understand soils based on their place in and on the landscape. In discussing soil geomorphology the following section will concentrate on slopes (names, types etc) and relating how slope influences water movement. Slopes occur everywhere. There are 3 major considerations of slope evaluation to be considered. The first is the ability to discuss them between our peers: thus nomenclature is important. The second is understanding how water moves on, across, and through the slope. The third and final is seeing how slopes are connected to each other. The discussion of slopes begins with reviewing slope position and the hydrologic cycle. Drainage and slope considerations of septic system design must be put into context of the hydrology of a site and septic system. On a given landscape each part of the slope has a different name. Consider comparing the names to parts on your body; head = summit, ridge top, top etc., shoulder = shoulder slope, back or side = back or side slope, foot = foot slope, toe = toe slope. The upslope areas have good external drainage as water flow away from these zones whereas the lower portions of the landscape have poor external drainage as water flows into these zones. How does a septic system change the site hydrology? It adds 2 to 15x the water to the site in the course of a year, thus the soil/landscape must be able to absorb this water under unsaturated conditions, and prevent water (effluent) from reaching the land surface. Ground water mounding may result as the amount of water entering the site exceeds the capacity for the water to leave the site. The worst case result of this would be ground water ponding in the trench or reaching the surface. As slope of impermeable layers increases the gradient of the ground water increases and the actual mound may be less, but down slope other consideration must be considered. In looking at the whole soil profile which horizon becomes the most critical to design? In essence all are critical, but the least permeable will be the so called weakest link. What about the slope of the soil horizons? Slope must also be considered in relation to lateral flow and mounding. Although we would like to think of the drainfield as only influencing or being influenced by the soil directly beneath it, it is however related to the surrounding soil and landscape, thus evaluations should characterize the site and soil variability. We need to consider 3 zones in the soil or site when it comes to water movement. First is the infiltrative surface at the trench bottom. Second is the least permeable horizon beneath the trench bottom. Third and final is the lateral window that the water must eventually flow through. Curtain drains, ground water interceptor drains, French drains etc. are designed to remove lateral flowing water from above a system and/or lower the water table. Any drain must have an outlet that is at an elevation below the bottom of deepest trench. The outlet should divert water away from the

Model Decentralized Wastewater Practitioner Curriculum Soil and Site Evaluation
Lindbo et. al. 13
system both on and off site. A proper outlet must be clear and free flowing and exit topographically below the bottom of the deepest trench. A rat guard is also a must as a rodent or other critter may get up into a drain line. If this happens and they cannot get out they will clog the line and prevent it from working properly. Any curtain must be designed and installed properly. In dealing with slopes it is important to investigate the site, upslope from the site and the adjacent site to observe how water will flow on a larger scale. Sometimes a lot may look good as far as the soils were concerned, but the landscape position such as a head slope (concave-concave) may cause water to accumulate over a small (5-10 acre) water shed. Although landscape may be less than ideal a curtain drain and or swale may mitigated some of problems. Furthermore, on sloping land some of the problems with lateral flow can be alleviated by the drain field configuration. Once again consider the 3 zones of infiltration or infiltrative surfaces of a septic system. Zone A is the trench bottom and biomat, zone B is the most limiting zone below the trench, and zone C is the “window” or horizontal zone that water must move through as it moves down gradient from the system. The ability to keep the system aerobic will depend on not exceeding the hydraulic conductivity of the most limiting of these layers, thus the most limiting layer is the one that must be considered for design purposes. The traditional design of a septic system uses many short trenches for the system. The lateral flow away from the system has to pass through a narrow window down slope. By increases the length of the drainfield along the slope by using fewer, longer trenches the effluent is spread over a wider window. For example, perhaps 1 or 2 long trenches can overcome the limitation of the down slope window. Unfortunately drainfield configuration is rarely this simple as it is generally constrained by lot size and shape. For more information on this you should refer to the 2002 EPA design manual. Ditching or tile drainage is a common way to deal with high water under a septic system. Digging a ditch may lower the water table provided the ditch has an outlet and is free flowing. Just as with a curtain drain, if the ditch is not free-flowing it will not drain the site. Basically, a ditch with no outlet is a pond, all be it, a long narrow pond. The depth of the ditch must be below the level that drainage is needed. Thus depth of the ditch bottom is important, but the elevation of the outlet truly controls the level the ditch will ultimately drain to. If open ditches are impractical or undesirable the same effect can be attained by using drain tile with either a gravity outlet or a sump and pump to lower the water table. In order for either ditches or perimeter drainage to work the soil must be of a high enough conductivity and transmissivity to allow for drainage to the proper (code) depth.

Model Decentralized Wastewater Practitioner Curriculum Soil and Site Evaluation
Lindbo et. al. 14
In practice drainage ditches are often put in for agricultural purpose. Since agricultural land needs to be drained only during the growing season these ditches may not work appropriately during the winter. Furthermore, a BMP on flat agricultural land is to use water control structures to hold back water and nutrients. This may raise the water table several miles behind the outlet these negating any benefit of drainage to the septic system. Looking for a silt line along the ditch walls will tell how well the ditch is working. Of course direct observation of how well it drains after a storm will also help. In the end ditches rarely drain to their bottom. The effects of drainage may extend as little as 25 feet to as much as 300 feet depending on the texture of the soil. Gravity drain tile must have an outlet. If the drain exits below the water level in a ditch it can only drain water above the elevation of the water in the ditch. If on the other hand the ditch is free flowing and the drain tile is above the water level it would be a more effective drain. There are several critical considerations for drainage; conductivity of underlying material, zone of influence – draw down, depth of ditch/outlet, outlet for drain, long-term maintenance of water lowering system, and, drainage area, and topographic position. All these will combine to lead to a success or failure of the drainage system. Since topography plays a role in designing and evaluating a site for its drainage potential we need to consider some aspects of topography beyond its role in soil development (Chapter 1). Topographic relationships can be broken into 2 distinct groups; dissected regions and broad, flat regions. Dissected or rolling topography will have the well drained soils at the summit and the poorly drained soils at the low or toe slope areas. Drier soil on summit appears reddish or yellow. Poorly drained soils are dark or black. In contrast to rolling topographic areas the flat regions have the poor drained soils at the high points away from the drainage ways. The well drained soils occur adjacent to the drainage ways. This is referred to as the dry edge effect.

Model Decentralized Wastewater Practitioner Curriculum Soil and Site Evaluation
Lindbo et. al. 15
Figure 1: Slope names, Su = summit, Sh = shoulder, Bs = back slope or side slope, Fs = footslope, and Ts = toe slope.
Figure 2: Plan view of slopes.

Model Decentralized Wastewater Practitioner Curriculum Soil and Site Evaluation
Lindbo et. al. 16
Figure 3: 3-d nomenclature of slopes.

Model Decentralized Wastewater Practitioner Curriculum Soil and Site Evaluation
Lindbo et. al. 17
Figure 4 Slope morphology.

Model Decentralized Wastewater Practitioner Curriculum Soil and Site Evaluation
Lindbo et. al. 18
Southeast Landforms and Soil Systems
Generally, when one considers soils they automatically start to think about what is below their feet, but in order to better understand soils one needs to consider the bigger picture and be able to comprehend how landscape/landforms and soils are related. This section discusses some of the typical land forms and soil system of North Carolina and the south eastern US. Rather than go into an extensive discussion of this region the reader is recommended refer to Soil Systems in North Carolina (Daniels et al, 1999) for a complete view of the region. In addition refer to the notes provided with the slide presentation that complements this section. Other regions have similar texts that shall be referenced accordingly. Note presenters from outside the southeast will have to add and delete slides in order to make this section appropriate for them. Glacial Landscapes
Glacial Landform Terms
Outwash Plain: commonly smooth landform of low relief in a valley floor composed of coarse-textured glaciofluvial deposit. Esker: long, narrow sinuous steep-sided ridge composed of irregularly stratified sand and gravel that was deposited by a subsurface stream under the glacier (tunnel). Commonly range in length from 0.5 to 2.0 km. Range from 3 to 25 m in height. Kame: a mound-like hill of stratified sand and gravel formed from collapse of glaciofluvial sediments after the melting of stagnant ice. Kame Terrace: terrace like feature consisting of stratified sand and gravel deposited by a stream flowing between the valley wall and the glacier. Lacustrine Plain: commonly a smooth plain with low relief, may be strongly undulating if cover upland landforms. Composed of fine to medium textured sediments deposited in glacial lakes. Drumlin: cigar-shaped landform with the long axis parallel to the direction of the ice flow. Primarily composed of compacted, unsorted materials churned at the base of the glacier (basal till). May contain looser unstratified materials (ablation till) above the dense till. Recessional End Moraine: landform built during the retreat of the glacier. Usually a series of ridges composed of glaciofluvial materials and till.

Model Decentralized Wastewater Practitioner Curriculum Soil and Site Evaluation
Lindbo et. al. 19
Terminal End Moraine: landform built during the retreat of the glacier; occurs at the southern most margin of the glacial lobe; usually a complex series of ridges composed of glaciofluvial materials and till. Ground Moraine: low-lying landform with some undulation formed of ablation and basal till. Kettle Holes: circular depressions formed from the burial of isolated blocks of ice and subsequent melting of the ice.

Model Decentralized Wastewater Practitioner Curriculum Soil and Site Evaluation
Lindbo et. al. 20
Chapter 3 Field Description of Soils
Introduction In order to assess a site for any type of land use the soil must be described and features identified. This chapter will detail the methods for field and in some cases laboratory methods to full describe the soils at a given site. Understanding and interpreting soils is an iterative process that begins with a soil description and leads towards an assessment of the soils suitability to carry out its proposed land use. Specifically, this chapter will focus on the skills needed to describe and interpret the soil including; profile description, wetness conditions, and restrictive horizons, assess suitability, aerobic conditions, internal vs. external drainage. Evaluation of the soil is just one component of fully assessing a site. There are additional site factors and characteristics that must also be evaluated. These are discussed in Chapter 4. Where do we begin to describe a soil? Just like the recipe for woodchuck stew starts with “first find a woodchuck hole” so with soil description we must first find a hole or soil to describe. Once the hole is dug decisions need to be made as to what do you describe. The level of detail of this description will be related to the proposed land use, however a soil description should include most if not all the following; horizon, depth, color, texture, features, consistence, structure, pores, roots, and reaction. Each component of the description will aid in the overall interpretation, however, depending on land use some will be more important than others. In addition to learning how to make descriptions this chapter will give the basics on how to interpret description made by others, particularly those found in NRCS Soil Surveys
Soil Color Color is the first soil property to begin discussing as it is perhaps the most obvious and easily determined soil characteristic. Important characteristics can be inferred from soil color. Well drained soils have uniform bright colors. Soils with a fluctuating water table have a mottled pattern of gray, yellow, and/or orange colors. Organic matter darkens the soil and is typically associated with surface layers. Organic matter will mask all other coloring agents. Iron (Fe) is the primary coloring agent in the subsoil. The orange brown colors associated with well drained soils are the result of Fe oxide stains coating individual particles. Manganese (Mn) is common in some soils resulting in a very dark black or purplish black color. Several other soil minerals have distinct colors, thus making their identification straight forward. For example, glauconite is green, Quartz has various colors but is often white or gray, feldspars range from pale buff to white, micas may be white, brownish black, or golden, and kaolinite appears gray to white.

Model Decentralized Wastewater Practitioner Curriculum Soil and Site Evaluation
Lindbo et. al. 21
Color determination can be quite subjective if just a verbal description is used. In general each person will perceive color differently, thus there is a need to standardize it. In order to be able to standardize color some basic understanding of the properties that govern it are needed. Recall that white light (or visible EM wavelengths) can be broken into the colors of the rainbow (ROYGBIV). Each spectral color (ROYGBIV) corresponds to a specific wavelength. The color we see is the wavelength that is reflected off the surface of what we are looking at. Thus if we see a red object, the red wavelength is being reflected and all other colors are being absorbed. It is possible to measure the wavelength reflected off an object, but the equipment is expensive and not easily used in the field. Thus determining the spectral wavelength is not ideal. In the early 1900’s some work was done to try and make color description easier. The method devised used the artist’s color well. Each pie wedge represented a particular spectral wavelength or HUE (R=Red etc.) These wedges could be further divided into smaller sections (1R = 10% Red, 10R = 100% Red). Typically only the 25, 50, 75 and 100% are used (2.5, 5, 7.5, and 10). The HUE does not tell the whole story. Shading (value) and purity or intensity (chroma) was then added. A measure of lightness or darkness was then added. Value refers to how light or dark the color is (gray scale). Value indicates the degree of lightness or darkness of a color relative to gray. Value extends from pure black (0/) to pure white (10/) and is a measure of the amount of light that reaches the eye, gray is perceived as about halfway between black and white and has a value notation of 5/. Lighter colors have values between 5/ and 10/; darker colors are between 5/ to 0/. Chroma is the relative purity or strength of the spectral color. Chroma indicates the degree of saturation of neutral gray by the spectral color. Chromas extend from /0 for neutral colors to /8 as the strongest expression of the color. Putting all this together the Munsell Color System was created. It was initially designed for manufacturing but soon made its way into any field that needed to record and communicate color. Hue refers to the dominant wavelength of light (red, yellow, green, etc.). Value refers to the lightness and darkness of a color in relation to a neutral gray scale. Chroma is the relative purity or strength of the Hue. The typical notation of color is an alpha-numeric term of Hue Value/Chroma or 10YR 5/6. Some colors have symbols such as N 6/. These are totally achromatic (neutral color), and have no hue and no chroma, only a value. Gley colors/pages are a specific group of colors that when observed in soils generally mean the soil has formed under saturated conditions. The gley page is set up differently from the other pages. Hue is along the bottom value increase along the Y axis the colors have a chroma of 0 in hue is N, 1 or 2 for other hues. Checking the face page will indicate which chroma is being used. Colors should be recorded in a specific fashion. Soil should be moist. Although this is the most common way soil colors are recorded they can be recorded in the dry state. At all time the moisture status of the sample should be noted. Always use a freshly exposed face or ped and record what is being colored. Do not crush or rub the soil before getting a color unless it is an organic sample. Colors must always be determined in natural light (direct sunlight). Furthermore, colors should not be determined late or early in the day as the sun angle can alter the observed color. Colors should never be determined under artificial light. Finally, color should not be determined when one is wearing sunglasses or tinted glasses.

Model Decentralized Wastewater Practitioner Curriculum Soil and Site Evaluation
Lindbo et. al. 22
In describing colors it is important to determine the variation in color throughout the soil. Matrix color is the color that occupies the greatest volume of the horizon. Some horizons have several colors, the color that appears the most is recorded first and so forth. Redoximorphic features result from the reduction, oxidation, and translocation of Fe and/or Mn. Mottles are color patterns not related to soil wetness, often related to parent material, mineralogy, or weathering patterns. Other color patterns may be described separately for any feature such as peds, concretions, nodules, cemented bodies, filled animal burrows, etc. Gley colors are low chroma matrix colors with or without mottles. If the soil has a gley color it is likely to be reduced and wet for much of the year. Likewise the percent of the given feature should be recorded. Although NRCS does use this chart to indicate abundance it is better to record the actual percent using the charts in the Munsell book to estimate. Contrast refers to how easy it is to see a feature as compared to the matrix. There are 3 classes of contrast; faint, distinct, and prominent. Faint contrast is evident only on close examination. Distinct contrast is readily seen but moderate to the color to which compared. Prominent contrast is strongly contrasting colors to which they are compared (Table 1). Table 1: Contrast chart.
Contrast Class
Code Difference in Color Between Matrix and Mottle
Hue Value Chroma Faint F same 0 to <2 and <1
same >2 to <4 and <4 or
same <4 and >1 to <4
Distinct D
1 page <2 and <1 same >4 or >4
1 page >2 or >1 Prominent P
2+ page >0 or >0 Chemistry and Morphology
Chemistry and soil morphology are intimately related. This chapter will discuss these relations and demonstrate how we use morphology to determine the processes going on in the soil. Essentially, the soil looks the way it does due to chemical reactions. Three types of reactions, resulting morphology, and interpretations will be discussed; redox reactions, podzolization, and cementation. Other reactions do occur but these three are the most critical in regards to soil evaluation for on-site wastewater treatment and dispersal.

Model Decentralized Wastewater Practitioner Curriculum Soil and Site Evaluation
Lindbo et. al. 23
Redox reactions are short for oxidation-reduction reactions. These reactions occur in all soil but are most common in seasonally saturated and hydric soils. It is these reactions that are responsible for many of the soil colors observed in soil. Other than color redox reactions control organic matter contents and are related to soil water chemistry. The general redox principle is that as OM decomposes it releases electrons. These electrons are taken up by (or given to) another element or compound. The compound that gains an electron is said to be reduced as the electron has a negative charge thus the overall charge or the element or compound is reduced by 1. Conversely a substance that looses an electron is said to be oxidized. A simple way to remember when electrons are lost or gained is with this saying: LEO the lion says GER. In soil there are aerobic soil reactions. In these reactions oxygen acts as the terminal electron acceptor. This reaction results in the most energy for the organism and is preferred. Respiration uses oxygen as the terminal electron acceptor. If the oxygen is removed from the system then the soil is said to be anaerobic that is without air. Once the oxygen is removed several anaerobic reactions will occur. The sequence that the reactions occur in is dependent on the amount of energy each reaction will produce. The sequence starts with aerobic reactions (respiration), then denitrification, then Mn or Fe reduction, then sulfate reduction, and finally carbon dioxide reduction. Denitrification occurs when nitrate is used as the terminal electron acceptor. Nitrate is reduced to nitrogen gas. This reaction can be measured in soil by measuring the production of N2 gas. There is no morphologic signature to this reaction. Iron (Fe) reduction occurs when Fe3+ is used as the terminal electron acceptor. Fe3+ (ferric iron) is reduced to Fe2+ (ferrous iron). Unlike nitrate reduction there is a morphologic signature of Fe reduction. Consider soil particles to be coated or painted with Fe-oxide pain (rust). This is similar to the way in which M&Ms are coated with a colorful candy shell. If the M&Ms get wet the shell is washed or dissolved off leaving the white candy shell beneath. Similarly the rusty coating on soil particles is dissolved off as the Fe3+ is converted to Fe2+. The Fe2+ is colorless and soluble in water. The gray color that remains is the color of the mineral grains. Sulfate reduction occurs as sulfate is converted to hydrogen sulfide gas, which smells like rotten egg. Generally this odor is only encounter when the soil is saturated and reduced for sulfate. Redoximorphic features, formerly known as mottles, are formed by changes in redox conditions in seasonally saturated soil, the reduction and oxidation of C, Fe, Mn, and S compounds, and the subsequent translocation of C, Fe, Mn, and S compounds. The best evidence of this process is to find features caused by reduction and oxidation in the same profile. The oxidized features are evidence of translocation. In order to form features: must have anaerobic conditions (reduced and saturated - stagnant); must have Fe and/or Mn (electron acceptor); must have microbes (bugs); must have carbon (food for the bugs). Within the soil reducing conditions may occur adjacent to organic matter. For example Fe is reduced near the dead root after all the oxygen and nitrate is removed from the water. The reduced Fe is soluble in water and diffuses away from the root area leaving gray minerals behind. As the reduced Fe interacts

Model Decentralized Wastewater Practitioner Curriculum Soil and Site Evaluation
Lindbo et. al. 24
with the water that has not had all its oxygen removed it will reoxidize or rust leaving a red rim around the reduced area in the middle. Since the bacteria are not mobile the area of reduction will be near a carbon source.
Soil Texture and Particle Size Distribution Texture or particle size is used to determine LTAR ranges for designing on-site systems. Texture, itself, only refers to the amount of sand, silt and clay in the soil. The practitioner infers from this information what the pore size distribution is and thus infers the rate at which water will flow through the soil. Texture by itself is not enough to determine LTAR it simply helps to define the range of possibilities. USDA Description Particle size distribution describes the abundance of the various size particles that constitute the mineral portion of soil materials. The finer size fractions are called the fine earth fraction (smaller than 2 mm diameter). The larger particles (pebbles, cobbles, stones, and boulders) are called rock fragments. The term “coarse fragments” excludes the stones and boulders classes in the rock fragments. Particle-size distribution of fine earth fraction is determined in the field mainly by feel. The content of rock fragments is determined by estimating the proportion of the soil volume they occupy. Rock Fragments Rock fragments are unattached pieces of rock 2 mm in diameter or larger that are moderately cemented or more resistant to rupture. Rock fragments include all sizes that have horizontal dimensions less than the size of a pedon (approximately 3.5 m). Rock fragments are described by size, shape, and for some, the kind of rock. The classes are gravels, cobbles, channers, flagstones, stones, and boulders (See Table). If a size or range of sizes predominates, the class is modified, as for example: "fine gravels," "cobbles 100 to 150 mm in diameter," "channers 25 to 50 mm long." The terms "gravel" and "cobble" are usually restricted to rounded or subrounded fragments; however, they can be used to describe angular fragments if they are not flat. Words like chert, limestone, and shale refer to a kind of rock, not a piece of rock. The composition of the fragments can be given: "chert pebbles," "limestone channers." The upper size of gravel is 3 inches (76 mm). This coincides with the upper limit used by many engineers for grain-size distribution computations. The 5-mm and 20-mm divisions for the separation of fine, medium, and coarse gravel coincide with the sizes of openings in the "number 4" screen (4.76 mm) and the "3/4 inch" screen (19.05 mm) used in engineering to separate fractions of rock fragments. The 250-mm (10 inch) limit is used to separate cobbles from stones and 600 mm (24 inch) limit is used to separate stones from boulders. The 150 mm (channers) and 380 mm (flagstones) limits for thin, flat fragments follow conventions used for many years to provide class limits for plate-shaped and crudely spherical rock fragments that have about the same soil use implications as the 250-mm limit for spherical shapes. Terms for describing rock fragments. ___________________________________________

Model Decentralized Wastewater Practitioner Curriculum Soil and Site Evaluation
Lindbo et. al. 25
Size Type Adjective (mm) Rounded, subrounded, and irregular: 2 to 76...........Gravels.......gr.............gravelly 2 to 5.............Gravels......grf.......fine gravelly 5 to 20...........Gravels.....grm....med. gravelly 20 to 76.........Gravels......grc...coarse gravelly 76 to 250........Cobbles......cb...............cobbly 250 to 600......Stones.........st................stony >600..............Boulders.....by............bouldery Flat: (long) 2 to 150.........Channers....cn............channery 150 to 380......Flagstones...fl.................flaggy 380 to 600......Stones.........st................stony >600..............Boulders.....by............bouldery Fine-Earth Fraction The following table shows the various size fractions that make up the fine-earth fraction of soil materials. USDA size separates for the fine-earth fraction (mineral soil materials <2 mm). Class Size ___________________________(mm)__ Very coarse sand.......................2.0 to 1.0 Coarse sand..............................1.0 to 0.5 Medium sand..........................0.5 to 0.25 Fine sand..............................0.25 to 0.10 Very fine sand........................0.10 to 0.05 Silt....................................0.05 to 0.002 Clay...........................................<0.002
Soil Texture Soil texture refers to the weight proportion of the separates for the less than 2 mm fraction as determined from a laboratory particle-size distribution. Field estimates should be checked against laboratory determinations and the field criteria should be adjusted as necessary. The texture of soil is given to tell as much as possible about a soil in a few words. With texture given, approximations and estimates can be made of many properties of a soil, such as bearing value, water-holding capacity, liability to frost-heave, adaptability to soil-cement construction, etc.

Model Decentralized Wastewater Practitioner Curriculum Soil and Site Evaluation
Lindbo et. al. 26
Soil Texture Classes Defined The texture classes are sands, loamy sands, sandy loams, loam, silt loam, silt, sandy clay loam, clay loam, silty clay loam, sandy clay, silty clay, and clay. Sands are subdivided into coarse sand, sand, fine sand, and very fine sand. Subclasses of loamy sands and sandy loams that are based on sand size are named similarly (See table for abbreviations). Textural classes and corresponding symbols Symbol Class ___________________________________________ cos..................................coarse sand s..............................................sand fs........................................fine sand vfs...............................very fine sand lcos.......................loamy coarse sand ls...................................loamy sand lfs..............................loamy fine sand lvfs.....................loamy very fine sand cosl.......................coarse sandy loam sl...................................sandy loam fsl..............................fine sandy loam vfsl.....................very fine sandy loam l..............................................loam sil......................................silt loam si..............................................silt scl............................sandy clay loam cl......................................clay loam sicl.............................silty clay loam sc.....................................sandy clay sic.....................................silty clay c..............................................clay Sands: More than 85 percent sand, the percentage of silt plus 1.5 times the percentage of clay is less than 15. Coarse sand: A total of 25 percent or more very coarse and coarse sand and less than 50 percent any other single grade of sand.

Model Decentralized Wastewater Practitioner Curriculum Soil and Site Evaluation
Lindbo et. al. 27
Sand: A total of 25 percent or more very coarse, coarse, and medium sand, a total of less than 25 percent very coarse and coarse sand, and less than 50 percent fine sand and less than 50 percent very fine sand. Fine sand: 50 percent or more fine sand; or a total of less than 25 percent very coarse, coarse, and medium sand and less than 50 percent very fine sand. Very fine sand: 50 percent or more very fine sand. Loamy sands: Between 70 and 91 percent sand and the percentage of silt plus 1.5 times the percentage of clay is 15 or more; and the percentage of silt plus twice the percentage of clay is less than 30. Loamy coarse sand: A total of 25 percent or more very coarse and coarse sand and less than 50 percent any other single grade of sand. Loamy sand: A total of 25 percent or more very coarse, coarse, and medium sand and a total of less than 25 percent very coarse and coarse sand, and less than 50 percent fine sand and less than 50 percent very fine sand. Loamy fine sand: 50 percent or more fine sand; or less than 50 percent very fine sand and a total of less than 25 percent very coarse, coarse, and medium sand. Loamy very fine sand: 50 percent or more very fine sand. Sandy loams: 7 to 20 percent clay, more than 52 percent sand, and the percentage of silt plus twice the percentage of clay is 30 or more; or less than 7 Percent clay, less than 50 percent silt, and more than 43 percent sand. Coarse sandy loam: A total of 25 percent or more very coarse and coarse sand and less than 50 percent any other single grade of sand. Sandy loam: A total of 30 percent or more very coarse, coarse, and medium sand, but a total of less than 25 percent very coarse and coarse sand and less than 30 percent fine sand and less than 30 percent very fine sand; or a total of 15 percent or less very coarse, coarse, and medium sand, less than 30 percent fine sand and less than 30 percent very fine sand with a total of 40 percent or less fine and very fine sand. Fine sandy loam: 30 percent or more fine sand and less than 30 percent very fine sand; or a total of 15 to 30 percent very coarse, coarse, and medium sand; or a total of more than 40 percent fine and very fine sand, one half or more of which is fine sand, and a total of 15 percent or less very coarse, coarse, and medium sand. Very fine sandy loam: 30 percent or more very fine sand and a total of less than 15 percent very coarse, coarse, and medium sand; or more than 40 percent fine and very fine sand, more than one half of which is very fine sand, and a total of less than 15 percent very coarse, coarse, and medium sand.

Model Decentralized Wastewater Practitioner Curriculum Soil and Site Evaluation
Lindbo et. al. 28
Loam: 7 to 27 percent clay, 28 to 50 percent silt, and 52 percent or less sand. Silt loam: 50 percent or more silt and 12 to 27 percent clay, or 50 to 80 percent silt and less than 12 percent clay. Silt: 80 percent or more silt and less than 12 percent clay. Sandy clay loam: 20 to 35 percent clay, less than 28 percent silt, and more than 45 percent sand. Clay loam: 27 to 40 percent clay and more than 20 to 46 percent sand. Silty clay loam: 27 to 40 percent clay and 20 percent or less sand. Sandy clay: 35 percent or more clay and 45 percent or more sand. Silty clay: 40 percent or more clay and 40 percent or more silt. Clay: 40 percent or more clay, 45 percent or less sand, and less than 40 percent silt. A texture triangle (see figure) is used to resolve problems related to word definitions of the textures, which are obviously somewhat complicated. Instructions for Estimating Soil Texture by Feel The feel and appearance of the textural groups illustrate factors used in determining the texture of a soil in the field and also assist in field classification work. Note that forming a cast of soil, dry and moist, in the hand and pressing a moist ball of soil between the thumb and finger constitute two major field tests to judge soil texture. Sand: Individual grains can be seen and felt readily. Squeezed in the hand when dry, this soil will fall apart when the pressure is released. Squeezed when moist, it will form a cast that will hold its shape when the pressure is released but will crumble when touched. Sandy loam: Consists largely of sand, but has enough silt and clay present to give it a small amount of stability. Individual sand grains can be seen and felt readily. Squeezed in the hand when dry, this soil will fall a part when the pressure is released. Squeezed when moist, it forms a cast that will not only hold its shape when the pressure is released but will withstand careful handling without breaking. The stability of the moist cast differentiates this soil from sand. Loam: Consists of an even mixture of sand and silt, and contains a considerable amount of clay. It is easily crumbled when dry and has a slightly gritty, yet fairly smooth feel. It is slightly plastic. Squeezed in the hand when dry, it will form a cast that will withstand careful handling. The cast formed of moist soil can be handled freely without breaking.

Model Decentralized Wastewater Practitioner Curriculum Soil and Site Evaluation
Lindbo et. al. 29
Silt loam: Consists of a moderate amount of fine grades of sand, a small amount of clay, and a large quantity of silt particles; lumps in a dry, undisturbed state appear quite cloddy but they can be pulverized readily; the soil then feels soft and floury. When wet, silt loam runs together and puddles. Either dry or moist casts can be handled freely without breaking. When a ball of moist soil is pressed between thumb and finger, it will not press out into a smooth, unbroken ribbon but will have a broken appearance. Clay loam: A fine-textured soil which breaks into clods or lumps that are hard when dry. When a ball of moist soil is pressed between the thumb and finger, it will form a thin ribbon that will break readily, barely sustaining its own weight. The moist soil is plastic and will form a cast that will withstand considerable handling. Clay: A fine-textured soil that breaks into very hard clods or lumps when dry, and is plastic and unusually sticky when wet. When a ball of moist soil is pressed between the thumb and finger, it will form a long ribbon. Soil texture can be estimated by feel using the following procedure and key. Place approximately 25 grams of soil in the palm of your hand. Add water drop wise and knead to break down aggregates. Soil is at the proper consistency when plastic and moldable like moist putty.
Soil Texture Class Key* Does soil remain in a ball when lightly tossed in the air? No - the texture is SAND Yes - place ball between the thumb and forefinger and push the soil with the thumb to form a ribbon. Allow the ribbon to extend over the forefinger until it breaks from its own weight. Does the soil form a ribbon? No - the texture is LOAMY SAND. If the soil forms a ribbon that that extends past the forefinger, note the length of the ribbon. Next excessively wet a small sample in the palm and rub with the forefinger. If the ribbon was < 1 inch long when it broke and the excessively wet sample feels: gritty, the texture is SANDY LOAM; smooth, the texture is SILT LOAM; neither gritty nor smooth, the texture is LOAM. If the ribbon was between 1 and 2 inches long when it broke and the excessively wet sample feels: gritty, the texture is SANDY CLAY LOAM; smooth, the texture is SILTY CLAY LOAM; neither gritty nor smooth, the texture is CLAY LOAM. If the ribbon > 2 inches long when it broke and the excessively wet sample feels: gritty, the texture is SANDY CLAY; smooth, the texture is SILTY CLAY; neither gritty nor smooth, the texture is CLAY.

Model Decentralized Wastewater Practitioner Curriculum Soil and Site Evaluation
Lindbo et. al. 30
• *The soil texture key should be tested for samples within ones own region. Soil materials behave in different ways depending upon the shape and size of the sand fraction, and the mineralogy of the clay fraction. Some sand fractions are flat in shape and will feel smooth (mica particles for example). Fine and very fine sand will behave in a manner similar to silt-sized particles. Clay fractions with appreciable smectite minerals will form long ribbons even with less than 40% clay.
Using Rock Fragment Modifiers If more than 15% rock fragments (by volume estimate) occur in a soil horizon the soil texture class is modified with a rock fragment abundance modifier. Historically, the total volume of rock fragments of all sizes has been used to form classes. The interpretations program imposes requirements that cannot be met by grouping all sizes of rock fragments together. Furthermore, the interpretations program requires weight rather than volume estimates. For interpretations, the weight percent >250, 250-75, 75-5 and 5-2 mm are required; the first two are on a whole soil basis, and the latter two are on a <75 mm basis. For the >250 and 250-75 mm fractions, weighing is impracticable. Volume percentage estimates would be made from areal percentage measurements by point-count or line-intersect methods. Length of the transect or area of the exposure should be 50 and preferably 100 times the area or dimensions of the rock fragment size that encompasses about 90 percent of the rock fragment volume. For the <75 mm, weight measurements are feasible but may require 50-60 kg of sample if appreciable rock fragments near 75 mm are present. An alternative is to obtain volume estimates for the 75-20 mm and weight estimates for the <20 mm. This is favored because of the difficulty in visual evaluation of the 5 and 2 mm size separations. The weight percentages of 20-5 and 5-2 mm may be converted to volume estimates and placed on a <75 mm base by computation. The adjective form of a class name of rock fragments is used as a modifier of the textural class name: "gravelly loam." The following classes based on volume percentages are used: Less than 15 percent: No adjective or modifier terms are used. 15 to 35 percent: The adjective term of the dominant kind of rock fragment is used as a modifier of the textural term: "gravelly loam," "channery loam," "cobbly loam." 35 to 60 percent: The adjective term of the dominant kind of rock fragment is used with the word "very" as a modifier of the textural term: "very gravelly loam," "very flaggy loam." More than 60 percent: If enough fine earth is present to determine the texture class (approximately 5 percent or more by volume) the adjectival term of the dominant kind of rock fragment is used with the word "extremely" as a modifier of the textural term: "extremely gravelly loam." If there is too little fine earth to determine the texture class (less than about 5 percent by volume) the terms "gravel," "cobbles," "stones," and "boulders" are used in the place of fine earth texture.

Model Decentralized Wastewater Practitioner Curriculum Soil and Site Evaluation
Lindbo et. al. 31
Symbols and adjectives used to modify textural class names with greater than 15% rock fragments. Symbol Adjective __________________________________________ by......................................bouldery byv..............................very bouldery byx.......................extremely bouldery cb..........................................cobbly cbv.................................very cobbly cbx..........................extremely cobbly cn.........................................channery cnv..............................very channery cnx.......................extremely channery fl............................................flaggy flv...................................very flaggy flx............................extremely flaggy gr........................................gravelly grc..............................coarse gravelly grf.................................fine gravelly grv...............................very gravelly grx........................extremely gravelly st...........................................stony stv....................................very stony stx............................extremely stony

Model Decentralized Wastewater Practitioner Curriculum Soil and Site Evaluation
Lindbo et. al. 32

Model Decentralized Wastewater Practitioner Curriculum Soil and Site Evaluation
Lindbo et. al. 33

Model Decentralized Wastewater Practitioner Curriculum Soil and Site Evaluation
Lindbo et. al. 34
AASHTO Description Wentworth Description (Geologic Description (phi scale)) Particle size analysis (pipette method) 1000 ml sedimentation columns hand stirrer (plunger) calgon solution (sodium hexametaphosphate) 35.7 grams of (NaPO3)6 and 7.94 grams of Na2CO3 in 1 liter of water nest of sieves sieve shaker hydrogen peroxide 30-35% Lowy Pipette 50 ml beakers 250 ml centrifuge bottles shaker 1) Weigh 10 grams of sample into the 250 ml centrifuge bottles and 10 grams into weighed 50 ml beakers. Place the beakers in a 105 degrees C oven overnight.

Model Decentralized Wastewater Practitioner Curriculum Soil and Site Evaluation
Lindbo et. al. 35
If samples contain substantial organic matter the samples should be pretreated to remove organic matter. a) Weigh out 10 grams of sample into two 600 ml beakers. b) Add 10 ml of 30% hydrogen peroxide and 10 ml of distilled water. Stir and let stand for 30 minutes to an hour. c) Add an additional 10 ml of hydrogen peroxide and 10 ml of water and put the samples on a hot plate. Slowly raise the temperature to 70 degrees C. Occasionally stir. Leave on the hotplate overnight covered with a watch glass. d) Place one of the beakers in the oven to determine oven dry sample wt and the other sample wash into a centrifuge bottle. e) Continue the procedure starting at step 2. 2) Add 10 ml of calgon and enough distilled water to the centrifuge bottle so that it is 3/4 full. 3) Place the samples on the shaker (lying down) and shake on slow speed overnight. 4) In the morning, wash soil calgon water mixture through a 270 mesh (53 um) sieve. Materials passing through the sieve should be collected in a 1000 ml sedimentation column. 5) Wash the sand fraction from the sieve into a 50 ml beaker and place it in a 105 degree C oven overnight. 6) Fill the column up with distilled water to the 1000 ml mark. 7) Leave the column overnight to allow the temperature to equilibrate. 8) Record the temperature and refer to the temperature-sedimentation falling rate chart to find appropriate times to collect samples at the 10 cm depth with the pipette. 9) Stir the soil-water-calgon mixture in the column with the plunger. Make short rapid strokes in the beginning near the bottom of the column. Increase the length of the strokes so that the entire column is being mixed with a rhythmic motion. Do not hit the plunger on the bottom of the column or break the plane of the water at the top of the column. Stop stirring after 1 to 2 minutes and record the time. 10) At the appropriate time, pipette a 25 ml aliquot with the Lowy pipette and dispense the aliquot into weighed (to 4 places) 50 ml beakers. 11) Repeat step 10 if successive fractions are to be measured. 12) Place beakers in the 105 degrees C oven overnight.

Model Decentralized Wastewater Practitioner Curriculum Soil and Site Evaluation
Lindbo et. al. 36
13) Remove beakers from the oven and place them in a desiccator to cool. 14) Weigh beakers in step 1 to determine oven dry weight of sample. Use this weight to determine the percentage of each fraction. 15) Weigh beakers in step 5 to record weight of sand. Divide this weight by the oven dry weight and multiply by 100 to get percent sand. 16) Weigh beakers (to 4 places) in step 12 to determine amount of sample and calgon in each 25 ml aliquot. Multiply this value by 40 to determine the amount in the entire column. If the weight represents a silt fraction, subtract the weight in the next finer fraction. For example subtract the clay weight from the fine silt size fraction. If the weight represents the clay fraction subtract the weight of the dry calgon added to the centrifuge bottle in step 2. This weight can be calculated by oven drying three 10 ml aliquots of calgon and computing the mean weight of 10 ml. 17) Calculate remaining size fractions by determining the difference of those recorded from 100%. Sample Oven dry
sample and beaker wt.
Oven dry beaker wt.
Oven dry sample wt
X40 Subtract clay or calgon
Divide by sample wt. (9.90)
Multiply by 100
Fine silt 29.5000 29.0000 0.5000 2.0000 1.0000 0.1010 10.1% Clay 28.2500 28.0000 0.2500 1.0000 0.5000 0.0505 5.1% calgon 0.5000

Model Decentralized Wastewater Practitioner Curriculum Soil and Site Evaluation
Lindbo et. al. 37
Sedimentation rates of particles follow a form of Stokes’ Law:
V = 2r2g(ps-pl)/(9n) where: V = velocity of fall= 2r2g(ps-pl)/(9n) r = particle radius g = acceleration due to gravity ps = particle density pl = liquid density n = fluid viscosity Assumptions used in applying Stokes' law to soil sedimentation measurements are as follows: 1. Terminal velocity is attained as soon as settling begins. 2. Settling and resistance are entirely due to the viscosity of the fluid. 3. Particles are smooth and spherical. 4. There is no interaction between individual particles in the solution (Gee and Bauder, 1986). 5. Since soil particles are not smooth and spherical, the radius of the particle is considered an equivalent rather than an actual radius.
37

Model Decentralized Wastewater Practitioner Curriculum Soil and Site Evaluation
Lindbo et. al. 38
Soil Organic Matter
Organic Carbon influences soil by acting as a coloring agent, improving the water holding capacity, increasing fertility, and improving aggregation. Organic matter may feel smooth (like silt) and sticky (like clay) and therefore interfere with your texture by feel. Organic matter is approximately 1.77x the organic carbon content. A soil is divided into 3 classes based on the organic carbon content related to clay; muck, mucky mineral, and mineral (see graph). Organic mater content may be determined in the lab or in the field. For field determination it is best to have known standards to calibrate yourself. In addition to amount of organic mater it may be necessary to determine how decomposed the materials is. There are 3 types of soil organic materials; sapric (Oa) – very decomposed, <17% rubbed fibers, hemic (Oe) – decomposed, 17 to 40% rubbed fibers, fibric (Oi) – least decomposed, > 40% rubbed fibers also referred to as sapric (Oa) – muck, hemic (Oe) – mucky peat, fibric (Oi) – peat. In order to identifying organic soil type rub moist sample between fingers 10 times. Examine material with hand lens and look for fibers, not live roots, and estimate percent fibers remaining. Fibers are smaller than 2 cm (approx. 1”) and show cellular structure. Muck is highly decomposed, < 1/6 fibers remaining after rubbing (sapric material). Mucky peat is moderately decomposed, between 1/6 and ¾ fibers remaining after rubbing (hemic material). Peat is slightly decomposed, > ¾ fibers remaining after rubbing (fibric material). It is important to be able to tell the difference between organic and mineral material as this could affect interpretations. Specifically, muck and mucky mineral horizons often suggest wet soil conditions, whereas a dark A horizon may not. Thus the difference between these two materials can influence one’s final interpretation of the site.
Soil Structure Soil structure is another aspect of soil description that must be considered in order to evaluate a soil for its ability to treat and dispose of wastewater. Soil structure relates to the bigger picture of how water will move in the soil. Soils with a good texture may be foiled by a poor structure. One definition of soil structure is the grouping of individual soil particle into a larger grouping. You can also thinks of structure as a brick house in that the brick, mortar and cement are the particles (i.e. texture) and the completed house is the structure. We concerned about structure because of its relation to land use. Take for example a soil with a structure that does not allow roots to penetrate deeply into the soil. Agricultural crops will suffer water stress as the pants will be unable to utilize water depth in the soil profile since their roots can not penetrate that far. An effect of shallow rooting of trees may result in tree throw during winds the tree may not be well anchored.
38

Model Decentralized Wastewater Practitioner Curriculum Soil and Site Evaluation
Lindbo et. al. 39
Certain structures are more likely to be restrictive to water movement and thus are unsuitable for wastewater treatment and dispersal. Description of structure (as with texture) follows the NRCS description on categories. “Structure is the naturally occurring arrangement of soil particles into aggregates (peds) that result from pedogenic processes”. Three general groups: Natural Soil Structural Units (pedogenic structure); Structureless; Artificial Earthy Fragments or Clods. It is the first two that we will spend the vast amount of time discussing. Soil structure is describing using 3 components: type, size, and grade. Pedogenic structure is divided into 7 classes; granular, angular blocky, subangular blocky, platy, wedge, prismatic and columnar (Figure 1). Typical granular structure looks like granola and is most often found in the surface layers. Angular blocky structure is equidimensional with the faces at sharp angles and the peds fit together well. Subangular blocky structure is more rounded than angular. Platy structure is wider than deep. Wedge structure has elliptical interlocking peds the often show slickened sides. Prismatic structure is vertically elongated. Columnar structure is similar to prismatic but the unit tops are frequently rounded and bleached due to the high salt content. Structureless soils are broken into 2 official groups; Single Grain, Massive and Massive - Rock Controlled Fabric. Single grain refers to sands whereas massive refers to any soil that does not break apart into any predictable and repeatable type or shape. Massive rock controlled structure is used for soil developed from saprolite. Unlike simple massive structure, rock controlled fabric has a preferred orientation of the minerals. The material may easily break into the individual mineral grains. Artificial structure is that created by disturbance. In regards to on-site systems this may be detrimental as it often will restrict water movement. Size is broken into 5 groups. The actual size ranges vary depending on the type of structure. Note that platy refers to thickness and columnar and prismatic refer to diameter. Grade refers to how well expressed or how stable the structure is. There are 4 groups of structure grade (0-3). All structureless soils have a grade of 0. The others range from 1 to 3. Structureless are soil where no discrete units observable in place or in hand sample. Weak structured soils have units that are barely observable in place or in a hand sample. Moderate structured soils have well-formed units that are evident in place or in a hand sample. Strong structured soils have units that are distinct in place (undisturbed soil), and separate cleanly when disturbed. Compound structure is described when smaller structural units held together to form larger units. For example a soil may be described as having “Moderate coarse prismatic structure parting to strong medium subangular blocky structure.” This means that subangular blocky is the primary structure and prismatic is the secondary structure.
39

Model Decentralized Wastewater Practitioner Curriculum Soil and Site Evaluation
Lindbo et. al. 40
The formation of structure in soils has not received the level of scrutiny proportional to its importance to land use or water management. Much of the research that has been done has to do with tillage and surface layers. These studies are concerned with both formation and destruction of structure as it relates to agronomic concerns. Similarly, research on salt affected soils deals with how soils disperse and structure is destroyed. Finally research on Vertisols and expansive clay has been investigated to show how structures vary in Veritsol regions. By reviewing these studies a general idea regarding structure formation can be developed. Structure formation is related to physical, chemical and biological processes at work in the soil. The physical processes that affect structure are; illuviation/eluviation, freeze/thaw, compaction, disruption (mechanical, natural i.e. slope movement), and wet/dry – shrink/swell. Eluviated zones generally have weaker structure or are structureless where as the Illuviated zones show stronger structure as the illuviated material will help define the structure units by coating and stabilizing peds. Even if the material does not have a high amount of expandable clay minerals, desiccation will cause cracks to form. These cracks may become stabilized as clay, oxides or organic matter move through and/or coats them. When expandable clays are present their action can help define and form wedge structure. In regions that experience freezing of the ground surface such action may aid in structural development. In some ways this is similar to shrink/swell in that the soil is compacted as object is force upward. The compaction form ped faces which, if stabilized may form structural units. However the next freeze/thaw cycle could destroy the original feature. Compaction generally results in denser soil maybe even structureless. Compaction due to farm implements or traffic will often result in a platy plow or traffic pan. If present these should be disrupt throughout the drainfield as they could channel water into the trenches. If left alone temporary perching may occur. Water may flow across it and into the disturbed area of the trenches. During construction the backhoe may smear the sidewalls of the trench resulting in decrease infiltration and poor performance. Slope movement can disrupt structure or prevent it from forming. Although some soils may have enough clay to qualify as an argillic horizon there may be not clay coatings present as constant creep allows only a weak subangular blocky structure to be formed. This phenomenon also illustrates that time is a factor in structure formation as the older more stable soils will have a better developed structure. The soil water chemistry affects structure as well. As with physical influences these affects can be both positive and negative. Flocculation is the bringing of the particles close together and is enhanced by polyvalent cations (Al+++, Ca++, etc.). The flocculated units may form some of the initial building blocks for structural units.
40

Model Decentralized Wastewater Practitioner Curriculum Soil and Site Evaluation
Lindbo et. al. 41
Fe oxides may coat and bridge particles. These oxides may be attached to clay or other particle charges. The oxides may help define a weak subangular blocky structure. Similar to oxides, organic acids will coat and stabilize. Commonly these acids will overwhelm the particles and cement the particles in the horizon together. The biological influence generally enhances the structure. Microbes and fungus add to structure by their by-products, their mediation of redox reactions (Fe oxides), and binding particles together. This phenomenon is most common in the A horizon (topsoil) but can occur wherever enough carbon is present for food. An example of how well the microbes bind soil can be shown by the Rossi-Chaladny test. Plant roots can be quite important to structure formation. In weak structure soils they create larger pores. The pores may be reused and coalesce to form ped faces. Root exudates help stabilize the pores. Bacteria etc. consume the exudates and further stabilize the faces/pores. Root growth physically compresses the voids. In well structured soils they follow the path of least resistance. Large roots can cause by pass flow. Insects may act in a similar way to roots. Ants and termites can form stable channels. Fecal pellets may appear as strong very fine granular structure particularly in forested A horizons. Other large organisms have a similar affect as insects. Crayfish burrows extend over 4 feet into the soil. Within a krotovena a weak to moderate structure is often found. Most structure is formed by the interaction of all 3 components. Despite its importance to land use little research has been done on the formation of structure beyond that related to tillage and agronomic factors. Should soil structure be a factor in land use management? The answer should be obvious as structure plays an important role in water and gas movement in the soil. In on-site wastewater management structure plays a significant role in water movement and in the determination of the LTAR by the soil evaluator. Essentially, recall that as the soil goes from granular to platy and massive the structural porosity decreases thus conductivity decreases (Figure 2). Keep in mind is that texture relates to the microporosity whereas structure relates to macroporosity. The type of structure has a profound impact on how water will move through the soil. In dealing with a septic system remember that under the trench the water flow must be unsaturated through aerobic soil for proper treatment to occur. However, water moves out from the trench into the soil by saturated flow. This means that flow out of the trench bottom is controlled by the structural macropores at first. Flow from the trench is not a simple one dimensional flow. Side walls only play a role to the depth at which they are ponded. In a conventional system this should be minimal. It will be more important in serial distribution or pressure dosed systems. Once flow leaves the zone of saturation it will become unsaturated flow. Although matric potential can draw the flow in any direct (highest potential to lowest potential) the majority of the flow is still vertical. Once the water/effluent reaches the ground water (or restrictive) the flow will become gradient driven, generally lateral. A well structured soil will conduct water away faster as the
41

Model Decentralized Wastewater Practitioner Curriculum Soil and Site Evaluation
Lindbo et. al. 42
larger voids will have a greater conductivity and may allow for deeper flow. Furthermore, flow or diffusion of air (oxygen) will be enhanced by the better structure thus improving treatment. As with any evaluation, once the field work is done the real work begins in regards to interpretation. Structure is used in the determination of the Long Term Acceptance Rate (LTAR). LTAR is based on textural group first. This gives the range. Next the LTAR is adjusted for structure. And then finally the LTAR is adjusted for other factors. LTAR adjustments can be based on structure grade. Once a range is established start in middle of that range. Increase LTAR for strong structure, decrease for weak since strong structure faster movement, better treatment. Also adjust for size by giving a finer size an increase in LTAR and a larger size a decrease in LTAR. Using a chart first developed by Tyler, 2001 the adjustment can be standardized. It should be good to know that the data used to develop the LTARs in general is based on less than 20 observations In Conclusion structure is an important but overlooked aspect of soil evaluation If possible structure should be viewed in a pit. Structure should be assessed in the field with an eye for how will water flow through the soil. This can best be done by looking at roots and ped faces. The relationship between structure and water movement is complex and differs depending on moisture content. Finally, more research is needed
42

Model Decentralized Wastewater Practitioner Curriculum Soil and Site Evaluation
Lindbo et. al. 43
Figure 5: Soil Structure
43

Model Decentralized Wastewater Practitioner Curriculum Soil and Site Evaluation
Lindbo et. al. 44
Figure 6: Soil Structure and water movement
44

Model Decentralized Wastewater Practitioner Curriculum Soil and Site Evaluation
Lindbo et. al. 45
Soil Mineralogy and Consistence Evaluation of soil consistence helps in refining our understanding of how water and wastewater may move through the soil. Soil consistence is used as a proxy to estimate the shrink-swell capacity of the soil and thus its mineralogy. Aspects of consistence are used to determine if the horizon or soil will have a low permeability. Consistence is the degree and kind of cohesion and adherence that soil exhibits, and/or the resistance of soil to deformation or rupture under applied stress. Moisture content strongly influences soil’s consistence. There are 5 ways to record consistence in the field; Rupture Resistance, Manner of Failure, Stickiness, Plasticity, and Penetration Resistance. Each type is recorded at specific moisture contents or within given moisture content ranges resulting in a measure of the strength of the soil to withstand an applied stress. Separate classes are made for; Blocks, peds, and clods and Surface crusts and plates. Moisture content is also considered; Dry and Moist. Cementation classes are obtained by submergence of overnight air-dried samples for at least 1 hour before the test. Calibrating ones fingers against known standards is needed in order to estimate the force being applied. The Field Book for Describing and Sampling Soils describes the specific force that corresponds with each class. A 1 to 1.5 inch (2.5 to 3.1 cm) cube should be used or a plate 3/8 to 5/8 inch (1.0 –1.5 cm) long by ¼ inch (0.5 cm) thick. The rate of change and physical condition soil attains when subjected to compression. Samples are moist or wetter. 3 failure classes are determined; Brittleness, Fluidity, and Smeariness. Each class uses a different size sample. The smeariness failure class is used dominantly with Andic or spodic materials and relates to their unique mineralogy and form the organic matter. Rupture resistance is a measure of the strength of soil material to withstand an applied stress. Different classes are provided for dry and moist block-like specimens (Table 1). The block-like specimen should be 1 to 1.5 inch (2.5 to 3) cm on edge. The specimen is compressed between the thumb and forefinger, between both hands, or between a foot and a non-resilient flat surface. If a specimen resists rupture by compression, a weight is dropped onto it from increasingly greater heights until it ruptures. Failure occurs at the initial detection of deformation or rupture. Stress applied by hand should be over a 1-second period. Soil materials with a moist rupture resistance class stronger than
45

Model Decentralized Wastewater Practitioner Curriculum Soil and Site Evaluation
Lindbo et. al. 46
Table 1. Rupture resistance classes for block-like specimens. Dry class Moist class Operation Stress Applied* Loose Loose Specimen not obtainable Soft Very friable Very slight force <8N between fingers Slightly Friable Slight force 8-20N hard between fingers Moderately Firm Moderate force 20-40N hard between fingers Hard Very firm Strong force 40-80N between fingers Very Extremely Moderate force 80-160N hard firm between hands Extremely Slightly rigid Foot pressure 160-800N hard full body weight Rigid Rigid Blow of <3J but 800N < 3J not body weight Very rigid Very rigid Blow of > 3J > 3J * Both force (newtons, N) and energy (joules, J) are used. The number of newtons is 10 times the kilograms of force. Three J is the energy delivered by dropping 2 kg weight 15 cm. Firm is considered limiting for onsite wastewater treatment
46

Model Decentralized Wastewater Practitioner Curriculum Soil and Site Evaluation
Lindbo et. al. 47
Manner of failure is the rate of change and the physical condition soil material attains when subjected to compression. Manner of failure is dependent upon water state; soil materials are moist or wetter (Table 2). To evaluate the manner of failure, a block-like specimen 1 to 1.5 inch (2.5 to 3) cm on edge is pressed between thumb and forefinger and/or a handful of soil material is squeezed in a hand. Table 2. Manner of failure classes.
Class Criteria Brittle Block ruptures abruptly (pops or shatters) Semi-deformable Block ruptures before compression to < ½ original thickness Deformable Block ruptures after compression to > ½ original thickness Non-fluid No soil flows through fingers with full compression Slightly fluid Some soil flows through fingers, most remains in palm, after full pressure Moderately fluid Most soil flows through fingers, some remains in palm, after full pressure Very fluid Most soil flows through fingers, very little remains in palm, after gentle pressure Non-smeary At failure, block does not change abruptly to fluid, fingers do not skid, no smearing occurs Weakly smeary At failure, block changes abruptly to fluid, fingers skid, soil
smears, little or no water remains on fingers Moderately At failure, block changes abruptly to fluid, fingers skid, soil smeary smears, some water remains on fingers Strongly smeary At failure, block changes abruptly to fluid, fingers skid, soil smears and is slippery, water easily seen on fingers Samples that are fluid and/or smeary present potential problems for onsite wastewater systems. They may be unstable (flow) or result in excessively smeared sidewalls during installation.
47

Model Decentralized Wastewater Practitioner Curriculum Soil and Site Evaluation
Lindbo et. al. 48
Stickiness is the capacity of soil material to adhere to other objects. A sample of soil is crushed in the hand, water is applied while manipulating with thumb and forefinger. Stickiness is estimated at the moisture content that displays maximum adherence between thumb and forefinger. Table 3. Stickiness classes.
Class Criteria Non-sticky Little or no soil adheres to fingers after release of pressure.
Slightly sticky Soil adheres to both fingers after release of pressure with little stretching on separation of fingers.
Moderately sticky Soil adheres to both fingers after release of pressure with some stretching on separation of fingers.
Very Sticky Soil adheres firmly to both fingers after release of pressure with much stretching on separation of fingers.
Plasticity is the degree to which puddled or reworked soil material can be permanently deformed without rupturing. The evaluation is made by forming a roll (wire) of soil at a water content where the maximum plasticity is expressed. Table 4. Plasticity classes
Class Criteria
Non-plastic Will not form a 6 mm diameter roll, of if formed, can not support itself if held on end
Slightly plastic 6 mm diameter roll supports itself; 4 mm diameter roll does not Moderately plastic 4 mm diameter roll supports itself; 2 mm diameter roll does not Very plastic 2 mm diameter supports itself
48

Model Decentralized Wastewater Practitioner Curriculum Soil and Site Evaluation
Lindbo et. al. 49
Penetration resistance is the ability of soil in a confined (field) state to resist penetration by a rigid object of specific size. Classes (Table 5) are based on the pressure required to push the flat end of a cylindrical rod (penetrometer can be purchased from many engineering/forestry,/geology/environmental supply centers) with a diameter of 6.4 mm a distance of 6.4 mm into the soil in about one second. Table 5. Penetration resistance classes.
Class Criteria Extremely low <0.01 mega-pascals (MPa) Very low 0.01 to <0.1 MPa Low 0.1 to 1 MPa Moderate 1 to 2 MPa High 2 to 4 MPa Very high 4 to 8 MPa Extremely high >8 MPa
Consistence results in a fair amount of data. In order to utilize this data some idea of what consistence is related to will help. Perhaps the most critical relations to discuss are water movement, clay mineralogy, and overall management. Essentially as consistence increases the rate of water movement decreases. The relation to water movement is in part due to the clay mineralogy. In order to understand the role clay mineralogy plays in consistence and thus water movement need to understand some of the properties of the clay minerals. Silica Tetrahedron have four sides, four oxygen molecules and one silica (Si+4). Aluminum Octahedron have eight sides with Al+3. These are bound together by shared oxygen molecules into different layers. 1:1 clays are like an open face sandwich with one silica tetrahedron to one aluminum octahedron. The main 1:1 mineral is Kaolinite. 2:1 clays are like a sandwich with two slices of bread. Two silica tetrahedrons (bread) to one aluminum octahedron (filling). The 2:1 clays can be broken into 2 groups; expansive, and non-expansive. In the non-expansive 2:1 clays the sheets or layers are held together strongly so that neither water nor a change in the interlayer cations causes them to swell.
49

Model Decentralized Wastewater Practitioner Curriculum Soil and Site Evaluation
Lindbo et. al. 50
The expansive 2:1 clays are bound together by very weak hydrogen bounds (easily broken). These minerals will swell upon wetting. Smectites are one group of expandable clays. The role of parent material is paramount in the formation of clay minerals (secondary product of weathering). The 1:1 minerals are usually weathered from acidic or felsic parent materials. The expanding 2:1 minerals are usually weathered from basic or mafic parent material. Parent material plays the biggest part of whether the soil will be expansive. Minerals may expand as water is added. Water is dipolar; which simply means it can be attracted to a net negative charge or a net positive charge. Since clays are negatively charge water will be attracted to the minerals. Water carries many different ions in soil solution. It will form a hydrated shell or layer around these ions, such as Na, Ca, and Mg etc. As this hydrated ion is sorbed onto the particle it will push the layers apart. Water has a physical size, thus when it gets between the layers it will force them to move apart Other than consistence in the field the only other way to determine the mineralogy of the soil is via lab procedures. Of all the first 3 are the preferred. Atterburg limits have been shown to be unreliable. Soil Horizons
Three kinds of symbols are used in combination to designate horizons and layers. These are capital letters, lower case letters, and Arabic numbers; capital letters are used to designate master horizons and layers; lower case letters are used as suffixes to indicate specific characteristics of the master horizon and layer; Arabic numerals are used both as suffixes to indicate vertical subdivisions within a horizon or layer and as prefixes to indicate discontinuities (Soil survey manual, Issued October 1993. This is a revision and enlargement of USDA Handbook No. 18, the Soil Survey Manual issued October 1962, and supersedes it. Reference is also made to Keys to soil taxonomy, 6th ed. issued, 1994). Genetic horizons are not the equivalent of the diagnostic horizons of the U.S. soil taxonomy. Designations of genetic horizons express a qualitative judgment about the vector of changes that are believed to have taken place. Diagnostic horizons are quantitatively defined features used to differentiate between taxa in U.S. system of soil taxonomy. Horizon symbols indicate the direction of presumed pedogenesis while diagnostic horizons indicate the magnitude of that expression.
Master Horizons and Layers O horizons-Layers dominated by organic material.
A horizons-Mineral horizons that formed at the surface or below an O horizon that exhibit obliteration of all or much of the original rock structure and (i) are characterized
50

Model Decentralized Wastewater Practitioner Curriculum Soil and Site Evaluation
Lindbo et. al. 51
by an accumulation of humified organic matter intimately mixed with the mineral fraction and not dominated by properties characteristic of E or B horizons; or (ii) have properties resulting from cultivation, pasturing, or similar kinds of disturbance.
E horizons-Mineral horizons in which the main feature is loss of silicate clay, iron, aluminum, or some combination of these, leaving a concentration of sand and silt particles of quartz or other resistant materials.
B horizons-Horizons that formed below an A, E, or O horizon and are dominated by obliteration of all or much of the original rock structure and show one or more of the following:
1. illuvial concentration of silicate clay, iron, aluminum, humus, carbonates, gypsum, or silica, alone or in combination; 2. evidence of removal of carbonates; 3. residual concentration of sesquioxides; 4. coatings of sesquioxides that make the horizon conspicuously lower in value, higher in chroma, or redder in hue than overlying and underlying horizons without apparent illuviation of iron; 5. alteration that forms silicate clay or liberates oxides or both and that forms granular, blocky, or prismatic structure if volume changes accompany changes in moisture content; or 6. brittleness.
C horizons or layers-Horizons or layers, excluding hard bedrock, that are little affected by pedogenic processes and lack properties of O, A, E, or B horizons. The material of C horizons may be either like or unlike that from which the solum presumably formed. The C horizon may have been modified even if there is no evidence of pedogenesis.
R layers-Hard bedrock including granite, basalt, quartzite and indurated limestone or sandstone that is sufficiently coherent to make hand digging impractical.
Transitional Horizons Two kinds of transitional horizons are recognized. In one, the horizon is dominated by properties of one master horizon but has subordinate properties of another. Two capital latter symbols are used, such as AB, EB, BE, or BC. The master horizon symbol that is given first designates the kind of master horizon whose properties dominate the transitional horizon. In the other, distinct parts of the horizon have recognizable properties of the two kinds of master horizons indicated by the capital letters. The two capital letters are separated by a virgule (/), as E/B, B/E, or B/C. The first symbol is that of the horizon that makes up the greater volume.
51
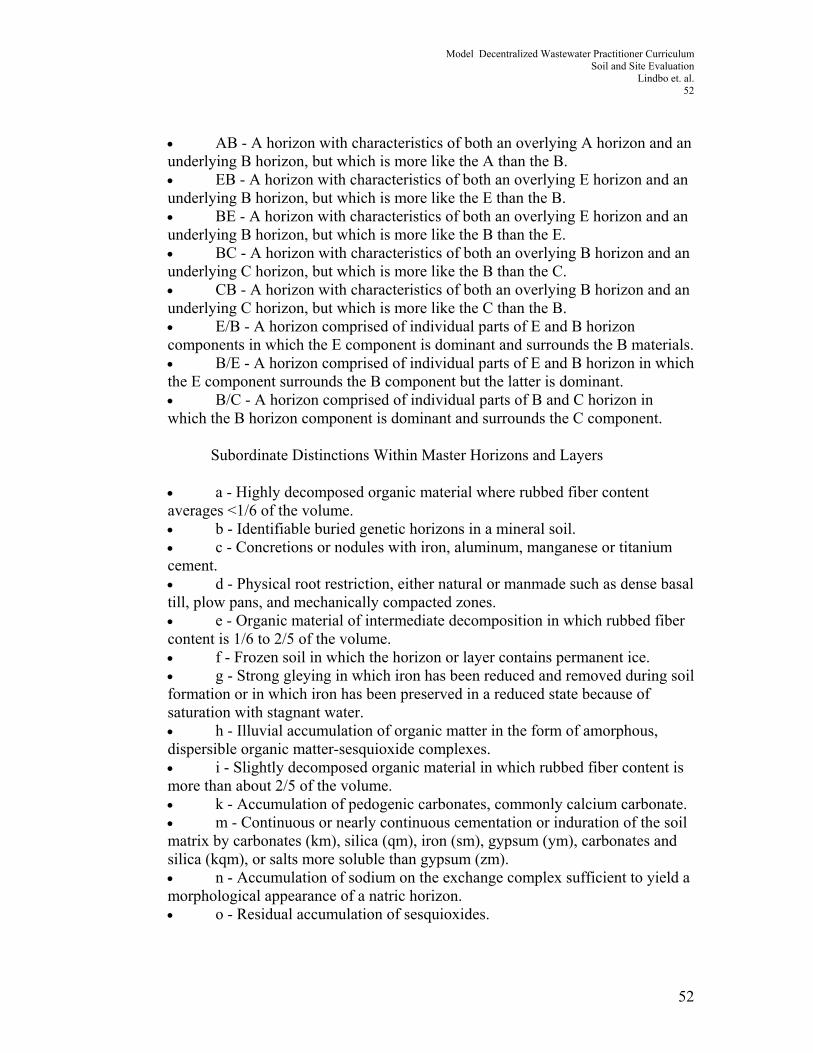
Model Decentralized Wastewater Practitioner Curriculum Soil and Site Evaluation
Lindbo et. al. 52
• AB - A horizon with characteristics of both an overlying A horizon and an underlying B horizon, but which is more like the A than the B. • EB - A horizon with characteristics of both an overlying E horizon and an underlying B horizon, but which is more like the E than the B. • BE - A horizon with characteristics of both an overlying E horizon and an underlying B horizon, but which is more like the B than the E. • BC - A horizon with characteristics of both an overlying B horizon and an underlying C horizon, but which is more like the B than the C. • CB - A horizon with characteristics of both an overlying B horizon and an underlying C horizon, but which is more like the C than the B. • E/B - A horizon comprised of individual parts of E and B horizon components in which the E component is dominant and surrounds the B materials. • B/E - A horizon comprised of individual parts of E and B horizon in which the E component surrounds the B component but the latter is dominant. • B/C - A horizon comprised of individual parts of B and C horizon in which the B horizon component is dominant and surrounds the C component.
Subordinate Distinctions Within Master Horizons and Layers
• a - Highly decomposed organic material where rubbed fiber content averages <1/6 of the volume. • b - Identifiable buried genetic horizons in a mineral soil. • c - Concretions or nodules with iron, aluminum, manganese or titanium cement. • d - Physical root restriction, either natural or manmade such as dense basal till, plow pans, and mechanically compacted zones. • e - Organic material of intermediate decomposition in which rubbed fiber content is 1/6 to 2/5 of the volume. • f - Frozen soil in which the horizon or layer contains permanent ice. • g - Strong gleying in which iron has been reduced and removed during soil formation or in which iron has been preserved in a reduced state because of saturation with stagnant water. • h - Illuvial accumulation of organic matter in the form of amorphous, dispersible organic matter-sesquioxide complexes. • i - Slightly decomposed organic material in which rubbed fiber content is more than about 2/5 of the volume. • k - Accumulation of pedogenic carbonates, commonly calcium carbonate. • m - Continuous or nearly continuous cementation or induration of the soil matrix by carbonates (km), silica (qm), iron (sm), gypsum (ym), carbonates and silica (kqm), or salts more soluble than gypsum (zm). • n - Accumulation of sodium on the exchange complex sufficient to yield a morphological appearance of a natric horizon. • o - Residual accumulation of sesquioxides.
52
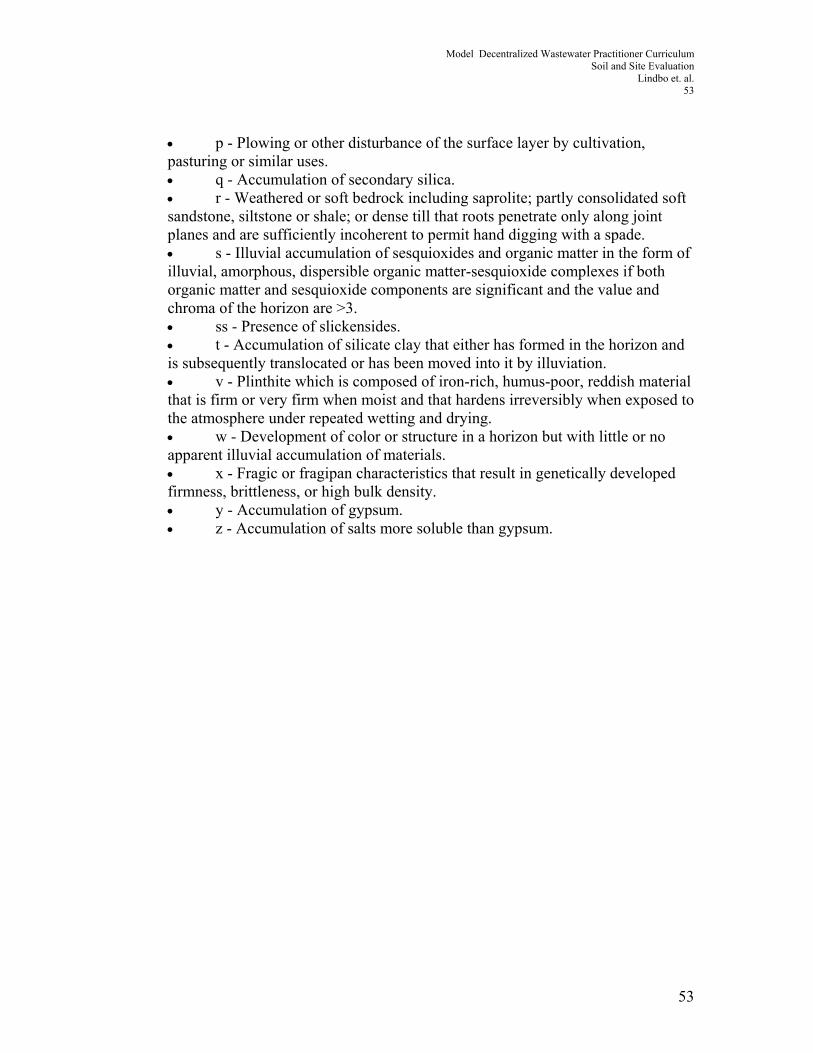
Model Decentralized Wastewater Practitioner Curriculum Soil and Site Evaluation
Lindbo et. al. 53
• p - Plowing or other disturbance of the surface layer by cultivation, pasturing or similar uses. • q - Accumulation of secondary silica. • r - Weathered or soft bedrock including saprolite; partly consolidated soft sandstone, siltstone or shale; or dense till that roots penetrate only along joint planes and are sufficiently incoherent to permit hand digging with a spade. • s - Illuvial accumulation of sesquioxides and organic matter in the form of illuvial, amorphous, dispersible organic matter-sesquioxide complexes if both organic matter and sesquioxide components are significant and the value and chroma of the horizon are >3. • ss - Presence of slickensides. • t - Accumulation of silicate clay that either has formed in the horizon and is subsequently translocated or has been moved into it by illuviation. • v - Plinthite which is composed of iron-rich, humus-poor, reddish material that is firm or very firm when moist and that hardens irreversibly when exposed to the atmosphere under repeated wetting and drying. • w - Development of color or structure in a horizon but with little or no apparent illuvial accumulation of materials. • x - Fragic or fragipan characteristics that result in genetically developed firmness, brittleness, or high bulk density. • y - Accumulation of gypsum. • z - Accumulation of salts more soluble than gypsum.
53
Model Decentralized Wastewater Practitioner Curriculum Soil and Site Evaluation
Lindbo et. al. 54
Chapter 4 Site and Soil Evaluation Concepts (adapted in part from
Arnold et al., 1995)
The key to designing, installing, and operating an on site-system that minimizes NPS pollution is to thoroughly evaluate the soil and site conditions. The evaluation determines site suitability or points out site limitations. Only after a site evaluation has been completed can the proper on-site system options be adequately identified. The purpose of the site assessment is to understand the soil, hydrology, and landscape of the site, to predict wastewater flow through the soil and into subsurface materials, and to design an on-site system to match the site conditions. Thus, every on-site wastewater system is a custom design that maximizes the capacity of the site to treat and disperse wastewater. The performance of the system depends on: the soil’s ability to treat and disperse the effluent; the probable flow paths of effluent water from the site; and the pretreatment received by the effluent. A comprehensive site and soil evaluation requires considerable expertise by a soil scientist. The soil scientist must have substantial knowledge about soil science, geology, sanitary engineering, and environmental health. A systematic approach to site evaluation is discussed in the following sections. Ten steps to site evaluation can be arranged into 3 basic groups;
A. collecting information before the site visit, B. site and soil investigation, and C. recording and relaying soil and site evaluation data for system design for the
client (designer of the system and/or the applicant).
54

Model Decentralized Wastewater Practitioner Curriculum Soil and Site Evaluation
Lindbo et. al. 55
Collecting information before the site visit The old adage “prior pervious planning prevents poor performance” should be taken to heart during this stage of the project. The planning component of site evaluation consists of; knowing the current rules and regulations of the state, county, or town, knowing what types of on-site wastewater systems can best fit a given situation (the state-of-the-art options) and learning about the geology, landscape, and soils in the region in general and on the site specifically. STEP 1 Know the rules by reading and reviewing a copy of the local regulations. These rules are established to protect public health and minimize the environmental damage from on-site systems. The rules include construction and installation criteria and/or specification for the components of the on-site wastewater system. The rules also provide the legal support for a site and soil evaluation and set the standards for site suitability. These rules provide may provide performance criteria for on-site systems by considering the allowable risks to the environment and public health from constituents of the wastewater, such as bacteria, viruses, nitrate, phosphorus, and other pollutants. The rules determine the minimum amount or level of information that is required to be collected for each site. General knowledge of the site will assist in fine tuning the level of detail for the site investigation and the type of data that should be collected. For example, a relatively flat site with uniform soils may require less investigation than a site with a complex slope and variable soils. STEP 2 Information on wastewater quantity and quality is used to determine the initial size and type of on-site system to be installed at a particular site. The information for determining wastewater quantity and quality should be obtained from the client. If this information is not known, specifically as to quality of the wastewater, values may be obtained through a search of the literature or from the regulatory authority. Daily flow and peak flow of wastewater (quantity) should also be obtained from the client or from standardized tables in the rules. Likewise wastewater quality (organic, FOG, industrial process wastewater) is determined by the type of facility and, to a lesser degree, by the size of the facility. A further consideration is how and when the wastewater is generated. Wastewater quantity and quality affect the level of detail required for a site evaluation. Essentially as the quantity of flow increases (more use) or the quality decreases (stronger than domestic quality wastewater) the level of detail or scope of the evaluation required for a site evaluation will increase.
55

Model Decentralized Wastewater Practitioner Curriculum Soil and Site Evaluation
Lindbo et. al. 56
STEP 3 Review preliminary site information supplied by the client. Collect any existing, published information that may help the understanding the types of soils, their properties and distribution on the landscape. These may include County Soil Survey reports, USGS topographic maps, bedrock and surficial geology maps, FEMA maps (including flood zone maps) and plat or survey of site. Additional information can be obtained from the tax records or deeds as needed. Most of the maps are good for planning, initial decision making, and helping understand what to expect prior to a site visit. None of these materials are detailed enough to make specific recommendations. A field investigation is necessary for a proper site and soil evaluation and there is NO substitute for field investigation. STEP 4 A full working knowledge of the various onsite system design options is needed. Although the exact details of the systems may not be critical it is important for the soil scientist to know the soil and site requirements for each system. Based on this knowledge the soil scientist will be able to make some preliminary decision as to what system will or will not fit the site. With this knowledge the soil scientist can tailor the evaluation to meet the needs of the system. For instance, a different type of site investigation would be required for a system using ground water interceptor drains than for a conventional on-site system. During the evaluation the soil scientist must keep in mind that the on-site system must be designed to allow an aerobic zone beneath the treatment and dispersal field to properly treat the wastewater before it enters the ground water.
56

Model Decentralized Wastewater Practitioner Curriculum Soil and Site Evaluation
Lindbo et. al. 57
Site and Soil Investigation Specific items to locate during a site visit: The following items can be located on the site by walking along property lines and noting on your site plan any items that may effect the siting of a system. It is important to be diligent in looking for signs of buried utilities and easements and confirm that buried utilities that were found during your preliminary investigation. Calling the utility locating service is a good way to assure proper location of these items. Site evaluation should extend across all adjacent parcels if domestic wells or other features (streams, ponds, slopes etc.) are present. On your site plan note the following observations: • Aesthetic features such as trees or views • Buildings (on property and adjacent properties) • Driveways • Easements • Overhead power • Gas • Existing Dwellings • Existing sewer lines (on property and adjacent properties) • Existing wastewater systems (on property and adjacent properties) • Existing water lines (on property and adjacent properties) • Historic or cultural objects • Nature of man made cut banks • Other paved surfaces • Percolation holes • Photo points (if photos are taken) • Proposed residence • Property lines • Property Corners (Iron pins) • Retaining walls • Roads • Road cuts • Rock outcroppings • Survey Monuments • Tennis Courts • Test holes • Vegetation • Wells (on property and adjacent properties) • Water-features • Dry washes • Streams
57
Model Decentralized Wastewater Practitioner Curriculum Soil and Site Evaluation
Lindbo et. al. 58
• Ponds or lakes • Swimming pools • Water-supply by lakes or streams Suggested Equipment • Auger • Calculator • Clipboard • Compass • Level, Theodolites • GPS • Color book • Field book for describing soils • Flagging • Stakes • Measuring wheel • String lines • Soil knife • Tape measures • Shovel • Camera • A device to determine grade STEP 5 The on-site system is part of the soil system and the hydrologic cycle. A typical, properly designed system for a single-family home may not add enough water to the site to substantially change the site’s hydrology. However the configuration of the drainfield in relationship to slope and to other systems in the area can have a significant impact on subsurface flow in terms of quality and quantity. STEP 6 The evaluation and prediction of wastewater flow through the soil is accomplished by a thorough soil morphologic description. The best way to accomplish this is with a backhoe pit. If backhoe pits are not available auger borings may be used. The soil profile should be evaluated 1- 5 feet below the expected trench bottom in order to identify any restrictive layers or evidence of water table. It is generally accepted that the minimum number of profile descriptions is 2, one in the primary field and one in the reserve, however the number performed should always be
58

Model Decentralized Wastewater Practitioner Curriculum Soil and Site Evaluation
Lindbo et. al. 59
enough to adequately describe and evaluate the site. More complex landscapes will require more profile descriptions. As the profile is described interpretation regarding the direction of flow (both horizontally and vertically) are made. As a result of these evaluations a long term acceptance rate (LTAR) will be suggested. The LTAR will be used by the design to determine the system size and configuration. The designer may need to adjust the LTAR based on additional information such as wastewater strength, drainfield configuration, treatment train, etc. Site and soil morphologic evaluations are a more reliable prediction of wastewater movement than a percolation or “perc” test. The perc test estimates saturated hydraulic conductivity by filling a borehole with water and measuring how quickly the water level falls. It has been shown that the perc test technique is inaccurate and unreliable for determining wastewater flow. Therefore, many forward thinking states have discontinued the use of the test for evaluating sites for on-site systems. STEP 7 Under certain conditions additional information may need to be collected. The conditions will vary but often include: large (<1500 gpd) systems, advanced treatment systems, ground water mounding and lateral flow, use a drainage system, and hydraulic conductivity. STEP 8 As the site is evaluated the treatment potential of the site/soil must be considered. Treatment depends on the extent of aerobic soil conditions and the flow rate of sewage into the soil. Sewage is treated more effectively in aerobic soils with slow or low application rates, which allows adequate sorption and degradation of chemical and biological constituents. Thus a deeper aerobic soil will have a longer flow path, resulting in more contact with the soil and soil organisms, therefore better treatment. These depths are different from state to state. STEP 9 Risk assessment can be done at this stage to determine the environmental and public health sensitivity. Proximity to various water bodies or receiving environments should be considered. When such environments are of particular public interest (i.e. well fields, shellfish beds, etc) additional site evaluation may be required as well as a higher level of documentation related to the area of concern. In the end an advanced treatment system may be needed in order to adequately protect the public interest.
59

Model Decentralized Wastewater Practitioner Curriculum Soil and Site Evaluation
Lindbo et. al. 60
Recording and relaying soil and site evaluation data for system design for the client (designer of the system and/or the applicant). This component requires the soil scientist to communicate information gathered from the system designer so that a proper design can be made. STEP 10 Provide the system designer with soil/site descriptions and recommendations. The information should include all data gathered about the facility, the site and soil evaluation, the suggest loading rates, highlights site and design considerations, and any special concerns for designing the on-site system. The soil scientist and designer should rank each site for the type of system that can be installed and provide specific soil and site data that will enable selection of the most feasible design options for the site. Data must be provided to support the decisions made. The process described above is an iterative process. This means that the process may be repeated several times, where new information or a new design is tried until a design is found that will fit the site.
60

Model Decentralized Wastewater Practitioner Curriculum Soil and Site Evaluation
Lindbo et. al. 61
Chapter 5 Matching the System to the Soil and Site
Authors’ Note: Matching the system to the site and soil is the ultimate goal of the site evaluation. In the end this match is governed as much by the soil and site as by how the local, regional, or state rules are written. It would be impossible for the authors of this module to cover every system, every set of state rule, local regulations, etc. We have therefore decided to first present some general concepts to follow and then use some examples following the regulations in North Carolina. These examples will have to be reworked for local regulation and it is suggested that the presenter use soils and site photos from his/her region. Additionally, the corresponding text should also serve only as an example of what the presenter should prepare for her/his region. In no way are we trying to indicate that the North Carolina regulations, interpretations, or approach are the only ones that should be considered, instead they simply serve as an example of how to format this section. In order to match the system to the site certain information is needed. First, a working knowledge of state and/or local rules is needed. Next the wastewater flow and characteristics must be known. Since the type of system will be constrained by the soil and site conditions these too should be well documented and preliminary interpretations made. Finally, the system options should be fully integrated into the process. This includes aspects of installation and long term O&M. Rules and other pertinent information should consider; State rules and regulations, any applicable performance standards, soil and siting requirements. These can be attained from the local Health Dept. or other regulatory agency. At this point it is a good idea to check if any other agency has regulation governing construction or other forms of site development. Siting and soil reports should include profile description, site interpretation and give an idea about the variability expected on the site. Coupled with this information should be an assessment of the LTAR at locations A, B, and C through the proposed or designated area for the system. Additional information provided by the site/soil report should include; available space, set-backs, topography, drainage, features, well location, streams, etc. There should also be a report describing all off site features that could affect the system. In some cases linear loading and ground water mounding analysis may need to be investigated. Wastewater flow and characteristics (wastewater quantity and quality), type of activity, size of facility will all be used to determine what system options need to be considered. These factors combined with the site investigation data will ultimately determine the System Requirements and Performance criteria that will best be used on the give site. In the end the public health and water quality issues will guide the system choices. As a final note the profession must remember that the soil beneath the trench must allow for aerobic treatment of effluent. To attain this goal the depth of trench bottom
61
Model Decentralized Wastewater Practitioner Curriculum Soil and Site Evaluation
Lindbo et. al. 62
(infiltrative surface), LTARs at several depths in the soil, the type of dispersal system, pretreatment options, and finally a comprehensive risk analysis will need to be done to design the best system for the site.
The following Section has been taken from: the Proceedings of the Fifteenth Annual On-Site Wastewater Treatment Conference: On-site Wastewater System Technology: Teams, Tools, and Training, edited by David Lindbo, 1999.
62

Model Decentralized Wastewater Practitioner Curriculum Soil and Site Evaluation
Lindbo et. al. 63
Matching the On-Site Wastewater System To The Soil/Site Conditions
Reprinted from
Joe Lynn On-site Wastewater Section, DENR 6768 George Hildebran School Road
Hickory, NC 28602
Introduction A site evaluator must know the Laws and Rules governing on-site wastewater, have a basic understanding of soil science, and have some knowledge of the workings of a "septic tank" system. Without this minimum level of expertise the site evaluator can not hope to successfully match the system to the site. On-site systems must: (1) protect public health and (2) minimize environmental impacts (N C Guidance Manual). The type of on-site wastewater system chosen for a parcel of land must meet the soil and site conditions of the property. "The objective of a site investigation is to evaluate the characteristics of the area for their potential to treat and dispose of wastewater. A site evaluation should be done in a systematic manner to ensure the information collected is useful and is sufficient in detail" (EPA Design Manual, 2002). "The key to installing a reliable on-site system that minimizes pollution and disease is to identify suitable locations with a thorough site and soil evaluation. The evaluation determines suitability or points out site limitations. Only after a site evaluation has been completed can the proper on-site system be designed" (N C Guidance Manual). The steps in a thorough site and soil evaluation are: 1. Collecting as much information as possible before the site visit (preliminary information), 2. Investigating the site and the soil at the location, and 3. Recording the data for system design and relying the information to the designer of the system and the applicant.
Preliminary Information “This begins with the party developing the site. The location of the lot and the intended use must be established“(EPA Design Manual, 2002). The expected daily flows and the peak flows from the proposed facility must be determined, this is wastewater quantity. Also, the strength of the wastewater must be estimated, the wastewater quality.
63

Model Decentralized Wastewater Practitioner Curriculum Soil and Site Evaluation
Lindbo et. al. 64
"Wastewater quantity and quality affect the level of detail required for a site evaluation" (N C Guidance Manual). The property owner or applicant must make an application to the local health department, have the property lines marked and make the site accessible. The application must contain at least the following information: 1. Property owner's name, mailing address and phone number 2. Location of the property 3. Plat of the property 4. Information needed to determine wastewater flow and characteristics 5. Type of water supply, including location of existing or proposed wells 6. Signature of owner or legal representative 7. Identify wetlands 8. If wastewater other than sewage will be generated 9. If the site is subject to approval by other agencies. In some instances it is helpful to review published information such as soil survey reports, geologic, topographic and plat maps. A decision on the site cannot be made from published materials. A discussion with co-workers who are familiar with the soil and site conditions in the part of the county where the property is located can be helpful.
Site Evaluation
"The most critical element in onsite wastewater treatment system design is the evaluation of the site on which the system is to be constructed". The site evaluation needs to provide sufficient information to determine if the site can support an onsite wastewater treatment and disposal system, what system design concept to use, and what design parameters to follow (Otis, 1994). "The purpose of the site assessment is to understand the soil system and the hydrology of the site, to predict wastewater flow through the soil system and the hydrology of the site. The soil and site evaluation helps to predict how an on-site system will function at a site" (N C Guidance Manual). "Field testing begins with a visual survey of the parcel to locate potential sites for subsurface soil absorption. The location of any depressions, gullies, steep slopes, rocks or rock outcrops, or other obvious land and surface features are noted and marked on the plot plan. Locations and distances from a permanent benchmark to lot lines, wells, surface waters, buildings, and other features or structures are also marked on the plot plan" (EPA Design Manual, 2002). Enough hand auger borings or backhoe pits must be made to adequately describe the soils in the area, and should be deep enough to assure that a sufficient depth of unsaturated soil exists below the proposed trench bottom elevation of the absorption area (EPA Design Manual 2002).
64

Model Decentralized Wastewater Practitioner Curriculum Soil and Site Evaluation
Lindbo et. al. 65
In North Carolina six factors must be evaluated to determine the suitability of a site for a "septic tank" system (N C Guidance Manual). The six factors are: 1. Topography and Landscape Position 2. Soil Characteristics (morphology) a. Soil texture b. Soil structure c. Clay mineralogy d. Organic soils 3. Soil Wetness Conditions 4. Soil Depth 5. Restrictive Horizons 6. Available Space a. The area of Suitable or Provisionally Suitable soil b. The required setbacks c. Other factors such as large capacity wells, large wastewater flows, utilities, location of structures, drives and parking, artificial drainage, etc. A soil/site evaluation sheet must be used to record the information gathered. A plot plan or sketch of the lot to locate soil borings or pits, surface features, the proposed house, drive, well (if needed), other structures, etc. must be prepared. The landscape position, slope, soil texture, soil structure, soil consistency (clay mineralogy), soil wetness (presence of chroma 2 mottles), soil depth and restrictive horizons must be recorded. A long-term acceptance rate (LTAR) must be assigned to each soil profile that is suitable or provisionally suitable. After the evaluation is completed a LTAR must be assigned to the area being considered for the wastewater system.
Design The system design must be compatible with the daily flow, the wastewater characteristics, and the soil/site conditions. The applicant or owner’s preferred house location, house footprint, drive location, and location other structures must be considered whenever possible. The site preparation and landscaping plans must be considered in designing the system. Other agencies rules must be considered. For example, the building code requires foundation drains in some situations and surface water must be diverted away from manufactured homes. The watershed rules may require greater setbacks to surface waters. The LTAR and the daily flow will determine the system size. For example, a conventional system (gravel trench) with a LTAR of .5 gpd/ft
2 and a daily flow of 360
gpd will require 240 linear feet of 3-ft. wide trenches. For other systems linear footage requirements see Table 1. The LTAR chosen is determined by the soil/site conditions and by the type of system
65

Model Decentralized Wastewater Practitioner Curriculum Soil and Site Evaluation
Lindbo et. al. 66
under consideration. For example, a clay soil would have a LTAR between .4 and .1 gpd/ft
2 for a conventional system, but it would be .2 to .05 gpd/ft
2 for a low-pressure pipe
system. Also, saprolite systems and "drip systems" have different LTARs. The site evaluator should work closely with the designer to determine the appropriate LTAR for the given site, system, and regulation as applicable. The depth of usable soil or saprolite to an unsuitable horizon; expansive mineralogy, restrictive horizon, soil wetness; rock, parent material, or unsuitable saprolite; and the steepness of the slope will determine the system option(s). See Table 1 for the required soil depths for each system type. A conventional system (3’ wide gravel trench) on a level lot requires 30 inches of usable soil, but on a 20 percent slope the required soil depth would be 37 inches (see Table 1 for the calculation). On very steep tracts the difficulty of installation will determine the type of system chosen. It is very difficult, if not impossible to install a conventional (gravel) system on a 50 percent slope. On this slope a large diameter pipe system can be easier to install. The steps in choosing an on-site system are: 1. Determine type of pretreatment * Septic tank * Aerobic sewage treatment units (ATU) * Advanced pretreatment 2. Decide on the type of nitrification field *Conventional system * Modified conventional systems + Shallow systems (24 inches soil minimum, cover added) + Gravelless trenches + Large diameter pipe system + Prefabricated porous block panel systems * Alternative systems + Low pressure pipe systems + Fill systems; new and existing (before 1977) * Innovative systems + “Perc rite" drip system + Chamber systems * Infiltrator * Envirochamber * Biodiffuser * Cultec * Houck drainage systems 3. Determine the type of distribution * Gravity distribution + Equal - distribution box + Serial - step-downs or drop boxes * Pump
66
Model Decentralized Wastewater Practitioner Curriculum Soil and Site Evaluation
Lindbo et. al. 67
+ Pressure - low pressure or drip + Not pressure (equal, distribution box or pressure manifold) or serial The property owner or his representative must be given the results of the soil /site evaluation. If the site can be permitted, the wastewater system option(s) for the property must be presented and explained to the applicant. Any options for an unsuitable site must be provided to the applicant. For sand filter and peat biofilter systems more soil/site evaluations may be required. Saprolite evaluations, Rule .1948 (d) proposals, drainage systems, mineralogy questions, large systems, and other situations will require additional soil/site evaluations and possibly other tests.
3. Design a system or review a system design and issue the necessary permits. The details of the system and installation requirements must be listed. Some items to list are: 1. The facility * Type (residence, business, institution, etc.) * Daily wastewater flow * Wastewater characteristics 2. The system * Type (trench media) * Location * Distribution (gravity or pump) 3. System layout * Trench length * Trench width * Trench depth 4. Installation requirements * Type of backfill material * Setbacks * Rake sidewalls of trench * Don't install when soil is wet * Pump requirements if applicable 5. Site modifications * Fill specifications * Drainage specifications * Site preparation (grading)
Summary
An on-site system that is a good match with the soil and site conditions should function properly for a long time, as long if it isn't abused or neglected. No system will function as designed when daily flows are exceeded, the characteristics of the effluent changes, no
67

Model Decentralized Wastewater Practitioner Curriculum Soil and Site Evaluation
Lindbo et. al. 68
maintenance is performed, or components are damaged.
68
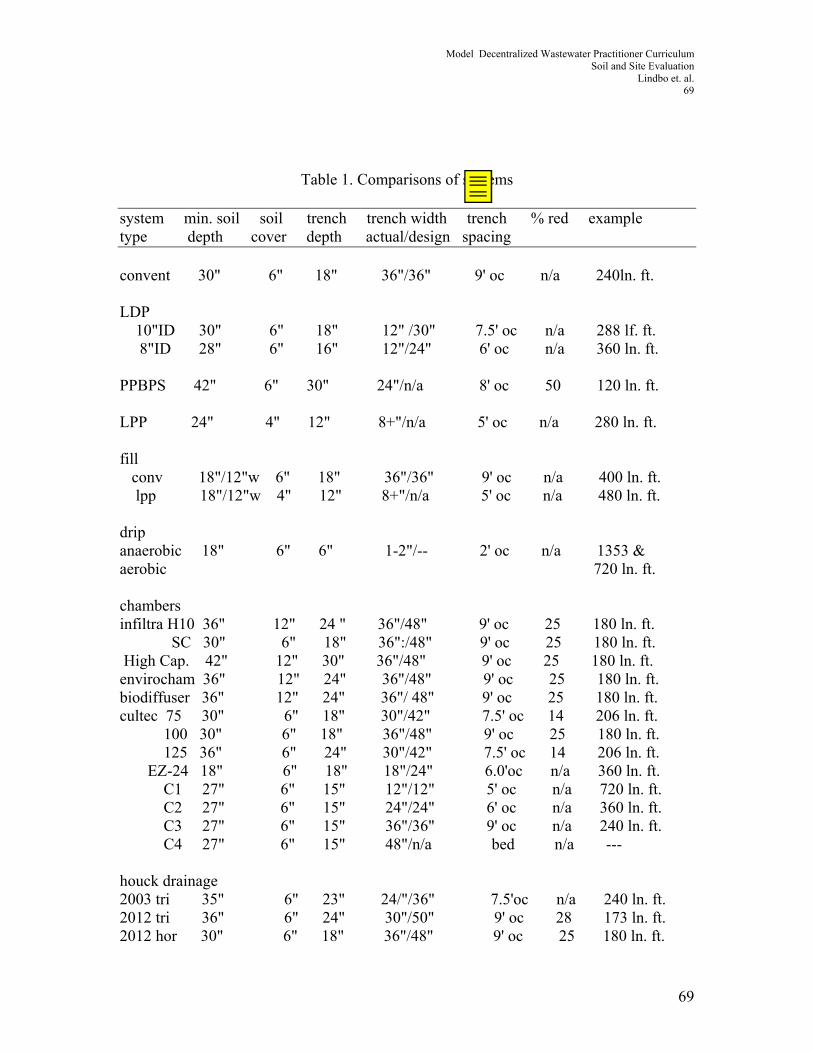
Model Decentralized Wastewater Practitioner Curriculum Soil and Site Evaluation
Lindbo et. al. 69
Table 1. Comparisons of systems
system min. soil soil trench trench width trench % red example type depth cover depth actual/design spacing convent 30" 6" 18" 36"/36" 9' oc n/a 240ln. ft. LDP 10"ID 30" 6" 18" 12" /30" 7.5' oc n/a 288 lf. ft. 8"ID 28" 6" 16" 12"/24" 6' oc n/a 360 ln. ft. PPBPS 42" 6" 30" 24"/n/a 8' oc 50 120 ln. ft. LPP 24" 4" 12" 8+"/n/a 5' oc n/a 280 ln. ft. fill conv 18"/12"w 6" 18" 36"/36" 9' oc n/a 400 ln. ft. lpp 18"/12"w 4" 12" 8+"/n/a 5' oc n/a 480 ln. ft. drip anaerobic 18" 6" 6" 1-2"/-- 2' oc n/a 1353 & aerobic 720 ln. ft. chambers infiltra H10 36" 12" 24 " 36"/48" 9' oc 25 180 ln. ft. SC 30" 6" 18" 36":/48" 9' oc 25 180 ln. ft. High Cap. 42" 12" 30" 36"/48" 9' oc 25 180 ln. ft. envirocham 36" 12" 24" 36"/48" 9' oc 25 180 ln. ft. biodiffuser 36" 12" 24" 36"/ 48" 9' oc 25 180 ln. ft. cultec 75 30" 6" 18" 30"/42" 7.5' oc 14 206 ln. ft. 100 30" 6" 18" 36"/48" 9' oc 25 180 ln. ft. 125 36" 6" 24" 30"/42" 7.5' oc 14 206 ln. ft. EZ-24 18" 6" 18" 18"/24" 6.0'oc n/a 360 ln. ft. C1 27" 6" 15" 12"/12" 5' oc n/a 720 ln. ft. C2 27" 6" 15" 24"/24" 6' oc n/a 360 ln. ft. C3 27" 6" 15" 36"/36" 9' oc n/a 240 ln. ft. C4 27" 6" 15" 48"/n/a bed n/a --- houck drainage 2003 tri 35" 6" 23" 24/"/36" 7.5'oc n/a 240 ln. ft. 2012 tri 36" 6" 24" 30"/50" 9' oc 28 173 ln. ft. 2012 hor 30" 6" 18" 36"/48" 9' oc 25 180 ln. ft.
69

Model Decentralized Wastewater Practitioner Curriculum Soil and Site Evaluation
Lindbo et. al. 70
Minimum soil depth is based on a level site, natural soil for cover. For slopes the soil depth would be deeper, minimum soil depth for system type + actual trench width x the slope = required soil depth. Example conventional trench 30" + 36" x .20 = 37 inches. The example is based on a daily flow of 360 gpd, with LTAR of .5 gal./day/ft.sq.
70
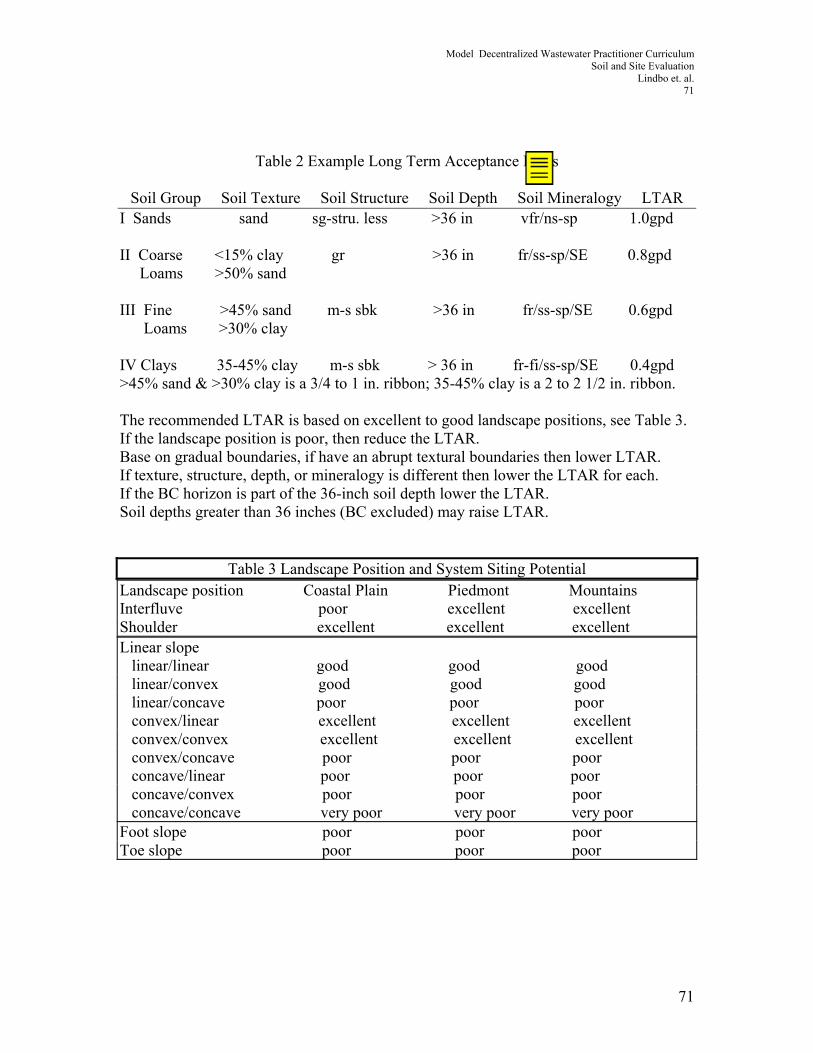
Model Decentralized Wastewater Practitioner Curriculum Soil and Site Evaluation
Lindbo et. al. 71
Table 2 Example Long Term Acceptance Rates
Soil Group Soil Texture Soil Structure Soil Depth Soil Mineralogy LTAR I Sands sand sg-stru. less >36 in vfr/ns-sp 1.0gpd II Coarse <15% clay gr >36 in fr/ss-sp/SE 0.8gpd Loams >50% sand III Fine >45% sand m-s sbk >36 in fr/ss-sp/SE 0.6gpd Loams >30% clay IV Clays 35-45% clay m-s sbk > 36 in fr-fi/ss-sp/SE 0.4gpd >45% sand & >30% clay is a 3/4 to 1 in. ribbon; 35-45% clay is a 2 to 2 1/2 in. ribbon. The recommended LTAR is based on excellent to good landscape positions, see Table 3. If the landscape position is poor, then reduce the LTAR. Base on gradual boundaries, if have an abrupt textural boundaries then lower LTAR. If texture, structure, depth, or mineralogy is different then lower the LTAR for each. If the BC horizon is part of the 36-inch soil depth lower the LTAR. Soil depths greater than 36 inches (BC excluded) may raise LTAR.
Table 3 Landscape Position and System Siting Potential Landscape position Coastal Plain Piedmont Mountains Interfluve poor excellent excellent Shoulder excellent excellent excellent Linear slope linear/linear good good good linear/convex good good good linear/concave poor poor poor convex/linear excellent excellent excellent convex/convex excellent excellent excellent convex/concave poor poor poor concave/linear poor poor poor concave/convex poor poor poor concave/concave very poor very poor very poor Foot slope poor poor poor Toe slope poor poor poor
71

Model Decentralized Wastewater Practitioner Curriculum Soil and Site Evaluation
Lindbo et. al. 72
References 1. EPA Design Manual, Onsite Wastewater Treatment and Disposal Systems, 1980 PP 17-19, 24, 28. 2. North Carolina On-Site Wastewater Management; Guidance Manual, March, 1996. PP 4.5.1- 4.5.3, 4.4.35. 3. Otis R.J. and Anderson D. L. 1994. Meeting Public Health and Environmental Goals: Performance Standards for On-Site Wastewater Systems; On-Site Wastewater Treatment, Proceedings of the Seventh International Symposium on Individual and Small Community Sewage Systems; Atlanta, Georgia.
72

Model Decentralized Wastewater Practitioner Curriculum Soil and Site Evaluation
Lindbo et. al. 73
Soil Profile Descriptions
Fripp series Slopes 15%. Landscape position: Side slope A--0 to 5 inches; grayish brown (10YR 5/2) fine sand; common medium faint light gray (2.5Y 7/2) mottles; single grained; loose; common fine and medium roots; about 5 percent of the grains are black and dark brown; moderately acid; clear wavy boundary. (1 to 8 inches thick)
C1--5 to 21 inches; pale yellow (2.5Y 7/4) fine sand; many medium distinct light brownish gray (10YR 6/2) mottles; single grained; loose; common fine and few medium roots; about 5 percent of the grains are black and dark brown; moderately acid; gradual wavy boundary. (5 to 27 inches thick)
C2--21 to 52 inches; very pale brown (10YR 7/3) fine sand; single grained; loose; few fine and medium roots; about 5 percent of the grains are black and dark brown; slightly acid; gradual wavy boundary. (20 to 54 inches thick)
C3--52 to 90 inches; white (2.5Y 8/2) fine sand; single grained; loose; few irregular horizontal light brownish gray (10YR 6/2) streaks about 1/8 inch thick; about 5 percent of the grains are black and dark brown; slightly acid.
73

Model Decentralized Wastewater Practitioner Curriculum Soil and Site Evaluation
Lindbo et. al. 74
Profile: Fripp
Suitability ranking for each factor: (S, PS, or U) and whether reclassified
Landscape/topo: s Why: Sideslope Texture: s Why: Group 1
Structure: s Why: Single Grained Mineralogy: s Why: loose
Soil Wetness: s Why: 10YR 6/2 @ 5 “ are not due to wetness but to leaching. Note lack of concentrations in or near that horizon. At 52” 2 chroma may be due to wetness or it may be the color of the sand.
Soil Depth: s Why: > 48” Restrictive Horizon: s Why: None
Available Space: s Why: Assume suitable Overall Suitability: S Why:
Depth to Shallowest Limiting Condition
52 Why:
Type of system and/or site modifications to
recommend
Conventional
LTAR 1.0
74
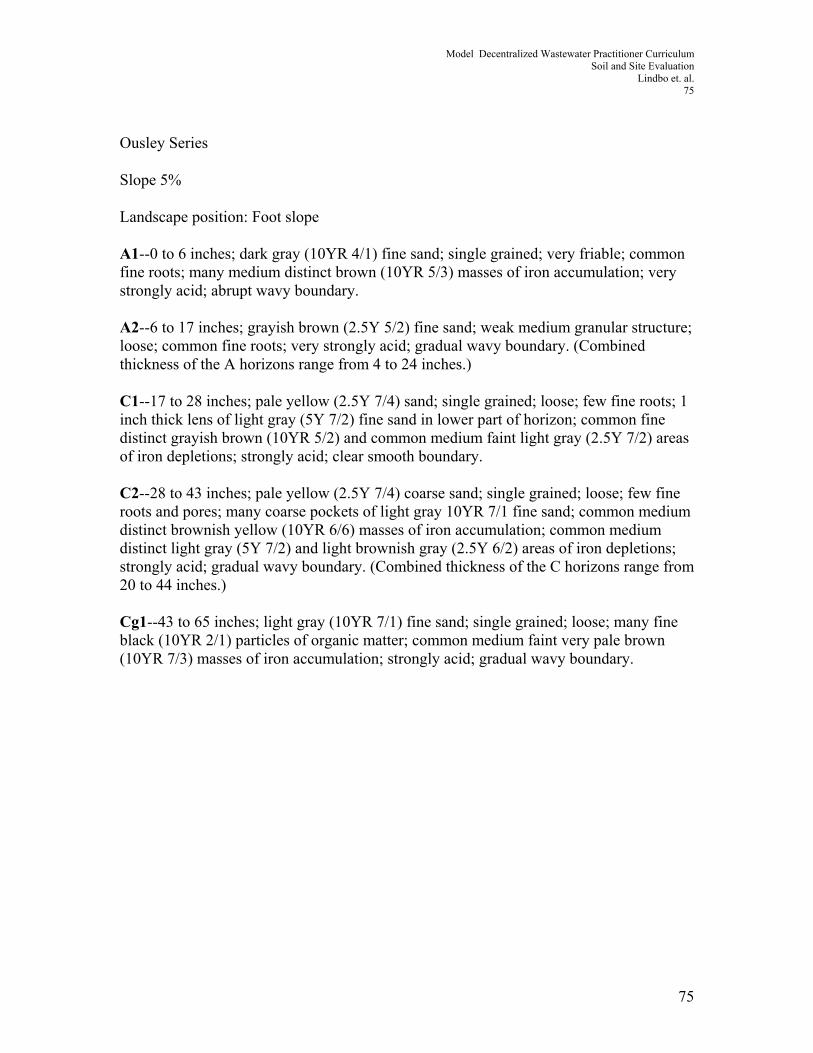
Model Decentralized Wastewater Practitioner Curriculum Soil and Site Evaluation
Lindbo et. al. 75
Ousley Series
Slope 5%
Landscape position: Foot slope
A1--0 to 6 inches; dark gray (10YR 4/1) fine sand; single grained; very friable; common fine roots; many medium distinct brown (10YR 5/3) masses of iron accumulation; very strongly acid; abrupt wavy boundary.
A2--6 to 17 inches; grayish brown (2.5Y 5/2) fine sand; weak medium granular structure; loose; common fine roots; very strongly acid; gradual wavy boundary. (Combined thickness of the A horizons range from 4 to 24 inches.)
C1--17 to 28 inches; pale yellow (2.5Y 7/4) sand; single grained; loose; few fine roots; 1 inch thick lens of light gray (5Y 7/2) fine sand in lower part of horizon; common fine distinct grayish brown (10YR 5/2) and common medium faint light gray (2.5Y 7/2) areas of iron depletions; strongly acid; clear smooth boundary.
C2--28 to 43 inches; pale yellow (2.5Y 7/4) coarse sand; single grained; loose; few fine roots and pores; many coarse pockets of light gray 10YR 7/1 fine sand; common medium distinct brownish yellow (10YR 6/6) masses of iron accumulation; common medium distinct light gray (5Y 7/2) and light brownish gray (2.5Y 6/2) areas of iron depletions; strongly acid; gradual wavy boundary. (Combined thickness of the C horizons range from 20 to 44 inches.)
Cg1--43 to 65 inches; light gray (10YR 7/1) fine sand; single grained; loose; many fine black (10YR 2/1) particles of organic matter; common medium faint very pale brown (10YR 7/3) masses of iron accumulation; strongly acid; gradual wavy boundary.
75

Model Decentralized Wastewater Practitioner Curriculum Soil and Site Evaluation
Lindbo et. al. 76
Profile:
Suitability ranking for each factor: (S, PS, or U) and whether reclassified
Landscape/topo: s Why: Texture: ss Why:
Structure: s Why: Mineralogy: s Why:
Soil Wetness: u Why: 17 Soil Depth: ps Why:
Restrictive Horizon: 3 Why: Available Space: S Why: Assume suitable
Overall Suitability: ps Why: Depth to Shallowest Limiting Condition
17 Why:
Type of system and/or site modifications to
recommend
Fill, drip, pretreatment
LTAR .8
76

Model Decentralized Wastewater Practitioner Curriculum Soil and Site Evaluation
Lindbo et. al. 77
Stockade series
Slope 2%
Landscape position: Flat of interstream divide
A--0 to 12 inches; black (N 2/0) fine sandy loam; weak fine subangular blocky structure; very friable; common fine roots; strongly acid; gradual wavy boundary. (10 to 20 inches thick)
Btg1--12 to 26 inches; very dark gray (10YR 3/1) sandy clay loam; few fine distinct yellowish brown and few fine faint dark grayish brown mottles; weak medium subangular blocky structure; friable; slightly acid; gradual smooth boundary. (8 to 17 inches thick)
Btg2--26 to 46 inches; dark gray (10YR 4/1) sandy clay loam; weak medium subangular blocky structure; few fine brown sand streaks; neutral; friable; clear wavy boundary. (14 to 29 inches thick)
C--46 to 65 inches; dark grayish brown (10YR 4/2) light brownish gray (10YR 6/2) fine sand; moderate medium crumb structure; very friable; neutral.
77

Model Decentralized Wastewater Practitioner Curriculum Soil and Site Evaluation
Lindbo et. al. 78
Profile:
Suitability ranking for each factor: (S, PS, or U) and whether reclassified
Landscape/topo: s Why: Texture: ps Why:
Structure: ps Why: Mineralogy: s Why:
Soil Wetness: u Why: Soil Depth: ps Why:
Restrictive Horizon: s Why: Available Space: S Why: Assume suitable
Overall Suitability: u Why: Depth to Shallowest Limiting Condition
0 Why:
Type of system and/or site modifications to
recommend
Unsuitable
LTAR
78

Model Decentralized Wastewater Practitioner Curriculum Soil and Site Evaluation
Lindbo et. al. 79
Goldsboro series
Slope 5%
Landscape position; Side slope
Ap--0 to 8 inches; grayish brown (10YR 5/2) loamy sand; weak medium granular structure; very friable; many fine roots; moderately acid; clear smooth boundary. (5 to 10 inches thick)
E--8 to 12 inches; pale brown (10YR 6/3) loamy sand; weak medium granular structure; very friable, many fine roots; moderately acid; clear smooth boundary. (0 to 10 inches thick)
BE--12 to 15 inches; brownish yellow (10YR 6/6) sandy loam; weak fine subangular blocky structure; friable, slightly sticky; many fine roots; strongly acid; clear smooth boundary. (0 to 12 inches thick)
Bt1--15 to 26 inches; yellowish brown (10YR 5/6) sandy clay loam; weak fine subangular blocky structure; friable, slightly sticky, slightly plastic; common fine roots; sand grains coated and bridged with clay; few faint clay films on faces of peds; very strongly acid; gradual wavy boundary.
Bt2--26 to 45 inches; pale brown (10YR 6/3) sandy clay loam; common medium distinct gray (10YR 5/1) and yellowish brown (10YR 5/6) mottles; weak fine subangular blocky structure; friable, slightly sticky, slightly plastic; few fine roots; sand grains coated and bridged with clay; few faint clay films on faces of peds; very strongly acid; gradual wavy boundary. (Combined thickness of the Bt horizon is 12 to 72 inches)
Btg--45 to 65 inches; gray (10YR 6/1) sandy clay loam; common medium prominent red (2.5YR 5/6), and common medium distinct brownish yellow (10YR 6/6) mottles; weak fine subangular blocky structure; friable, slightly sticky, slightly plastic; sand grains coated and bridged with clay; few faint clay films on faces of peds; very strongly acid; gradual irregular boundary. (0 to 24 inches thick)
BCg--65 to 76 inches; gray (10YR 6/1) sandy loam and strata of sandy clay loam, common medium distinct brownish yellow (10YR 6/6) and common medium faint gray (10YR 5/1) mottles; weak fine subangular blocky structure; friable, slightly sticky, slightly plastic; sand grains coated and bridged with clay; very strongly acid.
79
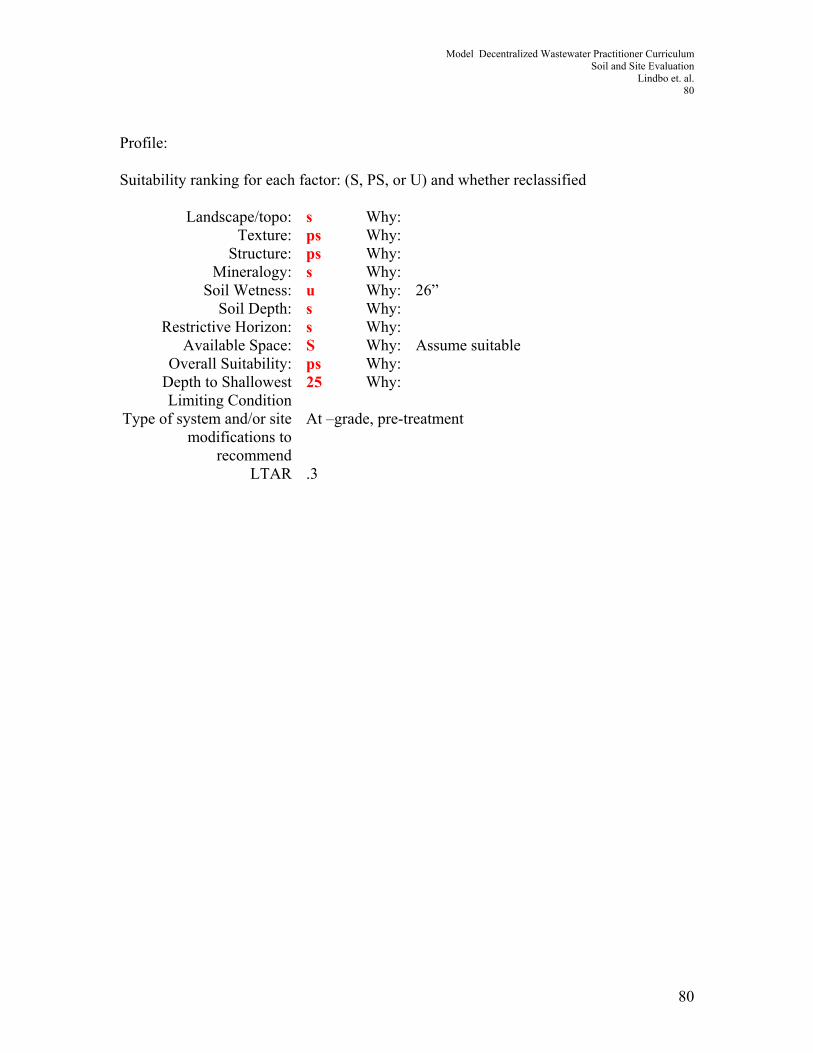
Model Decentralized Wastewater Practitioner Curriculum Soil and Site Evaluation
Lindbo et. al. 80
Profile:
Suitability ranking for each factor: (S, PS, or U) and whether reclassified
Landscape/topo: s Why: Texture: ps Why:
Structure: ps Why: Mineralogy: s Why:
Soil Wetness: u Why: 26” Soil Depth: s Why:
Restrictive Horizon: s Why: Available Space: S Why: Assume suitable
Overall Suitability: ps Why: Depth to Shallowest Limiting Condition
25 Why:
Type of system and/or site modifications to
recommend
At –grade, pre-treatment
LTAR .3
80

Model Decentralized Wastewater Practitioner Curriculum Soil and Site Evaluation
Lindbo et. al. 81
Rains series
Slope 2%
Landscape position; Foot slope
A--0 to 7 inches; very dark gray (10YR 3/1) sandy loam; weak fine granular structure; very friable; many fine and medium roots; very strongly acid; clear smooth boundary. (4 to 10 inches thick)
Eg--7 to 12 inches; light brownish gray (10YR 6/2) sandy loam; weak fine granular structure; very friable; many fine and few medium roots; many fine pores; few fingers of A horizon in upper part; very strongly acid; clear wavy boundary. (0 to 11 inches thick)
Btg1--12 to 20 inches; gray (10YR 6/1) sandy loam; weak coarse subangular blocky structure; friable; few fine and medium roots; many fine pores; sand grains coated and bridged with clay; few medium prominent yellowish brown (10YR 5/6) masses of iron accumulation in lower half; very strongly acid; gradual wavy boundary.
Btg2--20 to 40 inches; gray (10YR 6/1) sandy clay loam; weak medium subangular blocky structure; friable; few fine and medium roots; many fine pores; few faint clay films on faces of peds; few small pockets of gray sandy loam; common medium prominent yellowish brown (10YR 5/6) masses of iron accumulation; few fine prominent red masses of iron accumulation; very strongly acid; gradual wavy boundary.
Btg3--40 to 52 inches; gray (10YR 6/1) sandy clay loam; weak medium subangular blocky structure; firm; few fine pores; few faint clay films on faces of peds; few fine and medium prominent red (2.5YR 4/6), and few fine and medium prominent yellowish brown (10YR 5/6) masses of iron accumulation; very strongly acid; gradual wavy boundary.
Btg4--52 to 62 inches; gray (10YR 6/1) sandy clay loam; weak medium subangular blocky structure; friable; few faint clay films on faces of peds; few medium prominent brownish yellow (10YR 6/6) masses of iron accumulation; very strongly acid; gradual wavy boundary. (Combined thickness of the Bt horizon is more than 40 inches.)
BCg--62 to 79 inches; gray (10YR 6/1) sandy clay loam; weak coarse subangular blocky structure; friable; few fine distinct brownish yellow masses of iron accumulation; very strongly acid; gradual wavy boundary. (0 to 20 inches thick)
2Cg--79 to 85 inches; light gray (10YR 7/1) sand; single grained; loose; very strongly acid.
81

Model Decentralized Wastewater Practitioner Curriculum Soil and Site Evaluation
Lindbo et. al. 82
Profile:
Suitability ranking for each factor: (S, PS, or U) and whether reclassified
Landscape/topo: s Why: Texture: ps Why:
Structure: ps Why: Mineralogy: s Why:
Soil Wetness: us Why: 0 Soil Depth: s Why:
Restrictive Horizon: s Why: Available Space: S Why: Assume suitable
Overall Suitability: us Why: Depth to Shallowest Limiting Condition
0 Why:
Type of system and/or site modifications to
recommend
Unsuitable
LTAR
82
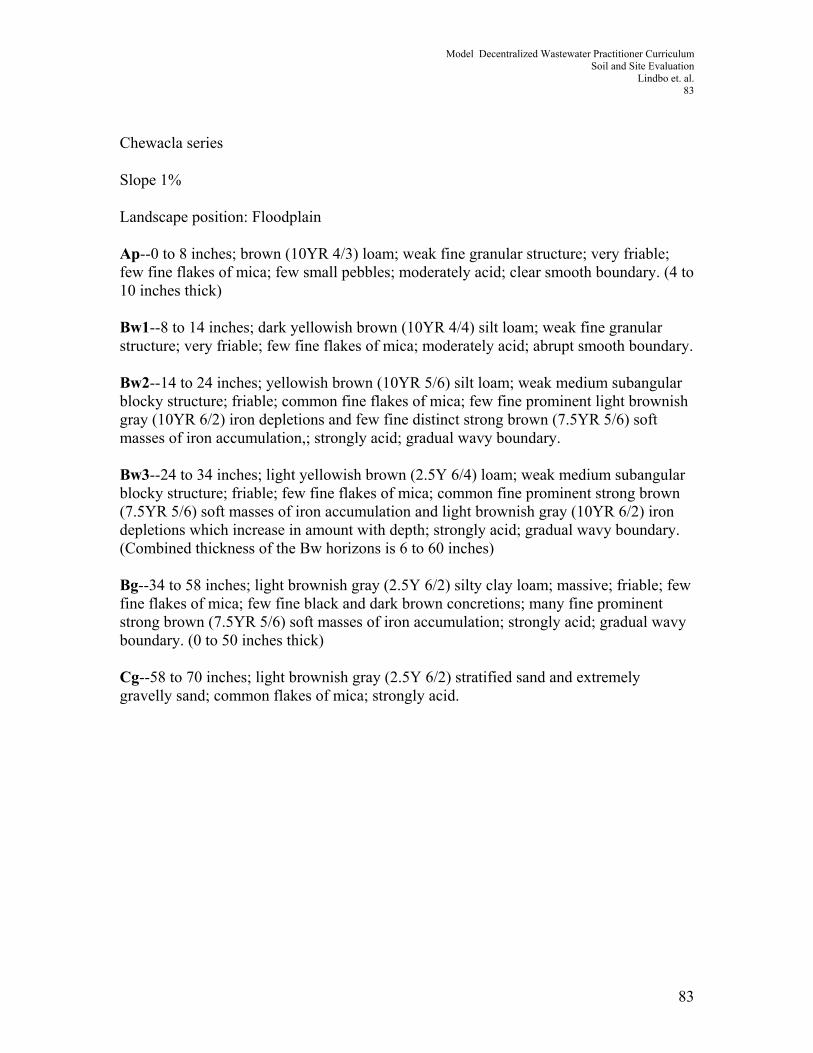
Model Decentralized Wastewater Practitioner Curriculum Soil and Site Evaluation
Lindbo et. al. 83
Chewacla series
Slope 1%
Landscape position: Floodplain
Ap--0 to 8 inches; brown (10YR 4/3) loam; weak fine granular structure; very friable; few fine flakes of mica; few small pebbles; moderately acid; clear smooth boundary. (4 to 10 inches thick)
Bw1--8 to 14 inches; dark yellowish brown (10YR 4/4) silt loam; weak fine granular structure; very friable; few fine flakes of mica; moderately acid; abrupt smooth boundary.
Bw2--14 to 24 inches; yellowish brown (10YR 5/6) silt loam; weak medium subangular blocky structure; friable; common fine flakes of mica; few fine prominent light brownish gray (10YR 6/2) iron depletions and few fine distinct strong brown (7.5YR 5/6) soft masses of iron accumulation,; strongly acid; gradual wavy boundary.
Bw3--24 to 34 inches; light yellowish brown (2.5Y 6/4) loam; weak medium subangular blocky structure; friable; few fine flakes of mica; common fine prominent strong brown (7.5YR 5/6) soft masses of iron accumulation and light brownish gray (10YR 6/2) iron depletions which increase in amount with depth; strongly acid; gradual wavy boundary. (Combined thickness of the Bw horizons is 6 to 60 inches)
Bg--34 to 58 inches; light brownish gray (2.5Y 6/2) silty clay loam; massive; friable; few fine flakes of mica; few fine black and dark brown concretions; many fine prominent strong brown (7.5YR 5/6) soft masses of iron accumulation; strongly acid; gradual wavy boundary. (0 to 50 inches thick)
Cg--58 to 70 inches; light brownish gray (2.5Y 6/2) stratified sand and extremely gravelly sand; common flakes of mica; strongly acid.
83

Model Decentralized Wastewater Practitioner Curriculum Soil and Site Evaluation
Lindbo et. al. 84
Profile:
Suitability ranking for each factor: (S, PS, or U) and whether reclassified
Landscape/topo: s Why: Texture: ps Why:
Structure: us Why: Mineralogy: s Why:
Soil Wetness: u Why: 14 Soil Depth: s Why:
Restrictive Horizon: s Why: Available Space: S Why: Assume suitable
Overall Suitability: us/ps Why: Depth to Shallowest Limiting Condition
14 Why:
Type of system and/or site modifications to
recommend
fill or drip with pretreatment. Note that this is in a floodplain and should also be considered unsuitable for that reason
LTAR .3
84

Model Decentralized Wastewater Practitioner Curriculum Soil and Site Evaluation
Lindbo et. al. 85
Dothan series
Slope 12%
Landscape position; Side slope
Ap--0 to 6 inches; dark grayish brown (10YR 4/2) sandy loam; weak fine granular structure; very friable; many fine roots; strongly acid; abrupt smooth boundary. (6 to 12 inches thick)
BE--6 to 13 inches; yellowish brown (10YR 5/6) sandy loam; massive in upper 2 inches, weak medium subangular blocky structure below; very friable; many fine roots; strongly acid; gradual smooth boundary. (0 to 11 inches thick)
Bt1--13 to 28 inches; yellowish brown (10YR 5/8) sandy clay loam; weak medium subangular blocky structure; firm; many fine roots; few faint clay films on ped faces; strongly acid; diffuse smooth boundary.
Bt2--28 to 33 inches; yellowish brown (10YR 5/8) sandy clay loam; weak medium subangular blocky structure; friable; common fine roots; common faint clay films on ped faces; few plinthite nodules; common medium distinct strong brown (7.5YR 5/8) and yellowish red (5YR 4/6) masses of iron accumulation; strongly acid; clear wavy boundary. (Combined thickness of the Bt horizons ranges from 15 to 36 inches.)
Btv--33 to 60 inches; variegated yellowish brown (10YR 5/8), strong brown (7.5YR 5/8), red (2.5YR 4/8), yellow (10YR 7/8), and very pale brown (10YR 8/2) sandy clay loam; weak medium subangular blocky structure; friable; compact in place; many fine roots; common faint clay films on ped faces; about 15 percent by volume, red (2.5YR 4/8) plinthite nodules; the areas of yellowish brown, strong brown, red, and yellow are areas of iron accumulations; the areas in shades of very pale brown are iron depletions; strongly acid.
85

Model Decentralized Wastewater Practitioner Curriculum Soil and Site Evaluation
Lindbo et. al. 86
Profile:
Suitability ranking for each factor: (S, PS, or U) and whether reclassified
Landscape/topo: s Why: Texture: ps Why:
Structure: ps Why: Mineralogy: s Why:
Soil Wetness: us/ps Why: 33 Soil Depth: s Why:
Restrictive Horizon: u Why: plintiite at 28” Available Space: S Why: Assume suitable
Overall Suitability: ps Why: Depth to Shallowest Limiting Condition
28 Why:
Type of system and/or site modifications to
recommend
Shallow placement, fill, pretreatment
LTAR .3
86

Model Decentralized Wastewater Practitioner Curriculum Soil and Site Evaluation
Lindbo et. al. 87
Wagram series
Slope 7 %
Landscape position: Shoulder
Ap--0 to 8 inches; grayish brown (10YR 5/2) loamy sand; single grained; very friable; moderately acid; abrupt smooth boundary. (1 to 10 inches thick)
E--8 to 24 inches; pale brown (10YR 6/3) loamy sand; single grained; loose; few thin horizontal bands of sandy loam; strongly acid; gradual wavy boundary. (14 to 35 inches thick)
Bt1--24 to 27 inches; yellowish brown (10YR 5/6) sandy loam; few fine grayish brown mottles; weak medium subangular blocky structure; friable; some penetration of E material locally in root channels; local areas that are brittle; strongly acid; clear wavy boundary. (0 to 6 inches thick)
Bt2--27 to 38 inches; yellowish brown (10YR 5/8) sandy clay loam; weak medium subangular blocky structure; friable, slightly sticky; few faint clay films in pores and on faces of peds; strongly acid; gradual wavy boundary.
Bt3--38 to 52 inches; yellowish brown (10YR 5/8) sandy clay loam; common medium distinct yellowish red (5YR 5/8) mottles; weak medium and coarse subangular blocky structure; friable, slightly sticky; few faint clay films on faces of peds; common clean grains of coarse sand; strongly acid; gradual wavy boundary.
Bt4--52 to 75 inches; yellowish brown (10YR 5/6) sandy clay loam; few medium distinct yellowish red (5YR 5/8) mottles and few medium faint pale brown (10YR 6/3) mottles; weak, medium and coarse subangular blocky structure; friable; strongly acid; gradual irregular boundary. (Combined thickness of the Bt horizon is 21 to more than 60 inches)
BC--75 to 82 inches; mottled yellowish brown (10YR 5/6) and gray (10YR 6/1) sandy loam; massive; few lenses and pockets of sandy clay loam material; some gray areas contain very coarse sand grains; very strongly acid.
87

Model Decentralized Wastewater Practitioner Curriculum Soil and Site Evaluation
Lindbo et. al. 88
Profile:
Suitability ranking for each factor: (S, PS, or U) and whether reclassified
Landscape/topo: s Why: Texture: ps Why:
Structure: ps Why: Mineralogy: s Why:
Soil Wetness: s Why: 75 Soil Depth: s Why:
Restrictive Horizon: s Why: Available Space: S Why: Assume suitable
Overall Suitability: ps Why: Depth to Shallowest Limiting Condition
Why:
Type of system and/or site modifications to
recommend
conventional
LTAR .5
88

Model Decentralized Wastewater Practitioner Curriculum Soil and Site Evaluation
Lindbo et. al. 89
Appling series
Slope 4%
Landscape positon; Near ridge crest
Ap--0 to 9 inches; yellowish brown (10YR 5/4) sandy loam; weak fine granular structure; very friable; common fine and medium roots; few pebbles of quartz; slightly acid; clear smooth boundary. (5 to 12 inches thick)
BA--9 to 12 inches; reddish yellow (7.5YR 6/8) sandy clay loam; weak medium subangular blocky structure; friable; slightly sticky; common fine roots; common fine and medium pores; few pebbles of quartz; strongly acid; clear smooth boundary. (0 to 7 inches thick)
Bt1--12 to 19 inches; reddish yellow (7.5YR 6/8) clay loam; common medium prominent red (2.5YR 5/8) mottles; moderate medium subangular blocky structure; firm; sticky, plastic; few fine roots; common fine and medium pores; few thin distinct clay films on faces of peds; few fine flakes of mica; strongly acid; gradual smooth boundary.
Bt2--19 to 35 inches; strong brown (7.5YR 5/8) clay; common medium prominent red (2.5YR 5/8) mottles; moderate medium subangular blocky structure; firm, sticky, plastic; few fine roots; common fine and medium pores; common thick distinct clay films on faces of peds; common fine flakes of mica; strongly acid; gradual wavy boundary.
Bt3--35 to 42 inches; strong brown (7.5YR 5/6) clay loam; common medium distinct yellowish red (5YR 5/6) and few fine distinct yellow (10YR 8/6) mottles; weak medium subangular blocky structure; firm, sticky, slightly plastic; few fine pores; few distinct clay films on faces of peds; common fine flakes of mica; about 15 percent saprolite; very strongly acid; gradual wavy boundary. (Combined thickness of Bt horizon is 18 to 50 inches)
BC--42 to 46 inches; reddish yellow (5YR 6/8) clay loam; common medium distinct red (2.5YR 5/8) and yellow (10YR 8/6) mottles; weak medium subangular blocky structure; friable; slightly sticky; common fine flakes of mica; about 25 percent saprolite; very strongly acid; gradual wavy boundary. (0 to 30 inches)
C--46 to 65 inches; reddish yellow (7.5YR 7/6), red (2.5YR 5/8), and yellow (10YR 8/6) saprolite that has a sandy clay loam texture; massive; friable; common fine flakes of mica; few bodies of clay loam; very strongly acid.
89

Model Decentralized Wastewater Practitioner Curriculum Soil and Site Evaluation
Lindbo et. al. 90
Profile:
Suitability ranking for each factor: (S, PS, or U) and whether reclassified
Landscape/topo: s Why: Texture: ps Why:
Structure: ps Why: Mineralogy: ps Why:
Soil Wetness: s Why: Soil Depth: ps Why:
Restrictive Horizon: s Why: Available Space: S Why: Assume suitable
Overall Suitability: ps Why: Depth to Shallowest Limiting Condition
Why:
Type of system and/or site modifications to
recommend
conventional
LTAR .3
90

Model Decentralized Wastewater Practitioner Curriculum Soil and Site Evaluation
Lindbo et. al. 91
Cecil series
Slope 20%
Landscape position; Shoulder
Oi--2 to 0 inches; very dark grayish brown (2.5Y 3/2) partially decayed leaves and twigs. (0 to 3 inches thick)
A--0 to 2 inches; dark grayish brown (10YR 4/2) sandy loam; weak medium granular structure; very friable; many fine roots; strongly acid; clear wavy boundary. (2 to 8 inches thick)
E--2 to 7 inches; brown (7.5YR 5/4) sandy loam; weak medium granular structure; very friable; many fine and medium roots; few pebbles of quartz; strongly acid; clear smooth boundary. (0 to 10 inches thick)
BE--7 to 11 inches; yellowish red (5YR 4/8) sandy clay loam; weak medium granular structure; very friable; many fine roots; strongly acid; clear wavy boundary. (0 to 8 inches thick)
Bt1--11 to 28 inches; red (2.5YR 4/8) clay; moderate medium subangular blocky structure; firm; sticky, plastic; common thick distinct clay films on faces of peds; few fine flakes of mica; few small pebbles of quartz; strongly acid; gradual smooth boundary.
Bt2--28 to 40 inches; red (2.5YR 4/8) clay; moderate and weak medium subangular blocky structure; firm; sticky, plastic; common thin clay films on faces of peds; few to common fine flakes of mica; strongly acid; gradual smooth boundary.
Bt3--40 to 50 inches; red (2.5YR 5/8) clay loam; common medium distinct strong brown (7.5YR 5/6) mottles; weak medium subangular blocky structure; friable; few thin distinct clay films on vertical faces of peds; common fine flakes of mica; strongly acid; gradual smooth boundary. (Combined thickness of the Bt horizon is 24 to 48 inches)
C--50 to 75 inches; mottled red (2.5YR 5/8), strong brown (7.5YR 5/8), and pale brown (10YR 6/3) loamy saprolite of gneiss; common pockets of clay loam; massive; friable; common fine flakes of mica; strongly acid.
91

Model Decentralized Wastewater Practitioner Curriculum Soil and Site Evaluation
Lindbo et. al. 92
Profile:
Suitability ranking for each factor: (S, PS, or U) and whether reclassified
Landscape/topo: s Why: Texture: s Why:
Structure: ps Why: Mineralogy: s Why:
Soil Wetness: s Why: Soil Depth: s Why:
Restrictive Horizon: s Why: Available Space: S Why: Assume suitable
Overall Suitability: s Why: Depth to Shallowest Limiting Condition
50 Why:
Type of system and/or site modifications to
recommend
Conventional
LTAR 0.35
92

Model Decentralized Wastewater Practitioner Curriculum Soil and Site Evaluation
Lindbo et. al. 93
Green Level series
Slope 5%
Landscape position; Upland ridge
A--0 to 1 inch; brown (10YR 4/3); sandy loam; weak fine granular structure; friable; non-sticky; non-plastic; common fine roots; very strongly acid; abrupt smooth boundary. (1 to 10 inches thick)
E--1 to 8 inches; light yellowish brown (2.5Y 6/4); sandy loam; weak fine subangular blocky structure; friable; non-sticky; slightly plastic; common fine roots; strongly acid; clear smooth boundary. (0 to 10 inches thick)
Bt--8 to 12 inches; strong brown (7.5YR 5/6); clay loam; weak fine subangular blocky structure; firm; moderately sticky; moderately plastic; common fine roots; common fine distinct brownish yellow (10YR 6/8) iron depletions; very strongly acid; clear smooth boundary.
Btss1--12 to 24 inches; yellowish brown (10YR 5/8); clay; weak medium subangular blocky structure; very firm; very sticky; very plastic; common fine roots; common nonintersecting slickensides; common fine distinct light yellowish brown (10YR 6/4) and few fine prominent light gray (10YR 7/2) iron depletions; very strongly acid; gradual wavy boundary.
Btss2--24 to 33 inches; yellowish brown (10YR 5/8); clay; weak medium subangular blocky structure; very firm; very sticky; very plastic; common fine roots; common fine roots; common nonintersecting slickensides; common fine prominent red (2.5YR 5/8) irregularly shaped masses of iron accumulation and common fine prominent light gray (10YR 7/2) iron depletions; very strongly acid; clear wavy boundary. (Combined thickness of the Bt horizons is 20 to 50 inches.)
BCtg--33 to 38 inches; light gray (10YR 7/2); sandy clay loam; weak coarse subangular blocky structure; friable; slightly sticky; moderately plastic; few fine roots; common medium prominent yellowish brown (10YR 5/8) and strong brown (7.5YR 5/8) irregularly shaped masses of iron accumulation and common medium faint pinkish gray (7.5YR 7/2) iron depletions; very strongly acid; clear wavy boundary. (0 to 15 inches thick)
Cg1--38 to 51 inches; light gray (10YR 7/2); sandy loam; common coarse distinct brown (7.5YR 5/2) and common coarse prominent brown (7.5YR 4/3) lithochromic mottles; massive; friable; slightly sticky; non-plastic; 5 percent sandstone pararock fragments; very strongly acid; diffuse wavy boundary.
93

Model Decentralized Wastewater Practitioner Curriculum Soil and Site Evaluation
Lindbo et. al. 94
Profile:
Suitability ranking for each factor: (S, PS, or U) and whether reclassified
Landscape/topo: s Why: Texture: ps Why:
Structure: ps Why: coarse structure at 33” Mineralogy: u Why: v.sticky, v plastic at 12”
Soil Wetness: u Why: wetness @ 12” Soil Depth: u Why:
Restrictive Horizon: s Why: Available Space: S Why: Assume suitable
Overall Suitability: u Why: Depth to Shallowest Limiting Condition
12 Why:
Type of system and/or site modifications to
recommend
Possible for drip with pretreatment and disinfection at 6”
LTAR
94

Model Decentralized Wastewater Practitioner Curriculum Soil and Site Evaluation
Lindbo et. al. 95
Hiwassee series
Slope 10%
Landscape position; Ridge top
Ap--0 to 6 inches; dark reddish brown (5YR 3/4) clay loam; moderate medium granular structure; friable, sticky, slightly plastic; many fine roots; moderately acid; clear smooth boundary. (4 to 10 inches thick)
Bt1--6 to 28 inches; dark red (10R 3/6) clay; moderate fine subangular blocky structure; firm; very sticky; few fine roots; common fine tubular pores; many distinct clay films on faces of peds; moderately acid; clear wavy boundary.
Bt2--28 to 44 inches; dark red (2.5YR 3/6) clay; moderate medium subangular blocky structure; firm; sticky, plastic; few fine roots; common fine tubular pores; many distinct clay films on faces of peds; common fine distinct strong brown (7.5YR 5/6) masses of iron accumulation; strongly acid; gradual wavy boundary. (Combined thickness of the Bt horizon is 35 to 60 or more inches)
BC--44 to 65 inches; dark reddish brown (2.5YR 3/4) clay loam; weak medium subangular blocky structure; firm; slightly sticky, slightly plastic; few fine roots; few very fine tubular pores; few distinct clay films on vertical faces of peds; many medium distinct strong brown (7.5YR 5/8) and common medium faint red (10R 4/6) masses of iron accumulation; strongly acid.
95

Model Decentralized Wastewater Practitioner Curriculum Soil and Site Evaluation
Lindbo et. al. 96
Profile:
Suitability ranking for each factor: (S, PS, or U) and whether reclassified
Landscape/topo: s Why: Texture: ps Why:
Structure: s Why: Mineralogy: s Why:
Soil Wetness: s Why: Soil Depth: s Why:
Restrictive Horizon: s Why: Available Space: S Why: Assume suitable
Overall Suitability: s Why: Depth to Shallowest Limiting Condition
Why:
Type of system and/or site modifications to
recommend
Conventional
LTAR 0.35
96

Model Decentralized Wastewater Practitioner Curriculum Soil and Site Evaluation
Lindbo et. al. 97
Tate series
Slope 30%
Landscape position; Bottom of long 45% slope
Ap--0 to 7 inches; dark grayish brown (10YR 4/2) loam; moderate fine granular structure; very friable; many fine roots; few fine pores; few root channels; contains some material from the BA horizon; moderately acid; abrupt smooth boundary. (5 to 11 inches thick)
BA--7 to 12 inches; brown (10YR 4/3) clay loam; weak medium subangular blocky structure; friable; common fine roots; common fine pores; common root channels; moderately acid; clear smooth boundary. (0 to 14 inches thick)
Bt--12 to 32 inches; yellowish brown (10YR 5/6) clay loam; weak medium subangular blocky structure; friable; few fine roots; few fine pores; few faint clay films on faces of peds and in pores; few fine flakes of mica; strongly acid; clear smooth boundary. (15 to 40 inches thick)
BC--32 to 46 inches; brownish yellow (10YR 6/6) sandy clay loam; weak medium subangular blocky structure; friable; few faint clay films on faces of peds; many pebbles; common fine flakes of mica; strongly acid; gradual wavy boundary. (3 to 20 inches thick)
C--46 to 72 inches; brownish yellow (10YR 6/8) and light yellowish brown (10YR 6/4) fine sandy loam; massive; friable; common quartz pebbles in upper part; strongly acid.
97

Model Decentralized Wastewater Practitioner Curriculum Soil and Site Evaluation
Lindbo et. al. 98
Profile:
Suitability ranking for each factor: (S, PS, or U) and whether reclassified
Landscape/topo: ps Why: Texture: s Why:
Structure: s Why: Mineralogy: s Why:
Soil Wetness: s Why: Soil Depth: ps Why: 46”
Restrictive Horizon: s Why: Available Space: S Why: Assume suitable
Overall Suitability: ps Why: Depth to Shallowest Limiting Condition
46 Why:
Type of system and/or site modifications to
recommend
Conventional
LTAR 0.4
98

Model Decentralized Wastewater Practitioner Curriculum Soil and Site Evaluation
Lindbo et. al. 99
Buladean series
Slope 42%
Landscape position; Side slope
Oi--0 to 1 inch; slightly decomposed deciduous leaves and twigs. (0 to 3 inches thick)
Oe--1 to 2 inches; moderately decomposed deciduous leaves and twigs and very dark gray (10YR 3/1) decomposed organic matter. (0 to 3 inches thick)
A--2 to 5 inches; very dark grayish brown (10YR 3/2) loam, brown (10YR 4/3) dry; weak fine granular structure; very friable; many very fine or fine, common medium, and few coarse roots; many very fine to medium and common coarse tubular pores; 2 percent by volume gravel; strongly acid; clear smooth boundary. (1 to 8 inches thick)
Bw1--5 to 22 inches; brown (7.5YR 4/4) loam; weak medium subangular blocky structure; friable; common very fine to medium and few coarse roots; common very fine to medium and few coarse tubular pores; few fine flakes of mica; 5 percent by volume gravel; strongly acid; clear wavy boundary.
Bw2--22 to 28 inches; brown (7.5YR 4/4) coarse sandy loam; weak fine subangular blocky structure; friable; common very fine to coarse roots; common very fine to coarse tubular pores; few very fine flakes of mica; 5 percent by volume gravel; strongly acid; gradual wavy boundary. (Combined thickness of the Bw horizon is 15 to 39 inches.)
C--28 to 52 inches; multicolored coarse sandy loam saprolite; massive; very friable; few very fine to medium and common coarse roots; few very fine to coarse tubular pores; few very fine flakes of mica; 5 percent by volume gravel; strongly acid; abrupt smooth boundary. (0 to 40 inches thick)
Cr--52 to 88 inches; weathered, multicolored, partially consolidated biotite granitic gneiss that can be dug with difficulty with hand tools ; few fine and medium roots in cracks that are spaced more than 4 inches apart.
99

Model Decentralized Wastewater Practitioner Curriculum Soil and Site Evaluation
Lindbo et. al. 100
Profile:
Suitability ranking for each factor: (S, PS, or U) and whether reclassified
Landscape/topo: ps/u Why: Texture: s Why:
Structure: s Why: Mineralogy: s Why:
Soil Wetness: s Why: Soil Depth: ps Why:
Restrictive Horizon: s Why: Available Space: S Why: Assume suitable
Overall Suitability: s Why: Depth to Shallowest Limiting Condition
28 Why:
Type of system and/or site modifications to
recommend
Install in saprolite
LTAR 0.4
100

Model Decentralized Wastewater Practitioner Curriculum Soil and Site Evaluation
Lindbo et. al. 101
C7--53 to 80 inches; brown (10YR 5/3) and dark yellowish brown (10YR 4/4) fine sand; few fine distinct strong brown (7.5YR 4/6) mottles; single grained; loose; common very fine and fine flakes of mica; slightly acid.
Biltmore series
Slope 0%
Landscape position; Floodplain
Ap--0 to 8 inches; dark yellowish brown (10YR 4/4) sand; few medium distinct brownish yellow (10YR 6/6) mottles; weak fine granular structure; very friable; many very fine, fine, and medium roots; few fine interstitial pores; common very fine and fine flakes of mica; slightly acid; abrupt smooth boundary. (6 to 17 inches thick)
C1--8 to 16 inches; brownish yellow (10YR 6/6) sand; few medium distinct very pale brown (10YR 7/3) mottles; single grained; loose; few fine interstitial and tubular pores; few charcoal stains; common very fine and fine flakes of mica; slightly acid; clear smooth boundary.
C2--16 to 23 inches; yellowish brown (10YR 6/6) sand; few medium faint yellowish brown (10YR 5/4) mottles; single grained; loose; few fine interstitial and tubular pores; few charcoal stains; common very fine and fine flakes of mica; slightly acid; clear smooth boundary.
C3--23 to 26 inches; light yellowish brown (10YR 6/4) sand; single grained; loose; few fine interstitial and tubular pores; common very fine and fine flakes of mica; slightly acid; abrupt smooth boundary.
C4--26 to 41 inches; yellowish brown (10YR 5/6), dark yellowish brown, and light yellowish brown (10YR 6/4) fine sand; few fine faint brown (10YR 5/3) mottles; single grained; loose; common very fine and fine flakes of mica; slightly acid; clear smooth boundary.
C5--41 to 47 inches; dark yellowish brown (10YR 4/6) fine sand; few medium distinct light yellowish brown (10YR 6/4) and fine prominent strong brown (7.5YR 5/6) mottles; single grained; loose; few charcoal stains; common very fine and fine flakes of mica; slightly acid; clear smooth boundary.
C6--47 to 53 inches; dark yellowish brown (10YR 4/6), light yellowish brown (10YR 6/4), and strong brown (7.5YR 5/6) sand; single grained; loose; common very fine and fine flakes of mica; slightly acid; clear smooth boundary.
101

Model Decentralized Wastewater Practitioner Curriculum Soil and Site Evaluation
Lindbo et. al. 102
Profile:
Suitability ranking for each factor: (S, PS, or U) and whether reclassified
Landscape/topo: s Why: Texture: s Why:
Structure: s Why: Mineralogy: s Why:
Soil Wetness: s Why: Soil Depth: u Why: only 8” by rule but in reality depth is 80”
Restrictive Horizon: s Why: Available Space: S Why: Assume suitable
Overall Suitability: s Why: Depth to Shallowest Limiting Condition
8” by rule
Why: C horizon @ 8”. Can use deeper
Type of system and/or site modifications to
recommend
Conventional if utilize C horizon
LTAR 0.8
102

Model Decentralized Wastewater Practitioner Curriculum Soil and Site Evaluation
Lindbo et. al. 103
The Hayesville series
Slope 32%
Landscape position: Side slope
A1--0 to 1 inch; brown (10YR 4/3) loam; moderate fine and medium granular structure; very friable; many fine and medium roots; moderately acid; abrupt smooth boundary. (1 to 5 inches thick)
A2--1 to 5 inches; brown (10YR 5/3) loam; weak medium granular structure; very friable; many fine and medium roots; moderately acid; abrupt smooth boundary. (0 to 7 inches thick)
BA--5 to 9 inches; yellowish red (5YR 5/8) clay loam; weak medium subangular blocky structure; friable; common medium and fine roots; few fine flakes of mica; strongly acid; clear smooth boundary. (0 to 6 inches thick)
Bt1--9 to 26 inches; red (2.5YR 4/6) clay; moderate medium and coarse subangular blocky structure; friable to firm; common distinct clay films on faces of peds; few to common soft fragments of rock; few fine flakes of mica; strongly acid; gradual smooth boundary.
Bt2--26 to 38 inches; red (2.5YR 5/6) clay loam; weak medium subangular blocky structure; friable; few faint clay films on faces of peds; common coarse fragments of rock; soft and hard; few partially weathered feldspar and dark minerals; few flakes of mica; strongly acid; gradual irregular boundary. (Combined thickness of the Bt horizon is 11 to 45 inches)
BC--38 to 48 inches; yellowish red (5YR 5/6) and red (2.5YR 4/6) sandy clay loam; massive; friable; many grayish and whitish streaks of soft gneiss; gray and white colors increase in abundance with depth; common flakes of mica; few hard fragments of gneiss; strongly acid. (6 to 29 inches thick)
C--48 to 60 inches; strong brown (7.5YR 5/8) saprolite that is fine sandy loam; massive (rock structure); very friable; common fine flakes of mica; strongly acid.
103

Model Decentralized Wastewater Practitioner Curriculum Soil and Site Evaluation
Lindbo et. al. 104
Profile:
Suitability ranking for each factor: (S, PS, or U) and whether reclassified
Landscape/topo: s Why: Texture: ps Why:
Structure: s Why: Mineralogy: s Why:
Soil Wetness: s Why: Soil Depth: s Why:
Restrictive Horizon: s Why: Available Space: S Why: Assume suitable
Overall Suitability: s Why: Depth to Shallowest Limiting Condition
48 Why:
Type of system and/or site modifications to
recommend
Conventional
LTAR
104

Model Decentralized Wastewater Practitioner Curriculum Soil and Site Evaluation
Lindbo et. al. 105
The Burton series
Slope 20%
Landscape position; Ridge top
Oe--0 to 2 inches; mat of decomposing forest leaves and twigs laced with many fine live roots. (1 to 3 inches thick)
A1--2 to 6 inches; black (10YR 2/1) loam; moderate medium and coarse granular structure; very friable; many fine and medium roots; 2 percent by volume angular gneiss stones and cobbles; few fine flakes of mica; extremely acid; clear smooth boundary. (2 to 9 inches thick)
A2--6 to 10 inches; very dark brown (10YR 2/2) loam; weak coarse subangular blocky structure; friable; common fine and medium roots; 2 percent by volume angular gneiss stones and cobbles; few fine flakes of mica; extremely acid; clear smooth boundary. (4 to 11 inches thick)
AB--10 to 14 inches; dark brown (10YR 3/3) loam; weak coarse subangular blocky structure; friable; common fine and medium roots; 5 percent by volume angular gneiss cobbles and stones; few fine flakes of mica; extremely acid; clear smooth boundary. (0 to 8 inches thick)
Bw1--14 to 18 inches; brown (10YR 4/3) sandy loam; weak coarse subangular blocky structure; friable; few fine roots; 5 percent by volume angular gneiss cobbles and stones; few fine flakes of mica; very strongly acid; gradual wavy boundary.
Bw2--18 to 23 inches; yellowish brown (10YR 5/6) sandy loam; weak coarse subangular blocky structure; friable; few fine roots; 10 percent by volume angular gneiss cobbles and stones; common fine flakes of mica; very strongly acid; clear irregular boundary. (Combined thickness of the Bw horizon is 6 to 14 inches.)
C--23 to 30 inches; brown (10YR 5/3) saprolite that has a texture of very cobbly fine sandy loam; massive; friable; few fine roots; 50 percent by volume angular gneiss cobbles and stones; many fine and medium flakes of mica; very strongly acid; clear irregular boundary. (4 to 12 inches thick)
105

Model Decentralized Wastewater Practitioner Curriculum Soil and Site Evaluation
Lindbo et. al. 106
Profile:
Suitability ranking for each factor: (S, PS, or U) and whether reclassified
Landscape/topo: s Why: Texture: s Why:
Structure: s Why: Mineralogy: s Why:
Soil Wetness: s Why: Soil Depth: ps Why:
Restrictive Horizon: s Why: Available Space: S Why: Assume suitable
Overall Suitability: s Why: Depth to Shallowest Limiting Condition
23 Why:
Type of system and/or site modifications to
recommend
Shallow place
LTAR 0.5
106

Model Decentralized Wastewater Practitioner Curriculum Soil and Site Evaluation
Lindbo et. al. 107
The Wayah series
Slope 20%
Landscape position: Side slope
Oi--0 to 2 inches; slightly decomposed leaves and twigs.
Oe--2 to 4 inches; partially decomposed organic litter and root mat.
A1--4 to 14 inches; black (10YR 2/1) sandy clay loam, very dark gray (10YR 3/1) dry; weak fine granular structure; very friable; common fine and medium roots; 2 percent pebbles by volume; few fine flakes of mica; 18 percent organic matter; extremely acid; clear wavy boundary.
A2--14 to 18 inches; very dark grayish brown (10YR 3/2) sandy clay loam, dark grayish brown (10YR 4/2) dry; weak medium granular structure; very friable; common fine and medium roots; 2 percent pebbles by volume; few fine flakes of mica; very strongly acid; clear wavy boundary. (Combined thickness of the A horizon is 10 to 20 inches.)
Bw--18 to 44 inches; dark yellowish brown (10YR 4/6) gravelly sandy clay loam; weak medium subangular blocky structure; very friable; few fine roots; 33 percent pebbles; few fine flakes of mica; very strongly acid; gradual wavy boundary. (12 to 30 inches thick.)
C1--44 to 50 inches; pale brown (10YR 6/3) gneiss saprolite that is gravelly sandy loam; few medium faint light gray (10YR 7/2) and white (10YR 8/2) mottles; massive rock controlled structure; very friable; 16 percent pebbles; few fine flakes of mica; very strongly acid; gradual wavy boundary.
C2--50 to 69 inches; mottled yellowish brown (10YR 5/8), yellowish red (5YR 5/6), white (10YR 8/2) and pale brown (10YR 4/6) gneiss saprolite that is gravelly sandy loam; massive rock controlled structure; very friable; 17 percent pebbles by volume; few fine flakes of mica; very strongly acid.
107

Model Decentralized Wastewater Practitioner Curriculum Soil and Site Evaluation
Lindbo et. al. 108
Profile: Wahay
Suitability ranking for each factor: (S, PS, or U) and whether reclassified
Landscape/topo: PS Why: Slope of 20% Texture: PS Why: Sandy Clay Loam at 14”
Structure: PS Why: SBK at 18” Mineralogy: S Why:
Soil Wetness: S (PS?)
Why: Lithochromic colors may be confused with wetness
Soil Depth: PS Why: Saprolite at 44” Restrictive Horizon: S Why:
Available Space: S Why: Assume all for this exercise are suitable Overall Suitability: PS Why:
Depth to Shallowest Limiting Condition
44” Why:
Type of system and/or site modifications to
recommend
Conventional with curtain drain
LTAR 0.4
108

Model Decentralized Wastewater Practitioner Curriculum Soil and Site Evaluation
Lindbo et. al. 109
109