software visualization
DESCRIPTION
Software Visualization. Peter Eades University of Sydney. Making Pictures of Abstract Things. Photograph. Bent photorealism. Jesse Jin. Synthesized photorealism. Mitsubishi Electric Research Laboratories. Unseen but imaginable. BMIT group. Unseen but imaginable. BMIT group. - PowerPoint PPT PresentationTRANSCRIPT
1
Software VisualizationPeter Eades
University of Sydney
2
Making Picturesof
Abstract Things
3
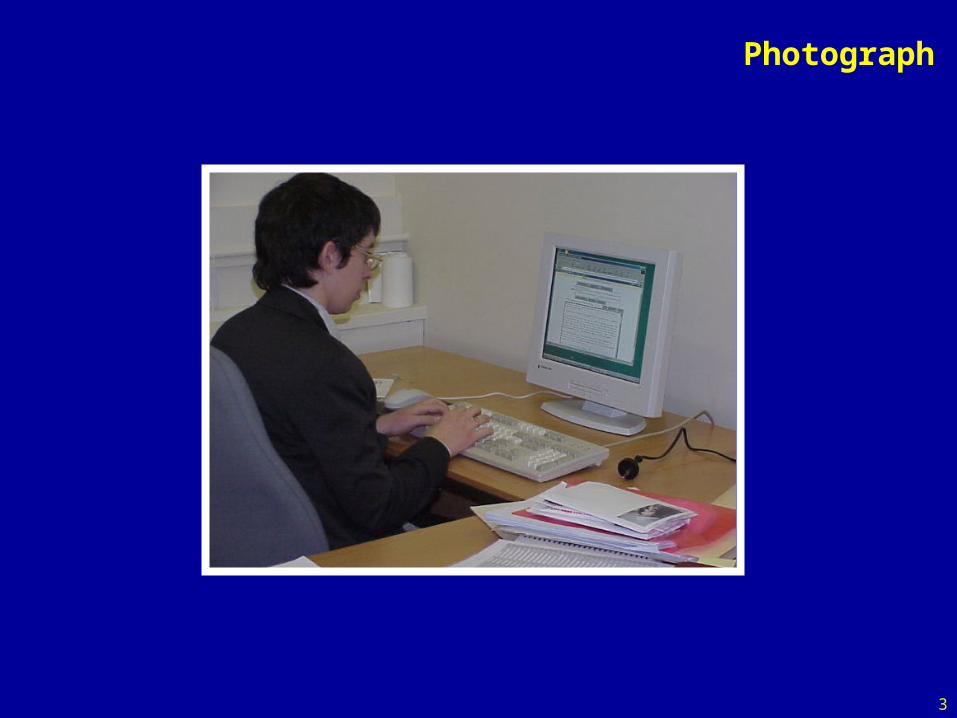
Photograph
4
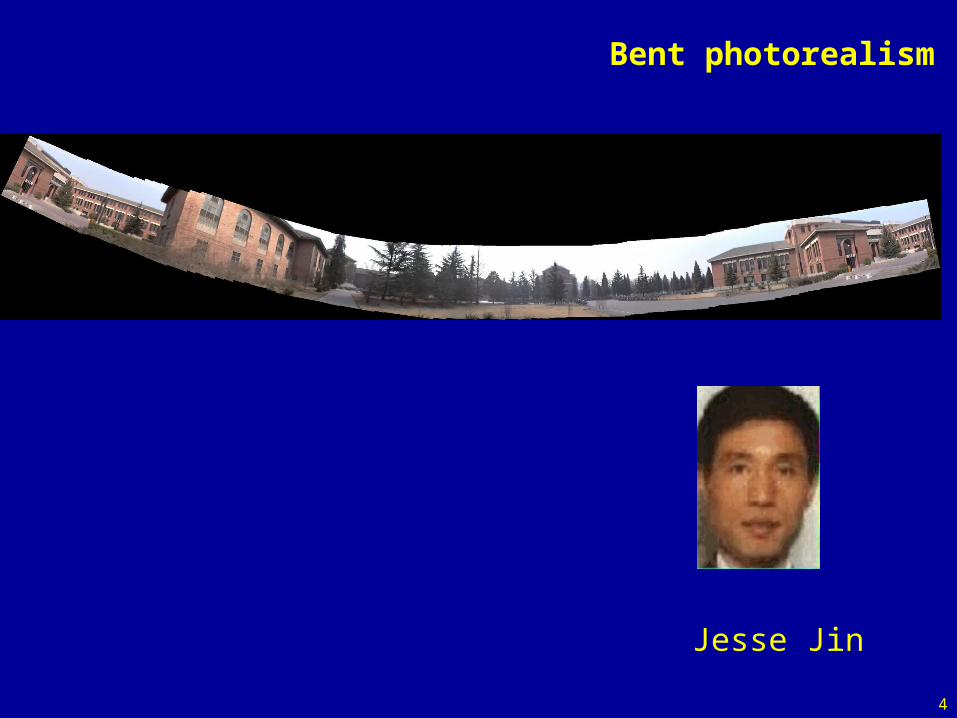
Bent photorealism
Jesse Jin

5
Synthesized photorealism
Mitsubishi Electric Research Laboratories
6
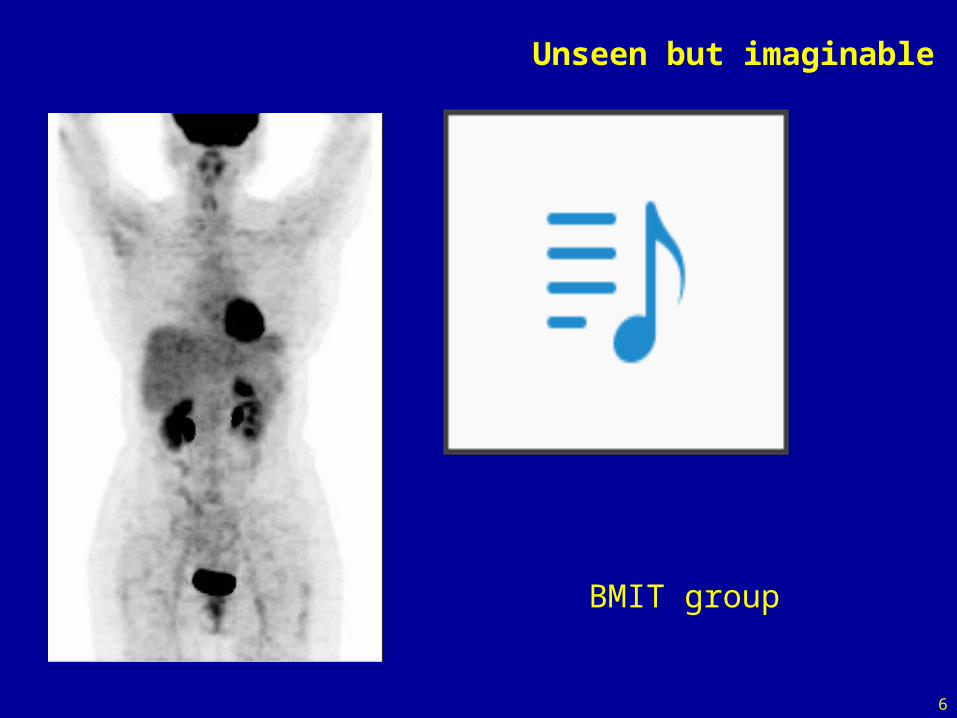
Unseen but imaginable
BMIT group
7
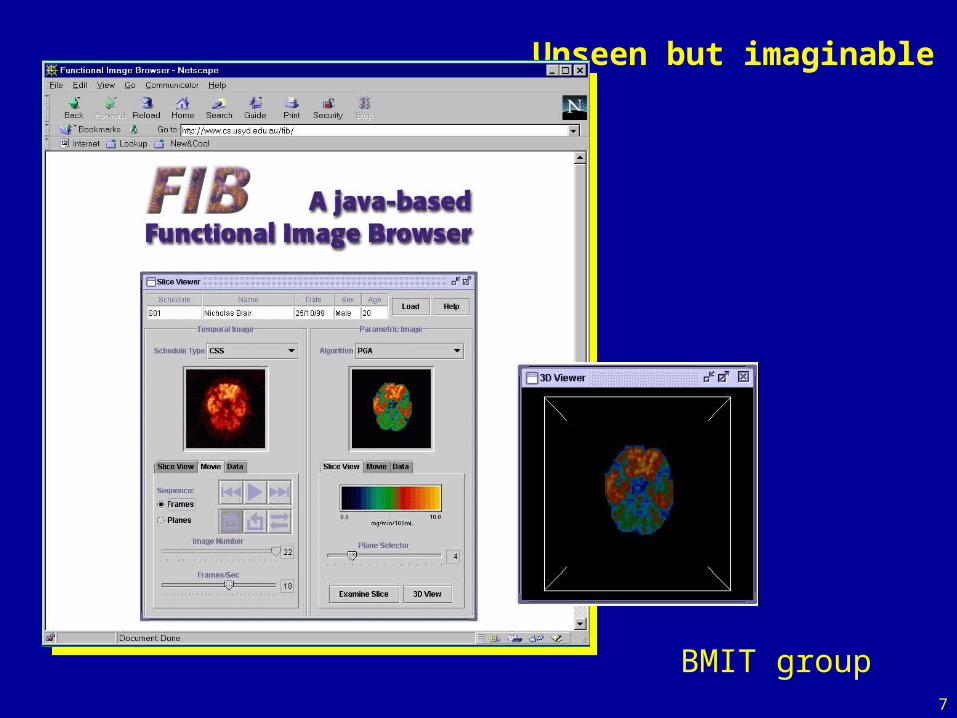
Unseen but imaginable
BMIT group
8
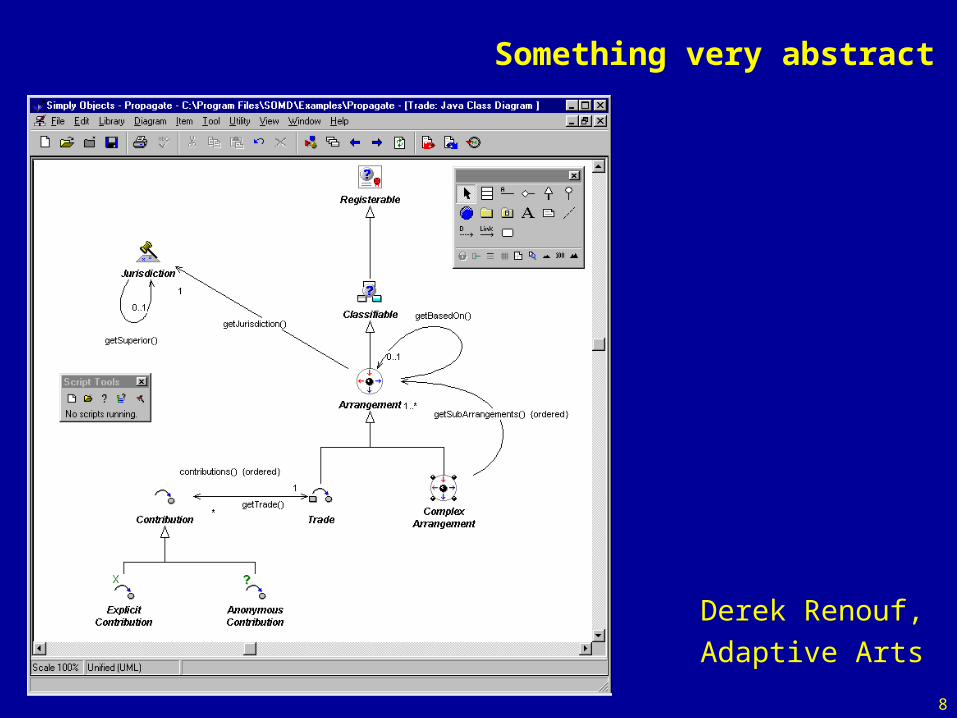
Something very abstract
Derek Renouf,
Adaptive Arts
9
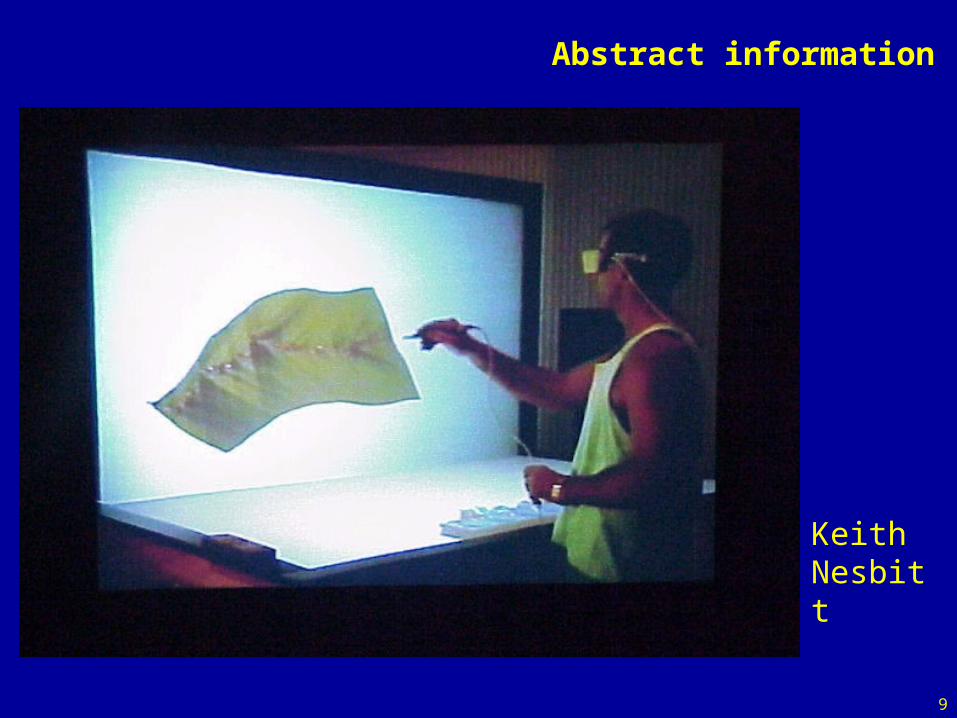
Abstract information
KeithNesbitt
10
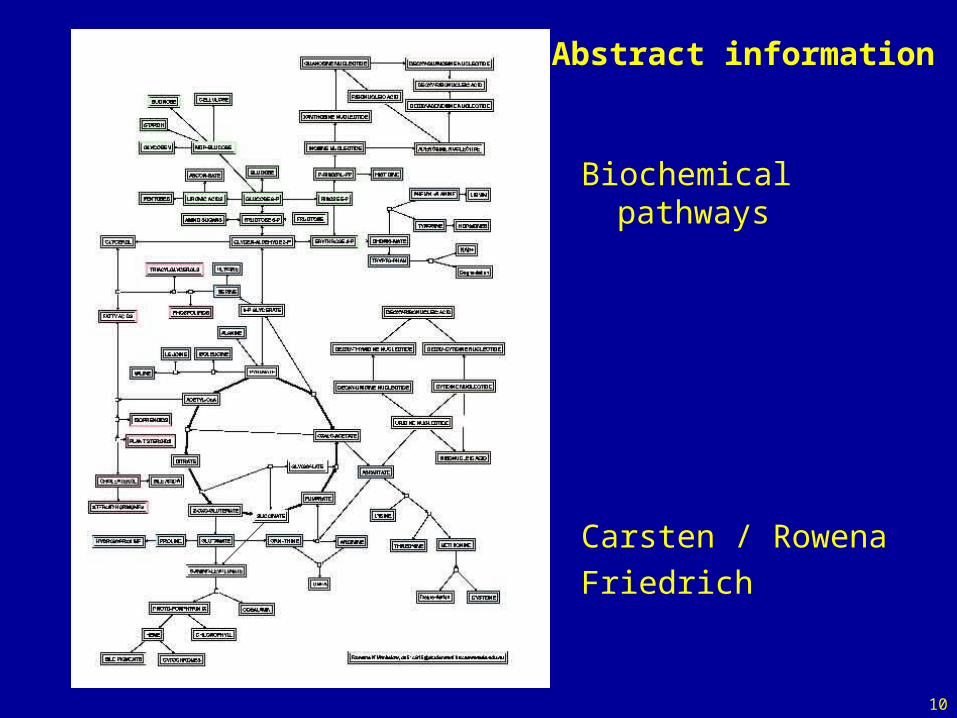
Abstract information
Biochemical pathways
Carsten / Rowena
Friedrich
11
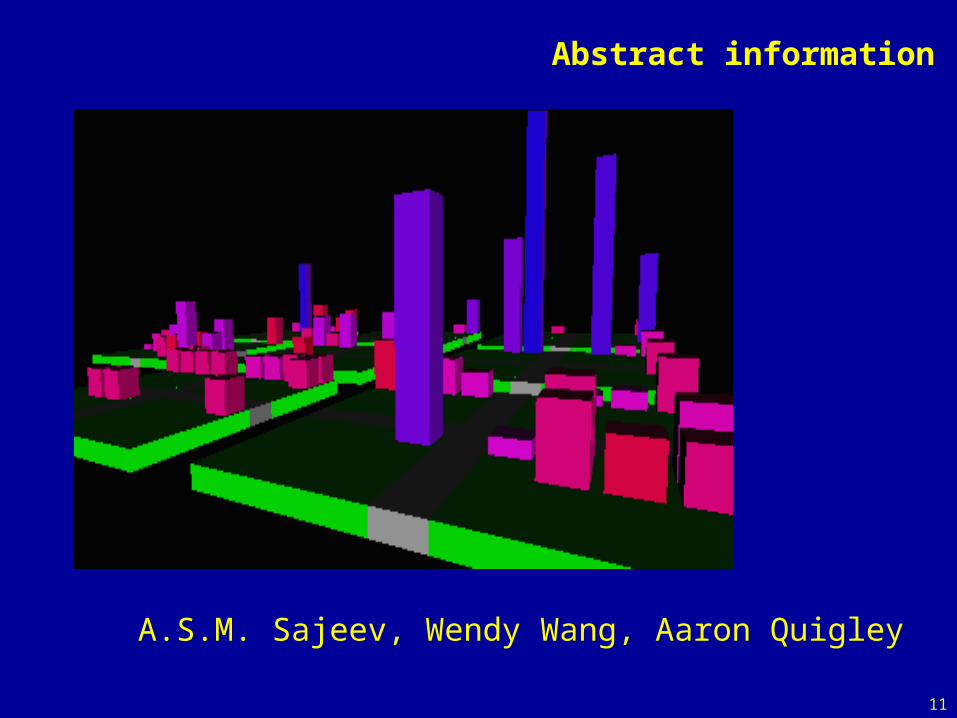
Abstract information
A.S.M. Sajeev, Wendy Wang, Aaron Quigley
12
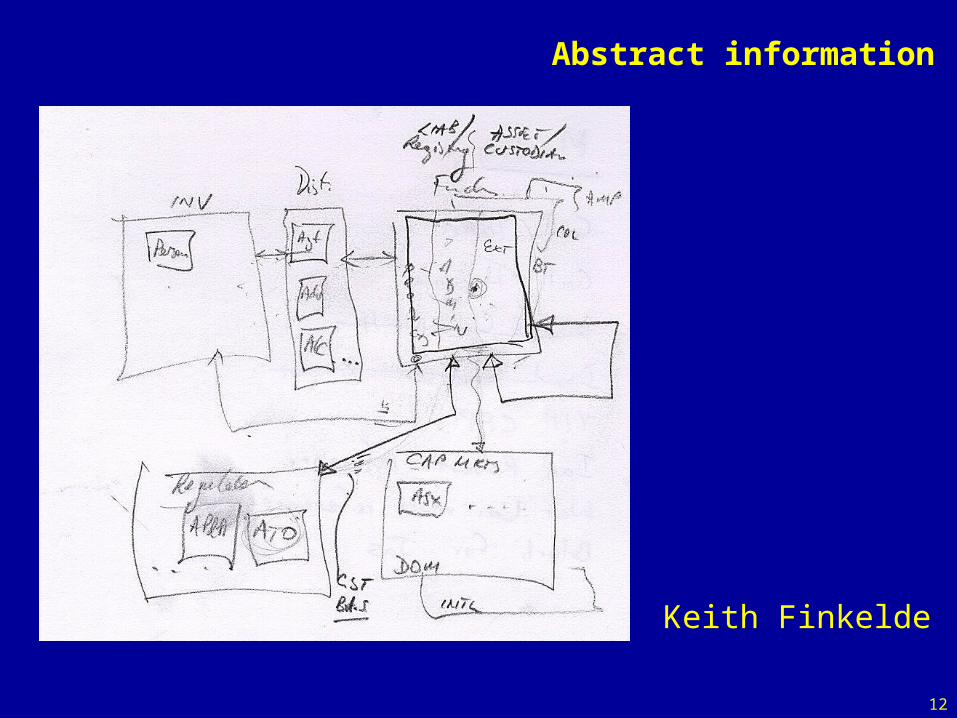
Abstract information
Keith Finkelde
13
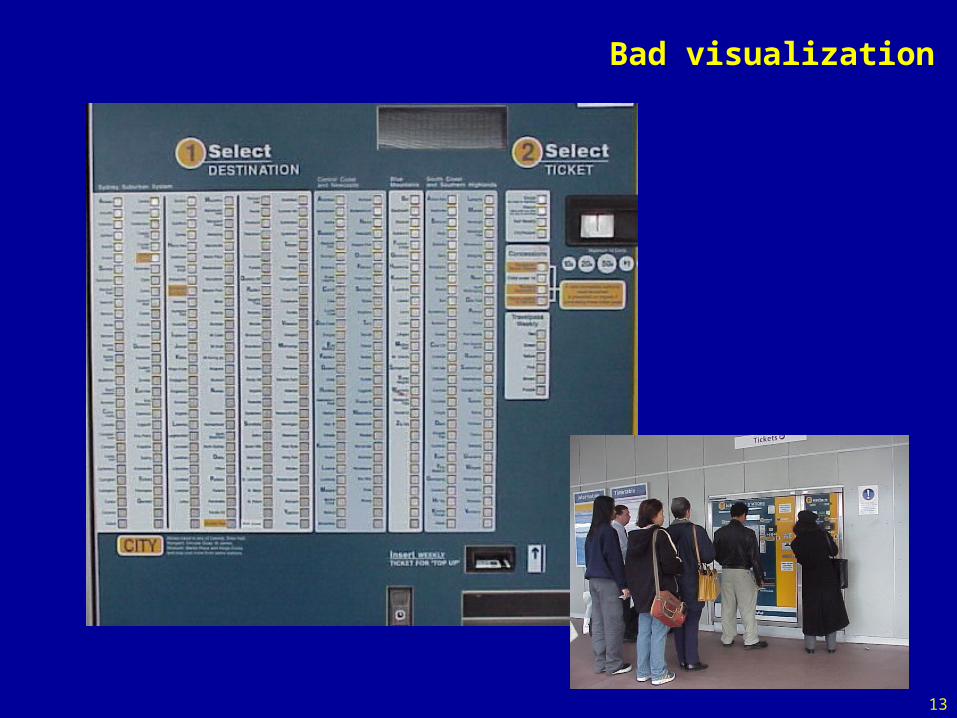
Bad visualization
14
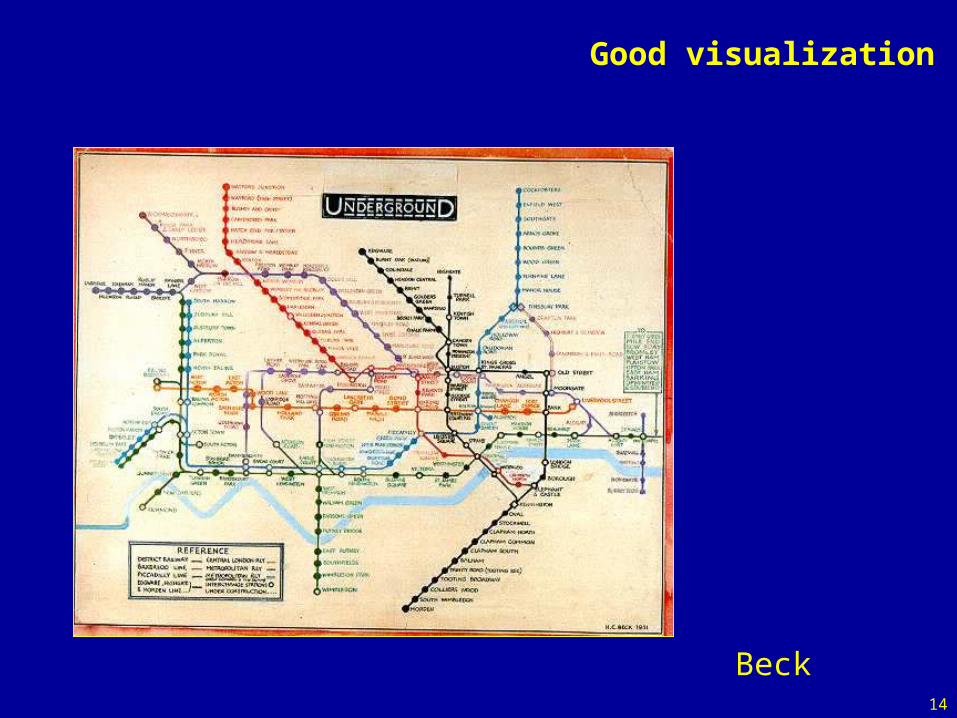
Good visualization
Beck
15
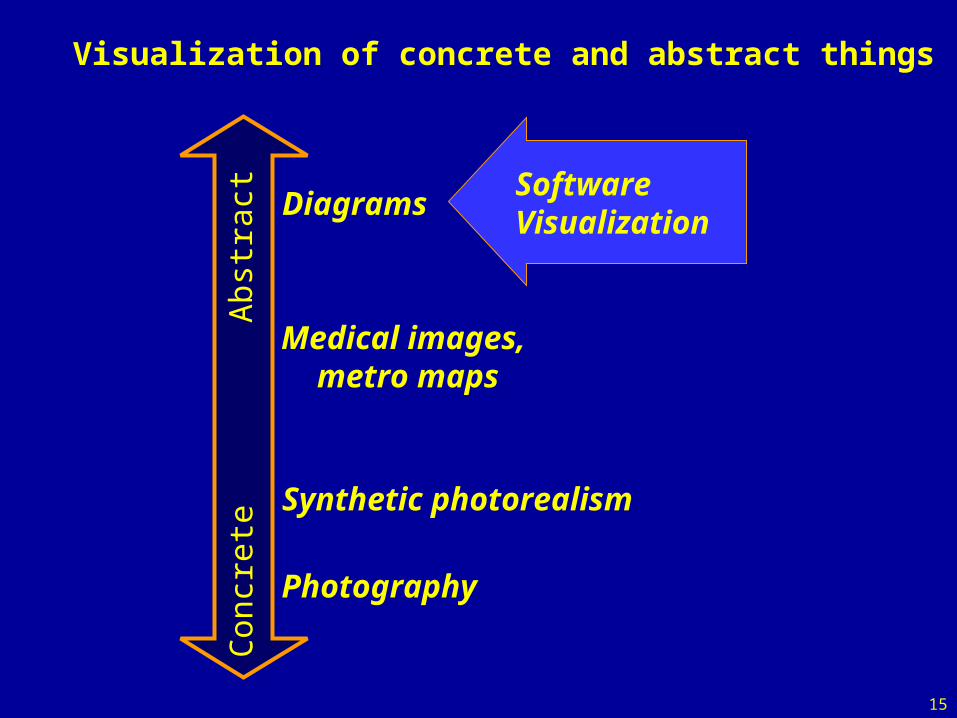
Visualization of concrete and abstract things
Con
cret
eA
bstr
act
Photography
Diagrams
Synthetic photorealism
Medical images, metro maps
Software Visualization
16
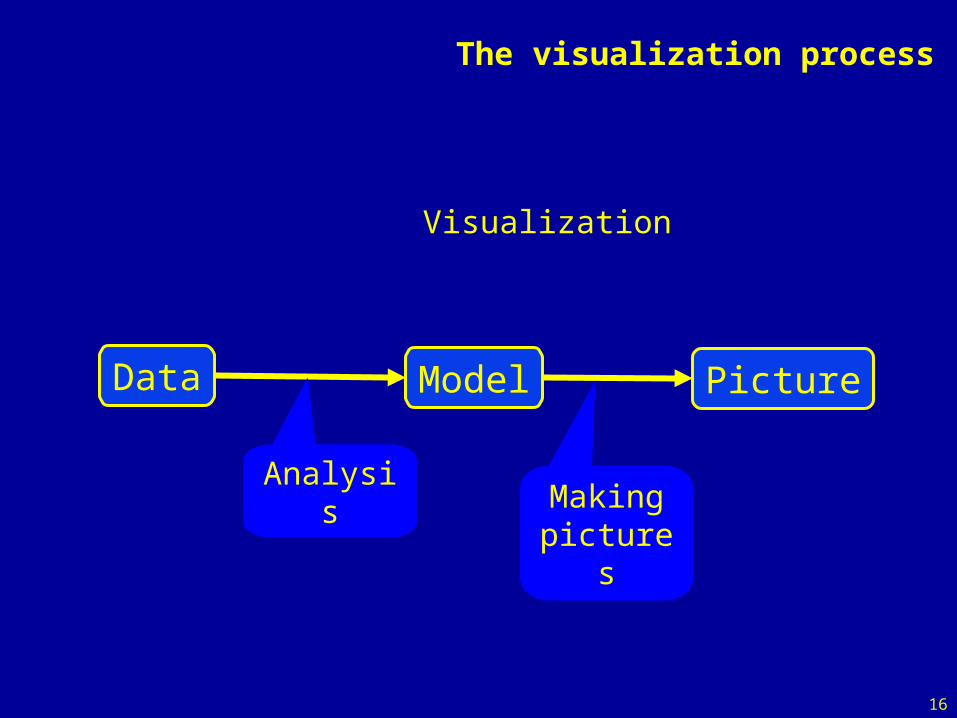
The visualization process
Visualization
Data Model Picture
AnalysisMakingpictures
17
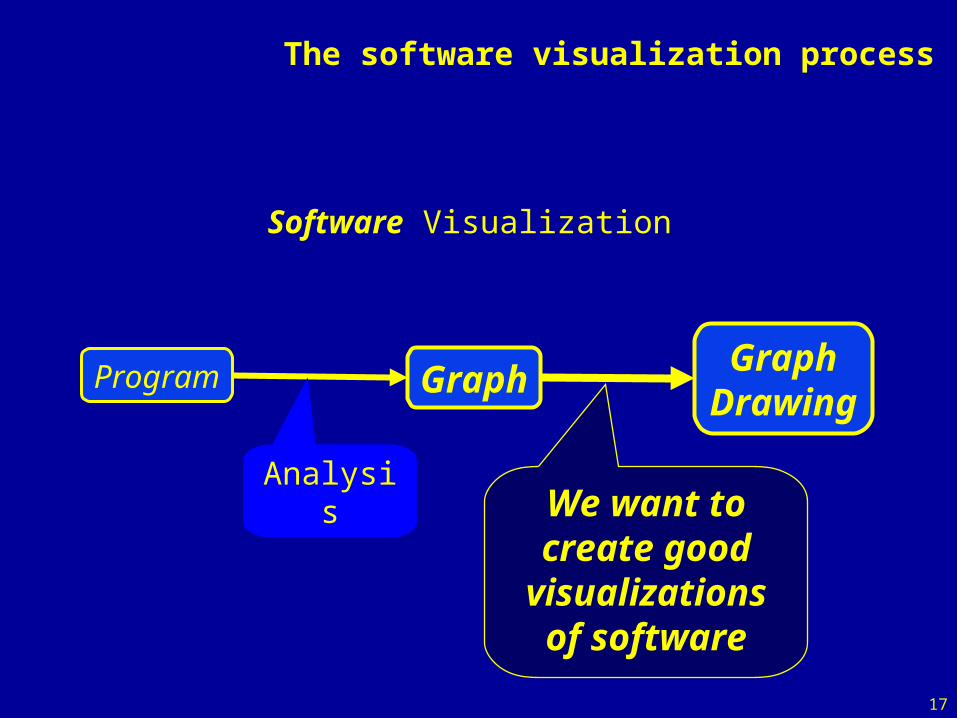
The software visualization process
Program GraphGraph
Drawing
Analysis
Makingpictures
Software Visualization
We want to create good
visualizations of software
18
There is alot of
Software
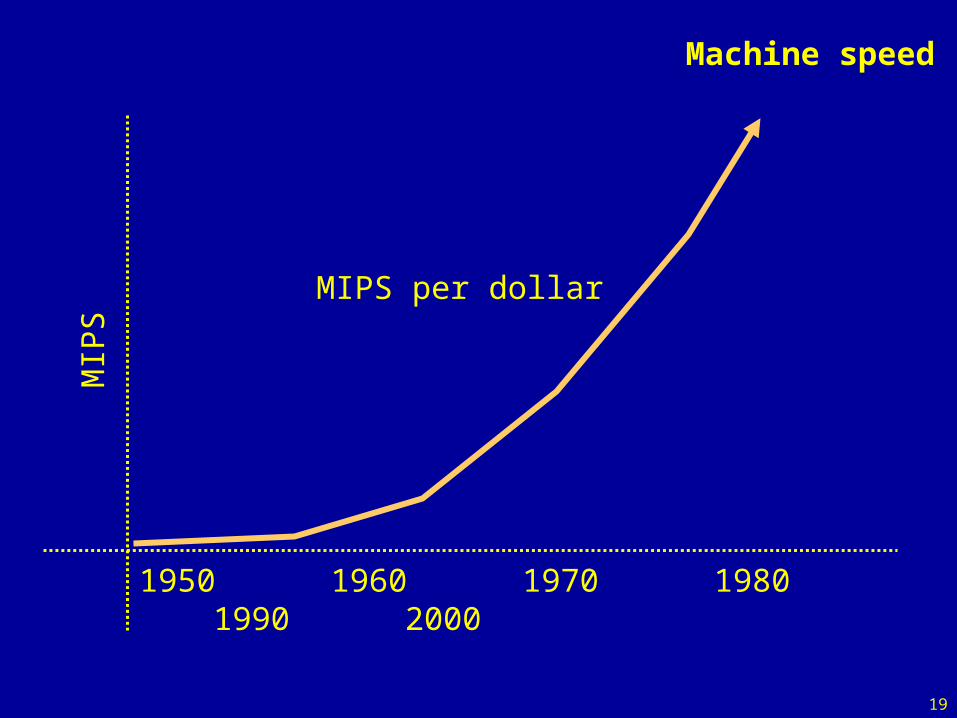
19
Machine speed
MIPS per dollar
1950 1960 1970 1980 1990 2000
MIP
S
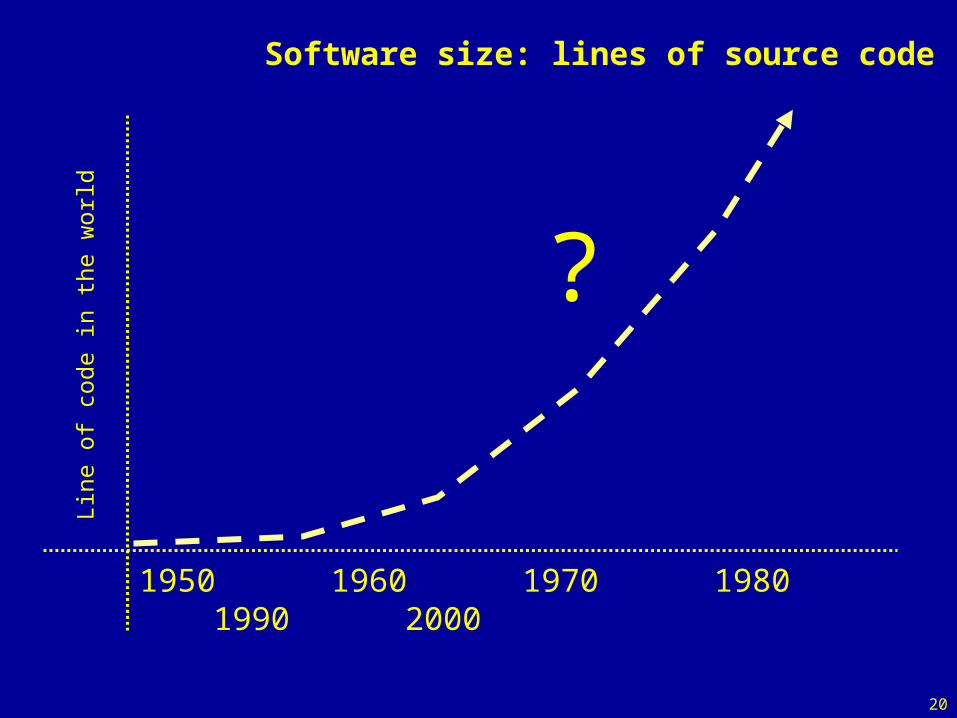
20
Software size: lines of source codeLi
ne o
f co
de in
the
wor
ld
1950 1960 1970 1980 1990 2000
?
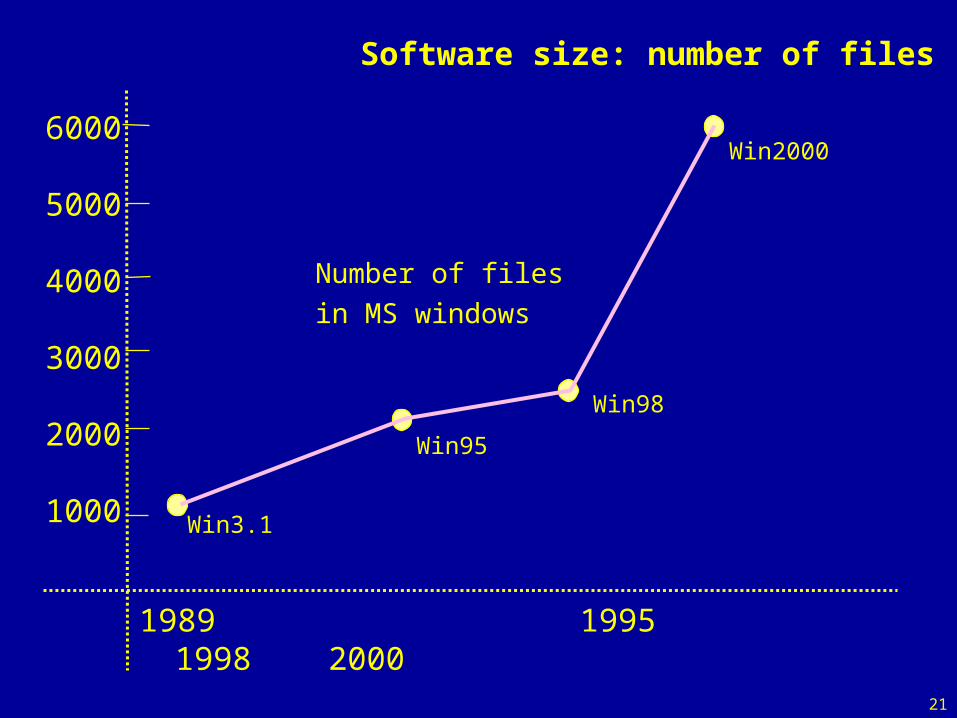
21
Software size: number of files
Number of files
in MS windows
1989 1995 1998 2000
6000
5000
4000
3000
2000
1000 Win3.1
Win95
Win98
Win2000
22
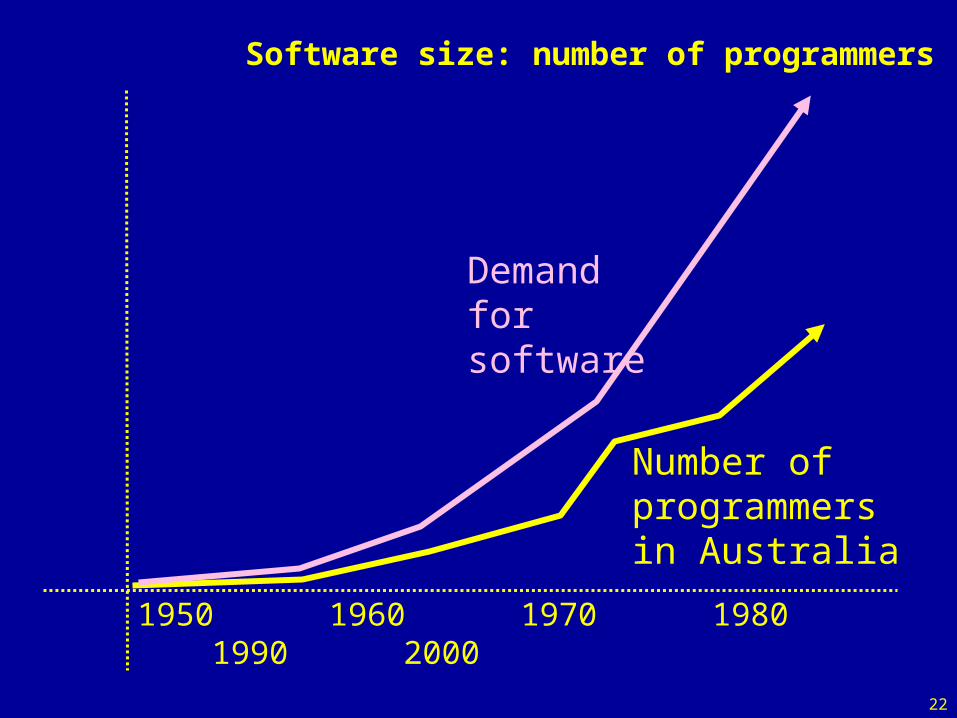
Software size: number of programmers
Number of programmers in Australia
1950 1960 1970 1980 1990 2000
Demand for software
23
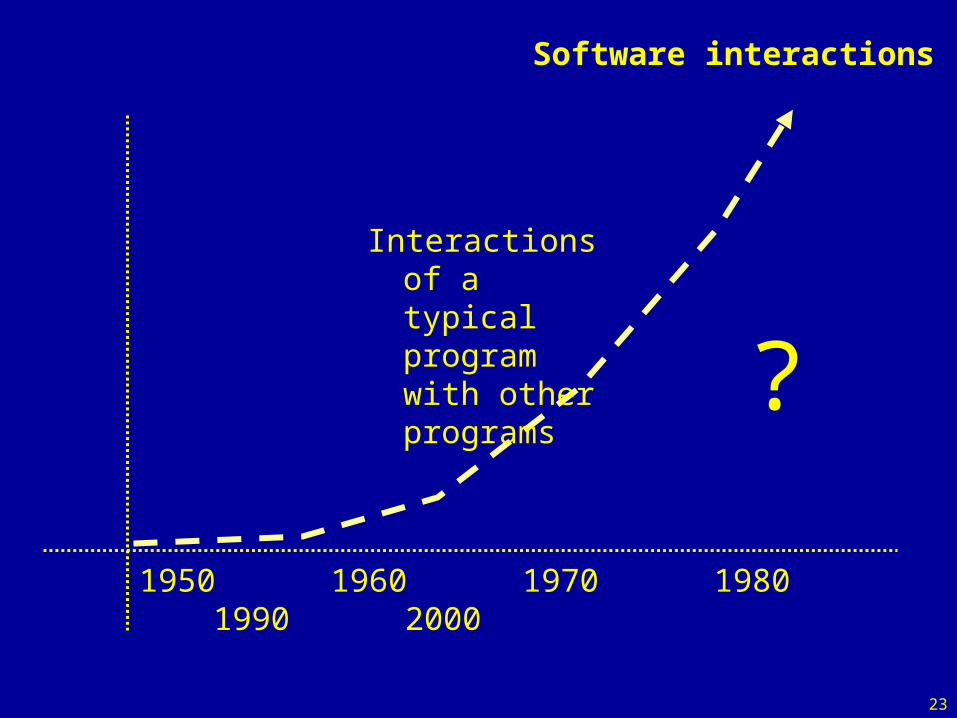
Software interactions
1950 1960 1970 1980 1990 2000
?
Interactions of a typical program with other programs
24
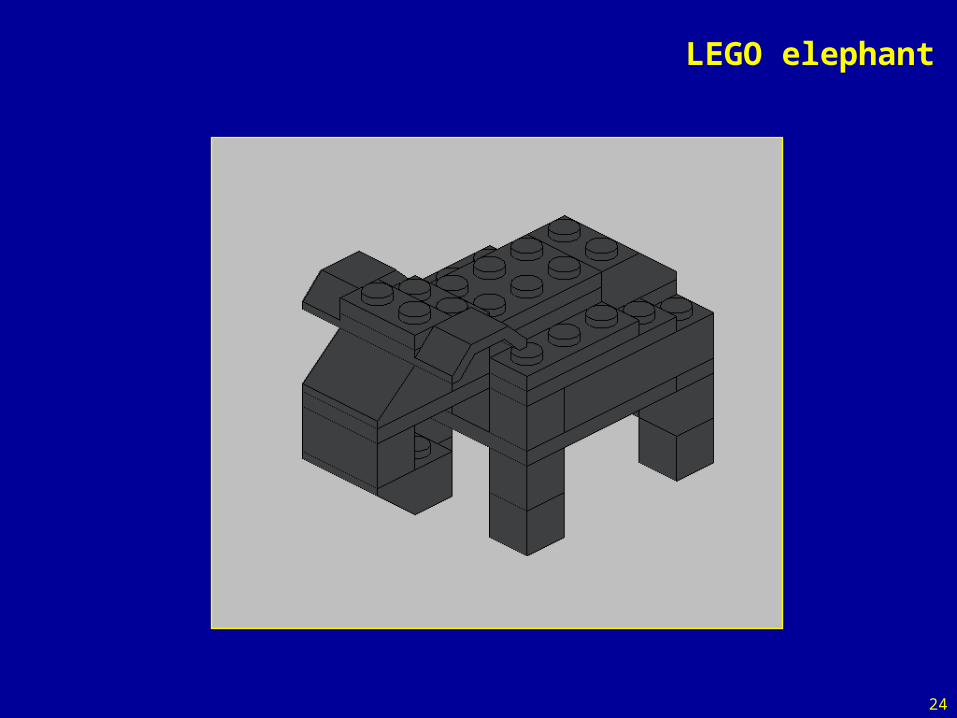
LEGO elephant
25
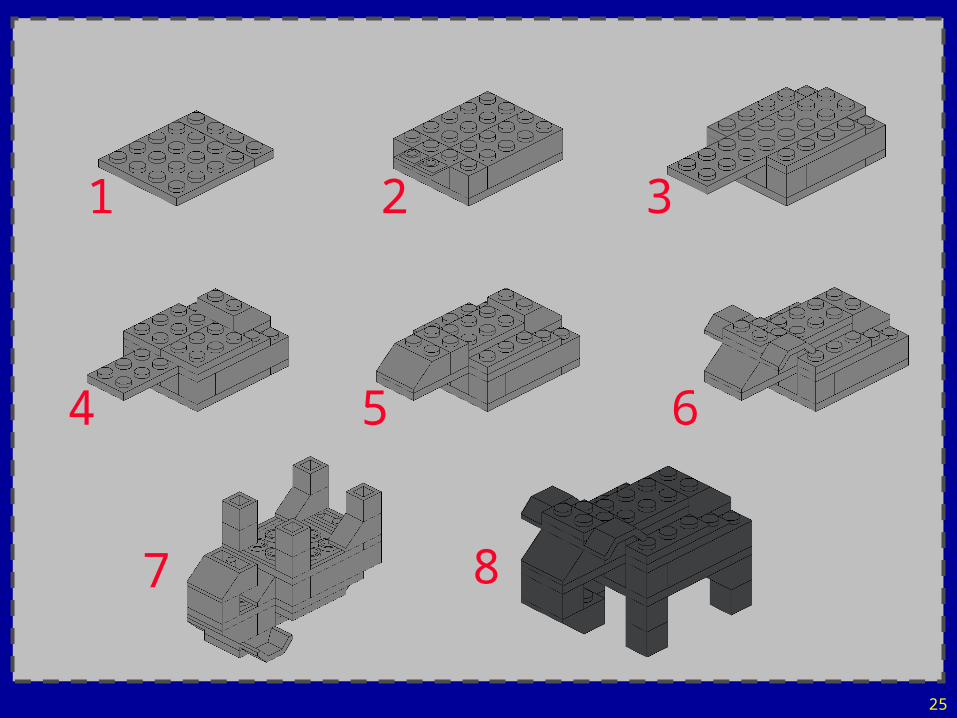
Design for a LEGO elephant
1 2 3
4 5 6
7 8

26
LEGO elephant
27
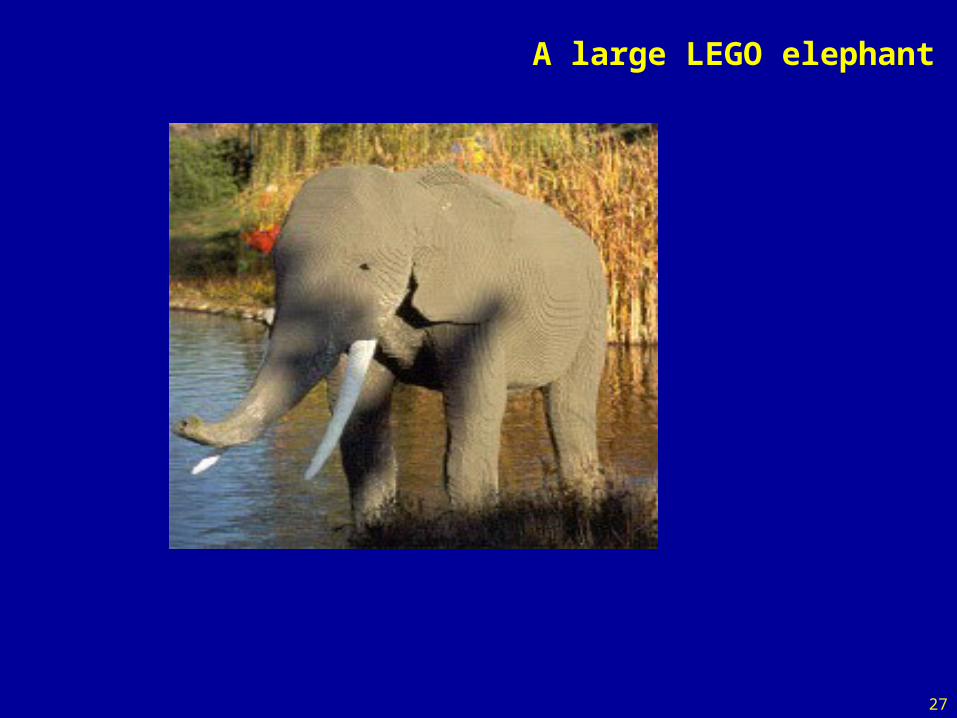
A large LEGO elephant

28
29
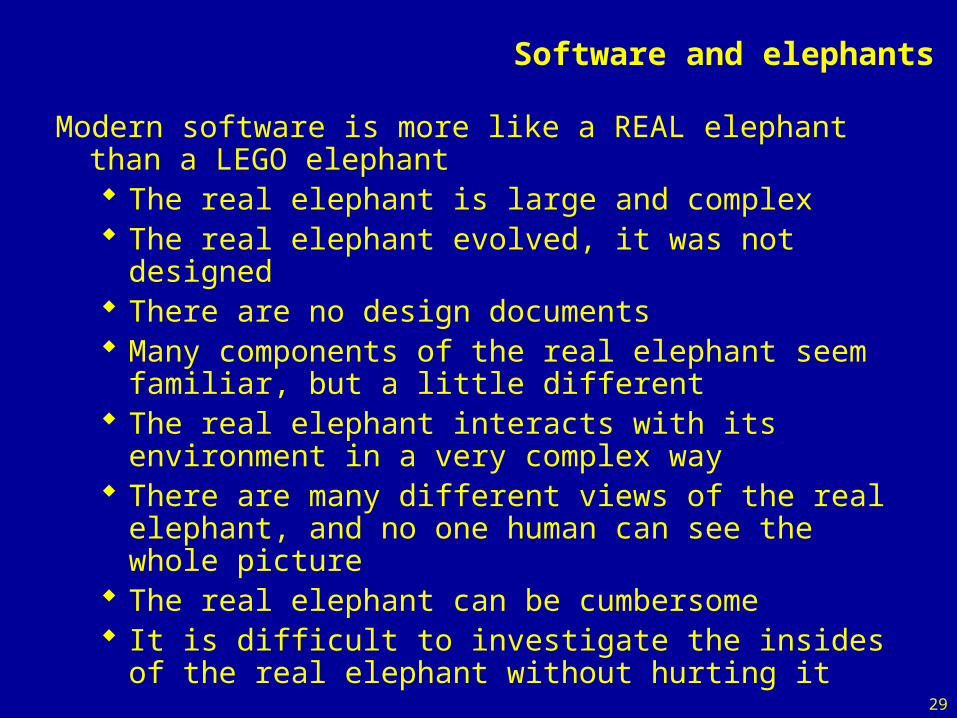
Software and elephants
Modern software is more like a REAL elephant than a LEGO elephant The real elephant is large and complex The real elephant evolved, it was not designed There are no design documents Many components of the real elephant seem familiar,
but a little different The real elephant interacts with its environment in a
very complex way There are many different views of the real elephant,
and no one human can see the whole picture The real elephant can be cumbersome It is difficult to investigate the insides of the real
elephant without hurting it
30
Software and elephants
• Understanding modern software systems is something like understanding real elephants
31
Softwareis
RelationalInformation
32
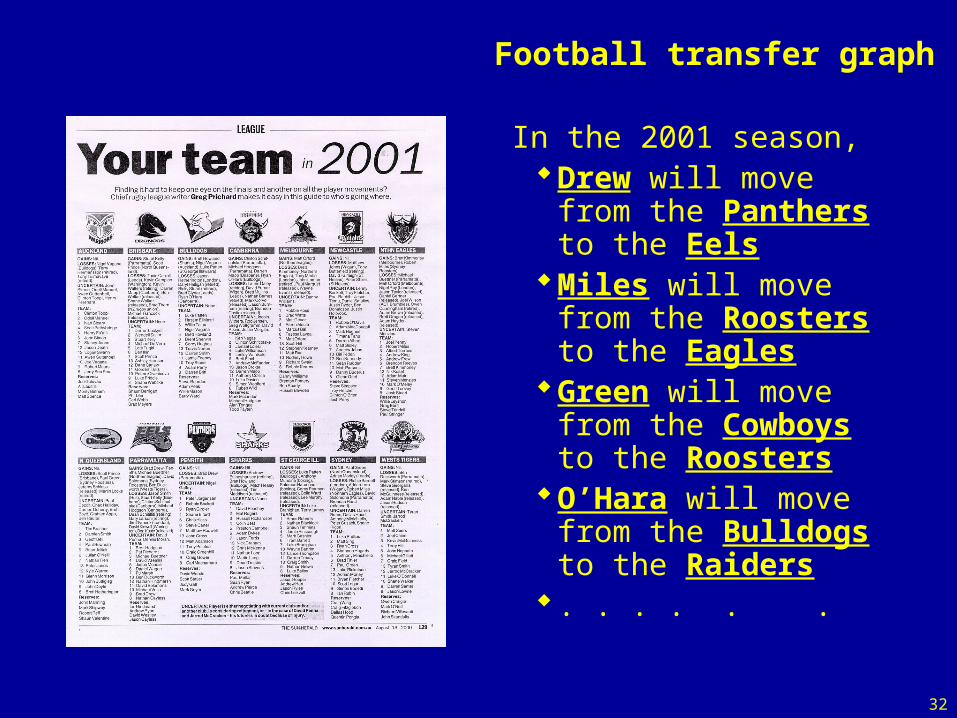
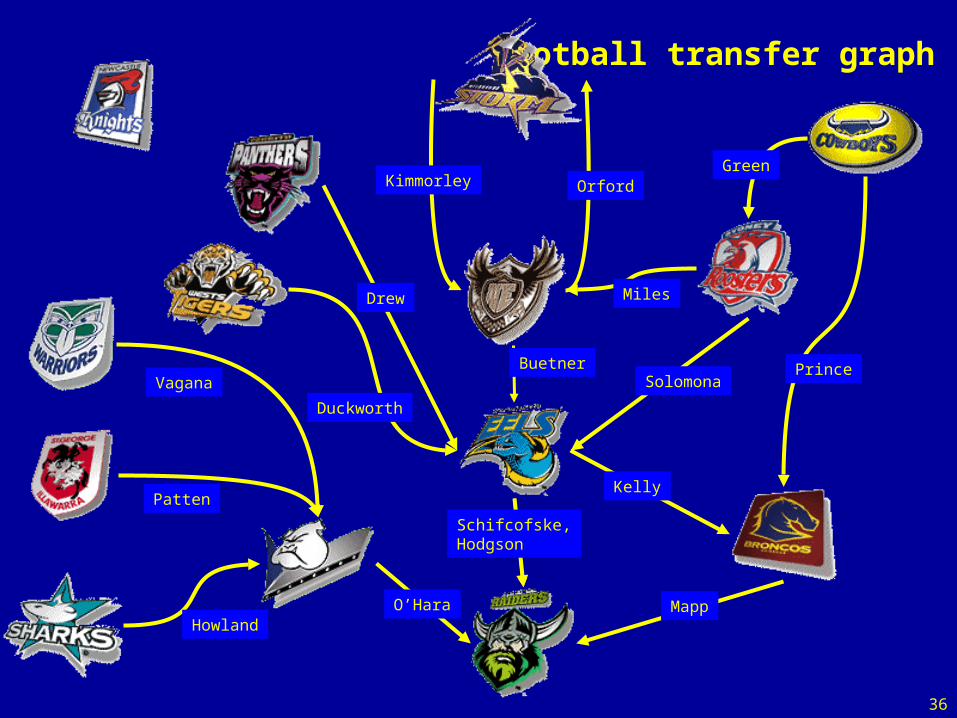
Football transfer graph
In the 2001 season,Drew will move from
the Panthers to the Eels
Miles will move from the Roosters to the Eagles
Green will move from the Cowboys to the Roosters
O’Hara will move from the Bulldogs to the Raiders
. . . . . .
33
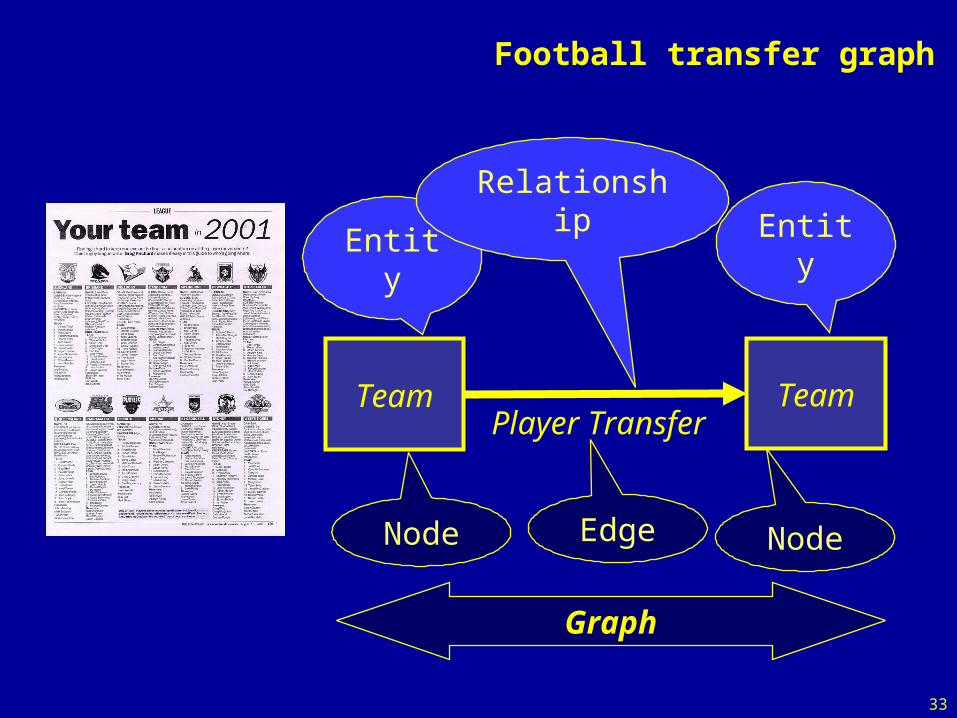
Football transfer graph
Team TeamPlayer Transfer
Node NodeEdge
Entity EntityRelationship
Graph
34
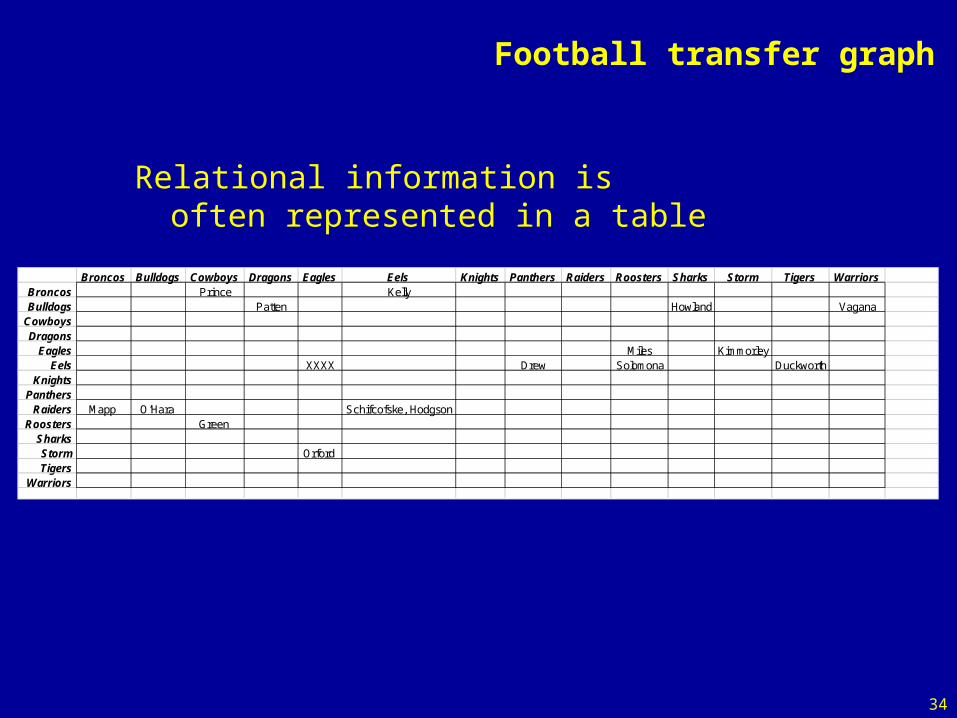
Football transfer graph
Relational information is often represented in a table
Broncos Bulldogs Cowboys Dragons Eagles Eels Knights Panthers Raiders Roosters Sharks Storm Tigers WarriorsBroncos Prince KellyBulldogs Patten Howland Vagana
CowboysDragons
Eagles Miles KimmorleyEels XXXX Drew Solomona Duckworth
KnightsPanthers
Raiders Mapp O’Hara Schifcofske, HodgsonRoosters Green
SharksStorm Orford Tigers
Warriors
35
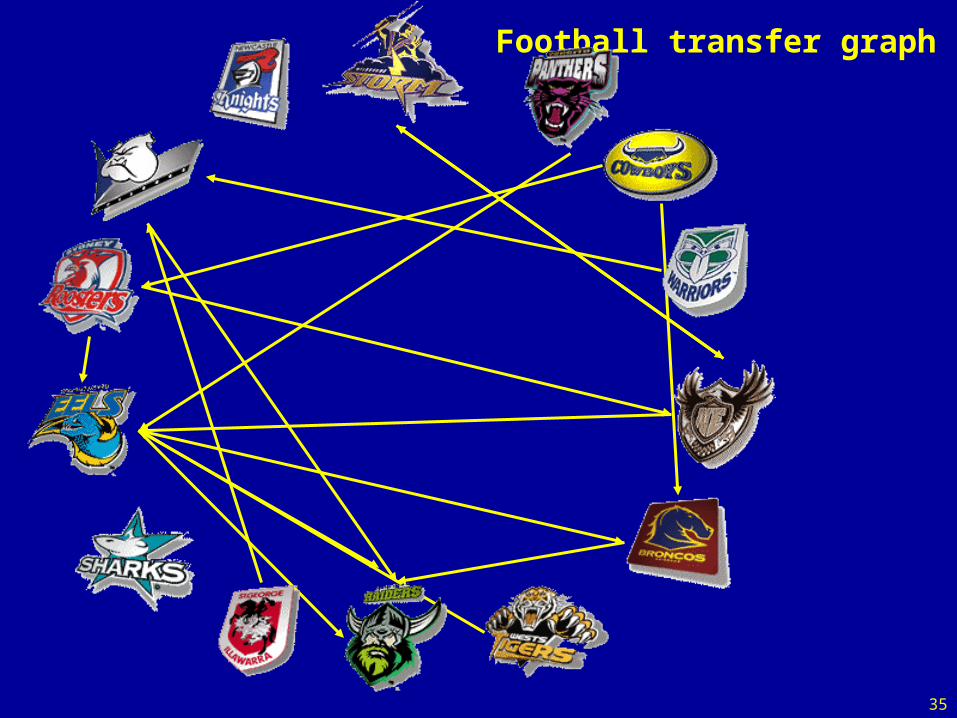
Football transfer graph
36
Football transfer graph
Kelly
Schifcofske,Hodgson
MappO’Hara
OrfordKimmorley
MilesDrew
Solomona
Duckworth
Prince
Green
Howland
Vagana
Patten
Buetner
37
A program#include <stdio.h> #include <types.h>#include <point.h>#include <edge.h>#include <vertex.h>#include <defs.h>define MAX(X,Y) (((X) >= (Y)) ? (X) : (Y))#define DeltaX 0.1
extern vertex *read_cgo();extern char *cmap[];
main(){
vertex *cgo;vertex *tree;int height;
/* * Read the cgo, Find the root of the tree, (coloured "root") * draw the tree, remove any added links, and write out the cgo again. */
if ((cgo = read_cgo()) == NULL) exit (0);for (tree = cgo; /* Find root of tree, colour */ tree && (strcmp (cmap[tree->v_colour], "root") != STREQUAL); tree = tree->v_next);Draw_Subtree(tree, &height);rm_links(cgo);write_cgo(cgo);
}
/* * Removes the added links from
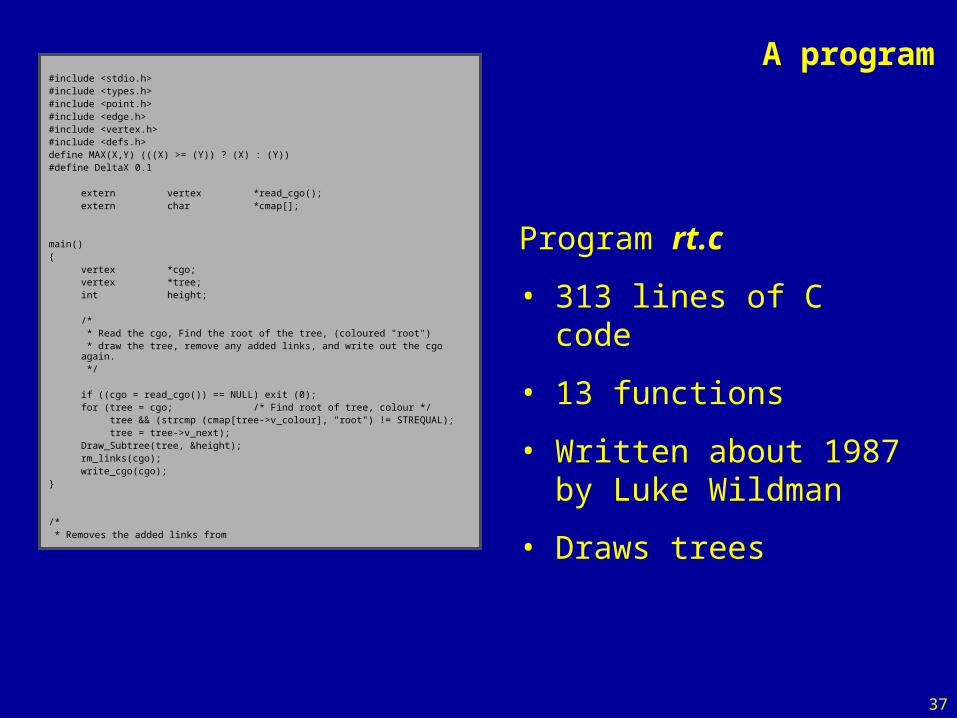
Program rt.c
• 313 lines of C code
• 13 functions
• Written about 1987 by Luke Wildman
• Draws trees
38
Program call graph
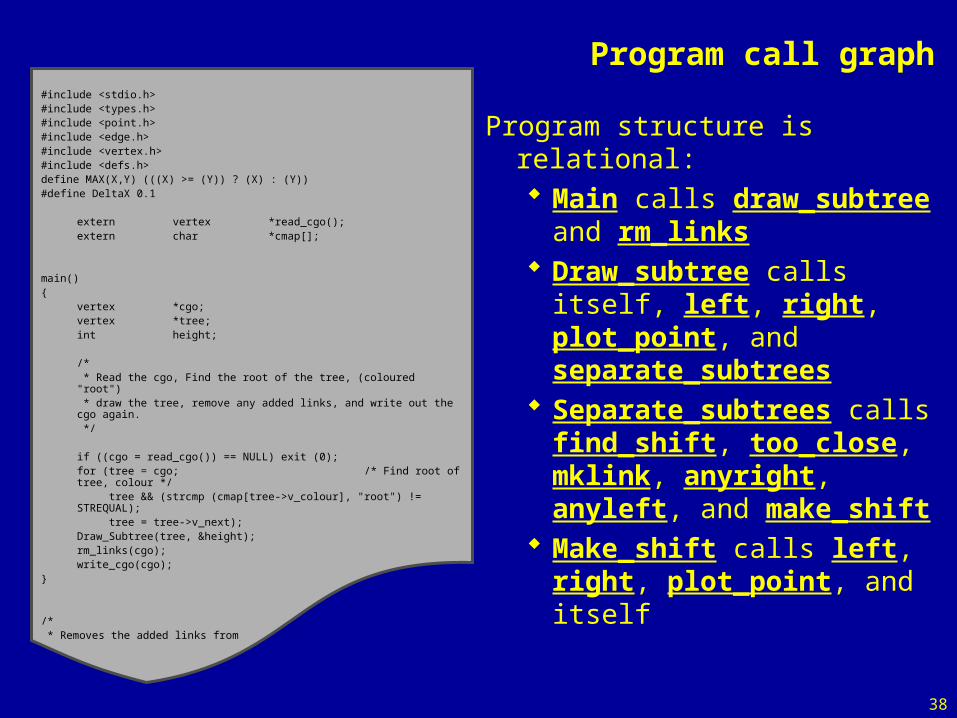
Program structure is relational: Main calls draw_subtree
and rm_links Draw_subtree calls itself,
left, right, plot_point, and separate_subtrees
Separate_subtrees calls find_shift, too_close, mklink, anyright, anyleft, and make_shift
Make_shift calls left, right, plot_point, and itself
#include <stdio.h> #include <types.h>#include <point.h>#include <edge.h>#include <vertex.h>#include <defs.h>define MAX(X,Y) (((X) >= (Y)) ? (X) : (Y))#define DeltaX 0.1
extern vertex *read_cgo();extern char *cmap[];
main(){
vertex *cgo;vertex *tree;int height;
/* * Read the cgo, Find the root of the tree, (coloured "root") * draw the tree, remove any added links, and write out the cgo again. */
if ((cgo = read_cgo()) == NULL) exit (0);for (tree = cgo; /* Find root of tree, colour */ tree && (strcmp (cmap[tree->v_colour], "root") != STREQUAL); tree = tree->v_next);Draw_Subtree(tree, &height);rm_links(cgo);write_cgo(cgo);
}
/* * Removes the added links from
39
Program call graph
#include <stdio.h> #include <types.h>#include <point.h>#include <edge.h>#include <vertex.h>#include <defs.h>define MAX(X,Y) (((X) >= (Y)) ? (X) :
#define DeltaX 0.1
extern vertex*read_cgo();extern char*cmap[];
main(){
vertex *cgo;vertex *tree;int height;
/* * Read the cgo, Find the root of the tree, (coloured "root") * draw the tree, remove any added links, and write out the cgo again. */
if ((cgo = read_cgo())for (tree =
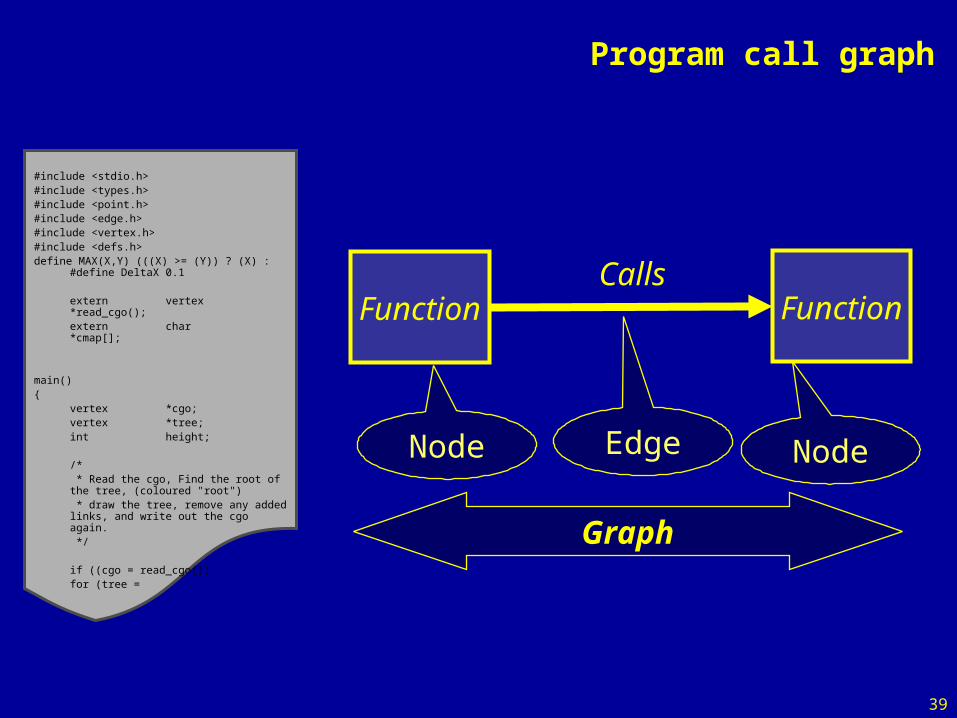
Function FunctionCalls
Node NodeEdge
Graph
40
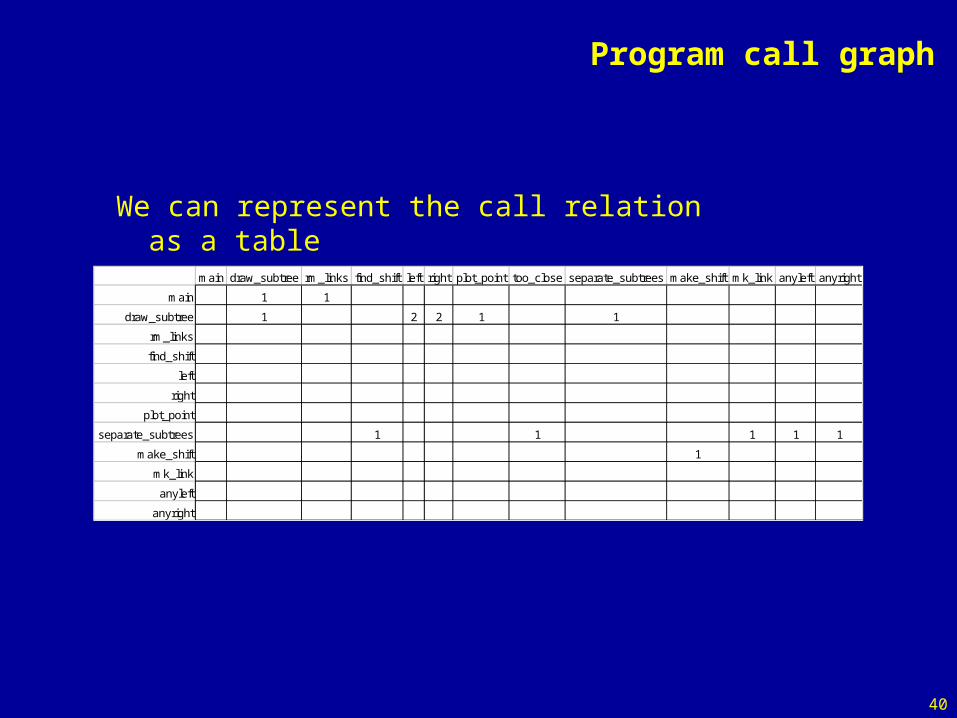
Program call graph
We can represent the call relation as a table
main draw_subtree rm_links find_shift left right plot_point too_close separate_subtrees make_shift mk_link anyleft anyright
main 1 1
draw_subtree 1 2 2 1 1
rm_links
find_shift
left
right
plot_point
separate_subtrees 1 1 1 1 1
make_shift 1
mk_link
anyleft
anyright
41
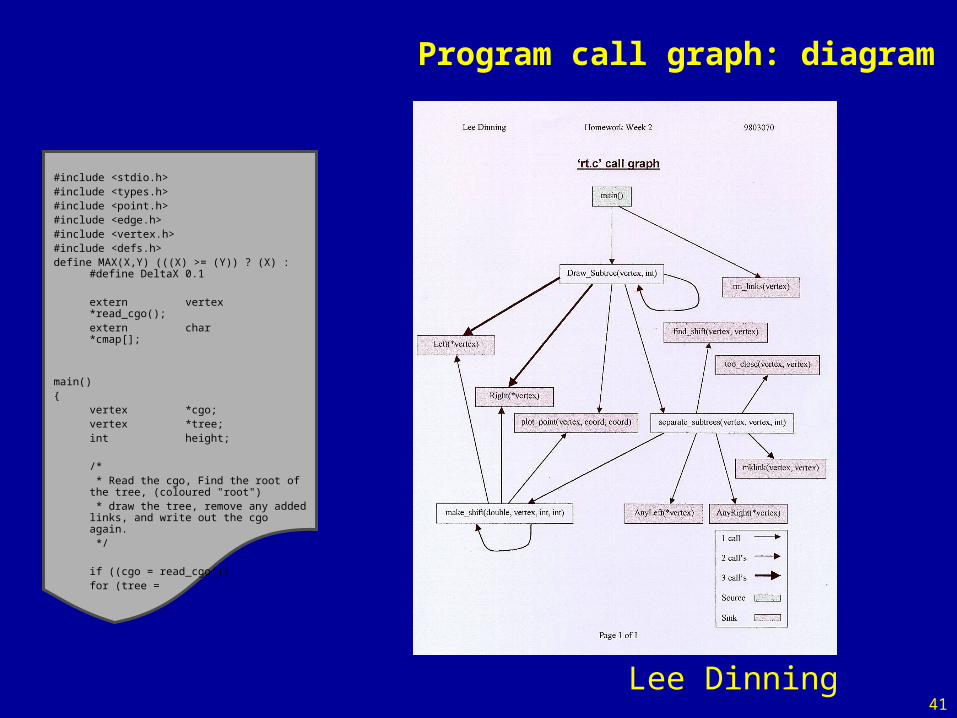
Program call graph: diagram
#include <stdio.h> #include <types.h>#include <point.h>#include <edge.h>#include <vertex.h>#include <defs.h>define MAX(X,Y) (((X) >= (Y)) ? (X) :
#define DeltaX 0.1
extern vertex*read_cgo();extern char*cmap[];
main(){
vertex *cgo;vertex *tree;int height;
/* * Read the cgo, Find the root of the tree, (coloured "root") * draw the tree, remove any added links, and write out the cgo again. */
if ((cgo = read_cgo())for (tree =
Lee Dinning
42
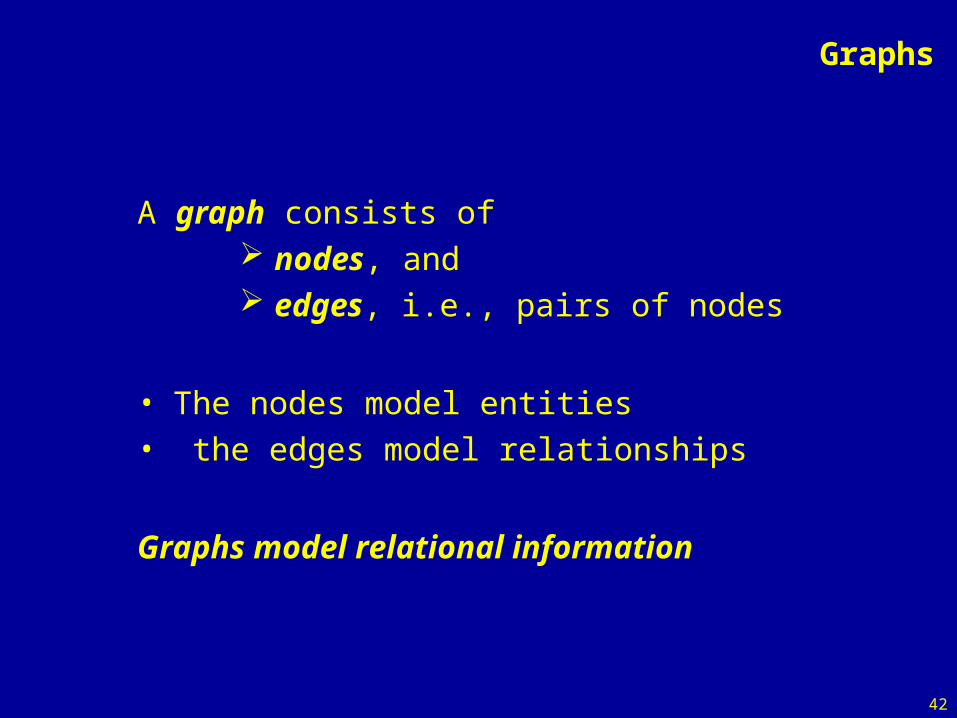
Graphs
A graph consists of nodes, and edges, i.e., pairs of nodes
• The nodes model entities• the edges model relationships
Graphs model relational information
43
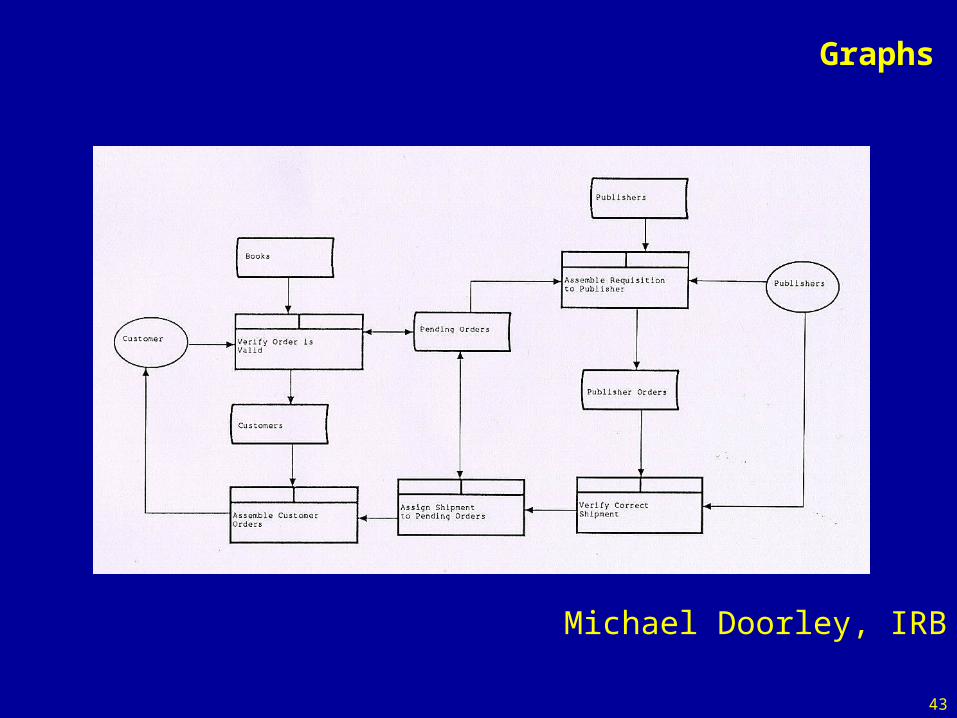
Graphs
Michael Doorley, IRB
44
Graphs and software
Graphs are used widely as software models Call graphs Use-case diagrams Slicing diagrams Class hierarchies ER models NIAM models Data flow diagrams Control flow diagrams
45
Graphs and software
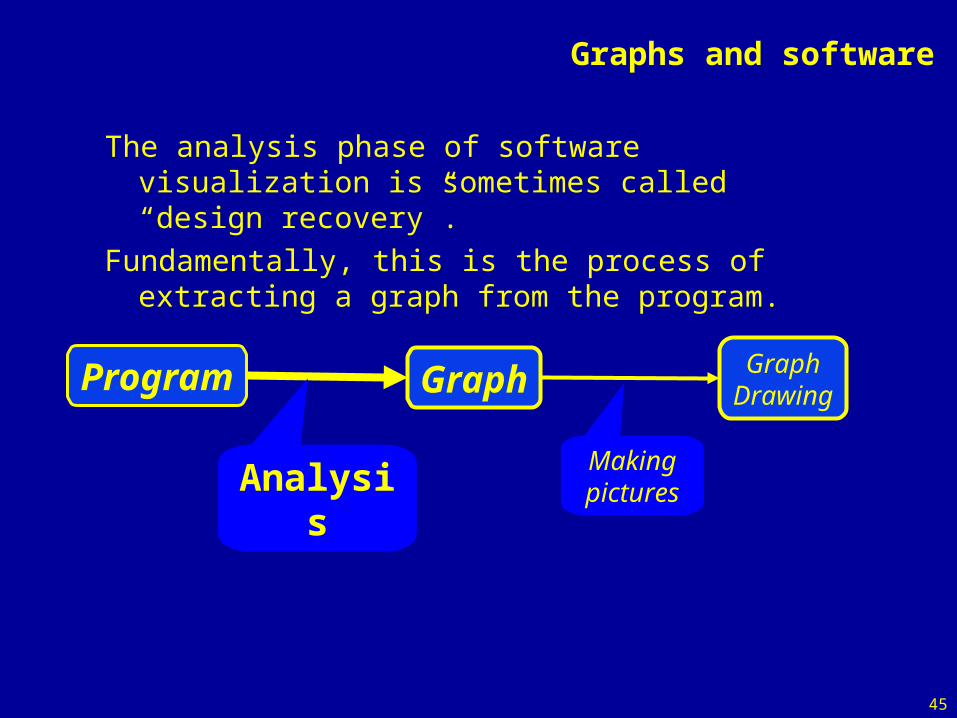
The analysis phase of software visualization is sometimes called “design recovery”.
Fundamentally, this is the process of extracting a graph from the program.
Program Graph GraphDrawing
Analysis Makingpictures
46
How toUntangle
aDiagram
47
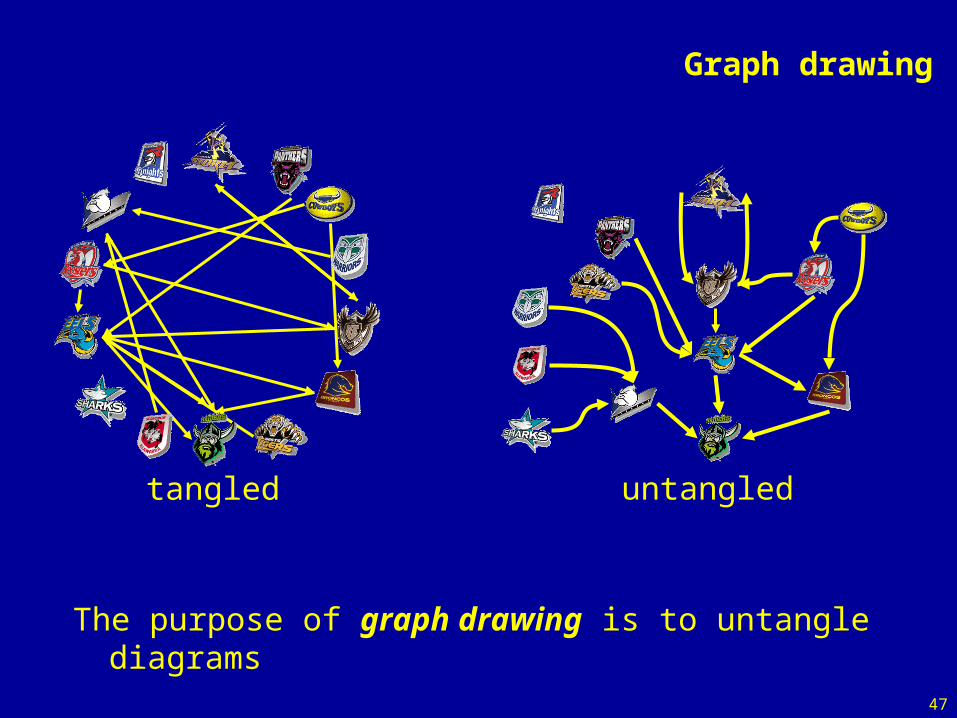
Graph drawing
The purpose of graph drawing is to untangle diagrams
untangledtangled
48
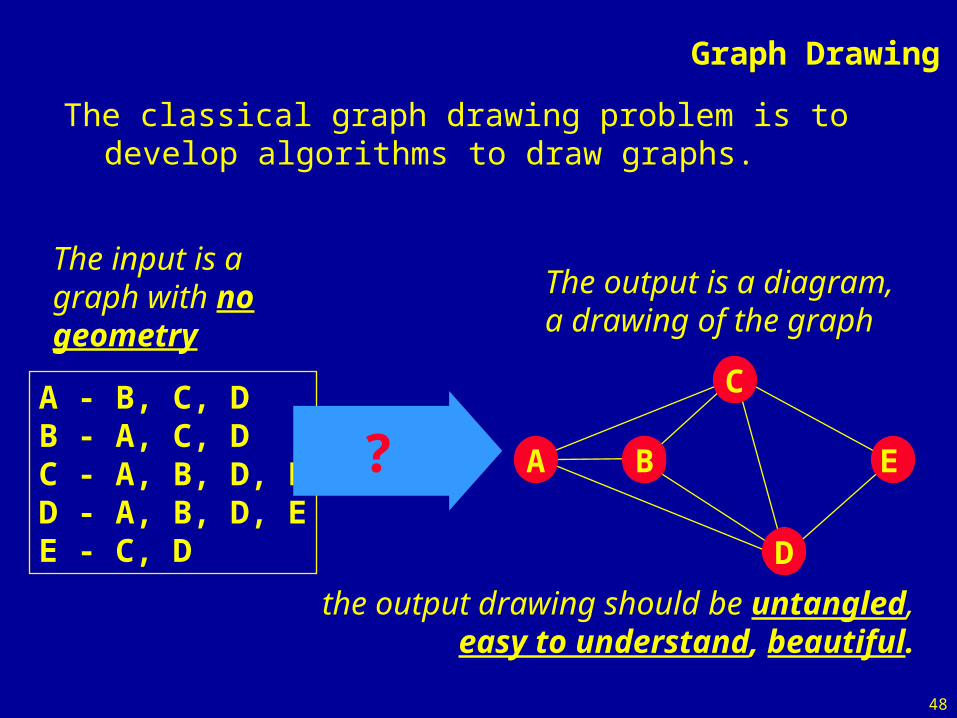
Graph Drawing
The classical graph drawing problem is to develop algorithms to draw graphs.
A - B, C, DB - A, C, DC - A, B, D, ED - A, B, D, EE - C, D
The input is a graph with no geometry
A B
D
C
E?
The output is a diagram, a drawing of the graph
the output drawing should be untangled, easy to understand, beautiful.
49
Graph Drawing
There are many methods to draw untangled pictures of graphs.
Two such methods:
1. GIOTTO method
2. Force-directed method
50
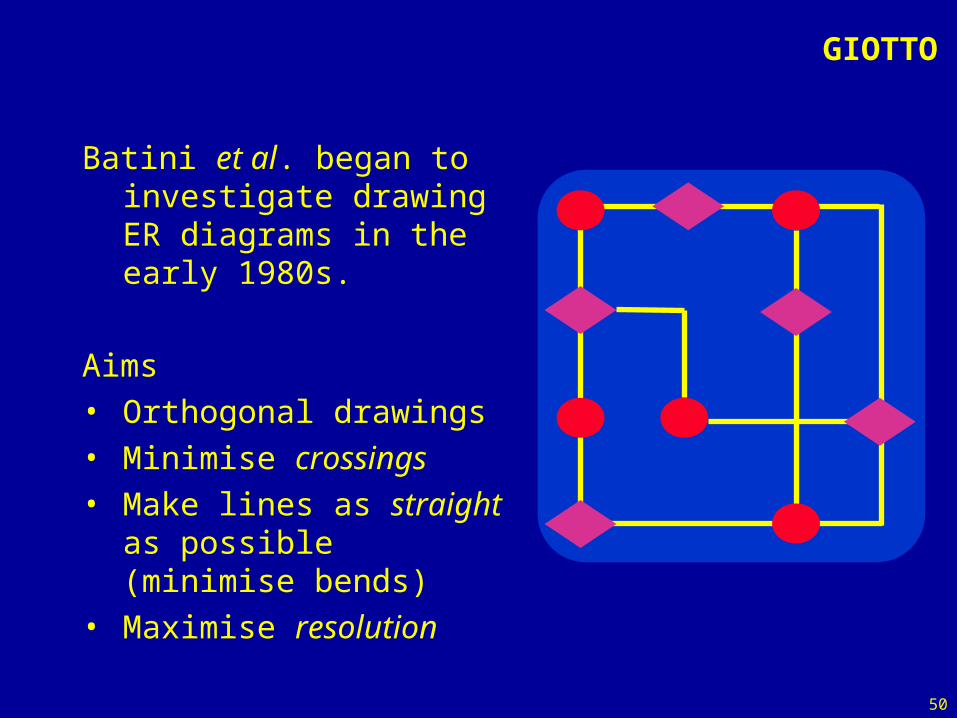
GIOTTO
Batini et al. began to investigate drawing ER diagrams in the early 1980s.
Aims• Orthogonal drawings• Minimise crossings• Make lines as straight as
possible (minimise bends)• Maximise resolution
51
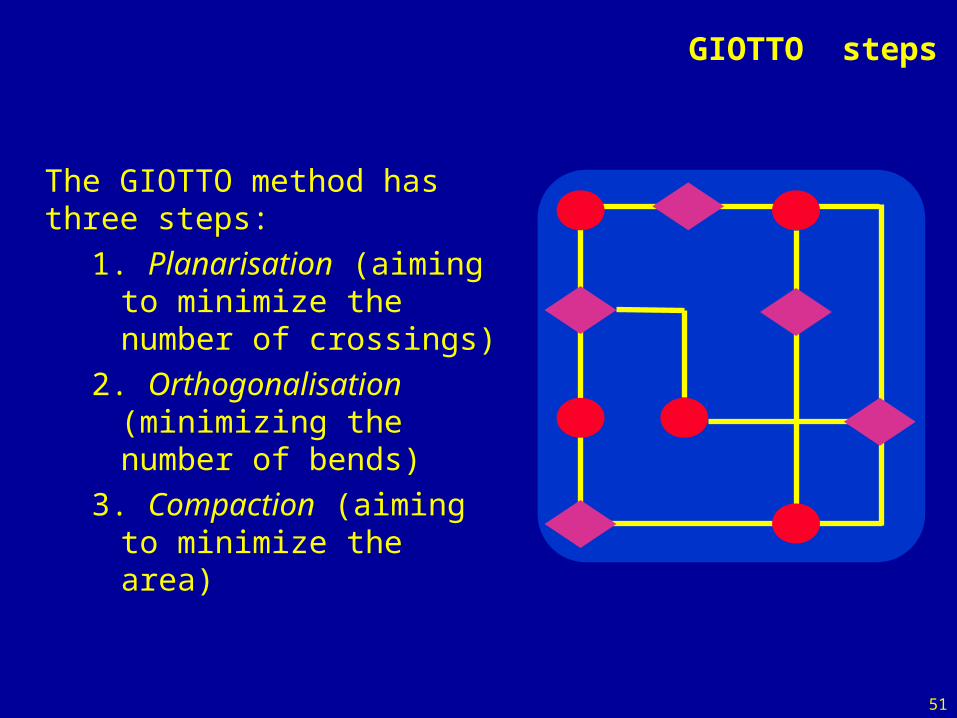
GIOTTO steps
The GIOTTO method has three steps:
1. Planarisation (aiming to minimize the number of crossings)
2. Orthogonalisation (minimizing the number of bends)
3. Compaction (aiming to minimize the area)
52
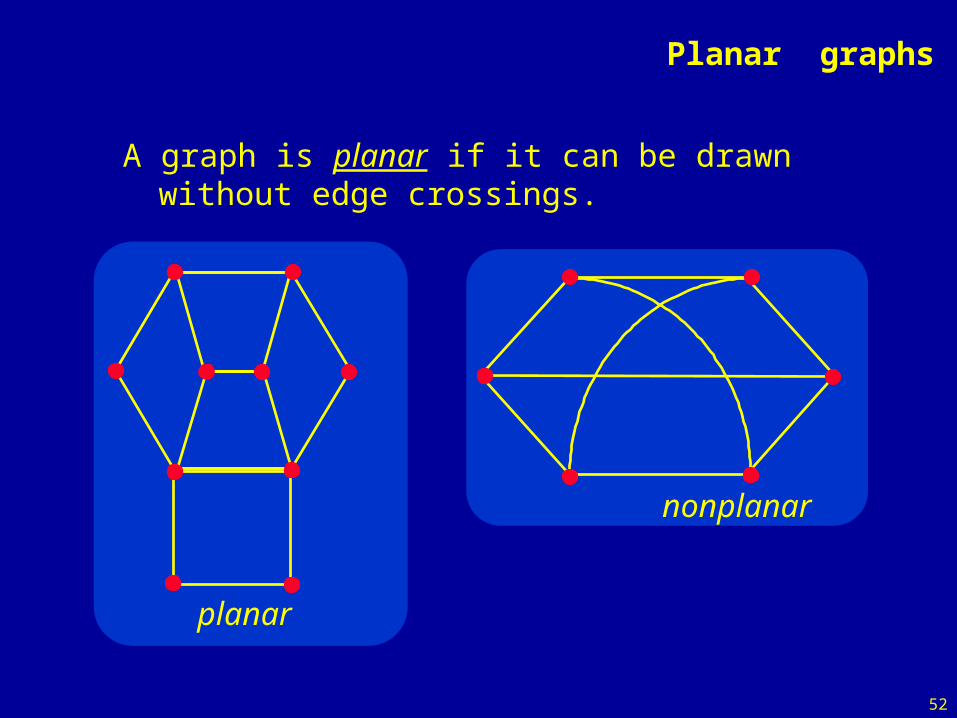
Planar graphs
A graph is planar if it can be drawn without edge crossings.
planar
nonplanar
53
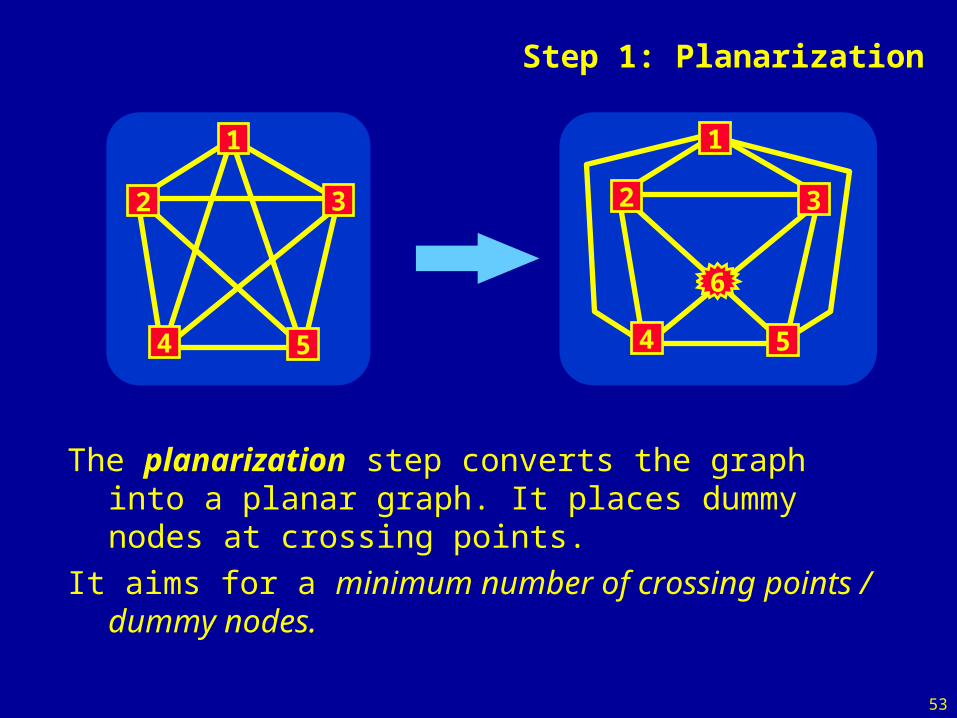
Step 1: Planarization
1
2
4 5
3
6
54
32
1
The planarization step converts the graph into a planar graph. It places dummy nodes at crossing points.
It aims for a minimum number of crossing points / dummy nodes.
54
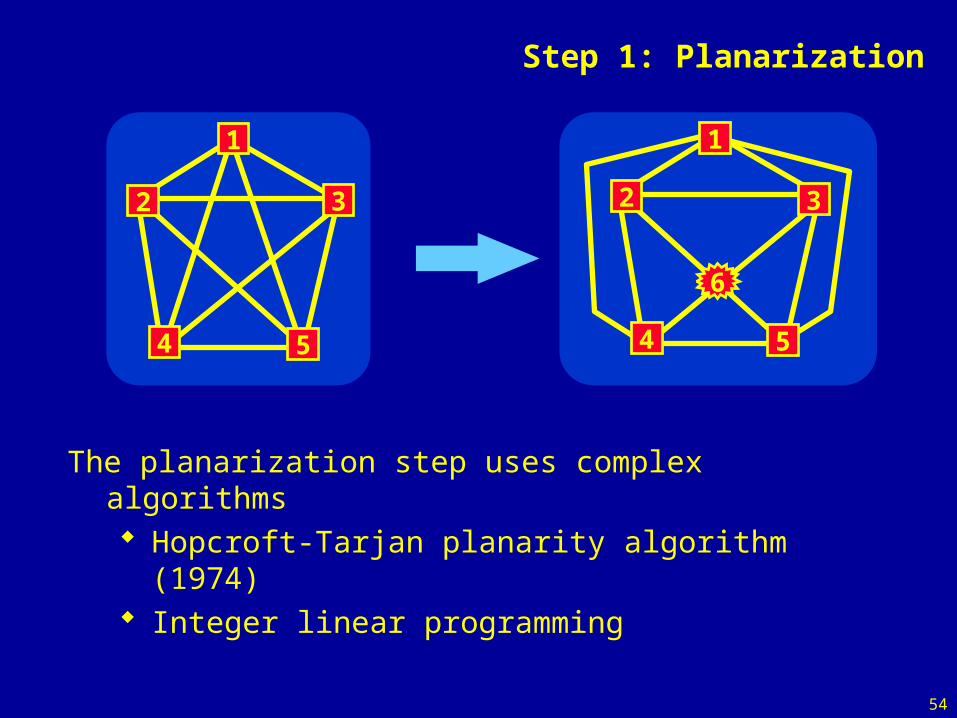
Step 1: Planarization
1
2
4 5
3
6
54
32
1
The planarization step uses complex algorithms Hopcroft-Tarjan planarity algorithm (1974) Integer linear programming
55
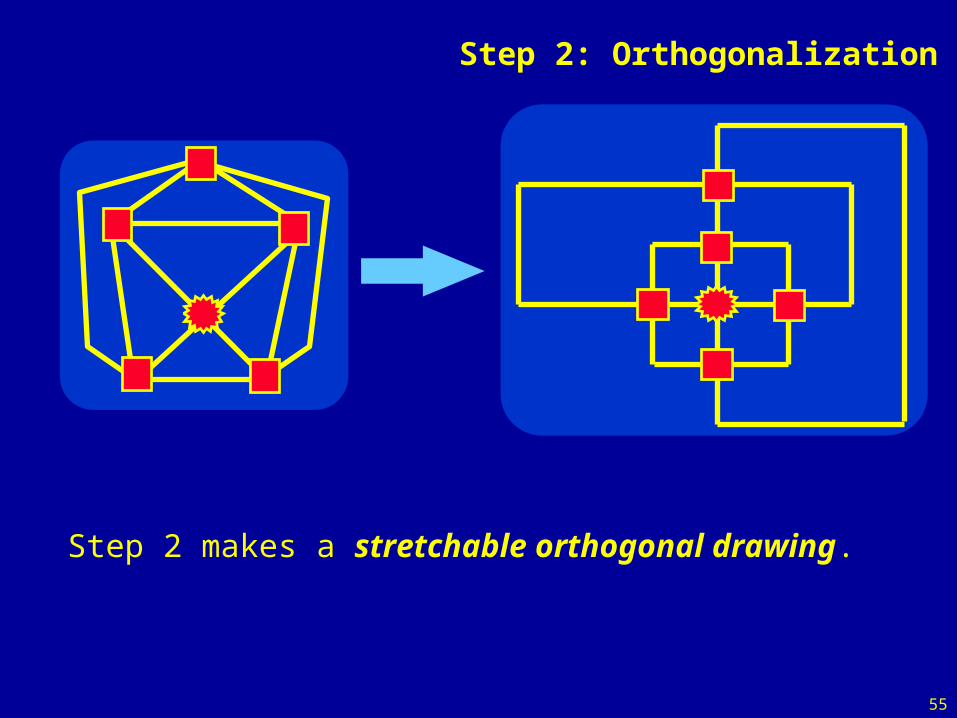
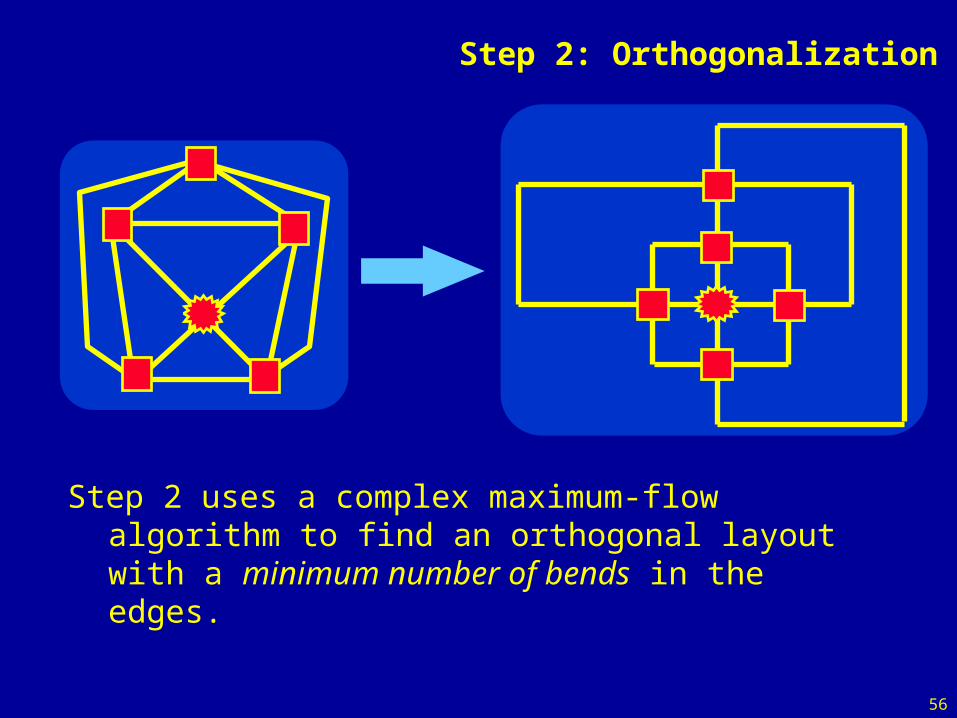
Step 2: Orthogonalization
Step 2 makes a stretchable orthogonal drawing.
56
Step 2: Orthogonalization
Step 2 uses a complex maximum-flow algorithm to find an orthogonal layout with a minimum number of bends in the edges.
57
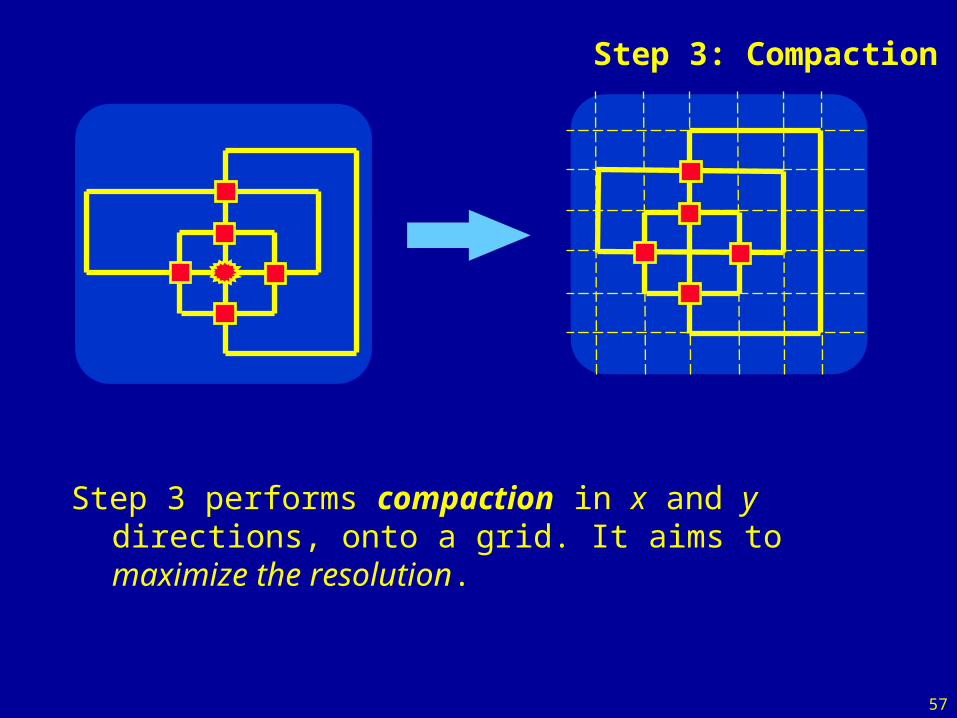
Step 3: Compaction
Step 3 performs compaction in x and y directions, onto a grid. It aims to maximize the resolution.
58
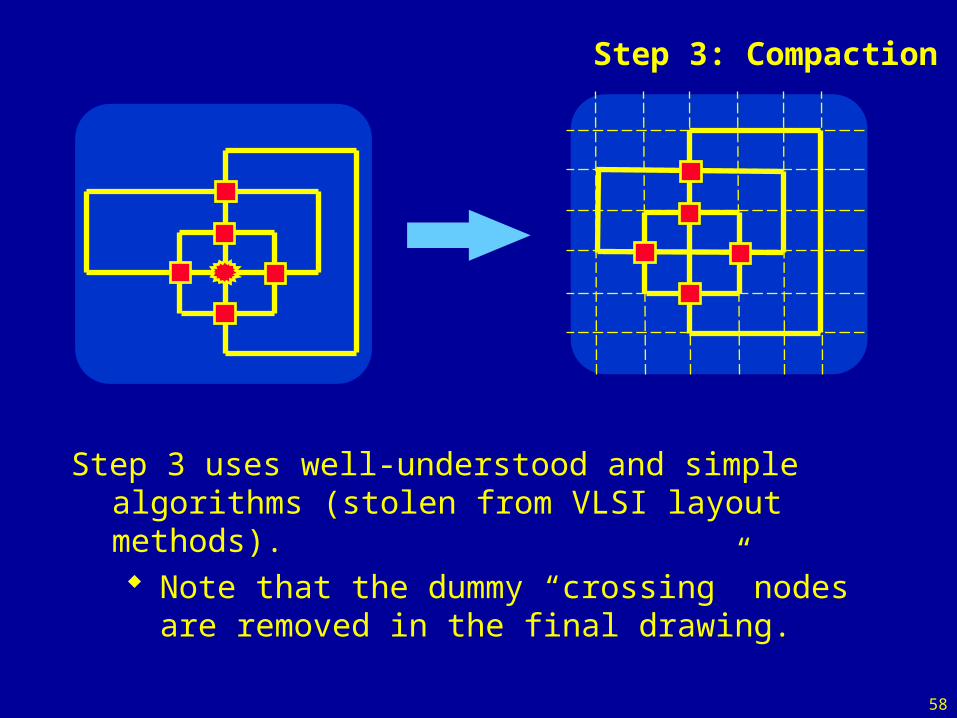
Step 3: Compaction
Step 3 uses well-understood and simple algorithms (stolen from VLSI layout methods). Note that the dummy “crossing” nodes are removed
in the final drawing.

59
GIOTTO
GIOTTO Many subsequent graph drawing methods have been
based on the GIOTTO approach. GIOTTO and its descendants give very readable
drawings of undirected graphs. The methods are complex, and difficult to implement.
Petra Mutzel

60
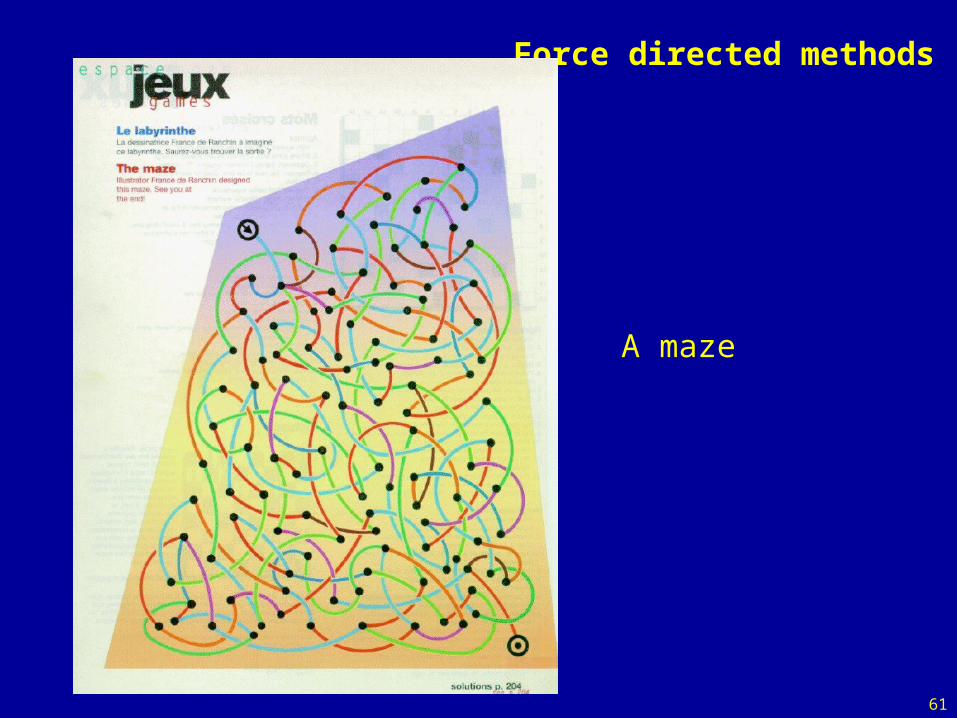
Force directed methods
Force directed methods are quite popular.
1. Place forces between pairs of nodes; for example:
• spring forces for edges• gravitational repulsion for nonedges
2. Find a zero force configuration.
1. 2.
61
Force directed methods
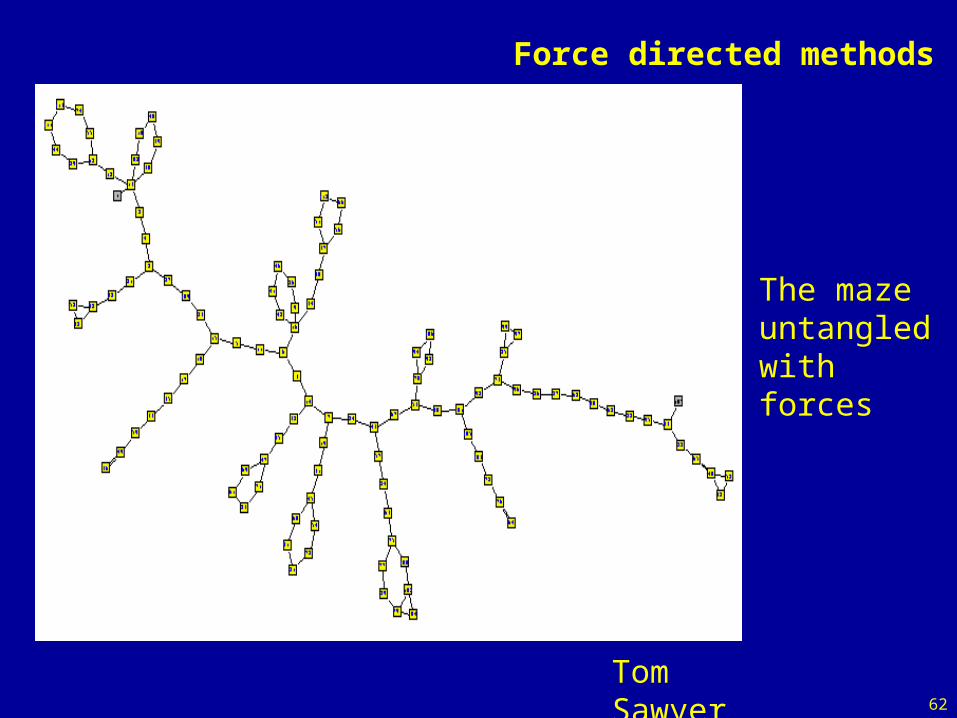
A maze
62
Force directed methods
The maze untangled with forces
Tom Sawyer
63
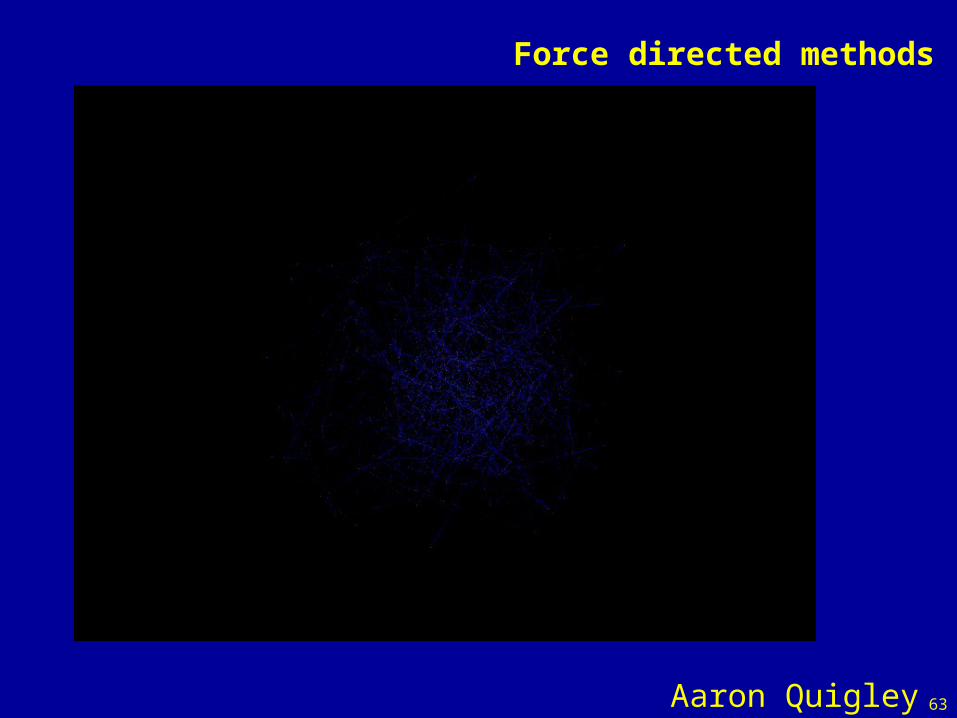
Force directed methods
Aaron Quigley
64
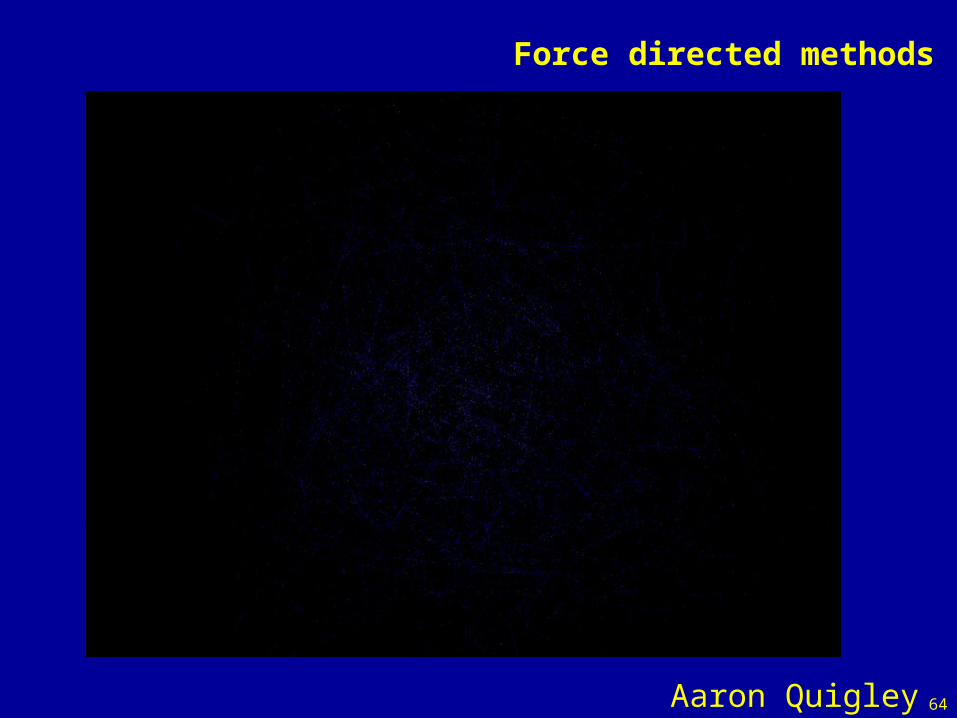
Force directed methods
Aaron Quigley

65
Force directed methods
Force directed methods give medium quality drawings
Stephen North, Lucent
66
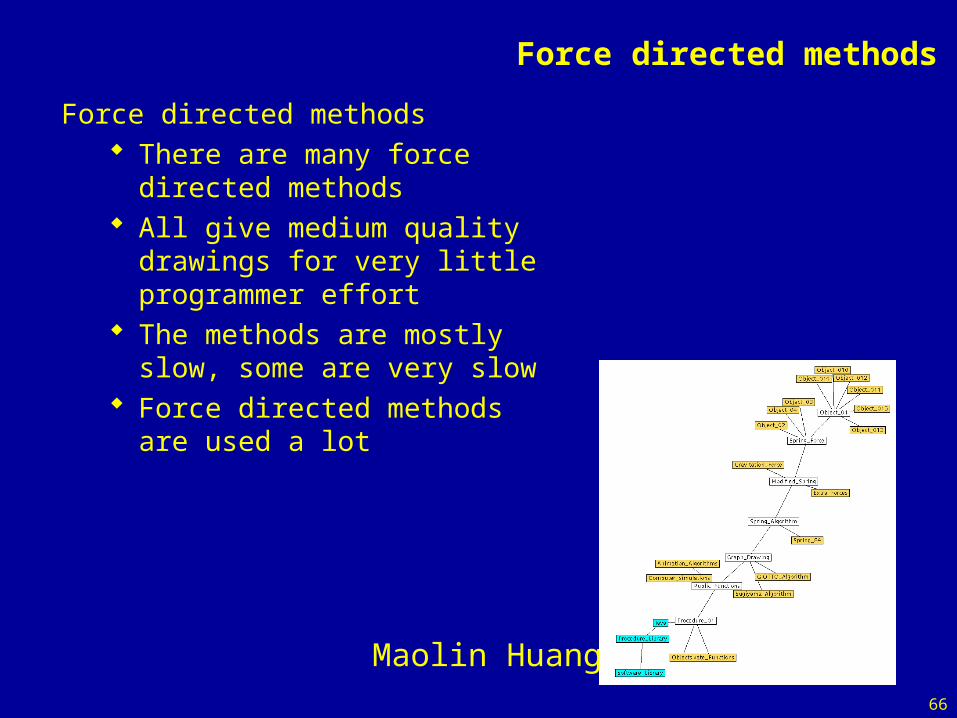
Force directed methods
Force directed methods There are many force
directed methods All give medium quality
drawings for very little programmer effort
The methods are mostly slow, some are very slow
Force directed methods are used a lot
Maolin Huang
67
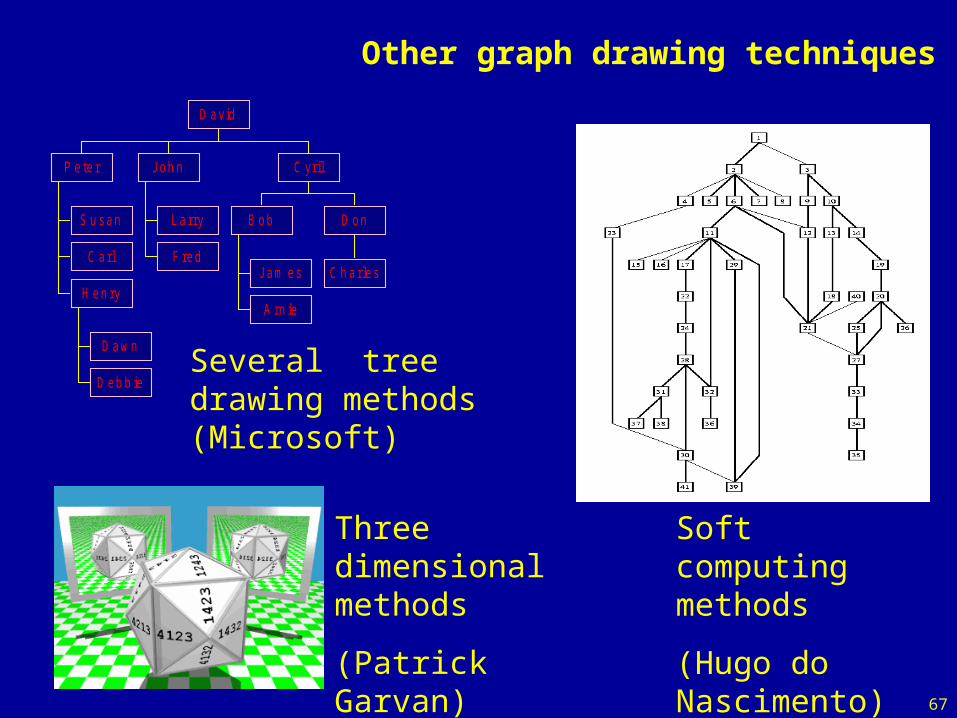
Other graph drawing techniques
Three dimensional methods
(Patrick Garvan)
Several tree drawing methods (Microsoft)
S u san
C arl
D aw n
D eb b ie
H en ry
P ete r
L arry
F red
Joh n
Jam es
A rn ie
B ob
C h arles
D on
C yril
D avid
Soft computing methods
(Hugo do Nascimento)
68
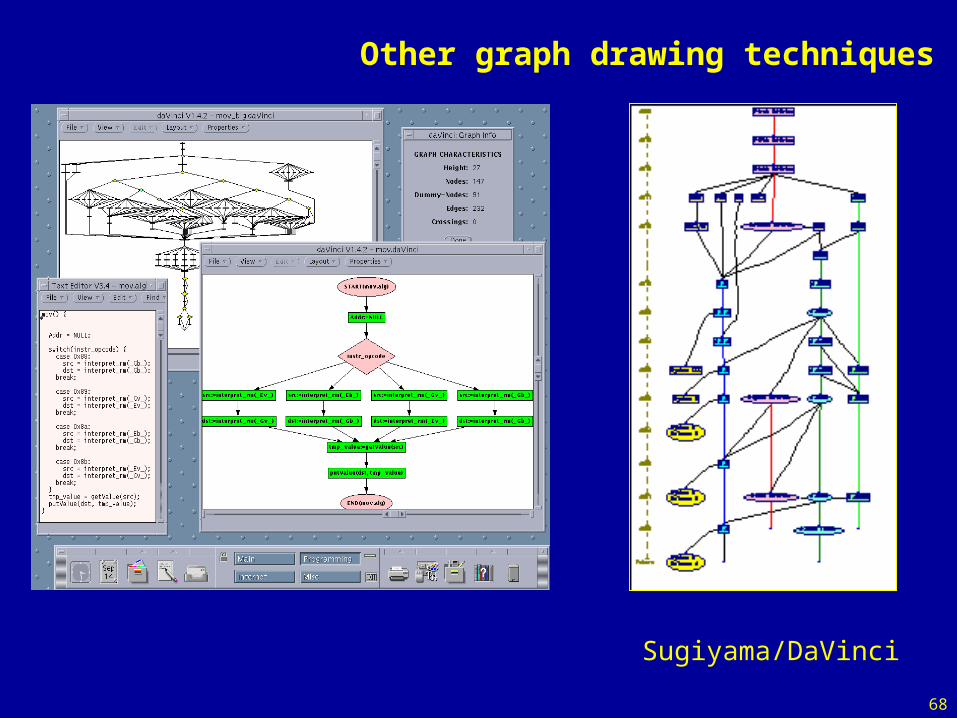
Other graph drawing techniques
Sugiyama/DaVinci
69
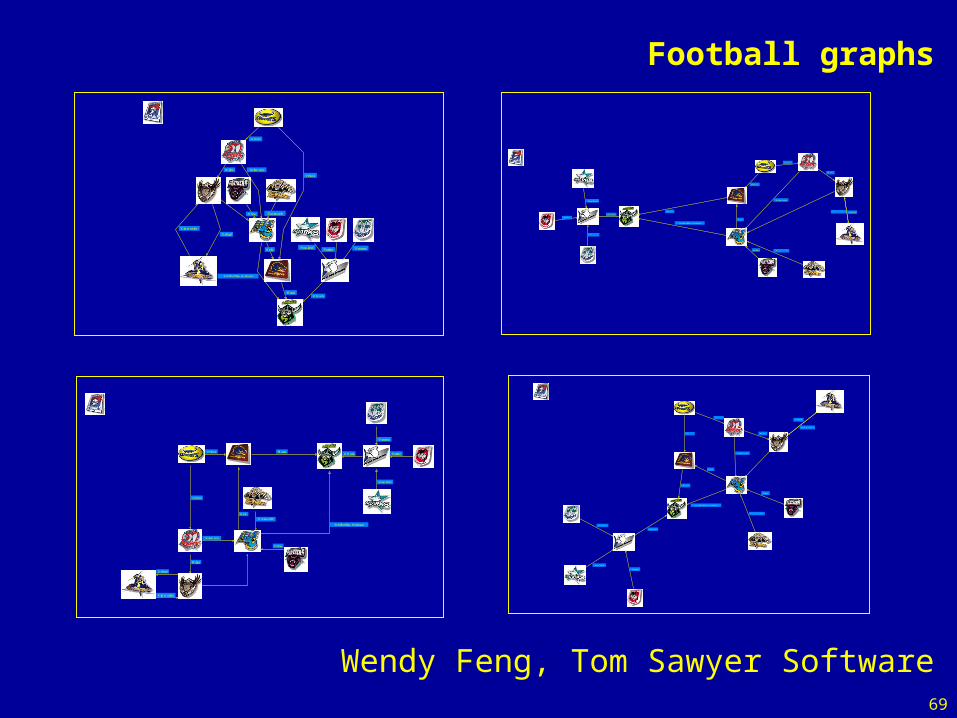
Football graphs
Vagana
Patten
Howland
Drew
Duckworth
O'Hara
Schifcofske, Hodgson
Orford
Kimmorley
Miles
Green
Solomana
Kely
Mapp
Prince
Vagana
Patten
Howland
Drew
Duckworth
O'Hara
Schifcofske, Hodgson
Orford
Kim m orley
Miles
Green
Solom ana
Kely
MappPrince
VaganaPattenHowland
Drew Duckworth
O'Hara
Schifcofske, Hodgson
Orford
Kim m orley
Miles
Green
Solom ana
Kely
Mapp
Prince
Vagana
Patten
Howland
Drew Duckworth
O'Hara
Schifcofske, Hodgson
OrfordKimmorley
Miles
Green
Solomana
Kely
Mapp
Prince
Wendy Feng, Tom Sawyer Software
70
Big Diagrams
71
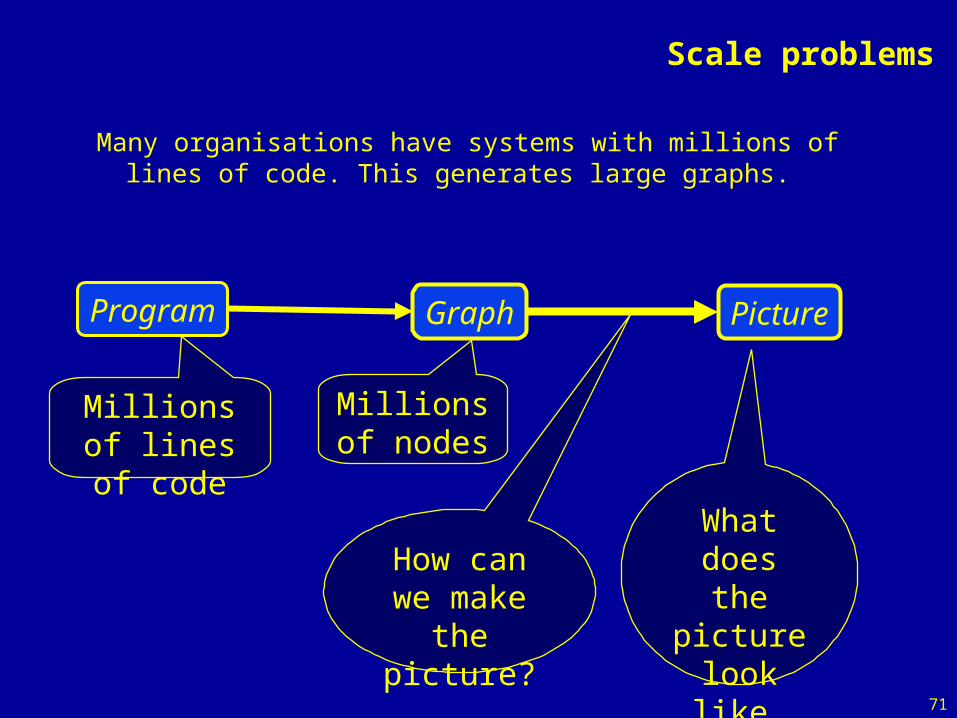
Scale problems
Many organisations have systems with millions of lines of code. This generates large graphs.
Program Graph Picture
Millions of lines of code
Millions of nodes
How can we make
the picture?
What does the picture
look like, anyway?
72
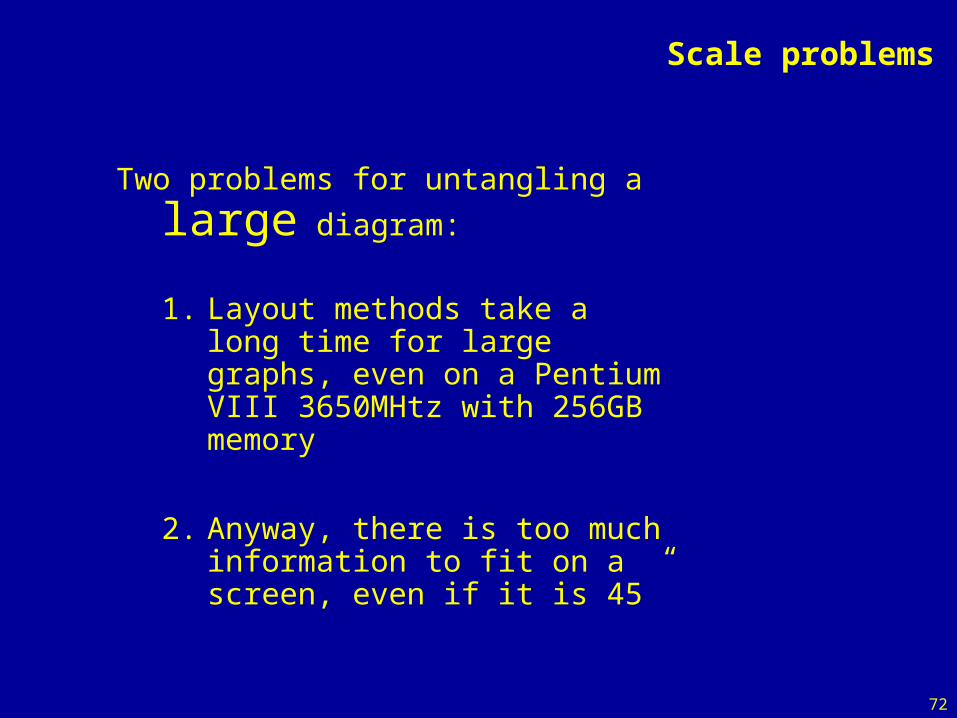
Scale problems
Two problems for untangling a large diagram:
1. Layout methods take a long time for large graphs, even on a Pentium VIII 3650MHtz with 256GB memory
2. Anyway, there is too much information to fit on a screen, even if it is 45”
73
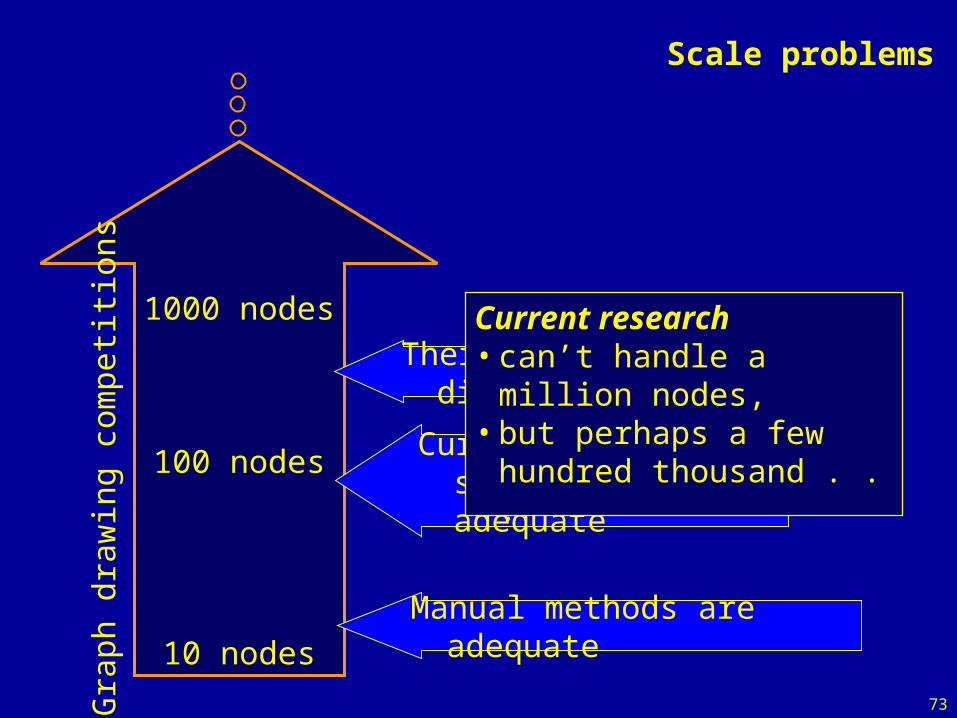
Scale problems
1000 nodes
100 nodes
10 nodes
Current commercial software is adequate
There are difficulties
Manual methods are adequate
Current research• can’t handle a million
nodes,• but perhaps a few hundred
thousand . . .
Gra
ph d
raw
ing
com
petit
ions
74
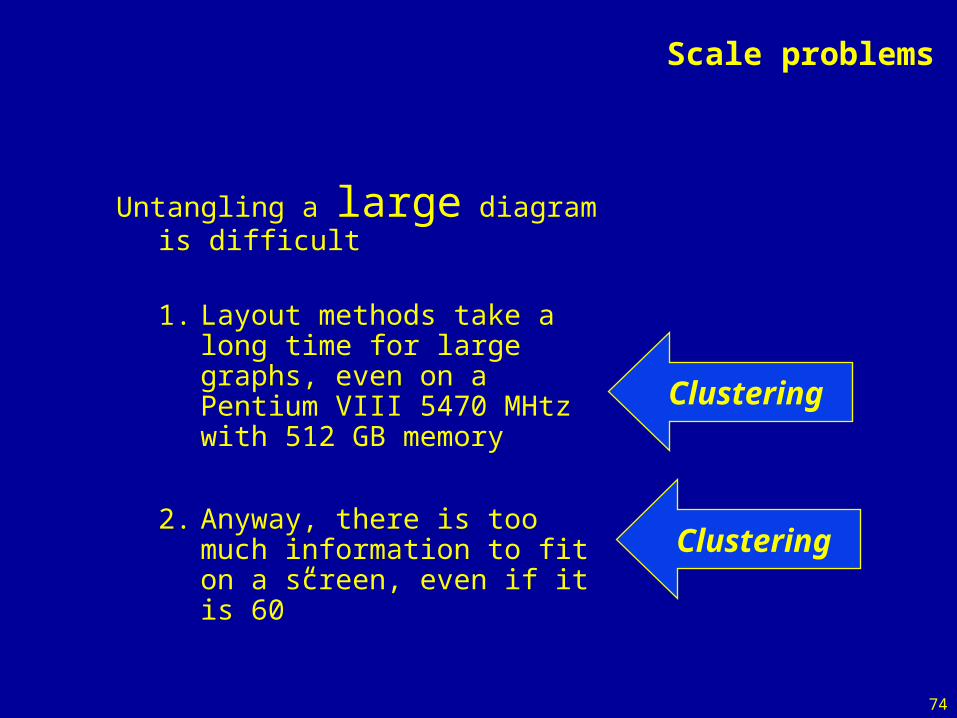
Scale problems
Untangling a large diagram is difficult
1. Layout methods take a long time for large graphs, even on a Pentium VIII 5470 MHtz with 512 GB memory
2. Anyway, there is too much information to fit on a screen, even if it is 60”
Clustering
Clustering
75
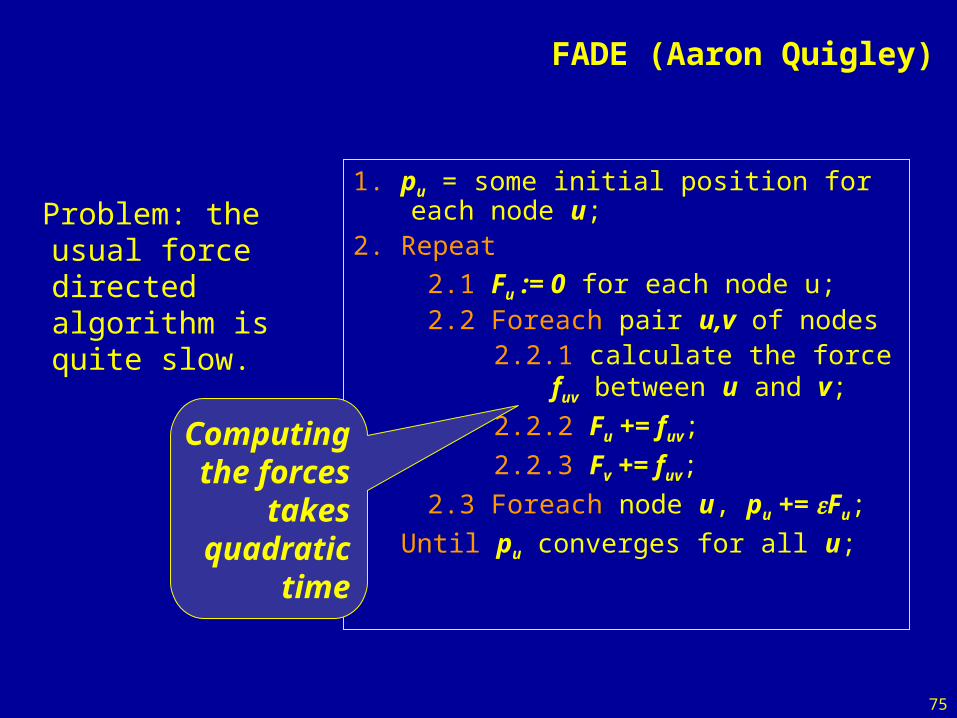
FADE (Aaron Quigley)
Problem: the usual force directed algorithm is quite slow.
1. pu = some initial position for each node u;
2. Repeat
2.1 Fu := 0 for each node u;2.2 Foreach pair u,v of nodes
2.2.1 calculate the force fuv between u and v;
2.2.2 Fu += fuv;
2.2.3 Fv += fuv;
2.3 Foreach node u, pu += Fu;
Until pu converges for all u;
Computingthe forces
takesquadratic
time
76
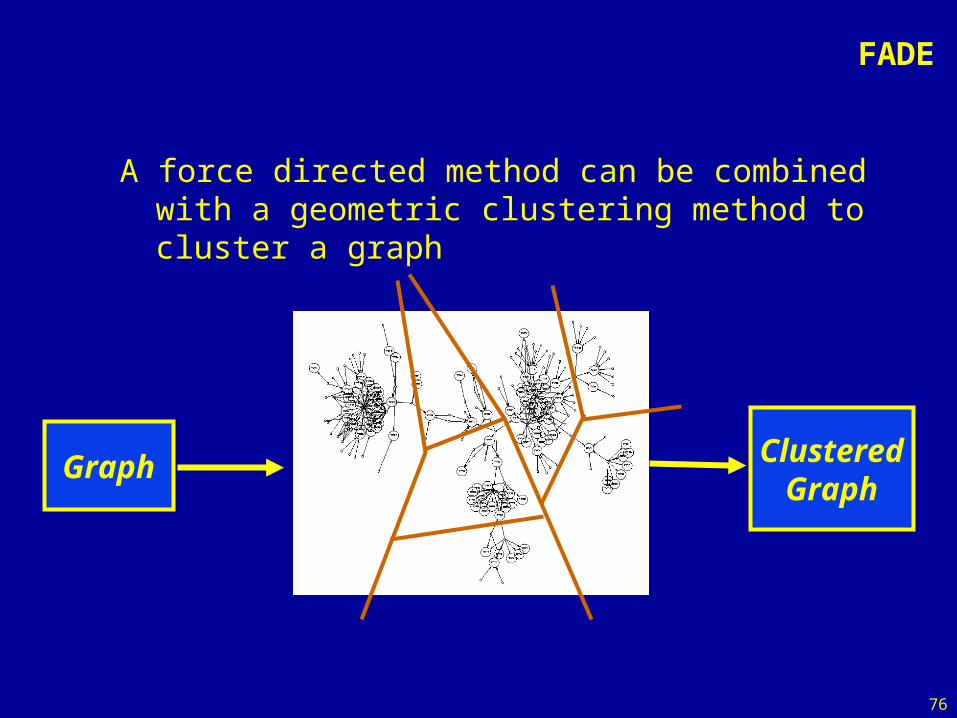
FADE
A force directed method can be combined with a geometric clustering method to cluster a graph
Graph ClusteredGraph

77
ef
FADE
Barnes&Hutt proposed a method of computing forces between stars.
A quadtree (octree) is a simple kind of clustering that represents the stars at their current positions.
a
dc
b
root
e f
BLa b d
TL BRc
78
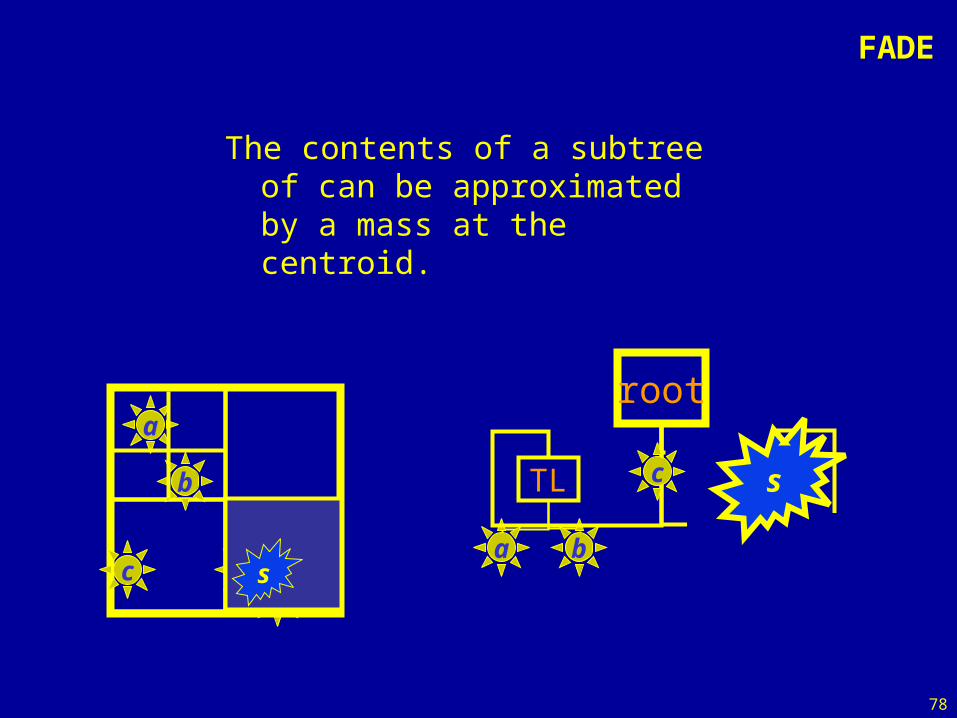
FADE
The contents of a subtree of can be approximated by a mass at the centroid.
ef
a
dc
b
root
e f
BLa b d
TL BRc
s
s
79
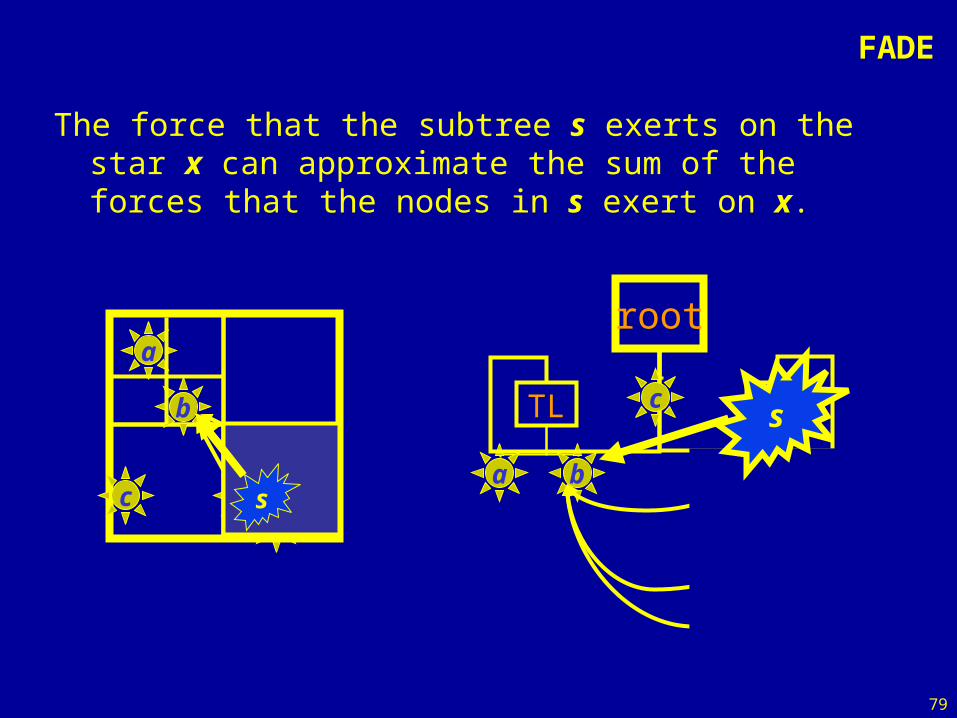
FADE
The force that the subtree s exerts on the star x can approximate the sum of the forces that the nodes in s exert on x.
ef
a
dc
b
root
e f
BLa b d
TL BRc
s
s
80
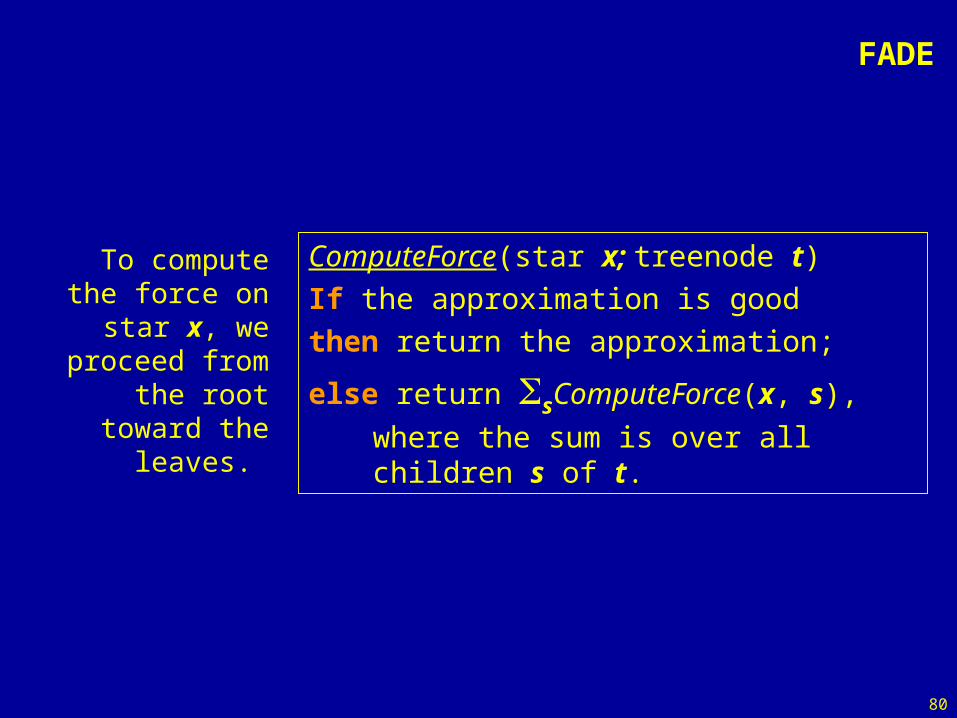
FADE
To compute the force on star x,
we proceed from the root
toward the leaves.
ComputeForce(star x; treenode t)
If the approximation is good
then return the approximation;
else return sComputeForce(x, s), where
the sum is over all children s of t.
81
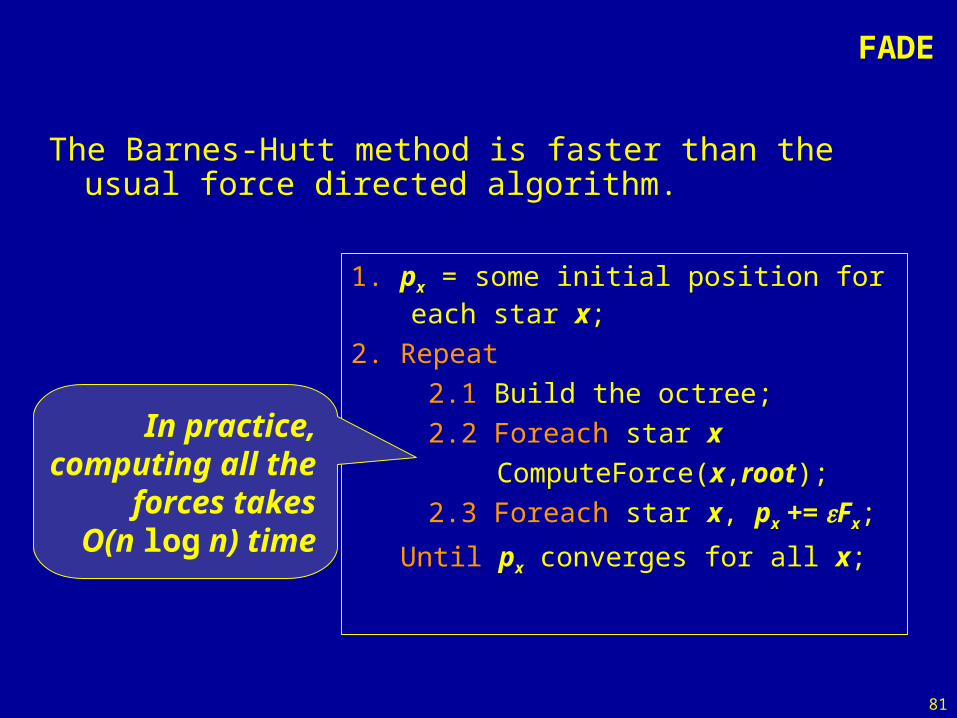
FADE
The Barnes-Hutt method is faster than the usual force directed algorithm.
1. px = some initial position for each star x;
2. Repeat
2.1 Build the octree;
2.2 Foreach star x
ComputeForce(x,root);
2.3 Foreach star x, px += Fx;
Until px converges for all x;
In practice,computing all the
forces takesO(n log n) time
82
FADE
83
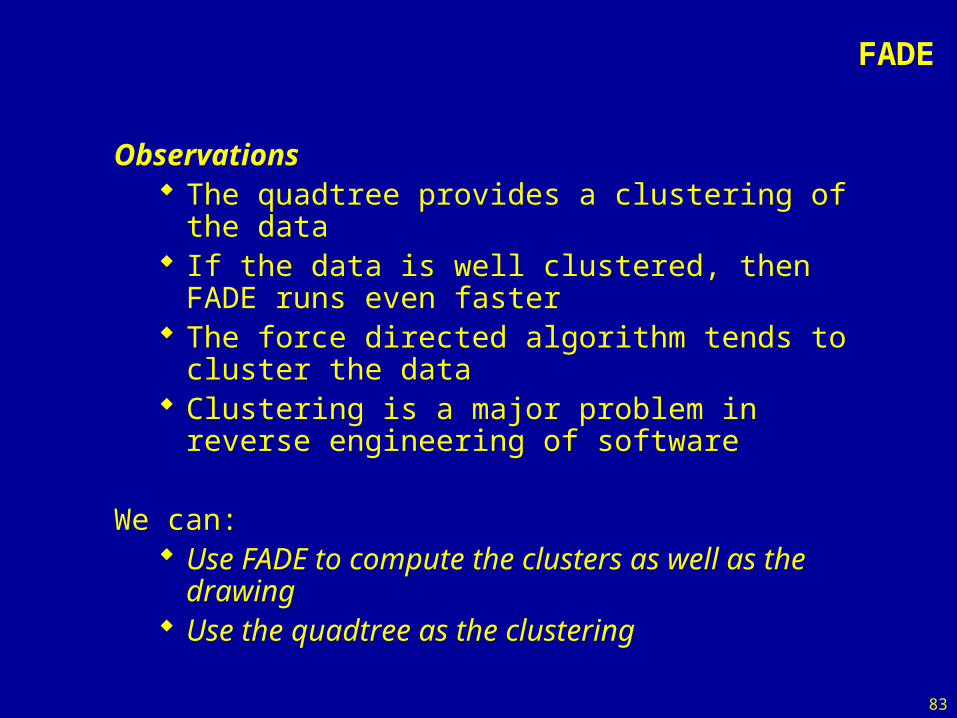
FADE
Observations The quadtree provides a clustering of the data If the data is well clustered, then FADE runs
even faster The force directed algorithm tends to cluster the
data Clustering is a major problem in reverse
engineering of software
We can: Use FADE to compute the clusters as well as
the drawing Use the quadtree as the clustering
84
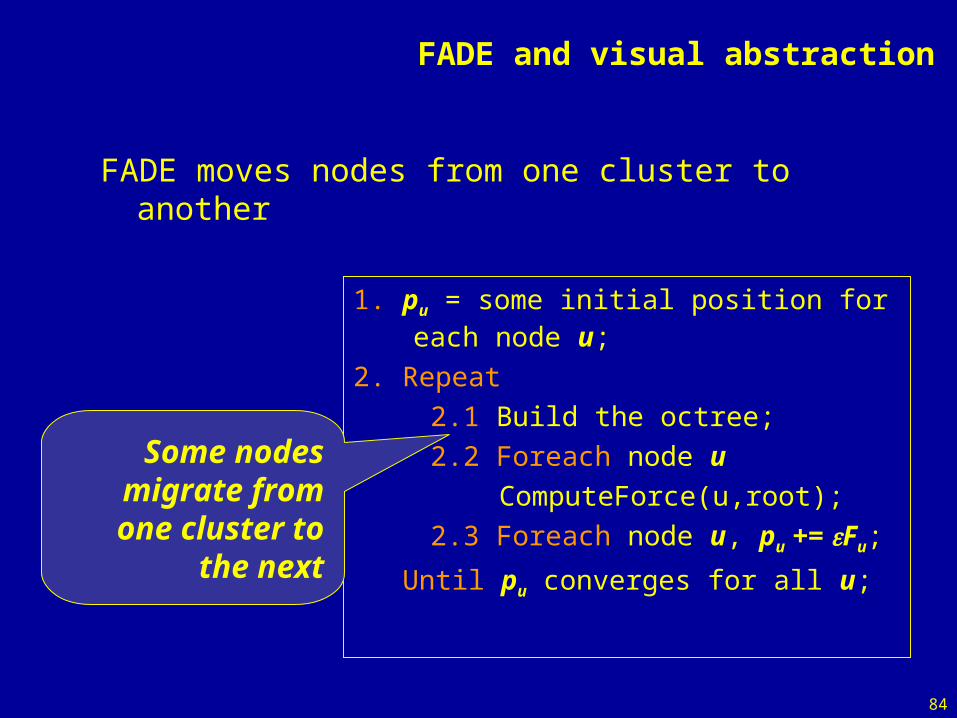
FADE and visual abstraction
FADE moves nodes from one cluster to another
1. pu = some initial position for each node u;
2. Repeat
2.1 Build the octree;
2.2 Foreach node u
ComputeForce(u,root);
2.3 Foreach node u, pu += Fu;
Until pu converges for all u;
Some nodes migrate from one
cluster to the next
85
FADE and visual abstraction
FADE provides a synergy between clustering and layout A better clustering makes FADE faster and gives
a better layout A better layout gives better visualization and
better clustering
The clustering can be used as a visual abstraction for the diagram.
86
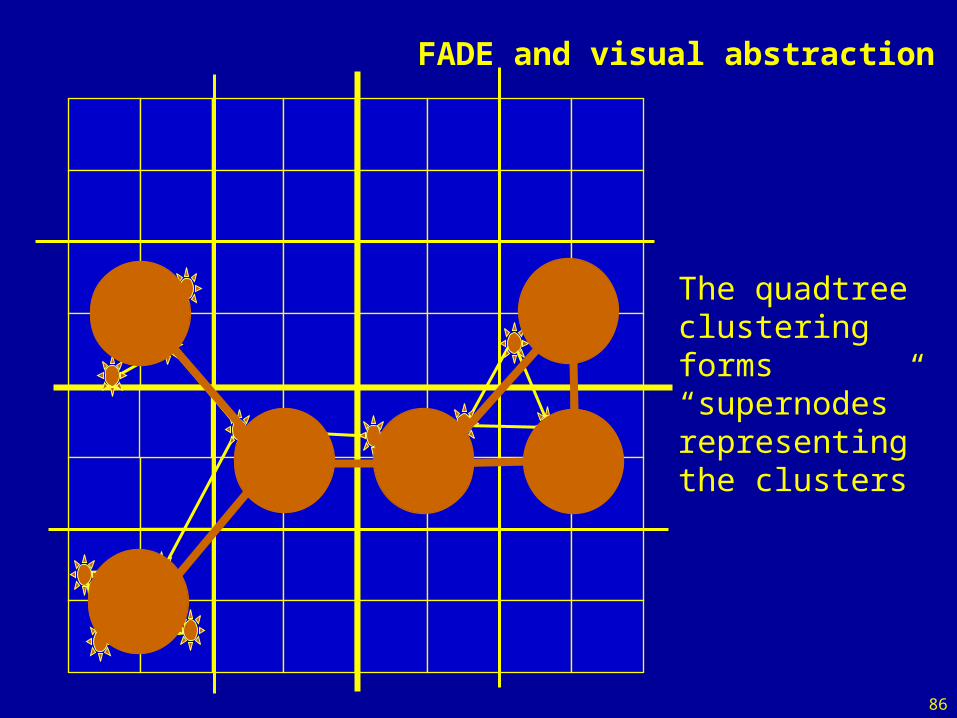
FADE and visual abstraction
The quadtree clustering forms “supernodes” representing the clusters
87
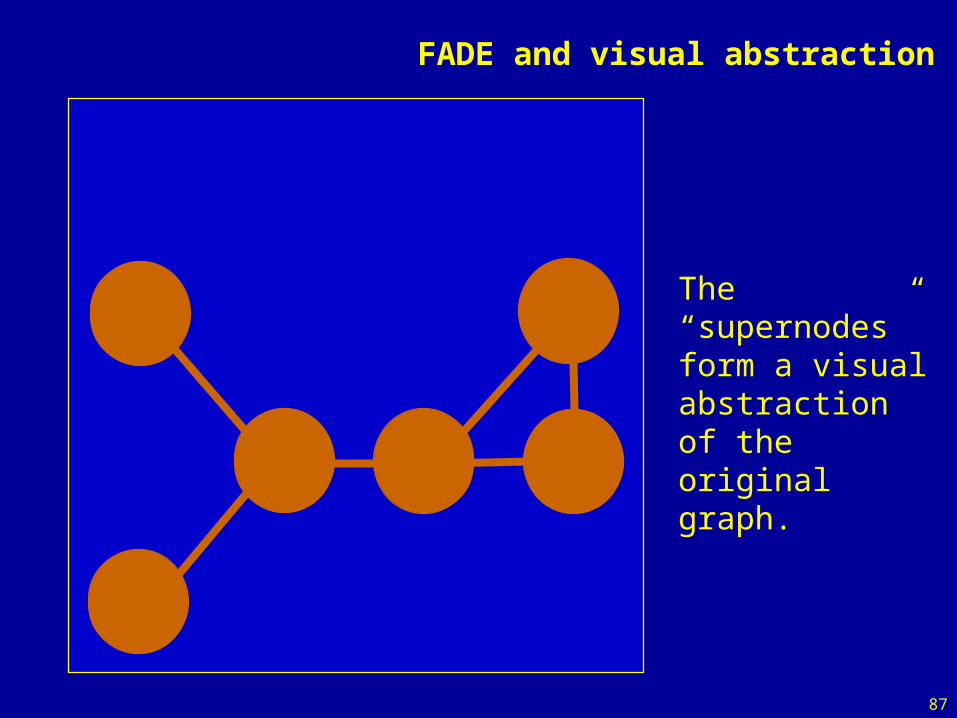
FADE and visual abstraction
The “supernodes” form a visual abstraction of the original graph.

88
FADE and visual abstraction
Aaron Quigley
89
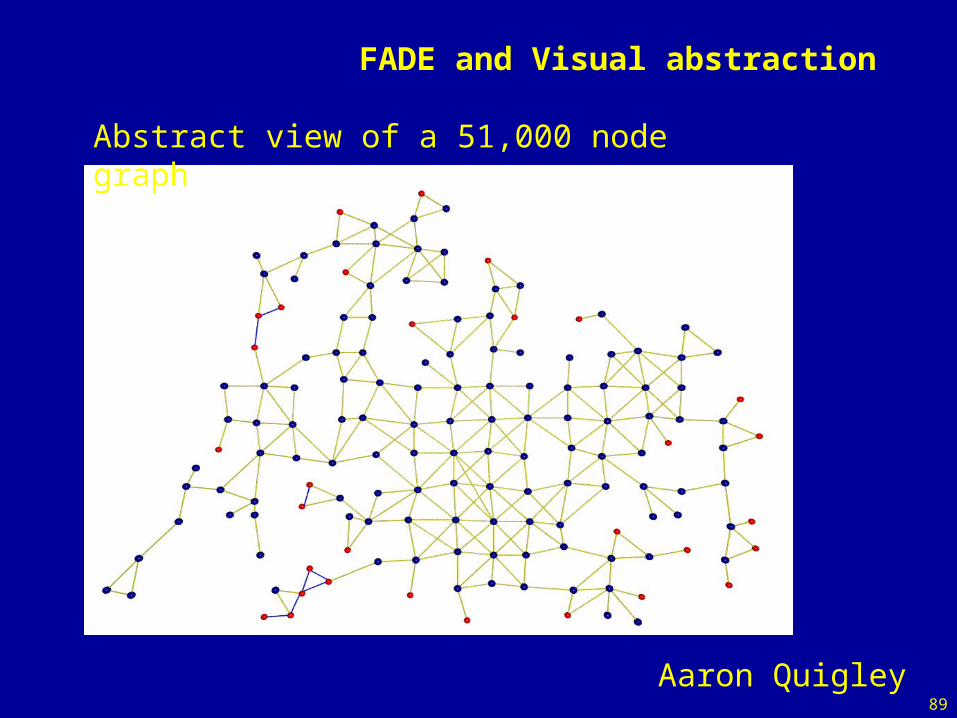
FADE and Visual abstraction
Abstract view of a 51,000 node graph
Aaron Quigley
90
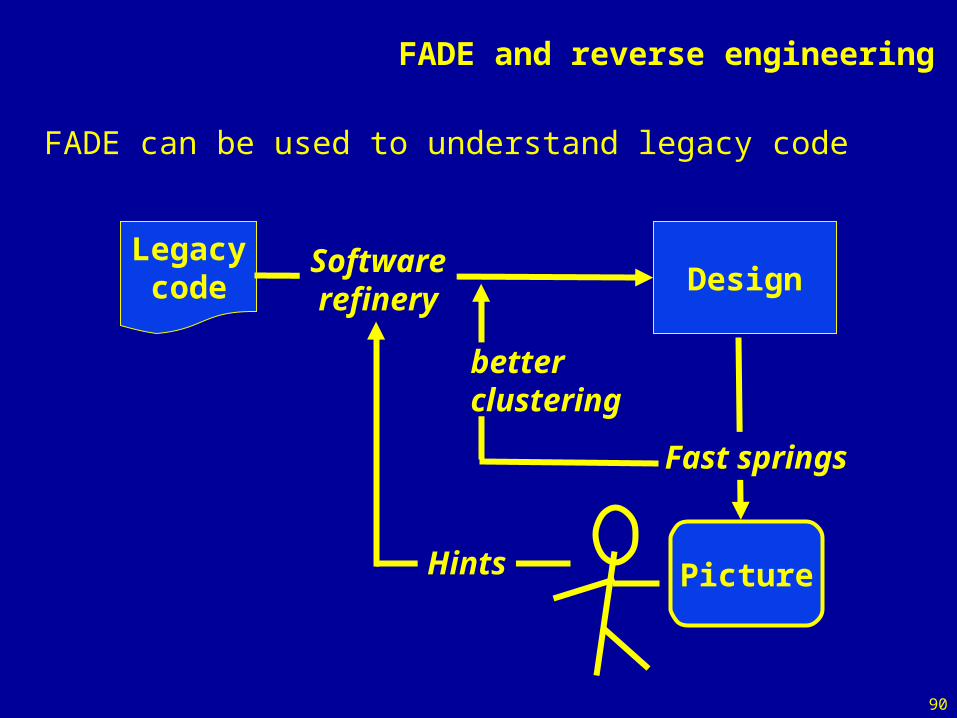
FADE and reverse engineering
FADE can be used to understand legacy code
Legacycode Design
PictureHints
Softwarerefinery
Fast springs
betterclustering
91
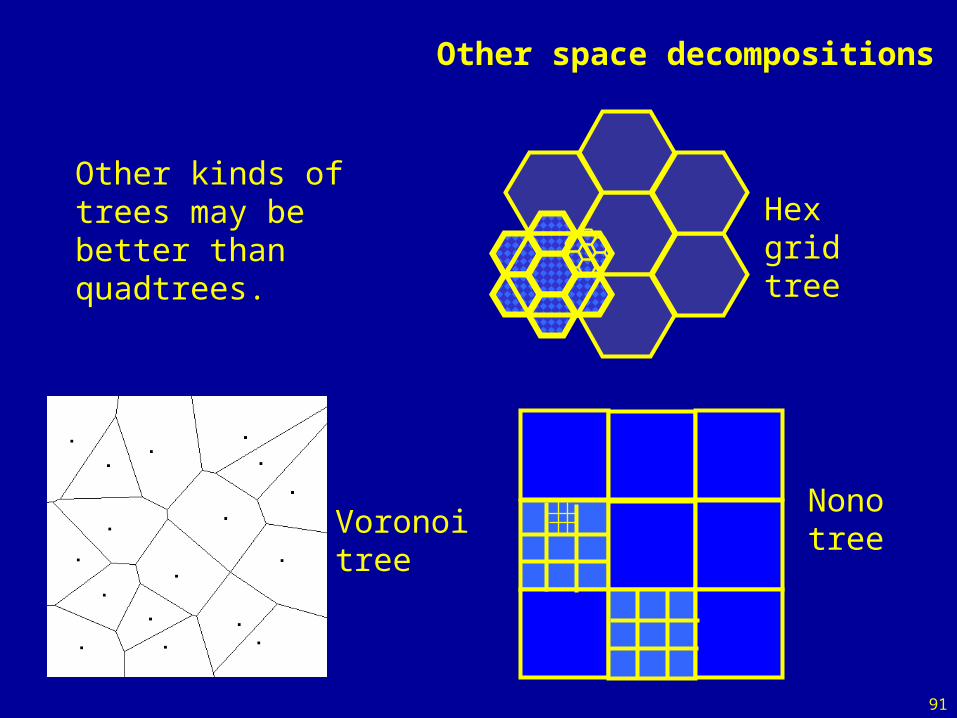
Other space decompositions
Hexgridtree
NonotreeVoronoi
tree
Other kinds of trees may be better than quadtrees.
92
FADE
FADE gives some hope for drawing huge graphs offers medium-quality drawings in reasonable time
offers clustering of the graph for reverse engineering
the clustering can be used as a visual abstraction
93
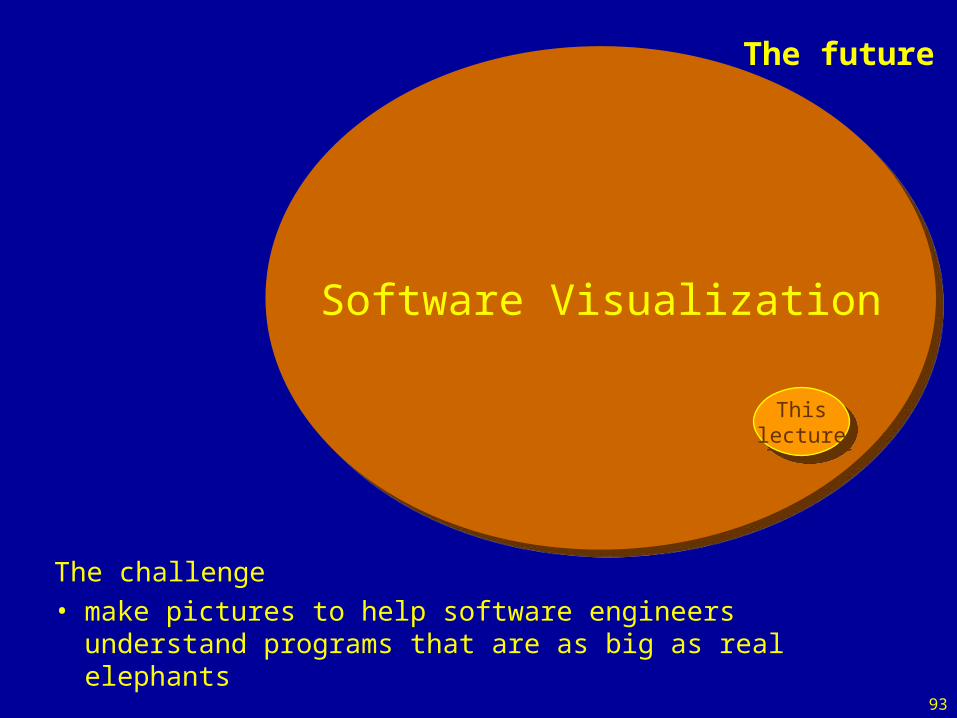
The future
The challenge• make pictures to help software engineers understand
programs that are as big as real elephants
Software VisualizationSoftware Visualization
Thislecture
Thislecture
94
John Cozzolino, USydLee Dinning, UNcleRuth Eades, Asahi ShimbunDavid Feng and BMIT , USyd Wendy Feng, Tom Sawyer SoftwareKeith Finkelde, BT Financial GroupCarsten Friedrich, USydPatrick Garvan, DSTOSeokHee Hong, USyd Maolin Huang, UTSJesse Jin, USyd
The EndJoe Marks, MERL
Petra Mutzel, T.U. ViennaHugo do Nascimento, USyd
Keith Nesbitt, UNcleStephen North, Lucent
Adele Phuah, USydAaron Quigley, UNcle
Derek Renouf, Adaptive Arts A.S.M. Sajeev, UNcleWendy Wang, UNcleTom Weidong, USyd
Thanks