software visualization of porous media with … · · 2016-02-07mass flow rate determinaton as...
TRANSCRIPT

Journal of Asian Scientific Research 2(12):900-912
900
SOFTWARE VISUALIZATION OF POROUS MEDIA WITH EMPHASIS ON
MASS FLOW RATE DETERMINATON AS TEMPERATURE CHANGES
Olagunju Mukaila
Department of computer science, polytechnic, Ilorin Nigeria
J.S Sadik
Dept. of computer science, Science University of Ilorin, Nigeria
ABSTRACT
Background: Software development has been in existence since the last three decades, when the
computer age started, as the software developments became more complex, so does the task of
understanding them. Even some time, it is very difficult for the developers to interpret the source
and object codes to the users.
Objective: Based on the problems mentioned above, this work is developed software visualization
for porous media with Graphical User Interface (GUI) application. Software visualization (SV)
uses computer graphics to communicate the structure and behavior of computer software and
algorithms.
Fluid, which comprise both liquid and gases play very vital roles in human life and machines
performances. This fluid always becomes useful when it tranfers or move from one point to another
and this normally possible through pipe. The quantity or mass of fluid that passes through the pipe
need to be determined especialy by the designers of pipe and the end users of the fluid.
Method: Inorder to develop the software visualization for this work, the model which based on
modified Heagen equation was modified to determine different mass flow rate at different
temperature. The visual pipe for representation of different mass flow rate was developed with
Autodesk Mayer and embedded in C# program for easy visualization.
Results: With this software visualization, easy visualization of mass flow partterns can be
examined and viewed.
Conclution: This work will definitely assist the experts in fluid, pipes designers, and end users of
fluid to determine at ease and at safe cost series of mass flow rate at different temperature.
Key Words: Software visualization, Porous media, Mass flow rate, Temperature changes.
Journal of Asian Scientific Research
journal homepage: http://aessweb.com/journal-detail.php?id=5003

Journal of Asian Scientific Research 2(12):900-912
901
INTRODUCTION
Determination of mass flow rate of fluid is very important for any designer of pipe, so in other to
know the quantity of fluid that can pass through the pipe at any given time before the actual design.
Software visualization has a great role to play in determination of mass flow rate in graphical
forms.Software is defined as a set of instruction designed to perform certain processing on the
inputs to produce certain results (Raisinghania, 2003; Jawadekar, 2006). Software is not like
hardware components because it is not physical product that has specification like dimensions,
weight, Height and so on. It is referred to as an invisible component of computer system.
Visualization is the systematic and focuses visual display of information in form of tables,
diagrams and graphs (Turfle, 2001). The classical definition of visualization is describe as the
formation of mental visual images, the act or process of interpreting in visual term
Simple illustration of visualization process is given below:
Figure-1. Visualisation Process
For software visualization to be meaningfull, it must be related to an object or substance which is a
visualized object or substance. Fluid can be described in many forms as given below
Fluid is defined as a substance which cannot withstand a shear force or stress without moving when
compared with solid, (John et al., 2009). Fluid can also be defined as a substance which
continously deform when a shear stress is appled.It is further classified fluids as liquids or gases,.
(John et al., 2009) It is as well regarded a liquid which has intermolecular forces which hold it
together so that it possesses volume but no definite shape, (Raisinghania, 2003). They also
classified fluid by the types of their flow into laminar and turbulent flow. Classified fluid by the
types of their flow into laminar and turbulent flow (Patankar, 1974; Raisinghania, 2003; John et al.,
2009) The term laminar flow means a fluid flow which flows in laminas or layers as opposed to
the turbulent flow in which the velocity component have random turbulent fluctuations imposed
upon their means values. Since we know that fluid cannot flow without pass through an object and
the most common object is pipe Pipeline system ranges from simple ones to complex ones (Ovri
and Ofeke, 1998).(Bruce, 2009) And (Reisherg, 1997) describe that the main function of pipe is to
convey fluid from one location to another.
The designer of pipes always faces different problems especially during the design stage.
The problem ranges from the type of materials used to the length and radius of the pipe.
The solution to these problems must be provided in order to achieve the objectives of the designers
so that the design pipes can allow the flow of fluid to undergo expected trends, with these in mind,
Journal of Asian Scientific Research 2(12):900-912
902
visualization is hereby proposed as method of determining the trends and patterns of fluid flow in
pipe.
METHODOLOGY
The material for this study was collected using observation and interview method.
The object oriented programing language was used to analyse and visualize the mass flow rate in
graphical and in tabular form.
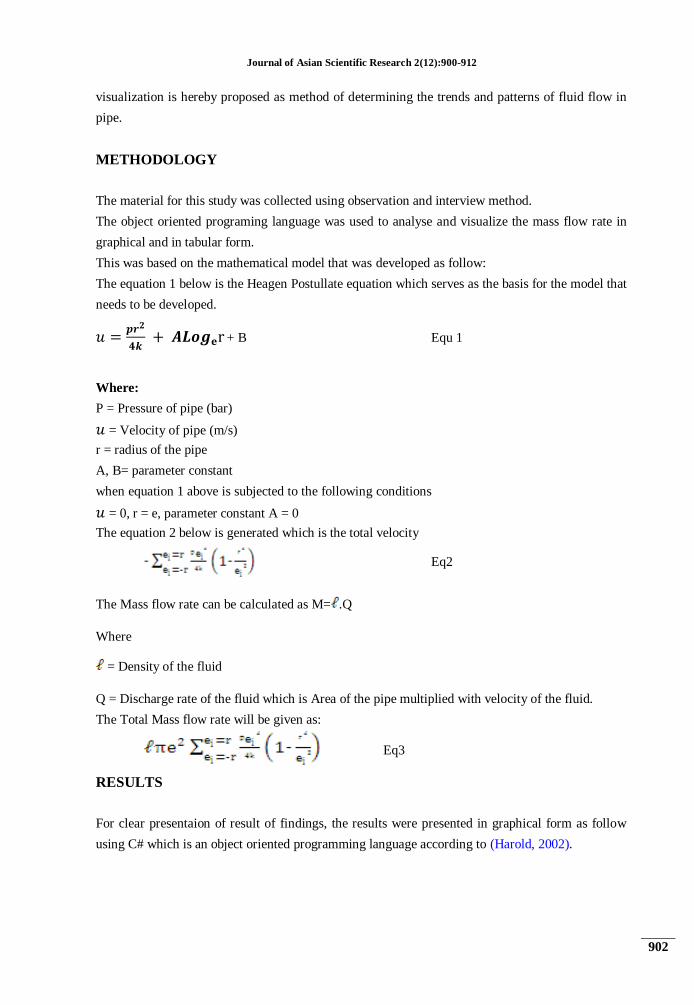
This was based on the mathematical model that was developed as follow:
The equation 1 below is the Heagen Postullate equation which serves as the basis for the model that
needs to be developed.
𝑢 =𝒑𝒓𝟐
𝟒𝒌 + 𝑨𝑳𝒐𝒈𝐞r + B Equ 1
Where:
P = Pressure of pipe (bar)
𝑢 = Velocity of pipe (m/s)
r = radius of the pipe
A, B= parameter constant
when equation 1 above is subjected to the following conditions
𝑢 = 0, r = e, parameter constant A = 0
The equation 2 below is generated which is the total velocity
Eq2
The Mass flow rate can be calculated as M= .Q
Where
= Density of the fluid
Q = Discharge rate of the fluid which is Area of the pipe multiplied with velocity of the fluid.
The Total Mass flow rate will be given as:
Eq3
RESULTS
For clear presentaion of result of findings, the results were presented in graphical form as follow
using C# which is an object oriented programming language according to (Harold, 2002).

Journal of Asian Scientific Research 2(12):900-912
903
Discussion on Mass Flowrate Output figures
The figures 2, 3 and 4 below show the effect of temperature at 0o, 20o and 100o respectively on
mass flow rate of water.
Fig-2. Mass flow rate of water at 0 degree with radious of 0.4m at presseure of 100bar
Fig-3. Mass flow rate of water at 20 degree with radious of 0.6m at presseure of 100bar

Journal of Asian Scientific Research 2(12):900-912
904
Fig-4. Mass flow rate of water at 100 degree with radious of 0.4m at presseure of 100bar
DISCUSSIONS
With reference to the figures 2,3,4 above it implies that the higher the temperature the lower the
mass flow rate and vice versa as illustrated at point 0.33000 radius with 369.58696 and 2452.36796
at zero and hundred degree respectively. The reason this for pheneomenum is that as tempertaure
increases the molecules of fluid that are already bonded together continue to move and because of
this it becomes lighter and the bond binding them together become more loss and occupy less
weight.
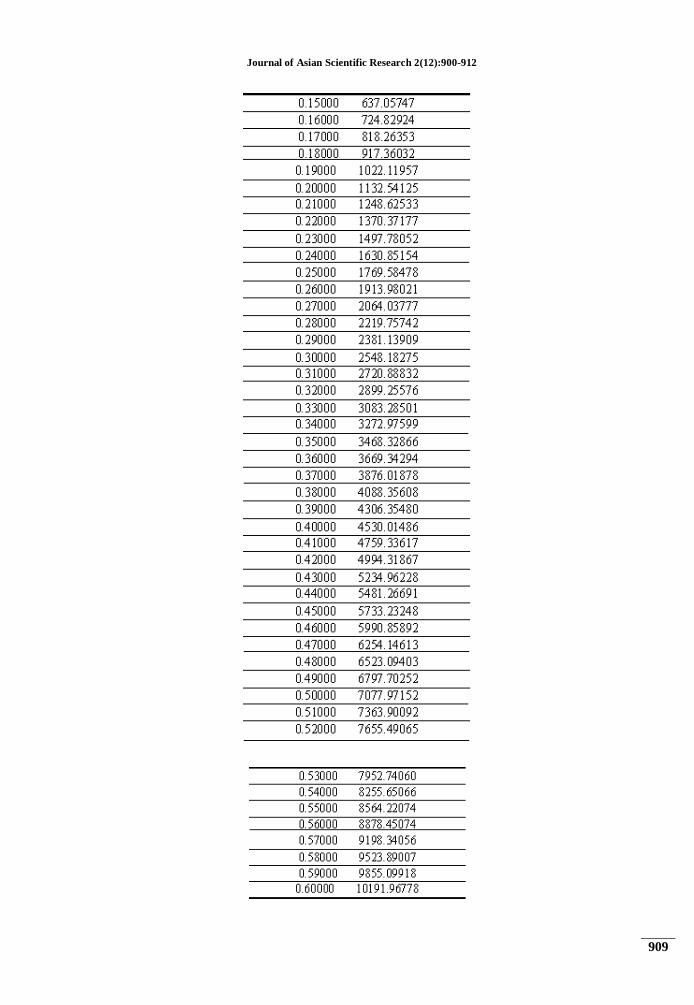
This is the mass of flow that passes through a particular point at a given time. The mass flowrate of
water at 0, 20 and 100 degree as shown above in Tables 1, 2 and 3 respectively. The chosen radii
were .8, .6 and .4 m respectively. It can also be deduced from the tables that as the point in the
radius increases, the mass flow rate reduces. Also, as the temperature increases, the mass flow rate
increases. The effidence can be found by comparing the values in the tables 1 and 3 above.
CONCLUSION AND RECOMMADATIONS
This work has clearly shown that the temprature play a vital role in mass of fluid that passes
through a pipe at given time. With the results of the findings, the recommendations are as follow:
i, designer of the pipe must consider the environmental temperature.
ii, the radius of pipe must be in proportional to amount of fluid needed by end users to avoid
spillage

Journal of Asian Scientific Research 2(12):900-912
905
Table-1. Mass flow rate of water at 0 degree with radious of 0.4m at presseure of 100bar

Journal of Asian Scientific Research 2(12):900-912
906

Journal of Asian Scientific Research 2(12):900-912
907
Table-2. Mass flow rate of water at 20 degree with radious of 0.6m at presseure of 100bar

Journal of Asian Scientific Research 2(12):900-912
908
Journal of Asian Scientific Research 2(12):900-912
909

Journal of Asian Scientific Research 2(12):900-912
910
Table-3. Mass flow rate of water at 100 degree with radious of 0.6m at presseure of 100bar

Journal of Asian Scientific Research 2(12):900-912
911
Journal of Asian Scientific Research 2(12):900-912
912
REFERENCE
Bruce, E.L., 2009. Hydraulic of pipeline systems. New York: publication data.
Harold, D., 2002. Visual c# .Net programming. Phyllis Davis.Manufactured in the United
States of America.
Jawadekar, W.S., 2006. Software engineering, principle and practice. New Delihi: Tata
McGraw- Hill publishing company, limited,.
John, A., Brighton. and William F. Hughes., 2009. Theory and problems of fliud
dynamics. Schaum's outline seals, New York: 66-69.
Ovri, J. and T. Ofeke, 1998. The corrosion behaviour of mild steel in marine environment.
J. Sci. Eng. Tech., 5(2): 1117-1129.
Patankar, S.V., 1974. Prediction of laminar flow and heat transfer in helically coiled pipe.
Journal of fluid mechanics, 62(3): 539-551.
Raisinghania, M.D., 2003. Fluid dynamics with complete hydrodynamics. New Delhi:
Rajendra, Ravindra, Ltd.
Reisherg, D., 1997. Cognitive thinking of visualization. New York: Oxford University
Press.
Turfle, L.R., 2001. Visualization of quantitative information. 2nd Edn., Cheshine:
Graphics Press.