software solutions for integrated...
TRANSCRIPT

C A S E S T U D Y
Software solutionsfor integrated
glassdevelopment
Professor Devendra Kumar
Professor of Glass Technology
DEPARTMENT OF CERAMIC ENGINEERING
INDIAN INSTITUTE OF TECHNOLOGY
(BHU), VARANASI – 221005
68 Glass-Technology International 3/2015
manufacturing is different from flat glass manufactur-ing and it also differs from tableware and decorative glasses. Glass industries are also different in terms of their production capacity and technology used: fully automatic, semi-automatic or labour intensive.The Indian glass industry is poised to grow at an un-precedented rate, fuelled by growth in sectors such as real estate, infrastructure, retail, automotive, food and beverages. According to a study by ASSOCHAM, the Indian glass market is esti-
mated to increase at a com-pound annual growth rate (CAGR) of 15 per cent. Growth in glass consump-tion is expected in con-struction (10-12 per cent), automotive (20 per cent), consumer goods (15-20 per cent) and pharmaceu-tical (15-18 per cent) sec-tors.The organised glass sec-tor is dominated by large players such as Asahi Glass India Ltd, Hindustan Na-tional Glass & Industries Ltd, Piramal Glass, Saint-Gobain India, HSIL, Owens Corning, Triveni
INTRODUCTIONThere are multifaceted uses of glasses in dif-
ferent forms and shapes. Although the raw materials and basic scientific process-es of making glass articles are the same, the uses of glass articles, the manufac-turing and business of the same items have a variant, depending on their applica-tion. Many down-line processes are also involved to give glass a variety in type of product and area of ap-plication. Container glass

69Glass-Technology International 3/2015
Glass, Gujarat Borosil etc.Growth drivers of the glass industry are:
increasing population and per capita usage of glass;green building con-cept;real estate sector boom;automotive industry;solar energy glass de-mand;packaging industry.
Challenges faced by the glass industries are:
increasing prices of the raw materials;stiff competition from international particu-larly Chinese products;low glass consumption in comparison to other countries;growing alternatives for glass affecting its growth. The glass industry is facing tough competi-tion from alternative medis. The latest chal-lenge being faced by Indian glass manufac-turers regards the in-creasing prices of raw materials, which is an important component in the process of glass manufacturing, and is affecting the bottom line of glassmakers.
The use of glass is of criti-cal importance in the pre-sent day when deteriorating environmental conditions have set alarm bells ringing for protection of environ-ment in the interest of hu-man health and wellbeing. There is an urgent need to
preserve and improve the environment. Glass indus-tries are experiencing pres-sure not only due to com-petition within the country and abroad, but also re-garding the maintenance of quality of the products at minimum cost, innova-tion in design and address-ing government regulations concerning the environ-ment. During the last few years I have visited Asahi India and Gujarat Guardian float glass plants, along with a few container and ban-gle glass manufacturing units at Firozabad (Uttar Pradesh). In recent years, important changes in the use and ap-plication of glass are being observed. To be successful in the glass business it is very important that proper market assess-ments be made at regular intervals, and quick deci-sions be made for strategic changes in the production line. In this endeavour, large-scale analysis of data and calculated predictions are very much necessary. Computers and software solutions may be very help-ful in this direction. It has been observed that in large-scale glass industries, computers and software are being used for process control in the manufactur-ing sector and for the man-agement of finance and human resources in admin-istration. Computer usage is very little in the medium-
and small-scale sector.During 2013-14, I assigned a project to two of our un-dergraduate students: Ms. Sakchhi Srivastava and Mr. Harish Ved, to conduct a study on software solu-tions for the Indian Glass Industry. AIS management was kind enough to allow them to tour their Roorkee plant and to get first-hand infor-mation regarding different operations and software requirements of a modern and advanced glass manu-facturing plant. After the one-day tour (13 September 2013), an in-depth study was car-ried out for the develop- ment of ERP software so-lutions for the glass indus-try, and in particular for the float glass industry. The present article is based on this extensive work, which may open up a new area of academic research and development in sup-port of the glass industry.Supervisory contributions from Prof. K. K. Shukla, Department of Computer Science and Engineering, Indian Institute of Tech-nology are highly acknowl-edged.
GLASS MANUFACTURING PROCESSThe float glass manufac-turing process involves the procurement of raw mate-rial in required and known quality, especially with re-gards to iron content, since it affects the transparency,
tint and colour of glass. Af-ter mixing the raw materials with cullet in an automated batch house, it is trans-ferred to the glass melting tank furnace, where the raw materials react and melt. The molten glass is then refined, homogenized and conditioned before be-ing transferred to the float tank, where the glass is converted into a flat ribbon of required uniform thick-ness with good surface quality. The solidified ribbon is then transferred to the annealing furnace for stress removal.The continuous glass rib-bon coming out of anneal-ing furnace is inspected for defects, coated for the protection of surface finish, and finally cut and sorted for marketing or subse-quent down-line operations depending on the applica-tion and use of the glass. Toughened, mirror, insu-lated, automobile and solar glasses have different down line operations. Major fac-tors of float glass manufac-ture are fuel efficiency of tank furnace, regenerators and float glass tank along with refining, homogeni-zation (i.e. controlling de-fects), colour, tint and flat-ness of glasses.
Other major concerns are reducing change over losses from one tint to oth-er and control of effect of changes in raw materials on the working of glass tank furnace and characteristics of glasses.

C A S E S T U D Y
70 Glass-Technology International 3/2015
formation. ERP software is usually used for integrated applications to store and manage data at every stage of business, including: (i) product planning, (ii) cost and development, (iii) manufacturing (iv) market-ing and sales, (v) inventory management and (vi) ship-ping and payments. ERP provides an integrated real-time view of core business processes, using common databases maintained by a database management system. ERP systems track business resources; cash, raw materials, production capacity and the status of business commitments: or-ders, purchase orders, and payroll etc. These applica-tions make up the system to share data across the various departments (man-ufacturing, purchasing, sales, accounting, etc.), who entered the data. ERP facilitates information flow between all business func-tions, and manages con-nections to outside stake-holders. One of the popular topics in the ERP imple-mentation is to identify or develop “Critical Success Factors”. The idea is that there are some important factors, which determine the success or failure of an ERP implementation. In information systems implementation research, there has been a lot of at-tention given to measuring success in implementation and finding which factors of information systems are critical to success.
ENTERPRISE RE-SOURCE PLANNING (ERP) SOFTWARE SYSTEMSOrganizations are under constant pressure from customers, shareholders, and suppliers to continu-ously improve upon the operations for manufac-turing and better quality products, quickly and ef-ficiently. Competing in a dynamic environment and meeting global challenges requires agility. Successful companies must be able to respond quickly and cost-effectively to change. The change could be of any type; shift in customer de-mands and supply chain partners, modifications to a business model or business process, business expan-sion and regulatory pres-sures imposed by financial markets, industrial groups, and government bodies. Organizations need to con-vert their industries into re-sponsive, demand-driven, profit making enterprises by optimizing their op-erations. Their competi-tive advantage and ultimate survival depend on the use of extended information system applications and/or technology. The ERP is an industry-driven software system, which is commonly used by businesses organi-zations and industries as a practical solution to achieve an integrated enterprise in-formation system, which facilitates the smooth flow of common functional in-
OpenERP
There are some ERP soft-ware available for glass in-dustries, however, some of these systems are known to be painful to implement and are very expensive. We worked for the development of the OpenERP system for the glass industry. Open-ERP is an open source en-terprise resource planning (ERP) software actively programmed, supported, and organized by Open-ERP. OpenERP is an open source alternative to SAP ERP, Oracle E-Business Suite, Microsoft Dynam-ics, Netsuite, Adempiere, Compiere, OFBiz, Open-bravo, and other enterprise resource planning software. OpenERP is licensed un-der the terms of the AGPL license. OpenERP is very flexible, incredibly easy to use and designed to fit one’s own process. Open-ERP‘s success is based on six main advantages; these are user-friendly, afford-able, flexible, modular, web-based and easy to im-plement. The development processes of Open Source Software provide a new way of cutting cost while maintaining quality. This can make an ERP system, which may be fully avail-able to small and medium enterprises. Open source software makes it possible to greatly reduce develop-ment costs by aggressive reuse of open source soft-ware libraries; to eliminate intermediaries (the distrib-utors), with all of their ex-
pensive sales overhead; to cut out selling costs by free publication of the software; and to considerably reduce the marketing overhead. OpenERP uses a Service Oriented Architecture (Fig-ure 1) as a software archi-tecture design pattern. Ser-vice oriented architecture (SOA) is a software design and software architecture design pattern, which is based on discrete pieces of software providing applica-tion functionality as ser-vices to other applications. This is known as service orientation. It is independ-ent of any vendor, product or technology. A service is a self-contained unit of func-tionality. Services can be combined by other software applications to provide the complete functionality of a large software applica-
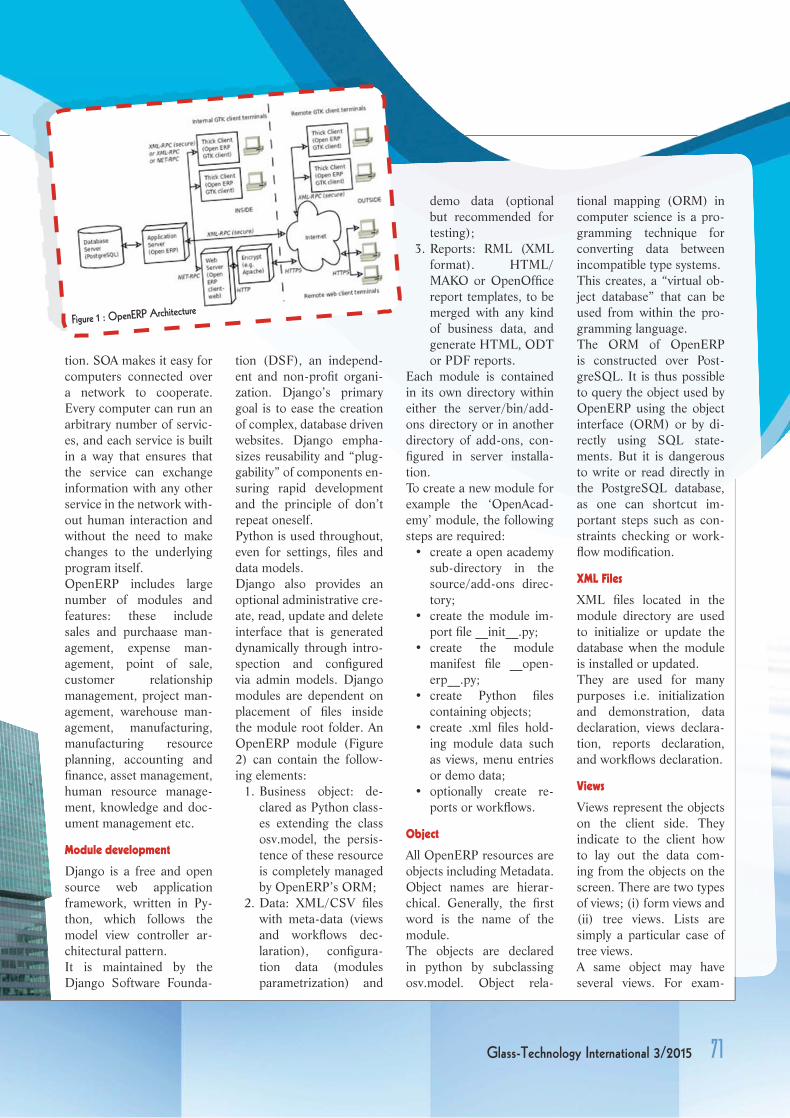
71Glass-Technology International 3/2015
tion. SOA makes it easy for computers connected over a network to cooperate. Every computer can run an arbitrary number of servic-es, and each service is built in a way that ensures that the service can exchange information with any other service in the network with-out human interaction and without the need to make changes to the underlying program itself. OpenERP includes large number of modules and features: these include sales and purchaase man-agement, expense man-agement, point of sale, customer relationship management, project man-agement, warehouse man-agement, manufacturing, manufacturing resource planning, accounting and finance, asset management, human resource manage-ment, knowledge and doc-ument management etc.
Module development
Django is a free and open source web application framework, written in Py-thon, which follows the model view controller ar-chitectural pattern.It is maintained by the Django Software Founda-
tion (DSF), an independ-ent and non-profit organi-zation. Django’s primary goal is to ease the creation of complex, database driven websites. Django empha-sizes reusability and “plug-gability” of components en-suring rapid development and the principle of don’t repeat oneself. Python is used throughout, even for settings, files and data models. Django also provides an optional administrative cre-ate, read, update and delete interface that is generated dynamically through intro-spection and configured via admin models. Django modules are dependent on placement of files inside the module root folder. An OpenERP module (Figure 2) can contain the follow-ing elements:
1. Business object: de-clared as Python class-es extending the class osv.model, the persis-tence of these resource is completely managed by OpenERP’s ORM;
2. Data: XML/CSV files with meta-data (views and workflows dec-laration), configura-tion data (modules parametrization) and
Figure 1 : OpenERP Architecture
demo data (optional but recommended for testing);
3. Reports: RML (XML format). HTML/MAKO or OpenOffice report templates, to be merged with any kind of business data, and generate HTML, ODT or PDF reports.
Each module is contained in its own directory within either the server/bin/add-ons directory or in another directory of add-ons, con-figured in server installa-tion. To create a new module for example the ‘OpenAcad-emy’ module, the following steps are required:
create a open academy sub-directory in the source/add-ons direc-tory;create the module im-port file __init__.py;create the module manifest file __open-erp__.py;create Python files containing objects;create .xml files hold-ing module data such as views, menu entries or demo data;optionally create re-ports or workflows.
Object
All OpenERP resources are objects including Metadata. Object names are hierar-chical. Generally, the first word is the name of the module. The objects are declared in python by subclassing osv.model. Object rela-
tional mapping (ORM) in computer science is a pro-gramming technique for converting data between incompatible type systems. This creates, a “virtual ob-ject database” that can be used from within the pro-gramming language. The ORM of OpenERP is constructed over Post-greSQL. It is thus possible to query the object used by OpenERP using the object interface (ORM) or by di-rectly using SQL state-ments. But it is dangerous to write or read directly in the PostgreSQL database, as one can shortcut im-portant steps such as con-straints checking or work-flow modification.
XML Files
XML files located in the module directory are used to initialize or update the database when the module is installed or updated. They are used for many purposes i.e. initialization and demonstration, data declaration, views declara-tion, reports declaration, and workflows declaration.
Views
Views represent the objects on the client side. They indicate to the client how to lay out the data com-ing from the objects on the screen. There are two types of views; (i) form views and (ii) tree views. Lists are simply a particular case of tree views. A same object may have several views. For exam-

C A S E S T U D Y
72 Glass-Technology International 3/2015
the principle of separation between the data layer and the presentation layer.
Workflow
The objects and the views allow one to define new forms very simply, lists/trees and interactions be-tween them. But that is not enough, one must de-fine the dynamics of these objects. The dynamics be-tween objects is known as workflow. Under the present pro-ject a module is developed for batch calculation for OpenERP. The developed float glass batch calculation module is named ‘float_glass’. The root folder for the ‘float glass’ module
ple, the products have sev-eral views according to the product variants. Views are described in XML. If no view has been defined for an object, the object is able to generate a view to repre-sent itself. This can limit the devel-oper’s work but results in less ergonomic views. The design of new objects is restricted to the minimum: create the objects and op-tionally create the views to represent them.
Reports
OpenERP uses a flexible and powerful reporting sys-tem. Reports are generated either in PDF or in HTML. Reports are designed on
consists of 4 files:1. Python import file: __
init__.py;2. Manifest file: __open-
erp__.py;3. models file: float_glass.
py; and4. XML file: float_glass_
lists.xml.The python import file consists of only a single line ‘import float_glass’, which allows us to import root ‘float_glass’ module folder. The next file is ‘__ openerp__.py’ which gives relevant information about the developed module. The module defines a new menu tab on the menu bar root named ‘Float Glass’ with priority. This would contain all the additional modules. The child element
of this menu-tab is ‘menu_float_root’ which categories the current mod-ule.The further child elements are:
‘menu_float_raw_material_lists’ is the model which helps us decide and create new lists. Here raw material lists stands for a particular list made up for a par-
ticular colour of glass. For example, a list to make ‘green’ glass should contain silica, dolomite, soda ash, salt cake, chromium oxide as raw materials. Simi-larly, many lists can be made for each colour.
‘menu_float_raw_materials’ lists the model which helps us create and define raw materials. Here raw materials are the mate-rials with info attached to them. For example, a raw material defines a name such as ‘silica’ and can include a for-eign key to supplier’s model. Hence, one re-cord includes a single raw material. ‘menu_float_raw_mat_ rel’ lists the model which defines the relationship
Figure 2 : OpenERP Module
mod
d
_e sew st-Database structure for batch
calculation of glass
73Glass-Technology International 3/2015
between the lists and the raw materials. This has a one to many re-lationship with the lists table as well as the raw materials table. Thus the link, which list con-tains which raw mate-rial and also in what quantity.
Thus, the quantity of a particular raw material in a particular list is defined here. ‘menu_batch_calc’ lists; the model which de-fines the heart of this mod-ule. This model shows the cal-culation window where, if we select a list, will show the related raw materi-als, which, on selection, would show the calculated quantity required for that material according to the required glass quantity. ‘view_ batch_calc’ shows the model that this field de-scribes. The view is defined by a short xml file form by the name ‘Calculations’. The fields defined by this view are; required quantity, col-our list, selected raw mate-rials and individual quan-tity. There are on change events in this model. These are; actions triggered by select-ing a list and the selecting a raw material respectively. The working principle is that as the user selects a list from the dropdown menu, “the type of glass that has to be manufactured”, the raw materials required for the manufacture of that particular glass are popu-
lated in the dropdown menu of the raw materials field. On selecting the raw material from that drop-down menu, the calculated batch quantity to manufac-ture the specified amount of glass is displayed in the “individual quantity’ field. The database structure of the module is as given in the Figure 3, ‘on change batch quantity’ and ‘on change raw material’ are method fields, which are to be called as view functions. ‘required quantity’ is an integer field, which defines the amount of total glass of a particular type that is to be prepared. ‘colour list’ is a many to one field. This gives the correlation to the type of glass that is to be manufactured. ‘se-lected raw material’ field gives a list of raw materials in a particular list used for manufacturing a particular type of glass.
PROGRAMME EVALUATION AND REVIEW TECHNIQUE (PERT) AND NETWORK THEORYProgramme Evaluation and Review Technique or PERT, as commonly known, is a sophisticated and relatively new tool used by manage-ment for project planning and control technique. PERT, through its flexibil-ity, can be used to cover al-most any facet of a project. It has become as the hottest new technique in the Theo-ry and Practice of manage-ment. For making effective
decisions, management must have some pertinent and timely information: (i) What are the alternative courses of action? (ii) What is the cost of each alterna-tive? (iii) What are the risks involved? (iv) When should the decision be taken? (v) What will be the result if the decision is delayed? The management cannot af-ford the increasing costs of idle equipment, manpower, and time in these hard days of cut-throat competition and they must control it through PERT or critical path method (CPM). There are the three elements of a project: (i) Operation, (ii) Resources and (iii) The conditions and the restric-tions under which the work must be done. The project completion is difficult until and unless there is timely delivery of designs, materials, ma-chines etc., by the outer agencies. The objective of PERT is to coordinate them because they may be con-flicting in the master plan. For preparing the Master Model, the various jobs and their sequence of perfor-mance must be determined.
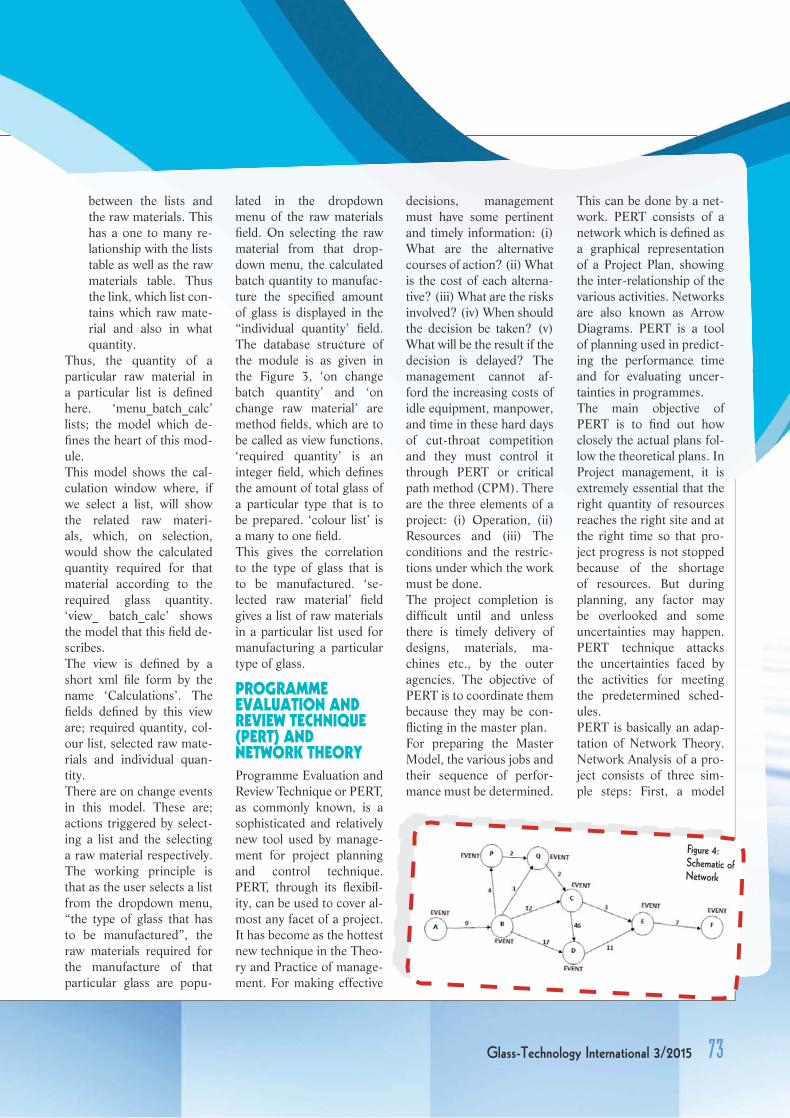
This can be done by a net-work. PERT consists of a network which is defined as a graphical representation of a Project Plan, showing the inter-relationship of the various activities. Networks are also known as Arrow Diagrams. PERT is a tool of planning used in predict-ing the performance time and for evaluating uncer-tainties in programmes. The main objective of PERT is to find out how closely the actual plans fol-low the theoretical plans. In Project management, it is extremely essential that the right quantity of resources reaches the right site and at the right time so that pro-ject progress is not stopped because of the shortage of resources. But during planning, any factor may be overlooked and some uncertainties may happen. PERT technique attacks the uncertainties faced by the activities for meeting the predetermined sched-ules. PERT is basically an adap-tation of Network Theory. Network Analysis of a pro-ject consists of three sim-ple steps: First, a model
Figure 4: Schematic of Network

C A S E S T U D Y
74 Glass-Technology International 3/2015
occur until events A, B, P and Q have occurred, and so on so forth. Scheduling or Time Estimating con-sists of estimating the time required for each of the ac-tivities linking the events. One must know as to how long it will take to perform the activity leading from event A to event B, the time from B to C, and so on. These time values for pro-jects must be estimated by those people who are most familiar with the activities. The intention is to get a real time required for each activity. The range provides a measure of uncertainty associated with the actual time required to perform the activity sometimes in future. Critical Path in a network (Figure 5) is that sequence of interconnected events and activities which will require the longest time between the start and the completion of the network. Thus the critical path is the longest time path through the network using the ex-pected time values for each activity as a guide. In the above chart, the longest time path and therefore, the Critical Path is indicated by bold lines. The reason why this is called the critical path is that any delay in complet-ing the activities along this path will delay the comple-tion of the project. Some of the other activities not on the critical path, if delayed may not affect the overall time of the project. Three
or network is developed covering all aspects of a business activity or project. This model is a detailed picture of what should hap-pen, indicating schemati-cally (by networks) as to how the project should de-velop. The second step in network analysis is to eval-uate the plan or model to be certain that if the steps are followed, the probabili-ties are great that the end objective will be reached. Finally, the network is used to monitor or control the project as it proceeds. To achieve the above, the fol-lowing steps are taken:
arrange the individual jobs of the project in a logical network;identify the critical jobs e.g. the activities which control the completion date of the overall pro-ject;allocate resources to the individual activities to optimize the per-formance of the whole system in terms of cost and time;supervise progress and reallocate resources as necessary to achieve the determined aims e.g., maintaining planned completion date or maintaining cost ceiling.
In this PERT diagram (Fig-ure 4), no work can be started on any other event until B has occurred. Af-ter completion of event B, work can be started on the activities following event B and leading to event P, Q, C and D. Event C cannot
values are estimated; (i) the most optimistic time, i.e., the shortest time, it could possibly take to perform the activity, (ii) the most pes-simistic time, i.e., the long-est probable time that it will take and (iii) the most likely time, i.e., the time it will probably take to perform the activity. Management is often interested in know-ing the cost of shortening period of different event or activity. By providing time and cost, it may help management to better utilize its manpower, materials and machines. But before making a deci-sion, management would like to know the cost of such changes of advanc-ing delivery. Adding cost figures to the time figures developed for the network can be done without much difficulty provided the firm has a sound cost-account-ing system. These computations must cover direct costs of labour and materials, etc, as well as overhead charges, fringe benefits, etc. PERT/cost (PERT with cost) indicates where management can ac-celerate a project and how much it will cost, in order to make way for subsequent work. PERT/cost helps the man-agement in evaluating al-ternative plans of action on both in time and in cost basis. For instance, if resources are transferred from one part of a network to the critical path, the ex-tra cost of doing so as well
as the time saved could be ascertained. PERT/cost also helps in planning the financial as-pects of a large project and indicates the money requirements for the vari-ous portions of the project, and also the time when re-quired. The total amount required for the project is also known. This will enable the management to bor-row money in advance or to make arrangements well in time. PERT/ cost also helps the management in meas-uring the accomplishments of the various managers of departments in meeting their schedule and cost es-timates on the project. This method also enables the management to find out the future manpower require-ments and costs which can
t
--n n f d k -l

75Glass-Technology International 3/2015
be secured either through additional personnel or through overtimes.
CONCLUSIONSThis article is an attempt to indicate the importance of software solutions in inte-grated development of glass industry particularly in In-dian context. To the best of my knowledge, there is no prior work on ERP soft-ware for glass and ceramic industries, due to lack of relationship between aca-demia and software indus-try with glass and ceramic industry. The study was under taken as a part of undergraduate research project under the supervision of the author. It was a trans-disciplinary ac-tivity with the involvement of Professor of Computer Science and Engineering. The project aims to be pio-neer in this area. This project and article aims to generate awareness about this trans-discipli-nary segment. Though, the project has carried out a lot of background study and addressed many software issues related to glass in-dustry, a lot more work re-
mains to be done. It is be-cause of the diverse nature of range of glass products for varied application and wide disparity in sizes of glass industries. There is urgent need to identify the Critical Suc-cess Factors (CSFs) for im-plementation in the Glass Industry. It can enable us to get more information about the customization and implementation needs of the industry. Once CSFs have been iden-tified and analysed, ERPs can be implemented in a lot more successful manner with much less transition time. This article indicates the benefits of using Open-ERPs. Risks and integra-tion costs are important barriers to all the advan-tages one gains from such systems. A few small and medium sized companies are not able to use ERPs. The de-velopment processes of Open Source Software, and the new business mod-els provide a new way of re-solving such cost and qual-ity issues. Open source software makes it possible to greatly
reduce development costs by aggressive reuse of open source software libraries and to cut out selling costs by free publication of the software. Since there is open inter-action among thousands of contributors and part-ners working on the same project, the quality of the resulting software greatly benefits from the scrutiny. Because of OpenERP’s modularity, collaborative developments in Open-ERP have been cleanly in-tegrated. Any company can choose from a large list of available functions and can build its own customized system by simply grouping and con-figuring the most suitable modules. Many modules for specific applications, which are urgently de-manded can be developed. A module to identify and analyse the colours in tint-ed glasses need immediate attention.
ACKNOWMENTSThe author would like to acknowledge the motiva-tion, dedication and the meticulous effort of his students Ms. Sakchhi Sriv-astava and Mr. Harish Ved in bringing this project to a fruitful step forward. Sup-port of AIS management for allowing our students to have a tour of their Roor-kee plant for getting first-hand information regard-ing different operations and software requirement of a modern and advanced
glass manufacturing plant is highly acknowledged. Lastly supervisory as-sistance from Prof. K. K. Shukla, Department of Computer Science and Engineering, IIT (BHU) Varanasi is acknowledged, which gave me a confidence for taking up this kind of interdisciplinary project.
p g y
Figure 5 : Critical Path in Network
Originally published in KANCH g y p
Quarterly Journal of The All India
Glass Manufactures’ Federation
(AIGMF)