software sector summary report - gca altium
TRANSCRIPT

SOFTWARESECTOR REPORT
Q3 2020

22
Software Q3 2020
EXECUTIVE SUMMARY
» In Q3 2020, the software sector continued to show its resiliency. M&A deal activity and overall M&A deal value witnessed a sharp rebound, and private financing activity continued at a healthy pace. Investors have shown a strong desire for software business models amidst greater cloud adoption and remote work environments, evidenced by favorable performances in public markets and heavy IPO activity with subsequent pops in share price value
– Software sector performed well in Q3 with the IGV tech-software index outperforming the S&P 500 by 34.1% LTM as of Q3 2020
– Infrastructure software index grew 148.8% LTM as of Q3 2020, outperforming all other software subsegments
» Q3 ’20 saw ~$18Bn in financing deal value and ~$56Bn in M&A deal value
- 215 financings, 3.2% lower than Q3 ‘19
- 469 M&A transactions, 22.1% higher than Q3 ’19
» Significant M&A activity in Q3 includes acquisitions in the Security sector: Ivanti’s $930MM acquisition of MobileIron and Fastly’s $775MM acquisition of Signal Sciences
» Financial software had some of the largest financing deals in Q3 ‘20 led by the $660MM financing of Robinhood and $650MM financing of Klarna; the Security sector also saw high financing volume
» Overall outlook in software growth remains healthy, with most sectors seeing notable growth
Notes:Sources: PitchBook, 451 Research, Capital IQ.
Select Q3 Active Investors Select Q3 Active Acquirers

33
GCA OVERVIEWThe GCA Software Team
Sector Coverage US Team
VERTICAL SOFTWARE
Key GCA Stats
65+Senior Bankers
Covering Technology
30+Senior Bankers
Covering Software
25 Offices Globally Software Transactions in the Last 3 Years110
Technology-Related Deals in the Last 3 Years260+
Josh WepmanManaging Director
Chris GoughManaging [email protected]
Kevin WalshManaging [email protected]
Glen KrugerManaging Director
Rupert SadlerManaging [email protected]
Saif MalikDirector
Collaboration Software
Enterprise Resource Planning
Human Capital Management
Supply Chain Management
BI & Analytics
CRM
Governance, Risk & Compliance
Marketing
HORIZONTAL SOFTWARE
E-commerce & Retail
Food & Agriculture
Insurance
Real Estate
Travel & Hospitality
Automotive
Education
Industrial
Media & Communications
Transportation & Logistics
INFRASTRUCTURE SOFTWARE
Data Management & Analytics
Workflow Automation
Cybersecurity
SaaS / Cloud-Enablement
Europe Team
Sascha PfeifferManaging Director
James CravenManaging Director
Raymond FröjdManaging Director
Raiko SteltenManaging Director
Kristoffer KälleskogManaging Director
Adrian ReedManaging Director

44
Deep Software Sector Expertise with Demonstrated Success Advising Large-cap Public and Private Companies on Complex Assignments
GCA OVERVIEW
Notes:The above transactions represent a compilation of past and current deals that GCA entities, including GCA Advisors, LLC, GCA Advisors Corporation and GCA Altium, have advised on. Generally, GCA Advisors Corporation advises Asian-based transactions, while GCA Advisors, LLC advises U.S.-based transactions and GCA Altium advises UK/European-based transactions. At times, multiple GCA entities may be retained to advise on the same transaction.

55
Select Financing Transactions Quarterly Financing Deal Value (1)(2) Quarterly M&A Deal Value Select M&A Transactions (3)
Company Amount ($MM) Acquirer Target EV ($MM)
$660 $11,000
$650 $7,500
$580 $6,800
$550 $5,350
$500 $5,000
$500 $4,700
$450 $1,800
$300 $1,600
LTM as of Q3 2020 Software Price Performance vs. S&P 500 (4)
Financing Activity by Quarter
$90.0 Billion
2020 YTD M&A Deal Value2020 YTD Financing Deal Value (1)(2)
$48.5 Billion
2020 YTD M&A Transactions2020 YTD Financing Transactions (1)(2)
660 1,173
(40%)
(20%)
0%
20%
40%
60%
80%
Oct-19 Nov-19 Dec-19 Jan-20 Feb-20 Mar-20 Apr-20 May-20 Jun-20 Jul-20 Aug-20 Sep-20
SPX IGV
$57
$82
$30 $39
$22 $19 $28
$5
$56
Q3'18 Q4'18 Q1'19 Q2'19 Q3'19 Q4'19 Q1'20 Q2'20 Q3'20
$17 $23
$14 $15 $17 $18 $14 $16 $18
Q3'18 Q4'18 Q1'19 Q2'19 Q3'19 Q4'19 Q1'20 Q2'20 Q3'20
187225
201 198222 227 211
234 215
Q3'18 Q4'18 Q1'19 Q2'19 Q3'19 Q4'19 Q1'20 Q2'20 Q3'20
363 375 361 359384
349389
315
469
Q3'18 Q4'18 Q1'19 Q2'19 Q3'19 Q4'19 Q1'20 Q2'20 Q3'20
DEAL DASHBOARD
Notes:Sources: Capital IQ, PitchBook, 451 Research and Dow Jones VentureSource. Market data as of 09/30/2020.1) Criteria based on software series A and subsequent rounds of global financings greater than or equal to $20MM. 2) Financings include software venture and private equity growth / expansion activity.3) Software M&A transactions reflect select transactions in Q3 2020. M&A metrics are based on closed and announced transactions.4) iShares North American Tech-Software ETF (IGV), used as proxy for software landscape. Top holdings in the ETF include ADBE, MSFT, ORCL, CRM, and INTU.
Software Q3 2020
Quarterly Financing Deal Count (1)(2) Quarterly M&A Deal Count
$Bn $Bn
14.4%
48.5%

66
148.8%
Index Performance
RECENT STOCK PERFORMANCE
Last 12 Months
27.1%
53.5%66.9%
27.9%
92.2%
33.2%
69.6%
43.8%
69.3%
21.5%
48.6%
Notes:Sources: Capital IQ. Market data as of 09/30/20.List of companies in each sector can be found in the public comparable tables.1) SaaS bucket is a subset of the other buckets and includes companies that operate a software-as-a-service platform.
Infrastructure SaaS(1) S&M Content ERP Development Technical Security Platform BI & Analytics Vertical Financial Nasdaq S&P 500
Low (1.6%) (8.2%) (28.4%) (2.7%) (16.8%) (18.7%) (12.0%) (17.9%) (10.7%) (28.8%) (22.4%) (21.4%) (13.3%) (23.9%)
Uptick from Low
150.4% 100.4% 98.0% 72.0% 83.7% 72.1% 60.6% 61.8% 43.9% 56.7% 49.5% 42.9% 54.5% 38.3%
Performance since Oct-19
148.8% 92.2% 69.6% 69.3% 66.9% 53.5% 48.6% 43.8% 33.2% 27.9% 27.1% 21.5% 41.2% 14.4%
14.4%
41.2%
(50.0%)
0.0%
50.0%
100.0%
150.0%
200.0%
Oct-19 Nov-19 Dec-19 Jan-20 Feb-20 Mar-20 Apr-20 May-20 Jun-20 Jul-20 Aug-20 Sep-20

77
Subsector Top Players and Key Operating Stats
SOFTWARE PUBLIC COMPANY LANDSCAPE
Platform
Combined Market Cap: $2,309Bn20E/19A Rev. Growth: 0.1%20E EBITDA Margin: 30.2%
Infrastructure
Combined Market Cap: $319Bn20E/19A Rev. Growth: 33.1%
20E EBITDA Margin: 19.3%
Security
Combined Market Cap: $291Bn20E/19A Rev. Growth: 13.1%
20E EBITDA Margin: 18.9%
Content & Storage Management
Combined Market Cap: $322Bn20E/19A Rev. Growth: 8.7% 20E EBITDA Margin: 19.3%
BI & Analytics
Combined Market Cap: $65Bn20E/19A Rev. Growth: 13.0%
20E EBITDA Margin: 9.9%
Financial Applications
Combined Market Cap: $414Bn20E/19A Rev. Growth: 14.2%
20E EBITDA Margin: 20.8%
Notes:Sources: Capital IQ. Market data as of 09/30/20.Logos shown represent largest players in each sub sector by enterprise value. Operating statistics for each sector represent full list of companies shown in public comparable tables.

88
Subsector Top Players and Key Operating Stats
SOFTWARE PUBLIC COMPANY LANDSCAPE
Technical Applications
Combined Market Cap: $243Bn20E/19A Rev. Growth: 14.3%
20E EBITDA Margin: 29.1%
Vertical
Combined Market Cap: $342Bn20E/19A Rev. Growth: 1.9%20E EBITDA Margin: 15.1%
ERP & General Business
Combined Market Cap: $554Bn20E/19A Rev. Growth: 12.5%
20E EBITDA Margin: 16.9%
Development & Operations
Combined Market Cap: $331Bn20E/19A Rev. Growth: 20.7%
20E EBITDA Margin: 14.8%
Sales & Marketing
Combined Market Cap: $42Bn20E/19A Rev. Growth: 19.5%
20E EBITDA Margin: 8.0%
SaaS
Combined Market Cap: $1,566Bn20E/19A Rev. Growth: 28.4%
20E EBITDA Margin: 14.4%
Notes:Sources: Capital IQ. Market data as of 09/30/20.Logos shown represent largest players in each sub sector by enterprise value. Operating statistics for each sector represent full list of companies shown in public comparable tables.

99
(13.5%) (14.0%) (14.5%) (14.9%) (15.0%) (15.3%) (15.4%) (15.7%) (16.8%) (18.2%)(19.9%) (21.5%) (21.5%) (22.5%) (22.7%)
(27.1%) (28.6%)
(35.2%)
(41.7%)(44.3%)
33.2% 33.4% 35.9% 37.1% 39.2% 39.3% 42.2% 42.7% 42.9% 43.4% 44.7%
67.8% 68.3% 71.4% 81.4% 84.0% 92.4%
109.2%
157.0%
247.1%
SOFTWARE STOCKS WINNERS & LOSERS
Notes:Sources: Capital IQ as of 09/30/20.
Top and Bottom 20 Stock Price Performers in Q3 2020
Top 20 Performers
Bottom 20 Performers
1010
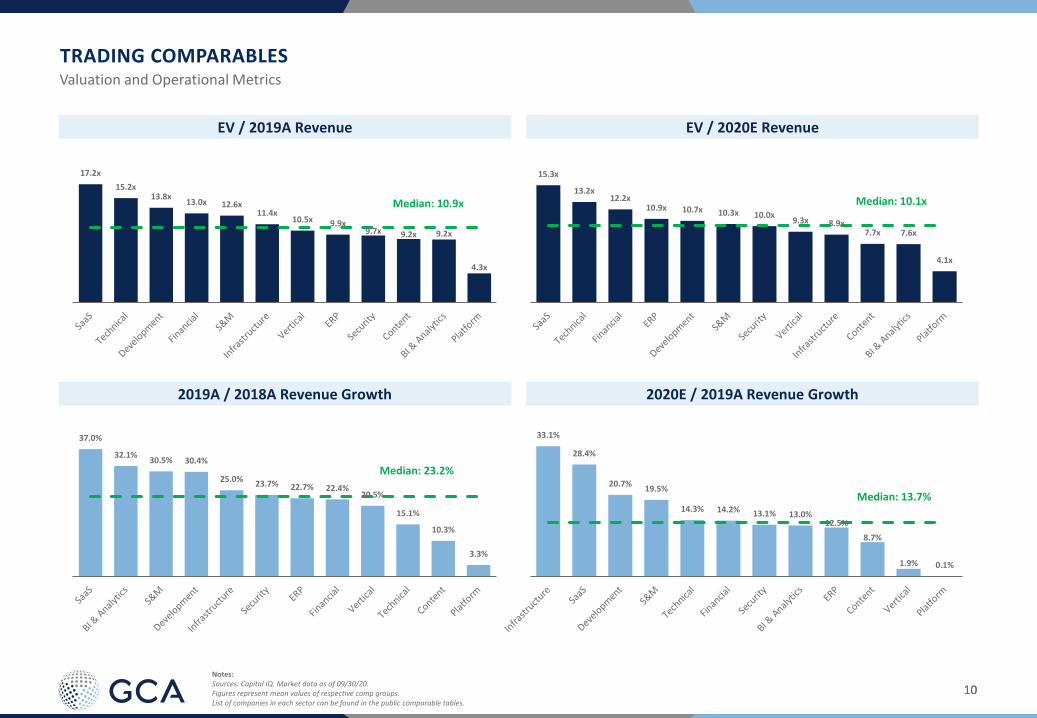
33.1%
28.4%
20.7% 19.5%
14.3% 14.2% 13.1% 13.0% 12.5%
8.7%
1.9% 0.1%
Median: 13.7%
15.3x
13.2x12.2x
10.9x 10.7x 10.3x 10.0x9.3x 8.9x
7.7x 7.6x
4.1x
Median: 10.1x
37.0%
32.1% 30.5% 30.4%
25.0% 23.7% 22.7% 22.4% 20.5%
15.1%
10.3%
3.3%
Median: 23.2%
Valuation and Operational Metrics
TRADING COMPARABLES
EV / 2019A Revenue EV / 2020E Revenue
2019A / 2018A Revenue Growth 2020E / 2019A Revenue Growth
Notes:Sources: Capital IQ. Market data as of 09/30/20.Figures represent mean values of respective comp groups.List of companies in each sector can be found in the public comparable tables.
17.2x
15.2x13.8x
13.0x 12.6x11.4x
10.5x 9.9x9.7x 9.2x 9.2x
4.3x
Median: 10.9x
1111
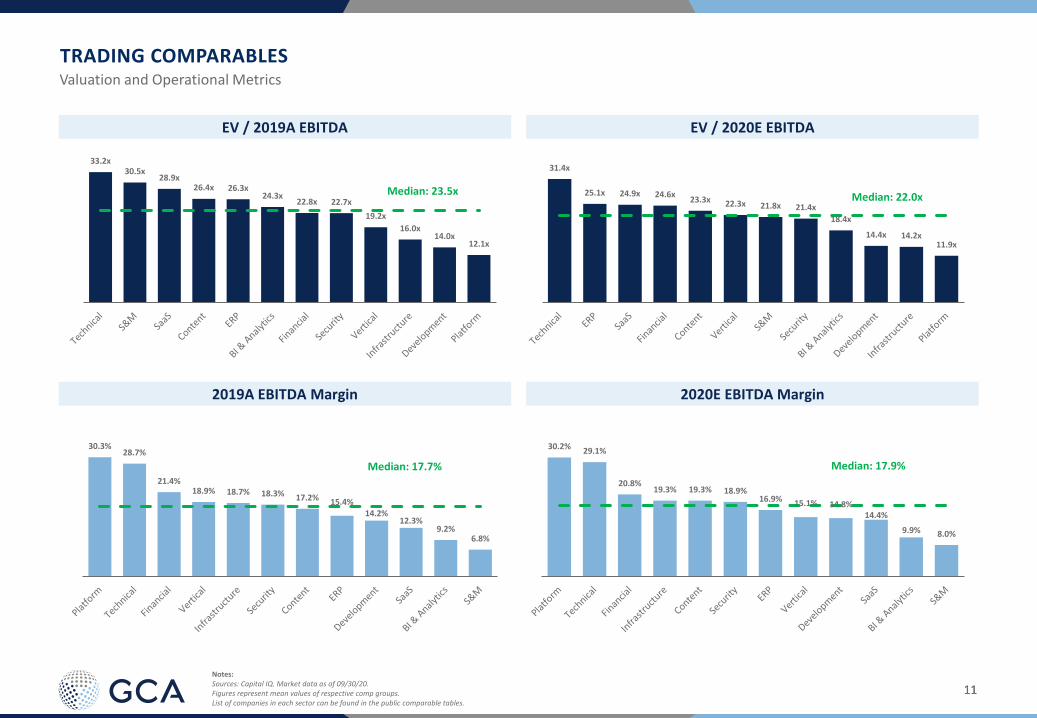
30.2% 29.1%
20.8% 19.3% 19.3% 18.9%
16.9% 15.1% 14.8% 14.4%
9.9% 8.0%
Median: 17.9%
31.4x
25.1x 24.9x 24.6x23.3x 22.3x 21.8x 21.4x
18.4x
14.4x 14.2x11.9x
Median: 22.0x
30.3% 28.7%
21.4% 18.9% 18.7% 18.3% 17.2% 15.4%
14.2% 12.3%
9.2% 6.8%
Median: 17.7%
Valuation and Operational Metrics
TRADING COMPARABLES
EV / 2019A EBITDA EV / 2020E EBITDA
2019A EBITDA Margin 2020E EBITDA Margin
Notes:Sources: Capital IQ. Market data as of 09/30/20.Figures represent mean values of respective comp groups.List of companies in each sector can be found in the public comparable tables.
33.2x30.5x
28.9x26.4x 26.3x
24.3x22.8x 22.7x
19.2x
16.0x14.0x
12.1x
Median: 23.5x
1212
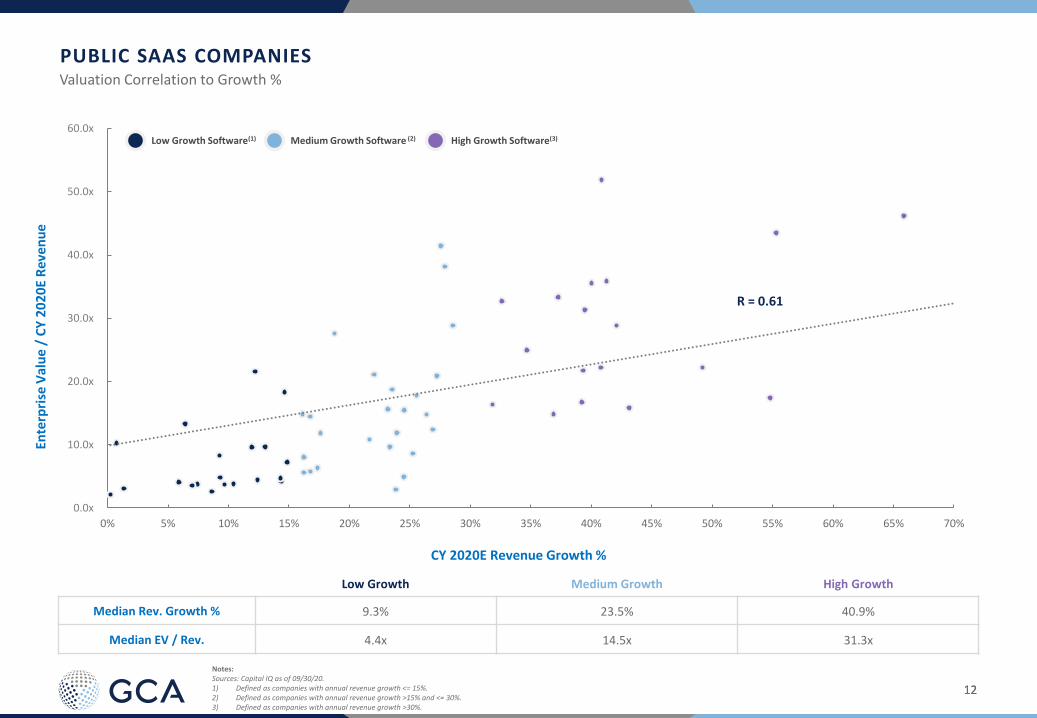
PUBLIC SAAS COMPANIESEn
terp
rise
Val
ue
/ C
Y 2
02
0E
Re
ven
ue
CY 2020E Revenue Growth %
Low Growth Medium Growth High Growth
Median Rev. Growth % 9.3% 23.5% 40.9%
Median EV / Rev. 4.4x 14.5x 31.3x
High Growth Software(3)Medium Growth Software (2)Low Growth Software(1)
Notes:Sources: Capital IQ as of 09/30/20.1) Defined as companies with annual revenue growth <= 15%.2) Defined as companies with annual revenue growth >15% and <= 30%.3) Defined as companies with annual revenue growth >30%.
Valuation Correlation to Growth %
0.0x
10.0x
20.0x
30.0x
40.0x
50.0x
60.0x
0% 5% 10% 15% 20% 25% 30% 35% 40% 45% 50% 55% 60% 65% 70%
R = 0.61
1313
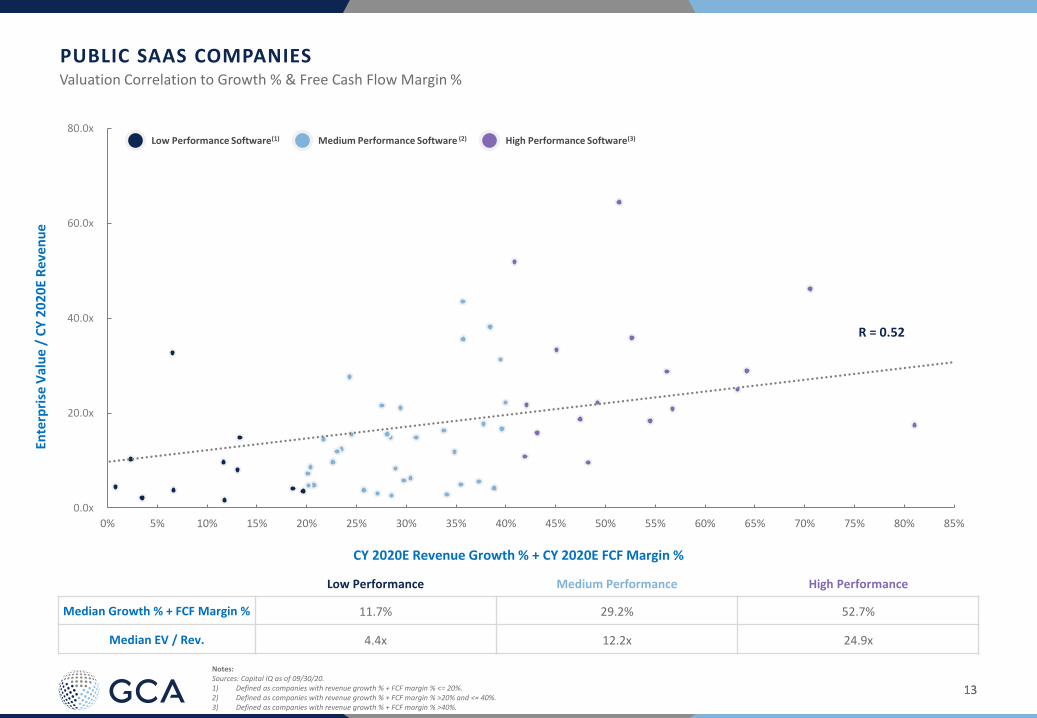
PUBLIC SAAS COMPANIES
Notes:Sources: Capital IQ as of 09/30/20.1) Defined as companies with revenue growth % + FCF margin % <= 20%.2) Defined as companies with revenue growth % + FCF margin % >20% and <= 40%.3) Defined as companies with revenue growth % + FCF margin % >40%.
Ente
rpri
se V
alu
e /
CY
20
20
E R
eve
nu
e
CY 2020E Revenue Growth % + CY 2020E FCF Margin %
Low Performance Medium Performance High Performance
Median Growth % + FCF Margin % 11.7% 29.2% 52.7%
Median EV / Rev. 4.4x 12.2x 24.9x
Valuation Correlation to Growth % & Free Cash Flow Margin %
High Performance Software(3)Medium Performance Software (2)Low Performance Software(1)
0.0x
20.0x
40.0x
60.0x
80.0x
0% 5% 10% 15% 20% 25% 30% 35% 40% 45% 50% 55% 60% 65% 70% 75% 80% 85%
R = 0.52

1414
PUBLIC SAAS COMPANIESEn
terp
rise
Val
ue
/ C
Y 2
02
0E
Re
ven
ue
CY 2020E Incremental Revenue / CY 2019A S&M Expense
Low Efficiency Medium Efficiency High Efficiency
Median Inc. Rev. / S&M Expense 0.4x 0.7x 1.3x
Median EV / Rev. 8.6x 21.1x 28.2x
Notes:Sources: Capital IQ as of 09/30/20.1) Defined as companies with S&M expense efficiency <= 0.6x.2) Defined as companies with S&M expense efficiency >0.6x and <= 1.0x.3) Defined as companies with S&M expense efficiency >1.0x.
Valuation Correlation to Returns on S&M Expense Efficiency
High Efficiency Software(3)Medium Efficiency Software (2)Low Efficiency Software(1)
0.0x
10.0x
20.0x
30.0x
40.0x
50.0x
60.0x
70.0x
80.0x
0.0x 0.2x 0.4x 0.6x 0.8x 1.0x 1.2x 1.4x 1.6x 1.8x 2.0x 2.2x 2.4x
R = 0.51

1515
Notes:Sources: Capital IQ and 451 Research.
SOFTWARE M&A UPDATE
Quarterly M&A Activity Select Q3 2020 M&A Transactions
Ann.Date
Acquirer TargetEnterprise
ValueEV/ LTM
Rev.
9/28 $930 3.9x
9/21 $7,500 NA
8/31 $4,700 5.9x
8/31 $792 4.0x
8/27 $1,600 9.6x
8/27 $1,120 NA
8/27 $775 31.0x
8/25 $5,000 10.2x
8/13 $5,350 NA
8/07 $11,000 NA
8/03 $1,102 NA
7/29 $6,800 12.1x
7/27 $1,800 NA
7/20 $729 4.7x
7/13 $925 7.0x
($MM)($Bn) Number of Deals M&A Deal Value
Q3 2020 Dashboard
$57
$82
$30
$39
$22 $19
$28
$5
$56
363
375
361 359
384
349
389
315
469
Q3'18 Q4'18 Q1'19 Q2'19 Q3'19 Q4'19 Q1'20 Q2'20 Q3'20
Quarterly M&A Activity
$57
$82
$30
$39
$22 $19
$28
$5
$56
363
375
361 359
384
349
389
315
469
Q3'18 Q4'18 Q1'19 Q2'19 Q3'19 Q4'19 Q1'20 Q2'20 Q3'20
1616
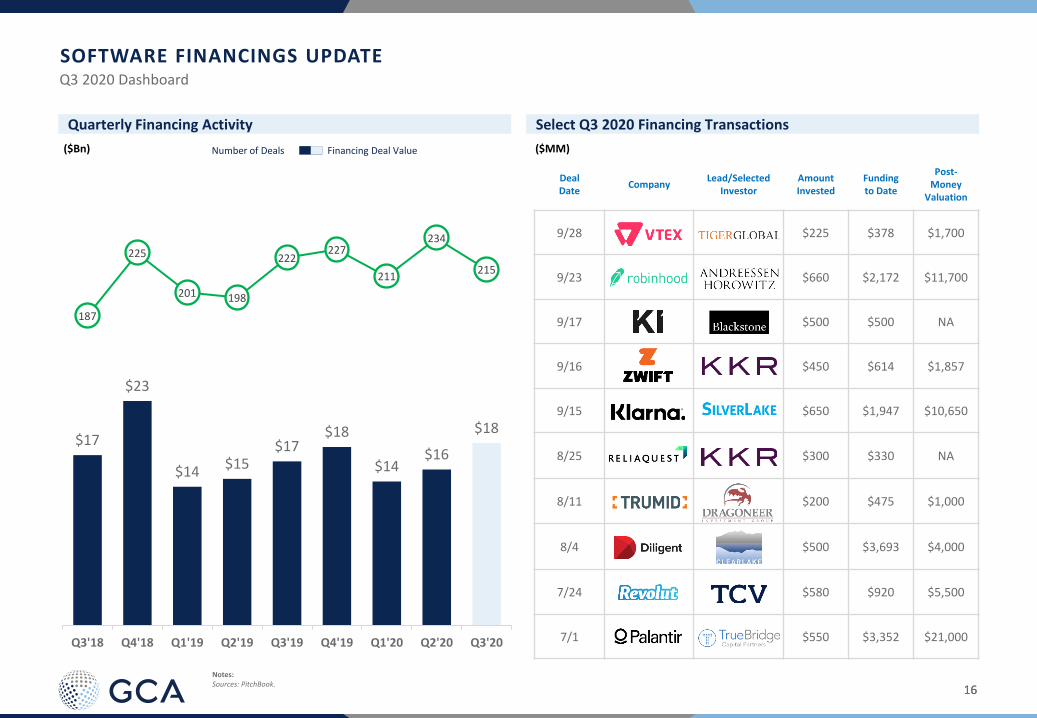
SOFTWARE FINANCINGS UPDATE
Quarterly Financing Activity Select Q3 2020 Financing Transactions
DealDate
CompanyLead/Selected
InvestorAmount Invested
Funding to Date
Post-Money
Valuation
9/28 $225 $378 $1,700
9/23 $660 $2,172 $11,700
9/17 $500 $500 NA
9/16 $450 $614 $1,857
9/15 $650 $1,947 $10,650
8/25 $300 $330 NA
8/11 $200 $475 $1,000
8/4 $500 $3,693 $4,000
7/24 $580 $920 $5,500
7/1 $550 $3,352 $21,000
($MM)($Bn) Number of Deals Financing Deal Value
Q3 2020 Dashboard
Notes:Sources: PitchBook.
$17
$23
$14 $15 $17
$18
$14 $16
$18
187
225
201 198
222227
211
234
215
Q3'18 Q4'18 Q1'19 Q2'19 Q3'19 Q4'19 Q1'20 Q2'20 Q3'20
1717
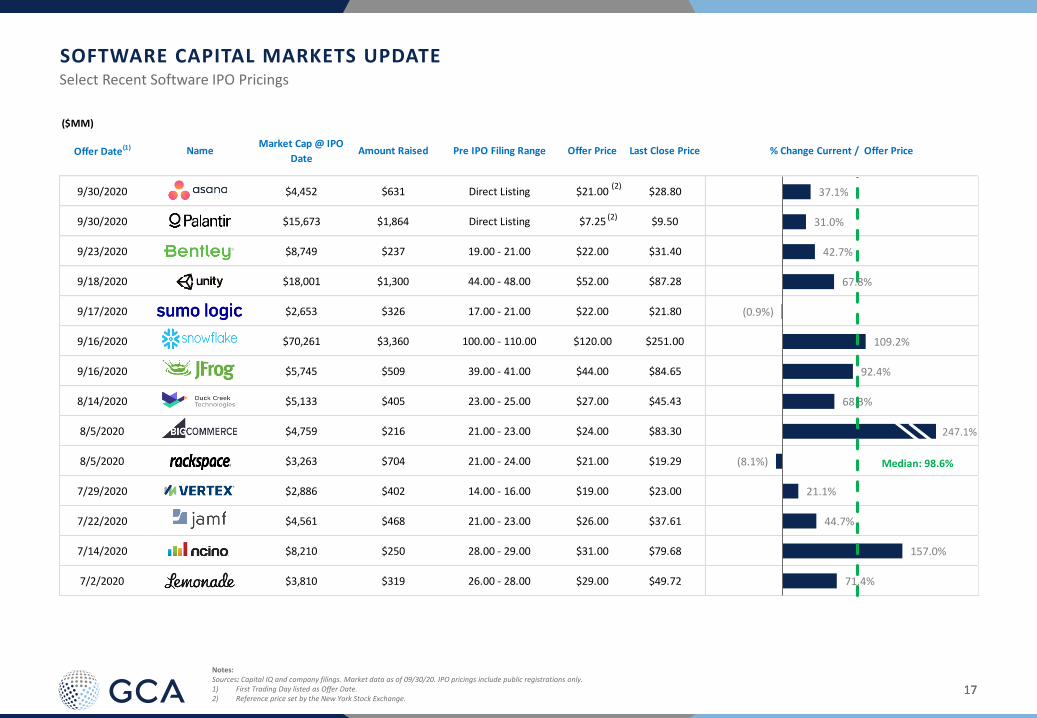
($MM)
Offer Date(1) Name Market Cap @ IPO
DateAmount Raised Pre IPO Filing Range Offer Price Last Close Price % Change Current / Offer Price
9/30/2020 $4,452 $631 Direct Listing $21.00 $28.80
9/30/2020 $15,673 $1,864 Direct Listing $7.25 $9.50
9/23/2020 $8,749 $237 19.00 - 21.00 $22.00 $31.40
9/18/2020 $18,001 $1,300 44.00 - 48.00 $52.00 $87.28
9/17/2020 $2,653 $326 17.00 - 21.00 $22.00 $21.80
9/16/2020 $70,261 $3,360 100.00 - 110.00 $120.00 $251.00
9/16/2020 $5,745 $509 39.00 - 41.00 $44.00 $84.65
8/14/2020 $5,133 $405 23.00 - 25.00 $27.00 $45.43
8/5/2020 $4,759 $216 21.00 - 23.00 $24.00 $83.30
8/5/2020 $3,263 $704 21.00 - 24.00 $21.00 $19.29
7/29/2020 $2,886 $402 14.00 - 16.00 $19.00 $23.00
7/22/2020 $4,561 $468 21.00 - 23.00 $26.00 $37.61
7/14/2020 $8,210 $250 28.00 - 29.00 $31.00 $79.68
7/2/2020 $3,810 $319 26.00 - 28.00 $29.00 $49.72 71.4%
157.0%
44.7%
21.1%
(8.1%)
68.3%
92.4%
109.2%
(0.9%)
67.8%
42.7%
31.0%
37.1%
Select Recent Software IPO Pricings
SOFTWARE CAPITAL MARKETS UPDATE
Notes:Sources: Capital IQ and company filings. Market data as of 09/30/20. IPO pricings include public registrations only. 1) First Trading Day listed as Offer Date. 2) Reference price set by the New York Stock Exchange.
(2)
Median: 98.6%
(2)
247.1%

1818
($MM)
Offer Date(1) Name Market Cap @ IPO
DateAmount Raised Pre IPO Filing Range Offer Price Last Close Price % Change Current / Offer Price
6/5/2020 $1,229 $345 19.00 - 21.00 $23.00 $48.36
6/4/2020 $1,513 $935 19.00 - 20.00 $21.00 $42.99
12/13/2019 $795 $150 16.00 - 18.00 $17.00 $38.50
12/12/2019 $2,505 $216 19.00 - 21.00 $22.00 $100.31
9/19/2019 $10,883 $648 19.00 - 22.00 $27.00 $102.16
9/19/2019 $1,561 $188 14.00 - 16.00 $15.00 $31.21
9/13/2019 $5,280 $525 12.00 - 14.00 $15.00 $41.06
8/1/2019 $6,572 $570 13.00 -15.00 $16.00 $41.02
7/19/2019 $4,565 $326 16.00 - 18.00 $21.00 $27.42
6/20/2019 $19,484 $4,560 Direct Listing $26.00 $26.86
6/12/2019 $11,408 $612 28.00 - 30.00 $34.00 $137.32
5/17/2019 $2,176 $180 14.00 - 16.00 $16.00 $93.68
4/18/2019 $15,896 $751 33.00 - 35.00 $36.00 $470.11
4/11/2019 $620 $108 12.00 - 14.00 $14.00 $8.25 (41.1%)
3.3%
30.6%
156.4%
108.1%
126.5%
104.7%
110.3%
(2)
Select Recent Software IPO Pricings (Cont.)
SOFTWARE CAPITAL MARKETS UPDATE
Notes:Sources: Capital IQ and company filings. Market data as of 09/30/20. IPO pricings include public registrations only. 1) First Trading Day listed as Offer Date. 2) Reference price set by the New York Stock Exchange.
MEDIAN: 98.6%
MEAN: 156.5%
Median: 98.6%
1205.9%
485.5%
303.9%
278.4%
356.0%
173.7%

19
APPENDIX

2020
($MM)
Trading Metrics Operating Metrics CIQ
Stock Price Market Cash & Total Enterprise EV / Revenue EV / EBITDA Revenue Growth Gross Margin EBITDA Margin Revenue
Company 9/30/2020 Cap ST. Invest. Debt Value (EV) CY19A CY20E CY21E CY19A CY20E CY21E 19A/18A 20E/19A 21E/20E CY19A CY20E CY21E CY19A CY20E CY21E
Platform
Microsoft Corporation $210.33 $1,591,704 $136,492 $82,110 $1,537,322 11.5x 10.3x 9.4x 25.1x 22.4x 19.9x 13% 11% 10% NM NM 66% 46% 46% 47%
Oracle Corporation $59.70 $179,750 $42,303 $70,766 $208,862 5.3x 5.3x 5.2x 11.1x 10.7x 10.6x 0% (0%) 2% NM NM 80% 47% 49% 49%
SAP SE $155.89 $185,643 $8,580 $19,218 $196,382 6.4x 5.9x 5.5x 17.4x 16.7x 15.0x 9% 7% 8% 72% 72% 71% 37% 36% 37%
International Business Machines Corporation$121.67 $108,357 $14,104 $69,765 $164,155 2.2x 2.2x 2.2x 9.0x 9.3x 8.6x (3%) (2%) 2% 47% 49% 48% 24% 24% 25%
Cisco Systems $39.39 $166,755 $29,425 $15,585 $152,915 3.0x 3.2x 3.1x 8.1x 8.8x 8.7x 1% (8%) 4% NM NM 63% 37% 36% 36%
Dell Technologies Inc. $67.69 $50,545 $11,221 $55,771 $100,072 1.1x 1.1x 1.1x 8.5x 8.8x 8.3x 2% (3%) 2% 34% 33% 31% 13% 13% 13%
HP Inc. $18.99 $26,083 $4,679 $7,418 $28,822 0.5x 0.5x 0.5x 5.5x 6.5x 6.1x (0%) (5%) 1% NM NM 18% 9% 8% 8%
Mean 4.3x 4.1x 3.8x 12.1x 11.9x 11.0x 3% 0% 4% 51% 51% 54% 30% 30% 31%
Median 3.0x 3.2x 3.1x 9.0x 9.3x 8.7x 1% (2%) 2% 47% 49% 63% 37% 36% 36%
Infrastructure
Zoom Video Communications $470.11 $133,709 $1,482 $73 $132,300 NM NM 43.6x NM NM NM 88% 285% 27% 82% 72% 78% 17% 33% 29%
Snowflake Inc. $251.00 $70,505 $591 $201 $70,115 NM NM NM NM NM NM 174% 114% 90% 56% 63% 67% NM NM NM
RingCentral $274.61 $24,429 $774 $1,094 $24,749 30.3x 21.7x 17.6x NM NM NM 33% 39% 23% 76% 76% 78% 15% 13% 13%
Akamai Technologies $110.54 $17,985 $1,373 $2,685 $19,298 6.7x 6.1x 5.7x 15.9x 14.1x 13.1x 7% 9% 7% 66% 65% 65% 42% 43% 44%
Citrix Systems $137.71 $17,012 $868 $1,930 $18,074 6.0x 5.6x 5.5x 15.8x 16.3x 16.9x 1% 7% 2% 86% 86% 86% 38% 34% 33%
Fastly $93.68 $9,840 $384 $30 $9,486 47.3x 32.0x 24.0x NM NM NM 39% 48% 33% 57% 60% 56% (9%) 5% 6%
Five9 $129.68 $8,473 $686 $655 $8,442 25.7x 21.1x 18.0x NM NM NM 27% 22% 17% 63% 64% 61% 19% 17% 18%
Rackspace Technology $19.29 $3,841 $161 $4,683 $8,362 3.4x 3.1x 2.9x 14.0x 11.0x 10.4x (1%) 9% 7% NM 38% 39% 24% 29% 28%
Amdocs Limited $57.41 $7,637 $1,194 $1,040 $7,525 1.8x 1.8x 1.7x 9.2x 9.1x 8.1x 3% 1% 4% NM NM 35% 20% 20% 22%
Juniper Networks $21.50 $7,133 $1,865 $1,885 $7,152 1.6x 1.6x 1.6x 7.5x 8.0x 7.5x (4%) (1%) 3% 60% 59% 60% 21% 20% 21%
Jamf Holding Corp. $37.61 $4,380 $38 $202 $4,543 22.3x 17.7x 14.8x NM NM NM 39% 26% 20% NM 80% 77% 9% 10% 9%
Everbridge $125.73 $4,348 $483 $461 $4,326 21.5x 16.3x 13.0x NM NM NM 37% 32% 26% 71% 70% 69% 3% 3% 5%
Verint Systems Inc. $48.18 $3,151 $814 $1,087 $3,441 2.6x 2.7x 2.5x 10.6x 10.6x 9.6x 6% (2%) 8% 68% 69% 67% 25% 26% 26%
Software Aktiengesellschaft $49.41 $3,656 $580 $251 $3,327 3.3x 3.3x 3.2x 10.8x 14.6x 13.7x 1% 1% 3% 77% 77% 77% 31% 23% 23%
Radware Ltd. $24.24 $1,119 $226 $25 $918 3.6x 3.7x 3.4x 21.6x 28.7x 21.3x 8% (2%) 9% 83% 83% 82% 17% 13% 16%
Extreme Networks $4.02 $494 $194 $482 $783 0.8x 0.9x 0.8x NA 13.6x 7.3x (1%) (14%) 7% NM NM 56% NA 7% 11%
Limelight Networks $5.76 $703 $18 $15 $700 3.5x 3.0x 2.7x 38.6x 20.6x 16.8x 3% 18% 10% 49% 51% 53% 9% 14% 16%
A10 Networks $6.37 $496 $143 $31 $384 1.8x 1.7x 1.6x NA 9.3x 7.4x (8%) 6% 9% NM 78% 78% NA 18% 21%
Mean 11.4x 8.9x 9.6x 16.0x 14.2x 12.0x 25% 33% 17% 69% 68% 66% 19% 19% 20%
Median 3.6x 3.5x 3.4x 14.0x 13.6x 10.4x 6% 9% 9% 68% 70% 67% 19% 18% 21%
Software Trading Statistics
PUBLIC COMPANY VALUATIONS
Notes:Sources: Capital IQ and Wall Street Estimates. Market data as of 09/30/20.Margins <(20%) considered NM. Multiples <0 or >50 considered NM.
2121
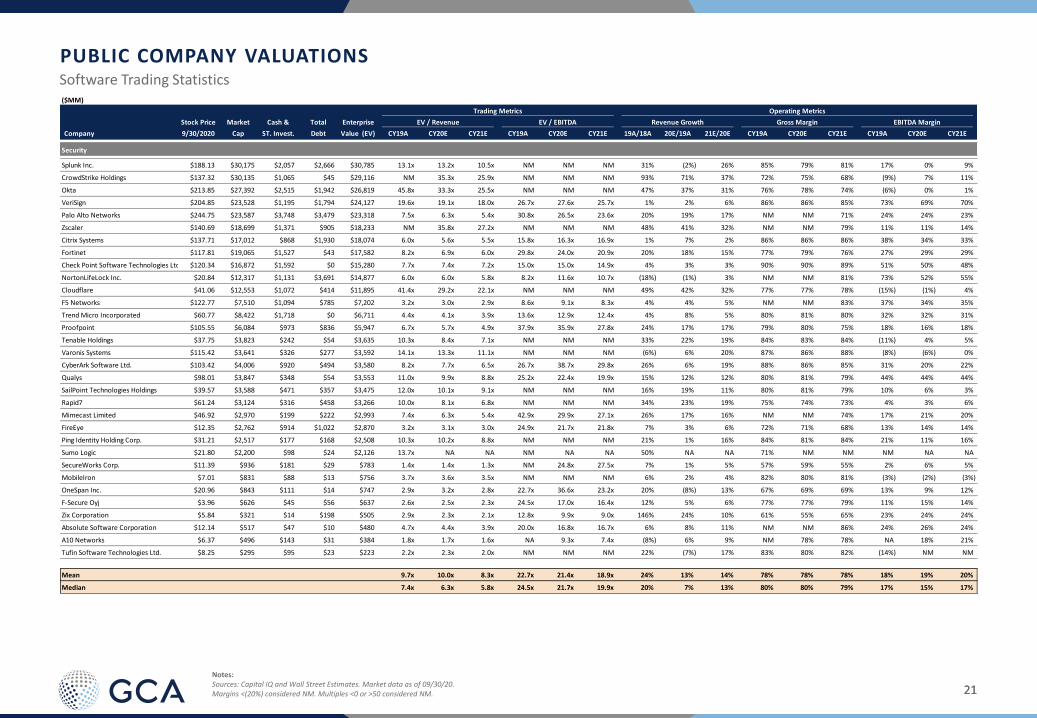
($MM)
Trading Metrics Operating Metrics CIQ
Stock Price Market Cash & Total Enterprise EV / Revenue EV / EBITDA Revenue Growth Gross Margin EBITDA Margin Revenue
Company 9/30/2020 Cap ST. Invest. Debt Value (EV) CY19A CY20E CY21E CY19A CY20E CY21E 19A/18A 20E/19A 21E/20E CY19A CY20E CY21E CY19A CY20E CY21E
Security
Splunk Inc. $188.13 $30,175 $2,057 $2,666 $30,785 13.1x 13.2x 10.5x NM NM NM 31% (2%) 26% 85% 79% 81% 17% 0% 9%
CrowdStrike Holdings $137.32 $30,135 $1,065 $45 $29,116 NM 35.3x 25.9x NM NM NM 93% 71% 37% 72% 75% 68% (9%) 7% 11%
Okta $213.85 $27,392 $2,515 $1,942 $26,819 45.8x 33.3x 25.5x NM NM NM 47% 37% 31% 76% 78% 74% (6%) 0% 1%
VeriSign $204.85 $23,528 $1,195 $1,794 $24,127 19.6x 19.1x 18.0x 26.7x 27.6x 25.7x 1% 2% 6% 86% 86% 85% 73% 69% 70%
Palo Alto Networks $244.75 $23,587 $3,748 $3,479 $23,318 7.5x 6.3x 5.4x 30.8x 26.5x 23.6x 20% 19% 17% NM NM 71% 24% 24% 23%
Zscaler $140.69 $18,699 $1,371 $905 $18,233 NM 35.8x 27.2x NM NM NM 48% 41% 32% NM NM 79% 11% 11% 14%
Citrix Systems $137.71 $17,012 $868 $1,930 $18,074 6.0x 5.6x 5.5x 15.8x 16.3x 16.9x 1% 7% 2% 86% 86% 86% 38% 34% 33%
Fortinet $117.81 $19,065 $1,527 $43 $17,582 8.2x 6.9x 6.0x 29.8x 24.0x 20.9x 20% 18% 15% 77% 79% 76% 27% 29% 29%
Check Point Software Technologies Ltd. $120.34 $16,872 $1,592 $0 $15,280 7.7x 7.4x 7.2x 15.0x 15.0x 14.9x 4% 3% 3% 90% 90% 89% 51% 50% 48%
NortonLifeLock Inc. $20.84 $12,317 $1,131 $3,691 $14,877 6.0x 6.0x 5.8x 8.2x 11.6x 10.7x (18%) (1%) 3% NM NM 81% 73% 52% 55%
Cloudflare $41.06 $12,553 $1,072 $414 $11,895 41.4x 29.2x 22.1x NM NM NM 49% 42% 32% 77% 77% 78% (15%) (1%) 4%
F5 Networks $122.77 $7,510 $1,094 $785 $7,202 3.2x 3.0x 2.9x 8.6x 9.1x 8.3x 4% 4% 5% NM NM 83% 37% 34% 35%
Trend Micro Incorporated $60.77 $8,422 $1,718 $0 $6,711 4.4x 4.1x 3.9x 13.6x 12.9x 12.4x 4% 8% 5% 80% 81% 80% 32% 32% 31%
Proofpoint $105.55 $6,084 $973 $836 $5,947 6.7x 5.7x 4.9x 37.9x 35.9x 27.8x 24% 17% 17% 79% 80% 75% 18% 16% 18%
Tenable Holdings $37.75 $3,823 $242 $54 $3,635 10.3x 8.4x 7.1x NM NM NM 33% 22% 19% 84% 83% 84% (11%) 4% 5%
Varonis Systems $115.42 $3,641 $326 $277 $3,592 14.1x 13.3x 11.1x NM NM NM (6%) 6% 20% 87% 86% 88% (8%) (6%) 0%
CyberArk Software Ltd. $103.42 $4,006 $920 $494 $3,580 8.2x 7.7x 6.5x 26.7x 38.7x 29.8x 26% 6% 19% 88% 86% 85% 31% 20% 22%
Qualys $98.01 $3,847 $348 $54 $3,553 11.0x 9.9x 8.8x 25.2x 22.4x 19.9x 15% 12% 12% 80% 81% 79% 44% 44% 44%
SailPoint Technologies Holdings $39.57 $3,588 $471 $357 $3,475 12.0x 10.1x 9.1x NM NM NM 16% 19% 11% 80% 81% 79% 10% 6% 3%
Rapid7 $61.24 $3,124 $316 $458 $3,266 10.0x 8.1x 6.8x NM NM NM 34% 23% 19% 75% 74% 73% 4% 3% 6%
Mimecast Limited $46.92 $2,970 $199 $222 $2,993 7.4x 6.3x 5.4x 42.9x 29.9x 27.1x 26% 17% 16% NM NM 74% 17% 21% 20%
FireEye $12.35 $2,762 $914 $1,022 $2,870 3.2x 3.1x 3.0x 24.9x 21.7x 21.8x 7% 3% 6% 72% 71% 68% 13% 14% 14%
Ping Identity Holding Corp. $31.21 $2,517 $177 $168 $2,508 10.3x 10.2x 8.8x NM NM NM 21% 1% 16% 84% 81% 84% 21% 11% 16%
Sumo Logic $21.80 $2,200 $98 $24 $2,126 13.7x NA NA NM NA NA 50% NA NA 71% NM NM NM NA NA
SecureWorks Corp. $11.39 $936 $181 $29 $783 1.4x 1.4x 1.3x NM 24.8x 27.5x 7% 1% 5% 57% 59% 55% 2% 6% 5%
MobileIron $7.01 $831 $88 $13 $756 3.7x 3.6x 3.5x NM NM NM 6% 2% 4% 82% 80% 81% (3%) (2%) (3%)
OneSpan Inc. $20.96 $843 $111 $14 $747 2.9x 3.2x 2.8x 22.7x 36.6x 23.2x 20% (8%) 13% 67% 69% 69% 13% 9% 12%
F-Secure Oyj $3.96 $626 $45 $56 $637 2.6x 2.5x 2.3x 24.5x 17.0x 16.4x 12% 5% 6% 77% 77% 79% 11% 15% 14%
Zix Corporation $5.84 $321 $14 $198 $505 2.9x 2.3x 2.1x 12.8x 9.9x 9.0x 146% 24% 10% 61% 55% 65% 23% 24% 24%
Absolute Software Corporation $12.14 $517 $47 $10 $480 4.7x 4.4x 3.9x 20.0x 16.8x 16.7x 6% 8% 11% NM NM 86% 24% 26% 24%
A10 Networks $6.37 $496 $143 $31 $384 1.8x 1.7x 1.6x NA 9.3x 7.4x (8%) 6% 9% NM 78% 78% NA 18% 21%
Tufin Software Technologies Ltd. $8.25 $295 $95 $23 $223 2.2x 2.3x 2.0x NM NM NM 22% (7%) 17% 83% 80% 82% (14%) NM NM
Mean 9.7x 10.0x 8.3x 22.7x 21.4x 18.9x 24% 13% 14% 78% 78% 78% 18% 19% 20%
Median 7.4x 6.3x 5.8x 24.5x 21.7x 19.9x 20% 7% 13% 80% 80% 79% 17% 15% 17%
Software Trading Statistics
PUBLIC COMPANY VALUATIONS
Notes:Sources: Capital IQ and Wall Street Estimates. Market data as of 09/30/20.Margins <(20%) considered NM. Multiples <0 or >50 considered NM.
2222
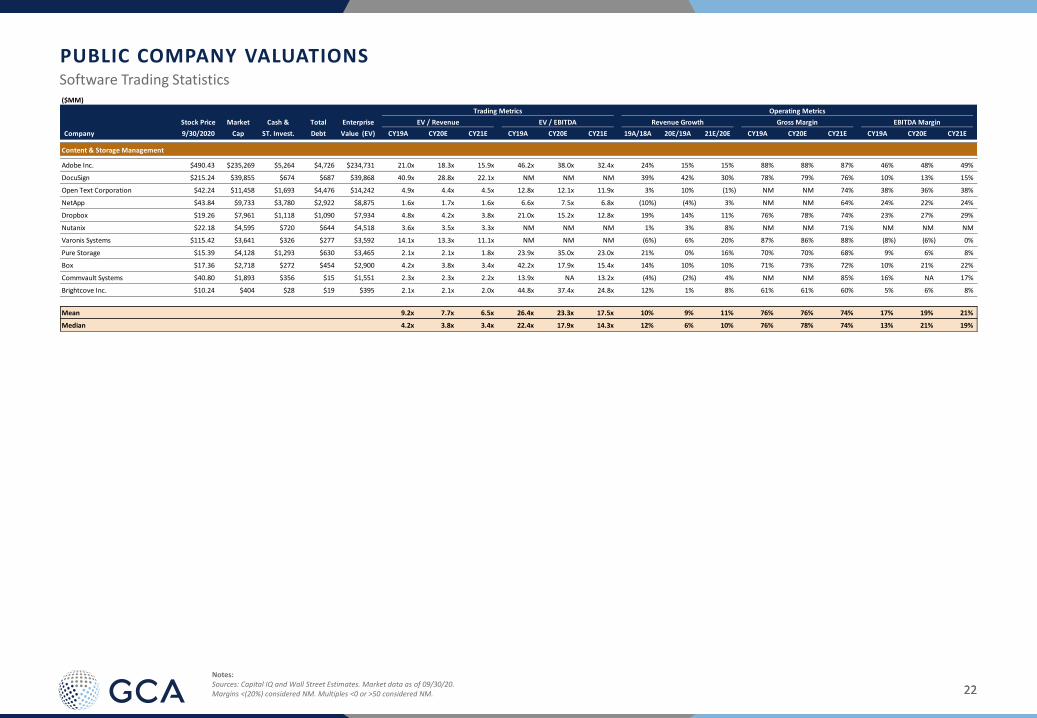
($MM)
Trading Metrics Operating Metrics CIQ
Stock Price Market Cash & Total Enterprise EV / Revenue EV / EBITDA Revenue Growth Gross Margin EBITDA Margin Revenue
Company 9/30/2020 Cap ST. Invest. Debt Value (EV) CY19A CY20E CY21E CY19A CY20E CY21E 19A/18A 20E/19A 21E/20E CY19A CY20E CY21E CY19A CY20E CY21E
Content & Storage Management
Adobe Inc. $490.43 $235,269 $5,264 $4,726 $234,731 21.0x 18.3x 15.9x 46.2x 38.0x 32.4x 24% 15% 15% 88% 88% 87% 46% 48% 49%
DocuSign $215.24 $39,855 $674 $687 $39,868 40.9x 28.8x 22.1x NM NM NM 39% 42% 30% 78% 79% 76% 10% 13% 15%
Open Text Corporation $42.24 $11,458 $1,693 $4,476 $14,242 4.9x 4.4x 4.5x 12.8x 12.1x 11.9x 3% 10% (1%) NM NM 74% 38% 36% 38%
NetApp $43.84 $9,733 $3,780 $2,922 $8,875 1.6x 1.7x 1.6x 6.6x 7.5x 6.8x (10%) (4%) 3% NM NM 64% 24% 22% 24%
Dropbox $19.26 $7,961 $1,118 $1,090 $7,934 4.8x 4.2x 3.8x 21.0x 15.2x 12.8x 19% 14% 11% 76% 78% 74% 23% 27% 29%
Nutanix $22.18 $4,595 $720 $644 $4,518 3.6x 3.5x 3.3x NM NM NM 1% 3% 8% NM NM 71% NM NM NM
Varonis Systems $115.42 $3,641 $326 $277 $3,592 14.1x 13.3x 11.1x NM NM NM (6%) 6% 20% 87% 86% 88% (8%) (6%) 0%
Pure Storage $15.39 $4,128 $1,293 $630 $3,465 2.1x 2.1x 1.8x 23.9x 35.0x 23.0x 21% 0% 16% 70% 70% 68% 9% 6% 8%
Box $17.36 $2,718 $272 $454 $2,900 4.2x 3.8x 3.4x 42.2x 17.9x 15.4x 14% 10% 10% 71% 73% 72% 10% 21% 22%
Commvault Systems $40.80 $1,893 $356 $15 $1,551 2.3x 2.3x 2.2x 13.9x NA 13.2x (4%) (2%) 4% NM NM 85% 16% NA 17%
Brightcove Inc. $10.24 $404 $28 $19 $395 2.1x 2.1x 2.0x 44.8x 37.4x 24.8x 12% 1% 8% 61% 61% 60% 5% 6% 8%
Mean 9.2x 7.7x 6.5x 26.4x 23.3x 17.5x 10% 9% 11% 76% 76% 74% 17% 19% 21%
Median 4.2x 3.8x 3.4x 22.4x 17.9x 14.3x 12% 6% 10% 76% 78% 74% 13% 21% 19%
Software Trading Statistics
PUBLIC COMPANY VALUATIONS
Notes:Sources: Capital IQ and Wall Street Estimates. Market data as of 09/30/20.Margins <(20%) considered NM. Multiples <0 or >50 considered NM.
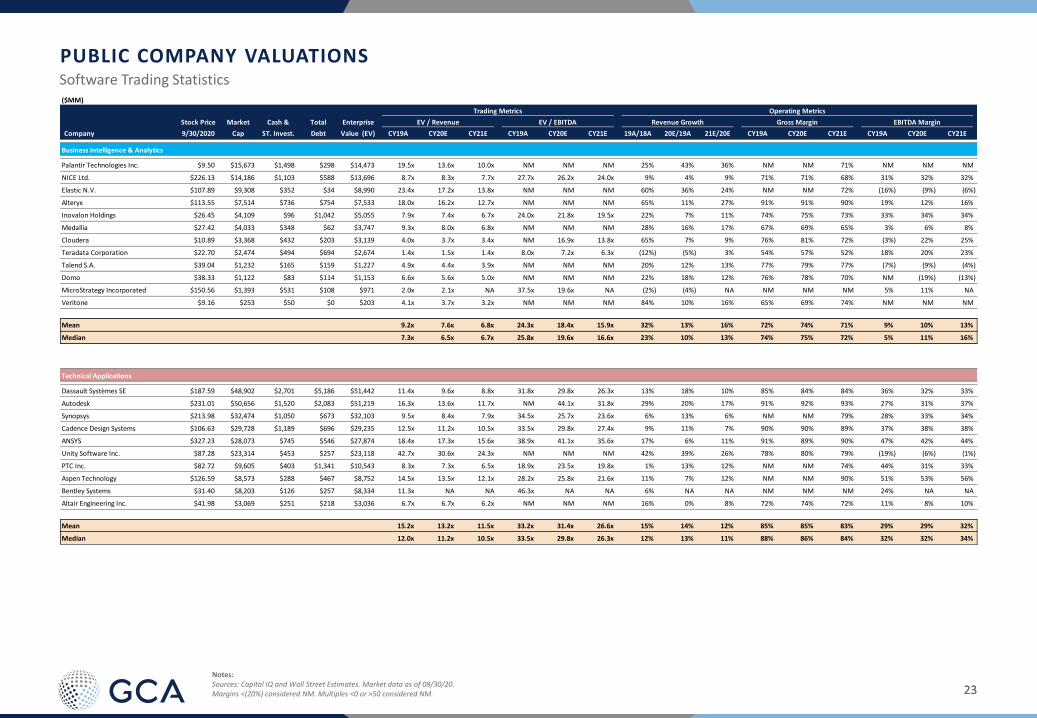
2323
($MM)
Trading Metrics Operating Metrics CIQ
Stock Price Market Cash & Total Enterprise EV / Revenue EV / EBITDA Revenue Growth Gross Margin EBITDA Margin Revenue
Company 9/30/2020 Cap ST. Invest. Debt Value (EV) CY19A CY20E CY21E CY19A CY20E CY21E 19A/18A 20E/19A 21E/20E CY19A CY20E CY21E CY19A CY20E CY21E
Business Intelligence & Analytics
Palantir Technologies Inc. $9.50 $15,673 $1,498 $298 $14,473 19.5x 13.6x 10.0x NM NM NM 25% 43% 36% NM NM 71% NM NM NM
NICE Ltd. $226.13 $14,186 $1,103 $588 $13,696 8.7x 8.3x 7.7x 27.7x 26.2x 24.0x 9% 4% 9% 71% 71% 68% 31% 32% 32%
Elastic N.V. $107.89 $9,308 $352 $34 $8,990 23.4x 17.2x 13.8x NM NM NM 60% 36% 24% NM NM 72% (16%) (9%) (6%)
Alteryx $113.55 $7,514 $736 $754 $7,533 18.0x 16.2x 12.7x NM NM NM 65% 11% 27% 91% 91% 90% 19% 12% 16%
Inovalon Holdings $26.45 $4,109 $96 $1,042 $5,055 7.9x 7.4x 6.7x 24.0x 21.8x 19.5x 22% 7% 11% 74% 75% 73% 33% 34% 34%
Medallia $27.42 $4,033 $348 $62 $3,747 9.3x 8.0x 6.8x NM NM NM 28% 16% 17% 67% 69% 65% 3% 6% 8%
Cloudera $10.89 $3,368 $432 $203 $3,139 4.0x 3.7x 3.4x NM 16.9x 13.8x 65% 7% 9% 76% 81% 72% (3%) 22% 25%
Teradata Corporation $22.70 $2,474 $494 $694 $2,674 1.4x 1.5x 1.4x 8.0x 7.2x 6.3x (12%) (5%) 3% 54% 57% 52% 18% 20% 23%
Talend S.A. $39.04 $1,232 $165 $159 $1,227 4.9x 4.4x 3.9x NM NM NM 20% 12% 13% 77% 79% 77% (7%) (9%) (4%)
Domo $38.33 $1,122 $83 $114 $1,153 6.6x 5.6x 5.0x NM NM NM 22% 18% 12% 76% 78% 70% NM (19%) (13%)
MicroStrategy Incorporated $150.56 $1,393 $531 $108 $971 2.0x 2.1x NA 37.5x 19.6x NA (2%) (4%) NA NM NM NM 5% 11% NA
Veritone $9.16 $253 $50 $0 $203 4.1x 3.7x 3.2x NM NM NM 84% 10% 16% 65% 69% 74% NM NM NM
Mean 9.2x 7.6x 6.8x 24.3x 18.4x 15.9x 32% 13% 16% 72% 74% 71% 9% 10% 13%
Median 7.3x 6.5x 6.7x 25.8x 19.6x 16.6x 23% 10% 13% 74% 75% 72% 5% 11% 16%
Technical Applications
Dassault Systèmes SE $187.59 $48,902 $2,701 $5,186 $51,442 11.4x 9.6x 8.8x 31.8x 29.8x 26.3x 13% 18% 10% 85% 84% 84% 36% 32% 33%
Autodesk $231.01 $50,656 $1,520 $2,083 $51,219 16.3x 13.6x 11.7x NM 44.1x 31.8x 29% 20% 17% 91% 92% 93% 27% 31% 37%
Synopsys $213.98 $32,474 $1,050 $673 $32,103 9.5x 8.4x 7.9x 34.5x 25.7x 23.6x 6% 13% 6% NM NM 79% 28% 33% 34%
Cadence Design Systems $106.63 $29,728 $1,189 $696 $29,235 12.5x 11.2x 10.5x 33.5x 29.8x 27.4x 9% 11% 7% 90% 90% 89% 37% 38% 38%
ANSYS $327.23 $28,073 $745 $546 $27,874 18.4x 17.3x 15.6x 38.9x 41.1x 35.6x 17% 6% 11% 91% 89% 90% 47% 42% 44%
Unity Software Inc. $87.28 $23,314 $453 $257 $23,118 42.7x 30.6x 24.3x NM NM NM 42% 39% 26% 78% 80% 79% (19%) (6%) (1%)
PTC Inc. $82.72 $9,605 $403 $1,341 $10,543 8.3x 7.3x 6.5x 18.9x 23.5x 19.8x 1% 13% 12% NM NM 74% 44% 31% 33%
Aspen Technology $126.59 $8,573 $288 $467 $8,752 14.5x 13.5x 12.1x 28.2x 25.8x 21.6x 11% 7% 12% NM NM 90% 51% 53% 56%
Bentley Systems $31.40 $8,203 $126 $257 $8,334 11.3x NA NA 46.3x NA NA 6% NA NA NM NM NM 24% NA NA
Altair Engineering Inc. $41.98 $3,069 $251 $218 $3,036 6.7x 6.7x 6.2x NM NM NM 16% 0% 8% 72% 74% 72% 11% 8% 10%
Mean 15.2x 13.2x 11.5x 33.2x 31.4x 26.6x 15% 14% 12% 85% 85% 83% 29% 29% 32%
Median 12.0x 11.2x 10.5x 33.5x 29.8x 26.3x 12% 13% 11% 88% 86% 84% 32% 32% 34%
Software Trading Statistics
PUBLIC COMPANY VALUATIONS
Notes:Sources: Capital IQ and Wall Street Estimates. Market data as of 09/30/20.Margins <(20%) considered NM. Multiples <0 or >50 considered NM.

2424
($MM)
Trading Metrics Operating Metrics CIQ
Stock Price Market Cash & Total Enterprise EV / Revenue EV / EBITDA Revenue Growth Gross Margin EBITDA Margin Revenue
Company 9/30/2020 Cap ST. Invest. Debt Value (EV) CY19A CY20E CY21E CY19A CY20E CY21E 19A/18A 20E/19A 21E/20E CY19A CY20E CY21E CY19A CY20E CY21E
Financial Applications
Fidelity National Information Services $147.21 $91,212 $1,183 $19,868 $110,087 10.7x 8.7x 8.0x 26.2x 20.9x 17.8x 23% 22% 8% 35% 35% 34% 41% 42% 45%
Fiserv $103.05 $69,007 $869 $21,874 $91,715 9.0x 6.1x 5.8x 18.7x 16.2x 14.1x 75% 47% 6% 47% 47% 47% 48% 38% 41%
Intuit Inc. $326.21 $85,404 $7,050 $3,636 $81,990 11.5x 10.4x 9.5x 32.1x 28.3x 25.6x 13% 10% 10% NM NM 84% 36% 37% 37%
MSCI Inc. $356.78 $29,840 $1,385 $3,543 $31,998 20.5x 19.0x 17.3x 37.6x 33.7x 30.3x 9% 8% 10% 81% 83% 81% 55% 56% 57%
SS&C Technologies Holdings $60.52 $15,589 $262 $7,235 $22,562 4.9x 4.9x 4.7x 12.3x 12.5x 12.0x 35% (0%) 3% 54% 58% 49% 39% 39% 40%
Coupa Software Incorporated $274.24 $18,881 $1,342 $1,490 $19,029 48.8x 38.2x 30.3x NM NM NM 50% 28% 26% 72% 72% 69% 9% 17% 20%
Fair Isaac Corporation $425.38 $12,336 $126 $1,032 $13,242 11.1x 10.7x 10.1x 35.3x 31.3x 29.5x 16% 4% 6% NM NM 70% 31% 34% 34%
Jack Henry & Associates $162.59 $12,410 $213 $69 $12,265 7.5x 7.1x 6.7x 23.0x 22.9x 21.2x 7% 6% 6% NM NM 42% 33% 31% 32%
Temenos AG $135.23 $9,782 $124 $1,118 $10,776 11.1x 11.4x 10.1x 29.4x 25.5x 23.2x 16% (3%) 13% 83% 82% 75% 38% 45% 44%
Xero Limited $72.22 $10,292 $319 $296 $10,269 23.2x 19.7x 15.9x NM NM NM 32% 18% 24% NM NM 84% 19% 21% 24%
Avalara $127.34 $10,634 $475 $67 $10,227 26.7x 21.8x 17.8x NM NM NM 41% 22% 22% 72% 72% 72% 0% (0%) 3%
Bill.com Holdings $100.31 $8,043 $698 $2 $7,348 NM 43.5x 35.1x NA NM NM NA 55% 24% NM NM 75% NA (9%) (2%)
nCino $79.68 $7,263 $388 $0 $6,879 49.8x 35.6x 28.8x NM NM NM 51% 40% 23% NM 59% 53% (17%) (9%) (6%)
SimCorp A/S $131.80 $5,223 $45 $79 $5,257 10.3x 9.8x 8.8x 32.9x 35.2x 28.0x 16% 5% 12% 63% 62% 62% 31% 28% 31%
Q2 Holdings $91.26 $4,881 $389 $479 $4,971 15.8x 12.4x 10.2x NM NM NM 31% 27% 22% 53% 54% 50% 6% 6% 7%
BlackLine $89.63 $5,100 $626 $409 $4,889 16.9x 14.5x 12.2x NM NM NM 27% 17% 19% 82% 82% 80% 9% 12% 12%
Envestnet $77.16 $4,149 $92 $682 $4,736 5.3x 4.8x 4.3x 24.5x 21.1x 18.8x 11% 9% 11% 69% 69% 45% 21% 23% 23%
Vertex $23.00 $3,376 $47 $174 $3,503 10.9x 9.6x 9.0x NM 47.3x NM 18% 13% 8% NM 70% 65% 15% 20% 18%
Asseco Poland S.A. $18.01 $1,495 $633 $807 $2,262 0.8x 0.7x 0.7x 5.3x 5.2x 4.9x 13% 10% 6% 22% NM 21% 15% 14% 14%
Shift4 Payments $48.36 $1,764 $244 $440 $2,170 3.0x 2.9x 2.1x NA 26.8x 14.9x 30% 3% 37% NM 54% 35% NA 11% 14%
Bottomline Technologies (de) $42.16 $1,884 $205 $213 $1,891 4.4x 4.2x 3.8x 19.3x 19.7x 17.0x 6% 4% 11% NM NM 57% 23% 21% 22%
IRESS Limited $6.86 $1,308 $69 $146 $1,385 3.9x 3.5x 3.2x 14.7x 15.1x 14.1x 9% 11% 10% 27% 22% 29% 26% 23% 23%
Ebix $20.60 $637 $109 $729 $1,306 2.2x 2.6x 2.1x 7.5x NA NA 17% (14%) 23% 64% 57% 63% 30% NA NA
Model N $35.28 $1,219 $192 $116 $1,143 7.9x 7.0x 6.4x NM NM 47.4x (4%) 13% 10% NM NM 57% 10% 12% 13%
Zuora $10.34 $1,222 $179 $74 $1,117 4.0x 3.8x 3.4x NM NM NM 17% 7% 10% 57% 62% 55% (10%) (2%) 2%
Basware Oyj $44.50 $642 $39 $92 $694 4.2x 3.9x 3.6x NM 32.6x 24.8x 3% 7% 10% 51% 56% 52% 3% 12% 14%
Mean 13.0x 12.2x 10.4x 22.8x 24.6x 21.5x 22% 14% 14% 58% 61% 58% 21% 21% 22%
Median 10.3x 9.2x 8.4x 23.7x 24.2x 20.0x 17% 10% 11% 60% 60% 57% 22% 21% 22%
Software Trading Statistics
PUBLIC COMPANY VALUATIONS
Notes:Sources: Capital IQ and Wall Street Estimates. Market data as of 09/30/20.Margins <(20%) considered NM. Multiples <0 or >50 considered NM.

2525
($MM)
Trading Metrics Operating Metrics CIQ
Stock Price Market Cash & Total Enterprise EV / Revenue EV / EBITDA Revenue Growth Gross Margin EBITDA Margin Revenue
Company 9/30/2020 Cap ST. Invest. Debt Value (EV) CY19A CY20E CY21E CY19A CY20E CY21E 19A/18A 20E/19A 21E/20E CY19A CY20E CY21E CY19A CY20E CY21E
Vertical Applications
Danaher Corporation $215.33 $152,757 $5,539 $23,281 $170,510 9.5x 8.0x 7.1x 38.2x 29.5x 25.0x 5% 19% 13% 56% 56% 56% 25% 27% 28%
Roper Technologies $395.11 $41,372 $1,871 $5,866 $45,368 8.5x 8.1x 7.2x 23.6x 22.9x 19.7x 3% 4% 13% 64% 64% 63% 36% 35% 37%
Veeva Systems Inc. $281.19 $42,411 $1,495 $57 $40,973 37.1x 28.9x 24.1x NM NM NM 28% 29% 20% 75% 74% 72% 40% 40% 39%
Amadeus IT Group $55.88 $25,135 $2,752 $5,779 $28,174 4.5x 8.9x 5.7x 11.2x 47.5x 15.6x 11% (50%) 56% 69% 72% 55% 40% 19% 37%
Cerner Corporation $72.29 $22,076 $441 $1,517 $23,152 4.1x 4.2x 4.0x 14.0x 13.4x 12.2x 6% (3%) 5% 82% 83% 82% 29% 31% 33%
Tyler Technologies $348.56 $14,026 $404 $20 $13,643 12.6x 12.0x 11.1x 45.0x 42.4x 38.1x 16% 4% 9% 52% 51% 49% 28% 28% 29%
Guidewire Software $104.27 $8,704 $1,145 $461 $8,020 11.4x 10.7x 10.6x NM NM NM (4%) 6% 2% NM NM 56% 20% 11% 3%
CoreLogic $67.67 $5,379 $137 $1,668 $6,910 3.9x 3.6x 3.6x 13.9x 11.0x 11.6x (1%) 10% (2%) 50% 55% 51% 28% 32% 31%
RealPage $57.64 $5,698 $639 $1,331 $6,390 6.5x 5.6x 5.0x 22.7x 20.9x 18.0x 14% 16% 11% 63% 63% 62% 29% 27% 28%
Duck Creek Technologies $45.43 $5,937 $15 $31 $5,953 33.0x 27.6x 23.7x NA NM NM NA 20% 17% NM NM 56% NA 3% (0%)
Sabre Corporation $6.51 $2,063 $1,306 $4,808 $5,575 1.4x 3.8x 2.1x 5.9x NM 16.2x 3% (63%) 80% 35% 10% 23% 24% (17%) 13%
AppFolio $141.81 $4,864 $74 $133 $4,922 19.2x 15.4x 12.9x NM NM NM 35% 25% 20% 60% 63% 62% 14% 16% 18%
Blackbaud $55.83 $2,696 $31 $599 $3,264 3.6x 3.6x 3.6x 17.4x 14.7x 14.7x 6% 1% (0%) 60% 58% 56% 21% 24% 24%
2U $33.86 $2,411 $195 $345 $2,561 4.5x 3.4x 2.9x NM NM NM 40% 29% 17% 72% 70% 74% (4%) 1% 4%
Lemonade $49.72 $2,813 $288 $0 $2,525 37.5x 28.8x 24.3x NM NM NM 199% 30% 18% 32% 23% 35% NM NM NM
Allscripts Healthcare Solutions $8.14 $1,327 $199 $1,163 $2,291 1.3x 1.4x 1.3x 7.8x 7.8x 7.1x 1% (5%) 2% 43% 41% 45% 17% 17% 19%
PROS Holdings $31.94 $1,384 $220 $146 $1,310 5.2x 5.2x 4.8x NM NM NM 27% 1% 7% 63% 60% 60% (5%) (13%) (6%)
HealthStream $20.07 $642 $145 $29 $527 2.1x 2.2x 2.4x 11.2x 12.6x 15.2x 10% (7%) (7%) 59% 63% 60% 18% 18% 16%
Castlight Health $1.13 $170 $44 $17 $143 1.0x 1.1x 1.1x NM NM NM (8%) (7%) (1%) 61% 63% 62% (11%) (8%) (4%)
Boxlight Corporation $1.61 $81 $6 $7 $82 2.1x 2.7x 2.1x NM NM NM 1% (21%) 27% 30% 31% 27% (8%) (6%) 2%
Mean 10.5x 9.3x 8.0x 19.2x 22.3x 17.6x 21% 2% 15% 57% 56% 55% 19% 15% 18%
Median 4.9x 5.4x 4.9x 14.0x 17.8x 15.6x 6% 4% 12% 60% 61% 56% 22% 18% 19%
Software Trading Statistics
PUBLIC COMPANY VALUATIONS
Notes:Sources: Capital IQ and Wall Street Estimates. Market data as of 09/30/20.Margins <(20%) considered NM. Multiples <0 or >50 considered NM.

2626
($MM)
Trading Metrics Operating Metrics CIQ
Stock Price Market Cash & Total Enterprise EV / Revenue EV / EBITDA Revenue Growth Gross Margin EBITDA Margin Revenue
Company 9/30/2020 Cap ST. Invest. Debt Value (EV) CY19A CY20E CY21E CY19A CY20E CY21E 19A/18A 20E/19A 21E/20E CY19A CY20E CY21E CY19A CY20E CY21E
ERP & General Business
salesforce.com $251.32 $228,701 $9,283 $6,188 $225,606 13.2x 10.8x 9.2x 45.0x 36.2x 30.8x 29% 22% 18% 78% 78% 76% 29% 30% 30%
Shopify Inc. $1,022.97 $124,677 $4,001 $153 $120,830 NM 46.2x 35.3x NM NM NM 47% 66% 31% 55% 53% 55% 5% 11% 10%
Workday $215.13 $51,020 $2,754 $2,137 $50,404 13.9x 11.8x 10.0x NM 47.2x 40.3x 29% 18% 18% 75% 76% 73% 21% 25% 25%
Constellation Software Inc. $1,110.54 $23,534 $593 $730 $23,671 6.8x 6.1x 5.3x 25.3x 21.3x 18.8x 14% 10% 17% NM NM 37% 27% 29% 28%
Paycom Software $311.30 $17,932 $114 $53 $17,872 24.2x 21.6x 18.1x NM NM 46.3x 30% 12% 19% 85% 86% 86% 43% 38% 39%
Slack Technologies $26.86 $15,324 $1,533 $846 $14,654 23.2x 16.7x 12.9x NM NM NM 57% 39% 29% 87% 88% 87% (17%) (6%) (3%)
Ceridian HCM Holding Inc. $82.65 $12,151 $527 $1,012 $12,636 15.3x 15.1x 13.1x NM NM NM 11% 2% 16% 46% 43% 46% 22% 19% 20%
Zendesk $102.92 $11,880 $997 $1,150 $12,033 14.7x 11.9x 9.6x NM NM NM 36% 24% 24% 75% 77% 73% 8% 10% 11%
The Sage Group plc $9.32 $10,186 $1,135 $1,432 $10,482 4.1x 4.3x 4.3x 16.4x 17.0x 16.9x 8% (5%) (0%) NM NM 93% 25% 25% 25%
Paylocity Holding Corporation $161.42 $8,687 $285 $181 $8,583 17.2x 14.8x 12.6x NM NM 49.4x 23% 16% 18% NM NM 64% 29% 25% 26%
Anaplan $62.58 $8,747 $305 $53 $8,495 24.4x 19.4x 15.4x NM NM NM 45% 26% 25% 76% 78% 74% (11%) (6%) (2%)
Manhattan Associates $95.49 $6,066 $124 $35 $5,977 9.7x 10.5x 9.6x 38.4x 43.3x 39.6x 11% (8%) 10% 55% 54% 56% 25% 24% 24%
BigCommerce Holdings $83.30 $5,632 $25 $88 $5,695 NM 39.8x 33.7x NM NM NM 22% 28% 18% NM 77% 77% NM NM (15%)
Smartsheet Inc. $49.42 $5,961 $546 $72 $5,486 20.3x 14.8x 11.5x NM NM NM 52% 37% 29% 82% 81% 81% (19%) (12%) (9%)
The Descartes Systems Group Inc $56.93 $4,809 $82 $14 $4,741 14.6x 13.8x 12.3x 38.7x 34.4x 30.4x 18% 5% 12% 74% 74% 73% 38% 40% 41%
J2 Global $69.22 $3,295 $617 $1,582 $4,261 3.1x 3.1x 2.9x 7.7x 7.6x 7.2x 14% 1% 5% 83% 83% 83% 40% 40% 40%
Cornerstone OnDemand $36.36 $2,339 $136 $1,320 $3,523 6.1x 4.9x 4.3x 27.0x 15.6x 12.9x 7% 25% 14% 76% 74% 73% 23% 31% 33%
Energy Harbor Corp. $23.51 $0 $1 $2,928 $2,927 NA NA NA NA NA NA NA NA NA NM NM NM NA NA NA
SPS Commerce $77.87 $2,735 $226 $22 $2,532 9.1x 8.3x 7.6x 36.3x 30.6x 26.8x 12% 9% 9% 68% 68% 67% 25% 27% 28%
Workiva Inc. $55.76 $2,663 $509 $325 $2,479 8.3x 7.2x 6.3x NM NM NM 22% 15% 14% 72% 74% 73% (2%) (2%) (1%)
Pluralsight $17.13 $1,917 $406 $568 $2,127 6.7x 5.6x 4.8x NM NM NM 37% 21% 17% 78% 81% 76% (13%) (6%) (2%)
Technology One Limited $5.69 $1,817 $51 $18 $1,784 8.7x 8.4x 7.3x 31.0x 25.8x 20.3x 14% 4% 15% NM NM 38% 28% 32% 36%
Upland Software $37.70 $1,108 $88 $571 $1,591 7.1x 5.7x 5.5x 19.3x 16.9x 16.2x 49% 25% 3% 71% 68% 68% 37% 34% 34%
Opera Limited $9.78 $1,150 $162 $8 $996 3.0x 3.3x 5.0x 21.9x NM 20.4x 94% (9%) (34%) 81% 81% 71% 14% 5% 24%
QAD Inc. $42.20 $873 $141 $34 $766 2.5x 2.5x 2.3x NM 34.9x 25.3x (7%) (3%) 8% 55% 58% 55% 4% 7% 9%
Benefitfocus $11.20 $361 $183 $283 $461 1.6x 1.7x 1.6x 24.2x 12.8x 11.7x 14% (10%) 9% 54% 52% 51% 6% 14% 14%
American Software $14.04 $456 $92 $2 $366 3.3x 3.2x 3.1x 23.2x 26.3x 22.3x 1% 0% 6% NM NM 54% 14% 12% 14%
Synchronoss Technologies $3.01 $131 $43 $73 $174 0.6x 0.6x 0.6x 6.3x 7.7x 5.1x (5%) (4%) 5% 52% 58% 53% 9% 8% 11%
ServiceSource International $1.47 $141 $41 $60 $160 0.7x 0.8x 0.8x 37.7x NM 24.6x (9%) (10%) 3% 30% 28% 30% 2% 1% 3%
Park City Group $4.93 $96 $20 $7 $83 4.3x 4.1x 3.8x 21.8x 23.9x 17.0x (16%) 6% 8% NM NM 69% 20% 17% 22%
Mean 9.9x 10.9x 9.3x 26.3x 25.1x 24.1x 23% 12% 13% 68% 69% 66% 15% 17% 18%
Median 8.3x 8.3x 7.3x 24.8x 24.9x 21.4x 18% 10% 14% 74% 74% 71% 20% 18% 22%
Software Trading Statistics
PUBLIC COMPANY VALUATIONS
Notes:Sources: Capital IQ and Wall Street Estimates. Market data as of 09/30/20.Margins <(20%) considered NM. Multiples <0 or >50 considered NM.
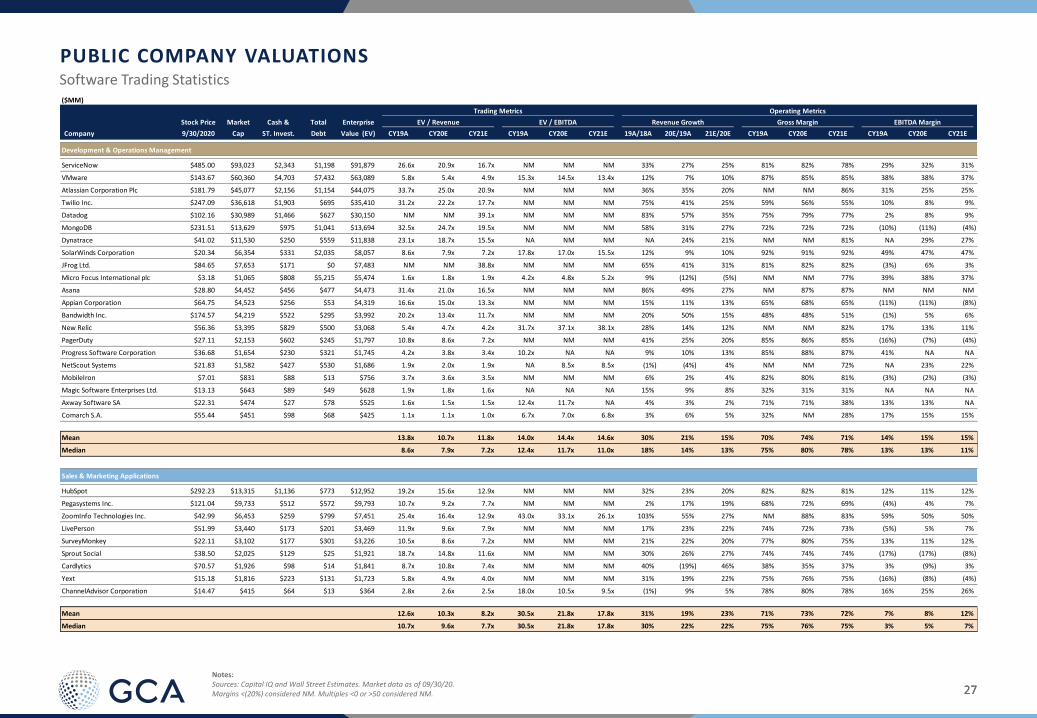
2727
($MM)
Trading Metrics Operating Metrics CIQ
Stock Price Market Cash & Total Enterprise EV / Revenue EV / EBITDA Revenue Growth Gross Margin EBITDA Margin Revenue
Company 9/30/2020 Cap ST. Invest. Debt Value (EV) CY19A CY20E CY21E CY19A CY20E CY21E 19A/18A 20E/19A 21E/20E CY19A CY20E CY21E CY19A CY20E CY21E
Development & Operations Management
ServiceNow $485.00 $93,023 $2,343 $1,198 $91,879 26.6x 20.9x 16.7x NM NM NM 33% 27% 25% 81% 82% 78% 29% 32% 31%
VMware $143.67 $60,360 $4,703 $7,432 $63,089 5.8x 5.4x 4.9x 15.3x 14.5x 13.4x 12% 7% 10% 87% 85% 85% 38% 38% 37%
Atlassian Corporation Plc $181.79 $45,077 $2,156 $1,154 $44,075 33.7x 25.0x 20.9x NM NM NM 36% 35% 20% NM NM 86% 31% 25% 25%
Twilio Inc. $247.09 $36,618 $1,903 $695 $35,410 31.2x 22.2x 17.7x NM NM NM 75% 41% 25% 59% 56% 55% 10% 8% 9%
Datadog $102.16 $30,989 $1,466 $627 $30,150 NM NM 39.1x NM NM NM 83% 57% 35% 75% 79% 77% 2% 8% 9%
MongoDB $231.51 $13,629 $975 $1,041 $13,694 32.5x 24.7x 19.5x NM NM NM 58% 31% 27% 72% 72% 72% (10%) (11%) (4%)
Dynatrace $41.02 $11,530 $250 $559 $11,838 23.1x 18.7x 15.5x NA NM NM NA 24% 21% NM NM 81% NA 29% 27%
SolarWinds Corporation $20.34 $6,354 $331 $2,035 $8,057 8.6x 7.9x 7.2x 17.8x 17.0x 15.5x 12% 9% 10% 92% 91% 92% 49% 47% 47%
JFrog Ltd. $84.65 $7,653 $171 $0 $7,483 NM NM 38.8x NM NM NM 65% 41% 31% 81% 82% 82% (3%) 6% 3%
Micro Focus International plc $3.18 $1,065 $808 $5,215 $5,474 1.6x 1.8x 1.9x 4.2x 4.8x 5.2x 9% (12%) (5%) NM NM 77% 39% 38% 37%
Asana $28.80 $4,452 $456 $477 $4,473 31.4x 21.0x 16.5x NM NM NM 86% 49% 27% NM 87% 87% NM NM NM
Appian Corporation $64.75 $4,523 $256 $53 $4,319 16.6x 15.0x 13.3x NM NM NM 15% 11% 13% 65% 68% 65% (11%) (11%) (8%)
Bandwidth Inc. $174.57 $4,219 $522 $295 $3,992 20.2x 13.4x 11.7x NM NM NM 20% 50% 15% 48% 48% 51% (1%) 5% 6%
New Relic $56.36 $3,395 $829 $500 $3,068 5.4x 4.7x 4.2x 31.7x 37.1x 38.1x 28% 14% 12% NM NM 82% 17% 13% 11%
PagerDuty $27.11 $2,153 $602 $245 $1,797 10.8x 8.6x 7.2x NM NM NM 41% 25% 20% 85% 86% 85% (16%) (7%) (4%)
Progress Software Corporation $36.68 $1,654 $230 $321 $1,745 4.2x 3.8x 3.4x 10.2x NA NA 9% 10% 13% 85% 88% 87% 41% NA NA
NetScout Systems $21.83 $1,582 $427 $530 $1,686 1.9x 2.0x 1.9x NA 8.5x 8.5x (1%) (4%) 4% NM NM 72% NA 23% 22%
MobileIron $7.01 $831 $88 $13 $756 3.7x 3.6x 3.5x NM NM NM 6% 2% 4% 82% 80% 81% (3%) (2%) (3%)
Magic Software Enterprises Ltd. $13.13 $643 $89 $49 $628 1.9x 1.8x 1.6x NA NA NA 15% 9% 8% 32% 31% 31% NA NA NA
Axway Software SA $22.31 $474 $27 $78 $525 1.6x 1.5x 1.5x 12.4x 11.7x NA 4% 3% 2% 71% 71% 38% 13% 13% NA
Comarch S.A. $55.44 $451 $98 $68 $425 1.1x 1.1x 1.0x 6.7x 7.0x 6.8x 3% 6% 5% 32% NM 28% 17% 15% 15%
Mean 13.8x 10.7x 11.8x 14.0x 14.4x 14.6x 30% 21% 15% 70% 74% 71% 14% 15% 15%
Median 8.6x 7.9x 7.2x 12.4x 11.7x 11.0x 18% 14% 13% 75% 80% 78% 13% 13% 11%
Sales & Marketing Applications
HubSpot $292.23 $13,315 $1,136 $773 $12,952 19.2x 15.6x 12.9x NM NM NM 32% 23% 20% 82% 82% 81% 12% 11% 12%
Pegasystems Inc. $121.04 $9,733 $512 $572 $9,793 10.7x 9.2x 7.7x NM NM NM 2% 17% 19% 68% 72% 69% (4%) 4% 7%
ZoomInfo Technologies Inc. $42.99 $6,453 $259 $799 $7,451 25.4x 16.4x 12.9x 43.0x 33.1x 26.1x 103% 55% 27% NM 88% 83% 59% 50% 50%
LivePerson $51.99 $3,440 $173 $201 $3,469 11.9x 9.6x 7.9x NM NM NM 17% 23% 22% 74% 72% 73% (5%) 5% 7%
SurveyMonkey $22.11 $3,102 $177 $301 $3,226 10.5x 8.6x 7.2x NM NM NM 21% 22% 20% 77% 80% 75% 13% 11% 12%
Sprout Social $38.50 $2,025 $129 $25 $1,921 18.7x 14.8x 11.6x NM NM NM 30% 26% 27% 74% 74% 74% (17%) (17%) (8%)
Cardlytics $70.57 $1,926 $98 $14 $1,841 8.7x 10.8x 7.4x NM NM NM 40% (19%) 46% 38% 35% 37% 3% (9%) 3%
Yext $15.18 $1,816 $223 $131 $1,723 5.8x 4.9x 4.0x NM NM NM 31% 19% 22% 75% 76% 75% (16%) (8%) (4%)
ChannelAdvisor Corporation $14.47 $415 $64 $13 $364 2.8x 2.6x 2.5x 18.0x 10.5x 9.5x (1%) 9% 5% 78% 80% 78% 16% 25% 26%
Mean 12.6x 10.3x 8.2x 30.5x 21.8x 17.8x 31% 19% 23% 71% 73% 72% 7% 8% 12%
Median 10.7x 9.6x 7.7x 30.5x 21.8x 17.8x 30% 22% 22% 75% 76% 75% 3% 5% 7%
Software Trading Statistics
PUBLIC COMPANY VALUATIONS
Notes:Sources: Capital IQ and Wall Street Estimates. Market data as of 09/30/20.Margins <(20%) considered NM. Multiples <0 or >50 considered NM.

2828
($MM)
Trading Metrics Operating Metrics CIQ
Stock Price Market Cash & Total Enterprise EV / Revenue EV / EBITDA Revenue Growth Gross Margin EBITDA Margin Revenue
Company 9/30/2020 Cap ST. Invest. Debt Value (EV) CY19A CY20E CY21E CY19A CY20E CY21E 19A/18A 20E/19A 21E/20E CY19A CY20E CY21E CY19A CY20E CY21E
SaaS
Adobe Inc. $490.43 $235,269 $5,264 $4,726 $234,731 21.0x 18.3x 15.9x 46.2x 38.0x 32.4x 24% 15% 15% 88% 88% 87% 46% 48% 49%
salesforce.com $251.32 $228,701 $9,283 $6,188 $225,606 13.2x 10.8x 9.2x 45.0x 36.2x 30.8x 29% 22% 18% 78% 78% 76% 29% 30% 30%
Zoom Video Communications $470.11 $133,709 $1,482 $73 $132,300 NM NM 43.6x NM NM NM 88% 285% 27% 82% 72% 78% 17% 33% 29%
Shopify Inc. $1,022.97 $124,677 $4,001 $153 $120,830 NM 46.2x 35.3x NM NM NM 47% 66% 31% 55% 53% 55% 5% 11% 10%
ServiceNow $485.00 $93,023 $2,343 $1,198 $91,879 26.6x 20.9x 16.7x NM NM NM 33% 27% 25% 81% 82% 78% 29% 32% 31%
Snowflake Inc. $251.00 $70,505 $591 $201 $70,115 NM NM NM NM NM NM 174% 114% 90% 56% 63% 67% NM NM NM
Workday $215.13 $51,020 $2,754 $2,137 $50,404 13.9x 11.8x 10.0x NM 47.2x 40.3x 29% 18% 18% 75% 76% 73% 21% 25% 25%
Atlassian Corporation Plc $181.79 $45,077 $2,156 $1,154 $44,075 33.7x 25.0x 20.9x NM NM NM 36% 35% 20% NM NM 86% 31% 25% 25%
Veeva Systems Inc. $281.19 $42,411 $1,495 $57 $40,973 37.1x 28.9x 24.1x NM NM NM 28% 29% 20% 75% 74% 72% 40% 40% 39%
DocuSign $215.24 $39,855 $674 $687 $39,868 40.9x 28.8x 22.1x NM NM NM 39% 42% 30% 78% 79% 76% 10% 13% 15%
Twilio Inc. $247.09 $36,618 $1,903 $695 $35,410 31.2x 22.2x 17.7x NM NM NM 75% 41% 25% 59% 56% 55% 10% 8% 9%
Splunk Inc. $188.13 $30,175 $2,057 $2,666 $30,785 13.1x 13.2x 10.5x NM NM NM 31% (2%) 26% 85% 79% 81% 17% 0% 9%
Datadog $102.16 $30,989 $1,466 $627 $30,150 NM NM 39.1x NM NM NM 83% 57% 35% 75% 79% 77% 2% 8% 9%
Okta $213.85 $27,392 $2,515 $1,942 $26,819 45.8x 33.3x 25.5x NM NM NM 47% 37% 31% 76% 78% 74% (6%) 0% 1%
RingCentral $274.61 $24,429 $774 $1,094 $24,749 30.3x 21.7x 17.6x NM NM NM 33% 39% 23% 76% 76% 78% 15% 13% 13%
Unity Software Inc. $87.28 $23,314 $453 $257 $23,118 42.7x 30.6x 24.3x NM NM NM 42% 39% 26% 78% 80% 79% (19%) (6%) (1%)
Coupa Software Incorporated $274.24 $18,881 $1,342 $1,490 $19,029 48.8x 38.2x 30.3x NM NM NM 50% 28% 26% 72% 72% 69% 9% 17% 20%
Zscaler $140.69 $18,699 $1,371 $905 $18,233 NM 35.8x 27.2x NM NM NM 48% 41% 32% NM NM 79% 11% 11% 14%
Paycom Software $311.30 $17,932 $114 $53 $17,872 24.2x 21.6x 18.1x NM NM 46.3x 30% 12% 19% 85% 86% 86% 43% 38% 39%
Slack Technologies $26.86 $15,324 $1,533 $846 $14,654 23.2x 16.7x 12.9x NM NM NM 57% 39% 29% 87% 88% 87% (17%) (6%) (3%)
Palantir Technologies Inc. $9.50 $15,673 $1,498 $298 $14,473 19.5x 13.6x 10.0x NM NM NM 25% 43% 36% NM NM 71% NM NM NM
HubSpot $292.23 $13,315 $1,136 $773 $12,952 19.2x 15.6x 12.9x NM NM NM 32% 23% 20% 82% 82% 81% 12% 11% 12%
Zendesk $102.92 $11,880 $997 $1,150 $12,033 14.7x 11.9x 9.6x NM NM NM 36% 24% 24% 75% 77% 73% 8% 10% 11%
Cloudflare $41.06 $12,553 $1,072 $414 $11,895 41.4x 29.2x 22.1x NM NM NM 49% 42% 32% 77% 77% 78% (15%) (1%) 4%
Dynatrace $41.02 $11,530 $250 $559 $11,838 23.1x 18.7x 15.5x NA NM NM NA 24% 21% NM NM 81% NA 29% 27%
NetApp $43.84 $9,733 $3,780 $2,922 $8,875 1.6x 1.7x 1.6x 6.6x 7.5x 6.8x (10%) (4%) 3% NM NM 64% 24% 22% 24%
Paylocity Holding Corporation $161.42 $8,687 $285 $181 $8,583 17.2x 14.8x 12.6x NM NM 49.4x 23% 16% 18% NM NM 64% 29% 25% 26%
Five9 $129.68 $8,473 $686 $655 $8,442 25.7x 21.1x 18.0x NM NM NM 27% 22% 17% 63% 64% 61% 19% 17% 18%
Bentley Systems $31.40 $8,203 $126 $257 $8,334 11.3x NA NA 46.3x NA NA 6% NA NA NM NM NM 24% NA NA
Dropbox $19.26 $7,961 $1,118 $1,090 $7,934 4.8x 4.2x 3.8x 21.0x 15.2x 12.8x 19% 14% 11% 76% 78% 74% 23% 27% 29%
JFrog Ltd. $84.65 $7,653 $171 $0 $7,483 NM NM 38.8x NM NM NM 65% 41% 31% 81% 82% 82% (3%) 6% 3%
ZoomInfo Technologies Inc. $42.99 $6,453 $259 $799 $7,451 25.4x 16.4x 12.9x 43.0x 33.1x 26.1x 103% 55% 27% NM 88% 83% 59% 50% 50%
Bill.com Holdings $100.31 $8,043 $698 $2 $7,348 NM 43.5x 35.1x NA NM NM NA 55% 24% NM NM 75% NA (9%) (2%)
nCino $79.68 $7,263 $388 $0 $6,879 49.8x 35.6x 28.8x NM NM NM 51% 40% 23% NM 59% 53% (17%) (9%) (6%)
RealPage $57.64 $5,698 $639 $1,331 $6,390 6.5x 5.6x 5.0x 22.7x 20.9x 18.0x 14% 16% 11% 63% 63% 62% 29% 27% 28%
Duck Creek Technologies $45.43 $5,937 $15 $31 $5,953 33.0x 27.6x 23.7x NA NM NM NA 20% 17% NM NM 56% NA 3% (0%)
Proofpoint $105.55 $6,084 $973 $836 $5,947 6.7x 5.7x 4.9x 37.9x 35.9x 27.8x 24% 17% 17% 79% 80% 75% 18% 16% 18%
Software Trading Statistics
PUBLIC COMPANY VALUATIONS
Notes:Sources: Capital IQ and Wall Street Estimates. Market data as of 09/30/20.Margins <(20%) considered NM. Multiples <0 or >50 considered NM.
2929
($MM)
Trading Metrics Operating Metrics CIQ
Stock Price Market Cash & Total Enterprise EV / Revenue EV / EBITDA Revenue Growth Gross Margin EBITDA Margin Revenue
Company 9/30/2020 Cap ST. Invest. Debt Value (EV) CY19A CY20E CY21E CY19A CY20E CY21E 19A/18A 20E/19A 21E/20E CY19A CY20E CY21E CY19A CY20E CY21E
SaaS (Cont.)
BigCommerce Holdings $83.30 $5,632 $25 $88 $5,695 NM 39.8x 33.7x NM NM NM 22% 28% 18% NM 77% 77% NM NM (15%)
Smartsheet Inc. $49.42 $5,961 $546 $72 $5,486 20.3x 14.8x 11.5x NM NM NM 52% 37% 29% 82% 81% 81% (19%) (12%) (9%)
Q2 Holdings $91.26 $4,881 $389 $479 $4,971 15.8x 12.4x 10.2x NM NM NM 31% 27% 22% 53% 54% 50% 6% 6% 7%
AppFolio $141.81 $4,864 $74 $133 $4,922 19.2x 15.4x 12.9x NM NM NM 35% 25% 20% 60% 63% 62% 14% 16% 18%
BlackLine $89.63 $5,100 $626 $409 $4,889 16.9x 14.5x 12.2x NM NM NM 27% 17% 19% 82% 82% 80% 9% 12% 12%
Envestnet $77.16 $4,149 $92 $682 $4,736 5.3x 4.8x 4.3x 24.5x 21.1x 18.8x 11% 9% 11% 69% 69% 45% 21% 23% 23%
Jamf Holding Corp. $37.61 $4,380 $38 $202 $4,543 22.3x 17.7x 14.8x NM NM NM 39% 26% 20% NM 80% 77% 9% 10% 9%
Asana $28.80 $4,452 $456 $477 $4,473 31.4x 21.0x 16.5x NM NM NM 86% 49% 27% NM 87% 87% NM NM NM
Everbridge $125.73 $4,348 $483 $461 $4,326 21.5x 16.3x 13.0x NM NM NM 37% 32% 26% 71% 70% 69% 3% 3% 5%
J2 Global $69.22 $3,295 $617 $1,582 $4,261 3.1x 3.1x 2.9x 7.7x 7.6x 7.2x 14% 1% 5% 83% 83% 83% 40% 40% 40%
Medallia $27.42 $4,033 $348 $62 $3,747 9.3x 8.0x 6.8x NM NM NM 28% 16% 17% 67% 69% 65% 3% 6% 8%
Varonis Systems $115.42 $3,641 $326 $277 $3,592 14.1x 13.3x 11.1x NM NM NM (6%) 6% 20% 87% 86% 88% (8%) (6%) 0%
Qualys $98.01 $3,847 $348 $54 $3,553 11.0x 9.9x 8.8x 25.2x 22.4x 19.9x 15% 12% 12% 80% 81% 79% 44% 44% 44%
Cornerstone OnDemand $36.36 $2,339 $136 $1,320 $3,523 6.1x 4.9x 4.3x 27.0x 15.6x 12.9x 7% 25% 14% 76% 74% 73% 23% 31% 33%
Vertex $23.00 $3,376 $47 $174 $3,503 10.9x 9.6x 9.0x NM 47.3x NM 18% 13% 8% NM 70% 65% 15% 20% 18%
LivePerson $51.99 $3,440 $173 $201 $3,469 11.9x 9.6x 7.9x NM NM NM 17% 23% 22% 74% 72% 73% (5%) 5% 7%
Pure Storage $15.39 $4,128 $1,293 $630 $3,465 2.1x 2.1x 1.8x 23.9x 35.0x 23.0x 21% 0% 16% 70% 70% 68% 9% 6% 8%
Cloudera $10.89 $3,368 $432 $203 $3,139 4.0x 3.7x 3.4x NM 16.9x 13.8x 65% 7% 9% 76% 81% 72% (3%) 22% 25%
New Relic $56.36 $3,395 $829 $500 $3,068 5.4x 4.7x 4.2x 31.7x 37.1x 38.1x 28% 14% 12% NM NM 82% 17% 13% 11%
Mimecast Limited $46.92 $2,970 $199 $222 $2,993 7.4x 6.3x 5.4x 42.9x 29.9x 27.1x 26% 17% 16% NM NM 74% 17% 21% 20%
Box $17.36 $2,718 $272 $454 $2,900 4.2x 3.8x 3.4x 42.2x 17.9x 15.4x 14% 10% 10% 71% 73% 72% 10% 21% 22%
SPS Commerce $77.87 $2,735 $226 $22 $2,532 9.1x 8.3x 7.6x 36.3x 30.6x 26.8x 12% 9% 9% 68% 68% 67% 25% 27% 28%
Ping Identity Holding Corp. $31.21 $2,517 $177 $168 $2,508 10.3x 10.2x 8.8x NM NM NM 21% 1% 16% 84% 81% 84% 21% 11% 16%
Workiva Inc. $55.76 $2,663 $509 $325 $2,479 8.3x 7.2x 6.3x NM NM NM 22% 15% 14% 72% 74% 73% (2%) (2%) (1%)
Sumo Logic $21.80 $2,200 $98 $24 $2,126 13.7x NA NA NM NA NA 50% NA NA 71% NM NM NM NA NA
Sprout Social $38.50 $2,025 $129 $25 $1,921 18.7x 14.8x 11.6x NM NM NM 30% 26% 27% 74% 74% 74% (17%) (17%) (8%)
PagerDuty $27.11 $2,153 $602 $245 $1,797 10.8x 8.6x 7.2x NM NM NM 41% 25% 20% 85% 86% 85% (16%) (7%) (4%)
Talend S.A. $39.04 $1,232 $165 $159 $1,227 4.9x 4.4x 3.9x NM NM NM 20% 12% 13% 77% 79% 77% (7%) (9%) (4%)
Zuora $10.34 $1,222 $179 $74 $1,117 4.0x 3.8x 3.4x NM NM NM 17% 7% 10% 57% 62% 55% (10%) (2%) 2%
Zix Corporation $5.84 $321 $14 $198 $505 2.9x 2.3x 2.1x 12.8x 9.9x 9.0x 146% 24% 10% 61% 55% 65% 23% 24% 24%
Benefitfocus $11.20 $361 $183 $283 $461 1.6x 1.7x 1.6x 24.2x 12.8x 11.7x 14% (10%) 9% 54% 52% 51% 6% 14% 14%
ChannelAdvisor Corporation $14.47 $415 $64 $13 $364 2.8x 2.6x 2.5x 18.0x 10.5x 9.5x (1%) 9% 5% 78% 80% 78% 16% 25% 26%
Veritone $9.16 $253 $50 $0 $203 4.1x 3.7x 3.2x NM NM NM 84% 10% 16% 65% 69% 74% NM NM NM
Park City Group $4.93 $96 $20 $7 $83 4.3x 4.1x 3.8x 21.8x 23.9x 17.0x (16%) 6% 8% NM NM 69% 20% 17% 22%
Mean 17.2x 15.3x 13.8x 28.9x 24.9x 22.5x 37% 28% 20% 74% 74% 73% 12% 14% 16%
Median 13.9x 13.3x 11.3x 25.2x 22.4x 19.3x 29% 23% 20% 76% 77% 74% 13% 13% 14%
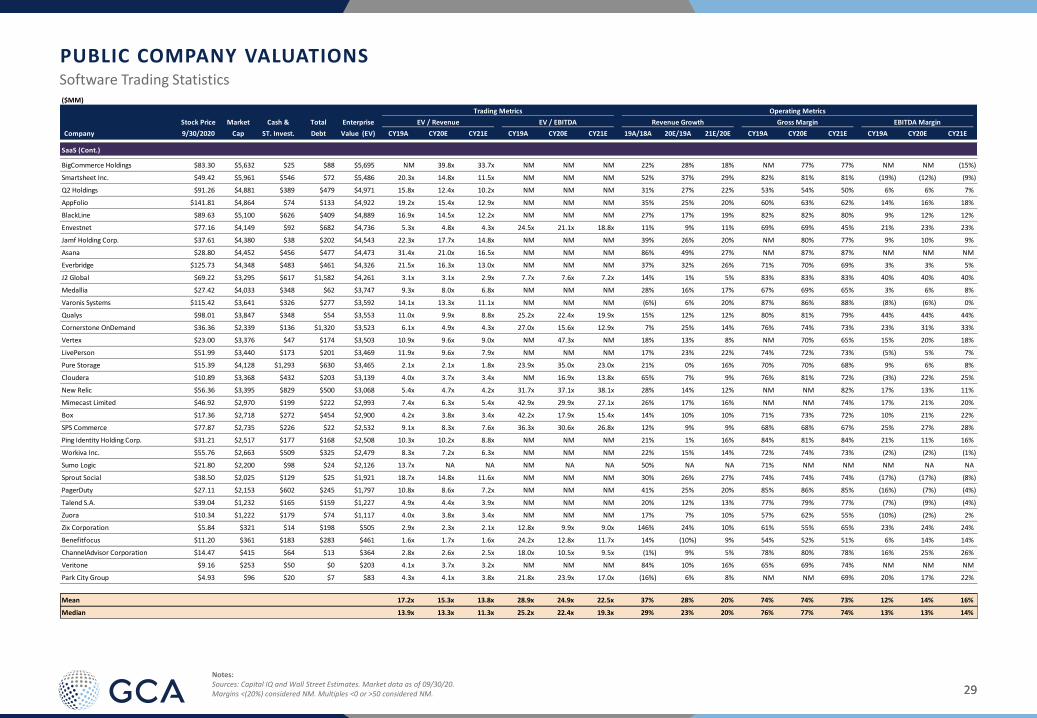
Software Trading Statistics
PUBLIC COMPANY VALUATIONS
Notes:Sources: Capital IQ and Wall Street Estimates. Market data as of 09/30/20.Margins <(20%) considered NM. Multiples <0 or >50 considered NM.

3030
($MM)
Announced Enterprise EV / Revenue EV / EBITDA
Date Acquirer Target Value (EV) LTM NTM LTM NTM Target Description
9/30/20 Sumo DigitalPipeworks
Studios$60 3.1x NA NA NA
Develops and provides videogames for businesses, the public sector and consumers. Offerings enable AI capabilities and include PC
and console games.
9/28/20 Ivanti MobileIron $930 3.9x NA NM NAProvides secure mobile device and application management SaaS and software for businesses and government agencies. Software
enables cybersecurity, unified endpoint management and passwordless multi-factor authentication capabilities.
9/23/20 CrowdStrike Preempt Security $96 NA NA NA NAProvides adaptive threat prevention security SaaS and software for businesses. Software continuously analyzes, adapts and responds
to potential cyber-security breaches based on identity, behavior and risk to auto-resolve insider threats and targeted attacks.
9/21/20 Microsoft ZeniMax Media $7,500 NA NA NA NA Develops PC, console, mobile, online and virtual reality (VR) video games for consumers globally.
9/21/20 PagerDuty Rundeck $100 NA NA NA NAProvides open-source DevOps automation SaaS for businesses. Software enables front-line incident response teams to run automated
machine-centric workflows that prevent, diagnose and resolve incidents at the push of a button.
9/16/20 Koch Media Vertigo Games $59 NA NA NA NA Develops virtual reality games for use on PCs and consoles and in arcades.
9/14/20 Wolters Kluwer XCM Solutions $161 NA NA NA NA
Provides workflow automation and scheduling SaaS to tax, accounting and financial sectors in the United States and Canada, as well
as provides features for automated workflow and accountability, compliance, assessment and monitoring of team performance,
benchmarking and outsourced client accounting services (CAS).
9/11/20 Verisk Analytics Franco Signor $160 NA NA NA NAActs as a Medicare Secondary Payer (MSP) compliance firm that provides related insurance claim management software and services
for employers, insurers and third party administrators in the US.
9/8/20Progress
SoftwareChef Software $220 3.1x NA NA NA
Provides IT systems configuration automation SaaS for enterprises that enables the automated creation, deployment and
management of infrastructure tasks based on the storage and analysis of reusable definitions stored on the network server.
9/8/20 Apax Partners MyCase $193 6.7x NA NA NA
Provides law practice and case management SaaS for the legal industry in the United States as well as features for team collaboration,
client communication, contact and task management, time and expense management, client billing and invoicing, document
management, and reporting.
9/3/20 Medallia StellaService $100 NA NA NA NAProvides customer service automation SaaS for businesses. Software enables real-time feedback, coaching and quality management
for customer service teams.
Select Software M&A Transactions
RECENT ACQUISITIONS
Notes:Sources: Capital IQ and Wall Street Estimates. Reflects M&A activity through 09/30/20, where Enterprise Value is >$50MM.Transactions highlighted in light blue denote private equity transactions. Multiples <0 and >50 considered NM.
3131
($MM)
Announced Enterprise EV / Revenue EV / EBITDA
Date Acquirer Target Value (EV) LTM NTM LTM NTM Target Description
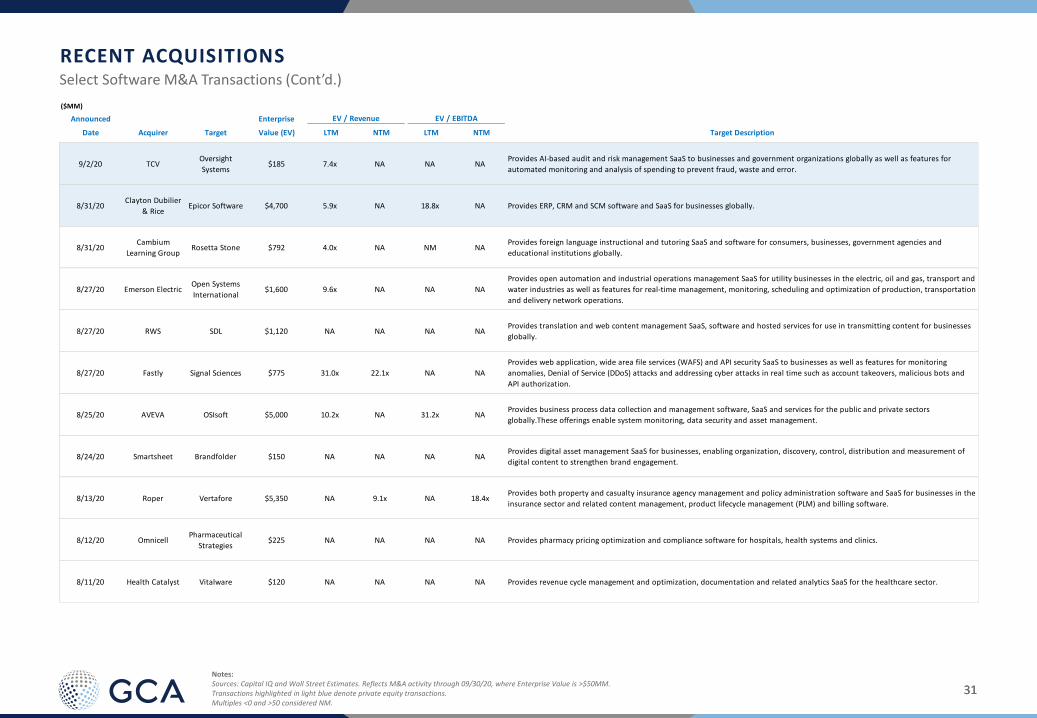
9/2/20 TCVOversight
Systems$185 7.4x NA NA NA
Provides AI-based audit and risk management SaaS to businesses and government organizations globally as well as features for
automated monitoring and analysis of spending to prevent fraud, waste and error.
8/31/20Clayton Dubilier
& RiceEpicor Software $4,700 5.9x NA 18.8x NA Provides ERP, CRM and SCM software and SaaS for businesses globally.
8/31/20Cambium
Learning GroupRosetta Stone $792 4.0x NA NM NA
Provides foreign language instructional and tutoring SaaS and software for consumers, businesses, government agencies and
educational institutions globally.
8/27/20 Emerson ElectricOpen Systems
International$1,600 9.6x NA NA NA
Provides open automation and industrial operations management SaaS for utility businesses in the electric, oil and gas, transport and
water industries as well as features for real-time management, monitoring, scheduling and optimization of production, transportation
and delivery network operations.
8/27/20 RWS SDL $1,120 NA NA NA NAProvides translation and web content management SaaS, software and hosted services for use in transmitting content for businesses
globally.
8/27/20 Fastly Signal Sciences $775 31.0x 22.1x NA NA
Provides web application, wide area file services (WAFS) and API security SaaS to businesses as well as features for monitoring
anomalies, Denial of Service (DDoS) attacks and addressing cyber attacks in real time such as account takeovers, malicious bots and
API authorization.
8/25/20 AVEVA OSIsoft $5,000 10.2x NA 31.2x NAProvides business process data collection and management software, SaaS and services for the public and private sectors
globally.These offerings enable system monitoring, data security and asset management.
8/24/20 Smartsheet Brandfolder $150 NA NA NA NAProvides digital asset management SaaS for businesses, enabling organization, discovery, control, distribution and measurement of
digital content to strengthen brand engagement.
8/13/20 Roper Vertafore $5,350 NA 9.1x NA 18.4xProvides both property and casualty insurance agency management and policy administration software and SaaS for businesses in the
insurance sector and related content management, product lifecycle management (PLM) and billing software.
8/12/20 OmnicellPharmaceutical
Strategies$225 NA NA NA NA Provides pharmacy pricing optimization and compliance software for hospitals, health systems and clinics.
8/11/20 Health Catalyst Vitalware $120 NA NA NA NA Provides revenue cycle management and optimization, documentation and related analytics SaaS for the healthcare sector.
Select Software M&A Transactions (Cont’d.)
RECENT ACQUISITIONS
Notes:Sources: Capital IQ and Wall Street Estimates. Reflects M&A activity through 09/30/20, where Enterprise Value is >$50MM.Transactions highlighted in light blue denote private equity transactions. Multiples <0 and >50 considered NM.

3232
($MM)
Announced Enterprise EV / Revenue EV / EBITDA
Date Acquirer Target Value (EV) LTM NTM LTM NTM Target Description
8/10/20 FINEOS Limelight Health $75 5.2x NA NA NA
Provides quoting and underwriting SaaS for employees benefits industry. Software provides elimination of duplicate entries,
automated enforcement of underwriting rules, rule based quoting, rating engine, document management, data analysis and
reporting.
8/11/20 Health Catalyst Vitalware $120 NA NA NA NA Provides revenue cycle management and optimization, documentation and related analytics SaaS for the healthcare sector.
8/5/20
American Virtual
Cloud
Technologies
Kandy
Communications$59 NA NA NA NA
Provides cloud-based unified communications as a service (UCaaS), communications platform as a service (CPaaS) and contact center
as a service (CCaaS) for service providers, partners and enterprises.
8/3/20
FinTech
Acquisition
Corp. III
Paya $1,102 NA 4.6x NA NAProvides payment management SaaS for businesses globally. Software includes features for online, in-store or on-the-go transactions
and payments processing, cash flow, and transaction reporting.
7/31/20Francisco
Partners
Consignor Group
AS$165 NA NA NA NA
Provides multi-carrier delivery management and logistics SaaS for businesses globally. Software supports customers’ delivery
processes and connects shippers’ websites and warehouses with their customers.
7/30/20 Strata Decision EPSi LLC $365 NA NA NA NA Provides financial decision support, planning, budgeting and forecasting, and analytics SaaS for hospitals and health systems.
7/30/20 Corsair Capital MSTS $300 NA NA NA NAProvides both business-to-business (B2B) payment, credit and A/R management SaaS and services for businesses in the
transportation, manufacturing, retail and e-commerce industries.
7/29/20Clarivate
AnalyticsCPA Global $6,800 12.1x NA NA NA
Provides intellectual property (IP) workflow management software, including patent portfolio optimization, patent search and
analytics, contract management, trademark renewals, and document review.
7/28/20Zebra
TechnologiesReflexis Systems $575 NA NA NA NA
Provides AI-enabled workforce management and business intelligence SaaS for corporate performance monitoring, reporting and
business optimization.
7/28/20Network
InternationalDirect Pay $288 NA NA NA NA Provides online payment processing SaaS for retail businesses.
7/27/20 Black Knight Optimal Blue $1,800 NA NA 38.7x NAProvides mortgage pricing and eligibility, mortgage sales, mortgage rate quoting and marketing automation SaaS, for banks, mortgage
lenders and loan officers.
RECENT ACQUISITIONSSelect Software M&A Transactions (Cont’d.)
Notes:Sources: Capital IQ and Wall Street Estimates. Reflects M&A activity through 09/30/20, where Enterprise Value is >$50MM.Transactions highlighted in light blue denote private equity transactions. Multiples <0 and >50 considered NM.
3333
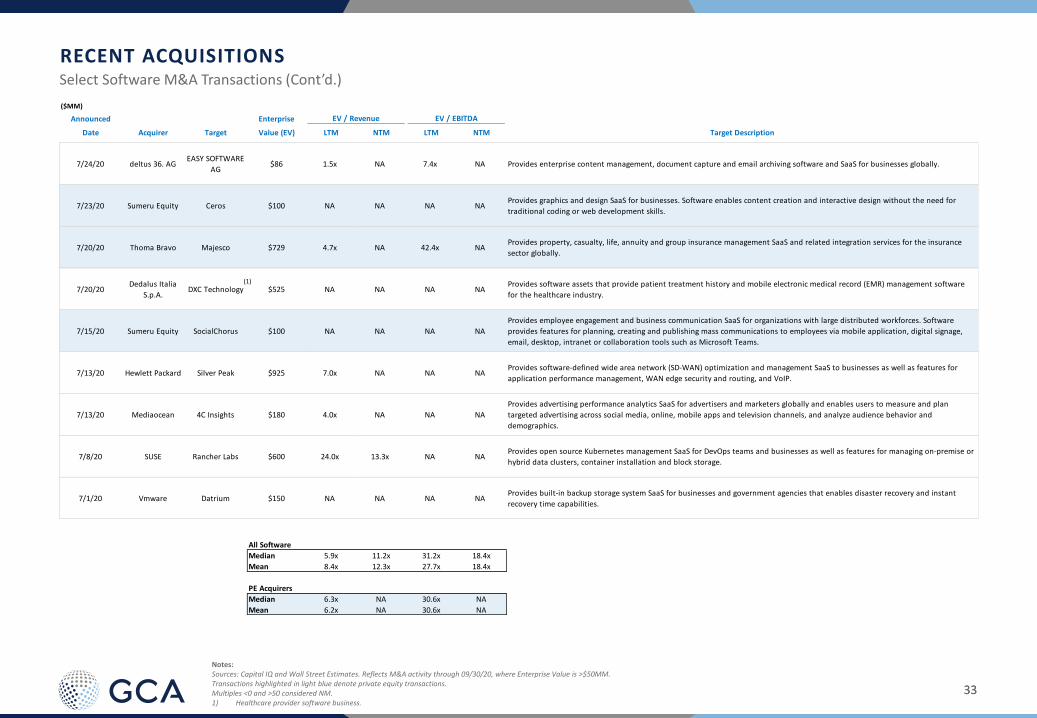
($MM)
Announced Enterprise EV / Revenue EV / EBITDA
Date Acquirer Target Value (EV) LTM NTM LTM NTM Target Description
7/24/20 deltus 36. AGEASY SOFTWARE
AG$86 1.5x NA 7.4x NA Provides enterprise content management, document capture and email archiving software and SaaS for businesses globally.
7/23/20 Sumeru Equity Ceros $100 NA NA NA NAProvides graphics and design SaaS for businesses. Software enables content creation and interactive design without the need for
traditional coding or web development skills.
7/20/20 Thoma Bravo Majesco $729 4.7x NA 42.4x NAProvides property, casualty, life, annuity and group insurance management SaaS and related integration services for the insurance
sector globally.
7/20/20Dedalus Italia
S.p.A.DXC Technology $525 NA NA NA NA
Provides software assets that provide patient treatment history and mobile electronic medical record (EMR) management software
for the healthcare industry.
7/15/20 Sumeru Equity SocialChorus $100 NA NA NA NA
Provides employee engagement and business communication SaaS for organizations with large distributed workforces. Software
provides features for planning, creating and publishing mass communications to employees via mobile application, digital signage,
email, desktop, intranet or collaboration tools such as Microsoft Teams.
7/13/20 Hewlett Packard Silver Peak $925 7.0x NA NA NAProvides software-defined wide area network (SD-WAN) optimization and management SaaS to businesses as well as features for
application performance management, WAN edge security and routing, and VoIP.
7/13/20 Mediaocean 4C Insights $180 4.0x NA NA NA
Provides advertising performance analytics SaaS for advertisers and marketers globally and enables users to measure and plan
targeted advertising across social media, online, mobile apps and television channels, and analyze audience behavior and
demographics.
7/8/20 SUSE Rancher Labs $600 24.0x 13.3x NA NAProvides open source Kubernetes management SaaS for DevOps teams and businesses as well as features for managing on-premise or
hybrid data clusters, container installation and block storage.
7/1/20 Vmware Datrium $150 NA NA NA NAProvides built-in backup storage system SaaS for businesses and government agencies that enables disaster recovery and instant
recovery time capabilities.
All Software
Median 5.9x 11.2x 31.2x 18.4x
Mean 8.4x 12.3x 27.7x 18.4x
PE Acquirers
Median 6.3x NA 30.6x NA
Mean 6.2x NA 30.6x NA
Notes:Sources: Capital IQ and Wall Street Estimates. Reflects M&A activity through 09/30/20, where Enterprise Value is >$50MM.Transactions highlighted in light blue denote private equity transactions. Multiples <0 and >50 considered NM.1) Healthcare provider software business.
RECENT ACQUISITIONSSelect Software M&A Transactions (Cont’d.)
(1)

3434
($MM)
Deal Date CompanyAmount
Raised Brief Description Investors
9/30/20 Zhangmen.com $450Developer of an online education technology platform in China designed to let children take
classes online.
Canada Pension Plan Investment Board, Chinese Culture Group, Genesis Capital (Hong Kong),
International Finance Corporation, SB China Venture Capital
9/30/20 BioCatch $168Developer of a biometric technology designed to recognize a wide range of human and non-
human cybersecurity threats.
American Express Ventures, Bain Capital Tech Opportunities, Barclays, Blumberg Capital, Citigroup,
CreditEase, HSBC, Industry Ventures, Janvest Capital Partners, Maverick Ventures
9/30/20 SendinBlue $160Developer of a digital marketing platform designed to help businesses grow through stronger
customer relationships. BlackRock, Bpifrance, Bridgepoint Advisers, Partech
9/30/20 HOMER $50Developer of an essential early learning program designed to provide kids a personalized learning
journey that grows with them as they build skills for school and life.
3one4 Capital, Amanat Holdings, Gymboree Play & Music, Interlock Partners, LEGO Ventures,
Liquidity Capital, Sesame Workshop, TrustBridge Partners, Vaidya Capital Partners
9/29/20 Seismic $92Developer of an end-to-end sales enablement platform designed to help marketing and sales
teams fulfill their promises of driving revenue.
Ameriprise Financial, EDBI, Jackson Square Ventures, Lightspeed Venture Partners, Permira, T.
Rowe Price
9/29/20 Bitpanda $52Provider of a digital investment platform intended to offer users a portal to buy and sell digital
assets and cryptocurrencies. Speedinvest, UNIQA Ventures, Valar Ventures
9/28/20 VTEX $225Developer of a cloud-based e-commerce platform intended to help companies to future proof
their businesses and free them from software updates.
Constellation Asset Management, Endeavor Catalyst, Lone Pine Capital, SoftBank Group, Tiger
Global Management
9/24/20 Within3 $100Operator of a virtual engagement platform intended for healthcare professionals to collaborate
with patients. Insight Partners, Silversmith Capital Partners
9/24/20 MineralTree $50Provider of a cloud-based automation software designed to automate Accounts Payable and
business to business payments. .406 Ventures, Eight Roads, Great Hill Partners
9/23/20 Robinhood $660Developer of an investment platform intended to help teach people to invest in the stock
market.
9Yards Capital, Andreessen Horowitz, D1 Capital Partners, DST Global, Founders Circle Capital, IVP,
Redalpine Venture Partners, Ribbit Capital, Sequoia Capital, Sung Capital Partners
9/23/20 Attentive $230Developer of a personalized mobile messaging platform designed to change the way businesses
and consumers interact.
Atomico, Bain Capital Ventures, Coatue Management, D1 Capital Partners, IVP, NextView
Ventures, Sapphire Ventures, Sequoia Capital, Tiger Global Management, Wellington Mgmt.
9/23/20 Salsify $155Developer of a product experience management platform designed to drive online products and
increase sales. Venrock, Warburg Pincus
9/23/20Shangxian
Technology$100
Provider of advertising and precision marketing services intended for gaming, e-commerce and IT
services companies. Bain Capital
9/23/20 SpotOn $60Developer of a cloud-based financial platform designed to give businesses an unparalleled set of
growth-driving tools. Dragoneer Investment Group, DST Global, Franklin Templeton Investments
9/22/20 Mirakl $300Developer of a marketplace platform designed to plug directly into an e-commerce tech
ecosystem. 83North, Bain Capital Ventures, Elaia Partners, Felix Capital, Permira
9/22/20 Nucarf $50Provider of an online platform designed to provide business solutions for road freight logistics
industry. Eastern Bell Venture Capital
9/21/20 JoyNext $105 Developer of intelligent solutions for networked vehicles. Cathay Capital Private Equity, F&G Ventures, Ningbo Gaofa Automotive Control System Company,
Platinum VC, State Development and Investment Corporation
9/21/20 Playco $100Operator of an instant-play gaming company intended to create games that people can play
together.
Bragiel Brothers, Caffeinated Capital, Digital Garage, Dreamers VC, Good AI Capital, Joshua Buckley,
KSK Angel Fund, Makers Fund, Mistletoe, Sequoia Capital, Sozo Ventures
9/21/20 TrueLayer $60Developer of an API platform designed for individuals to share or aggregate their financial
information from different providers.
Anthemis Group, Connect Ventures, Mouro Capital, Northzone Ventures, Temasek Holdings,
Tencent Holdings, Visa Ventures
RECENT FINANCINGS
Notes:Sources: PitchBook. Reflects deal activity through 09/30/20. Transactions reflect recent software venture and private equity growth / expansion activity where the amount raised was greater than or equal to $50MM.
Selected Software Private Financings

3535
($MM)
Deal Date CompanyAmount
Raised Brief Description Investors
9/18/20Mobile Premier
League$90 Developer of an eSports platform designed to offer cash prizes while playing games.
Bae Growth, Base Partners, Go-Ventures, GV Games, MDI Ventures, Pegasus Tech Ventures, RTP
Global, Sequoia Capital India, SIG Susquehanna
9/18/20 Holidu $53Developer of a travel search engine platform designed to make finding and booking vacation
rentals easy.
Chris Hitchen, Coparion, EQT Ventures, Kees Koolen, Mairdumont Ventures, Prime Ventures,
Senovo, Venture Stars
9/17/20 Ki Insurance $500 Operator of a digital and algorithmically-driven insurance syndicate platform. Brit, The Blackstone Group
9/17/20 AvidXchange $66Developer of an automated invoice and payment processing platform designed to offer accounts
payable and on-demand invoice management services. Undisclosed Investors
9/16/20 Zwift $450Provider of an interactive fitness platform intended to transform monotonous solo indoor cycling
and running workouts into dynamic and social adventures.
Amazon Alexa Fund, Causeway Media Partners, Highland Europe, Ilkka Paananen, Kohlberg Kravis
Roberts, Novator Partners, Permira, Specialized Bicycle Components, Zone 5 Ventures
9/16/20 AppDirect $185Developer of an end-to-end cloud commerce platform designed to make it easy for customers to
find, buy and use any recurring digital service. Caisse de dépôt et placement du Québec, Mithril Capital Management
9/16/20 Internetware $102 Developer of a DaaaS (Data as a Service) platform. Changchun Financial Holding Group
9/16/20 Factris $65Developer of a flexible credit line platform intended to help small and medium-sized businesses
meet their cash requirements and financing needs. AB Ventures (Arabia), Optima Investments, Speedinvest
9/15/20 Klarna $650Developer of an online payment platform designed to facilitate cashless payments through
installments.
Ant Group, BlackRock, Bonnier, Government of Singapore Investment Corporation (GIC), HMI
Capital, Merian Chrysalis Investment, Northzone Ventures, Silver Lake Management, TCV
9/15/20 Snyk $200 Developer of security analysis tools designed to identify open-source vulnerabilities. Addition
9/15/20 Devo $60Developer of a data analytics platform intended to provide a complete and unified view of
business operations. Bessemer Venture Partners, Georgian Partners, Insight Partners
9/15/20 Observe.AI $54Developer of a quality assurance engine designed to turn customer conversations into actionable
intelligence. Menlo Ventures, Next47, NGP Capital
9/14/20 Dream11 $225Developer of an online fantasy sports platform designed to play various fantasy league games
such as cricket, football, kabaddi, basketball, hockey, volleyball, baseball and handball. ChrysCapital, Footpath Ventures, Tiger Global Management, TPG Growth
9/14/20 Airtable $185Provider of an all-in-one collaboration platform designed to democratize software creation by
enabling anyone to build the tools that meet their needs.
Benchmark (San Francisco), Caffeinated Capital, Coatue Management, CRV, D1 Capital Partners,
Thrive Capital
9/11/20 MDLive $75Provider of on-demand digital healthcare services intended to provide access to board-certified
doctors via phone, video and application. Sixth Street Partners
9/10/20 Everlaw $78Developer of a cloud-based litigation platform intended to offer corporate counsels, litigators and
government attorneys. Andreessen Horowitz, CapitalG, K9 Ventures, Menlo Ventures, OVO Fund
9/8/20 Mollie $106Developer of payment application designed to simplify the entire process of setting up an online
store and accepting payments. TCV
9/2/20 Unacademy $150 Provider of an online learning platform designed to prepare students for competitive exams. Blume Ventures, Facebook, General Atlantic, Nexus Venture Partners, Sequoia Capital India,
SoftBank Investment Advisers
9/1/20 Neon $300Developer of a digital banking platform designed to uniting technology and design to simplify
users' financial experience.
BlackRock Innovation Capital Group, Endeavor Catalyst, Flourish Ventures, General Atlantic,
Monashees, PayPal Ventures, Propel Venture Partners, Vulcan Capital
RECENT FINANCINGS
Notes:Sources: PitchBook. Reflects deal activity through 09/30/20. Transactions reflect recent software venture and private equity growth / expansion activity where the amount raised was greater than or equal to $50MM.
Selected Software Private Financings (Cont’d.)
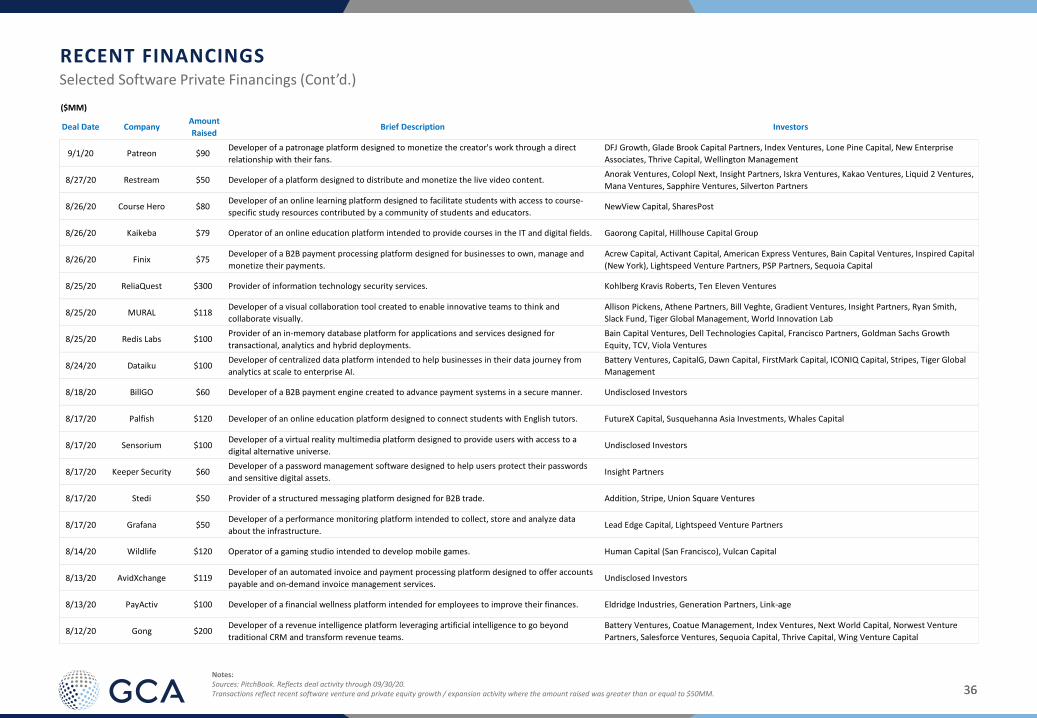
3636
($MM)
Deal Date CompanyAmount
Raised Brief Description Investors
9/1/20 Patreon $90Developer of a patronage platform designed to monetize the creator's work through a direct
relationship with their fans.
DFJ Growth, Glade Brook Capital Partners, Index Ventures, Lone Pine Capital, New Enterprise
Associates, Thrive Capital, Wellington Management
8/27/20 Restream $50 Developer of a platform designed to distribute and monetize the live video content. Anorak Ventures, Colopl Next, Insight Partners, Iskra Ventures, Kakao Ventures, Liquid 2 Ventures,
Mana Ventures, Sapphire Ventures, Silverton Partners
8/26/20 Course Hero $80Developer of an online learning platform designed to facilitate students with access to course-
specific study resources contributed by a community of students and educators. NewView Capital, SharesPost
8/26/20 Kaikeba $79 Operator of an online education platform intended to provide courses in the IT and digital fields. Gaorong Capital, Hillhouse Capital Group
8/26/20 Finix $75Developer of a B2B payment processing platform designed for businesses to own, manage and
monetize their payments.
Acrew Capital, Activant Capital, American Express Ventures, Bain Capital Ventures, Inspired Capital
(New York), Lightspeed Venture Partners, PSP Partners, Sequoia Capital
8/25/20 ReliaQuest $300 Provider of information technology security services. Kohlberg Kravis Roberts, Ten Eleven Ventures
8/25/20 MURAL $118Developer of a visual collaboration tool created to enable innovative teams to think and
collaborate visually.
Allison Pickens, Athene Partners, Bill Veghte, Gradient Ventures, Insight Partners, Ryan Smith,
Slack Fund, Tiger Global Management, World Innovation Lab
8/25/20 Redis Labs $100Provider of an in-memory database platform for applications and services designed for
transactional, analytics and hybrid deployments.
Bain Capital Ventures, Dell Technologies Capital, Francisco Partners, Goldman Sachs Growth
Equity, TCV, Viola Ventures
8/24/20 Dataiku $100Developer of centralized data platform intended to help businesses in their data journey from
analytics at scale to enterprise AI.
Battery Ventures, CapitalG, Dawn Capital, FirstMark Capital, ICONIQ Capital, Stripes, Tiger Global
Management
8/18/20 BillGO $60 Developer of a B2B payment engine created to advance payment systems in a secure manner. Undisclosed Investors
8/17/20 Palfish $120 Developer of an online education platform designed to connect students with English tutors. FutureX Capital, Susquehanna Asia Investments, Whales Capital
8/17/20 Sensorium $100Developer of a virtual reality multimedia platform designed to provide users with access to a
digital alternative universe. Undisclosed Investors
8/17/20 Keeper Security $60Developer of a password management software designed to help users protect their passwords
and sensitive digital assets. Insight Partners
8/17/20 Stedi $50 Provider of a structured messaging platform designed for B2B trade. Addition, Stripe, Union Square Ventures
8/17/20 Grafana $50Developer of a performance monitoring platform intended to collect, store and analyze data
about the infrastructure. Lead Edge Capital, Lightspeed Venture Partners
8/14/20 Wildlife $120 Operator of a gaming studio intended to develop mobile games. Human Capital (San Francisco), Vulcan Capital
8/13/20 AvidXchange $119Developer of an automated invoice and payment processing platform designed to offer accounts
payable and on-demand invoice management services. Undisclosed Investors
8/13/20 PayActiv $100 Developer of a financial wellness platform intended for employees to improve their finances. Eldridge Industries, Generation Partners, Link-age
8/12/20 Gong $200Developer of a revenue intelligence platform leveraging artificial intelligence to go beyond
traditional CRM and transform revenue teams.
Battery Ventures, Coatue Management, Index Ventures, Next World Capital, Norwest Venture
Partners, Salesforce Ventures, Sequoia Capital, Thrive Capital, Wing Venture Capital
RECENT FINANCINGS
Notes:Sources: PitchBook. Reflects deal activity through 09/30/20. Transactions reflect recent software venture and private equity growth / expansion activity where the amount raised was greater than or equal to $50MM.
Selected Software Private Financings (Cont’d.)
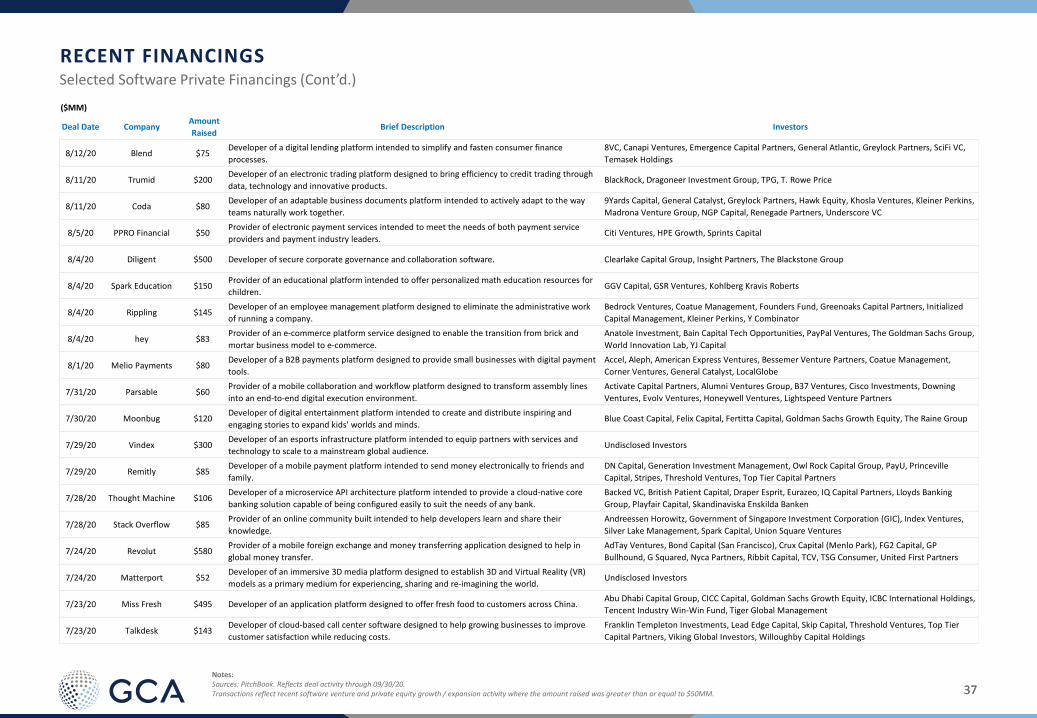
3737
($MM)
Deal Date CompanyAmount
Raised Brief Description Investors
8/12/20 Blend $75Developer of a digital lending platform intended to simplify and fasten consumer finance
processes.
8VC, Canapi Ventures, Emergence Capital Partners, General Atlantic, Greylock Partners, SciFi VC,
Temasek Holdings
8/11/20 Trumid $200Developer of an electronic trading platform designed to bring efficiency to credit trading through
data, technology and innovative products. BlackRock, Dragoneer Investment Group, TPG, T. Rowe Price
8/11/20 Coda $80Developer of an adaptable business documents platform intended to actively adapt to the way
teams naturally work together.
9Yards Capital, General Catalyst, Greylock Partners, Hawk Equity, Khosla Ventures, Kleiner Perkins,
Madrona Venture Group, NGP Capital, Renegade Partners, Underscore VC
8/5/20 PPRO Financial $50Provider of electronic payment services intended to meet the needs of both payment service
providers and payment industry leaders. Citi Ventures, HPE Growth, Sprints Capital
8/4/20 Diligent $500 Developer of secure corporate governance and collaboration software. Clearlake Capital Group, Insight Partners, The Blackstone Group
8/4/20 Spark Education $150Provider of an educational platform intended to offer personalized math education resources for
children. GGV Capital, GSR Ventures, Kohlberg Kravis Roberts
8/4/20 Rippling $145Developer of an employee management platform designed to eliminate the administrative work
of running a company.
Bedrock Ventures, Coatue Management, Founders Fund, Greenoaks Capital Partners, Initialized
Capital Management, Kleiner Perkins, Y Combinator
8/4/20 hey $83Provider of an e-commerce platform service designed to enable the transition from brick and
mortar business model to e-commerce.
Anatole Investment, Bain Capital Tech Opportunities, PayPal Ventures, The Goldman Sachs Group,
World Innovation Lab, YJ Capital
8/1/20 Melio Payments $80Developer of a B2B payments platform designed to provide small businesses with digital payment
tools.
Accel, Aleph, American Express Ventures, Bessemer Venture Partners, Coatue Management,
Corner Ventures, General Catalyst, LocalGlobe
7/31/20 Parsable $60Provider of a mobile collaboration and workflow platform designed to transform assembly lines
into an end-to-end digital execution environment.
Activate Capital Partners, Alumni Ventures Group, B37 Ventures, Cisco Investments, Downing
Ventures, Evolv Ventures, Honeywell Ventures, Lightspeed Venture Partners
7/30/20 Moonbug $120Developer of digital entertainment platform intended to create and distribute inspiring and
engaging stories to expand kids' worlds and minds. Blue Coast Capital, Felix Capital, Fertitta Capital, Goldman Sachs Growth Equity, The Raine Group
7/29/20 Vindex $300Developer of an esports infrastructure platform intended to equip partners with services and
technology to scale to a mainstream global audience. Undisclosed Investors
7/29/20 Remitly $85Developer of a mobile payment platform intended to send money electronically to friends and
family.
DN Capital, Generation Investment Management, Owl Rock Capital Group, PayU, Princeville
Capital, Stripes, Threshold Ventures, Top Tier Capital Partners
7/28/20 Thought Machine $106Developer of a microservice API architecture platform intended to provide a cloud-native core
banking solution capable of being configured easily to suit the needs of any bank.
Backed VC, British Patient Capital, Draper Esprit, Eurazeo, IQ Capital Partners, Lloyds Banking
Group, Playfair Capital, Skandinaviska Enskilda Banken
7/28/20 Stack Overflow $85Provider of an online community built intended to help developers learn and share their
knowledge.
Andreessen Horowitz, Government of Singapore Investment Corporation (GIC), Index Ventures,
Silver Lake Management, Spark Capital, Union Square Ventures
7/24/20 Revolut $580Provider of a mobile foreign exchange and money transferring application designed to help in
global money transfer.
AdTay Ventures, Bond Capital (San Francisco), Crux Capital (Menlo Park), FG2 Capital, GP
Bullhound, G Squared, Nyca Partners, Ribbit Capital, TCV, TSG Consumer, United First Partners
7/24/20 Matterport $52Developer of an immersive 3D media platform designed to establish 3D and Virtual Reality (VR)
models as a primary medium for experiencing, sharing and re-imagining the world. Undisclosed Investors
7/23/20 Miss Fresh $495 Developer of an application platform designed to offer fresh food to customers across China. Abu Dhabi Capital Group, CICC Capital, Goldman Sachs Growth Equity, ICBC International Holdings,
Tencent Industry Win-Win Fund, Tiger Global Management
7/23/20 Talkdesk $143Developer of cloud-based call center software designed to help growing businesses to improve
customer satisfaction while reducing costs.
Franklin Templeton Investments, Lead Edge Capital, Skip Capital, Threshold Ventures, Top Tier
Capital Partners, Viking Global Investors, Willoughby Capital Holdings
RECENT FINANCINGS
Notes:Sources: PitchBook. Reflects deal activity through 09/30/20. Transactions reflect recent software venture and private equity growth / expansion activity where the amount raised was greater than or equal to $50MM.
Selected Software Private Financings (Cont’d.)
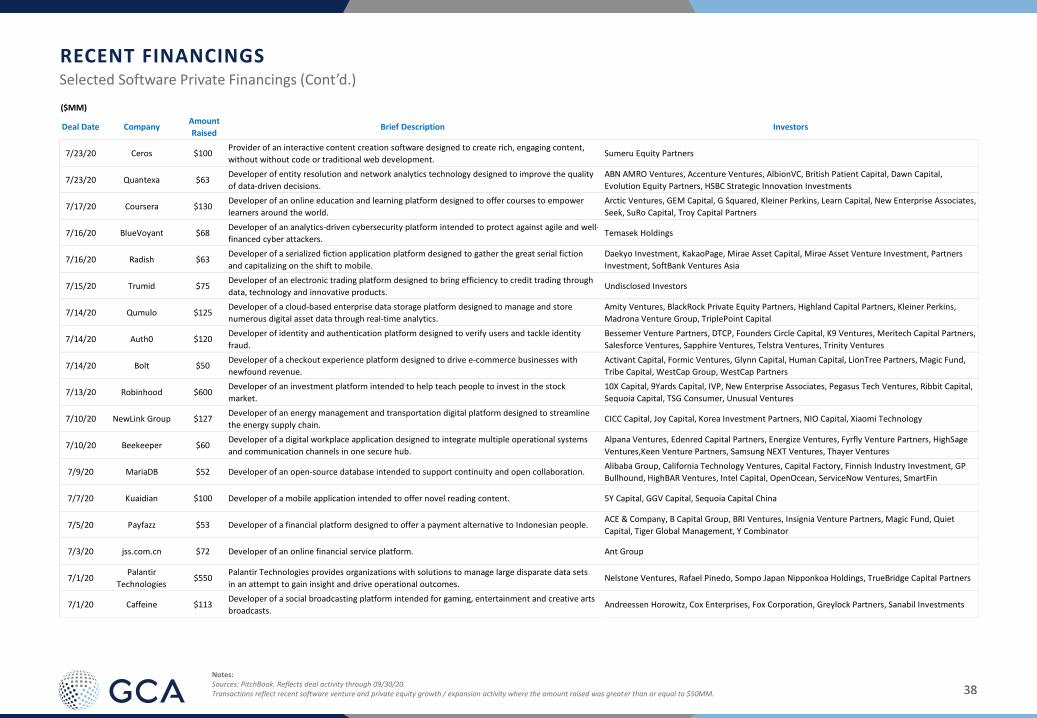
3838
($MM)
Deal Date CompanyAmount
Raised Brief Description Investors
7/23/20 Ceros $100Provider of an interactive content creation software designed to create rich, engaging content,
without without code or traditional web development. Sumeru Equity Partners
7/23/20 Quantexa $63Developer of entity resolution and network analytics technology designed to improve the quality
of data-driven decisions.
ABN AMRO Ventures, Accenture Ventures, AlbionVC, British Patient Capital, Dawn Capital,
Evolution Equity Partners, HSBC Strategic Innovation Investments
7/17/20 Coursera $130Developer of an online education and learning platform designed to offer courses to empower
learners around the world.
Arctic Ventures, GEM Capital, G Squared, Kleiner Perkins, Learn Capital, New Enterprise Associates,
Seek, SuRo Capital, Troy Capital Partners
7/16/20 BlueVoyant $68Developer of an analytics-driven cybersecurity platform intended to protect against agile and well-
financed cyber attackers. Temasek Holdings
7/16/20 Radish $63Developer of a serialized fiction application platform designed to gather the great serial fiction
and capitalizing on the shift to mobile.
Daekyo Investment, KakaoPage, Mirae Asset Capital, Mirae Asset Venture Investment, Partners
Investment, SoftBank Ventures Asia
7/15/20 Trumid $75Developer of an electronic trading platform designed to bring efficiency to credit trading through
data, technology and innovative products. Undisclosed Investors
7/14/20 Qumulo $125Developer of a cloud-based enterprise data storage platform designed to manage and store
numerous digital asset data through real-time analytics.
Amity Ventures, BlackRock Private Equity Partners, Highland Capital Partners, Kleiner Perkins,
Madrona Venture Group, TriplePoint Capital
7/14/20 Auth0 $120Developer of identity and authentication platform designed to verify users and tackle identity
fraud.
Bessemer Venture Partners, DTCP, Founders Circle Capital, K9 Ventures, Meritech Capital Partners,
Salesforce Ventures, Sapphire Ventures, Telstra Ventures, Trinity Ventures
7/14/20 Bolt $50Developer of a checkout experience platform designed to drive e-commerce businesses with
newfound revenue.
Activant Capital, Formic Ventures, Glynn Capital, Human Capital, LionTree Partners, Magic Fund,
Tribe Capital, WestCap Group, WestCap Partners
7/13/20 Robinhood $600Developer of an investment platform intended to help teach people to invest in the stock
market.
10X Capital, 9Yards Capital, IVP, New Enterprise Associates, Pegasus Tech Ventures, Ribbit Capital,
Sequoia Capital, TSG Consumer, Unusual Ventures
7/10/20 NewLink Group $127Developer of an energy management and transportation digital platform designed to streamline
the energy supply chain. CICC Capital, Joy Capital, Korea Investment Partners, NIO Capital, Xiaomi Technology
7/10/20 Beekeeper $60Developer of a digital workplace application designed to integrate multiple operational systems
and communication channels in one secure hub.
Alpana Ventures, Edenred Capital Partners, Energize Ventures, Fyrfly Venture Partners, HighSage
Ventures,Keen Venture Partners, Samsung NEXT Ventures, Thayer Ventures
7/9/20 MariaDB $52 Developer of an open-source database intended to support continuity and open collaboration. Alibaba Group, California Technology Ventures, Capital Factory, Finnish Industry Investment, GP
Bullhound, HighBAR Ventures, Intel Capital, OpenOcean, ServiceNow Ventures, SmartFin
7/7/20 Kuaidian $100 Developer of a mobile application intended to offer novel reading content. 5Y Capital, GGV Capital, Sequoia Capital China
7/5/20 Payfazz $53 Developer of a financial platform designed to offer a payment alternative to Indonesian people. ACE & Company, B Capital Group, BRI Ventures, Insignia Venture Partners, Magic Fund, Quiet
Capital, Tiger Global Management, Y Combinator
7/3/20 jss.com.cn $72 Developer of an online financial service platform. Ant Group
7/1/20Palantir
Technologies$550
Palantir Technologies provides organizations with solutions to manage large disparate data sets
in an attempt to gain insight and drive operational outcomes. Nelstone Ventures, Rafael Pinedo, Sompo Japan Nipponkoa Holdings, TrueBridge Capital Partners
7/1/20 Caffeine $113Developer of a social broadcasting platform intended for gaming, entertainment and creative arts
broadcasts. Andreessen Horowitz, Cox Enterprises, Fox Corporation, Greylock Partners, Sanabil Investments
RECENT FINANCINGS
Notes:Sources: PitchBook. Reflects deal activity through 09/30/20. Transactions reflect recent software venture and private equity growth / expansion activity where the amount raised was greater than or equal to $50MM.
Selected Software Private Financings (Cont’d.)
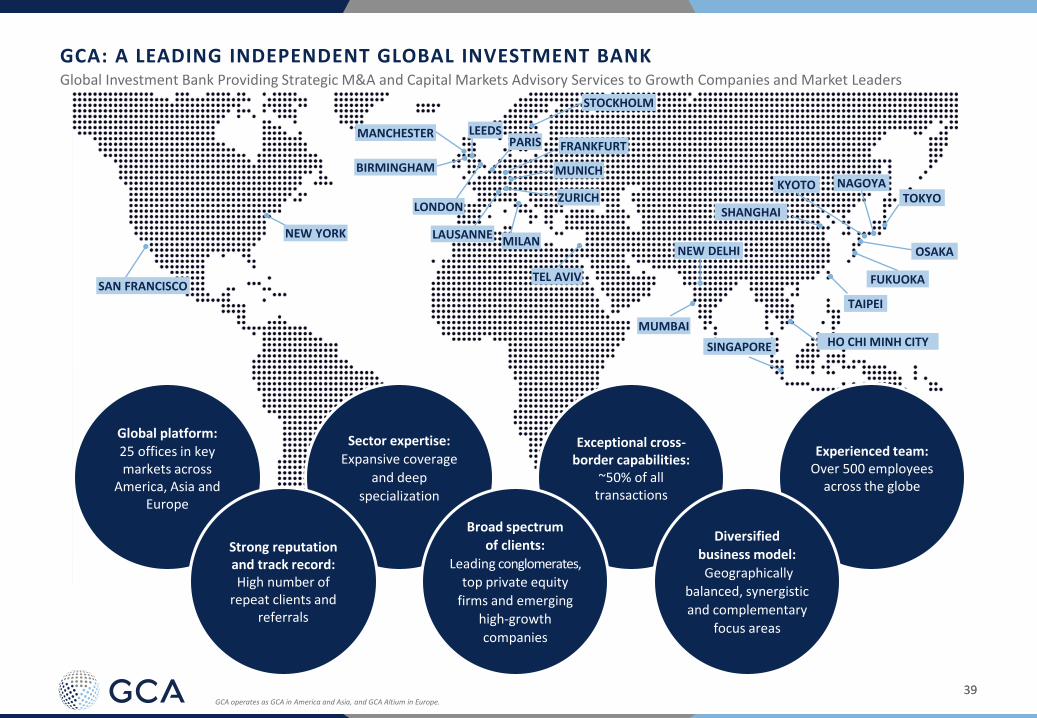
3939
GCA: A LEADING INDEPENDENT GLOBAL INVESTMENT BANKGlobal Investment Bank Providing Strategic M&A and Capital Markets Advisory Services to Growth Companies and Market Leaders
GCA operates as GCA in America and Asia, and GCA Altium in Europe.
ZURICH
MILAN
FRANKFURT
MUNICH
TEL AVIV
LONDON
BIRMINGHAM
MUMBAI
SHANGHAI
SINGAPORE
TOKYO
NEW DELHI
NAGOYA
HO CHI MINH CITY
TAIPEI
PARISLEEDS
FUKUOKA
NEW YORK
SAN FRANCISCO
Sector expertise:
Expansive coverage
and deep
specialization
Exceptional cross-border capabilities:
~50% of all transactions
Global platform:25 offices in key markets across
America, Asia and Europe
Broad spectrum of clients:
Leading conglomerates, top private equity
firms and emerging high-growth
companies
Experienced team: Over 500 employees
across the globe
Strong reputation and track record: High number of
repeat clients and referrals
Diversified business model:
Geographically
balanced, synergistic
and complementary focus areas
KYOTO
OSAKA
MANCHESTER
LAUSANNE
STOCKHOLM

4040
GCA Advisors, LLC is the US entity of GCA, a global investment bank that provides strategic M&A and capital markets advisory services to growth companies and market leaders. The firm offers worldwide coverage with over 500 professionals in 25 locations across America, Asia and Europe. Built by the people that run the business, GCA is a firm of experts who focus on deals that require commitment, original perspective, skill and exceptional networks.
www.gcaglobal.com
This report was prepared by GCA Advisors, LLC, a registered broker-dealer and member of FINRA and SIPC. Sources of data include Capital IQ and other news organizations. Information obtained from third-party sources is considered reliable, but we do not guarantee that the information herein is accurate and complete. The report shall not constitute an offer to sell or the solicitation of an offer to buy any of the securities mentioned herein; past performance does not guarantee future results. Recipients of this report should not interpret the information herein as sufficient grounds for an investment decision or any other decision.
DISCLAIMER: This report includes logos or other words or devices that may be registered trademarks of their respective owners. Such use is solely for purposes of convenience in referring to the trademark owners and their products/services. This report and its contents are not endorsed by, sponsored by or affiliated with any trademark owners. GCA Advisors, LLC and its affiliates are not affiliated with any trademark owner but may provide financial services to one or more trademark owners or their affiliates.