software process quality models: a comparative evaluation - citeseer
TRANSCRIPT

Software Process Quality Models: A comparative evaluation
M.Sc. Thesis
2003
Jonathan Tate
University of Durham
Department of Computer Science

Abstract, Preliminaries and Contents
- i -
Abstract Numerous software processes are implemented by software organisations in the production and
maintenance of software products. Varying levels of success are observed in their execution, as
processes vary in content and quality. A number of quality models for software processes have
been published, each of which is intended to encompass the totality of quality factors and issues
relevant to a specific notion of process quality. These quality models may be used to develop a
new process, measure the quality of existing processes, or guide improvement of existing
processes. It is therefore desirable that mechanisms exist to select the model of highest intrinsic
quality and greatest relevance.
In this thesis, mechanisms are proposed for the comparative evaluation of software
process quality models. Case studies are performed in which existing software process quality
models are applied to existing software processes. Case study results are used in empirical
evaluation of models to augment theoretical evaluation results. Specific recommendations are
made for selection of models against typical selection criteria. Assessment is performed of the
assessment procedures against defined success criteria.
Theoretical evaluation procedures are developed to measure process quality models
against defined quality criteria. Measurements are performed of conformance of models to the
requirements set for an ideal process quality model, and the relevance of model content to
defined stakeholders in software processes. Comparison is also made of the scope and size of
models.
Empirical evaluation procedures are developed to assess model performance in the
context of application to real software processes. These procedures assess the extent to which
the results of process measurement using process quality models are observed to differ, and
hence the importance of selecting one model in preference to others. Measurement is also
performed of the extent of difference in the software processes evaluated in the case studies.

Abstract, Preliminaries and Contents
- ii -
Acknowledgements I would like to take this opportunity to thank those individuals and organisations without whom
the production of this thesis and associated work would not otherwise have been possible. Their
input and support is greatly appreciated. I would like to thank my supervisor, Dr. Elizabeth
Burd, for valuable advice and encouragement, and Prof. Malcolm Munro for advice in the
preparation of this thesis. I would also like to thank Alistair Blair of Programming Research Ltd
for kindly permitting use of the PRL ‘QA C/QA C++’ products and ‘QA Insight’ prototype.
Lastly, but by no means least, I would like to thank my friends and family for their many unique
forms of encouragement, patience and support.
Copyright The copyright of this thesis rests with the author. No quotation from it should be published
without prior consent from the author and information derived from it should be acknowledged.
Declaration No part of the material offered has previously been submitted by the author for a degree in the
University of Durham or in any other University. All the work presented here is the sole work
of the author and no one else.
Abstract, Preliminaries and Contents
- iii -
Table of Contents Abstract, Preliminaries and Contents i Abstract i Acknowledgements ii Copyright ii Declaration ii Table of Contents iii Table of Figures viii Chapter 1: Introduction 1 1.1 Introduction 1 1.2 Problem area 1 1.3 Proposed work 2 1.4 Criteria for success for thesis 2 1.5 Thesis structure 3 Chapter 2: Literature Survey – Quality concepts 4 2.1 Overview of literature survey 4 2.2 Structure of literature survey 4 2.3 General quality issues 4 2.3.1 Overview and structure of ‘General quality issues’ section 4 2.3.2 Definitions of quality 5 2.3.3 Generic quality issues 6 2.3.4 Total Quality Management (TQM) 8 2.3.5 Measurement issues and methods 9 2.3.6 Findings on ‘General quality issues’ 10 2.4 Software Quality Assurance (SQA) 10 2.4.1 Overview and structure of ‘SQA’ section 10 2.4.2 General Software Quality Assurance 10 2.4.3 Software engineering standards 12 2.4.4 Measurement theory 13 2.4.5 Statistical quality control 13 2.4.6 Quality measures and models 14 2.4.7 Nature and assessment of models 14 2.4.8 Frameworks for evaluation 15 2.4.9 Software tools 17 2.4.10 Findings on ‘SQA’ section 17 2.5 Software products 17 2.5.1 Overview and structure of ‘Software products’ section 17 2.5.2 Software product quality issues 18 2.5.3 Software metrics 19 2.5.3.1 McCabe cyclomatic complexity measure 23 2.5.3.2 Halstead Software Science 23 2.5.4 Findings on ‘Software products’ 23 2.6 Software processes 24 2.6.1 Overview and structure of ‘Software processes’ section 24 2.6.2 Software processes 24 2.6.3 Open Source software processes 27 2.6.4 Software process measurement 28 2.6.5 Software process estimation 28 2.6.6 Software process improvement 29 2.6.7 Findings on ‘Software processes’ 29 2.7 Quality models 30 2.7.1 Overview and structure of ‘Quality models’ section 30 2.7.2 Software product quality models overview 30 2.7.3 McCall’s model 31 2.7.4 ISO 9126 model 32
Abstract, Preliminaries and Contents
- iv -
2.7.5 Dromey’s model 33 2.7.6 Boehm’s model 35 2.7.7 Software product quality models findings 37 2.8 Chapter 2: Summary 37 Chapter 3: Literature Survey - Process quality models 38 3.1 Software process quality models overview 38 3.2 SPICE model 38 3.3 ISO9001 model 40 3.4 Capability Maturity Model (CMM) 43 3.5 Chapter 3: Summary 47 Chapter 4: A theoretical evaluation method for process models 48 4.1 Evaluation approach 48 4.1.1 Validation through theoretical and empirical evaluation 48 4.1.2 Determining success of evaluation approach 49 4.1.3 Assessor 49 4.2 Theoretical evaluation of models 50 4.2.1 Theoretical evaluation concepts 50 4.2.1.1 Purpose of theoretical evaluation 51 4.2.1.2 Approaches to theoretical evaluation 51 4.2.1.3 Results to be obtained through theoretical evaluation 53 4.2.1.4 Hypotheses HT.a and HT.b for theoretical evaluation 53 4.2.2 Approach to theoretical model assessment 55 4.2.2.1 Approach of theoretical model assessment 55 4.2.2.2 Input resources to theoretical evaluation procedure 56 4.2.2.2.1 Set of candidate process quality models 56 4.2.2.2.2 Model source materials and resources 57 4.2.2.2.3 User classes 57 4.2.2.2.4 Approach of user class-based evaluation 58 4.2.2.2.5 User classes considered in evaluation 58 4.2.2.2.6 Requirements of an ideal process quality model 59 4.2.2.2.7 Procedure for requirement definition 60 4.2.3 Procedure of theoretical evaluation 61 4.2.3.1 Theoretical evaluation procedure 61 4.2.3.1.1 Analytical procedure for theoretical evaluation procedure 63 4.2.3.2 Purpose of user class-based evaluation 63 4.2.3.2.1 Relationship between user classes and user requirements 64 4.2.3.2.2 Mapping user requirements to user classes 67 4.2.3.3 Procedure of user class-based evaluation 68 4.2.3.3.1 Analytical procedure for user class-based evaluation 69 4.2.3.4 Comparison of model content 69 4.2.3.5 Mappings between quality models 71 4.2.3.5.1 Technique for mapping between quality models: Unit element approach 71 4.2.3.5.2 Selection of standard model 72 4.2.4 Determining success of theoretical evaluation 73 4.2.4.1 Source and rationale for criteria for success for theoretical evaluation procedure 73 4.2.4.2 Criteria for success for theoretical evaluation procedure 73 4.2.4.3 Schedule for theoretical evaluation procedure 74 4.3 Chapter 4: Summary 75 Chapter 5: An empirical evaluation method for process models 76 5.1 Empirical evaluation approach 76 5.1.1 Empirical evaluation concepts 76 5.1.1.1 Purpose of empirical evaluation 76 5.1.1.2 Approaches to empirical evaluation 77 5.1.1.3 Results to be obtained through empirical evaluation 78 5.1.1.4 Hypotheses HE.a and HE.b for empirical evaluation 79 5.1.2 Approach of case study assessment 80 5.1.2.1 Approach of case study assessment 80

Abstract, Preliminaries and Contents
- v -
5.1.2.2 Input resources to empirical evaluation procedure 81 5.1.2.2.1 Evaluation set of process quality models 81 5.1.2.2.2 Evaluation set of software processes 82 5.1.2.2.3 Model and process source materials and resources 83 5.1.2.3 Model requirements set derivation 84 5.1.2.4 Model measurement scales 84 5.1.3 Procedure of empirical evaluation 84 5.1.3.1 Empirical evaluation procedure 84 5.1.3.2 Empirical evaluation procedure: Evaluation of processes 85 5.1.3.2.1 Analytical procedure for software process evaluation 86 5.1.3.3 Empirical evaluation procedure: Comparison of case study results 86 5.1.3.3.1 Analytical procedure for comparative evaluation of case study results 87 5.1.3.4 Transforming case study results into a format for comparison 88 5.1.3.4.1 Technique for comparison of case study results: Process rating by model element 88 5.1.3.4.2 Technique for comparison of case study results: Process rating by whole model 89 5.1.3.4.3 Technique for comparison of case study results: Analysis at the standard model clause level
90
5.1.4 Determining success level of empirical evaluation 92 5.1.4.1 Source and rationale for criteria for success for empirical evaluation procedure 92 5.1.4.2 Criteria for success for empirical evaluation procedure 92 5.1.4.3 Schedule for empirical evaluation 93 5.2 Chapter 5: Summary 93 Chapter 6: Software support tool development 94 6.1 Overview of software support tool development 94 6.1.1 Reason for software tool creation 94 6.1.2 Feasibility of automation 94 6.1.3 Development methodology 95 6.2 System scope and requirements 95 6.2.1 Expected usage context 95 6.2.2 Requirements 96 6.3 System design 96 6.3.1 Translating requirements into an implementable design 96 6.3.2 Architecture and technologies 97 6.3.3 Representation of model data 97 6.3.4 Entity-Relationship diagram 98 6.4 System implementation 99 6.4.1 Development environment 99 6.4.2 Project configuration management 99 6.4.3 Platform issues 99 6.4.4 Reused code/libraries 99 6.4.5 Performance issues 99 6.4.6 Source code conventions 99 6.4.7 Testing 100 6.4.8 System execution 100 6.5 Evaluation 100 6.5.1 Evaluation method 100 6.5.2 Objective and subjective evaluation 100 6.5.3 Evaluation against requirements set 100 6.5.4 Evaluation through usage 101 6.6 User evaluation of software tool 101 6.6.1 Overview of user evaluation method 101 6.6.2 User’s experience of software tool usage 102 6.6.3 Comparing use of software tool with manual approach 102 6.6.4 Technical issues 102 6.6.5 Usability and learnability issues 103 6.6.6 Performance issues 103 6.6.7 Data management issues 103 6.7 Chapter 6: Summary 103
Abstract, Preliminaries and Contents
- vi -
Chapter 7: Summarised results 105 7.1 Overview of summarised results 105 7.2 Theoretical evaluation: Results 105 7.2.1 Models 105 7.2.2 Results of requirements-based evaluation 105 7.2.3 Summarised results for user classes 109 7.2.4 Results of evaluation for requirements groups 110 7.2.5 Size of model content 110 7.2.6 Criteria for success of theoretical evaluation procedure 111 7.3 Empirical evaluation: Results 112 7.3.1 Results of case studies in native format 112 7.3.1.1 Case study process A: University of Durham SEG 112 7.3.1.1.1 Case study 1a: ISO 9001:1994 and SEG 112 7.3.1.1.2 Case study 2a: SPICE v1.0 working draft and SEG 113 7.3.1.1.3 Case study 3a: SW-CMM v1.3 and SEG 113 7.3.1.2 Case study process B: GNU GCC 114 7.3.1.2.1 Case study 1b: ISO 9001:1994 and GNU GCC 114 7.3.1.2.2 Case study 2b: SPICE v1.0 working draft GNU GCC 114 7.3.1.2.3 Case study 3b: SW-CMM v1.3 GNU GCC 114 7.3.2 Results of case studies transformed to common format 115 7.3.2.1 Case study process A: University of Durham SEG 115 7.3.2.2 Case study process B: GNU GCC 117 7.3.3 Criteria for success of empirical evaluation procedure 118 Chapter 8: Evaluation of results 120 8.1 Overview of evaluation of results 120 8.2 Theoretical evaluation results 120 8.2.1 Theoretical evaluation results overview 120 8.2.2 Comparative evaluation of models 121 8.2.2.1 Comparison of model content and scope 121 8.2.2.1.1 Model 1: ISO 9001:1994 / ISO 9000-3 [ISO9001], [ISO9000-3] 121 8.2.2.1.2 Model 2: SPICE v1.0 [SPI95] 122 8.2.2.1.3 Model 3: SW-CMM v1.3 [PAU96] 123 8.2.2.1.4 Weaknesses of ISO 9001:1994 125 8.2.2.2 Recommended model by scope analysis 125 8.2.2.2.1 Rationale for ranking of models in Table 8.4 125 8.2.2.3 Recommended model by size of model content 125 8.2.2.4 Model detail level 126 8.2.3 Requirements coverage analysis 127 8.2.3.1 Maximising requirements coverage 127 8.2.3.2 Hypothesis HT.a analysed 127 8.2.3.3 Hypothesis HT.b analysed 128 8.2.3.3.1 Model 1 (ISO 9001:1994 / ISO 9000-3): 129 8.2.3.3.2 Model 2 (SPICE v1.0) 129 8.2.3.3.3 Model 3 (SW-CMM v1.3) 129 8.2.3.4 Recommended model by requirement satisfaction level: for all requirements 130 8.2.3.5 Recommended model by requirement satisfaction level: for each defined user class 131 8.2.3.5.1 U1: Software developer 132 8.2.3.5.2 U2: Software process manager 132 8.2.3.5.3 U3: Customer of developed project 133 8.2.3.5.4 Comparison of findings for user classes 133 8.2.3.6 Recommended model by requirement satisfaction level: overall 133 8.2.3.7 Comparison of requirement group coverage 134 8.2.3.8 Recommended model by breadth of requirement group coverage 135 8.3 Empirical evaluation results 135 8.3.1 Empirical evaluation results overview 135 8.3.2 Evaluation of processes 135 8.3.2.1 Case study 1a: ISO 9001:1994 / ISO 9000-3 and SEG 136 8.3.2.1.1 Process strengths 136 8.3.2.1.2 Process weaknesses 136

Abstract, Preliminaries and Contents
- vii -
8.3.2.1.3 Process elements of acceptable performance 136 8.3.2.2 Case study 1b: ISO 9001:1994 / ISO 9000-3 and GNU GCC 136 8.3.2.2.1 Process strengths 136 8.3.2.2.2 Process weaknesses 137 8.3.2.2.3 Process elements of acceptable performance 137 8.3.2.3 Case study 2a: SPICE and SEG 137 8.3.2.3.1 Generic practices 137 8.3.2.3.2 Process strengths 137 8.3.2.3.3 Process elements of acceptable performance 137 8.3.2.3.4 Process weaknesses 137 8.3.2.4 Case study 2b: SPICE and GNU GCC 137 8.3.2.4.1 Generic practices 137 8.3.2.4.2 Process strengths 137 8.3.2.4.3 Process elements of acceptable performance 137 8.3.2.4.4 Weaknesses of the process 138 8.3.2.5 Case study 3a: SW-CMM and SEG 138 8.3.2.5.1 Process strengths 138 8.3.2.5.2 Process elements of acceptable performance 138 8.3.2.5.3 Weaknesses of the process 138 8.3.2.6 Case study 3b: SW-CMM and GNU GCC 138 8.3.2.6.1 Process strengths 139 8.3.2.6.2 Process elements of acceptable performance 139 8.3.2.6.3 Process weaknesses 139 8.3.2.7 Comparison of processes through case studies 139 8.3.2.7.1 Model 1: ISO 9001:1994 / ISO 9000-3 139 8.3.2.7.2 Model 2: SPICE 140 8.3.2.7.3 Model 3: SW-CMM 140 8.3.2.7.4 Overall recommendation of process from case study application results 140 8.3.2.8 Hypothesis HE.a analysed 140 8.3.3 Comparison of case study results 141 8.3.3.1 Comparison of results at level of standard model clause 141 8.3.3.1.1 Comparison of case study process A (SEG) results 142 8.3.3.1.2 Comparison of case study process B (GNU GCC) results 142 8.3.3.1.3 Comparison of results from all processes 142 8.3.3.2 Comparison of results at level of entire model 143 8.3.3.2.1 Comparison of case study process A (SEG) results 143 8.3.3.2.2 Comparison of case study process B (GNU GCC) results 143 8.3.3.2.3 Comparison of results from all processes 144 8.3.3.3 Comparison of findings at levels of standard model clause and entire model 145 8.3.3.4 Hypothesis HE.b analysed 145 8.4 Chapter 8: Summary 145 Chapter 9: Evaluation of experimental procedures 146 9.1 Overview of evaluation of experimental procedures 146 9.2 Assessment of theoretical evaluation procedure 146 9.2.1 Overview of criteria-based assessment for theoretical evaluation procedure 146 9.2.2 Conformance of implemented procedure to criteria for success for theoretical evaluation 146 9.2.3 Criteria successfully fulfilled for theoretical evaluation 149 9.2.4 Criteria not successfully achieved for theoretical evaluation 149 9.2.5 Overall success of theoretical evaluation approach 150 9.2.6 Assessor skills for theoretical evaluation procedure 150 9.2.7 Possible changes to theoretical evaluation procedure 151 9.2.8 Possible modifications to the requirements set used in model theoretical evaluation 152 9.2.9 Suitability of models in evaluation set for theoretical evaluation 152 9.3 Assessment of empirical evaluation procedure 152 9.3.1 Overview of criteria-based assessment for empirical evaluation procedure 152 9.3.2 Conformance of implemented procedure to criteria for success for empirical evaluation 152 9.3.3 Criteria successfully fulfilled for empirical evaluation 154 9.3.4 Criteria not successfully achieved for empirical evaluation 154 9.3.5 Overall success of empirical evaluation approach 154
Abstract, Preliminaries and Contents
- viii -
9.3.6 Assessor skills for empirical evaluation procedure 156 9.3.7 Possible changes to empirical evaluation procedure 156 9.3.8 Suitability of models and processes in evaluation set for empirical evaluation procedure 156 Chapter 10: Conclusions 158 10.1 Overview of thesis 158 10.2 Conclusions 158 10.2.1 Theoretical analysis of models through content analysis 158 10.2.1.1 Scope of software process quality models found to be non-equivalent 158 10.2.1.2 Content size of software process quality models found to be non-equivalent 159 10.2.1.3 Detail level of process quality model definitions found to be non-equivalent 159 10.2.2 Theoretical analysis of models through requirements analysis 159 10.2.2.1 Hypothesis HT.a refuted: Conformance levels of models to set of requirements of an ideal model found to be non-equivalent
159
10.2.2.2 Model recommendation by conformance to requirements of an ideal model 159 10.2.2.3 Model recommendation by breadth of requirement group coverage 160 10.2.2.4 Hypothesis HT.b refuted: Models found to be more appropriate to requirements of some user classes than others
160
10.2.2.5 Model recommendation by conformance to requirements of user classes 160 10.2.2.6 Overall model recommendation by level of conformance to requirements 160 10.2.3 Empirical evaluation of processes through case studies 161 10.2.3.1 Process recommendation by analysis of case study results 161 10.2.3.2 Hypothesis HE.a refuted: Process quality models found to produce non-equivalent ratings of quality when applied to different processes
161
10.2.4 Empirical evaluation of model content dissimilarity 162 10.2.4.1 On application to the same process, different process quality models produce dissimilar ratings of process quality with low-level quality definitions
162
10.2.4.2 On application to the same process, different process quality models produce similar ratings of process quality with high-level quality definitions
162
10.2.4.3 Hypothesis HE.b refuted: Process quality models found to produce non-equivalent ratings of quality when applied to the same process
163
10.3 Success criteria for work performed 163 10.3.1 Success criteria for theoretical evaluation of models 163 10.3.2 Success criteria for empirical evaluation of models 164 10.3.3 Success criteria for thesis 164 10.4 Further work 166 10.4.1 Further case studies 166 10.4.2 Tailoring a software process quality model to a development context 166 10.4.3 Development of a hybrid model 166 10.4.4 Absolute measures of software process quality model issues 166 10.4.5 Integration of software process and software product quality models 166 Chapter 11: References 174 Chapter 12: Appendices 175
Table of Figures 1.1: Thesis content structure and interrelationships 3 2.1: The relationship between a model and reality 14 2.2: Model of software processes 24 2.3: Software quality criteria and factors relationship for McCall’s model 32 2.4: Mapping quality attributes to quality-carrying properties for Dromey’s model 34 2.5: Software quality characteristics tree for Boehm’s model 36 6.1: Layered system architecture model 97 6.2: Entity-Relationship diagram 98 8.1: Results of evaluation of case study process A from all models in standardised format 143 8.2: Results of evaluation of case study process B from all models in standardised format 144

Chapter 1: Introduction
- 1 -
Chapter 1: Introduction
1.1 Introduction
Software development is performed by a variety of organisations through the application of a
diverse range of software processes. Models have been proposed with which the quality of a
software process may be measured, and modifications made to improve process quality. This
thesis establishes mechanisms through which the content and quality of process quality models
can be measured, which are then applied to perform comparative evaluation. This chapter
defines the scope of the problem under investigation and establishes criteria for success.
Definition is provided of the content of subsequent chapters.
1.2 Problem area
A software process encompasses the entire system lifecycle, from initial acquisition and
development of user requirements to long-term maintenance of legacy systems [SOM96]. As
the content of software processes varies between examples it is thought that some processes
may be considered to be of a higher quality than others, in terms of quality of products or
quality of process issues, in a particular context of application [SOM96]. The quality of the
software process may positively or negatively impact upon the quality of developed products.
Additionally, the process quality may impact upon business and organisation concerns, such as
the ability to develop products to schedule and with predictable costs [PAU96]. Therefore,
software process quality is of interest to both the developers of a software project (software
suppliers) and the users of developed software products (software customers).
Process quality models have been proposed that define how a set of quality concepts
bear upon process elements [PRE97]. These may be used to measure the quality of an existing
process, or used in the development of a process to incorporate provision for quality issues.
Possible application of this type of technique include selection of a software process design
from a set of candidate processes, or the measurement of an existing process to determine the
extent to which it meets organisational requirements [PUL96].
Content varies between examples of software process quality models [PRE97].
Therefore, the quality of these models may differ, either when considered in isolation or when
considered in the context of application to a given software process. This bears upon the
capacity of a process quality model to perform measurement of a software process to produce
results that may be considered reliable, accurate and representative [PRE97]. The effectiveness
of a model in guiding development of an existing or proposed software process may also be
affected by the quality of the underlying content.
It can therefore be established that a number of software processes and software process
quality models have been proposed. It is desirable for an entity involved in software production,
Chapter 1: Introduction
- 2 -
e.g. an organisation or a project team, to select the best and most appropriate software process
quality model from the set of available models, in order that the entity may select and use the
best and most appropriate software process.
1.3 Proposed work
The proposed work may be summarised as the creation of mechanisms for the comparative
evaluation of software process quality models, the evaluation of these mechanisms, and the
application of these mechanisms to an example set of software process quality models.
Procedures are designed to perform both theoretical and empirical evaluation of process quality
models. A representative set of software process quality models is selected on which to apply
the evaluation procedures in order to evaluate procedures.
Procedures are designed to perform comparative evaluation of software process quality
model content on a theoretical basis. Application to the model set permits measurement of
relevance of models to the needs of typical users of model application results, model scope, and
the provision of recommendations for model selection in the context of specific quality criteria.
Procedures are designed to perform comparative evaluation of software process quality
models on an empirical basis. Application of procedures to the model set permits measurement
of similarity of model content and relative performance in actual usage. Case studies are
performed of the application of models in the measurement of typical processes, allowing
comparison of relative process quality. A novel software support tool was developed to assist in
the implementation of these evaluation activities. Finally, assessment is performed of the
theoretical and empirical evaluation procedures to determine the extent to which they satisfy
defined requirements and produce useful findings.
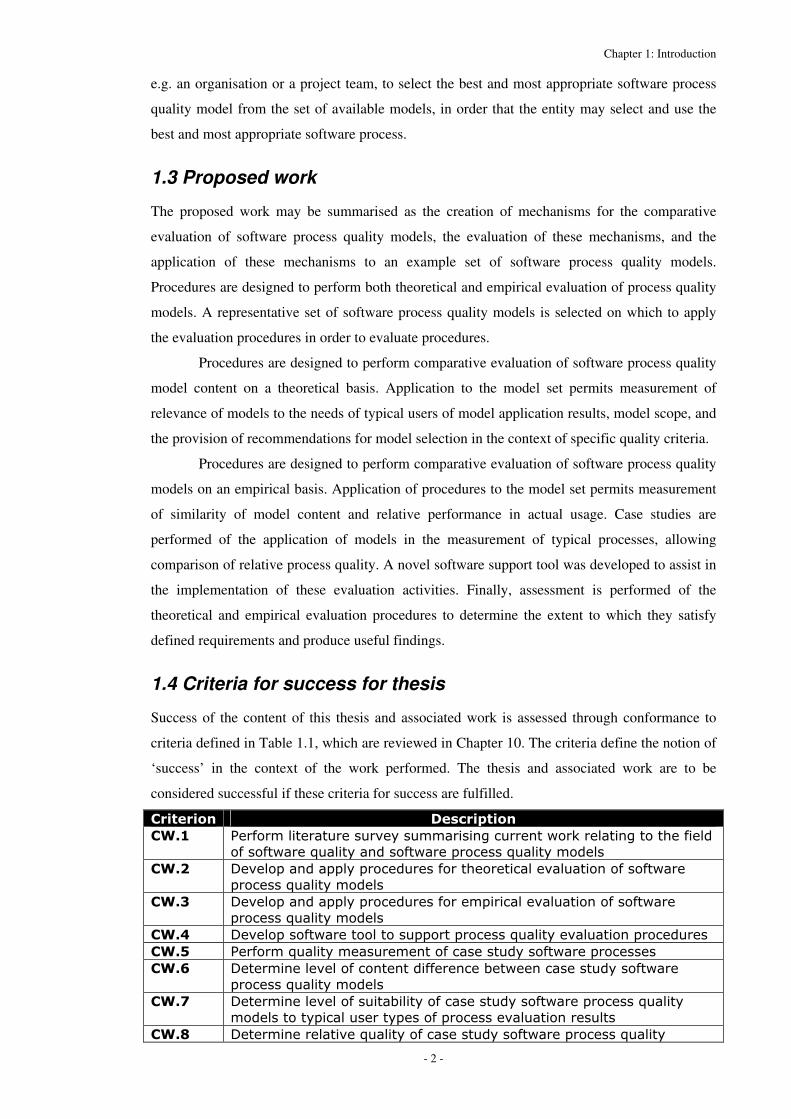
1.4 Criteria for success for thesis
Success of the content of this thesis and associated work is assessed through conformance to
criteria defined in Table 1.1, which are reviewed in Chapter 10. The criteria define the notion of
‘success’ in the context of the work performed. The thesis and associated work are to be
considered successful if these criteria for success are fulfilled.
���������� ����������
� ��� ���������������� ������ ����� ��������������������������������
��� ����������������� ������������ ������������ �
� ��� ��������������������������� �������������������������� �������
����� ������������ �
� ��� ��������������������������� ������������������������� �������
����� ������������ �
� ��� �������� ������������� ����������� ������������������������� �
� ��� ����������������� ������������ �� ���� ������������ � �
� ��� ������������������������������������������ �� ���� �������
����� ������������ �
� ��� ����������������� ����������� �� ���� ������������ �������
����� ���������� ������ ��������� ������������ �� �
� ��� �������������������������� �� ���� ������������ �������

Chapter 1: Introduction
- 3 -
����� �
� ��� �������������������� ����� ������������ ������� �� ���� �������
����� ������������ ��� ����������� ������������������������
� ���� �������������������������������� �������������������������� ����
��������������� ������ �
Table 1.1: Criteria for success for thesis and associated work
1.5 Thesis structure
Figure 1.1 illustrates the interrelationships between the elements of the work described in this
thesis. Brackets indicate, where relevant, the chapters of greatest relevance to a particular part of
the work. For further details on content of appendices please consult Table 12.1 in Chapter 12.
Lines in Figure 1.1 indicate a relationship between two thesis content elements, where the
content of one element influences that of another.
It is intended that Figure 1.1 assist the reader in understanding the internal relationships
of the thesis, and therefore understanding the logical development and progression of the work
and theories described within. It can be seen that all work described in this thesis is influenced
ultimately by the content of the literature survey presented in Chapters 2 and 3, with additional
input from case study software processes described in Appendix N.
Literature survey
Case study software process quality models (3)
Quality concepts (2)
Case study software
processes (appendices)
Evaluation frameworks
Product quality
Process quality
Quality models
SPICE ISO 9001 ISO 9000-3
CMM SEG GCC
Model evaluation method (4, 5)
Case studies (appendices)
Empirical evaluation
(5)
Theoretical evaluation
(4)
Framework for evaluation of method (4, 9)
Evaluation of models
(7,8)
Figure 1.1: Thesis content structure and interrelationships

Chapter 2: Literature Survey - Quality concepts
- 4 -
Chapter 2: Literature Survey - Quality concepts
2.1 Overview of literature survey
The purpose of this survey is to identify, summarise and document the historical background
and current understanding of the subject, and to establish the current state-of-the-art. The
content of this chapter sets out the context in which the work presented in this thesis should be
considered, and defines the knowledge base upon which work presented in the remainder of this
thesis will build.
2.2 Structure of literature survey
This chapter is split into five sections, each considering a different aspect of ‘quality’ in the
context of Software Engineering. The first section, ‘General quality issues’, considers quality
theory in a generic industrial process management context and defines aspects of quality theory
also applicable outside the domain of Software Engineering. The second section, ‘Software
Quality Assurance’ considers the application of the principles outlined in the first section to the
domain of Software Engineering and performing quality management in this context. The third
section, ‘Software products’, considers quality issues germane to software products and
mechanisms through which measurement of software product quality can be performed. The
fourth section, ‘Software processes’, considers quality issues relevant to software development
processes and mechanisms for the measurement and improvement of software process quality.
The fifth section, ‘Quality models’, considers specific examples of models through which
software product quality is measured and evaluated. Chapter 3 contains details for the software
process quality models upon which the work in the remainder of the thesis is based.
2.3 General quality issues
2.3.1 Overview and structure of ‘General quality issues’ section
‘Quality’ is an issue not restricted to the domain of Software Engineering. The issue of quality
extends beyond the boundaries of any given software product or software process. Analysis of
quality in the general context allows the leveraging of ideas and concepts found successful in
non-software fields to be transferred and applied to analogous entities in the domain of Software
Engineering. These may take the form of managerial strategies, typically not restricted to any
specific industrial sector or organisation, or the measurement and improvement of quality of
products and development processes. Without measurement, it is impossible to accurately
identify problem areas, identify trends, or to perform comparison between two or more
candidate products or processes.
Chapter 2: Literature Survey - Quality concepts
- 5 -
This section begins by considering alternative definitions of quality that have been
proposed in a variety of contexts. This is followed by a study of literature applying these
definitions in the context of a generic development and production environment, outlining
quality factors and approaches to quality management. The Total Quality Management approach
is examined in detail. Quality measurement is then examined, identifying possible approaches
and typical problems encountered.
2.3.2 Definitions of quality
The concept of quality is of an abstract nature, and is open to numerous differing and potentially
contradictory interpretations. An understanding of quality issues can only be formed in the
context of a particular definition of the concept of quality. Stakeholders in a software process
and users of software product are not necessarily trained in Software Engineering issues. These
individuals may have a different understanding of the notion of ‘quality’ than those definitions
frequently used in Software Engineering literature. It is therefore of key importance to consider
definitions of quality both specific to the Software Engineering community and as found in
more general usage.
The Cambridge International Dictionary of English [CAM03] defines ‘Quality’ as ‘the
standard of excellence of something, often a high standard.’ Pressman [PRE97] defines quality:
‘- ensuring that a software organisation does the right things at the right time in the right way’.
McCall [MCC77] defines quality as ‘a general term applicable to any trait or characteristic,
whether individual or generic, a distinguishing attribute which indicates a degree of excellence
or identifies the basic nature of something’. Crosby [CRO79] defines quality as ‘conformance to
requirements’. Measurement of quality is defined in terms of measuring products against a set
of defined requirements and determining the level of conformance. Therefore, in order to
effectively manage quality it is important to have a defined set of product requirements and
mechanisms for measuring product conformance with product requirements. It is recognised
that in some circumstances the meaning of ‘quality’ is taken to be 'fitness for use', 'fitness for
purpose', 'customer satisfaction', or 'conformance to the requirements', but that each of these
represents only some facets of the concept of ‘quality’.
ISO8402 [ISO8402] defines ‘quality’ as the ‘totality of characteristics of an entity that
bear on its ability to satisfy stated and implied needs’. ISO8402 is an international standard,
defining a vocabulary for ‘quality management and quality assurance’ with the purpose ‘to
clarify and standardise the quality terms as they apply to the field of quality management’. It is
deemed necessary as ‘many ordinary words … are used in the quality field in a specific or
restricted manner compared with the full range of dictionary definitions’, due to differing
terminology used by different sectors of industry. ISO8402 recognises the difference between a
‘defect’ and a ‘nonconformity’, and recognises the legal issues concerned with ‘product
liability’.

Chapter 2: Literature Survey - Quality concepts
- 6 -
2.3.3 Generic quality issues
Crosby [CRO79] states a theory that ‘Quality is free’. It is stated that from a business viewpoint
it is advantageous to focus the production process on quality issues. He considers that quality is
not to be considered a business expense, but rather that faults present in products and the costs
associated with their correction are the real culprits for expense and excessive resource usage.
An organisation focussing on making quality certain can increase profit by an amount equal to
5-10% of sales. Therefore, systems and procedures to measure, track and manage quality have a
business justification.
Crosby [CRO79] defines a ‘Quality management maturity grid’, and defines five stages
of quality maturity. These are (in order of increasing maturity): ‘uncertainty’, ‘awakening’,
‘enlightenment’, ‘wisdom’ and ‘certainty’. This recognises that different levels of capability to
manage quality exist, and that quality management requires long-term commitment. An
organisation can phase-in quality management practices and build capability over time.
Arthur [ART93] states ‘Kaizen is the Japanese concept that describes the continuous,
never-ending improvement of processes – management, software development, and software
evolution’. ‘The typical organisation without quality wastes 25 to 40 percent of its expenses on
the costs of poor quality. Best companies can cut this to 5 percent’. Arthur [ART93] quotes
Imai, who describes kaizen as the ‘process-oriented way of thinking versus the West’s
innovation and results-oriented thinking’.
Arthur provides a ‘Software Evolution – Quick Assessment’ questionnaire which an
organisation may complete to determine a ‘yardstick analysis’ of software process maturity, in
terms of whether the software process can be considered to be: repeatable, defined, managed,
optimised, and automated [ART93]. Arthur states that process measurement should be based on
the PDCA model [ART93]:
Plan 1. Setting the goals for measurement
2. Modelling the process and data
3. Creating the measurement process, training and tools
Do 4. Implementing the entire measurement process
Check 5. Evaluate the results of instigating measurements
Act 6. Continuously improve the measurement process, tools and training
Juran [ART93] identifies the ‘quality trilogy’ of ‘quality planning’, ‘quality management –
defect prevention, continuous improvement’ and ‘quality control – defect detection and
removal’. Arthur [ART93] states there are two classes of cause of variation in software
processes that cause problems, of which 85% are ‘common causes’ (variation in the process)
and 15% are ‘special causes’ (assignable to special events). ‘Ishikawa Diagrams’ [ART93] can
be used in the analysis of the relationship between cause and effect, for example to determine
the causes of a quality issue. Development of an Ishikawa diagram follows the PDCA (Plan,
Do, Check, Act) cycle.

Chapter 2: Literature Survey - Quality concepts
- 7 -
If software processes are stable, ‘… the quality of the software they produce cannot
improve without changes in the process’ [ART93]. Therefore, process improvement activities
are necessary if the quality of delivered software products is to be improved. According to
Arthur [ART93], before an initial release of a software product, the only techniques for
establishing measures of quality are based on process quality analysis. To ensure high product
quality before delivery, the developer must concentrate on process quality. To establish or
maintain quality after delivery, care must be taken to ensure that the process can be changed and
improved; if the process for an existing software product cannot be improved, then neither can
the product quality [ART93].
Deming states that manufacturers should ‘cease dependence on mass inspection’,
because ‘inspection to improve quality is too late, ineffective, costly.’ ‘Defects are not free.
Somebody makes them, and gets paid for making them’. ‘Low quality means high costs’.
Deming further notes ‘When a product leaves the door of a supplier, it is too late to do anything
about its quality. Quality comes not from inspection, but from improvement of the production
process.’ If these issues are translated into features of the software process, this implies that the
use of software product quality models to measure the quality of a software product will not
help to improve its quality. Instead, it is necessary to focus on the software process. However,
Deming recognizes that in some cases the inspection approach is the only viable method
[DEM86]. Deming states that ‘Divided responsibility [for quality issues] means that nobody is
responsible’. Therefore, it is necessary to assign responsibility for quality issues in such a way
that responsibility for a given issue or quality defect can be traced back to a single, identifiable
individual [DEM86].
Deming [DEM86] states that a ‘single source and long term relationship [between
customer and supplier]’ is advantageous to avoid quality issues resulting from two or more
suppliers providing items that conform to requirements but yet are not identical. Deming also
identifies the need for ‘mutual confidence and aid between purchaser and vendor’. Therefore, it
is essential that both the supplier and the customer have confidence in the ability of the other
party to implement any agreed supply contract and commitments. In order to effectively
perform this, it is necessary to have a mutual understanding of the issues concerned.
Interestingly, Deming [DEM86] quotes Crosby who states that ‘half of the rejections that occur
are the fault of the purchaser’. This implies that many quality defects are the result of
inadequate communication and co-operation between customer and supplier. Deming proposes
a 14-point plan, which outlines principles for transformation of an organization.
Crosby [CRO79] states ‘Quality means conformance. Nonquality is nonconformance’. In
Software Engineering terms, this means that quality can be defined exclusively through the
conformance of a software product to the defined requirements upon which it was based.
Chapter 2: Literature Survey - Quality concepts
- 8 -
Crosby states that quality must be defined as ‘conformance to requirements’ if it is to be
managed.
Crosby [CRO79] claims that: ‘Quality is an achievable, measurable, profitable entity
that can be installed once you have commitment and understanding and are prepared for hard
work’ and that ‘The cost of quality is the expense of doing things wrong.’ Crosby states that
quality is measurable, if only ‘by the oldest and most respected measurements – cold hard cash’.
Crosby further states that ‘Quality is free, but no one is ever going to know it if there isn’t some
sort of agreed-on system of measurement’. Therefore, a quality measurement system is required
in order to demonstrate that improvements in quality control and management processes are
bringing real benefits to an organisation. Crosby [CRO79] states: ‘Quality measurement is only
effective when it is done in a manner that produces information people can understand and use.’
It is further suggested that it is not possible to determine when action should be taken to
improve quality management procedures without reliable and meaningful information and
statistics: ‘If you don’t know what the defect level is, how do you know when to get mad?’
[CRO79]
Crosby [CRO79] believes that no industry sector can be considered a special case and
be considered immune from the need to establish an effective quality management programme.
‘The most-offered excuse managers have for not doing anything is that “our business is
different”’. Therefore, Crosby would not agree with the principle stated in [ISO9000-3] that ‘the
process of development and maintenance of software is different from that of most other types
of industrial products’. Therefore, any quality management techniques or process improvements
that are based on this concept that are found in any other industrial sector could be modified for
usage in the software sector. Crosby argues that the ‘our business is different’ argument is
invalid, and is therefore unacceptable as an ‘excuse’ for the presence of defects (equating to the
absence of quality, and nonconformance to requirements) [CRO79].
2.3.4 Total Quality Management (TQM)
Total quality management has three key components [ART93]: planning, problem-solving, and
process management. Hatton [HAT94] identifies that ‘TQM’ is an acronym which is ‘frequently
bandied around with very little understanding or even agreement as to what it actually means’.
TQM ‘focuses on customer satisfaction and emphasizes employee teamwork to remove
expensive inefficiencies and bottlenecks’ [HAT94]. Famous practitioners include Deming,
Crosby, Ishikawa, Taguchi and Juran. Hatton [HAT94] quotes Hewson: ‘while very little advice
given by the experts is bad advice, equally little of it is specific and much of the advice is
conflicting’.
Deming identifies four laws to TQM [HAT94]:
1. Lasting success for a business is achieved by delivering products and services that are
recognized for their quality.
Chapter 2: Literature Survey - Quality concepts
- 9 -
2. Quality can be achieved only by building it in, using the right tools and the right
process.
3. Quality can only be built in by people who are provided with the means and
environment to channel their creativity to building in quality.
4. Improvement must be continuous.
However, Hatton [HAT94] states that ‘if readers believe that TQM will solve all their problems,
they don’t understand what the problems are’, suggesting that TQM must be used as an element
of a process improvement strategy rather than being used to define the strategy itself.
2.3.5 Measurement issues and methods
Rifkin [RIF01] states that measurement methods currently used may not address the goals of an
organisation. Organisations may have one of three organisational focus types, although
successful organisations have elements of all three: ‘operational excellence’, ‘customer-
intimate’, and ‘product innovative’. Traditional methods (e.g. SEI, Quantitative Software
Management) address decisions that support increased quality, increased programmer
productivity, and reduced costs, which are ‘operational excellence’ matters. Measuring
operational excellence is ‘more or less a solved problem’.
Rifkin [RIF01] states that organisations rejection of measurement methods may be an
appropriate response to measures that do not fit their strategy, so one must be highly objective
and relevant when designing new measures. Some organisations are more concerned with time
to market than cost or quality. Organisations not managed in a traditional manner cannot use
traditional measurement techniques, although usually then have to respond within threshold
values of cost, quality and duration. The GQM (Goal-Questions-Metrics) approach can be used
to get from business goals to decisions requiring information, to determining what to measure to
supply this information. Often GQM fails in practice as managers do not set ‘correct’ goals.
Strigini [STR96] states that the application of scientific discipline to measurement requires:
• Using quantitative measurements wherever possible,
• Designing experiments whose results depend as much as possible on fact rather than
individual bias,
• Exploring which of a theory’s consequences may be refuted by experiments, and
• Checking that conjectures are consistent among themselves and with known facts.
Strigini states that ‘in the software industry, more so than in many other fields, important
decisions often depend on subjective judgement’. It is stated that ‘bolstering our subjective
judgements with scientific analysis can increase their reliability, but as an aid in decision-
making the scientific method also has limits. No amount of empirical information can predict
the future with certainty’ [STR96].
Chapter 2: Literature Survey - Quality concepts
- 10 -
2.3.6 Findings on ‘General quality issues’
A number of non-equivalent definitions of ‘quality’ exist, indicating that different
understandings of the concept of ‘quality’ exist; therefore quality management techniques must
be specific to a given context. Numerous approaches to quality management have been
proposed which aim to consider quality in a generic context, each considering a specific
understanding of quality, the advantages and disadvantages of high and low quality, and
mechanisms for achieving quality in practice. The ‘Total Quality Management’ approach is
commonly applied to Software Engineering. Measurement of quality is recognised in quality
management as an important precursor to gaining control over the issue of quality.
Measurement techniques must be carefully designed to be objective and relevant to the needs of
an organisation in order to produce useful and meaningful results.
2.4 Software Quality Assurance (SQA)
2.4.1 Overview and structure of ‘SQA’ section
This section begins by examining the nature and role of quality issues in the field of Software
Engineering. Consideration is given to the application of generic quality concepts that may be
applied to software products and processes. This is followed by an examination of software
engineering standards, and whether their application improves quality or simply standardises
ineffective practices. Measurement theory is then examined, followed by its application in
statistical quality control. Examination of quality models follows, considering the content and
usage of models. This is followed by examination of approaches for the assessment of models;
the frameworks of evaluation which may be used to perform assessments of models, processes
and products; and the software tools which may be used to assist evaluation.
2.4.2 General Software Quality Assurance
According to Kitchenham [KIT96] ‘Quality’ means different things to different people; it is
highly context dependent. As there is no universally accepted definition of quality there can be
no single, simple measure of software quality that is acceptable to everyone. However, defining
quality in a measurable way makes it easier for others to understand a given viewpoint and
relate one’s own notions of quality to those of another.
Kitchenham [KIT96] quotes Garvin’s five perspectives of software quality:
1. Transcendental view (can be recognised but not defined)
2. User view (fitness for purpose)
3. Manufacturing view (conformance to specification)
4. Product view (from inherent product characteristics)
5. Value-based view (depends on customer’s willingness to pay)

Chapter 2: Literature Survey - Quality concepts
- 11 -
There is little evidence that conformance to standards guarantees ‘good’ products. Most new
models of quality examine the software process. Assessing quality by measuring internal
properties is attractive because it offers an objective and context-independent view of quality.
However, more research is required to establish/confirm that internal quality ensures external
quality. Developers wish to measure product quality to establish baselines, monitor
improvement and predict likely product quality.
The user view concentrates on reliability and usability, which are said by Gilb [GIL87]
to be directly measurable. The manufacturer view concentrates on defect counts and rework
costs. The relationship between defect counts and operational failures is unclear [KIT96].
The way in which quality is measured depends on the viewpoint taken and the aspect of
quality that the assessor wishes to capture. Techniques such as the GQM (Goal-Question-
Metric) paradigm can help to identify which measures will help to monitor and improve quality.
To understand and measure quality, researchers have built models of how quality characteristics
relate to one another [KIT96].
According to Kitchenham [KIT96], the McCall model reflects a user viewpoint and the
ISO9126 model reflects a product viewpoint. Kitchenham states that McCall and ISO9126 both
lack a rationale for determining which factors should be included in the quality definition, so
selection can appear somewhat arbitrary. Hence, it is not possible to determine if these models
are a complete or consistent definition of quality. Both also fail to describe how lowest-level
metrics are composed into an overall assessment of highest-level quality characteristics. There
are no provided means to verify that chosen metrics affect the observed behaviour of a factor.
There is no attempt to measure factors at the top of the hierarchy, so the models are
fundamentally untestable [KIT96].
Kitchenham [KIT96] states that another approach to quality modelling is to examine the
process, as in the work of Evans and Marciniak [EVA87]. Quality of software is not ‘just an IT
problem’; it is a business problem if the software affects the business. Shen [SHE87] states that
the goals for all Software Engineering research are improvements in productivity and quality.
The software engineering field is apparently not yet mature enough to establish what quality is,
which factors influence quality, and by how much.
Basili [BAS87] identifies that Software Quality Assurance (SQA) is increasingly
important due to the increasing influence of software. To correctly perform SQA, consideration
should be given to productivity, process quality and product quality. There are internal and
external requirements for SQA activities. An SQA policy should address ‘what to assure’,
‘when to assure’, ‘which methods and tools to use’ and ‘who is to provide the assurance’:
Basili [BAS87] identifies that SQA-associated measurement must be goal-oriented, and
driven by the overall defined objectives of SQA. Measurements must be objective, and can be
found or computed from software documents e.g. source code, designs, test data. Direct
measures allow a project-specific quantification of a quality factor of interest. Indirect measures

Chapter 2: Literature Survey - Quality concepts
- 12 -
help to predict the expected value of a direct measure (e.g. product complexity). Therefore,
SQA policy should define goals in terms of quality factors, for which measurements can be
taken to determine achievement. A quantitative SQA model has three phases: define quality
requirements quantitatively, plan quality control, and perform quality control.
Grady [GRA93] states that there is no standard definition of software quality. Some
possibilities include: ‘fitness for use’, ‘satisfying customer needs’ and ‘absence of defects’.
Grady states that it is initially most useful to focus on defects. A major software cost is
associated with defect fixing, as it is 100 times more expensive to fix errors found late in the
development process than at earlier phases.
Brooks [BRO87] states that fashioning complex constructs is the ‘essence’ of software
development, and that ‘accidental’ tasks arise from representing these constructs in language
(after Aristotle). There has been much success in reducing ‘accidental’ tasks, so future research
should concentrate on addressing the ‘essence’. Software projects are usually ‘innocent and
straightforward’, but can quickly become ‘a monster of missed schedules, blown budgets and
flawed products’.
According to Brooks [BRO87], there is no ‘silver bullet’ technique or tool which will
solve all software engineering difficulties. Due to the inherent properties of software, there is
unlikely to ever be one. No single development (in technology or management) is on the
horizon that by itself promises even one order-of-magnitude improvement in productivity,
reliability or simplicity. Inherent properties of software’s irreducible essence are: complexity,
conformity, changeability, and invisibility. Potential attacks on the conceptual essence of
software are fundamentally limited by the productivity equation, where time of task is the sum
of the products of the subtasks and the frequency of performing subtasks. Conceptual
components of the task are currently occupying most of the time, hence software engineers must
concentrate on attacking the essence of the software problem. Approaches suggested by Brooks
[BRO87] include ‘buy vs build’, ‘requirements refinement and rapid prototyping’, and
‘incremental development’.
2.4.3 Software engineering standards
Schneidewind [SCH96] states that there is ‘ample evidence’ that ‘standards and their related
practices do improve software quality’. It is stated that when software-quality standards are used
in product development, higher product quality is observed because standards ‘require that the
developer comply with a documented, formal, rigorous, disciplined, and repeatable process’.
Schneidewind accepts that many software standards have deficiencies. However, Scneidewind
draws attention to the benefits of a specific standard in the following quote: ‘Perhaps the most
significant example of standards influencing quality is the certification process of ISO 9000
quality-system standards. Whether you like this process or not, it is hard to deny that it forces
vendors to put greater emphasis on product quality – including software quality’.

Chapter 2: Literature Survey - Quality concepts
- 13 -
However, some problems with standards are identified. There is no consensus on what
constitutes ‘best practice’ in software engineering, and it is ‘best practice’ that is used to define
standards. Fenton could find no evidence that any existing standard could be considered
effective according to the criterion that an effective standard ‘improves the quality of the
resulting software products cost-effectively’. Furthermore, Fenton identifies that ‘in general,
software-engineering standards are written in such a way that we could never determine whether
they were effective or not.’ Fenton lists the problems associated with standards as being
[SCH96]:
1. Software standards overemphasise process.
2. Many software standards aren’t standards.
3. It is impossible to measure conformance to software standards.
4. Many software standards prescribe, recommend, or mandate the use of technology that
has not been validated objectively.
5. Many software standards are simply too big.
2.4.4 Measurement theory
Fenton [FEN91] defines ‘direct measurement of an attribute is measurement which does not
depend on measurement of any other attribute’, and ‘indirect measurement of an attributes is
measurement which involves the measurement of one or more other attributes’. Direct
measurement of an attribute must be preceded by an intuitive understanding of that attribute.
Indirect measures are normally based on equations relating one or more measures. ‘Internal
attributes’ can be measured purely in terms of the entity itself. ‘External attributes’ can only be
measured with respect to how the entity relates to its environment.
2.4.5 Statistical quality control
Cobb [COB90] notes a difficulty in producing reliable software at the same time as increasing
demand for larger, more complex systems. These are symptoms of a process that is not yet
under intellectual control. Projects are often late or over budget, execution failures are observed
and the development process is labour-intensive. Software engineers should be required to use
engineering practices that produce software that does not contain faults that cause latent
execution failures. Each inventive step should be followed immediately by a verification step
when under intellectual control, so subsequent inventions do not build on incorrect results.
Software use is stochastic (can be modelled as a Markov process), so statistical methods can be
applied. Therefore, developers can estimate the expected MTTF (Mean Time To Failure).
Software failures are precise, while software errors are imprecise.
Chapter 2: Literature Survey - Quality concepts
- 14 -
2.4.6 Quality measures and models
Fenton [FEN91] states that in a framework for software measurement, there are three classes of
entity: processes, products and resources (inputs to processes). Fenton [FEN91] quotes Conte,
who states that it is often the case that a measure is applicable to both process and products. A
‘model’ is an ‘abstract representation of an object’. A ‘prediction system’ consists of a
mathematical model together with a set of prediction procedures for determining unknown
parameters and interpreting results. In the past, models have performed poorly as they were
developed from post-hoc analysis of a particular data set. Calibration significantly improves the
accuracy of all models.
Paulk [PAU96] quotes George Box: ‘All models are wrong; some models are useful.’
This suggests that although it may not be known that a given model is ideal, or indeed the best
available, it may be useful in drawing conclusions.
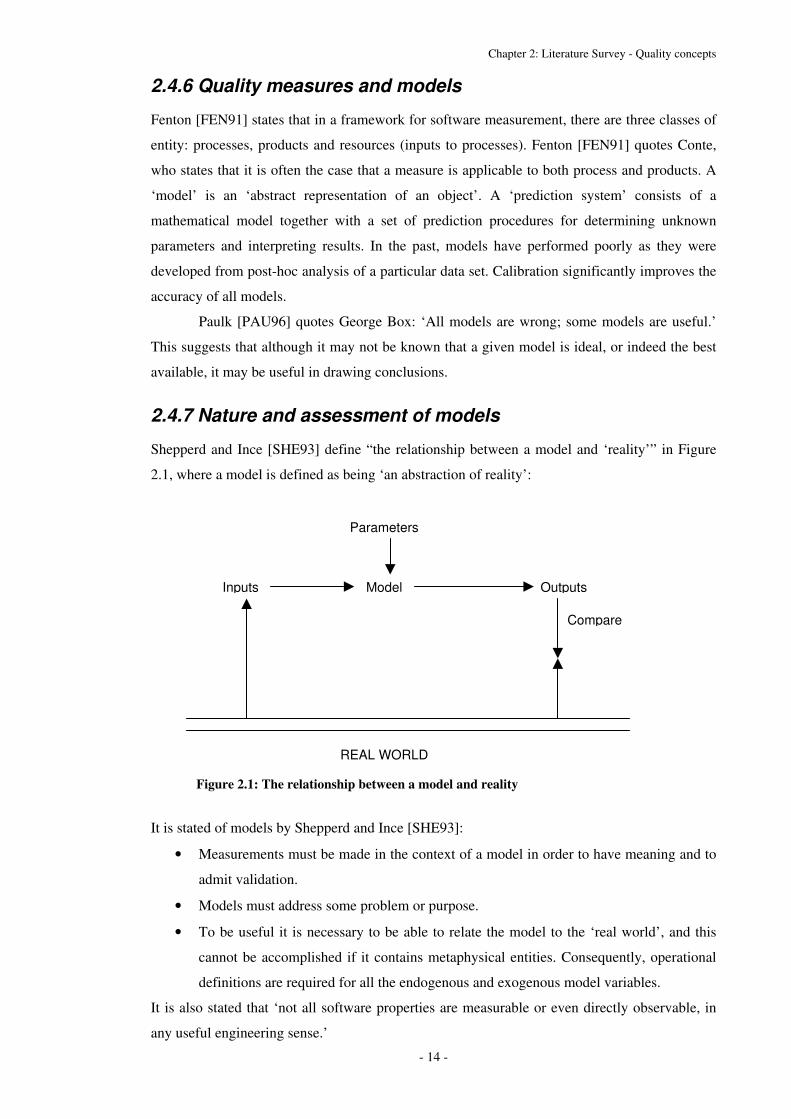
2.4.7 Nature and assessment of models
Shepperd and Ince [SHE93] define “the relationship between a model and ‘reality’” in Figure
2.1, where a model is defined as being ‘an abstraction of reality’:
It is stated of models by Shepperd and Ince [SHE93]:
• Measurements must be made in the context of a model in order to have meaning and to
admit validation.
• Models must address some problem or purpose.
• To be useful it is necessary to be able to relate the model to the ‘real world’, and this
cannot be accomplished if it contains metaphysical entities. Consequently, operational
definitions are required for all the endogenous and exogenous model variables.
It is also stated that ‘not all software properties are measurable or even directly observable, in
any useful engineering sense.’
Compare
Parameters
Outputs Model Inputs
REAL WORLD
Figure 2.1: The relationship between a model and reality

Chapter 2: Literature Survey - Quality concepts
- 15 -
Shepperd and Ince state that a model should be subject to theoretical and empirical
evaluation, and that theoretical evaluation should precede empirical evaluation as it is ‘often
much quicker, and is consequently a cheaper and easier method of exposing some of the
potential weaknesses in a model than is a full empirical study’ [SHE93].
For theoretical evaluation:
• The model must conform to widely accepted theories of software development and
cognitive science (a somewhat subjective criterion).
• The model must be as formal as possible.
• The model must use measurable inputs rather than estimates or subjective judgements.
For empirical evaluation, desiderata include:
• Large-scale empirical validations,
• Validation in a number of environments (particularly industrial environments),
• Adequate controls so it is possible for a null hypothesis to stand, and
• Different teams of workers should be involved for statistical variability.
Shepperd and Ince state ‘the vast majority of measurement models are entirely implicit. Even
when some attempt has been made to present the model behind the metric these are usually
incomplete in one or more respects’. Models may be described informally using the headings
[SHE93]: inputs, outputs, parameters, relationships, mappings from and on to the ‘real world’,
model limitations, and model reliability. A six-stage method of making the model underlying a
measure explicit is defined, in order to perform evaluation and refinement [SHE93].
Fenton [FEN91] states that a software engineer may use one of two approaches to
monitor software quality in conjunction with a model decomposition approach: the ‘fixed
model’ approach, or the ‘define your own quality model’ approach.
Hatton [HAT94] performs a comparison of ISO 9001 and CMM. He identifies that ISO
9001 certification does not correspond to a specific CMM level. Hatton suggests that
organisations should seek conformance with CMM levels 1 and 2 before attempting to gain ISO
9001 certification to avoid the likelihood to ‘self destruct in the process by formalising a
chronically deficient software process’. Hatton identifies that there is ‘inevitably a degree of
subjectivity’ but that ‘the result is useful’ when performing a comparison between the
component elements of different models, with the specific example of ISO 9001 and CMM
being provided and said to indicate a ‘tolerable correspondence’.
2.4.8 Frameworks for evaluation
Douglas states that in the past, evaluation of products has tended to be done on an ad-hoc, case-
by-case basis with each developer using criteria, techniques and test material closely tailored to
individual systems. Problems have been encountered due to a lack of agreement on a model for
even describing the phenomena. To develop and market products effectively, there is a need for

Chapter 2: Literature Survey - Quality concepts
- 16 -
generally accepted quality criteria and benchmarks (an increasingly recognised viewpoint).
User-targeted evaluations are particularly important for mass-market applications [DOU02].
Mendonca [MEN98] identifies that software organisations require methods for
understanding, structuring and improving the data they are collecting. A ‘measurement
framework’ is defined as ‘a set of related metrics, data collection mechanisms, and data uses
inside a software organisation’. ‘Measurement’ is defined as ‘the process of assigning a value to
an attribute’. A ‘measurement goal’ is defined as ‘an operational, tractable description of a user
group objective in using the data’. Where a GQM approach is used, each GQM structure should
specify the goals associated with a certain data user group (goals with the same ‘point of view’).
Problems identified with many existing measurement frameworks include collection of
redundant data, collection of data that is never used, and collection of data that may be useful to
people who are unaware of its existence.
Mendonca [MEN98] considers two main approaches to measurement frameworks.
1. ‘Top-down’
• Based on a GQM approach to identify measurement goals of data users. Goals are
mapped to metrics collected by the organisation.
2. ‘Bottom-up’
• This approach can be used to find new information in legacy data, and is dependent on
the existence of legacy data of sufficient quality and consistency.
One example of a ‘top-down’ framework to guide evaluation is ‘DECIDE’ [SIM02].
• Determine the goals to be addressed by evaluation
• Explore the specific questions to be answered
• Choose the evaluation paradigm, and techniques to answer the questions
• Identify the practical issues
• Decide how to deal with the ethical issues
• Evaluate, interpret and present the data
Hetzel [HET95] sets out a ‘suggested quality program for practices evaluation work’. There are
three key components:
1. A reference database of practices evaluation studies and results
2. A quality standard checklist and criteria for authors and reviewers
3. An independent quality review and conformance mark
The quality program would include a database of references, an independent quality review, and
a quality standard. The latter is a set of objective criteria that authors and study directors can use
to improve the visibility, validity and value of their practices evaluation work.
Hausen [HAU93] describes ‘a framework for measuring, assessing, and certifying the quality of
a software product’ and states that ‘reported information is meant to be equally useful to
software producers, vendors, and users’. It is intended to be used as a ‘handbook’ for evaluators.

Chapter 2: Literature Survey - Quality concepts
- 17 -
Four key principles of evaluations are defined as: repeatability, reproducibility, impartiality and
objectivity. Some common drawbacks with evaluations are identified. Some evaluation methods
are inherently subjective, or compromise objectivity due to required collaboration with users
and/or developers. Additionally, evaluators may not have access to some information sources
e.g. design documents or source code.
2.4.9 Software tools
Hatton [HAT94] identifies that that ‘continual hype’ of the software industry is responsible for
the inappropriate selection and usage of tools as it ‘replaces methodologies at regular intervals,
thus confusing the customer to the extent that the great majority of them use only a compiler,
reflecting a 1960s level of technology. The shelfware syndrome is singular if not unique to the
software world’. Hatton points out that in longer established engineering disciplines, ‘tools are
expected to become long-term aids to solve a particular problem, because the particular problem
is a side-effect of a stable well-defined process.’
2.4.10 Findings on ‘SQA’ section
Software Quality Assurance is the application of quality management principles and techniques
to the field of Software Engineering, with an emphasis on controlling quality throughout the
software process rather than retrospectively addressing defects. This requires software
organisations to address their working methods, and to consider the quality viewpoint of each
stakeholder. Software Engineering standards represent one approach to quality control by
definition of a single, universally accepted understanding of quality in specific contexts,
although it may be difficult to find agreement on standards. Successful use of statistical quality
control methods is desirable but also dependent on correct understanding and application of
measurement theory. Quality models have been proposed to present a unified understanding of
quality issues relevant in a specific context, and may be used for purposes of measurement,
understanding and prediction. However, models should be evaluated and validated prior to
usage to ensure their usefulness. Frameworks of evaluation exist that may be used to perform
measurement of software products, software processes and quality models. Software support
tools may be useful in performing measurement and evaluation.
2.5 Software products
2.5.1 Overview and structure of ‘Software products’ section
Software products include source code, designs, test plans and documentation items, and
represent the parts of software development programmes most visible to customers and end-
users. Different quality factors may be applicable to each class of product. In order to measure

Chapter 2: Literature Survey - Quality concepts
- 18 -
and control quality of software products, it is necessary to define what is understood by 'quality',
and for each class of product define what constitutes 'high' and 'low' quality.
This section begins by considering what is understood by software product quality,
which may be defined in terms of internal product attributes or external product behaviour.
Linking internal product quality attributes to external quality attributes is performed through
definition of models. This is followed by an examination of software metrics, which are
quantitative measures of attributes thought to indicate quality attributes. Consideration is given
to types of metrics and observed levels of success in their application in development
environments. Examples of software product quality metrics are provided. Analysis is
performed of the extent to which values of metrics are correlated with actual product quality.
2.5.2 Software product quality issues
Dromey [DRO95] states that ‘software does not directly manifest quality attributes’, but rather
it ‘exhibits product characteristics that imply or contribute to quality attributes and other
characteristics (product defects) that detract from the quality attributes of a product’. Dromey
states that most models of software quality fail to adequately deal with the ‘product
characteristics’ and fail to make the direct links between quality attributes and corresponding
product characteristics.
Dromey [DRO95] states that the prime requirement of a software product quality model
is to make clear and direct links between high-level quality attributes and explicit product
characteristics at all levels. A model should provide:
• Systematic guidance for building quality into software,
• A means to systematically identify/classify software characteristics and quality defects,
and
• A structure that is understandable at a number of levels, refineable and adaptable.
A common approach to formulating a software product quality model is to first identify a small
set of high-level quality attributes and then, in a top-down fashion, decompose these attributes
into sets of subordinate attributes.
Dromey [DRO96] states that ‘concrete and useful suggestions about what constitutes
quality software have always been elusive’. Some notions such as ‘quality’, ‘goodness’ and
‘fitness for purpose’ are stated to be experiential (i.e. ‘people make a judgement’). It is stated
that developers ‘cannot build high-level quality attributes like reliability or maintainability into
software’. The alternative approach suggested by Dromey is to define a set of product properties
that lead to the manifestation of high-level quality attributes, and then define links between
tangible product properties and high-level quality attributes. ‘A product’s tangible internal
characteristics or properties determine its external quality attributes’ is defined as a
‘fundamental axiom of software product quality’.

Chapter 2: Literature Survey - Quality concepts
- 19 -
Dromey [DRO96] identifies a five-step process for the construction of a software
product quality model, as follows:
1. Identify a set of high-level quality attributes for the product.
2. Identify the product components.
3. Identify and classify the most significant, tangible, quality-carrying properties for each
component.
4. Propose a set of axioms for linking product properties to quality attributes.
5. Evaluate the model, identify its weaknesses, and either refine it, or scrap it and start
again.
High-level quality attributes applicable to products of the ‘requirements’, ‘design’ and
‘implementation’ of a software development process are defined by Dromey [DRO96].
Hatton [HAT94] argues that there is ‘a property of software which experienced programmers
can identify with quality without knowing the function of the software’, referred to as ‘intrinsic
product quality’. The latter is defined to consist of the following four features: ‘zero statically-
detectable faults’, ‘zero transgressions of internal programming standards’, ‘zero dependence on
relevant unspecified features or any undefined linguistic features’, and ‘limitation of component
complexity’. ‘Software product compliance’ is defined as adherence to these properties.
2.5.3 Software metrics
The ISO9126 standard [ISO9126] states that ‘the correlation between internal attributes and
external measures is never perfect, and the effect that a given internal attribute has upon an
associated external measure will be determined by experience, and will depend on the particular
context in which the software is used’. It is stated that ‘it is generally difficult to design a
rigorous theoretical model which provides a strong relationship between internal and external
metrics’. Evaluating quality in use validates software product quality in specific user-task
scenarios.
‘Internal metrics measure internal attributes or indicate external attributes by analysis of the
static properties of the intermediate or deliverable software products’ [ISO9126].
Documentation can also be evaluated using internal metrics. An advantage of internal metrics is
that they can be used to ‘evaluate software product quality and address quality issues early
before the software product becomes available’.
‘External metrics use measures of a software product derived from measures of behaviour of the
system of which it is a part by testing, operating and observing the executable software or
system.’ [ISO9126] An advantage of external metrics is that they can be used to ‘evaluate
software product quality during testing or operation’ [ISO9126]. McCall [MCC77] notes that
metrics may be objective or subjective.
Kitchenham [KIT96] observes that the ESPRIT-funded ‘Request’ project concluded in
1984 that there are no software product metrics that were likely to be good predictors of final

Chapter 2: Literature Survey - Quality concepts
- 20 -
product qualities. By 1996, there was no evidence of any significant improvement. However,
much useful research in software metrics concentrates on linking software product measures to
error-prone modules. However, Gilb [GIL96] states that “we must stop messing with ‘internal’
software metrics such as complexity and function points and learn really powerful software
metrics based on final-product, customer-perceived results such as adaptability, availability,
reliability, maintainability, security, portability, and performance.’ Gilb offers the alternative
opinion that it is only useful to apply metrics usage to attributes which will be apparent to the
user, rather than those that may be useful to developers in a software process.
Khoshgoftaar [KHO01] states that ‘software product metrics quantify attributes of the
software itself, without regard for its development history’. Software product metrics can
provide quantitative understanding of some software product at a fixed point in development. A
software product metric cannot identify or quantify how the software product came to be in this
state or chart the development path followed.
Khoshgoftaar observes that it is not possible to capture all of a program’s detail in one
measurement; each metric measures an abstraction of a module, focussing on certain attributes
and ignoring others. This implies that a suite of measures is required if a total understanding of
all attributes in which the developer is interested is to be achieved. This also implies that the
developer must identify the attributes in which they are interested, and select a set of software
metrics which considers all required attributes [KHO01].
According to Kitchenham [KIT95], a number of software metrics may be composed
into a model, where it is assumed that the different metrics are complementary. The process of
‘validating a model’ is used to ensure a useful statistical relationship at the level of the model.
A validated quality model may be useful for quality assessment, control or prediction
[SCN92]. This demonstrates that a validated quality model may be used for several different
purposes: assessment, control and prediction.
According to Porter and Selby [POR90], the 80/20 rule states that 20% of a system is
responsible for 80% of errors, costs and rework effort. Identifying and classifying ‘high-risk’
components early in the lifecycle is an effective way to improve quality.
Mills and Dyson [MIL90] state that metrics are quantitative measures of certain
characteristics of a development project. They may measure software products, the development
process, the problem domain, and environment characteristics. Metrics can enhance
management control over the development process and product quality. The earlier in the
lifecycle that metrics are focussed to project-specific goals, the more control the developer has
on quality in terms of functionality, cost and schedule.
Shen [SHE87] states that the time to produce, understand or debug programs is a
mathematical function of the counts of various tokens. These are related to issues of
‘complexity’. Empirical studies in the 1970s failed to show good evidence that any newer
complexity measures were significantly better than LOC. By 1987, fewer people were trying to

Chapter 2: Literature Survey - Quality concepts
- 21 -
formulate combinations of complexity metrics to relate to definitions of productivity and
quality. A more modern approach is to set very narrow goals, and identify whether they are
reached in a project by using focussed metrics. For example, producing higher quality software
is a general goal. A narrow goal is ‘test the software more thoroughly’. An appropriate metric
would be some measure of test coverage. Program quality can be measured by the number of
bugs found in a thousand lines of code.
Grady [GRA87] states that an effective way to improve quality is to set measurable
goals. Modern design/implementation methods give higher initial quality than in the past, but
the quality of older products subjected to continuous change is often poor. Typically, there are a
number of ‘problem’ modules which remain problematic throughout development. Any given
module tends to account for a stable proportion of known defects. Defect categorisation is a
powerful tool. A substantial proportion of defects could be traced to a poor understanding of
user requirements. In large systems, the rate of change in trends may be more useful than the
actual trends, as this identifies the level of product stability.
Kafura and Reddy [KAF87] suggest that absolute values of metrics are less important
than relative values, so that components may be identified with undesirable properties. The use
of a spectrum of metrics gives a more accurate measure of system complexity than a single
metric, so is more likely to be a useful predictor of maintainability. Collecting metrics is not
cheap, and may require special-purpose software for code analysis. The costs of this may exceed
the benefits derived from maintainability estimation.
Lewis and Henry [LEW89] divide software complexity metrics into three categories,
and provide examples of each, as follows:
1. Code metrics: examine the internal complexity of a procedure by analysing the amount
of information within the procedure or assessing the logical complexity of the code.
2. Structure metrics: examine the relationship between a section of code and the rest of the
system.
3. Hybrid metrics: combine an internal view of a procedure (code metrics) with a measure
of the communication connections between that code and the rest of the system
(structure metrics).
Shepperd and Ince [SHE93] state that ‘the main thrust of research in software metrics has been
towards measurement of code, yet … by the time the code is available for measurement, the
majority of a software project’s resources have been committed, so that any strategic changes in
direction become prohibitively expensive’. It is stated that software metrics are frequently
‘categorised as either product or process metrics’. Shepperd and Ince [SHE93] list types of
‘code metrics’: ‘Lines Of Code (LOC)’, ‘Software Science metrics’, ‘graph theoretic metrics’
and ‘hybrid metrics’.
Shepperd and Ince [SHE93] state a need to develop ‘metrics that provide useful
quantitative feedback for staff involved in developing of software system designs’. The term

Chapter 2: Literature Survey - Quality concepts
- 22 -
‘useful’ implies the need for validation. They state ‘There is no shortage of metrics, what is less
in evidence, though, are metrics that are generally valid, usable, and useful, and thus widely
accepted.’
Shepperd and Ince agree with Basili and Hutchens [SHE93], who suggest that LOC be
used as a baseline metric against which all other metrics be compared, in the following: ‘It
would be reasonable to expect an effective code metric to perform better than LOC and so, as a
minimum, LOC offers a ‘null hypothesis’ for empirical evaluations of software metrics’.
Shepperd and Ince [SHE93] identify problems with some commonly-known software
code metrics, for example, Halstead’s Software Science metrics. They state: ‘Early empirical
validations of Software Science produced apparently large correlations between predicted and
actual results’; however, ‘a number of serious problems have emerged’. These include
uncertainties of the scope of the metrics, uncertainties of the intended uses and applications of
the metric, confusion as to how the basic inputs to the calculations are defined, and
‘considerable disquiet concerning the quality of many empirical validations and their associated
statistical analyses’. A number of theoretical objections are also identified.
Somerville [SOM96] refers to a number of studies which cast doubt on the usefulness
of a number of commonly quoted metrics when applied in case studies or analysed theoretically.
This is significant, as some of the metrics which are considered are influential and have been
used in practice or have influenced further research work. Sheperd et al did not conclusively
find Halstead/McCabe measurements to be predictors of maintainability or understandability.
Hamer and Frewin did not find Halstead’s measurements to work [SOM96].
Fenton [FEN91] states that ‘internal product attributes’ are ‘attributes of software
products (including documents) which are dependent only on the product itself.’ It is stated that
there is a ‘wide consensus among software engineering experts’ that certain internal structural
attributes will assure:
• The external attributes expected by software users e.g. reliability, maintainability,
usability, and
• The external process attributes expected by managers e.g. productivity, cost-
effectiveness.
Internal product attributes that can be measured early in the process and can be used to predict
attributes of the eventual implemented system (e.g. cost, effort, size, complexity and quality),
evaluate personnel performance, and evaluate the quality of the specification and design
documents. Internal attributes for specification documents include: ‘length’, ‘functionality’,
‘modularity’, ‘reuse’, ‘redundancy’, and ‘syntactic correctness’. Internal attributes for formal
designs and code are similar to those for documents, but include the additional attributes of
‘structuredness’ and ‘model coupling and cohesiveness’ [FEN91].
Fenton [FEN91] states that ‘external product attributes’ are ‘those attributes which are
dependent on entities additional to the product in question’. For software products (e.g.

Chapter 2: Literature Survey - Quality concepts
- 23 -
specification and design documents, code, test strategy documents), these include: ‘reliability’,
‘usability’, ‘understandability’, ‘maintainability’, ‘integrity’, ‘efficiency’, ‘testability’,
‘reusability’, ‘portability’, and ‘interoperability’. Software defects do not necessarily lead to
software failures. Only the latter are seen by users and are hence closely related to quality.
2.5.3.1 McCabe cyclomatic complexity measure McCabe [MCC76] defines the cyclomatic number V(G) of a graph G with n vertices, e edges
and p connected components as: V(G) = e-n+p
A ‘program control graph’ is constructed from these elements, and hence this cyclomatic
complexity measure can be applied to program control graphs. McCabe found a close
correlation between a ranking of subroutines by complexity and a ranking by reliability.
McCabe therefore proposes that developers should limit modules by complexity, not size.
McCabe places an upper bound of around 10 as a limit of acceptable complexity using the
cyclomatic complexity measure.
2.5.3.2 Halstead Software Science Halstead [HAL77] defines a number of software code metrics, known as ‘Halstead’s Software
Science’. It is based on the concept that ‘an algorithm consists of operators and operands, and of
nothing else’. The generalisation of algorithms to computer languages is stated to be ‘simply by
induction’. Halstead defines a number of software code metrics, based on four initial values
derived from a given sample of code. From these values, a number of other software code
metrics can be found mathematically through the application of simple equations. These
include: vocabulary size, length, program volume, program level, language level, effort,
implementation time, and intelligence content. Halstead provides a mathematical derivation of
each of these terms, and in some cases provides implementation details and results of validation
procedures.
2.5.4 Findings on ‘Software products’
Software product quality may be understood in terms of internal or external quality attributes.
The former represent the inherent quality of a product, and the latter represent the external
behaviour of a product. However, typically end-users and customers observe only external
quality attributes, and therefore internal quality attributes must be linked to external quality
attributes if they are to be applied meaningfully. Definitions and models of software product
quality have been proposed. A significant proportion of research in software quality has
focussed on the development and validation of software product metrics, of which a large
number have been proposed. These are measures of some attribute of software products thought
to be linked to quality, where measurement of a metric is equivalent to measuring the extent to
which a product satisfies a specific notion of quality. Software product quality models are
typically composed through hierarchical decomposition of a definition of ‘quality’, breaking
this down into progressively lower-level and more specific definitions in a tree-like structure.
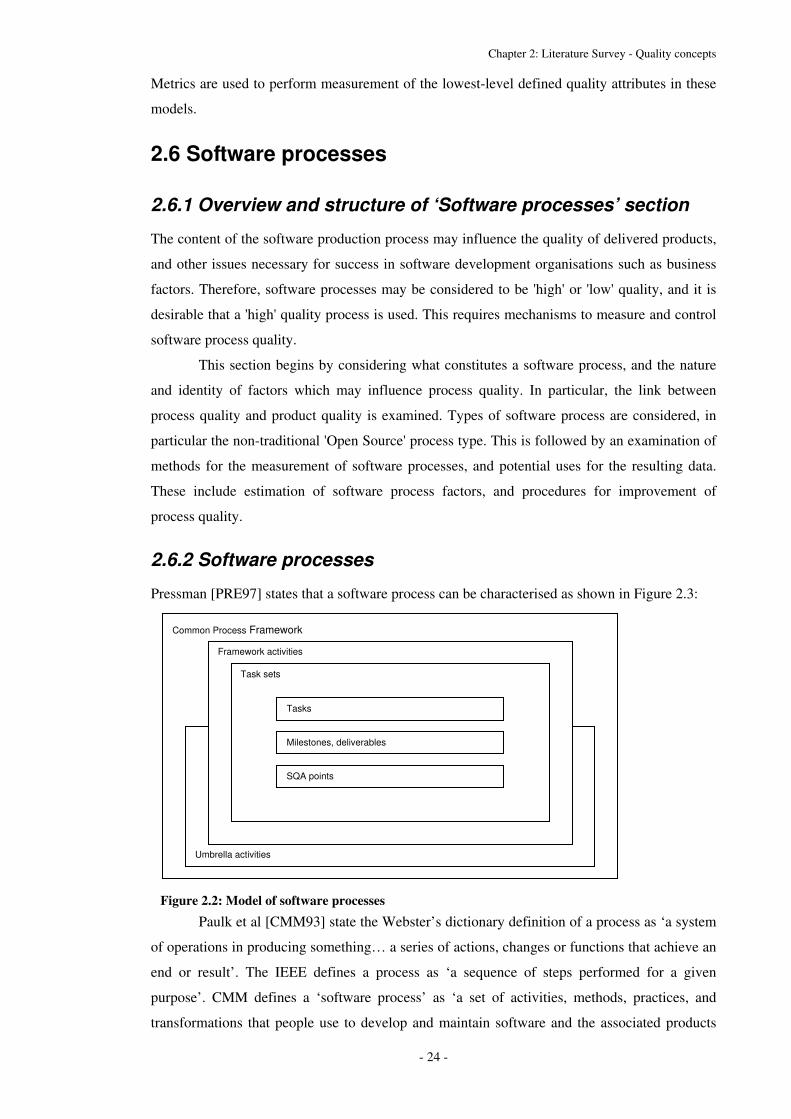
Chapter 2: Literature Survey - Quality concepts
- 24 -
Metrics are used to perform measurement of the lowest-level defined quality attributes in these
models.
2.6 Software processes
2.6.1 Overview and structure of ‘Software processes’ section
The content of the software production process may influence the quality of delivered products,
and other issues necessary for success in software development organisations such as business
factors. Therefore, software processes may be considered to be 'high' or 'low' quality, and it is
desirable that a 'high' quality process is used. This requires mechanisms to measure and control
software process quality.
This section begins by considering what constitutes a software process, and the nature
and identity of factors which may influence process quality. In particular, the link between
process quality and product quality is examined. Types of software process are considered, in
particular the non-traditional 'Open Source' process type. This is followed by an examination of
methods for the measurement of software processes, and potential uses for the resulting data.
These include estimation of software process factors, and procedures for improvement of
process quality.
2.6.2 Software processes
Pressman [PRE97] states that a software process can be characterised as shown in Figure 2.3:
Paulk et al [CMM93] state the Webster’s dictionary definition of a process as ‘a system
of operations in producing something… a series of actions, changes or functions that achieve an
end or result’. The IEEE defines a process as ‘a sequence of steps performed for a given
purpose’. CMM defines a ‘software process’ as ‘a set of activities, methods, practices, and
transformations that people use to develop and maintain software and the associated products
Common Process Framework
Umbrella activities
Framework activities
Task sets
Tasks
Milestones, deliverables
SQA points
Figure 2.2: Model of software processes
Chapter 2: Literature Survey - Quality concepts
- 25 -
(e.g. project plans, design documents, code, test cases, and user manuals)’. ‘Software process
capability’ is defined as ‘the range of expected results that can be achieved by following a
software process’. ‘Software process performance’ is defined as ‘the actual results achieved by
following a software process’. ‘Software process maturity’ is defined as ‘the extent to which a
specific process is explicitly defined, managed, measured, measured, controlled, and effective’.
Florac and Carleton [FLO99] use Pall’s 1987 definition of a process, ‘A process can be
defined as the logical organisation of people, materials, energy equipment, and procedures into
work activities designed to produce a specified end result’. This view of a process is stated to be
‘at the very heart of statistical process control since its founding in the 1920s’, for example from
the work of Shewart (1931) and Juran (1988). The CMM uses a different definition of a process,
which is interesting as the CMM is stated to utilise the work of Juran in its foundation [PAU93].
Florac and Carleton [FLO99] define and categorise measurable entities of a software
process that may be of interest when attempting to measure a software process. For measurable
entities, a number of measurable attributes are identified. The measurable entities are divided
into ‘measurable entities in a software process’ and ‘measurable attributes associated with
software process entities’.
According to Schneidewind [SCH96], ‘There is no guarantee that a “good” process will
lead to a good product, and there is no consensus that the processes mandated in many standards
are even “good”’. Hatton [HAT94] outlines the requirement for ‘sufficiently well defined’
processes in order for the identification of ‘automation opportunities’. Hatton states that ‘ISO
9001 certification and level 2 and perhaps even level 3 of the Carnegie-Mellon CMM is
probably a necessary condition for this.’
Dromey [DRO96] states that ‘Today the dominant modus operandi for software
development is heavily process-oriented’. Dromey states a goal is to ‘remove a programmer’s
license to apply bad practices’. Dromey states that ‘if we accept the notion that a quality process
is needed to a produce a quality product, then we should demand that the product be developed
by a mature, well-defined process’. This requires a high-level attribute, ‘process-mature’, to be
added to each product’s quality model, ‘a practical way to link the process to product quality’.
Withrow [WIT90] states that the ability to measure a process increases the
understanding of it. Withrow quotes Kelvin: ‘When you can measure what you are speaking
about, and express it in numbers, you know something about it.’
Hetzel [HET95] considers the ‘current state and technology for software practice (as
distinguished from product) measurement and evaluation’. Current measurement practices
include: surveys, studies and experiments, and assessments. Hetzel identifies problems
associated with each, so no approach may be considered ideal.
Process assessments have taken place for many years at different levels of formality.
The CMM is an example of an assessment approach which has had a substantial impact on
industry practice. Assessments have the goal of providing an objective appraisal of current
Chapter 2: Literature Survey - Quality concepts
- 26 -
software practices. Hetzel [HET95] notes that the following key questions have not been
answered:
• Do ‘higher’ assessments correlate with better, higher quality results?
• Do ‘higher’ assessments correlate with better, more productive results?
• Are the various forms of assessments a ‘repeatable’ process?
• How do the results differ between various assessment approaches?
• Which assessment process (if any) is more reliable and effective?
Although thousands of assessments have been performed, it is still not known whether the
maturity model is actually valid in the sense of higher levels correlating to more measured
project success. More emphasis should be placed on knowing and tracking measured
probabilities of success by level.
A software process framework is established by defining a number of ‘framework
activities’ applicable to all software projects. A number of ‘task sets’, each a collection of SE
work tasks, project milestones, software work products and deliverables, and quality assurance
points, enable the framework activities to be adapted to the characteristics of the software
project and the requirements of the project team. ‘Umbrella activities’ overlay the process
model, are independent of any one framework activity and occur throughout the process.
Software quality assurance, configuration management and measurement are umbrella
activities.
It is stated that the use of process assessment techniques would have a number of
benefits to an organisation beyond simply attaining knowledge of the process. These include the
encouragement of a ‘culture of continuous improvement’, optimisation of resource usage, and
the engineering of business practices to meet business requirements [SPI02b].
Hatton [HAT00] states that ‘the belief of any software process model is of course that
adhering to a defined set of procedures will be positively correlated with the production of
software which is in some sense of higher quality’. This may mean ‘more cheaply produced’, or
‘closer to the intended requirements of the user’, but ‘one implicit requirement is that the
software should be more reliable’. It is stated that ‘the main effect of formal process models
seems to be to reduce the not insignificant risk of nothing appearing at all, and to reduce
lateness in those products which are delivered’.
Hatton [HAT00] attempts to answer the question of ‘is there any evidence to justify that
software process models help to produce better software by whatever criterion we happen to
define as higher quality?’ An informal assessment is performed of a software product produced
through an Open Source development model using the CMM model. Hatton provides reliability
measurement data as evidence that the product developed by this Open Source process is of
high quality. This assessment considers only levels 2 and 3 of CMM. The assessment is not
performed in the manner suggested in [MAS95] and does not use the defined KPA goals and

Chapter 2: Literature Survey - Quality concepts
- 27 -
KPA common features. Hatton finds that the process is ‘firmly rooted at level 1, known politely
as chaotic, while simultaneously having areas of exceptional strength’.
Hatton [HAT00] presents evidence that the Linux operating system is ‘reliable’, despite
being produced through a software process which ‘traditional software process models would
probably classify as chaotic’, and seeks to establish if ‘process models are wrong’. Hatton
observes ‘significant differences between Linux and the CMM’ for example in terms of
adherence to deadlines and ‘Darwinian Software Development’, where ‘in commercial closed-
source development, there is no mechanism for evolutionary adaptation based on parallel
development’. However, Hatton identifies that the ‘quality of implementation staff’ and code
inspections are important to the success of both the Linux process and traditional processes.
Hatton states that for Linux, ‘the lack of a formal software process … has not been a handicap’.
2.6.3 Open Source software processes
It is stated that ‘The basic idea behind Open Source is very simple: When programmers can
read, redistribute, and modify the source code for a piece of software, the software evolves.
People improve it, people adapt it, people fix bugs.’ [OSI02] It is stated that ‘the open source
community have learned that this rapid evolutionary process produces better software than the
traditional closed model, in which only a very few programmers can see the source and
everyone else must blindly use an opaque block of bits’ [OSI02].
The ‘Open Source Quality Project’ [OPE02] is concerned with ‘designing and building
tools to improve the quality of Open Source software’. The three main branches in the analysis
of software in the project are: formal verification and theorem proving, model checking, and
large-scale software analysis.
It is stated [OPE02] that ‘Open Source is attractive as a research vehicle in software
quality because of the critical role it plays in the nation's economy and precisely because it has
the unique feature that it is a real-world system that is completely open and available for study.
Because of the Open Source tradition of incorporating useful new techniques and tools into the
Open Source environment, there is also an opportunity for direct and widespread impact.’
Therefore, the use of Open Source in research avoids issues concerning confidentiality of
assessment results of commercial projects, and ensures that source data are available for
researchers to work upon to confirm or contradict the work of others to verify conclusions
drawn. More credibility can be lent to results obtained from ‘real world’ software development
projects than those obtained from studies performed in artificial environments that have little
relevance to the manner in which software is developed on ‘real world’-scale projects.
Chapter 2: Literature Survey - Quality concepts
- 28 -
2.6.4 Software process measurement
According to Fenton [FEN91], during the performance of a software process, the following can
be recorded and measured: incidents, faults and defects, changes, execution time, project time,
effort, and cost.
Florac and Carleton [FLO99] state that software processes have influence in ‘planning,
estimating, designing, coding, testing, inspecting, reviewing, measuring, and controlling, as well
as the subtasks and activities that comprise these undertakings’. Watts Humphrey states that
statistical process control methods can be used to ‘understand process behaviour, and to bring
stability, predictability, and improvement to software processes’.
Florac and Carleton [FLO99] state that ‘characteristics of software products and
processes can be measured and analysed using statistical process control’, and production
activities ‘improved to achieve business and technical goals’. The ‘four responsibilities that are
central to process management’ are: process definition, process measurement, process control
(ensure variability is stable so results are predictable), and process improvement. This is
characterised in the PDCA cycle (Plan, Do, Check, Act). Possible uses for process measurement
results include: assessment of process stability and capability, prediction of future costs and
performance, provision of baselines and benchmarks, to plot trends, and to identify
opportunities for improvement.
Florac and Carleton [FLO99] state that the following issues of software processes must
be considered in process measurement: performance, stability, compliance, capability and
improvement. Steps for identifying process issues are defined. Common process issues are
identified as: product quality (specifications, tolerances, action limits and defects), process
duration, product delivery and process cost. Anomalous process behaviour patterns which may
emerge in measurements of a software process are identified such as cycles, rapid changes in
level and stratification.
2.6.5 Software process estimation
Fenton [FEN91] finds that there are two approaches to software process estimation:
• Top-down: Aims to provide total project estimates, individual tasks assumed to be a
proportion of the total project effort.
• Bottom-up: Based on estimating the effort for individual the effort for individual tasks,
the effort for the entire project assumed to be the sum of the effort for each task.
Fenton [FEN91] defines two main types of estimating model for software processes:
• Cost models: Provide direct estimates of effort or duration (e.g. COCOMO).
• Constraint models: Demonstrate the relationship over time between two or more cost
parameters (e.g. Rayleigh curve models).
Chapter 2: Literature Survey - Quality concepts
- 29 -
2.6.6 Software process improvement
According to Hetzel [HET95], published figures for improvements in process due to the use of
new technologies are often impossible to verify (e.g. those of Jones, Grady and Musa) and data
typically need to be accepted ‘on faith’. Hetzel quotes Weinberg [HET95] who states ‘We
measure a lot and understand little.’ Technologies for measuring process differences (and
finding which ones work) are ‘immature and undisciplined’, with ‘much of the measured data’
being ‘unreliable and misleading’ states Weinberg, as quoted by Hetzel [HET95]. Hetzel
[HET95] quotes Weinberg ‘Careful well-documented analysis based on measured experiences
with validated results that all can see and probe is the rare exception, not the norm that it ought
to be’ [HET95].
Goodman [GOO95] considers that developers should ‘concentrate on implementation to
achieve improved products or deliverables’, hence the need for ‘process improvement’.
Goodman considers process improvement in the context of TQM (Total Quality Management),
and states that ‘process improvement, as a philosophy, is the natural implementation of all the
principles on which TQM is founded’. However, in the UK 80% of TQM programmes fail to
deliver quantifiable or qualitative improvements [GOO95]. Goodman [GOO95] defines ‘five
dimensions of successful process improvement’ as: ‘management commitment’, ‘human
development’, ‘business process development’, ‘measurement and control’, and ‘management
of change’.
Paulk et al [PAU96] state that the five stages of the software process improvement cycle
according to the SEI IDEAL approach are: ‘Initiating’, ‘Diagnosing’, ‘Establishing’, ‘Acting’
and ‘Leveraging’.
Florac and Carleton [FLO99] state that the application of the principles of statistical
process control can be used to ‘improve process performance and process capability’, using
measures of variability to identify ‘opportunities for improving the quality of products and the
capability of processes’. Florac and Carleton [FLO99] state ‘While it may be true that few
software processes have explicit specification limits, it is always true that excessive variability
and off-target performance are inefficient and costly’. However, Florac and Carleton [FLO99]
highlight Taguchi’s observation that organisations which as a policy operate processes within
explicit specification limits often neglect processes which conform to this requirement, in
conflict with the principles of continual process improvement. This implies that it is useful to
monitor which elements of a process undergo continual change and which elements are allowed
to stagnate.
2.6.7 Findings on ‘Software processes’
Software processes define the totality of procedures performed in software development and
maintenance, and encompass sets of tasks related to software product development and process
management. Several types of software process exist, such as those based on the ‘Open Source’

Chapter 2: Literature Survey - Quality concepts
- 30 -
paradigm. A number of models for software processes and software process quality have been
proposed, each embodying the principles of a specific understanding of an idealised software
process. Models may be deployed for a number of purposes, including process design, process
quality measurement, process behaviour estimation, and process improvement. Industrial usage
of process assessment is common, although doubts remain as to the validity of assessment
results in producing useful findings. These doubts stem from considerations as to whether
traditional notions of ‘high quality’ processes necessarily result in successful projects, and
whether projects can be successful without a ‘high quality’ process. It is thought that process
quality measurements are a good predictor of process behavioural performance such as meeting
deadlines, but it remains to be proven that a strong link exists between measured process quality
and the quality in the resulting software products.
2.7 Quality models
2.7.1 Overview and structure of ‘Quality models’ section
Quality models bind a set of quality issues and factors into a structured coherent form,
providing a framework for evaluation and measurement of entities. Typical applications include
objective measurement of quality, establishing and defining quality targets, providing guidance
in how improvement activities may be performed, and providing guidelines in the definition of
'good practice'. Numerous models have been defined and published for both software product
quality and software process quality. Few models consider both product and process quality in a
unified manner. It is therefore important to examine a number of the more influential and
commonly-used models, both in terms of their defined content and observed success in
application in production environments. At this stage no formal comparison is performed
between models or categories of models.
Software process quality models form the focus of this thesis. The composition and
background of those specific software process quality models selected for comparison is
therefore considered in depth in Chapter 3. Information about models which could be utilised in
an analogous comparative evaluation procedure for software product quality models is
presented in the remainder of this chapter.
2.7.2 Software product quality models overview
A survey was made of the literature to identify those software product quality models that were
suitable for further investigation and possible utilisation in a case study. Therefore, it is of key
importance that the candidate models be complete, fully documented, and freely available
otherwise it would not be possible to implement them in practice. Other factors considered were
the extent to which the model had influenced the field of software quality, how widely
referenced the model was, whether the model introduced innovative ideas and concepts, how

Chapter 2: Literature Survey - Quality concepts
- 31 -
widely the model is used in industry, and its possible status as an international standard. The
availability of supporting resources was also taken into consideration when selecting the models
and the versions of models.
Examination is performed in turn of the content and background of 'McCall's model',
'ISO 9126', 'Dromey's model' and 'Boehm's model'. This model set is considered representative
of published software product quality models. Summarised findings are then presented.
2.7.3 McCall’s model
Kitchenham [KIT96] states that McCall’s quality model of 1977 is one of the earliest and most
influential models. It defines software product attributes as a hierarchy of quality factors, quality
criteria and quality metrics. A quality factor represents a behavioural characteristic of the
system. A quality criterion is an attribute of a quality factor that is related to software
production and design. A quality metric is a measure that captures some aspect of a quality
criterion. The eleven defined quality factors contribute to a complete picture of software quality.
One or more quality metrics should be associated with each quality criterion.
Kitchenham [KIT96] finds that metrics are derived from the number of positive (‘yes’)
responses to such questions as ‘Is all documentation…’ where a ‘yes’ response corresponds to a
favourable quality concept. Questions of this type are subjective. Dividing the number of ‘yes’
responses by the total number of responses (to find a ratio) gives a value in the range 0.0-1.0.
These measures can be composed into either measures of specific quality factors, or measures of
overall product quality. Problems with this approach include:
• Level of subjectivity varies from question to question,
• It is difficult to combine metrics, and
• Response complexity should in some cases be reflected in a richer measurement scale
(e.g. a multiple-point ordinal scale) rather than a simple ‘yes/no’ scale.
McCall et al [MCC77] set out an approach to quantify software quality:
1. Determine a set of quality factors which jointly comprise software quality.
2. Develop a working, hierarchical definition by identifying a set of criteria for each
factor.
3. Define metrics for each criterion and a normalisation function which relates and
integrates the metrics for all of the criteria of a factor to an overall rating of that factor.
4. Validate the metrics and normalisation functions.
5. Translate the results into guidelines.
McCall et al [MCC77] define a number of metrics and normalisation functions. Regression
analysis showed significant correlation for some metrics with related quality factors. An
integrated approach must be developed to effectively collect metric data in any software
development environment. A working set of software quality factors is defined as: correctness,
reliability, efficiency, integrity, usability, maintainability, testability, flexibility, portability,
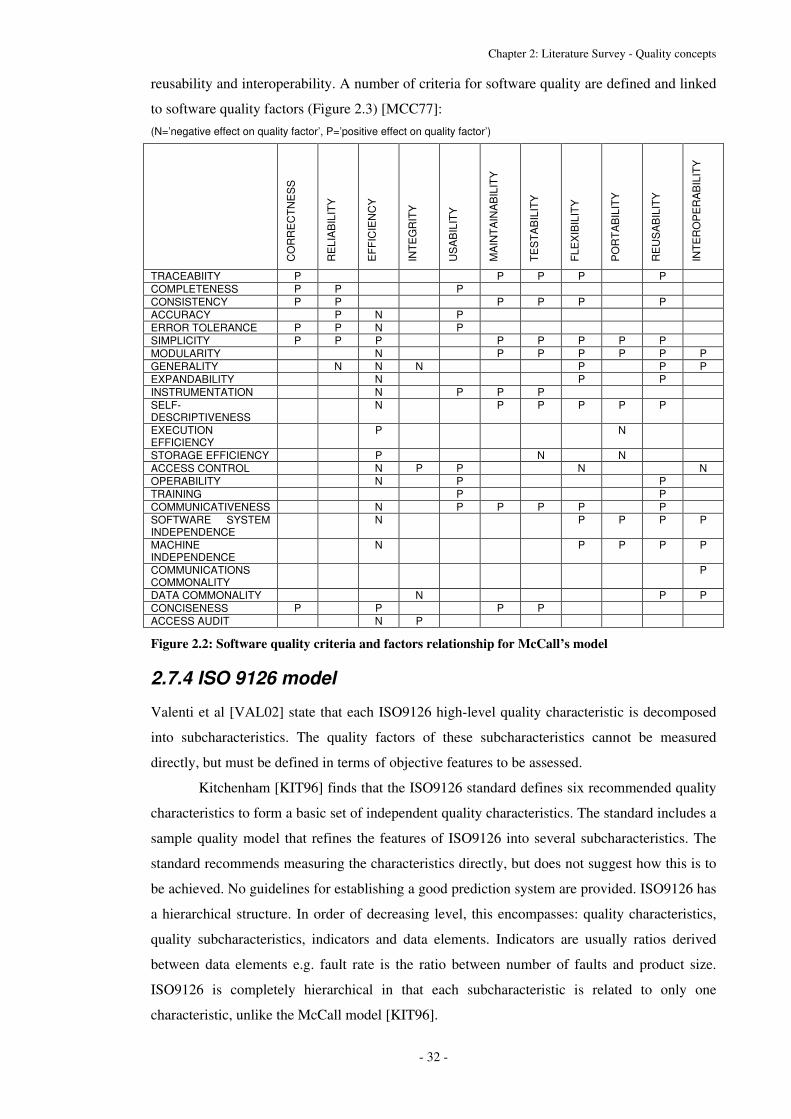
Chapter 2: Literature Survey - Quality concepts
- 32 -
reusability and interoperability. A number of criteria for software quality are defined and linked
to software quality factors (Figure 2.3) [MCC77]: (N=’negative effect on quality factor’, P=’positive effect on quality factor’)
CO
RR
EC
TNE
SS
RE
LIA
BIL
ITY
EFF
ICIE
NC
Y
INTE
GR
ITY
US
AB
ILIT
Y
MA
INTA
INA
BIL
ITY
TES
TAB
ILIT
Y
FLE
XIB
ILIT
Y
PO
RTA
BIL
ITY
RE
US
AB
ILIT
Y
INTE
RO
PE
RA
BIL
ITY
TRACEABIITY P P P P P COMPLETENESS P P P CONSISTENCY P P P P P P ACCURACY P N P ERROR TOLERANCE P P N P SIMPLICITY P P P P P P P P MODULARITY N P P P P P P GENERALITY N N N P P P EXPANDABILITY N P P INSTRUMENTATION N P P P SELF-DESCRIPTIVENESS
N P P P P P
EXECUTION EFFICIENCY
P N
STORAGE EFFICIENCY P N N ACCESS CONTROL N P P N N OPERABILITY N P P TRAINING P P COMMUNICATIVENESS N P P P P P SOFTWARE SYSTEM INDEPENDENCE
N P P P P
MACHINE INDEPENDENCE
N P P P P
COMMUNICATIONS COMMONALITY
P
DATA COMMONALITY N P P CONCISENESS P P P P ACCESS AUDIT N P
Figure 2.2: Software quality criteria and factors relationship for McCall’s model
2.7.4 ISO 9126 model
Valenti et al [VAL02] state that each ISO9126 high-level quality characteristic is decomposed
into subcharacteristics. The quality factors of these subcharacteristics cannot be measured
directly, but must be defined in terms of objective features to be assessed.
Kitchenham [KIT96] finds that the ISO9126 standard defines six recommended quality
characteristics to form a basic set of independent quality characteristics. The standard includes a
sample quality model that refines the features of ISO9126 into several subcharacteristics. The
standard recommends measuring the characteristics directly, but does not suggest how this is to
be achieved. No guidelines for establishing a good prediction system are provided. ISO9126 has
a hierarchical structure. In order of decreasing level, this encompasses: quality characteristics,
quality subcharacteristics, indicators and data elements. Indicators are usually ratios derived
between data elements e.g. fault rate is the ratio between number of faults and product size.
ISO9126 is completely hierarchical in that each subcharacteristic is related to only one
characteristic, unlike the McCall model [KIT96].
Chapter 2: Literature Survey - Quality concepts
- 33 -
ISO9126 [ISO9126] is a software product quality model. Quality characteristics are
defined, which are evaluated using validated or widely accepted metrics. ISO9126 defines six
quality characteristics and describes an evaluation process model.
ISO9126 [ISO9126] describes ‘a two-part model for software product quality: a)
internal and external quality, and b) quality in use’. The first part of the model describes ‘six
characteristics for internal and external quality, further subdivided into subcharacteristics’.
Subcharacteristics are manifested externally when software is used, and are a result of internal
software attributes. The second part of the model describes four quality in use characteristics,
which are the combined effect for the user of the six software product quality characteristics.
The ISO9126 definition document [ISO9126] states that ‘software product quality
should be evaluated using a defined quality model’, which should be used ‘when setting quality
goals for software products’. The view is stated that ‘software product quality should be
hierarchically decomposed into a quality model composed of characteristics and
subcharacteristics which can be used as a checklist of issues related to quality’.
ISO9126 [ISO9126] divides ‘external and internal quality’ of a software product into
six characteristics, further divided into subcharacteristics which can be measured by internal or
external metrics. However, no suitable metrics are defined, required or referenced in this
definition. The six characteristics and subcharacteristics are as follows:
1. Functionality: suitability, accuracy, interoperability, security, functionality compliance
2. Reliability: maturity, fault tolerance, recoverability, reliability compliance
3. Usability: understandability, learnability, operability, attractiveness, usability
compliance
4. Efficiency: time behaviour, resource utilisation, efficiency compliance
5. Maintainability: analysability, changeability, stability, testability, maintainability
compliance
6. Portability: adaptability, installability, co-existence, replaceability, portability
compliance
Four characteristics for quality in use are defined: effectiveness, productivity, safety, and
satisfaction. Dromey [DRO95] states that the ISO9126 standard ‘appears to have drawn
considerably on the model originally proposed by Boehm et al’ ([BOE78]).
2.7.5 Dromey’s model
According to Kitchenham [KIT96], Dromey observes that hierarchical models using a top-down
decomposition are commonly rather vague in their definition of lower levels. Dromey believes
that it is not possible to build high-level quality attributes such as reliability into products.
Dromey’s approach allows verification of the model, and establishes when the model is
incomplete (i.e. a model cannot classify a specific observed software defect).
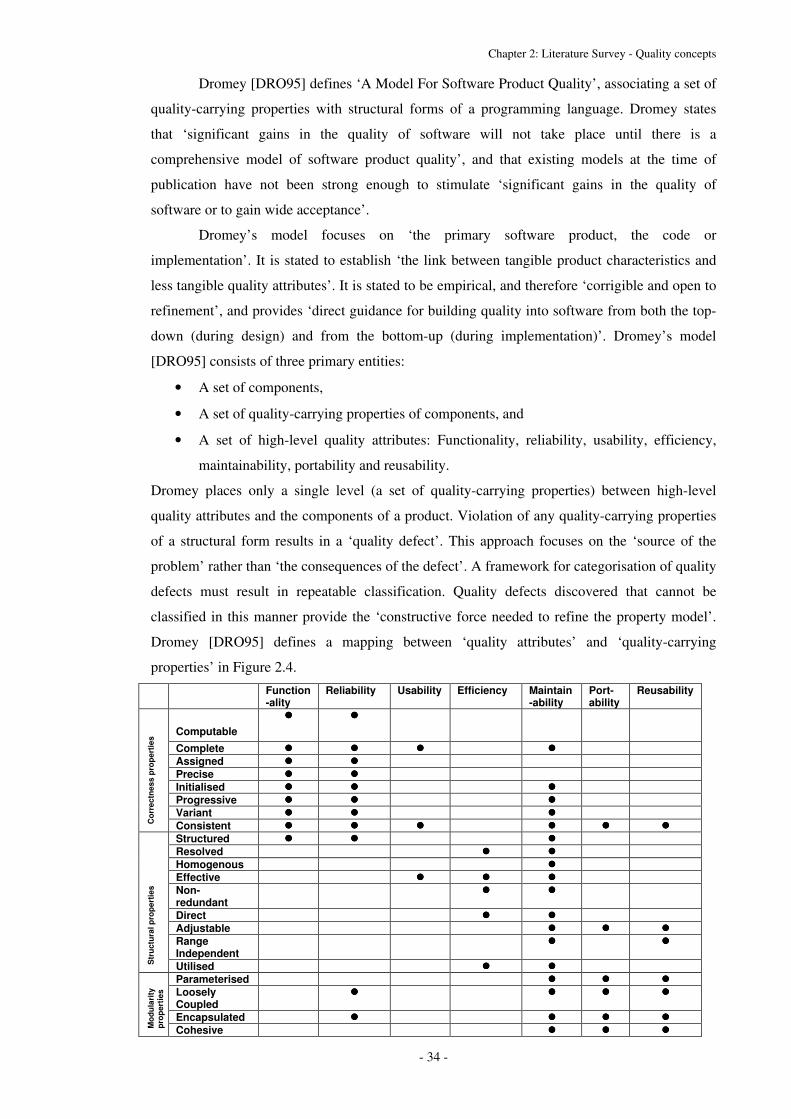
Chapter 2: Literature Survey - Quality concepts
- 34 -
Dromey [DRO95] defines ‘A Model For Software Product Quality’, associating a set of
quality-carrying properties with structural forms of a programming language. Dromey states
that ‘significant gains in the quality of software will not take place until there is a
comprehensive model of software product quality’, and that existing models at the time of
publication have not been strong enough to stimulate ‘significant gains in the quality of
software or to gain wide acceptance’.
Dromey’s model focuses on ‘the primary software product, the code or
implementation’. It is stated to establish ‘the link between tangible product characteristics and
less tangible quality attributes’. It is stated to be empirical, and therefore ‘corrigible and open to
refinement’, and provides ‘direct guidance for building quality into software from both the top-
down (during design) and from the bottom-up (during implementation)’. Dromey’s model
[DRO95] consists of three primary entities:
• A set of components,
• A set of quality-carrying properties of components, and
• A set of high-level quality attributes: Functionality, reliability, usability, efficiency,
maintainability, portability and reusability.
Dromey places only a single level (a set of quality-carrying properties) between high-level
quality attributes and the components of a product. Violation of any quality-carrying properties
of a structural form results in a ‘quality defect’. This approach focuses on the ‘source of the
problem’ rather than ‘the consequences of the defect’. A framework for categorisation of quality
defects must result in repeatable classification. Quality defects discovered that cannot be
classified in this manner provide the ‘constructive force needed to refine the property model’.
Dromey [DRO95] defines a mapping between ‘quality attributes’ and ‘quality-carrying
properties’ in Figure 2.4.
Function-ality
Reliability Usability Efficiency Maintain-ability
Port-ability
Reusability
Computable �������� �������� ���� ���� ���� ���� ����
Complete �������� �������� �������� ���� �������� ���� ����
Assigned �������� �������� ���� ���� ���� ���� ����
Precise �������� �������� ���� ���� ���� ���� ����
Initialised �������� �������� ���� ���� �������� ���� ����
Progressive �������� �������� ���� ���� �������� ���� ����
Variant �������� �������� ���� ���� �������� ���� ����
Cor
rect
ness
pro
pert
ies
Consistent �������� �������� �������� ���� �������� �������� ��������
Structured �������� �������� ���� ���� �������� ���� ����
Resolved ���� ���� ���� �������� �������� ���� ����
Homogenous ���� ���� ���� ���� �������� ���� ����
Effective ���� ���� �������� �������� �������� ���� ����
Non-redundant
���� ���� ���� �������� �������� ���� ����
Direct ���� ���� ���� �������� �������� ���� ����
Adjustable ���� ���� ���� ���� �������� �������� ��������
Range Independent
���� ���� ���� ���� �������� ���� ��������
Str
uctu
ral p
rope
rtie
s
Utilised ���� ���� ���� �������� �������� ���� ����
Parameterised ���� ���� ���� ���� �������� �������� ��������
Loosely Coupled
���� �������� ���� ���� �������� �������� ��������
Encapsulated ���� �������� ���� ���� �������� �������� ��������
Mod
ular
ity
prop
ertie
s
Cohesive ���� ���� ���� ���� �������� �������� ��������

Chapter 2: Literature Survey - Quality concepts
- 35 -
Generic ���� ���� ���� ���� �������� �������� ��������
Abstract ���� ���� ���� ���� �������� ���� ��������
Specified �������� �������� �������� ���� �������� �������� ��������
Documented ���� ���� �������� ���� �������� �������� ��������
Des
crip
tive
prop
ertie
s
Self-descriptive
���� ���� �������� ���� �������� �������� ��������
Figure 2.3: Mapping quality attributes to quality-carrying properties for Dromey’s model
Dromey [DRO95] introduces a theorem: ‘If each of the quality-carrying properties associated
with a particular structural form is satisfied when that particular structural form is used in a
program, then that structural form will contribute no quality defect to the software’’. If any
properties associated with a structural form are violated in a program, then each violation will
contribute a quality defect to the software. Therefore, building quality into software reduces to
systematically ensuring that all the quality-carrying properties associated with each structural
form in a program are satisfied. Detecting quality defects in software reduces to systematically
checking, for each structural form in a program, if any quality-carrying properties that imply
high-level quality attributes are violated.
2.7.6 Boehm’s model
Boehm’s model [BOE78] develops ‘a definitive hierarchy of well-defined, well-differentiated
characteristics of software quality’. It is stated that the high-level structure ‘reflects the actual
uses to which software quality evaluation would be put’, and the low-level characteristics ‘are
closely correlated with actual software metric evaluations which can be performed’. It is further
stated that ‘A large number of software quality evaluation metrics have been defined, classified
and evaluated with respect to their potential benefits, quantifiability, and ease of automation.
Particular software life-cycle activities have been identified which have significant leverage on
software quality’.
Boehm [BOE78] develops a hierarchical tree of increasingly low-level quality
characteristics to define a software product quality model. For each software quality
characteristic, a set of metrics is identified that serve as useful indicators of that characteristic.
Lower-level software quality characteristics also act as indicators for higher-level
characteristics. Therefore, the indicators at the lowest level relate only to a given characteristic.
Boehm [BOE78] states characteristics of a ‘good’ quality software product quality metric
include ‘correlation with software quality’, ‘potential benefit of applying metrics’,
‘quantifiability’, and ‘feasibility and completeness of automated evaluations’. Boehm et al
evaluate a set of candidate metrics using these criteria, and defined scales of measurement. The
hierarchy of software quality characteristics is defined in Figure 2.6 [BOE78].

Chapter 2: Literature Survey - Quality concepts
- 36 -
DEVICE-INDEPENDENCE
COMPLETENESS
ACCURACY
ACCESSIBILITY
CONSISTENCY
CONCISENESS
STRUCTUREDNESS
SELF-DESCRIPTIVENESS
COMMUNICATIVENESS
DEVICE EFFICIENCY
LEGIBILITY
AUGMENTABILITY
MODIFIABILITY
UNDERSTANDABILITY
TESTABILITY
HUMAN ENGINEERING
EFFICIENCY
GENERAL
UTILITY
AS-IS
UTILITY
MAINTAIN-
ABILITY
Figure 2.5: Software quality characteristics tree for Boehm’s model
RELIABILITY
PORTABILITY
Chapter 2: Literature Survey - Quality concepts
- 37 -
2.7.7 Software product quality models findings
Although it was found that these models typically offered a comprehensive examination of the
topic of software product quality, there was often a lack of detail on how a low-level
implementation of the model would be performed in practice. This was particularly true of the
international standard ISO 9126, which offered little advice on this matter.
2.8 Chapter 2: Summary
A survey was made of the literature to assess the current state of the art in issues relating to
quality, quality management, software quality assurance and the measurement of software
products and processes. The issue of quality was firstly considered in the generic sense, as
applicable generally across any number of industrial sectors. Definitions of quality were
obtained, with descriptions of typical quality issues. The managerial viewpoint of quality was
considered, alongside a number of techniques and strategies for the management of quality.
The issue of quality was then considered within the context of Software Engineering
and more specifically Software Quality Assurance. This involves the application of generic
quality issues in a manner relevant to typical software engineering practices, and the
expectations of customers of software products. Methods of assessing and measuring the quality
status of software products and software processes were considered, along with potential uses to
which these assessment results may be put. Strategies and supporting tools were considered.
The concept of the quality model was introduced where a number of quality issues are
combined into a single coherent entity. Frameworks of evaluation were considered.
In the third section, software product quality was considered. A number of product
quality attributes were identified, for both internal quality (attributes believed to be indicative of
intrinsic quality) and external quality (attributes relating to the capability of the product to
perform correctly in its environment). Methods of measuring quality attributes of software
products were considered, with identification of metric measures found to be useful or
influential. Metrics must undergo validation to ensure validity and usefulness.
The fourth section focused on software process quality. A number of types of software
process were considered, and a number of software process quality attributes were identified.
These attributes relate both to the ability of the process to produce high-quality products and to
the ability of the process to meet other goals and targets, for example budget and schedule
considerations. Mechanisms for the measurement of software processes were examined, along
with uses to which the results of model application could be put. These include the estimation
and tracking of trends in the performance of the process in quality issues, setting of targets, and
in performing process improvement activities. The fifth section of the literature survey
considered specific quality models of relevance to Software Engineering. Quality models for

Chapter 2: Literature Survey - Quality concepts
- 38 -
software products were considered here. Quality models for software processes, on which the
remainder of this thesis are based, are considered in detail in Chapter 3.
Chapter 3: Literature Survey - Process quality models
- 38 -
Chapter 3: Literature Survey - Process quality models
3.1 Software process quality models overview
A survey was made of the literature to identify those software process models that were suitable
for further investigative evaluation and possible utilisation in a case study. Therefore, it is of
key importance that the candidate models be complete, fully documented, and freely available
otherwise it would not be possible to implement them in practice. Other factors considered were
the extent to which the model had influenced the field of software quality, how widely
referenced the model was, whether the model introduced innovative ideas and concepts, how
widely the model is used in industry, and possible status as an international standard. The
availability of supporting resources was also taken into consideration when selecting the models
and the versions of models.
The remainder of this thesis focuses on the development of techniques of comparative
evaluation for software process quality models, and their application to the set of models
considered in this chapter. It is important that information is obtained relating to the focus,
background, structure, content and previous usage for each of ‘SPICE’, ‘ISO 9001’ and ‘CMM’
and therefore each model is considered in isolation.
3.2 SPICE model
SPICE is an initiative to develop an international standard for Software Process Assessment.
There are three principal goals:
1. Working draft for a standard for software process assessment (SPA),
2. Conduct industry trials, and
3. Promote technology transfer into industry.
SPA usage is increasing due to evidence of success in improvements in quality and productivity.
SPICE is designed with the needs of the general software industry, and is a multinational project
as befits attempts to create an international standard. When complete, the designated name will
be ‘ISO/IEC15504’ rather than ‘SPICE’. However, it is not yet an international standard, and a
finalised version has not yet been published. The latest published version is ‘Working Draft
v1.00’ [SPI02a].
It is recognised that process assessment can be a strong and effective driver for process
improvement. Empirical evidence exists that demonstrates the benefits that can be derived from
an assessment-based improvement programme. However, a number of incompatible assessment
approaches exist, hence the need for an international standard for Software Process
Improvement. Expected benefits for the software industry include:
• Software suppliers use only one SPA scheme, rather than the numerous ones currently
in use.

Chapter 3: Literature Survey - Process quality models
- 39 -
• Organisations will have a tool to initiate and sustain continuous process improvement.
• Programme managers can determine that their software development can support the
business needs of the organisation.
Benefits for purchasers of software are expected as they will be able to determine the capability
of software suppliers and determine the risk involved in selecting one supplier over another
[SPI02a].
SPICE [SPI02a] does not utilise a discrete pass/fail mechanism, but provides a scale of
capability measurement. It is oriented towards smaller processes rather than single large
monolithic processes. Individual processes (e.g. ‘system design’) receive ratings, determined on
a six-point scale, as follows:
0. Initial – not performed,
1. Performed – performed informally,
2. Managed – planned-and-tracked,
3. Defined – well-defined,
4. Measured – quantitatively controlled, and
5. Optimising – continuously improving.
It is stated that ‘during an assessment, generic practices, grouped according to common feature
and capability level, are used to determine the capability of a process’. SPICE defines the
capability of process maturity levels in terms of ‘generic practice common features’. To achieve
a given process maturity level, the generic practices pertinent to this level and all lower levels
must be implemented in full [SPI95].
SPICE documentation [SPI02a] contains nine components. These describe the totality
of the software processes assessment process, guiding the assessor through the planning and
implementation of an assessment then analysing the results. Results are used for the purposes of
‘process improvement’ and ‘determination of an organisation’s process capability’.
Consideration is also given to the issue of training, experience and qualifications required of
assessors. A vocabulary of terminology used is provided which is valuable for avoiding
confusion due to differing interpretations, especially when comparing two processes or for a
customer comparing two or more prospective suppliers.
It is stated [SPI02b] that ‘The overall goals of the standard are to encourage
organizations interested in improving product quality to employ proven, consistent and reliable
methods for assessing the state of their processes and to use their assessment results as part of
coherent improvement programs’. It is recognised that other standards and models already exist
to consider these issues, so a migration path is provided for ‘existing methods and models
wishing to become 15504-compliant’. This suggests that the migration path is for the actual
models rather than the organisations using them, which may cause difficulties if the creators of
the other standards do not wish to transition to 15504-compliance. In particular, organisations
using alternative models may experience difficulties if their practices become obsolete when

Chapter 3: Literature Survey - Process quality models
- 40 -
models change to become 15504-compliant, or if the models they use become obsolete if they
do not become 15504-compliant.
‘The scope of the proposed ISO/IEC15504 standard is process assessment, process
improvement and capability determination. Software process domains to be assessed are
acquisition, supply development, operation, maintenance, supporting processes and service
support.’ [SPI02b].
Paulk et al [PAU96] state that ‘the SPICE project began with a set of requirements,
initially drafted in the process management study report and refined in subsequent meetings’
and that ‘based on these requirements, a number of products have been identified for the
international standard’. [PAU96] provides an edited version of the requirements list. It is also
required that SPICE ‘be supportive of, and consistent with, the ISO9001 series of standards’.
This indicates the SPICE model was created by a process of initially defining requirements of a
quality model, and then producing an implementation of these requirements. This allows
organisations to examine the requirements and compare to their own requirements of a process
quality model, and therefore determine to what extent SPICE satisfies their needs. It is also
possible to test if SPICE meets its stated requirements and therefore verify the conformance of
SPICE to these requirements. SPICE includes a ‘baseline practices guide’ describing the
fundamental activities required for good software engineering, divided into five sections
[SPI95]: ‘CUS: Customer – Supplier’, ‘ENG: Engineering’, ‘PRO: Project’, ‘SUP: Support’ and
‘ORG: Organisation’.
It is stated [SPI95] that the purpose of SPICE is to provide ‘a framework for the assessment of
software processes’, and that this framework can be used for ‘planning, managing, monitoring,
controlling and improving the acquisition, supply, development, operation, evolution and
support of software’. It is stated that SPICE is intended to assess a single process instance,
which is ‘a singular instantiation of a process that is uniquely identifiable and about which
information can be gathered in a manner that provides repeatable ratings’. It is also stated that
‘the sophistication and complexity required of a process is dependent on its context’.
The SPICE documentation consists of a number of sections. In addition to defining the
model, issues considered include guidance on performing process assessments, work products
that satisfy process requirements, qualification and training of assessors, process improvement
guidelines, and use of SPICE to determine supplier process capability [SPI95].
3.3 ISO9001 model
The ISO 9001 definition document [ISO9001] defines a ‘model for quality assurance in design,
development, production, installation and servicing’. The scope is defined as specifying ‘quality
system requirements for use when a supplier’s capability to design and supply conforming
product needs to be demonstrated’. It is intended that the quality system requirements may be
applicable for ‘the purpose of a supplier demonstrating its capability, and for the assessment of

Chapter 3: Literature Survey - Process quality models
- 41 -
the capability of a supplier by external parties’. The 1994 edition of the ISO9000 family of
standards identifies ISO9001:1994 [ISO9001], and the subsets ISO9002 and ISO9003 which are
to be used by organisations who do not perform the entire range of activities considered in
ISO9001. In the 2000 edition [ISO9001b] there is only one standard, ISO9001:2000, covering
the considerations of ISO9001:1994, ISO9002:1994 and ISO9003:1994.
The ISO 9001 document [ISO9001] states that the quality system requirements defined
in the standard ‘are complementary (not alternative) to the technical (product) specified
requirements’, thereby separating the quality considerations of the process and the product.
ISO9001 does not seek to ‘enforce conformity of quality systems’ and is ‘generic and
independent of any specific industry or economic sector’. However, a separate document
[ISO9000-3] defines how ISO9001 is to be used in the software sector. It is intended that
ISO9001 requirements ‘will be adopted in their present form, but on occasions they may need to
be tailored by adding or deleting certain quality requirements for specific contractual situations’.
A separate document, ISO9000-1, defines how tailoring of the ISO9001 standard is to be
performed. ISO9001 is defined in terms of the content clauses [ISO9001], of which the most
relevant to process measurement are 4.1-4.20 under the heading of ‘4. Quality system
requirements’.
The ISO organisation [ISO02] state that ‘ISO9001:2001 specifies requirements for a
quality management system for any organization that needs to demonstrate its ability to
consistently provide product that meets customer and applicable regulatory requirements and
aims to enhance customer satisfaction’ It is used to establish a management system that
provides conformance of a product to established or specified requirements, by considering the
process of production. It is linked with other ISO standards, so an organisation may seamlessly
implement ISO9001 with other standards and systems already in place (e.g. ISO10013 standard
for quality documentation). It is possible for an organisation to engage an external auditor to
gain certification of compliance to ISO9001.
ISO9001 is intended to assist the continual assessment and refining of the quality
management system in order to fulfil quality policy and quality objectives. Widespread use in
industry ensures that ISO9001 compliance can be recognised by potential customers. Customers
can refer to the ISO9001 definition and gain some understanding of the quality management
process in place. ISO9001 is not in itself specific to the IT sector, although it may be applied in
this context, and so does not use software process-specific terminology. This gains easier
understanding by non-software organisations at the expense of not being fine-tuned to software
development processes. ISO9001 relies on the principle that a high-quality development process
will necessarily result in a high-quality product; ‘a desired result is achieved more efficiently
when activities and related resources are managed as a process’. If this process is difficult to
change or is poorly understood, ISO9001 may be difficult to implement [ISO02].

Chapter 3: Literature Survey - Process quality models
- 42 -
Eight quality management principles are listed [ISO02b]. These are intended to be used
by senior management as a framework to guide organisations towards improved performance.
The set of principles is defined as: ‘customer focus’, ‘leadership’, ‘involvement of people’,
‘process approach’, ‘system approach to management’, ‘continual improvement’, ‘factual
approach to decision making’ and ‘mutually beneficial supplier relations’. The BSI organisation
[BSI03] state that there is ‘no simple answer’ as to how much it costs to register compliance
with ISO9001. Several factors are involved, such as the usage of external consultants, registrar
charges and length of time to develop the quality system. Cost must therefore be evaluated on a
case-by-case basis. There is no official central database of ISO9001-registered organisations,
but an ISO survey (31st Dec 2001) identified 510,616 registered organisations across 161
countries.
The ISO 9000-3 definition document [ISO9000-3] provides ‘guidelines for the
application of ISO9001 to the development, supply and maintenance of software’, to ‘facilitate
the application of ISO9001 to organisations developing, supplying and maintaining software’.
Although Crosby [CRO97] believes that there are no special case industry sectors for which
generic quality mechanisms cannot be used, [ISO9000-3] states that ‘the process of
development and maintenance of software is different from that of most other types of industrial
products’ and that it requires ‘additional guidance for quality systems’. ISO9000-3 ‘deals
primarily with situations where specific software is developed as part of a contract according to
purchaser’s specifications’, and sets out how ISO9001 may be applied in this context ‘by
preventing non-conformity at all stages from development through to maintenance’. However,
the ISO9000-3 structure does not correspond directly to the ISO9001 structure, and so a number
of cross-reference indexes must be used.
Rothery [ROT92] observes that the definitions provided in the ISO 9000 series of
standards in the 1994 editions tend to be somewhat vague and therefore open to subjective
interpretation. Rothery states that ‘The contents of ISO 9000 are rather woolly’. The ISO 9004
document identifies the recommended basic elements of the system and quality policy,
including: policy and objectives, organisation and responsibility, marketing and product brief,
design, procurement, production, equipment control, documentation, and verification.
The ISO 9000 and ISO 9004 documents are used by an organisation to select which, if
any, of ISO 9001, ISO 9002 and ISO 9003 is applicable [ROT92]. (ISO 9001:2000 [ISO9001b]
avoids this source of potential confusion by combining all three into a single standard
document). Rothery identifies ISO 9001 as being ‘the “top” standard, although ISO probably
would not like such a qualitative judgement’. ISO 9002 is identified as being ‘the more common
standard for manufacturers’. Rothery is somewhat dismissive of ISO 9003, stating ‘the first side
is preamble, the second not much more’.
Paulk et al [PAU96] state that ‘ISO9001 is somewhat ambiguous about the role of
measurement in the quality system’, and that ‘it only requires that quality objectives can be

Chapter 3: Literature Survey - Process quality models
- 43 -
defined and documented, not that they be quantitative’. ISO 9001 is ‘the standard that is
pertinent to software development and maintenance’, of those standards in the ISO9000 family.
Hatton [HAT94] states that ‘At first glance, [ISO9001] is thin and difficult to interpret
in terms of software engineering, and in the late 1980s such interpretations could (and did) vary
widely.’ A number of weaknesses are identified:
• Some organisations see it as a ‘badge to get the sole purpose of bidding rather than a
permanent commitment to quality improvement’.
• It is not incremental. A company is certified or not.
• It merely codifies a process; it is perfectly possible to formalise an ineffective and
inefficient process and achieve compliance.
Hatton states that ‘The whole process [of ISO9001 certification] is expected to take 12-18
months to complete, although some have done it quicker.’
3.4 Capability Maturity Model (CMM)
According to Pressman [PRE97], the Capability Maturity Model defines key activities required
at different levels of process maturity. The SEI approach (based on the CMM) establishes five
increasingly desirable process maturity levels.
1. Initial: ad hoc, chaotic. Few processes defined, success dependent on individual effort.
2. Repeatable: basic project management processes established to track cost, schedule and
functionality. The necessary process discipline is in place to repeat earlier successes on
projects with similar applications.
3. Defined: software process for both management and engineering activities is
documented, standardised and integrated into an organisation-wide software process.
All projects use a documented and approved version of the organisation’s process for
developing and maintaining software. All characteristics defined for Level 2 are
included.
4. Managed: detailed measures of the software process and product quality are collected.
Both the software process and products are quantitatively understood and controlled
using detailed measures. All characteristics defined for Level 3 are included.
5. Optimising: Continuous process improvement is enabled by using quantitative
feedback from the process and from testing innovative ideas and technologies. All
characteristics defined for Level 4 are included.
At each maturity level, the SEI has defined a number of associated ‘Key Process Areas’
(KPAs). Each KPA is defined through the identification of characteristics of types: goals,
commitments, abilities, activities, methods for monitoring implementation and methods for
verifying implementation. The CMM concentrates entirely on the software process, not the
software product. This approach relies on an assumption that a high-quality process is likely to
result in a high-quality product. The CMM is intended to provide a basis for process

Chapter 3: Literature Survey - Process quality models
- 44 -
improvement, and to provide a structure for an organisation’s future planning in this area
[PRE97].
Pressman [PRE97] states that an organisation can be assessed to determine which level
of the CMM it is at. The higher the level of the CMM reached, the higher the quality of the
organisation’s underlying process. Therefore, the level of the organisation may reflect the level
of effort required by the organisation to produce ‘quality’ products. This may indicate that a
product of acceptable quality is more likely to be produced by an organisation at higher levels of
the CMM. In addition, an organisation at higher levels of the CMM is more likely to be able to
measure quality of products, be aware of quality issues and provide a consistent level of quality
across products and between versions after maintenance work.
Measurement takes place at all levels of CMM [CMU93]. However, different
measurements are performed at different levels. Higher levels of CMM introduce increasingly
sophisticated measurements, as shown in Table 3.1:
���������� �������� ���������� �������
���������� ���� ���������
������������� ��������������������������
����������� �������������
����������� �������������������� ����!������
"��#���$������ �$���%�$������������&�������������
Table 3.1: Measurements performed at levels of the Capability Maturity Model
Assessment of an organisation is performed by an external auditor. The auditor examines the
processes employed by an organisation against defined levels of CMM. An organisation has
either achieved a level or it has not; there is no mechanism to measure progress towards
achievement of a level. Without an external audit, an organisation may not claim to be at any
level of CMM, although there is no reason why an organisation could not ‘unofficially’
implement some or all of the CMM. CMM focuses on continual process improvement
[CMU93].
CMM is under current development [CMU93]. CMM was developed with consideration
of working practices and needs of US defence contractors. CMM v2 is expected to expand
descriptions of Level 4 and Level 5, and to have restructured process areas to span maturity
levels. The SEI acknowledges that the CMM does not address all the issues that need to be
faced for software process and quality improvement. Issues addressed indirectly or only by
implication in CMM v1 include ‘specific tools, methods and methodologies’, ‘concurrent
engineering and teamwork’, ‘system engineering and marketing’, ‘human resources’ and
‘change management’.
According to Hatton [HAT00], Puttnam reported in 1992 a significant correlation
between attributes such as shorter term, lower cost and less staff and an increasing CMM level.
Hatton reported that there was ‘no obvious relationship between the statically detectable
residual fault rate in a wide population of C and Fortran programs and whether or not the
software was produced by following a formal process model’.

Chapter 3: Literature Survey - Process quality models
- 45 -
Paulk et al [PAU93] state that CMM is based on the process management work of
quality gurus such as Deming, Juran and Crosby. ‘[CMM] can be applied by organisations to
improve their software process via software process assessments and by acquisition agencies to
select qualified software vendors via contractor evaluations’.
Paulk et al [CMM93] state that ‘The CMM is the foundation for systematically building
a set of tools, including a maturity questionnaire, which are useful in software process
improvement.’ It is based on ‘knowledge acquired from software process assessments and
extensive feedback from both industry and government.’ A number of intended uses are
defined, including ‘by organisations wanting to understand and improve their capability to
develop software effectively’, ‘by acquisition organisations or prime contractors wanting to
know the risks of having a particular software organisation perform the work of a contract’ and
‘by instructors preparing teams to perform software process assessments or software capability
evaluations’.
Paulk et al [CMM93] define that a process maturity framework is necessary, as ‘in the
absence of an organisation-wide software process, repeating results depends entirely on having
the same individuals available’ which ‘provides no basis for long term productivity and quality
improvement’. It is further stated that ‘continuous improvement can occur only through
focussed and sustained effort towards building a process infrastructure of effective software
engineering and management practices’.
The maturity framework upon which the quality principles of the CMM is built was
inspired by the work of Crosby in ‘Quality is free’ [CRO79], although the work of Shewart,
Deming and Juran was also influential. The CMM is stated to provide software organisations
with ‘guidance on how to gain control of their processes for developing and maintaining
software and how to evolve toward a culture of software engineering and management
excellence’ [CMM93].
Masters and Bothwell [MAS95] define a ‘CMM Appraisal Framework’. The ‘CAF’ is a
‘framework for developing, defining and using appraisal methods based on [the CMM]’. It
provides ‘a framework for rating the process maturity of an organisation against a generally
accepted reference model through the use of an appraisal method’. In measuring the software
process and associated activities employed by a software organisation against the content of the
CMM, a set of assessment methods is defined and applied by the organisation. These
assessment methods can be appraised through application of CAF, which defines a framework
of methods for their appraisal. The CAF states issues pertinent to the methods of performing the
appraisal, the required skill and experience levels of assessors, and methods for the analysis and
presentation of results.
Masters and Bothwell [MAS95] state a number of rules defining how conformance to
various elements of CMM is established. A goal is covered if sufficient findings exist to judge
the extent of implementation and institutionalisation relative to the CMM, the appraised entity,

Chapter 3: Literature Survey - Process quality models
- 46 -
and the appraised entity’s life cycle(s) (including the existence of acceptable alternatives). A
Key Process Area is covered if all of its goals are covered. A maturity level is covered if all of
its Key Process Areas and all those of lower level KPAs are covered.
Paulk et al [PAU96] state that ‘The CMM covers practices for planning, engineering,
and managing software development and maintenance. When followed, these practices improve
the ability of organisations to meet goals for cost, schedule, functionality and product quality’. It
is stated that the CMM is ‘a framework that describes key elements of an effective software
process’. The limitations of CMM are recognised, and it is noted that ‘the CMM is not a silver
bullet’. ‘Basing improvement efforts on a model is not without its risks’. However, [PAU96]
states that the CMM represents a ‘broad consensus of the software community and is a useful
tool for guiding software process improvement efforts’.
Paulk et al [PAU96] state that the CMM is ‘based on actual practices’, and reflects both
‘the best state of the practice’ and ‘the needs of individuals performing software process
improvement and software process appraisals’. It is also noted that the standard is documented
and is publicly available. Information used to construct the model was obtained by studying
non-software organisation, performing software process assessments and software capability
evaluations, analysing change requests to the model, participation in meetings and workshops
with industry and government representatives, and soliciting feedback from industry and
government reviewers.
It is stated that for a software process to be considered ‘mature’, then it must be: defined,
documented, trained, practiced, supported, maintained, controlled, verified, validated, measured,
and able to improve. Paulk et al [PAU96] state that process maturity can be judged in
comparison to a model such as the CMM, whereas process effectiveness can be determined only
with regard to the organisation’s business objectives. Some intangible benefits of CMM usage
are stated to include ‘increased customer satisfaction’, ‘competitive advantage’, ‘improved
employee morale’, ‘improved quality of work life’, ‘fewer overtime hours’, ‘more stable work
environment’, ‘lower turnover of staff’, ‘improved communication’ and ‘improved quality as
reported by customers’.
According to Hatton, [HAT94] CMM is ‘in essence the embodiment of Deming’s
principles into a software context’. Hatton states that an ‘intuitively attractive’ feature of CMM
is its incremental nature which is ‘in stark contrast with ISO 9001, which an organisation
satisfies or not, and after which there is no real guidance as to what the next quality steps should
be. In the CMM, there is a clear set of objectives with well-defined problem areas to be solved
at each stage.’
Hatton [HAT94] notes a tendency for the CMM definition document to increase in size
as successive versions are developed and published. ‘In common with seemingly everything to
do with software, the latest incarnation is some 10 times bigger than the original, perhaps
obscuring the real object of process improvement, which is to make the software better.’ An
Chapter 3: Literature Survey - Process quality models
- 47 -
increase in size with each successive version implies an associated increase with cost of
implementation and required resource allocation. An organisation committing to CMM would
also commit to these increases.
3.5 Chapter 3: Summary
A survey of the available literature was performed to identify a small number of candidate
software quality models for further investigation and appraisal, with the eventual goal of
selecting a subset to use in case studies. It was found that there were a relatively small number
of models in common usage that were complete and freely available and therefore suitable for
use in case studies. It was found that a small number of models fitted these requirements and
were therefore referenced widely in a large number of books, journals, papers and other
information sources. There was at least one suitable model that held international standard
status. These models were therefore widely referenced, and would provide a sound reference
point against which to compare other models as they represent the closest existing viewpoint to
an industry-wide consensus. It was found that the content varied significantly between models,
providing a valid, useful and interesting basis for comparison.
Chapter 4: A theoretical evaluation method for process models
- 48 -
Chapter 4: A theoretical evaluation method for process
models
4.1 Evaluation approach
4.1.1 Validation through theoretical and empirical evaluation Shepperd and Ince [SHE93] identify that the validation of a model requires both:
• Theoretical evaluation
Logical and theoretical analysis of the model is performed to establish if the model is
based on sound theory, to establish if measurement practices and expectations are
derived from a theoretical basis, rather than observation of a coincidental trend in a
given case study.
• Empirical evaluation
The model is applied in practice, either in a production environment or through the use
of case studies. This establishes whether the theory outlined in the definition of the
model correlates with ‘real world’ observations, and whether it can be successfully
translated into a practical and meaningful implementation.
It can therefore be seen that the validation of a model will require the implementation of two
main strands of evaluation, one pertaining to theoretical evaluation and the other pertaining to
empirical evaluation. A validation process that formally considers neither of these elements is
unlikely to yield useful and reliable results, as it is unlikely to address the factors germane to the
selection procedure. A validation process that considers only one of these elements is more
likely to draw useful conclusions as at least some relevant factors are placed under
consideration. However, a validation procedure of this type cannot be guaranteed to have
addressed the totality of issues relating to the suitability of a model for a particular usage
context. If only theoretical evaluation is performed, it cannot be proved that the ideas contained
in the model have any correlation with reality, even if they are theoretically sound and internally
self-consistent. If only empirical evaluation is performed, it is not possible to show that the
model is suitable or relevant in any other context than the case studies on which the empirical
evaluation was performed. It would not be possible to identify if the results obtained through
evaluation were a genuine reflection of the observed process, or simply the result of chance.
Therefore, the approach to be utilised will consider elements of both theoretical and empirical
evaluation strategies, allowing the most effective leveraging of the benefits offered by each
approach.
A validation process that considers both theoretical and empirical evaluation mitigates
these problems, provided that the theoretical and empirical evaluation strategies are
Chapter 4: A theoretical evaluation method for process models
- 49 -
complementary yet independent. A successful validation strategy will consider theoretical and
empirical evaluation in a manner that is independent and yet integrated. Through independence,
the results derived from the two evaluation paths will not be subject to confounding and so can
be utilised in isolation without reference to other elements. It is desirable to perform these two
types of analysis with as high a level of independence as is possible. If the analytical types do
not remain separate, then a reduced level of confidence may be obtained through their
application. If the findings of one analytical approach are in agreement with the findings of the
other, it is important to know whether this is due to similarities in the level of provision in the
model or to shared content in the assessment process. However, if an integrated approach is
used it is possible to combine the results from both evaluation paths to consider coherently the
totality of the validation strategy required for a process quality model.
4.1.2 Determining success of evaluation approach
In order to objectively evaluate the extent to which the analytical procedures as applied to the
process quality models and case studies are successful, it is necessary to define what is meant by
‘success’ in these contexts. The most effective way this can be performed is to define a set of
‘criteria for success’, each member of which defines a property or observation that would be
made of an evaluation process that would be considered to be successful.
Throughout the process of implementing the evaluation procedure, observations are
made. Upon termination of the evaluation procedure, these observations are utilised to
determine which of the criteria for success have been successfully achieved in practice.
It is considered that any evaluation procedure which can satisfy all criteria for success is
to be considered successful. Any evaluation procedure which fails to satisfy one or more criteria
cannot be considered to be fully successful, and so the results obtained through its application
must be carefully considered to establish the extent to which their validity may be
compromised. The proportion of criteria for success that are successfully achieved is a measure
of the extent to which the evaluation procedure can be considered successful. This provides an
understanding of the quality of the procedure, and a measure of the faith that may be placed in
the verity of the evaluation results, where a greater proportion of the satisfied requirements are
associated with more desirable results.
4.1.3 Assessor
The assessment procedures were designed and implemented by the author of this thesis. It
would have been useful to have the procedure applied at least once in practice by an
independent individual, as this would allow assessment of the learnability and ease-of-use of the
defined evaluation procedure. However, this would potentially compromise the accuracy of the
results, if the evaluator was attempting to perform the procedure for the first time at the same
time as learning it. If the procedure is implemented by its designer, it is not possible to
Chapter 4: A theoretical evaluation method for process models
- 50 -
investigate objectively the learnability and usability attributes, but as the designer knows the
procedure in depth there does not exist the possibility that results integrity is compromised
through misunderstanding of the procedure.
Ideally, each evaluation procedure would be performed by more than one assessor, and
the results compared to identify areas in which the assessors were in disagreement. As well as
potentially improving the quality of assessed results, as mistakes made by one assessor may be
in conflict with correct results produced by another assessor and so leading to the opportunity
for detection and correction of defects, this would also allow the quality of the evaluation
procedure and model requirements set to be examined. Any areas in which two or more
assessors are in disagreement are potentially areas that are open to more than one interpretation
or possess some other form of ambiguity, or are difficult to apply consistently in practice. These
areas would therefore be examined and potentially amended or removed if the evaluation
procedures were to be repeated. However, in practice it was not feasible to use more than one
assessor.
4.2 Theoretical evaluation of models
4.2.1 Theoretical evaluation concepts
Theoretical evaluation of a process quality model consists of an analytical procedure that takes
the definition of the model as an input, resulting in an assessment of some notion of quality of
the input model as an output product. The definition of the process quality model is the main
input to the assessment process. Although other backing resources may be utilised as evaluation
inputs in order to assist in the performance of the evaluation, those resources that do not directly
alter or augment the definition of the fundamental underlying model do not affect the results
obtained through assessment.
Theoretical evaluation requires the evaluator to define a notion of quality, as may or
may not be observed in the process quality models under consideration. The evaluation consists
of a process through which the models are measured against this notion of quality. The process
of measurement is required to link aspects of the understanding of quality with observable
factors in the definition of the model, without reference to ‘real world’ or case study application
of the process quality model to a process.
Theoretical evaluation of a process quality model consists of establishing some measure
of the quality of the model through the application of a procedure to analyse theoretically the
content of the model. An alternative understanding is to perform a methodical evaluation of the
theoretical content of the model. In practice, these are closely related and so performing the
theoretical evaluation of a process quality model implies consideration of both.

Chapter 4: A theoretical evaluation method for process models
- 51 -
4.2.1.1 Purpose of theoretical evaluation
The primary purpose of theoretical evaluation is to ensure that the underlying theory upon
which the model is based is fundamentally sound. It is necessary to ensure that, where the case
study application of a quality model produces a result in quality assessment of a process which
is thought to be a reasonable representation of the real situation, the observed result is achieved
in a theoretically sound manner and is not simply the result of coincidence or ‘lucky chance’. A
process quality model would ideally have a sound theoretical basis, where a rational argument
can be formed to link values of the measured quality attributes with elements of a well-defined
notion of quality.
An implicit assumption is that the establishment of the theoretical basis for the model
precedes the design of a quality model to embody these concepts. The alternate approach is to
establish a model using an approach based on observations of processes, and then work
backwards in an attempt to uncover the underlying theory which leads to the model producing
results which appear to match the observations. However, this approach is more risky as
although the use of case study results provides source data with which to work, this approach
risks assigning an inaccurate or incomplete theoretical link between measurable quality
elements and observed level of quality.
Theoretical evaluation is intended to examine the model in terms of its definition
without the influence of practical considerations of application of the evaluation procedure on
the evaluation results. Independence of the results of assessment from the process through
which they are obtained prevents confounding of the factors of the underlying model and the
factors of the procedure of application of the model to a process.
4.2.1.2 Approaches to theoretical evaluation
The process of measurement of quality may take a number of forms, depending on the manner
in which the model is constructed. Although a number of approaches may be considered to be
fundamentally valid, it is necessary to select an approach relevant to both the content type of the
model and to the type of result that the user of the results of assessment requires. For example,
should the model under assessment include a mathematical relationship between an observable
feature of a process and an element of quality theory, theoretical assessment could be applied to
determine the extent to which this linkage is valid and correct.
This approach may be considered to provide the strongest level of assurance of quality
as it considers the fundamental theoretical content of the model, rather than the implementation
of these theoretical factors in the model definition as presented to the user. However, this
approach is not well suited to producing results comparable across a number of assessed
models. The low-level implementation detail of the assessment procedure for a model would be
dependent on the model content, and the level of detail at which the model content was defined.
Application of non-identical assessment procedures across a range of models would produce
Chapter 4: A theoretical evaluation method for process models
- 52 -
result sets that were not directly comparable. In particular, result sets derived from a model
defined in terms of low-level elements could not be meaningfully compared directly to result
sets derived from a model defined in terms of only high-level elements.
The main disadvantage of this approach is that it requires access to details of how
elements of the model relate to an understanding of quality. Definitions of this information are
typically not published as part of the model definition document for process quality models, and
if this information is published elsewhere, it is typically incomplete or defined in insufficient
detail to perform analysis.
The selected evaluation approach is based on a different concept, as the software
process quality models selected for evaluation do not in all cases define (either mathematically
or otherwise) the theoretical foundation on which their content is based. A set of requirements is
defined which embody the concepts expected to be inherent in the definition of an ‘ideal’
process quality model. A model is then examined against this requirements set to determine the
level of compliance observed. If the conjectural ‘ideal’ process quality model is theoretically
sound, and the set of requirements is representative of the content of the ‘ideal’ model, then the
extent of conformance of the assessed model to this set of requirements provides some measure
of the quality of the model. For this level of conformance to be an accurate measure of model
quality, it is necessary for the set of requirements to be complete and an accurate representation
of the defined notion of quality. However, even if the set of requirements if not complete, it will
still provide a useful indication of quality, and provide a theoretically valid basis for comparison
between a number of process quality models. Provided that the incomplete set of requirements
can be considered a representative sample of the (potentially infinite) total set, the results of
analysis remain valid for comparative evaluation of relative model quality, and provide a useful
indication of absolute model quality.
The main disadvantage of this approach is that it does not directly address the theory
that underlies each process quality model, but instead considers the theoretical basis as
expressed in the model definition document as utilised by the user. Therefore, this approach
performs indirect measurement of the theoretical basis of the model. This approach requires
there to be a close correspondence between the scope of the ‘ideal’ model considered in the
requirements set and the scope of the model under evaluation.
This technique is in effect measuring the quality of a process quality model through the
application of another quality model. There is an implicit assumption that a single quality model
can sufficiently embody the concept of quality for each example of the evaluated item type,
irrespective of content. Therefore, this approach is not suitable for measuring the validity of the
quality model concept, only the validity of specific quality models.
Chapter 4: A theoretical evaluation method for process models
- 53 -
4.2.1.3 Results to be obtained through theoretical evaluation
The types of result that may be obtained through the theoretical evaluation of a process quality
model are dependent on the selected procedure of evaluation. If an analytical method is used
that determines mathematical correctness of any equations proposed in the model, then a
measure of correctness of the form ‘fulfilled/partially fulfilled/not fulfilled’ for each equation
may be relevant. The ‘partially fulfilled’ status relates to the scenario that provision exists for
some aspects of a given requirement but not all, or that the requirement is fulfilled only partially
or only by a proportion of the model.
Using the selected analytical approach, the results obtained are based upon statistical
methods applied to the requirements set. For each requirement identified in the set, the model
definition is analysed to determine if the model meets the requirement, and the findings are
recorded. Upon completion of examination of each requirement in turn to establish if the model
conforms, a set of results exists where there is exactly one result of the form ’fulfilled/partially
fulfilled/not fulfilled’ for each requirement.
This results set can then be further processed and summarised to yield useful results,
which are comparable between models subjected to this analytical process. It is possible to find
the proportion of total requirements which have the status of ‘fulfilled’, ‘partially fulfilled’ and
‘not fulfilled’. This provides a measure of the extent to which the model is able to satisfy the
requirements of an ‘ideal’ model, and hence provides a mechanism to measure the quality of the
model from a theoretical basis.
It is possible to define expected classes of user for the process quality models. A
mapping can be produced between user classes and model requirements, linking each user class
with the subset of model requirements to which their roles relate. By examining the proportion
of requirements in each user class-linked subset with the status of ‘fulfilled’, ‘partially fulfilled’
or ‘not fulfilled’, it is possible to determine the extent to which the evaluated model satisfies the
needs of the various user classes on a theoretical basis.
Therefore, it is expected that the theoretical evaluation process will yield the following
results for each model under consideration:
• Quality of model, in terms of conformance with total requirements set, and
• Relevance of model to members of user classes.
4.2.1.4 Hypotheses HT.a and HT.b for theoretical evaluation
Null hypotheses are utilised in the performance of this study.
Hypothesis HT.a: “No model from the set of evaluation models will be found to be more
conforming to the set of model requirements than any other.”
If all evaluation models are broadly similar in terms of content, and merely offer alternative
mechanisms of presentation of similar underlying content, this hypothesis will be found to be
true by the experimental process. However, if this hypothesis is not found to be true, then it will
Chapter 4: A theoretical evaluation method for process models
- 54 -
be the case that there are genuine differences in the content and quality of the models, and that
therefore some models may be considered to be of higher quality than others. In this situation,
when an organisation seeks to select a process quality model it may be necessary to evaluate the
selection candidates for compliance with a set of requirements expected of an ‘ideal’ model.
Also:
Hypothesis HT.b: “No model from the set of evaluation models shall be found for which
it is more relevant to the needs of one user class than any other identified user class.”
If this hypothesis is found to be true by conducting the experimental process, then for each
model it is the case that the model is no more relevant to the needs of one user class than any
other. However, if this hypothesis is found to be not true, the needs of all user classes are not
satisfied equally by all models. For at least one model under consideration, the requirements of
some user classes are satisfied to a greater extent than the needs of other user classes. In this
situation, when selecting between alternative candidate process quality models, it would be
necessary to identify user classes and the requirements associated with each user class, and to
determine which model best meets the needs of these user classes in particular.
If both hypotheses are found to be true, this is indicative that all models in the
evaluation models set are broadly similar in terms of their content and relevance to different
user classes. Therefore, there would be no advantage in the selection of any particular model in
this set over the remainder, and all would be considered in to in essence be equivalent. If the
evaluation set of models is considered to be a representative sample of all models, this would
indicate that all process quality models with similar scope are broadly equivalent in content, and
would therefore be suitable candidates for selection. It is not expected in reality that this
situation would be observed.
If one hypothesis is found to be false, this indicates that the theoretical evaluation
process has identified differences in the content of the models. This may be in the overall
quality of the model as assessed by comparison with a set of requirements defined for an ‘ideal’
model, or in the observed extent to which the model meets the requirements of specific defined
user classes. If both hypotheses are found to be false, this indicates that both types of difference
between models are applicable to members of the evaluation set of models. Therefore, if it is not
the case that both hypotheses are true, then it is the case that there are fundamental differences
in the theoretical content of the models which must be considered when proposing a candidate
model for selection for usage within an organisation. These would be fundamental differences
which would not disappear through the application of specialised utilisation procedures.
Chapter 4: A theoretical evaluation method for process models
- 55 -
4.2.2 Approach to theoretical model assessment
4.2.2.1 Approach of theoretical model assessment
The purpose of this section is to outline the approach through which theoretical evaluation of
the process quality models is to occur. In order to assess a quality model it is necessary in effect
to apply a secondary quality model. This secondary quality model is composed of a number of
requirements that would typically exist of a software process quality model. Each quality model
is to be assessed against these predefined criteria, and a recording made of whether the model
satisfies or does not satisfy the requirement. An ideal quality model would completely satisfy all
defined requirements, although in actual usage contexts this may not be required. Requirements
which are satisfied by a quality model but which are irrelevant to the needs of the user are of
little assistance. It is therefore useful to identify quality models whose strong or specialist areas
do not coincide solely with requirements irrelevant to the needs of the user.
Relevance and usefulness of the model is to be assessed with consideration of a number
of different viewpoints of the development process, to reflect the different types of individual
who are stakeholders in the deployment of a quality model in a software development
organization. Therefore, a number of user classes are to be defined which represent groups of
users of the quality model, in which each class consists of all users with similar requirements.
For each user class, it is to be determined which requirements are to be taken from the set of all
defined requirements to be appropriate and applicable to their expected needs. These
requirements may be orthogonal or contradictory.
The quality model is to be evaluated against each requirement and a record made of the
extent to which the requirement is satisfied. It is recorded in the results if the model is
insufficiently defined or is too ambiguous for such a measurement to be reliably made. Should
the content of the model definition imply that a requirement may be satisfied but does not
include content that explicitly defines this to be the case, this too is subject to recording in the
results.
Following the definition of user classes and the set of quality model requirements
associated with each, an assessment is to be made of the quality model in terms of these
requirements. The degree to which each model can meet the requirements of the user classes is a
function of the requirements of the user class, and the extent to which the model satisfies these
requirements. A conclusion is to be reached as to whether the model is a suitable candidate for
selection based on these results. A good quality model candidate for selection will meet all
requirements defined of each user class to at least a satisfactory extent.
Chapter 4: A theoretical evaluation method for process models
- 56 -
4.2.2.2 Input resources to theoretical evaluation procedure
4.2.2.2.1 Set of candidate process quality models
Each of the models identified as members of the evaluation set of process quality models in
Appendix M Table M.1 are to be considered using the theoretical evaluation procedure. This
procedure is summarised below.
A subset is to be identified of the set of available process quality models which is to
form the basis of the case studies and the subsequent analysis of comparison results. A number
of criteria are established to decide upon the membership of this subset, in terms of both the
quantity and identity of the constituent elements. From the set of available process quality
models, any subset found to meet the requirements of all selection criteria is considered to be a
suitable choice for utilisation. For the purposes of implementation of the validation strategy, a
particular subset is selected and is used consistently throughout the performance of the
theoretical and empirical evaluations.
The primary consideration in defining the subset of models to be used in the validation
procedure is the number of models. Criteria include:
• Sufficiently large number to be representative
• Sufficiently small number to be practical
• Allows conclusions to be drawn
One model is insufficient, as this allows no comparison of results or checking of results for
consistency against other models, so multiple models are required. Higher numbers of models
leads to results that may be considered more authoritative and more meaningfully reliable as a
representative sample of the set of all models.
Although in general it is theoretically desirable to consider as a large a sample set as
possible, beyond a certain number of processes the benefits of considering further models are
outweighed by the disadvantages relating to issues of practicality. The time taken to evaluate the
set of models increases in a linear fashion with increasing number of models, as the time taken
to evaluate each model is considered to be broadly equivalent and dependent mainly on the
content of the procedure. With increasing numbers of models in the evaluation set, the
evaluation set becomes a more accurately representative sample of the set of all models. At a
certain point the evaluation set can be considered to be sufficiently representative, and beyond
this point the addition of any further models to the set increases the evaluation time without a
significant increase in the representativeness of the evaluation set.
Other factors to be taken into consideration include:
• Relevance of model to case study processes
• Scope of model (compared to scope of evaluation, and the scope of other models in the
set of processes for evaluation)
• Availability of model definitions

Chapter 4: A theoretical evaluation method for process models
- 57 -
• Availability of guidelines for application of the model
• Availability of backing resources from third-party sources
• Absence of obsolescence property (a reasonably up-to-date version of the model must
exist
• Maturity of the model
• Stability of the model
• Representativeness of the model to the set of all models
• Observed level of usage of the model in ‘real world’ usage
• Absence of elements not related to software process quality (i.e. the presence of non-
generically applicable model elements which do not relate directly to software
processes, such as model elements that consider aspects of a business not related to a
software process)
• Status within the set of models (e.g. International Standard)
As these models are broadly compatible in terms of scope both within the evaluation set and
with the aims of the defined evaluation procedure, there are no logical reasons why any
members of the evaluation set would be unsuited to evaluation through this procedure. It is
therefore useful to consider all models within the evaluation set on an equal basis through an
identical procedure, as this will produce a set of evaluation results in an identical format suitable
for comparative analysis of the models.
4.2.2.2.2 Model source materials and resources
For each process quality model under consideration, a number of documents and resources are
utilised as input resources to the evaluation process. Where possible, the analysis focuses on the
information within the documents defining the model. However, in some cases it is necessary to
consider the content of other information sources. The sources used in this study are listed in
‘Appendix A: Information sources for theoretical evaluation’. These include items such as the
documents containing the definition of the process quality models, and supporting resources
which relate to the content of these documents.
The use of supporting resources which were not directly associated with the models to
which they relate was minimised wherever possible. Resources were preferred where the
organisation of origin is the same as that responsible for the publication of the model or the
implementation of the process, as it is assumed that this organisation is the highest authority on
this item.
4.2.2.2.3 User classes
It is recognized that there exists a number of stakeholders in the application of a process quality
model in a software development environment. These individuals may perform a wide variety
of roles in the software process and may be distributed across a number of separate

Chapter 4: A theoretical evaluation method for process models
- 58 -
organizational entities. Each of these individuals shares a base common interest in the quality of
developed products. However, beyond this uniting factor it is recognized that individuals have
differing requirements and will use the quality model and results produced through application
of the model for different purposes. A given process quality model may be more useful to some
user classes than others, irrespective of any measured level of intrinsic quality. Therefore, it is
important to evaluate a process quality model in the context of each expected user class, in
addition to producing an overall evaluation.
4.2.2.2.4 Approach of user class-based evaluation
In this study, consideration is given to the extent to which a given process quality model is
relevant and useful to the needs of members of different user classes. It is considered that in any
given software development project, it is possible to identify a number of user classes. Each
user class represents a set of similar roles performed by individuals with an interest in the usage
of a process quality model in this context. This interest can be expressed in terms of a number of
requirements placed on a process quality model. Any given requirement may be shared by more
than one user class. A set of requirements can be defined for each user class, the union of which
forms the total set of requirements considered in the evaluation of the model.
4.2.2.2.5 User classes considered in evaluation
‘Appendix C: Derivation of user classes’ outlines the method through which a working set of
user classes is established and defined. It is important that these user classes are well defined
and clearly delimited, and that the viewpoint of each user class is considered when performing
the study. This method is summarised below:
[SPI95] defines the intended users of a software process quality model as:
1. Software organization:
a. Understand what to do to improve software processes
b. Understand which processes an assessor may evaluate
2. Software process assessors:
a. Determine how an organization manages software processes and their results
Type 1 considers within a software organization what elements of the software process exist and
how they may be improved. Software processes are defined by managers and implemented by
developers. Successfully introducing an element of a software process requires involvement and
consideration of both developers and managers viewpoints, and so the supplier organization
must at least be divided into general ‘developers’ and ‘managers’. Although these are separate
roles, it is possible for a given individual to perform both should the organization be structured
in this way.
Type 2 considers the assessment of a software process. Information derived from an
assessment of this type is of interest to both the supplier and the customer. The supplier
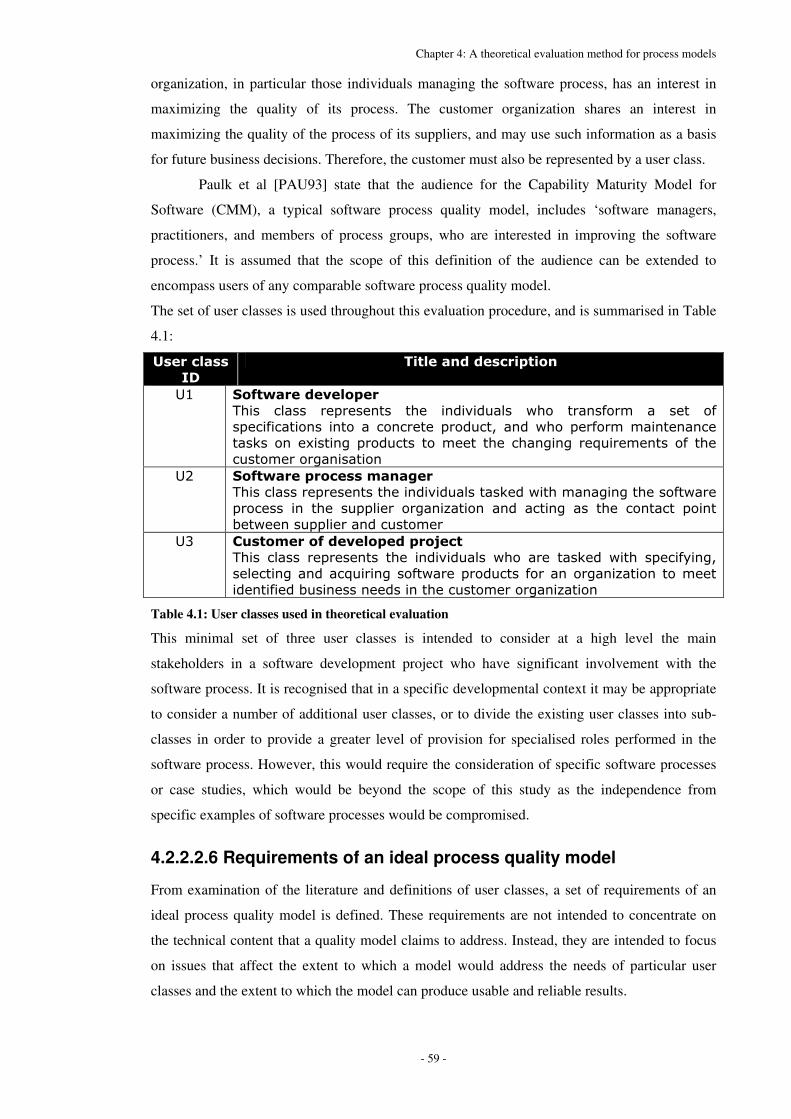
Chapter 4: A theoretical evaluation method for process models
- 59 -
organization, in particular those individuals managing the software process, has an interest in
maximizing the quality of its process. The customer organization shares an interest in
maximizing the quality of the process of its suppliers, and may use such information as a basis
for future business decisions. Therefore, the customer must also be represented by a user class.
Paulk et al [PAU93] state that the audience for the Capability Maturity Model for
Software (CMM), a typical software process quality model, includes ‘software managers,
practitioners, and members of process groups, who are interested in improving the software
process.’ It is assumed that the scope of this definition of the audience can be extended to
encompass users of any comparable software process quality model.
The set of user classes is used throughout this evaluation procedure, and is summarised in Table
4.1:
�����������
�
�� �������������� ����
��� ��� ���������������
����� ���� �� �������� ���� ���������� ���� ��������� � ���� ���
� ��������������������������� ��������������� �����������������
����������������� ������������������������������������������������
��������������������
��� ��� ���������������������
����������� ����������������������������������������������������
���������� ���� �� ������������������ �������� ���� ������� �����
���������� ����������������
��� ��� ������������������������ �
����������� ����������������������������������������� ���� �����
����������������������������� ���������������������������������
�����������������������������������������������������
Table 4.1: User classes used in theoretical evaluation
This minimal set of three user classes is intended to consider at a high level the main
stakeholders in a software development project who have significant involvement with the
software process. It is recognised that in a specific developmental context it may be appropriate
to consider a number of additional user classes, or to divide the existing user classes into sub-
classes in order to provide a greater level of provision for specialised roles performed in the
software process. However, this would require the consideration of specific software processes
or case studies, which would be beyond the scope of this study as the independence from
specific examples of software processes would be compromised.
4.2.2.2.6 Requirements of an ideal process quality model
From examination of the literature and definitions of user classes, a set of requirements of an
ideal process quality model is defined. These requirements are not intended to concentrate on
the technical content that a quality model claims to address. Instead, they are intended to focus
on issues that affect the extent to which a model would address the needs of particular user
classes and the extent to which the model can produce usable and reliable results.

Chapter 4: A theoretical evaluation method for process models
- 60 -
This approach is designed to avoid potential bias towards any given example of a
process quality model. Where sets of requirements are defined of a process quality model, this is
typically performed in the design of a particular model. Therefore, unless a given model can be
identified as representing the ‘gold standard’ against which all comparisons are to be made,
deriving a set of requirements for comparison of models from this requirements set would lead
to biasing of results in favour of the model for which this set was originally formulated. It is
also intended that the requirements set be considered primarily from the viewpoint of a user of a
process quality model, rather than a more abstract position, to maximise the relevance of the
results of model evaluation to those parties which may require to use them.
As previously identified, it is not possible to identify a complete set of requirements of
an ideal process quality model, as there is an element of subjective opinion as to which
requirements would hold of such a model. It is therefore intended that this requirements set act
as a representative sample of the total set, and be sufficiently representative to allow comparison
of results between models.
Should a user of this approach find that the requirements set requires augmentation to
increase coverage of a particular area of concern, it is possible to do so without modification of
the underlying assumptions and procedures. It is intended that if this evaluation approach were
to be reused by a user in a specific context, they would review the requirements set definition
and amend it as it appropriate to their evaluation needs.
The requirements set is divided into a number of smaller sets, each of which
representing a logical grouping of related requirements. Each requirement from the total set is a
member of exactly one of the subsets. If a potential user of the model is particularly interested in
a particular area of concern, for example ‘process development’, the results of evaluation
pertaining to subset ‘Group G: Process development’ could be examined in isolation.
4.2.2.2.7 Procedure for requirement definition
The following steps are performed for each potential requirement identified. This procedure
ensures that requirements are identified for which there is a proven need, and that the resulting
requirements are unambiguously and uniquely defined. The four steps are as follows:
1. Identify need for requirement.
2. Locate supporting references.
3. Prepare unambiguous definition of requirement.
4. Assign unique identifier, for purposes of internal/external referencing and traceability.
This series of steps is to be repeated until no further requirements can be identified. When no
more can be identified, this series terminates. It is not possible to determine whether the
requirement set is complete, but this must be balanced against the necessity to avoid irrelevant
or partially relevant requirements being introduced. Care is taken to ensure that no duplicate
requirements are permitted into the set.

Chapter 4: A theoretical evaluation method for process models
- 61 -
In compiling the set, most requirements were identified and derived from the roles,
needs and typical work activities performed user classes considered later in this chapter. From
the definition of each user class, consideration was given to the roles and activities that would
be performed and the ways in which the application of a process quality model could bear upon
this.
A summarised list of the requirements categorised into groupings of similar or related
concepts can be found in ‘Appendix B: Requirements of an ideal process quality model’. This
appendix also presents a list referencing the sources from which each requirement was derived.
In this set, there are 85 requirements labelled with identifiers R1-R85, divided into 17 groups
labelled with identifiers A-Q. Tables 7.2 – 7.18 in Chapter 7 present for each of R1-R85 a set of
keywords to summarise the content of the requirement.
4.2.3 Procedure of theoretical evaluation
4.2.3.1 Theoretical evaluation procedure
The experimental method is divided into a number of steps which are to be undertaken in
numerical order. At any stage, the party executing the experimental method is to record in an
appropriate format any:
• Observations,
• Experiences,
• Relevant and justifiable opinions,
• Identified strengths of the process quality model, and
• Identified weaknesses of the process quality model.
The level of detail used in recording these shall be commensurate with the perceived importance
of the observation. Observations of these types may not relate directly to the evaluation process,
but are nonetheless useful in performing an evaluation of a model. Therefore, these are recorded
using an informal format.
The output results of the experimental process are an analysis of the extent to which
user requirements are satisfied in theory by the process quality model, and may readily be
applied in the process of selecting a candidate process quality model from a number of
alternatives in a given developmental context. The results for each requirement identified are to
be presented in an identical format. Any results obtained which do not fit within this structure
are to be presented separately, to accompany results presented in the defined format.
The inputs to this method are the definitions and sources for each model (see ‘Appendix
A: Information sources for theoretical evaluation’), and the set of requirements (see ‘Appendix
B: Requirements of an ideal process quality model’). The output of this method is a set of
results for evaluation and analysis. A results set is produced for each model. Each results set
contains an assessed value of conformance of the model for each element of the requirements
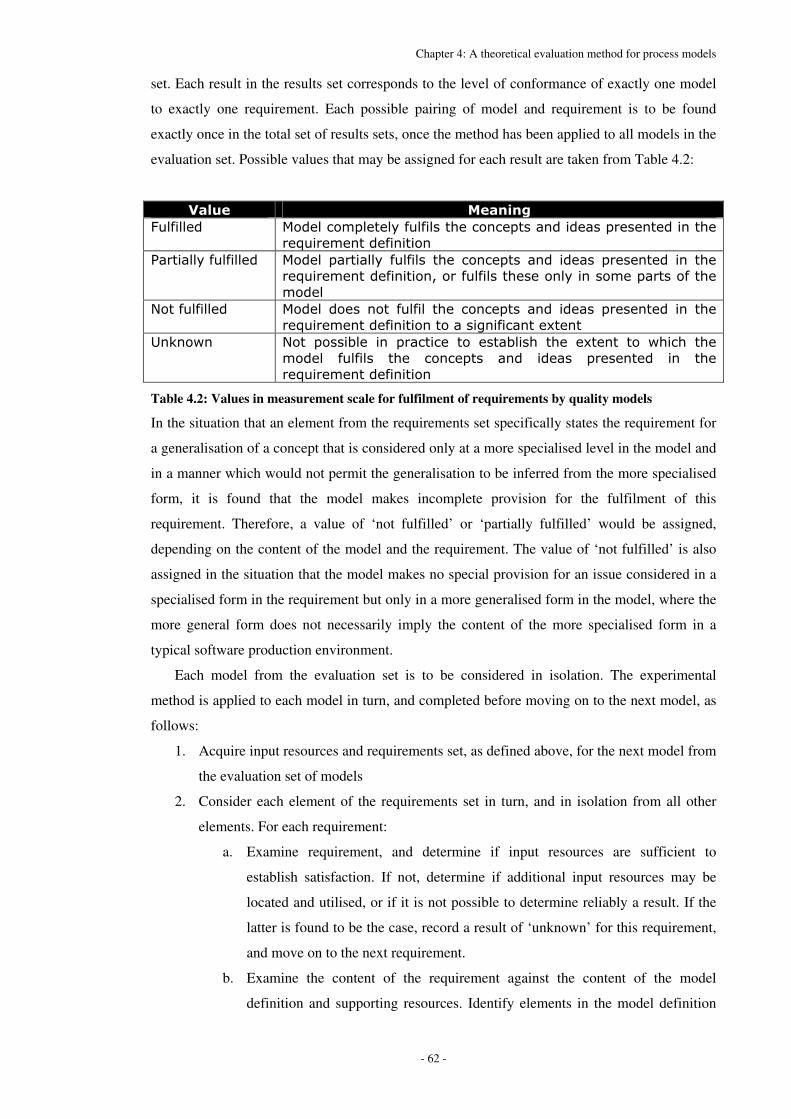
Chapter 4: A theoretical evaluation method for process models
- 62 -
set. Each result in the results set corresponds to the level of conformance of exactly one model
to exactly one requirement. Each possible pairing of model and requirement is to be found
exactly once in the total set of results sets, once the method has been applied to all models in the
evaluation set. Possible values that may be assigned for each result are taken from Table 4.2:
������ ��������
!������ "������� ��� ���������������� ����������� ����������������
�����������������������
#��� �������� "���� ��� ���������������� ����������� ����������������
����������������������������������������� ��������� �����������
�����
$���������� "��������������������������� ����������� ����������������
���������������������������������������������
�������� $��� ������� ��� ������� ��� �������� ���� ������� ��� ������ ����
����� ������ ���� ����� ��� ��� ����� ��������� ��� ����
�����������������������
Table 4.2: Values in measurement scale for fulfilment of requirements by quality models
In the situation that an element from the requirements set specifically states the requirement for
a generalisation of a concept that is considered only at a more specialised level in the model and
in a manner which would not permit the generalisation to be inferred from the more specialised
form, it is found that the model makes incomplete provision for the fulfilment of this
requirement. Therefore, a value of ‘not fulfilled’ or ‘partially fulfilled’ would be assigned,
depending on the content of the model and the requirement. The value of ‘not fulfilled’ is also
assigned in the situation that the model makes no special provision for an issue considered in a
specialised form in the requirement but only in a more generalised form in the model, where the
more general form does not necessarily imply the content of the more specialised form in a
typical software production environment.
Each model from the evaluation set is to be considered in isolation. The experimental
method is applied to each model in turn, and completed before moving on to the next model, as
follows:
1. Acquire input resources and requirements set, as defined above, for the next model from
the evaluation set of models
2. Consider each element of the requirements set in turn, and in isolation from all other
elements. For each requirement:
a. Examine requirement, and determine if input resources are sufficient to
establish satisfaction. If not, determine if additional input resources may be
located and utilised, or if it is not possible to determine reliably a result. If the
latter is found to be the case, record a result of ‘unknown’ for this requirement,
and move on to the next requirement.
b. Examine the content of the requirement against the content of the model
definition and supporting resources. Identify elements in the model definition

Chapter 4: A theoretical evaluation method for process models
- 63 -
and supporting resources which cover content areas relevant to the requirement
under consideration.
c. Determine the extent to which the requirement is satisfied by the model,
considering the elements in the model and supporting resources identified in
step ‘2.b’.
d. Assign a value from the scale defined in Table 4.2 as the result for this
requirement, which reflects the extent to which the requirement is satisfied by
the model
e. Record evidence to support the assignment of a particular result value,
providing evidence of the reasoning behind this decision. This may include
appropriate extracts from the model definition.
3. Collate results
a. Collate results into a results set
b. Present results in a table, where each requirement is assigned a row. Each row
links a requirement to the measured level of conformance, and presents the
evidence upon which this measured value is assigned.
4. If further models are present in the evaluation set of models, repeat process from step
‘1’ onwards for the next model. Otherwise, terminate procedure.
4.2.3.1.1 Analytical procedure for theoretical evaluation procedure
For each model in the evaluation set, a results set is produced containing a mapping between
each requirement in the requirements set, and a value defined in the measurement scale defined
in Table 4.2. As there are a finite number of values in the scale, it is possible to consider each
value in turn and find the number of requirements for which the model has been found to have
this level of conformance. Through comparison with the total number of elements in the
requirements set, it is possible to determine the proportion of requirements which have the
status of ‘Fulfilled’, ‘Partially fulfilled’, ‘Not fulfilled’ and ‘Unknown’. These proportions can
then be analysed to determine a measure of properties of the model, based on the level of
conformance with the requirements set for an ideal process quality model. Measures of this type
can then be combined with other observations obtained through conducting the procedure in the
evaluation of the model.
4.2.3.2 Purpose of user class-based evaluation
The purpose of user-class based evaluation is to establish the level of relevance and usefulness
of the content of a software process quality model to each of the user classes participating in the
process. There are several uses for this information. Firstly, it is possible to establish in absolute
terms how useful application of a model and the results of process evaluation using a model
would be to a given user class. Secondly, it is possible to establish usefulness and relevance in
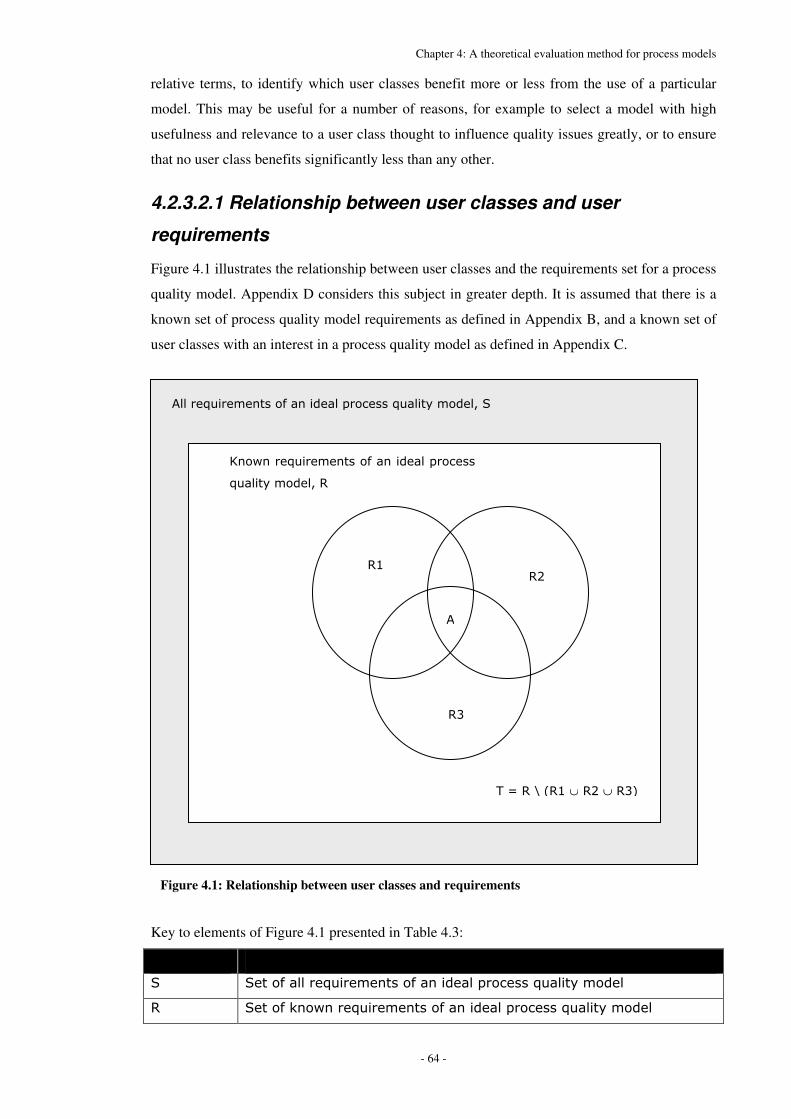
Chapter 4: A theoretical evaluation method for process models
- 64 -
relative terms, to identify which user classes benefit more or less from the use of a particular
model. This may be useful for a number of reasons, for example to select a model with high
usefulness and relevance to a user class thought to influence quality issues greatly, or to ensure
that no user class benefits significantly less than any other.
4.2.3.2.1 Relationship between user classes and user
requirements
Figure 4.1 illustrates the relationship between user classes and the requirements set for a process
quality model. Appendix D considers this subject in greater depth. It is assumed that there is a
known set of process quality model requirements as defined in Appendix B, and a known set of
user classes with an interest in a process quality model as defined in Appendix C.
Key to elements of Figure 4.1 presented in Table 4.3:
��� ������ ����
%� %����������������������������� ����������� ������
&� %���������������������������������� ����������� ������
'����������������������� ����������� �������%�
(��������������������������� �������
���� �������&�
��)�&�*�+&��∪�&��∪�&�,�
&��&��
&��
'�
Figure 4.1: Relationship between user classes and requirements

Chapter 4: A theoretical evaluation method for process models
- 65 -
�� %���������������������������� ����������� ������� ������� �
��������������
&���&���&�� %����������������������������� ����������� ������� ������� �
� ������������������
'� %����������������������������������������&���&�����&��
Table 4.3: Key to elements of Figure 4.1
The diagram represents a generalized overview of this relationship, and therefore remains
relevant if further user classes are defined. It is assumed that there exists a (possibly infinite) set
of valid requirements of a process quality model, S. This includes all requirements that any user
class may have of a quality model, whether known and defined or otherwise.
It is assumed that there exists a set of known and validated user requirements, R. R is a
subset of S (R ⊆ S). It is not in general possible to demonstrate that (R = S) or (R ≠ S), as this
would require knowledge of all members of S. As there is no upper bound on the number of
unique software processes that may potentially exist, there is also no upper bound on the
cardinality of S.
It is desirable to maximise the extent to which the membership of R concurs with the
membership of S. This represents a maximisation of the extent to which R is representative of S,
and therefore the extent to which R represents the requirements of an ideal process quality
model. To maximise the completeness of R, it is necessary to minimise #(S \ R). This is
achieved through a process of iterative improvement, observation of working practices in
software processes, and the pooling of current knowledge in the field.
For each user class, there exists a subset of R containing only those requirements
relevant to that specific user class. In Figure 4.1, there are three subsets of R (R1, R2 and R3) to
represent the three user classes identified in Table C.1 of ‘Appendix C: Derivation of user
classes’ (U1, U2 and U3 respectively). Table 4.4 defines this relationship.
����� � ������� ��������������
&�� ���+%������������ ��,�
&�� ���+%������� ������������,�
&�� ���+-���������������� ��� ��.���,�
Table 4.4: Subsets of R and associated user classes
There also exists T, another subset of R containing only those user requirements that are not
found to be relevant to the needs of any of the identified user classes. R1, R2 and R3 are not
necessarily disjoint, i.e. any given requirement can be a member of zero or more user class
requirement sets. However, any requirement present in the set T cannot be present in any user
class requirement set. R is the union of sets R1, R2, R3 and T.
R = R1 ∪ R2 ∪ R3 ∪ T

Chapter 4: A theoretical evaluation method for process models
- 66 -
A = R1 ∪ R2 ∪ R3
T = R \ (R1 ∪ R2 ∪ R3)
R1 ⊆ R
R2 ⊆ R
R3 ⊆ R
T ⊆ R
∀x. x ∈ T → (x ∉ R1) ∧ (x ∉ R2) ∧ (x ∉ R3)
Shared elements of requirements sets, as represented by overlapping sections in the
figure 4.1, represent a shared interest of two or more parties in a quality issue. This therefore
presents an opportunity to assess and improve the coupling of the working practices of the
parties sharing a common interest. This information may be of relevance to organizations
carrying out process improvement practices as these issues may require a greater than average
level of communication between heterogeneous working units.
The section of the diagram where all user classes overlap, A, represents a core subset of
requirements. These requirements form the basis for a common, shared understanding of quality
issues among all interested parties. Therefore, it is important that all of these requirements are
fulfilled by a quality model in order for the model to be considered adequate for usage in a
given software development context. It is desirable that the number and proportion of
requirements found in A should be as large as possible to ensure that the model maximizes the
extent of the shared understanding.
Requirements which are in the requirements set of exactly one user class represent
issues which are specialized and of relevance only to the working practices of the user class.
Therefore, it may be acceptable for these requirements to be more domain-specific and require a
greater level of specialized knowledge than those which are shared by more than one user class.
Any defined requirements not relevant to the defined user classes are superfluous and form the
set T as defined above. Such requirements could potentially be candidates for removal from the
model as utilisation does not provide benefit to model users. Therefore, the membership of T
should be minimised. Ideally, T = ∅. A model containing a significant proportion of irrelevant
material, or ‘noise’, may prove in practice to be cost-inefficient to implement due to costs
incurred in executing unneeded assessment tasks, and the presence of irrelevant elements may
distract from the issues that are of real importance to an organisation.
The presence of a requirement in T may indicate that an additional user class exists that
has not yet been recognised and defined. Alternatively, some requirements previously in R may
become ‘orphaned’ into T when an existing model is customised for application in a specific
usage context. If the membership of R is derived through purely theoretical methods, it may be
Chapter 4: A theoretical evaluation method for process models
- 67 -
discovered upon application of observational methods that some members of R may not be
relevant in practice.
4.2.3.2.2 Mapping user requirements to user classes
Appendix C Table C.1 defines three user classes which represent the stakeholders in the
implementation and results of application of a process quality model to a software process. For
each user class, a summary definition is provided of the role fulfilled within the software
process. Therefore, it is possible to derive an understanding of the notion of quality as
applicable for each user class, and an understanding of what benefits a member of this class
would be expected to gain from application and evaluation results of a process quality model.
It is possible to determine which of the members of the set of requirements of an ideal
process quality model are of relevance in achieving the quality aims of each defined user class
From the set of all requirements of an ideal process quality model, a subset of requirements is
identified which address the primary concerns of specific user classes. Appendix D considers
this subject in greater depth.
A requirement may be in present in the requirements subset for more than one user
class, reflecting a shared concern in an aspect of the software development process. Should a
requirement be present in exactly one requirements subset, this indicates the existence of a
specialised concern. A requirement that is present in none of the user class specific requirements
subsets may be indicative of a user class that is present in the software process but has not yet
been identified and defined. Alternatively, this requirement may be superfluous to requirements
and therefore a candidate for removal to simplify the requirements set. Subclassing of the
defined user classes may improve the usefulness and accuracy of these mapping.

Chapter 4: A theoretical evaluation method for process models
- 68 -
4.2.3.3 Procedure of user class-based evaluation
Following completion of the procedure outlined in the ‘Theoretical evaluation procedure’
sections of this chapter, for each model in the evaluation set there will exist a results set linking
each defined element in the requirements set with an assessed level of conformance of model to
requirement. Table D.3 in ‘Appendix D: Relationship between user classes and requirements’
defines a mapping between requirements and user classes, identifying which requirements are of
interest and relevance to each defined user class. This mapping is used to determine the level of
conformance of each model to the subset of requirements relevant to each user class. Should any
requirement remain unmapped to when all user classes have been fully considered, these
requirements should be removed from the set as they have been found to be irrelevant in this
context and therefore beyond the scope of the study. The following procedure is repeated for
each model in the evaluation set in turn.
1. Select the next model from the evaluation set
2. The following steps are performed on each user class (set identified in Table 4.1) in
turn:
a. Select the next user class from the set
b. Find the appropriate mapping column for the current user class from Table D.3
in ‘Appendix D: Relationship between user classes and requirements’
c. Use the mapping to identify the subset of requirements that are relevant to the
current user class
d. Find the number of requirements from the results set for the current model from
the ‘Theoretical evaluation procedure’ section of this chapter. Discard results
relating to any requirements which are not present in the subset identified in
step ‘2.b’.
e. From those results which have not been discarded, find the number of
requirements for which the model has been found to have a level of
conformance for each of the possible values (‘Fulfilled’, ‘Partially fulfilled’,
‘Not fulfilled’, ‘Unknown’).
f. From the subset of requirements from step ‘2.b’, find the total number of
requirements in this subset. Use this number and the values obtained in step
‘2.d’ to find the proportion of requirement at each of the possible values
(‘Fulfilled’, ‘Partially fulfilled’, ‘Not fulfilled’, ‘Unknown’) from the subset
identified in step ‘2.b’. The resulting figures represent the proportion of
requirements relevant to the combination of currently selected user class and
currently selected model at each of the possible levels of measured
conformance

Chapter 4: A theoretical evaluation method for process models
- 69 -
g. If more user classes remain that have not yet been considered, repeat from step
‘2.a’ onwards. Otherwise, proceed to step ‘3’.
3. If there remain any models that have not yet been considered, repeat procedure from
step 1 onwards. Otherwise, terminate procedure.
4.2.3.3.1 Analytical procedure for user class-based evaluation
Upon completion of the above procedure, for each model in the evaluation set there exists a set
of results sets. Each result set contains the proportion and number of requirements at each
possible conformance value, for a specific combination of user class and model. Each possible
combination of user class and model is considered exactly once.
Measures of this type can then be combined with other observations obtained through
conducting the procedure in the evaluation of the model. The results sets associated with each
user class represent a specialisation of the form of results set produced by the methods outlined
in the ‘Theoretical evaluation procedure’ section of this chapter. These results sets can therefore
be evaluated and analysed using the same methods.
Furthermore, this information can be used and evaluated to address the issues raised in
the ‘Purpose of user class-based evaluation’ section of this chapter. As results sets are produced
for each user class, it is therefore possible to determine a measure of the usefulness and
relevance of each model to each user class. It is also possible to perform comparison between
the results sets associated with specific user classes, to identify relative strengths and
weaknesses in support for specific user classes.
4.2.3.4 Comparison of model content
When comparing models, in addition to finding the suitability of the model to the needs of user
classes representing stakeholders in the software process, it is also useful to be able to gain an
understanding of the content of the models. If the user requires a specific item of content, it is
trivial to examine the definition documents of models in the evaluation set to establish if this
required content is present, either in the format of a dedicated model element or distributed
throughout a number of model elements. However, should the user simply wish to ensure that a
basic minimal level of functionality provision is present in the model, or to establish which
models have an appropriate (or perhaps maximal) level of content, it is necessary to have a
mechanism for the comparison of the content of models.
One possible approach is to build a list of those content items which are considered
essential to the user, and sequentially check for the provision of each item in each model in turn.
This is an extension of the trivial checking for a single content item, as discussed above.
However, this approach assumes the user is able to define exactly which content items are
required. This may be unrealistic as the user may not possess this type of knowledge, as one of
the purposes of defined quality models is to present a set of this type of information in a unified

Chapter 4: A theoretical evaluation method for process models
- 70 -
and usable package. In addition, there is no guarantee that the issues thought to be important by
the user are those issues which actually require the greatest level of attention; another purpose
of a defined model is to guide the user and establish awareness of these issues.
A second approach is to compare each possible pairing of models from the evaluation
set, and perform a line-by-line examination of content. The evaluator considers each line or
clause from the first model in turn, establishing and recording the identity or absence of
corresponding lines or clauses in the second model. This approach may produce very accurate
results for the comparisons in some cases, but has a number of weaknesses. The content
described in one clause of the first model may be distributed across a large number of clauses in
the second model, requiring each relevant clause to be identified and recorded. If a large number
of clauses are mapped to from a single clause in the first model, this may become confusing and
difficult to draw reliable conclusions from when establishing if the content of the two models is
similar and identifying differences. In addition, slight differences in interpretation of each low-
level detail in each model may lead to different results if another evaluator repeated the
comparison method. It is undesirable that an evaluation approach would produce results that
were not broadly repeatable.
An alternative third approach is to compare the content of each model with a known
reference standard. This approach relies on the existence of a ‘lowest common denominator’
model known to represent a basic set of quality issues, and against which all other models can
be compared in terms of their content elements. The basic technique used is to consider each
element in the reference standard in turn. For each reference element, attempts are made to find
and record corresponding content element provision in each of the other models. The product of
this technique is in essence a set of models, each of which is reorganised into the format of the
reference standard model, although some elements may be repeated within any given model.
The comparison of content types is performed at a relatively high level, to compare provision of
content types that are ‘similar’, rather than ‘identical’.
This approach allows the evaluator to establish if each model contains content of a
similar type and considering similar issues, to the reference standard model. The level of detail
of content provision is not considered in this approach, only the subjects considered by content
elements. Provided the reference standard model is assumed to be of sufficient quality to be
useful, it may be assumed that any model covering the same content types as the reference
standard can also be considered to be of at least sufficient quality, if the level of detail in the
model definition is also considered to be sufficient. This method is performed by identifying
and recording content element types in the reference standard model for which there is no
equivalent in the evaluated model.
It is also possible to use this technique to identify differences in model content. If a
content element in the reference standard model has no equivalent in a compared model, this
indicates missing content in the compared model. If a content element is found in the compared
Chapter 4: A theoretical evaluation method for process models
- 71 -
model that is not mapped to by any element of the reference standard model, this represents
additional content. This method is performed by identifying content element types present in the
evaluation model for which there is no equivalent in the reference standard model. This
additional content should be evaluated by the user to establish if it provides an advantage and
hence makes the compared model a better candidate for selection, or if it is irrelevant to their
needs representing ‘noise’ in the model and hence making the compared model a poorer
candidate for selection. This user evaluation would need to be performed in the context of a
specific software process, and is therefore beyond the scope of this study.
The reference standard model employed in this approach would need to be known to
contain a basic set of content elements, and ideally would have been shown to produce useful
results in practice in a number of real production environments. The technique for performing
mapping between content elements of process quality models is described in ‘Appendix H:
Mapping between elements of quality models’, and are summarised in section 4.2.3.5. The
results from the application of this technique to models in the evaluation set are presented in
‘Appendix I: Results of mapping between quality models’.
Comparison can also be made between models of the number of constituent content
elements in each process quality model in the evaluation set. This value represents the size of
model content.
4.2.3.5 Mappings between quality models
4.2.3.5.1 Technique for mapping between quality models: Unit
element approach
Each model produces software process assessment results in a different format. In order to
compare the results of the application of two different models, it is necessary to transform the
data values so that they are both in the same format and can be compared on a like-for-like
basis. This requires the production of a mapping between the elements of the quality models.
This subject is examined in Appendix H; a summary is provided below.
For any two given process quality models, identified as ‘X’ and ‘Y’, there are two ways in
which this can be achieved.
1. Map each element of model X to elements of model Y that consider similar subject
matter, and then map the results obtained from model X into the result presentation
format of model Y.
2. Create a new format for presentation of results, defined in terms of all areas considered
in model X and all areas considered in model Y. Map each element of models X and Y
onto elements of this new format, and then map the results obtained from the case
studies into this new format.

Chapter 4: A theoretical evaluation method for process models
- 72 -
Approach 1 has the advantage that no transformation of results is required for one quality model
which reduces the amount of work to be performed. Lowering the amount of data
transformation required reduces the potential for errors to be introduced in data transformation.
Provided the quality model selected to form the destination format is reasonably comprehensive
in terms of its content and is reasonably well structured, an advantage of this approach is that
the destination format is well defined and associated case studies demonstrate that it can be used
effectively. Therefore, approach 1 is selected for use.
4.2.3.5.2 Selection of standard model
Before the mapping of model elements can be performed, it is necessary to select which model
is to be mapped to. This subject is examined in Appendix H; a summary is provided below.
The three process quality models considered in the case studies are:
1. ISO9001 / ISO9000-3 ([ISO9001], [ISO9000-3])
2. SPICE ([SPI95])
3. CMM ([PAU96])
These are taken from Appendix M, Table M.1. The ISO9000-3 definition document [ISO9000-
3] contains a mapping of ISO9000-3 elements to generic ISO9001 elements (‘Annex A’ and
‘Annex B’). The SPICE definition documents [SPI95] contain a mapping of SPICE elements to
ISO9001 elements (‘Part 2: A model for process management, Annex F: Mapping to ISO9001).
[PAU93b], [PAU94] and [PAU96] (‘Appendix F: Comparing ISO9001 and the CMM) consider
a comparison of CMM and ISO and contain a mapping of CMM elements to ISO9001 elements.
(In all cases these mappings refer to the 1994 edition of ISO9001 [ISO9001]. The mapping of
ISO9001 elements to ISO9001 elements is the identity mapping and therefore does not require
further definition.)
It can be seen that mappings to ISO9001 have already been created by third parties for
all models used in case studies. It is therefore reasonable to use ISO9001 as the quality model to
which all other quality models are to be mapped for the purposes of comparison of case study
results. This approach will reuse existing resources and prevent repetition of work already
completed by other parties.
These mappings are the product of the organisations responsible for developing the
models. It is a reasonable assumption that the organisation which designed a given model has a
greater understanding of its content than any other organisation. A corollary of this is that the
organisation responsible for development of the model is the organisation most qualified to
produce the mapping of elements of this model to a different model. Therefore, it is reasonable
to select the mappings to ISO9001 identified above in preference to any other mappings which
may have been produced by third-party organisations.
ISO9001 is intended for usage in the context of a generic industrial process, whereas
SPICE, CMM and ISO9001/ISO9000-3 are intended for use in the context of a software
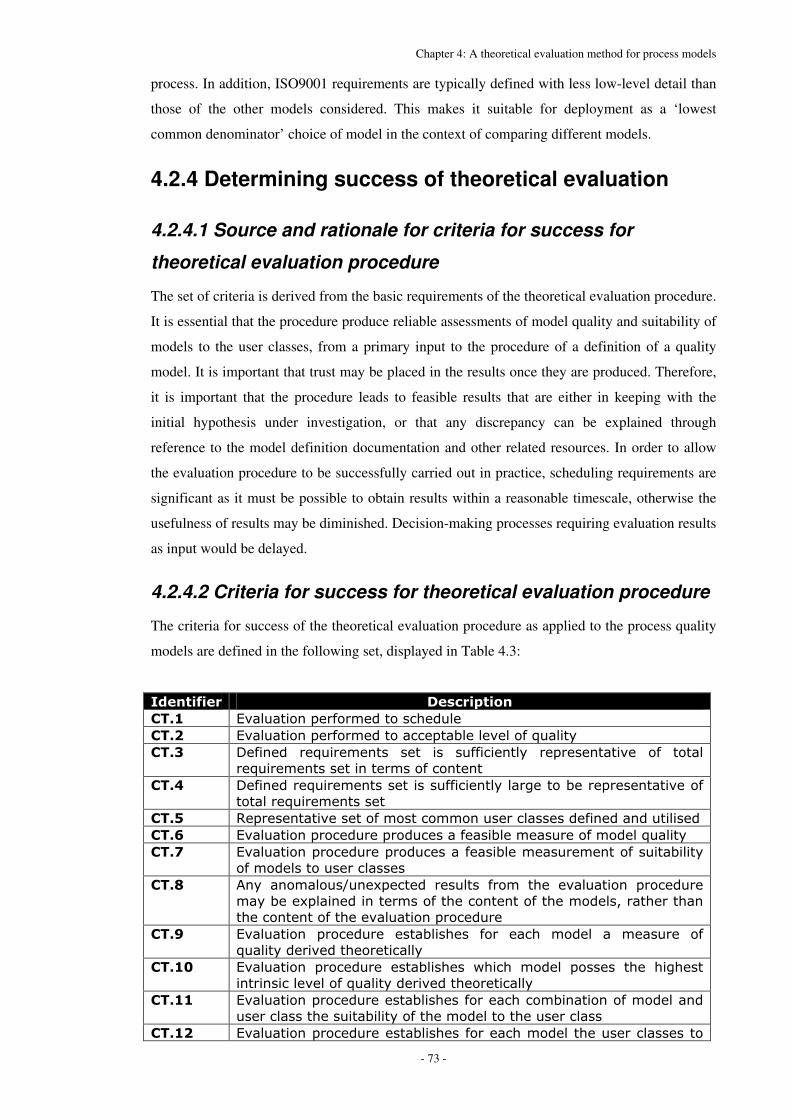
Chapter 4: A theoretical evaluation method for process models
- 73 -
process. In addition, ISO9001 requirements are typically defined with less low-level detail than
those of the other models considered. This makes it suitable for deployment as a ‘lowest
common denominator’ choice of model in the context of comparing different models.
4.2.4 Determining success of theoretical evaluation
4.2.4.1 Source and rationale for criteria for success for
theoretical evaluation procedure
The set of criteria is derived from the basic requirements of the theoretical evaluation procedure.
It is essential that the procedure produce reliable assessments of model quality and suitability of
models to the user classes, from a primary input to the procedure of a definition of a quality
model. It is important that trust may be placed in the results once they are produced. Therefore,
it is important that the procedure leads to feasible results that are either in keeping with the
initial hypothesis under investigation, or that any discrepancy can be explained through
reference to the model definition documentation and other related resources. In order to allow
the evaluation procedure to be successfully carried out in practice, scheduling requirements are
significant as it must be possible to obtain results within a reasonable timescale, otherwise the
usefulness of results may be diminished. Decision-making processes requiring evaluation results
as input would be delayed.
4.2.4.2 Criteria for success for theoretical evaluation procedure
The criteria for success of the theoretical evaluation procedure as applied to the process quality
models are defined in the following set, displayed in Table 4.3:
��� ������ ������ ����
��� � /������� ��������������������
���!� /������� ��������������� ��������������� �
���"� 0������� ������������� ���� ��� ���������� � �� ����������� ��� ����
�������������������������������������
���#� 0������������������������������������� ������������� ��������������
���������������������
���$� &� ������������������������������������������������������������
���%� /������� ��������� ����������������������������������� �
���&� /������� ��������� �������������������������������������� �
�����������������������
���'� '� � ������1���� ������ ������� ����� ���� �������� ���������
� ������ �����������������������������������������������������
��������������������������� ���������
���(� /������� ��������� ���������� ���� ���� ����� � ������� ���
���� ������������������ �
��� )� /������� ��������� ���������� ������ ����� ������ ���� ��������
��������������������� ������������������ �
��� � /������� �������������������������������������������������
��������������������� �����������������������������
��� !� /������� ��������������������������������������������������

Chapter 4: A theoretical evaluation method for process models
- 74 -
�������������������������������
��� "� /������� ��������������������������������������������������������
������������������������ ����� �������
��� #� /������� �������������������������������������������������
���� ���� ��� ���
��� $� /������� ��������� �������� �������� ��� ������ ��� ���� ���
�������
��� %� /������� ���������������������������������������������������
��� &� /������� ��������� ���� ����� � ��� � �������� 2�3� ��� ���
���������������������
��� '� /������� ��������� ���� ����� � ��� � �������� 2�3�� ��� ���
���������������������
Table 4.5: Criteria for success for theoretical evaluation procedure
4.2.4.3 Schedule for theoretical evaluation procedure
It is important in the practical deployment of an evaluation procedure for there to be some
awareness of scheduling requirements, so that organisational issues may be considered and to
allow tracking of progress towards completion and delivery of results and findings. The
procedure used for theoretical evaluation of a process quality model requires the use of a
defined set of requirements applied to each model in the evaluation set. The size of this set
remains constant for each of the models evaluated. Therefore, the schedule requirements for
each model can be considered to be broadly equivalent, as an equal number of requirements are
to be investigated. Some differences in scheduling requirements will be observed due to the
nature of the documents in which the models are defined (length, level of detail, level of
ambiguity of information and language, distribution of information) and the number of
additional resources required to perform the evaluation.
Observations were taken of the performance of an early prototype of the evaluation
procedure to produce an initial upper bound estimate of required schedule allocation. The
assumption was made that the initial non-prototype version of the procedure would take a
similar amount of time to implement in practice, as it was based on the same underlying
conceptual and structural framework. This estimate included time to seek backing resources for
which the need was not evident before beginning the procedure but became apparent at some
point before completion.
Estimates of scheduling requirements are applicable only in the working context in
which they were produced. Individual evaluators and evaluating organisations may need
somewhat different amounts of time to complete an evaluation, and it is therefore meaningless
to attempt to apply estimates produced in one evaluation scenario in a non-identical evaluation
scenario. It may be possible to establish baseline figures for an ideal working evaluation
environment, but these would embody minimal schedule requirements rather than those
expected to be found in the majority of non-ideal working environments.
Chapter 4: A theoretical evaluation method for process models
- 75 -
4.3 Chapter 4: Summary
This chapter presents a method for theoretical evaluation of software process quality models.
This may be applied to any set of software process quality models. Theoretical evaluation of
models is to be performed through analysis of the content of model definitions. Any set of
software processes may be considered in the case studies. Application of the theoretical
evaluation method produces results which are suitable for use in comparative evaluation of a set
of software process quality models, and from which a set of findings may be derived.
Chapter 5: An empirical evaluation method for process models
- 76 -
Chapter 5: An empirical evaluation method for process
models
5.1 Empirical evaluation approach
5.1.1 Empirical evaluation concepts
Empirical evaluation techniques are used to perform measurement of a process quality model in
the context of real-world usage, rather than a theoretical basis. It is required for validation of a
model, to ensure the theoretically validated content is useful, relevant and practically
implementable in actual usage. To ensure validity of findings, real software processes are
employed as case studies, rather than artificial case studies created solely for the purposes of
evaluation.
The focus of empirical evaluation procedures is generally to confirm or refute theories,
confirm that procedures established theoretically also work in practice, and to ensure that results
predicted through the application of theory are observed in reality. Generally empirical
evaluation is not used to establish or prove relationships between factors without the parallel
application of theoretical evaluation, as it is difficult to develop empirical studies with results
from which the underlying theoretical basis can be unequivocally derived. However, it is
equally important that any theoretically derived concepts can be shown to relate to observations
of elements in reality. Additionally, empirical observations can be utilised to establish
theoretical ideas which can then be subjected to further analysis.
5.1.1.1 Purpose of empirical evaluation
The primary purposes of empirical evaluation are to confirm the validity of proposed theories,
confirm that proposed methods are implementable in a realistic work context, and to identify
possible relationships for further investigation which could not be initially uncovered through
theoretical analysis. It is to ensure that the theory embodied in a model is an accurate and usable
representation and abstraction of the real world. An otherwise theoretically sound model will
not prove useful in actual usage if it is based on incorrect assumptions or produces results which
are not appropriate to the needs of the users. A process quality model would ideally derive a
realistic and representative measure of process quality in a form that is useful and meaningful to
the user of results, where rational argument can be used to link values of measured quality
attributes to a sound theoretical basis.
Implicit in this approach is the assumption that the model subject to evaluation is
founded on a defined theoretical basis, and is evaluated through application to case study
processes to establish measures of validity. If this is not the case, then empirical evaluation is

Chapter 5: An empirical evaluation method for process models
- 77 -
unlikely to yield results that bring increased understanding of the model or the case study
processes.
Although the focus of the empirical evaluation is the analysis of the process quality
models, a side-effect of case study execution is the production of quality measures of the case
study software processes. This allows the identification of possible areas of improvement and
weaknesses of the processes, in addition to an overall rating of quality in terms of the notion of
quality implicit in the process quality models.
5.1.1.2 Approaches to empirical evaluation
Empirical evaluation of a process quality model is achieved through the performance of a
number of case studies, taking the definition of the model and a number of case study processes
as inputs, resulting in the output of measures of quality of the input processes. Analysis is
performed on these output data to establish the comparative performance of the process quality
model relative to that of other evaluated processes in establishing a measure of quality
according to the notions of quality defined in the models. Through this approach it is possible to
compare the quality measurement findings of multiple models of a single process to identify
anomalous measures which require explanation, and to compare against previous expectations
of findings. The overall aim of this approach is to identify the extent to which different models
produce different measurements of quality in the context of an identical measured process.
The primary inputs to the evaluation process are documented definitions for each model
in the evaluation set, and a number of case study processes and their associated information
sources including documentation and direct observations. The identity and nature of input
processes influences the results obtained through process evaluation, but provided that typical
non-trivial processes are used the results of comparison are dependent only on the input model
content and not on the input process content. It is not sufficient for a process quality model to be
theoretically valid to be considered worthy of selection; it must also be suitable for practical
usage and yield useful and valid results in this context.
This approach does not require the evaluator to make reference to a defined notion of
quality independent of the evaluated models, instead using notions implicit in model definitions.
This approach is intended to evaluate the comparative performance observable of models in
real-world application. Examination of the quality level attributed to a given process by the
different models in the evaluation set allows the evaluator to establish the similarity of results.
This yields an indirect measurement of the similarity of content between models, where
it is thought that two models producing similar evaluation results are more likely to share
common content than two models producing dissimilar evaluation results. Similarity of results
can be compared at different levels of detail. The extent to which the different models produce
different evaluation results upon application to a given process is indicative of the extent to
which alternative models are required. If all models produce similar results, in practice there is
Chapter 5: An empirical evaluation method for process models
- 78 -
little to choose between them. If models produce dissimilar results, there is clearly a need for
model users to select the most appropriate and accurate model for their particular usage context.
5.1.1.3 Results to be obtained through empirical evaluation
The types of results that are obtained through empirical evaluation of a process quality model
are dependent on the selected procedure of evaluation. They can be split into two main
categories:
1. Measures dependent on model content. Measures of process content produced through
application of the model are of a nature and format defined by the content of the model.
2. Measures independent of model content. These include measures of issues relating to
the application of a model to a case study process, and measures of content common to
all models in the evaluation set.
Type 1 measures are useful in the analysis of a given software process, but are of limited use in
performing comparative evaluation of processes or models as the results set of one case study
may not be directly comparable with the results set of another. To become useful for
comparative evaluation, they must be translated into a common format. Those measurement
types that cannot be translated into a comparable format are not useful in performing
comparative evaluation and are to be disregarded in this context.
Using the selected analytical approach, a set of process quality models and a set of
processes are defined. Each possible pairing of where one element is selected from each set is
considered in the form of a case study. Each model is hierarchically decomposed into a set of
individual elements, each of which represents the lowest level of detail used in the model.
Information about the process is used to determine the level of conformance of the process to
each model element in turn, and the findings recorded. For each model, this produces a set of
results for each process, where results for processes evaluated by a given model are comparable,
but comparison cannot be made between models. Upon completion of a case study, for each
requirement in the element there exists exactly one result of the form ‘fulfilled / partially
fulfilled / not fulfilled’, for a particular pairing of process and model element. These are then
combined into a results set. Using the content and structure of the model, an overall rating of
process quality is produced for each process by each model, by composition of the contents of
the results set in accordance with the model definition. Both the results sets and measures of
process quality according to defined models are dependent on model content.
In order to perform comparison between models, it is necessary to translate the content
of the models and results of model application into a format common to all of the models. This
is achieved through mapping each element of a model to an equivalent element of a standard
reference model format, in essence presenting the content of the model in a standard format.
Each measured value of conformance of a process to a model element is also translated into the
common format. For each case study process, this results in a results set for each process quality

Chapter 5: An empirical evaluation method for process models
- 79 -
model in a common format, which may then be compared. This may be performed at two levels:
the level of each element of the standard model format, or at the level of the entire standard
model by collating the results for all elements.
Measures that are independent of model content relate to the evaluator’s findings of
model application. Both objective and subjective results can be produced. Objective measures
include time taken to perform measurement (a measure of efficiency and usability), and number
of model elements (a measure of model content depth). Absolute measures of the procedure of
model application are of course dependent on the assessor and assessment environment and as
such are limited in use, but provided these remain constant for all case studies compared then
the relative rankings provide a useful comparison. Subjective measures are harder to determine
accurately, and include relevance of model to process (is the model content aligned with the
intended purpose of the process), understandability (is the model readily meaningful to the
user), and the extent to which the model addresses the needs of the user. Therefore, it is
expected that the empirical evaluation procedure will yield the following results:
• Measures of process quality for each combination of process and process quality model,
at the level of the model element
• Measures of process quality for each combination of process and process quality model,
at the level of the entire model
• Measures of conformance of each case study process to each of the case study models
in a standard format, at the level of the standard model element
• Measures of conformance of each case study process to each of the case study models
in a standard format, at the level of the entire standard model
5.1.1.4 Hypotheses HE.a and HE.b for empirical evaluation
Null hypotheses used in the performance of this study are defined below:
Hypothesis HE.a: “For models in the evaluation set of models, no case study process
will be found to be more conforming and hence judged to be at a higher level of quality
than any other.”
If all processes in the evaluation set of processes are broadly similar in terms of content and
scope, and merely represent the same content and concepts in different ways and at different
levels of detail, this hypothesis will be found to be true by the experimental process. For each
model, this could indicate that each process was similar. However, if this is found to hold true
for a given model and not for others, it may show this given model to be less effective at finding
differences, or less prone to finding ‘false positive’ differences. In the case of models for which
this hypothesis is not found to hold true, this indicates that different models have different
content and measure different aspects of the process. In this situation, users of models would
need to evaluate candidate models to ensure the model was relevant to their specific needs and
usage context. If the hypothesis is found to be false for all models, this is indicative of
Chapter 5: An empirical evaluation method for process models
- 80 -
fundamental differences in the content of the processes. Users of processes would require
evaluation of process content to ensure compatibility with their requirements.
Hypothesis HE.b: “For each case study process, no model from the evaluation set of
models will be found to produce a higher rating of quality than any other.”
If this hypothesis holds true, this indicates that each model produces comparable results when
applied to an identical process. Regardless of how this is achieved, and which particular factors
are taken into consideration by individual models, this would indicate that the end-result as
presented to the user of each model is similar. Therefore, each model would be an equally
suitable choice in the context of assessment of the case study processes. However, if this
hypothesis is not found to hold true, this indicates that the measured level of process quality is
dependent on model quality, even though the process remains unchanged. This would indicate
that the content assessed by models and the method of assessment is different for members of
the evaluation set of models, and that the models have fundamental differences. Therefore, users
of process quality models would require evaluation of each candidate model to ensure the
selected model considered those areas of interest to the user prior to selection for deployment.
These can be summarised as follows:
• If hypothesis HE.a is refuted, there are fundamental differences in the content of
software processes. Otherwise, they may be considered similar.
• If hypothesis HE.b is refuted, there are fundamental differences in the content of
process quality models. Otherwise, they may be considered similar.
5.1.2 Approach of case study assessment
5.1.2.1 Approach of case study assessment
The purpose of this section is to outline the approach through which empirical evaluation of the
case study software processes and software process quality models is to occur. The approach
selected does not require the comparison of process content to a reference standard process, or
comparison of model content to a reference standard model. The main disadvantage of this
approach is it does not permit reliable measurement of absolute model quality, only the quality
of evaluated models relative to other evaluated models. However, as the primary purpose of this
study is the comparative evaluation of models this is not considered problematic.
This approach also avoids the need to identify an existing process or model which can
be considered objectively and accurately to possess all required quality attributes, or to possess
the highest proportion of known quality attributes of all known comparable entities. It is not
guaranteed that any entities exist that satisfy the former of these conditions. Determining
fulfilment of the latter condition would still require a separate mechanism for assessment of
relative quality to be applied to all existing entities within the scope of the study, which is not
thought to be feasible.
Chapter 5: An empirical evaluation method for process models
- 81 -
The approach of the empirical evaluation procedure is split into two distinct parts. The
first part involves the application of process quality models to software processes in case
studies, to perform evaluation of process quality. The second part involves comparison and
analysis of these results, to perform evaluation of model performance and quality.
Part one involves the evaluation of software processes against software process quality
models. A set of process quality models and a set of software processes are taken as primary
inputs. The content of each model is converted into a set of requirements of a software process.
Each possible pairing of model and process is considered as a separate case study, as defined in
Table N.4 of ‘Appendix N: Case study information’. For each case study, the content and
practice of the process is evaluated against each requirement of the model, and a value of
measured conformance is assigned from a scale appropriate to the model. When all model
requirements have been considered, the results are collated in a manner relevant to the structure
of the model definition, and a rating produced of process quality for the case study. Each case
study represents a pairing of model and process, and terminates with production of a results set
for conformance to model requirements and an overall rating of process quality.
Part two involves comparison of the case study results from part one. The content of
each evaluation model is converted into a standard form of presentation, so that the content of
the original model is retained but the structure of presentation is standardised. Results sets from
part one are converted to this standard format. This allows comparison of model performance in
a production environment. Model findings can be compared at the level of the standard model
clause, and at the level of the entire model. This allows the evaluator to determine if each model
produces similar results when applied to the same process, or otherwise. This performs
measurement of the level of similarity of content between the models. This establishes or
disproves the necessity for consideration of alternative models, as if all models perform
identically then any model of the evaluation set could be considered an equally valid choice.
Otherwise, the user of a quality model needs to perform evaluation to establish which model
achieves greatest fulfilment of use requirements. Measurement is also made of the extent to
which the content of each model is applicable in the context of the case study processes. Models
with a greater amount of irrelevant content may be considered to be of lower quality.
5.1.2.2 Input resources to empirical evaluation procedure
5.1.2.2.1 Evaluation set of process quality models
Each of the models identified as members of the evaluation set of process quality models in
Appendix M Table M.1 are to be considered using the empirical evaluation procedure. As these
models are broadly compatible in terms of scope both within the evaluation set and with the
aims of the defined evaluation procedure, there are no logical reasons why any members of the
evaluation set would be unsuited to evaluation through this procedure.
Chapter 5: An empirical evaluation method for process models
- 82 -
Where available, guidelines for application of the quality models were used. These
usage guidelines define requirements of the correct procedures to apply when measuring a
software process with a specific software process quality model. Usage of these guidelines
ensures that the process quality model is utilised correctly and in keeping with the intentions of
the model designer, thereby ensuring that the results of model application are an accurate
representation of the level of conformance of the process to the quality theory enshrined in the
model definition.
In the completion of case studies for model 1, ‘ISO 9001:1994 / ISO 9000-3’, results
sets were also produced for evaluation of the software processes with the ‘ISO 9001:1994’
[ISO9001] process quality model without application of the ‘ISO 9000-3’ [ISO9000-3]
guidelines. This allows comparison of results with and without the usage guidelines, and
examination of the extent to which the usage guidelines alter the observed results produced by
the evaluation procedure. ‘ISO 9001:1994’ without ‘ISO 9000-3’ is referred to as model ‘0’. It
represents a generic model which is not specifically intended for application in the domain of
software engineering, but can nevertheless be used in this context. As the scope of model 0 is
different to that of the other models, it is not considered in most evaluation types, and is
considered only for purposes of comparison.
5.1.2.2.2 Evaluation set of software processes
A set of software processes is selected in accordance with the requirements defined in
‘Appendix N: Case study information’. The evaluation set of software processes under
consideration is defined in Table N.2. Each process in this set is within the scope of this study,
and within the scope of each process quality model defined in Table M.1. Therefore, each
process in the evaluation set is suitable for usage in the empirical evaluation procedures. The
process of selection of software process is examined in Appendix N; a summary is provided
below.
Two distinct, independent software processes were selected for use in case studies. It
was deemed insufficient to use only one process, due to the risk of confounding of results due to
the effects of model content and the effects of process content, when the two are considered
together in case studies. The use of multiple processes allows the identification of similarities
and differences when the same procedure and models are utilised to mitigate this effect.
A number of requirements were defined of a software process to be taken into account
when selecting the case study processes, in Table 5.1. These were developed to ensure that
meaningful and usable results were obtained through the application of assessment procedures.
It was necessary to select procedures that were sufficiently well developed that at least a
minimal level of conformance with the content element of the process quality models could be
expected to be observed, in order to permit the obtaining of results for which there was a
possibility of different findings when performing comparative analysis. In addition, it was

Chapter 5: An empirical evaluation method for process models
- 83 -
deemed necessary for processes to be based on Software Engineering principles, otherwise they
would be beyond the scope of some of the process quality models (listed in ‘Appendix M: Case
study process quality model selection’ Table M.1) and would yield meaningless results.
�
���������� ��� ������
���� ����������������� ����������������������������
���� ����������������������������������������������������
���� ���������������������������������������������� �����������������
���� �������������������������������
���� ������������������������������������������
���� ����������������������������������������������
���� ��������������������������������������������������������������
���� ��������������������������������
���� �������������������������������������������
����� ����������������������������� �
����� ��������������������������������������������������
����� ������������������������������������������������������������� �����
��������
����� �������� ��� � ����� ��������� ���� �� �������� �������� ������� ����
���������������������������
����� ��������������������������������������� ����������������������
����� ��������������������� ������������������������������������������
������������������������ �
Table 5.1: Requirements of a case study process
5.1.2.2.3 Model and process source materials and resources
In conducting the empirical evaluation of the case study processes and the evaluation set of
process quality models, a number of resources are utilised. The evaluation set of process quality
models defined in ‘Appendix M: Case study process quality model selection’ Table M.1 was
used, in addition to the evaluation set of software processes defined in ‘Appendix N: Case study
information’ Table N.2.
The sources used in this study are listed in ‘Appendix A: Information sources for
theoretical evaluation’ and ‘Appendix N: Case study information’. Information sources for
process quality models include model definition documentation and usage guidelines.
Information sources for software processes include process documentation and direct
observational study.
Usage guidelines for the process quality models in the evaluation set were not
considered to be primary inputs to the evaluation procedure, as their content relates only to the
application of model content, and does not bear upon the nature of the content itself. However,
where available, usage guidelines were utilised in performing the case studies to ensure the
model is correctly applied and to minimise the misunderstanding or misapplication of the model
by the assessor. The usage guideline utilised in these case studies were those created by the
organisations responsible for the design of the models, and are discussed in ‘Appendix O:
Process quality model usage in case studies’.

Chapter 5: An empirical evaluation method for process models
- 84 -
The use of supporting resources which were not directly associated or constituent
elements of the processes or models to which they relate were minimised wherever possible.
Resources were preferred where the organisation of origin is the same as that responsible for the
publication of the model or the implementation of the process, as it is assumed that this
organisation is the highest authority on this item.
5.1.2.3 Model requirements set derivation
Each model in the evaluation set is defined with a different format. The content of each model is
divided and categorised in a different manner, in accordance with the defined structure of the
model. In order that a single procedure can be defined for the application of each process to a
model, the content of each model is converted into a set of requirements. Each requirement
represents the lowest level of content definition in the relevant model, to which a process must
conform in order to possess quality attributes. In production of this set of requirements for each
model, it is assumed that each model element is given equal weighting and is considered to be
of equal importance and influence on the final result obtained from application of the entire
model. Each model content element is assigned a unique identifier.
5.1.2.4 Model measurement scales
A given process quality model may use any form of measurement scale, in measuring the level
of conformance of an observed process to the notions and attributes of quality implicit in the
definition of the model. The measurement scale for each model is therefore taken from the
respective model definition. A value from this scale is assigned to each model content element
through the process of application of the model to a process. Appropriate measurement scales
derived from model content are defined in ‘Appendix O: Process quality model usage in case
studies’.
5.1.3 Procedure of empirical evaluation
5.1.3.1 Empirical evaluation procedure
The experimental method is divided into a number of steps which are to be undertaken in
numerical order. At any stage, the party executing the experimental method is to record in an
appropriate format any observations, experiences, relevant and justifiable opinions, and
identified strengths and weaknesses of the process quality model. The level of detail used in
recording these observations is commensurate with their perceived importance. These
observations, recorded informally, may not relate directly to the evaluation process but are
nonetheless useful in performing model evaluation.
Chapter 5: An empirical evaluation method for process models
- 85 -
5.1.3.2 Empirical evaluation procedure: Evaluation of processes
The output of part one of the experimental process is a set of case study result sets. Each
possible combination of process and model is evaluated in a case study, resulting in as many
evaluations of the quality of each process as there are members of the set of models. The results
for each process evaluated with a given model are presented in an identical format. However,
the format of presentation varies within models as the structure and content of each model
cannot be assumed to be identical. The results will take the general form of an overall rating of
process quality, and a measure of the proportion of model content requirements that have been
found to be satisfied. Any results which do not fit in this structure are to be presented separately,
to accompany results presented in the defined format.
The inputs to this method are the definitions and sources for each model (see ‘Appendix
A: Information sources for theoretical evaluation’ and ‘Appendix M: Case study process quality
model selection’), and the information sources for each process (see ‘Appendix N: Case study
information’ and ‘Appendix O: Process quality model usage in case studies’). The primary
outputs of this procedure are a set of case studies, referred to as 1a, 1b, 2a, 2b, 3a and 3b. Each
case study contains a results set, which maps each model content element to exactly one value
from the model measurement scale, as appropriate to the content of the case study process. The
possible values that can be assigned are dependent on the model, as defined in Appendix O.
Each pairing of model and process is considered in isolation. The set of software
processes to be used is defined in Table N.2. The set of process quality models to be used is
defined in Table N.3. The set of case studies to be performed is defined in Table N.4. The
following procedure is repeated for each model in the evaluation set:
1. Select the next model from the evaluation set. Acquire model definition documents,
measurement scale and associated resources.
2. The following steps are performed on each process in the evaluation set:
a. Select the next software process from the evaluation set
b. Acquire software process information sources
c. Repeat the following actions for each model content element:
i. Select next model content element
ii. Consider the extent to which the software process satisfies the
requirement of the model content element
iii. Assign a value from the measurement scale (as found in Appendix O),
mapping the model content element to a value in the measurement scale
for this software process.
iv. If more model content elements exist that have not yet been considered,
repeat from step 2.c.i onwards. Otherwise, proceed to step 2.d.
d. Collate results for this case study into a results set.
e. Perform analysis of the results of this case study.
Chapter 5: An empirical evaluation method for process models
- 86 -
f. If more software processes remain that have not yet been considered, repeat
from step 2.a onwards. Otherwise, proceed to step 3.
3. Perform analytical comparison of results sets for case studies of different processes for
this model.
4. If there remain any models that have not yet been considered, repeat procedure from
step 1 onwards. Otherwise, proceed to step 4.
The low-level details of the results can be found in Appendices P, Q and R for models 1, 2 and
3 respectively.
5.1.3.2.1 Analytical procedure for software process evaluation
For each pairing of model and process, a case study results set is produced. This contains a
mapping from each model content element to exactly one value in the relevant measurement
scale. This results set is examined against the content of the model and usage guideline
procedures, to establish a measured level of quality of the process for this model. In addition,
for each of the values in the measurement scale it is possible to count the number of model
content elements with which there is a mapping. This provides another measure of process
quality, for example by finding the proportion of requirements that were satisfied. Examination
of the internal coherence of the results set allows examination of the content of the model as it is
applied in the context of each process to determine internal consistency. Strengths and
weaknesses of the process can be established.
Analysis is then performed between the results sets for processes for a given model, to
determine which process can be considered to be of a higher quality in the context of this
model. Results of this procedure confirm or refute hypothesis HE.a.
5.1.3.3 Empirical evaluation procedure: Comparison of case
study results
The purpose of this evaluation stage is to compare the results produced in the case studies, in
order to perform comparative evaluation of the processes and of the models. Each model has a
structure and content identity that is specific to a given model. Results sets are structured in
accordance with the structure of the model, and therefore are also specific to a given model. In
order to perform comparison on a fair, like-for-like, and scientifically valid basis, it is essential
to transform model definitions and model application results sets into a standard structural
format.
The inputs to this evaluation step are the case study results sets produced in part one of
the empirical evaluation procedure, model definitions (see ‘Appendix A: Information sources
for theoretical evaluation’), and procedures for mapping elements and results between models
(see ‘Appendix H: Mapping between elements of quality models’ and ‘Appendix I: Results of
mapping between quality models’). The primary outputs are a requirements set for each case

Chapter 5: An empirical evaluation method for process models
- 87 -
study, derived from and representing the same underlying information but presented in an
identical, comparable standard format.
The technique for performing mapping between elements of different process quality
models is considered in ‘Appendix H: Mapping between elements of quality models’. The
results of application of the procedures in Appendix H are found in ‘Appendix I: Results of
mapping between quality models’. The utilisation of these mappings and procedures allows the
transformation of model content elements structure, model measurement scale, and results of
application of model to process, into a standard reference format. The following procedure is
repeated for each case study performed in part one of the empirical evaluation procedure:
1. Select the next case study from the set
2. Take the set of model content elements for the model used in the case study. Apply the
procedure outlined in ‘Appendix H: Mapping between elements of quality models’ to
convert model content into standard format. (The results of this are provided in
‘Appendix I: Results of mapping between quality models’)
3. Take the measurement scale for the model used in the case study. Apply the procedure
outlined in ‘Appendix H: Mapping between elements of quality models’ to convert
scale content into standard format.
4. Take the set of results for application of the model to the process used in the case study.
Apply the procedure outlined in ‘Appendix H: Mapping between elements of quality
models’ (and the inter-model mappings provided in ‘Appendix I: Results of mapping
between quality models’) to convert the results set into the standard format
5. If there remain any case studies that have not yet been considered, repeat procedure
from step 1 onwards. Otherwise, proceed to step 6.
6. Perform comparative evaluation of the results of each model for each content element
of the standard process structure, for each software process considered.
Results sets for case studies transformed into standard format can be found in Appendix S.
5.1.3.3.1 Analytical procedure for comparative evaluation of case
study results
These analytical procedures are performed primarily to compare the performance of the process
quality models in the evaluation set. Comparisons of the findings of each model at the level of
the clauses of the standard model format are presented in ‘Appendix T: Clause analysis of case
studies in standard format’. Mapping models into a standard format retains the meaning present
in the original model definitions, but presented in a different structure. It is therefore possible to
perform two types of comparison of results. Section 5.1.3.4 summarises procedures for
transforming case study results set into a format suitable for comparison and the subsequent
analysis of transformed results sets. These methods are discussed in greater depth in Appendices
H and T respectively.
Chapter 5: An empirical evaluation method for process models
- 88 -
It is possible to identify if different models produce a different quality rating upon
application to an identical process. This performs measurement of the extent to which the
content of the models differs. If multiple models produce dissimilar evaluation results when
applied to the same process, this indicates that the content of the models are different and that
the users of models must select an appropriate model. However, if the results are similar, this
may indicate that there is little to choose between the models, and that any model producing
similar results may be considered an equally acceptable choice. Results of this procedure
confirm or refute hypothesis HE.b.
5.1.3.4 Transforming case study results into a format for
comparison
Techniques for comparison of case study results at the level of the individual model element and
the entire model are examined in Appendix H. Techniques for the analysis of case study result
sets transformed into the standard model format are examined in Appendix T. Summaries of
these techniques are presented below.
5.1.3.4.1 Technique for comparison of case study results: Process
rating by model element
For each model, the mapping of model elements to a standard model is used. ISO9001 is
selected as the standard model using the procedure outlined in 4.2.3.5.2. A definition of the
model is to be produced from the reorganisation of the model elements into the structure of the
standard model and its model elements.
Results of process assessment from case studies for model elements are then to be
grouped according to this mapped standard model structure. Satisfaction of ISO9001 model
elements is determined on a {unsatisfied, satisfied} scale. Therefore, it is determined if each
standard model element is ‘satisfied’ or ‘unsatisfied’ by examining the process analysis results
for each model element mapped to the ISO9001 model element.
Satisfaction of the standard model element is achieved if the assessment results
associated with all model elements mapped to the ISO9001 element are at a level of ‘satisfied’.
If any mapped elements achieve a rating of ‘unsatisfied’, then the entire ISO9001 model
element is deemed to have achieved a rating of ‘unsatisfied’. However, it is possible to obtain
other useful information, for example the proportion of mapped requirements which are
‘satisfied’ and the proportion of mapped requirements which are ‘unsatisfied’.
The process through which satisfaction of the mapped elements is established is
dependent on the scale used to rate satisfaction in the source model. If conformance to elements
of the source model is measured on a scale of {unsatisfied, satisfied} (as is the case for
ISO9000-3 and CMM elements) then this value is simply transferred unaltered into the mapped
version.
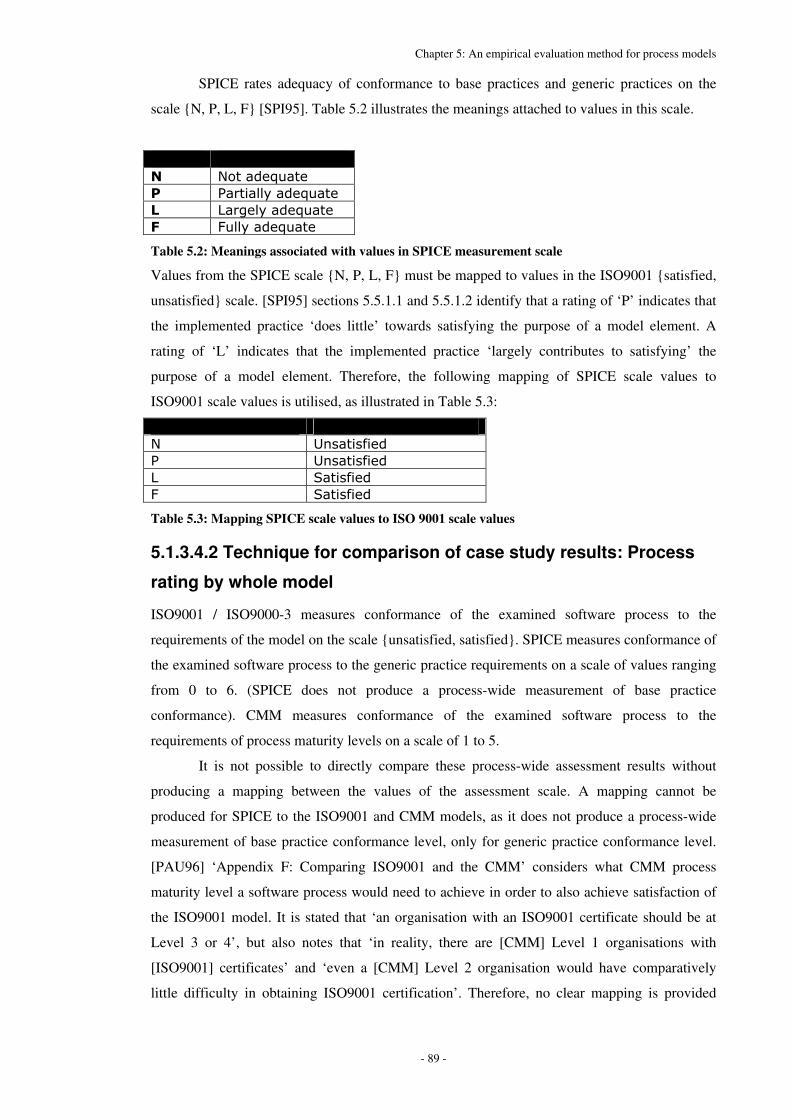
Chapter 5: An empirical evaluation method for process models
- 89 -
SPICE rates adequacy of conformance to base practices and generic practices on the
scale {N, P, L, F} [SPI95]. Table 5.2 illustrates the meanings attached to values in this scale.
������ ������
� �����!����
�� ���� ���!����
!� "��� ���!����
"� #� ���!����
Table 5.2: Meanings associated with values in SPICE measurement scale
Values from the SPICE scale {N, P, L, F} must be mapped to values in the ISO9001 {satisfied,
unsatisfied} scale. [SPI95] sections 5.5.1.1 and 5.5.1.2 identify that a rating of ‘P’ indicates that
the implemented practice ‘does little’ towards satisfying the purpose of a model element. A
rating of ‘L’ indicates that the implemented practice ‘largely contributes to satisfying’ the
purpose of a model element. Therefore, the following mapping of SPICE scale values to
ISO9001 scale values is utilised, as illustrated in Table 5.3:
#�$%&�� ����'����� $#(������ ����'�����
� $����������
�� $����������
"� ���������
#� ���������
Table 5.3: Mapping SPICE scale values to ISO 9001 scale values
5.1.3.4.2 Technique for comparison of case study results: Process
rating by whole model
ISO9001 / ISO9000-3 measures conformance of the examined software process to the
requirements of the model on the scale {unsatisfied, satisfied}. SPICE measures conformance of
the examined software process to the generic practice requirements on a scale of values ranging
from 0 to 6. (SPICE does not produce a process-wide measurement of base practice
conformance). CMM measures conformance of the examined software process to the
requirements of process maturity levels on a scale of 1 to 5.
It is not possible to directly compare these process-wide assessment results without
producing a mapping between the values of the assessment scale. A mapping cannot be
produced for SPICE to the ISO9001 and CMM models, as it does not produce a process-wide
measurement of base practice conformance level, only for generic practice conformance level.
[PAU96] ‘Appendix F: Comparing ISO9001 and the CMM’ considers what CMM process
maturity level a software process would need to achieve in order to also achieve satisfaction of
the ISO9001 model. It is stated that ‘an organisation with an ISO9001 certificate should be at
Level 3 or 4’, but also notes that ‘in reality, there are [CMM] Level 1 organisations with
[ISO9001] certificates’ and ‘even a [CMM] Level 2 organisation would have comparatively
little difficulty in obtaining ISO9001 certification’. Therefore, no clear mapping is provided
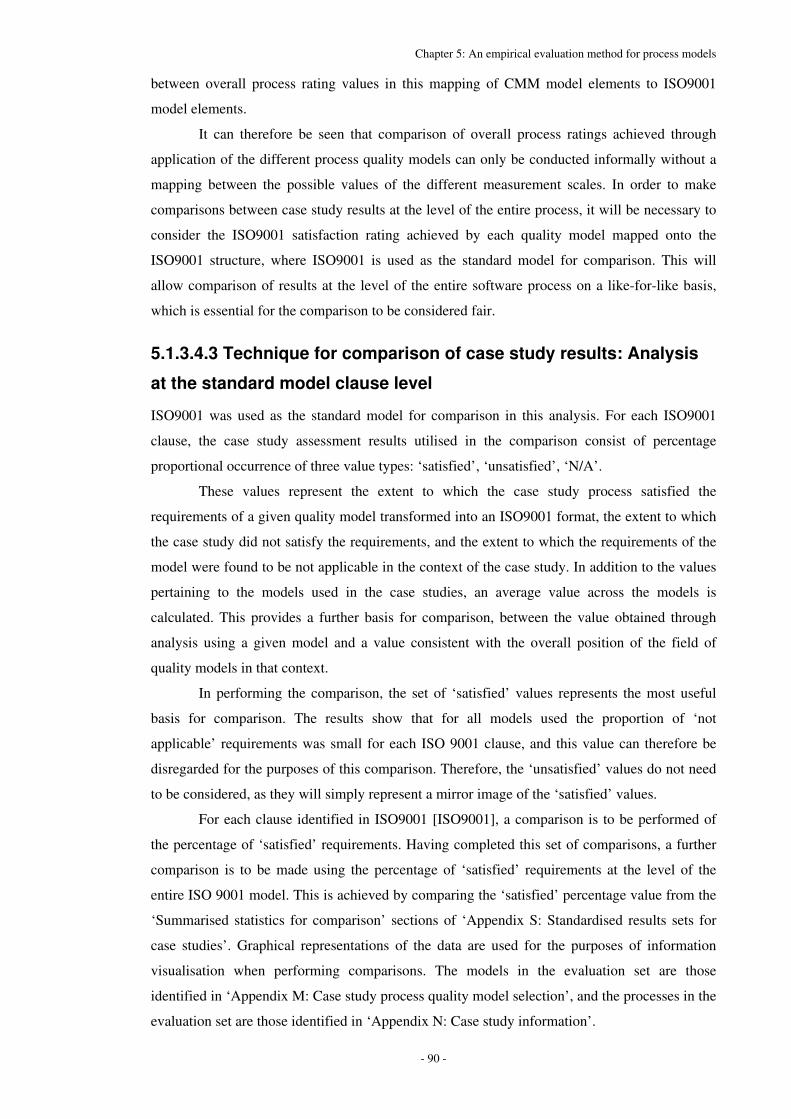
Chapter 5: An empirical evaluation method for process models
- 90 -
between overall process rating values in this mapping of CMM model elements to ISO9001
model elements.
It can therefore be seen that comparison of overall process ratings achieved through
application of the different process quality models can only be conducted informally without a
mapping between the possible values of the different measurement scales. In order to make
comparisons between case study results at the level of the entire process, it will be necessary to
consider the ISO9001 satisfaction rating achieved by each quality model mapped onto the
ISO9001 structure, where ISO9001 is used as the standard model for comparison. This will
allow comparison of results at the level of the entire software process on a like-for-like basis,
which is essential for the comparison to be considered fair.
5.1.3.4.3 Technique for comparison of case study results: Analysis
at the standard model clause level
ISO9001 was used as the standard model for comparison in this analysis. For each ISO9001
clause, the case study assessment results utilised in the comparison consist of percentage
proportional occurrence of three value types: ‘satisfied’, ‘unsatisfied’, ‘N/A’.
These values represent the extent to which the case study process satisfied the
requirements of a given quality model transformed into an ISO9001 format, the extent to which
the case study did not satisfy the requirements, and the extent to which the requirements of the
model were found to be not applicable in the context of the case study. In addition to the values
pertaining to the models used in the case studies, an average value across the models is
calculated. This provides a further basis for comparison, between the value obtained through
analysis using a given model and a value consistent with the overall position of the field of
quality models in that context.
In performing the comparison, the set of ‘satisfied’ values represents the most useful
basis for comparison. The results show that for all models used the proportion of ‘not
applicable’ requirements was small for each ISO 9001 clause, and this value can therefore be
disregarded for the purposes of this comparison. Therefore, the ‘unsatisfied’ values do not need
to be considered, as they will simply represent a mirror image of the ‘satisfied’ values.
For each clause identified in ISO9001 [ISO9001], a comparison is to be performed of
the percentage of ‘satisfied’ requirements. Having completed this set of comparisons, a further
comparison is to be made using the percentage of ‘satisfied’ requirements at the level of the
entire ISO 9001 model. This is achieved by comparing the ‘satisfied’ percentage value from the
‘Summarised statistics for comparison’ sections of ‘Appendix S: Standardised results sets for
case studies’. Graphical representations of the data are used for the purposes of information
visualisation when performing comparisons. The models in the evaluation set are those
identified in ‘Appendix M: Case study process quality model selection’, and the processes in the
evaluation set are those identified in ‘Appendix N: Case study information’.
Chapter 5: An empirical evaluation method for process models
- 91 -
The criteria used in performing comparison are:
• Are the results from all models in agreement?
• What is the overall level of satisfaction of model elements, as indicated by the results of
assessment?
• Are the results of all models when transformed into ISO9001 format in agreement with
the results produced using the original ISO9001 [ISO9001] model?
• Are the results of ISO9001/ISO9000-3 in agreement with the results of ISO9001?
(ISO9000-3 is intended to provide guidelines for the application of ISO9001, rather
than modify the basic content and meaning of the model)
• What range of values are observed from the assessment of the case study process using
the models transformed into ISO9001 format?
• What proportion of the model requirements is deemed to be non-applicable in the
context of the case study?

Chapter 5: An empirical evaluation method for process models
- 92 -
5.1.4 Determining success level of empirical evaluation
5.1.4.1 Source and rationale for criteria for success for
empirical evaluation procedure
The set of criteria for success is derived from the basic requirements of the empirical evaluation
procedure. It is considered essential that the procedure produce reliable assessments of process
quality, and comparison of the results of application of multiple models to a process, from the
primary inputs of definitions and backing information for the evaluation set of models and the
set of case study processes. It is important that the procedure leads to the obtaining of feasible
results that allow the confirmation of the hypotheses under investigation, or refutation in a
manner that can be traced to content elements of the models and processes. Otherwise, faith
placed in evaluation results would be misplaced. It is also important to consider issues relating
to the practicality of the defined evaluation method such as scheduling, as a procedure that is
theoretically sound but impractical or impossible to implement in practice is of limited use and
should therefore not be considered to be of high quality.
5.1.4.2 Criteria for success for empirical evaluation procedure
The criteria for success of the empirical evaluation procedure as applied to the process quality
models and software processes are defined in the following set, in Table 5.4:
$)��*���� ��� ������
%&+�� �����������������������������
%&+�� ������������������������������������!��� �
%&+�� ��������������������������� ����� ���������%�&�����������������
�����������
%&+�� ��������������������������� ����� ���������%�&������������������
�����������
%&+�� ������������������������������������������������
%&+�� ����������������������������������������������!��� �������
%&+�� ���������������������������������������������������������������
%&+�� �������� ���������� ����� � �������������� ���� ��� �������� ��������
!��� �������
%&+�� �������� ���������� ����� ���� �������� ����������� ��� ��������
���������������������������!��� ������
%&+��� �������� ���������� ��������� ��������������� ��� ��������!��� �
������������������
%&+��� �������� ���������� ��������� ���������� ����������� ������� ����
������������������������������
%&+��� �������� ���������� ��������� ���������� ����������� ������� ����
��������������������������������������
%&+��� �������� ���������� ��������� ������� ����� ���������� ������ ����� �
��������������������������������������
%&+��� ������������������������������������������������������
%&+��� ��������������������������������������������������
Table 5.4: Criteria for success for empirical evaluation procedure
Chapter 5: An empirical evaluation method for process models
- 93 -
5.1.4.3 Schedule for empirical evaluation
It is important in the practical deployment of an evaluation procedure for there to be some
awareness of scheduling requirements, so that organisational issues may be considered and to
allow tracking of progress towards completion and delivery of results and findings. The
procedure used for empirical evaluation involves the application of the process quality models
to the case study processes. The process quality model definitions are converted into a set of
requirements prior to application, where each requirement is associated with the lowest level of
detail in the model definitions as supplied. The number of elements in the requirement set may
vary greatly between models.
As each model may contain a different number of content elements, it is expected that
different amounts of time would be required for their application. It is assumed that, for each
requirement for a model, it takes approximately the same amount of time to evaluate the level of
conformance observed in any software process. Therefore, provided the evaluation procedure is
identical in each case, it would be expected that the time required to perform an evaluation
would be proportional to the number of content elements in the model, and independent of the
process under investigation.
5.2 Chapter 5: Summary
This chapter presents a method for empirical evaluation of software process quality models.
This may be applied to any set of software process quality models. Empirical evaluation of
models is to be performed through the application of software process quality models to
software processes in case studies. Any set of software processes may be considered in the case
studies. Application of the empirical evaluation method produces results which are suitable for
use in comparative evaluation of a set of software process quality models, and from which a set
of findings may be derived.
Chapter 6: Software support tool development
- 94 -
Chapter 6: Software support tool development
6.1 Overview of software support tool development The purpose of this chapter is to document the process through which a software tool designed
to support the appraisal, measurement and improvement of a software process is developed. In
the initial stages, the need for a software support tool is identified. Following this, consideration
is given to the identification of the requirements of the software tool. This includes the
consideration of issues such as required functionality, expected usage scenarios, criteria for
success, and evaluation of the finished product. The requirements set used as an input to the
design process is developed through an iterative process, and considers mainly the functional
requirements of the system divided into a number of defined categories. Evaluation takes place
largely through the application of the software tool in case studies, and is closely linked with the
iterative development methodology selected for deployment in the development process.
6.1.1 Reason for software tool creation
The appraisal of a software process through the application of a software process quality model
should be implemented through a defined and carefully designed procedure, for which a number
of key attributes are identified. Results obtained must be repeatable, in turn requiring the
appraisal procedure to be repeatable. Efficiency is also important, as appraisal procedures may
generate large amounts of data to stored, managed and processed. The field of data processing
and data management is one in which information technology solutions have been found to
excel. By reducing the bureaucratic and administrative overheads, appraisal procedures may be
executed more efficiently with completion dates brought forward correspondingly. Software
support tools may also perform checking and validation of data as it is entered according to
predefined rules, restricting the introduction of erroneous or anomalous information into project
databases.
6.1.2 Feasibility of automation
Typically, the process of applying a software process quality model to a software process for the
purpose of measuring quality will consist of repeated application of an investigative and
analytical procedure to the software process, where these actions are repeated for each element
present in the software process quality model. A working practice which consists of repeated
execution of an unchanging procedure is an ideal candidate for automation. The format of
information collected can typically be established before the implementation of the study
commenced, remaining unchanged throughout. Therefore, automation of the procedures for the
capture, storage, processing and retrieval of information is feasible.

Chapter 6: Software support tool development
- 95 -
6.1.3 Development methodology
The ‘rapid prototyping’ approach was selected, as recommended by Brooks [BRO87]. A
requirements set is derived through an iterative process. The customer is presented with a
partially functioning prototype, which is then trialled and feedback used to refine and develop
the requirements set and to drive the development process. When the customer believes that all
of their requirements, stated both explicitly and implicitly, have been addressed the prototype
system is ‘thrown away’. A system is then developed to implement the derived requirements
set, but is built on solid software engineering principles and practices.
The rapid prototyping approach allows ideas to be tested in response to experience, and
then either removed or developed further, and is well suited to an experimental approach.
Defining requirements through practical experience ensures the requirements set meets actual
rather than perceived user needs. Development terminated when the prototype embodied a
workable set of user requirements, as replacement of the prototype with new software products
would not bring further concept development or contribute additional results for analysis of
success criteria.
6.2 System scope and requirements The overall scope of the software tool is to provide support for the analysis of an existing
software process and the performance of activities to improve this process using a recognised,
established and defined software process quality model. Software process quality assessment
and software process improvement are typically approached as two concepts that are distinct yet
related. Therefore, within the scope of the software tool both issues should be supported in a
manner where they are considered to be distinct and yet related.
It is intended that the focus of the system to be developed is automated support for
process appraisal and process improvement, as applied specifically in the context of the
software development and maintenance process. It is therefore necessary to limit the scope of
the software tool to the domain of software engineering. An automated support environment is
created for the management of a software process with an emphasis on process improvement.
Therefore, the developed software tool is given the name ‘PIE’ (Process Improvement
Environment).
6.2.1 Expected usage context
At the broadest level of detail, it is expected that the system be used by an individual involved
with the management of a single software process implemented throughout an organisation. The
design of the system took this general concept into account, in particular during the early stages
of development. During the process of iterative requirements refinement, the system was more
closely tailored to a specific usage context based on feedback from practical application of the
Chapter 6: Software support tool development
- 96 -
software tool to a number of case study process evaluations. Two main usage scenarios are
identified:
1. Usage in completing case studies of application of software process quality models to
software processes
2. Usage in production environment in management of a software process
6.2.2 Requirements
Requirements can be divided into two main categories:
• Functional requirements: Specify the functionality and behaviour of the system, but not
how this is to be achieved in practice as this information is left as a detail to be resolved
in the process of design
• Non-functional requirements: Specify attributes of the system and system performance
that do not directly impact upon functionality issues
The functional requirements sets FR1-FR11 are defined in ‘Appendix K: Software tool
functional requirements’. In total, 47 functional requirements were derived through application
of the prototyping approach and trial usage in case studies.
6.3 System design
6.3.1 Translating requirements into an implementable design
The development process is intended to translate the defined functional requirements into an
executable implementation, subject to the defined criteria for success. This cannot be performed
directly, and therefore a system design must first be defined as an intermediary stage between
requirements definition and system implementation.
Design definitions are also considered to be a product of the software process. The creation of a
design involves consideration of defined sets of requirements and criteria for success. System
architectures are selected to act as a framework for designed elements. Candidate technologies
are selected and evaluated for appropriateness. Finally, each defined requirement is translated to
elements in the design. The design has an appropriate level of abstraction, where the
functionality of the system is considered without reference to low-level implementation details.
Upon completion of the design, this can be translated into a set of software products constituting
the implementation which is then subjected to the process of evaluation. If system requirements
are modified, this requires propagation of the change through the design, implementation and
evaluation phases, depending on which stage has been reached at the point of requirement
modification.

Chapter 6: Software support tool development
- 97 -
Client layer
Application layer
Server layer
Highest level
Lowest level
Web browser client
Software tool and scripting
language
Database server
6.3.2 Architecture and technologies
It is required by some process quality models (e.g. SW-CMM [PAU93]) that all data and
resources related to the evaluation of a software process are maintained in a single, centralised
database. It is logical to implement this process database using a software database, as this is the
technological solution most closely matched to these needs.
A number of system architectures are commonly deployed in conjunction with a
centralised database. The ‘client-server’ model was selected, as a number of database server
tools already exist and can therefore be used without modification. This allows the developer to
concentrate on the client and allows reuse of existing proven technology.
It was found that a ‘web application’ was the most appropriate form of system to
develop as the prototype. This approach allows the use of existing database technologies and the
use of existing web browser software as a client, reducing the amount of code to be developed
to be that which is specific to the required functionality of the system. Therefore, the
‘application layer’ which is found between the ‘database layer’ and the ‘client layer’ of the
‘three-tier architecture’ commonly used in web applications is the layer containing code that is
specific to the implementation of the required functionality of the system, as illustrated in
Figure 6.1.
Figure 6.1: Layered system architecture model
The application layer contains code specific to the functionality of the developed system, and
acts as an intermediary between the client and the server. This approach allows significant reuse
of existing technologies.
6.3.3 Representation of model data
The quality model is divided into its constituent elements at the level of the smallest distinctly
identifiable section. Results of analysis are defined in terms of the extent to which the analysed
software process satisfies the requirements of each section of the quality model against a
predefined scale.
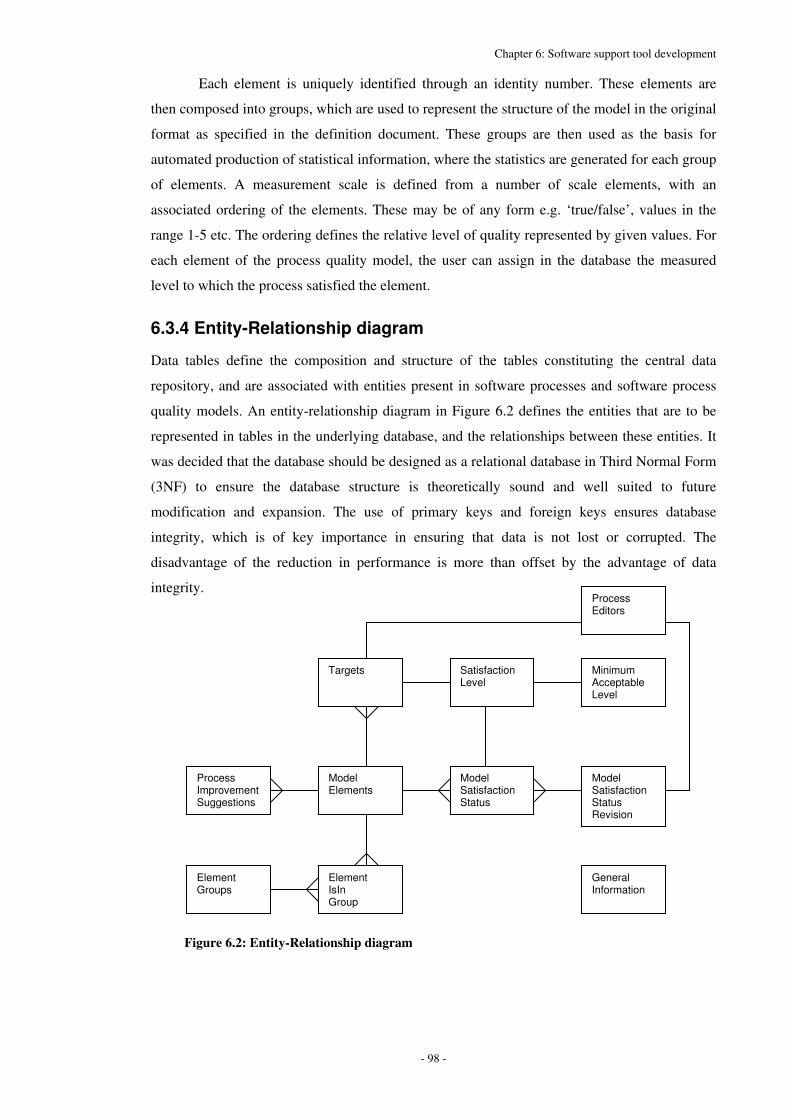
Chapter 6: Software support tool development
- 98 -
Process Improvement Suggestions
Model Satisfaction Status
Model Satisfaction Status Revision
Targets Satisfaction Level
Minimum Acceptable Level
Process Editors
General Information
Model Elements
Element IsIn Group
Element Groups
Figure 6.2: Entity-Relationship diagram
Each element is uniquely identified through an identity number. These elements are
then composed into groups, which are used to represent the structure of the model in the original
format as specified in the definition document. These groups are then used as the basis for
automated production of statistical information, where the statistics are generated for each group
of elements. A measurement scale is defined from a number of scale elements, with an
associated ordering of the elements. These may be of any form e.g. ‘true/false’, values in the
range 1-5 etc. The ordering defines the relative level of quality represented by given values. For
each element of the process quality model, the user can assign in the database the measured
level to which the process satisfied the element.
6.3.4 Entity-Relationship diagram
Data tables define the composition and structure of the tables constituting the central data
repository, and are associated with entities present in software processes and software process
quality models. An entity-relationship diagram in Figure 6.2 defines the entities that are to be
represented in tables in the underlying database, and the relationships between these entities. It
was decided that the database should be designed as a relational database in Third Normal Form
(3NF) to ensure the database structure is theoretically sound and well suited to future
modification and expansion. The use of primary keys and foreign keys ensures database
integrity, which is of key importance in ensuring that data is not lost or corrupted. The
disadvantage of the reduction in performance is more than offset by the advantage of data
integrity.
Chapter 6: Software support tool development
- 99 -
6.4 System implementation
6.4.1 Development environment
Development was performed using Sun Solaris, Microsoft Windows 2000 and emacs, with
access to an existing web server with support for PHP and MySQL database server. An existing
third-party web server and database server were used in order to simulate an expected typical
deployment scenario for the software, where the software would be installed on an
organisation’s intranet. The PHP scripting language was selected as it offers good integration
with the MySQL database system and allows development of a web application system,
accessed through a WWW browser.
6.4.2 Project configuration management
A manual project configuration management system was used where daily backups of files are
taken, and major updates are preceded by a dated backup. Tools such as CVS and RCS were
considered but rejected.
6.4.3 Platform issues
System input and output is performed through the use of HTML pages and form components in
a web application, which are not platform specific.
6.4.4 Reused code/libraries
No third-party source code libraries or modules were used in the development of the software
tool or incorporated into the products of the software process. Libraries of code and components
exist to support issues not considered in the prototype, such as security, access authorisation,
data backup and Human-Computer Interaction.
6.4.5 Performance issues
Efficiency considerations associated with the system are largely concerned with issues such as
average and maximum response time, which should be minimised.
6.4.6 Source code conventions
A standard system of indentation of source code is utilised to assist readability and
understandability. A list of the source code script files that form the system implementation
software products can be found in ‘Appendix L: Software tool source files’.
6.4.7 Testing
In performing testing of the software tool, a strategy based on the ‘V’ model was utilised. Other
models, such as ‘X’ were also considered [GOL02]. These are designed to verify and validate

Chapter 6: Software support tool development
- 100 -
the products of the software development process. Verification ensures that the product is
developed correctly, whereas validation ensures that the product under development is in
conformance with the needs of the user [PRE97].
6.4.8 System execution
In order to execute the system, it is assumed that the constituent elements and supporting
systems (MySQL database, PHP scripting language, and Apache web server) have been
installed and set-up correctly. The source code script files are transferred into a directory
accessible by the web server. System execution is commenced through the use of third-party
web-browsing software by navigating to the ‘index.php’ file.
6.5 Evaluation
6.5.1 Evaluation method
Multiple methods of evaluation were deployed. Different methods were applicable at various
stages and development milestones. Some evaluation procedures ran concurrently with the
general development effort.
6.5.2 Objective and subjective evaluation
Ideally, all measurements and evaluations performed on the software process and the developed
software tool would be objective and quantitative. With quantitative data, it is easier to
meaningfully apply statistical methods to identify and control trends and perform comparisons.
However, subjective evaluation of user experience was required, and some evaluation produced
only qualitative data.
6.5.3 Evaluation against requirements set
The content of the requirements specification drives the development process. Milestones can
be defined in terms of fulfilment of specific requirements by a specific target date. Evaluation of
software products against the requirements specification can be performed at any stage, and may
be performed periodically or on an event-driven basis.
Successful fulfilment of all defined system requirements indicates the software
development project can be considered successful. The iterative development procedure is
repeated until each requirement is fulfilled or removed from the specification. At any point, the
proportion of requirements fulfilled is a metric for measurement of completion of the
development process. Upon termination of the development process, if all requirements are
fulfilled the development process and developed software products may be considered a
success. Upon termination of the software prototype development process, it was found that the

Chapter 6: Software support tool development
- 101 -
developed software products fulfilled all functional requirements that were identified during the
prototyping process.
6.5.4 Evaluation through usage
In a ‘rapid prototyping’ software development strategy, the requirements set is evolved through
a process of end-user evaluation and feedback. Therefore, the requirements set must be carefully
managed in order to avoid deleterious effects associated with maintenance activities performed
on other software products (e.g. source code). A cyclically iterative process of requirement set
refinement is implemented in a rapid prototyping process. When software products are used,
evaluation of products against the requirements specification is performed. Evaluation is also
performed indirectly on the requirements specification, which may need modification to more
closely reflect the actual user requirements. Any requirements not identified through this
process can be considered to be sufficiently minor that they do not significantly diminish the
effectiveness in practice of the software tool. Where the user finds that they require
functionality not present in the system, this indicates that consideration should be given to
augmenting the functional requirements set.
This permits a two-way process of evaluation throughout development. The
requirements set is used to evaluate the software products. User evaluation of software products
is used to evaluate the requirements set. Modifications may be made as a result of this
evaluation procedure in order that the next iteration of the software process will improve the
quality of the software products and achieve better results in the next phase of evaluation.
6.6 User evaluation of software tool
6.6.1 Overview of user evaluation method
Evaluation of developed software products against the requirements specification was
performed at the end of development during acceptance testing. Most evaluation was performed
by conducting case studies 3a and 3b throughout the iterative development cycles. This
approach allows synergistic benefits to both software tool development and case study
performance. Developed software products are shaped to a real-world working environment and
usage patterns, and case study tasks gain software support.
6.6.2 User’s experience of software tool usage
Usage of the software tool to perform case studies 3a and 3b was found to be preferable by the
assessor to usage of the manual approach. The reasons are summarised as increased efficiency,
decreased difficulty in ensuring accuracy and correctness of results, and decreased time to
perform analysis. Automation of repetitive tasks was found to bring the most benefits of all
functionality present in the software tool, with new functionality not present in the manual
Chapter 6: Software support tool development
- 102 -
method not bringing similar levels of benefit. This suggests that software support brings most
gain when focus is maintained a small set of critical features, rather than maximising
functionality. Case studies could be performed entirely within the system, indicating the correct
level of functionality was present.
6.6.3 Comparing use of software tool with manual approach
Ideally, case studies would be performed independently by two assessors with similar skills,
experience and motivation, where one assessor uses the support tool and the other uses the
manual approach, permitting comparison of the respective performance of different approaches.
Comparison of results sets would identification of differences which may be attributable to the
influence of software support on assessment procedures, or natural variation. If results sets are
not identical, and differences cannot be explained by other factors, the use of software support
tools is found to influence the appraisal results. In this case, further investigation is required to
establish if appraisal results are more or less representative of the actual process quality. If
results sets are identical, it is possible to identify the approach that may be considered superior
in terms of issues such as efficiency, time and resource usage.
6.6.4 Technical issues
Few technical issues were encountered in system development, deployment and usage. Those
encountered could be addressed in development of a release-candidate system version and were
not fundamental design issues. One incidence of PHP session ‘time-out’ was observed where
database access information was lost by the server, resulting in a user-initiated database update
action leaving the database contents unmodified. This issue is a result of the PHP scripting
language behaviour rather than the software tool content and so is not indicative of a software
defect in the software products, and can be avoided through modification of usage guidelines to
limit the time between a user initiating and completing an action to a time less than that of the
PHP session time-out period.
6.6.5 Usability and learnability issues
In performing case studies 3a and 3b, usability and learnability factors were found to be
generally acceptable, although this may be a result of prior familiarity of the user with system
design. However, user guidance could be improved through the introduction of context-sensitive
help to improve learnability. A release-candidate version of the software tool would also require
comprehensive technical and end-user documentation. Adoption of a ‘wizard’ style interface to
guide users stepwise through a task would enhance learnability.
The user interface emphasizes a ‘shallow and wide’ rather than ‘deep and narrow’ menu
structure. Where large process quality models are used, there is a tendency for user displays to
swamp the user with too large a quantity of information or too many options. Usability

Chapter 6: Software support tool development
- 103 -
improvements could break down these displays into a number of smaller, more understandable
elements, especially where the user is presented with a large number of similar items. An
additional improvement for usability and learnability would separate the commonly-used
features from the less commonly-used features.
6.6.6 Performance issues
System performance and efficiency is dependent on external factors such as network and server
performance as internal factors related to system design and implementation. In performing case
studies 3a and 3b no significant performance issues were observed, with all user actions
completing in less than 5 seconds.
6.6.7 Data management issues
Unpredictable effects on data integrity may be observed if there is more than one user as there is
no specific provision in the prototype to prevent overlap of actions by multiple users. Usage of
SQL transactions or table locking systems to prevent these effects could be implemented
without compromise of system structure, alongside a mechanism for data backup and
restoration.
6.7 Chapter 6: Summary This chapter documents the process through which a software tool was designed and developed
to support the appraisal, measurement and improvement of a software process. A rapid
prototyping approach was used in an iterative development cycle to develop and refine a
functional requirements specification set, and to develop a prototype implementation of a
software tool which would support these requirements. The purpose of this prototype
implementation was three-fold. Firstly, it was to act as proof of concept for a software tool to
support the management, measurement and improvement of a software process. Secondly, it
was used to support and assist the end-user in performing case studies 3a and 3b. Thirdly,
through utilisation in case studies 3a and 3b user feedback was used to refine the requirements
specification and to drive the development process.

Chapter 7: Summarised results
- 105 -
Chapter 7: Summarised results
7.1 Overview of summarised results
The purpose of this chapter is to present the results produced through the implementation of
procedures defined in Chapters 4 and 5 relating to theoretical and empirical evaluation of
models. For each of these, a separate section presents the relevant information.
Results are presented in summarised format in the interests of readability and brevity,
including only that information which is required for the correct understanding of the evaluation
and interpretation of results performed in ‘Chapter 8: Evaluation’. Therefore, should the reader
require further information relating to these results, for example the evidence items from which
results were derived, it may be necessary to refer to one or more of the attached appendices. For
example, Appendices E, F and G contain evidence items and backing information for the results
sets of theoretical evaluation of the quality models in the evaluation set.
7.2 Theoretical evaluation: Results
7.2.1 Models
The results of application of the set of requirements defined in ‘Appendix B: Requirements of
an ideal process quality model’ to each of the process quality models identified as members of
the evaluation set are presented below in summarised format. Models 1-3 (ISO 9001:1994/ISO
9000-3, SPICE and SW-CMM) were utilised, with the results of all models presented alongside
each requirement identifier in turn for ease of comparison, divided into the groups of
requirements. The models in the evaluation set were previously identified in Appendix M, Table
M.1.
7.2.2 Results of requirements-based evaluation
The content type of each table cell corresponds to the observed relationship of a specific pairing
of requirement and model. These are defined in Table 7.1 below.
�����
��������
������ ���������
�� ������������ �� ���
�� ���������������� ���� �� ���
�� ��������������� �� ���
������� ��������� ��� ������������������� ���� ��
Table 7.1: Possible cell content types and associated meanings

Chapter 7: Summarised results
- 106 -
A separate table is used to present the results pertaining to each of the groups of requirements,
in Tables 7.2 – 7.18. A set of keywords is provided to summarise the content of each
requirement taken from Tables B.1 – B.17.
������������
���
�� �����
��������
�� �����
������
�� �����
����
�!"�� �
��� �� �� �� ������ ����� �������������
��� �� �� �� ��������������������
��� �� �� �� ��������� ����������
�#� �� �� �� ����������������
�$� �� �� �� �� ���������� �����
�%� �� �� �� ! ������ ����"������������ ��
Table 7.2: ‘Group A: Business’
������������
���
�� �����
��������
�� �����
������
�� �����
����
�!"�� �
�&� �� �� �� #�������������� ����
�'� �� �� �� ��� �������$� ��������
��� �� �� �� %������������� ��
���� �� �� �� !������� �����������
���� �� �� �� ���&����������
���� �� �� �� �������������������
���� �� �� �� !�������������� ��
Table 7.3: ‘Group B: Model definition’
������������
���
�� �����
��������
�� �����
������
�� �����
����
�!"�� �
��#� �� �� �� '�(�������
��$� �� �� �� #���������������������
��%� �� �� �� ��������� ����
Table 7.4: ‘Group C: Fairness’
������������
���
�� �����
��������
�� �����
������
�� �����
����
�!"�� �
��&� �� �� �� )�����*������� ��
��'� �� �� �� ��������� ��
���� �� �� �� !���������������������
���� �� �� �� �������+$���������������
Table 7.5: ‘Group D: Generic’
������������
���
�� �����
��������
�� �����
������
�� �����
����
�!"�� �
���� �� �� �� #��������� ��������� ����
���� �� �� �� #��������� �������������
���� �� �� �� ���������������
��#� �� �� �� %������� ������ �
��$� �� �� �� ,��&���������������� ���
Table 7.6: ‘Group E: Working practice’
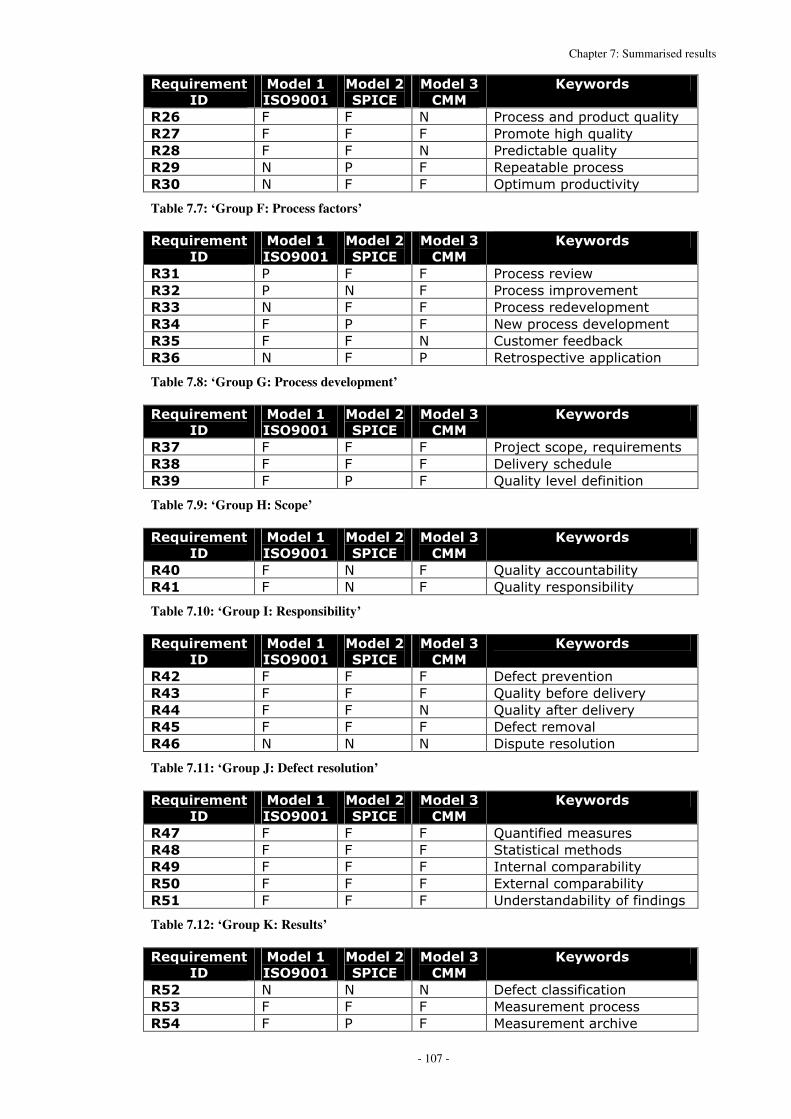
Chapter 7: Summarised results
- 107 -
������������
���
�� �����
��������
�� �����
������
�� �����
����
�!"�� �
��%� �� �� �� ���������������������� ����
��&� �� �� �� ������� �� ���� ����
��'� �� �� �� ��������� ����� ����
���� �� �� �� �������� ����������
���� �� �� �� '������������������
Table 7.7: ‘Group F: Process factors’
������������
���
�� �����
��������
�� �����
������
�� �����
����
�!"�� �
���� �� �� �� �������������$�
���� �� �� �� �����������������
���� �� �� �� �������������� �����
��#� �� �� �� ��$������������� �����
��$� �� �� �� ���������������&�
��%� �� �� �� ����������������� �������
Table 7.8: ‘Group G: Process development’
������������
���
�� �����
��������
�� �����
������
�� �����
����
�!"�� �
��&� �� �� �� ���(���������*������������
��'� �� �� �� -� �������� ��� ��
���� �� �� �� .�� ���� ��� ����������
Table 7.9: ‘Group H: Scope’
������������
���
�� �����
��������
�� �����
������
�� �����
����
�!"�� �
�#�� �� �� �� .�� ������������� ����
�#�� �� �� �� .�� ������������� ����
Table 7.10: ‘Group I: Responsibility’
������������
���
�� �����
��������
�� �����
������
�� �����
����
�!"�� �
�#�� �� �� �� -���������������
�#�� �� �� �� .�� ������������� ������
�##� �� �� �� .�� ������������ ������
�#$� �� �� �� -����������� �
�#%� �� �� �� -����������� �����
Table 7.11: ‘Group J: Defect resolution’
������������
���
�� �����
��������
�� �����
������
�� �����
����
�!"�� �
�#&� �� �� �� .�����������������
�#'� �� �� �� /��������� ��� ����
�#�� �� �� �� ����� ��������� ����
�$�� �� �� �� 01���� ��������� ����
�$�� �� �� �� #���������� ��������������
Table 7.12: ‘Group K: Results’
������������
���
�� �����
��������
�� �����
������
�� �����
����
�!"�� �
�$�� �� �� �� -������� ������������
�$�� �� �� �� %�����������������
�$#� �� �� �� %������������ ����

Chapter 7: Summarised results
- 108 -
�$$� �� �� �� -���������������� ����
Table 7.13: ‘Group L: Result handling’
������������
���
�� �����
��������
�� �����
������
�� �����
����
�!"�� �
�$%� �� �� �� #��������� ������ ����
�$&� �� �� �� ��������������������
�$'� �� �� �� /���$������������
�$�� �� �� �� �������������
�%�� �� �� �� ��������������
�%�� �� �� �� �������+���� ���������
�%�� �� �� �� ���(����������������&���
Table 7.14: ‘Group M: Component policy’
������������
���
�� �����
��������
�� �����
������
�� �����
����
�!"�� �
�%�� �� �� �� ��������������������
�%#� �� �� �� ���������� �������
�%$� �� �� �� !������������������
�%%� �� �� �� ���������������
�%&� �� �� �� ���������� ��������
�%'� �� �� �� ����������� ����
�%�� �� �� �� 2��� ��������
�&�� �� �� �� -��� ������ ��
Table 7.15: ‘Group N: Development plan’
������������
���
�� �����
��������
�� �����
������
�� �����
����
�!"�� �
�&�� �� �� �� 3���$������������
�&�� �� �� �� /���$������������
�&�� �� �� �� 0�������
�&#� �� �� �� /�� �����������
�&$� �� �� �� �������������������
�&%� �� �� �� %������� ����������
Table 7.16: ‘Group O: End-user environment’
������������
���
�� �����
��������
�� �����
������
�� �����
����
�!"�� �
�&&� �� �� �� ������� ����
�&'� �� �� �� ������� ����
�&�� �� �� �� #���� ����
�'�� �� �� �� �� ���� ����
�'�� �� �� �� 0���������
�'�� �� �� �� ������� ����
�'�� �� �� �� %�������� ����
Table 7.17: ‘Group P: Product issues’
������������
���
�� �����
��������
�� �����
������
�� �����
����
�!"�� �
�'#� �� �� �� -��������������� ����
�'$� �� �� �� .�� ������������������
Table 7.18: ‘Group Q: Decision making’

Chapter 7: Summarised results
- 109 -
7.2.3 Summarised results for user classes
The following results Tables 7.19 – 7.21 provide a summary of the results of application of the
theoretical evaluation procedure. For each model, a table represents the number and proportion
of requirements for which the model was found to be in conformance with each possible level in
the measurement scale of requirement fulfilment.
Results are provided for both the total requirements set identified in ‘Appendix B:
Requirements of an ideal process quality model’ tables B.1 – B.17 and additionally for the
subset of requirements associated with each of the user classes identified in ‘Appendix C:
Derivation of user classes’ table C.1. The relationship between quality model requirement and
user class is defined in ‘Appendix D: Relationship between user classes and requirements’ table
D.3.
In each table, ‘Mapped requirements’ represents the number of user requirements
mapped to a given user class, and the percentage this represents of the total number of
requirements in the requirements set (there are 85 defined in total). For each value, the first
figure indicates the numerical data value. The second figure, in brackets, indicated the
percentage this value represents of the total number in this category. All values are rounded to
the nearest integer, and therefore the percentages may not sum to 100% for a given category.
(������� ��))� �
������������
*��+���� �
�
��������!�
+��+���� �
,���+��+���� �
�
�! �� 45��6778�� 97��:68�� ;��668�� 69��6;8��
#6<�/���$����
���� �����
56��978�� =6��478�� >��98�� :��6=8��
#?<�/���$����
��������������
9;��468�� 57��:?8�� :��678�� 6?��6:8��
#><��������� 9?��:>8�� =4��::8�� :��668�� :��668��
Table 7.19: Summarised results for model 1: ISO 9001:1994 with ISO 9000-3 guidelines
(������� ��))� �������������
*��+���� ��
��������!�+��+���� �
,���+��+���� ��
�! �� 45��6778�� 5:��9:8�� 67��6?8�� 64��?68��
#6<�/���$����
���� �����
56��978�� >>��958�� 9��6?8�� 6?��?=8��
#?<�/���$����
��������������
9;��468�� =9��9:8�� 4��6?8�� 65��??8��
#><��������� 9?��:>8�� =?��948�� 4��6>8�� 6?��6;8��
Table 7.20: Summarised results for model 2: SPICE v1.0 ‘working draft’
(������� ��))� �������������
*��+���� ��
��������!�+��+���� �
,���+��+���� ��
�! �� 45��6778�� 59��998�� 9��:8�� ?>��?:8��
#6<�/���$����
���� �����
56��978�� >5��9;8�� >��98�� 6>��?58��
#?<�/���$����
��������������
9;��468�� 56��:=8�� 5��:8�� 6>��6;8��
#><��������� 9?��:>8�� >;��9>8�� =��98�� 6;��>68��
Table 7.21: Summarised results for model 3: SW-CMM v1.3

Chapter 7: Summarised results
- 110 -
7.2.4 Results of evaluation for requirements groups
This section presents results for the extent to which the requirements in each requirements
group (as defined in ‘Appendix B: Requirements of an ideal process quality model’ tables B.1-
B.17) are satisfied by each of the models in the evaluation set, as defined by the proportion of
requirements in the group with which each model is found to be at a ‘fulfilled’ level of
conformance. ‘Partially fulfilled’ requirements are not considered to contribute, as the scale of
measurement defined in Table 7.1 does not allow determination of the extent to which these
requirements are satisfied, and therefore two requirements for which a model is ‘partially
fulfilled’ may signify slightly different levels of conformance. Table 7.22 presents this
information, with all percentages rounded to the nearest significant figure.
� -��+����������������.+��+���� /����+����������0���
������������
����)�
�� �����
1��������2���#�
3���������4�5�
�� �����
1������0�6�5�
�� �����
1�74����0�6�5�
� 9:� 57� 4>�
8� 49� 49� 677�
�� >>� 9:� 677�
�� 677� :5� :5�
�� 47� 47� =7�
*� 97� 47� 97�
9� >>� 9:� 9:�
:� 677� 9:� 677�
�� 677� 7� 677�
;� 47� 47� 97�
� 677� 677� 677�
<� :5� ?5� :5�
�� 49� :6� :6�
,� :5� 57� 9>�
�� 57� 57� >>�
�� =>� :6� 7�
=� 57� 677� 57�
Table 7.22: Proportion of fulfilment of requirement groups by models in the evaluation set
7.2.5 Size of model content
Table 7.23 details the number of content elements associated with each process quality model in
the evaluation set, where models are ranked in order of increasing size. The number of content
elements is a measure of the size of model content. Figures for Model 0 (ISO 9001:1994
without ISO 9000-3) are provided for comparison only.
�� ��� ,��>����+�����������������
���������������� ��
6<��/'�;776<6;;=����/'�;777+>� 669��5;�@�5:��
?<�/���0��6A7�$��&��������� ??:��?9�@�?76��
><�/,+�%%��6A>� >94��6=6�@�6?5�@�>:�@�55��
Table 7.23: Size of model content
For Model 1 (ISO 9001:1994 / ISO 9000-3), the unbracketed figure is for the whole model. The
two bracketed figures indicate the size of the subsets for ISO 9001:1994 and ISO 9000-3
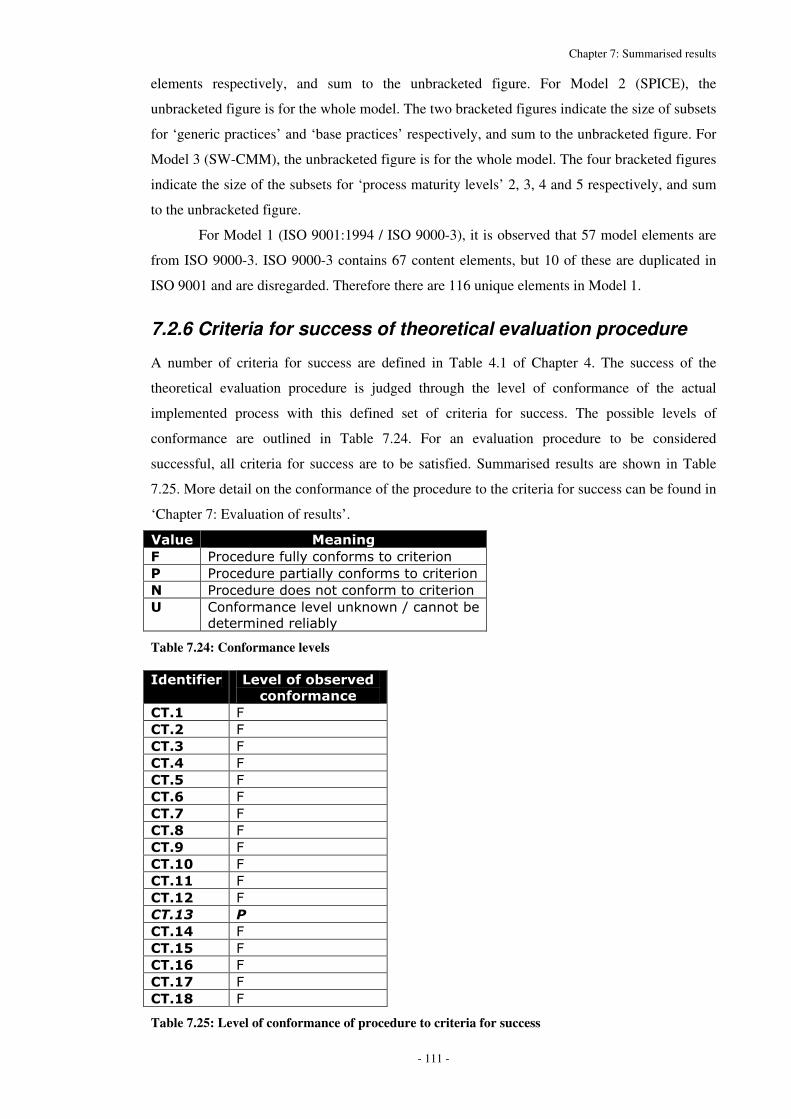
Chapter 7: Summarised results
- 111 -
elements respectively, and sum to the unbracketed figure. For Model 2 (SPICE), the
unbracketed figure is for the whole model. The two bracketed figures indicate the size of subsets
for ‘generic practices’ and ‘base practices’ respectively, and sum to the unbracketed figure. For
Model 3 (SW-CMM), the unbracketed figure is for the whole model. The four bracketed figures
indicate the size of the subsets for ‘process maturity levels’ 2, 3, 4 and 5 respectively, and sum
to the unbracketed figure.
For Model 1 (ISO 9001:1994 / ISO 9000-3), it is observed that 57 model elements are
from ISO 9000-3. ISO 9000-3 contains 67 content elements, but 10 of these are duplicated in
ISO 9001 and are disregarded. Therefore there are 116 unique elements in Model 1.
7.2.6 Criteria for success of theoretical evaluation procedure
A number of criteria for success are defined in Table 4.1 of Chapter 4. The success of the
theoretical evaluation procedure is judged through the level of conformance of the actual
implemented process with this defined set of criteria for success. The possible levels of
conformance are outlined in Table 7.24. For an evaluation procedure to be considered
successful, all criteria for success are to be satisfied. Summarised results are shown in Table
7.25. More detail on the conformance of the procedure to the criteria for success can be found in
‘Chapter 7: Evaluation of results’.
?����� ��������
*� ������������ ���������������������
�� ���������������� ���������������������
,� ������������������������������������
(� ��������� ��� ��&�$�����������
����������� ��� ��
Table 7.24: Conformance levels
� ����+���� <�0����+��>��0� �
���+��������
�@6�� ��
�@6�� ��
�@6�� ��
�@6#� ��
�@6$� ��
�@6%� ��
�@6&� ��
�@6'� ��
�@6�� ��
�@6��� ��
�@6��� ��
�@6��� ��
������ ��
�@6�#� ��
�@6�$� ��
�@6�%� ��
�@6�&� ��
�@6�'� ��
Table 7.25: Level of conformance of procedure to criteria for success

Chapter 7: Summarised results
- 112 -
Table 7.25 indicates that for all criteria for success other than CT.13, the procedure is in full
conformance. The process was found to be only partially in conformance with criterion CT.13.
No criteria were found for which the process was completely non-conforming, or for which it
was not possible to assign a reliable measurement value.
7.3 Empirical evaluation: Results
7.3.1 Results of case studies in native format
The following information tables present the evaluation results from the case studies, where
each software process in the evaluation set is evaluated using each process quality model from
the evaluation set. The results of each case study are presented in the ‘native’ format for the
relevant model i.e. not translated into a format for comparison between case studies using
different models. However, results are comparable between processes where the same model is
used. This information is used to determine a measure of software process quality.
The information summarised in this section was taken from ‘Appendix P: Evidence for
results of case studies 1a and 1b’, ‘Appendix Q: Evidence for results of case studies 2a and 2b’,
and ‘Appendix R: Evidence for results of case studies 3a and 3b’. The results identify for each
possible value, in the measurement scale appropriate to the model, the number and percentage
of model content element results for which that value was observed in performing the case
studies. All percentages are quoted to 2 significant figures.
Appropriate measurement scales derived from model content are defined in ‘Appendix
O: Process quality model usage in case studies’. Elements of the quality model that are not
applicable or relevant to the case study are disregarded and are marked ‘N/A’. Any element of
the quality model that explicitly requires the implementation of this particular quality model is
disregarded, as the case study does not specifically attempt to implement the model and would
therefore ‘fail’ regardless of the content of the actual process. It is also necessary to disregard
elements of the quality model for which it is impossible to adequately determine compliance in
the case study. For example, if it is not possible to adequately determine the behavioural
patterns of the customer organization it may not be possible to determine compliance. If an
organisation does not perform software maintenance, all maintenance requirements are
considered ‘not applicable’ as these would be beyond the scope of the case study process.
7.3.1.1 Case study process A: University of Durham SEG &6�6�6�6�������� !���2���������2���#��� ���9�
Table 7.26 shows a summary of the results for the ISO 9001:1994 / ISO 9000-3 model, in which
all columns sum to 100%. Figures indicate the number of model elements for which a given
value was assigned in evaluation of the process, and percentages indicate proportion of column
i.e. proportion of requirement set. Column two contains results for ISO 9001:1994 alone
(‘Model 0’). Column three contains results for those elements of the ISO 9000-3 model which

Chapter 7: Summarised results
- 113 -
are not duplicated in ISO 9001:1994. Column four combines the results in columns two and
three to provide results for the whole ISO 9001:1994 / ISO 9000-3 model (‘Model 1’).
������ �0����� ��������2���#� ��������4�� ��������2���#�
3���������4��
����+�� � >?��5=A?=8�� ?5��=>A498�� 5:��=;A6=8��
(����+�� � ?=��=7A948�� ?5��=>A498�� =;��=?A?=8��
,3� >��5A748�� :��6?A?48�� 67��4A9?8��
Table 7.26: Case study 1a summarised results
&6�6�6�6�������� !���2�������0�6��"��A���� ��+���� ���9�
Table 7.27 shows a summary of the results for the SPICE v1.0 model (‘model 2’) at each of the
defined levels of ‘generic practices’, in which all rows sum to 100%. Figures indicate the
number of model elements for which a given value was assigned in evaluation of the process,
and percentages indicate proportion of row i.e. of level at a given value. Table 7.28 shows a
summary of the results for the ‘base practices’, in which all columns sum to 100% where figures
indicate the number of model elements for which a given value was assigned in evaluation of
the process, and percentages indicate proportion of column i.e. proportion of element type.
<�0��� ,� �� <� *� ,3�
�� 7��7A778� 7��7A778� 7��7A778� 6��677A778� 7��7A778��
�� 7��7A778� 6��4A>>8� >��?5A778� 4��99A9:8� 7��7A778��
�� 7��7A778� 7��7A778� ?��=7A778� >��97A778� 7��7A778��
#� >��677A778� 7��7A778� 7��7A778� 7��7A778� 7��7A778��
$� 5��677A778� 7��7A778� 7��7A778� 7��7A778� 7��7A778��
�����0��� 4��>7A:98� 6��>A458� 5��6;A?>8� 6?��=9A658� 7��7A778��
Table 7.27: Case study 2a summarised generic practice results
������ �0����� 8���)��������
��������
9�������)��������
��������
���
��������
,� 9=��>6A4=8�� 4��>7A:98�� :?��>6A:?8��
�� ?6��67A=58�� 6��>A458�� ??��;A9;8��
<� ?9��6?A;=8�� 5��6;A?>8�� >6��6>A998��
*� :=��>9A4?8�� 6?��=9A658�� 49��>:A4;8��
,3� 69��:A;98�� 7��7A778�� 69��:A758��
Table 7.28: Case study 2a summarised results
&6�6�6�6�������� !���2��74����0�6���� ���9�
Table 7.29 shows a summary of the results for the SW-CMM model (‘model 3’) at each of the
defined ‘process maturity levels’ and for the model as a whole, in which all rows sum to 100%.
Figures indicate the number of model content elements for which a given value was assigned in
evaluation of the process. Percentages indicate proportion of row i.e. proportion of elements at a
given level.
<�0��� ����+�� � (����+�� � ,3�
�� :9��5>A;78�� >:��?9A?=8�� ?4��6;A498��
�� 99��5?A478�� =6��>?A478�� 64��6=A=78��
#� ?��5A=68�� >?��49A=;8�� >��4A668��
$� 7��7A778�� 9=��;4A=98�� 6��6A5=8��
�����0��� 6==��>;A6>8�� 6:=��=:A?48�� 57��6>A5;8��
Table 7.29: Case study 3a summarised results
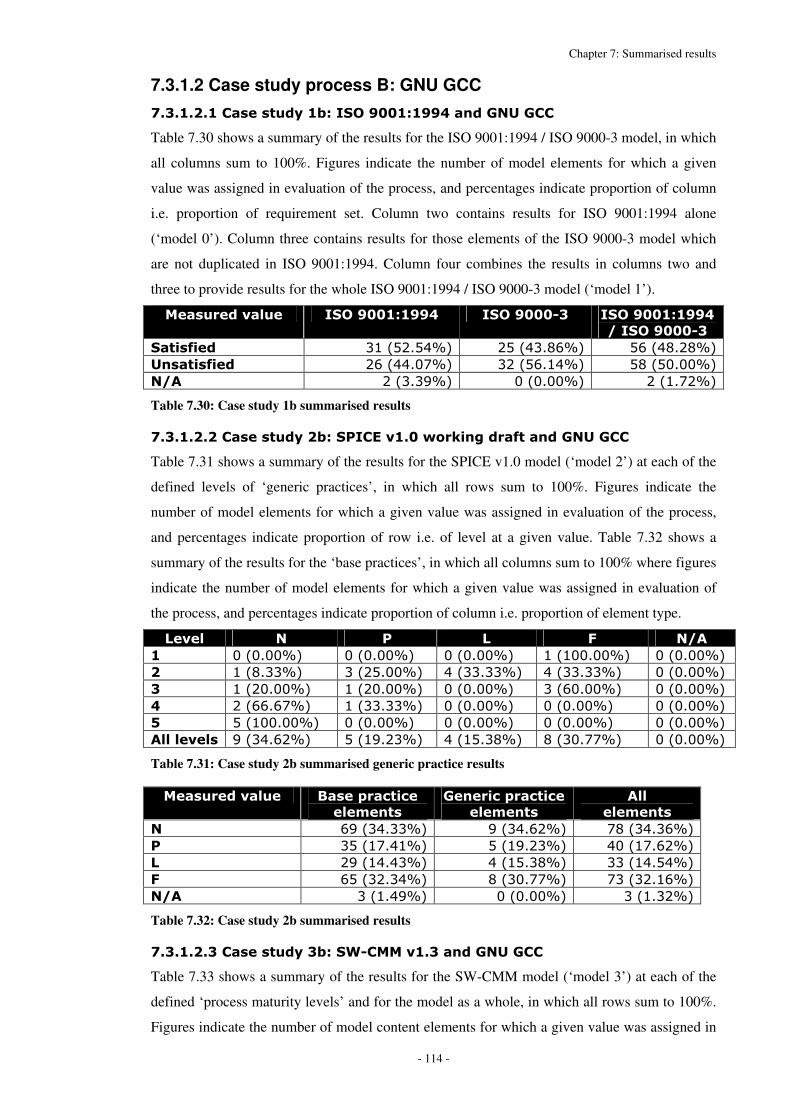
Chapter 7: Summarised results
- 114 -
7.3.1.2 Case study process B: GNU GCC &6�6�6�6�������� !��>2���������2���#��� �9,(�9���
Table 7.30 shows a summary of the results for the ISO 9001:1994 / ISO 9000-3 model, in which
all columns sum to 100%. Figures indicate the number of model elements for which a given
value was assigned in evaluation of the process, and percentages indicate proportion of column
i.e. proportion of requirement set. Column two contains results for ISO 9001:1994 alone
(‘model 0’). Column three contains results for those elements of the ISO 9000-3 model which
are not duplicated in ISO 9001:1994. Column four combines the results in columns two and
three to provide results for the whole ISO 9001:1994 / ISO 9000-3 model (‘model 1’).
������ �0����� ��������2���#� ��������4�� ��������2���#�
3���������4��
����+�� � >6��5?A5=8�� ?5��=>A498�� 59��=4A?48��
(����+�� � ?9��==A7:8�� >?��59A6=8�� 54��57A778��
,3� ?��>A>;8�� 7��7A778�� ?��6A:?8��
Table 7.30: Case study 1b summarised results
&6�6�6�6�������� !��>2�������0�6��"��A���� ��+���� �9,(�9���
Table 7.31 shows a summary of the results for the SPICE v1.0 model (‘model 2’) at each of the
defined levels of ‘generic practices’, in which all rows sum to 100%. Figures indicate the
number of model elements for which a given value was assigned in evaluation of the process,
and percentages indicate proportion of row i.e. of level at a given value. Table 7.32 shows a
summary of the results for the ‘base practices’, in which all columns sum to 100% where figures
indicate the number of model elements for which a given value was assigned in evaluation of
the process, and percentages indicate proportion of column i.e. proportion of element type.
<�0��� ,� �� <� *� ,3�
�� 7��7A778�� 7��7A778�� 7��7A778�� 6��677A778�� 7��7A778��
�� 6��4A>>8�� >��?5A778�� =��>>A>>8�� =��>>A>>8�� 7��7A778��
�� 6��?7A778�� 6��?7A778�� 7��7A778�� >��97A778�� 7��7A778��
#� ?��99A9:8�� 6��>>A>>8�� 7��7A778�� 7��7A778�� 7��7A778��
$� 5��677A778�� 7��7A778�� 7��7A778�� 7��7A778�� 7��7A778��
�����0��� ;��>=A9?8�� 5��6;A?>8�� =��65A>48�� 4��>7A::8�� 7��7A778��
Table 7.31: Case study 2b summarised generic practice results
������ �0����� 8���)��������
��������
9�������)��������
��������
���
��������
,� 9;��>=A>>8�� ;��>=A9?8�� :4��>=A>98��
�� >5��6:A=68�� 5��6;A?>8�� =7��6:A9?8��
<� ?;��6=A=>8�� =��65A>48�� >>��6=A5=8��
*� 95��>?A>=8�� 4��>7A::8�� :>��>?A698��
,3� >��6A=;8�� 7��7A778�� >��6A>?8��
Table 7.32: Case study 2b summarised results
&6�6�6�6�������� !��>2��74����0�6���� �9,(�9���
Table 7.33 shows a summary of the results for the SW-CMM model (‘model 3’) at each of the
defined ‘process maturity levels’ and for the model as a whole, in which all rows sum to 100%.
Figures indicate the number of model content elements for which a given value was assigned in

Chapter 7: Summarised results
- 115 -
evaluation of the process. Percentages indicate proportion of row i.e. proportion of elements at a
given level.
<�0��� ����+�� � (����+�� � ,3�
�� 5=��>4A>78�� 4:��96A:78�� 7��7A778��
�� ?5��?7A778�� ;:��::A978�� >��?A=78��
#� >��4A668�� >=��;6A4;8�� 7��7A778��
$� 7��7A778�� 95��677A778�� 7��7A778��
�����0��� 4?��??A?48�� ?4>��:9A;78�� >��7A4?8��
Table 7.33: Case study 3b summarised results
7.3.2 Results of case studies transformed to common format
Results from case studies 1a-3b were transformed into a common, standard format (ISO 9001
clauses) for comparison through techniques outlined in ‘Appendix H: Mapping between
elements of quality models’ and ‘Appendix I: Results of mapping between quality models’,
producing the results sets of ‘Appendix S: Standardised results sets for case studies’. ‘Appendix
T: Analysis of case study results at the level of the standard model clause’ performs analysis of
the results obtained for each model in the evaluation set at the level of the standard model
clause.
7.3.2.1 Case study process A: University of Durham SEG
Summarised statistics for comparison are presented below. Figures for ‘ISO 9001’ (model 0)
were obtained in acquiring ‘ISO9001/ISO9000-3’ (model 1) results, and are presented for
comparison. Table 7.34 identifies the percentage of ‘satisfied’ results of each ISO9001 clause
observed for each of the quality models considered, when applied to case study process A.
���� �� �
+������
������
����
����2���#�
-�
��������2���#�3�
�������4��
-�
������0�6��
-�
�74����0�6��
-�
#6�� 97A77� ?4A5:� ?9A>?� 55A59�
#6�� 7A77� 7A77� >7A>7� 56A45�
#6�� 57A77� 57A77� =7A77� 5?A;=�
#6#� ::A:4� 95A>4� 9:A?:� =5A96�
#6$� 99A9:� >>A>>� 99A9:� >;A6>�
#6%� ?7A77� 7A77� 7A77� 6=A?;�
#6&� 7A77� 7A77� 677A77� 7A77�
#6'� 677A77� =7A77� =7A77� >4A=9�
#6�� 7A77� 99A9:� 94A:5� 5:A6=�
#6��� 6=A?;� 47A77� 5?A9>� >:A57�
#6��� 7A77� :6A=>� 97A77� =6A9:�
#6��� 7A77� =7A77� 5?A77� =9A65�
#6��� 7A77� :7A5;� 57A77� 5=A6:�
#6�#� 7A77� 7A77� ?7A77� 69A9:�
#6�$� 677A77� 47A77� 57A77� ?5A77�
#6�%� 7A77� 7A77� 57A77� ?5A77�
#6�&� 7A77� 7A77� ?7A77� 97A77�
#6�'� 7A77� 7A77� :5A77� =7A77�
#6��� 7A77� 7A77� 66A66� +�
#6��� 7A77� 7A77� 7A77� 7A77�
Table 7.34: Process A 'satisfied' results in case studies, in standardised format
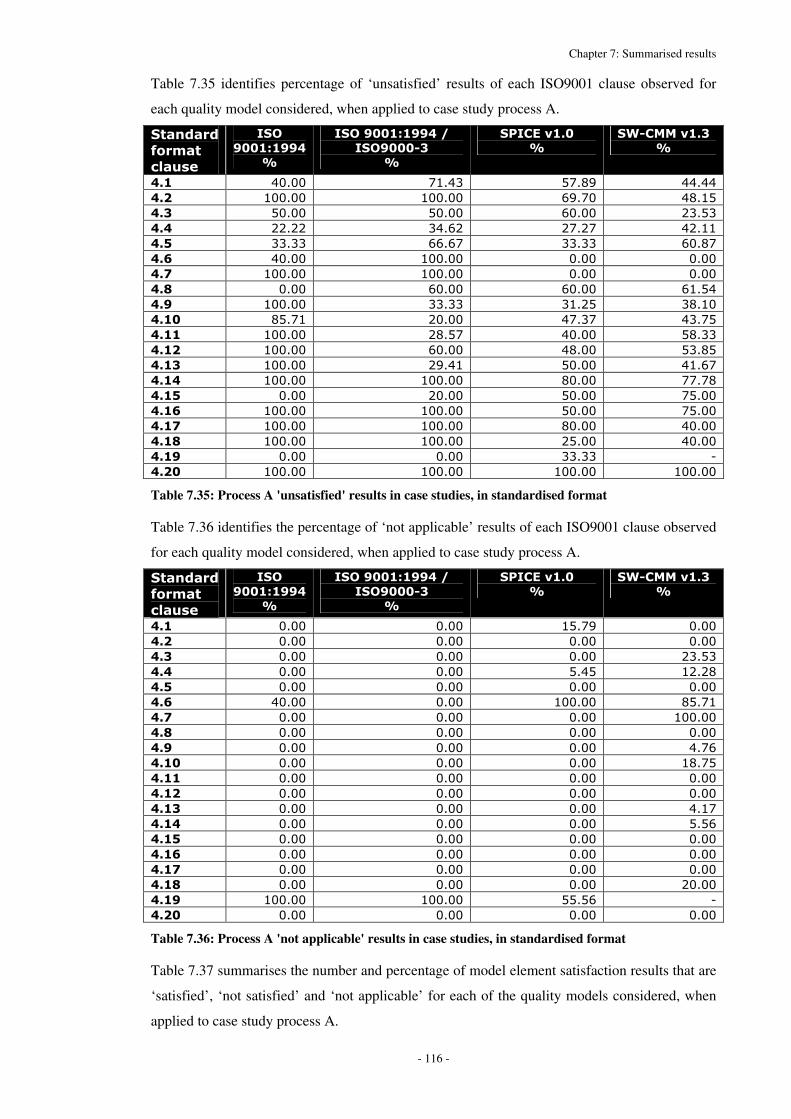
Chapter 7: Summarised results
- 116 -
Table 7.35 identifies percentage of ‘unsatisfied’ results of each ISO9001 clause observed for
each quality model considered, when applied to case study process A.
���� �� �
+������
������
��������2���#�
-�
��������2���#�3��������4��
-�
������0�6��-�
�74����0�6��-�
#6�� =7A77� :6A=>� 5:A4;� ==A==�
#6�� 677A77� 677A77� 9;A:7� =4A65�
#6�� 57A77� 57A77� 97A77� ?>A5>�
#6#� ??A??� >=A9?� ?:A?:� =?A66�
#6$� >>A>>� 99A9:� >>A>>� 97A4:�
#6%� =7A77� 677A77� 7A77� 7A77�
#6&� 677A77� 677A77� 7A77� 7A77�
#6'� 7A77� 97A77� 97A77� 96A5=�
#6�� 677A77� >>A>>� >6A?5� >4A67�
#6��� 45A:6� ?7A77� =:A>:� =>A:5�
#6��� 677A77� ?4A5:� =7A77� 54A>>�
#6��� 677A77� 97A77� =4A77� 5>A45�
#6��� 677A77� ?;A=6� 57A77� =6A9:�
#6�#� 677A77� 677A77� 47A77� ::A:4�
#6�$� 7A77� ?7A77� 57A77� :5A77�
#6�%� 677A77� 677A77� 57A77� :5A77�
#6�&� 677A77� 677A77� 47A77� =7A77�
#6�'� 677A77� 677A77� ?5A77� =7A77�
#6��� 7A77� 7A77� >>A>>� +�
#6��� 677A77� 677A77� 677A77� 677A77�
Table 7.35: Process A 'unsatisfied' results in case studies, in standardised format
Table 7.36 identifies the percentage of ‘not applicable’ results of each ISO9001 clause observed
for each quality model considered, when applied to case study process A.
���� �� �
+������
������
��������2���#�
-�
��������2���#�3��������4��
-�
������0�6��-�
�74����0�6��-�
#6�� 7A77� 7A77� 65A:;� 7A77�
#6�� 7A77� 7A77� 7A77� 7A77�
#6�� 7A77� 7A77� 7A77� ?>A5>�
#6#� 7A77� 7A77� 5A=5� 6?A?4�
#6$� 7A77� 7A77� 7A77� 7A77�
#6%� =7A77� 7A77� 677A77� 45A:6�
#6&� 7A77� 7A77� 7A77� 677A77�
#6'� 7A77� 7A77� 7A77� 7A77�
#6�� 7A77� 7A77� 7A77� =A:9�
#6��� 7A77� 7A77� 7A77� 64A:5�
#6��� 7A77� 7A77� 7A77� 7A77�
#6��� 7A77� 7A77� 7A77� 7A77�
#6��� 7A77� 7A77� 7A77� =A6:�
#6�#� 7A77� 7A77� 7A77� 5A59�
#6�$� 7A77� 7A77� 7A77� 7A77�
#6�%� 7A77� 7A77� 7A77� 7A77�
#6�&� 7A77� 7A77� 7A77� 7A77�
#6�'� 7A77� 7A77� 7A77� ?7A77�
#6��� 677A77� 677A77� 55A59� +�
#6��� 7A77� 7A77� 7A77� 7A77�
Table 7.36: Process A 'not applicable' results in case studies, in standardised format
Table 7.37 summarises the number and percentage of model element satisfaction results that are
‘satisfied’, ‘not satisfied’ and ‘not applicable’ for each of the quality models considered, when
applied to case study process A.

Chapter 7: Summarised results
- 117 -
����+�������
��0���
����
����2���#�-�
��������2���#�3�
�������4��-�
������0�6��
-�
�74����0�6��
-�
(����+�� � 5=A?=� ==A:?� =9A4=� =4A4:�
����+�� � =7A94� =;A5;� =:A;;� =?A::�
,3� 5A74� 5A9;� 5A6:� 4A>9�
Table 7.37: Summarised measured satisfaction levels of process A in case studies
7.3.2.2 Case study process B: GNU GCC
Summarised statistics for comparison are presented below. Figures for ‘ISO 9001’ (model 0)
were obtained in acquiring ‘ISO9001/ISO9000-3’ (model 1) results, and are presented for
comparison. Table 7.38 identifies the percentage of ‘satisfied’ results of each ISO9001 clause
observed for each of the quality models considered, when applied to case study process B.
���� �� �
+������
������
����
����2���#�-�
��������2���#�3�
�������4��-�
������0�6��
-�
�74����0�6��
-�
#6�� =7A77� ?4A5:� >9A4=� =7A:=�
#6�� >>A>>� 7A77� >7A>7� >>A>>�
#6�� 7A77� 7A77� ?7A77� ?5A5>�
#6#� ==A==� 5>A45� >7A;6� >9A4=�
#6$� 677A77� ::A:4� 99A9:� 97A4:�
#6%� 7A77� 7A77� :6A=>� 6=A?;�
#6&� 677A77� 677A77� 66A66� 57A77�
#6'� 677A77� 47A77� 55A77� 4=A9?�
#6�� 7A77� 57A77� 9?A57� >4A67�
#6��� :6A=>� 97A77� 4;A=:� 57A77�
#6��� 7A77� 45A:6� ;>A>>� 57A77�
#6��� 677A77� 47A77� 44A77� 4=A9?�
#6��� 677A77� 54A4?� 4:A57� 9?A57�
#6�#� 7A77� 7A77� ?9A9:� 66A66�
#6�$� 4>A>>� =7A77� 9>A9=� 57A77�
#6�%� 7A77� 7A77� 99A9:� >>A>>�
#6�&� 7A77� 7A77� ?7A77� 97A77�
#6�'� 7A77� 7A77� 7A77� ?7A77�
#6��� 677A77� =?A49� 99A9:� +�
#6��� 7A77� 7A77� 7A77� 6?A57�
Table 7.38: Process B 'satisfied' results in case studies, in standardised format
Table 7.39 identifies the percentage of ‘unsatisfied’ results of each ISO9001 clause observed for
each quality model considered, when applied to case study process B.
���� �� �
+������
������
����
����2���#�-�
��������2���#�3�
�������4��-�
������0�6��
-�
�74����0�6��
-�
#6�� 97A77� :6A=>� 9>A69� 55A59�
#6�� 99A9:� 677A77� 9;A:7� 99A9:�
#6�� 677A77� 677A77� 47A77� :9A=:�
#6#� 55A59� =9A65� 9;A7;� 96A=7�
#6$� 7A77� ??A??� >>A>>� >;A6>�
#6%� 97A77� 677A77� ?4A5:� :6A=>�
#6&� 7A77� 7A77� 55A59� 57A77�
#6'� 7A77� ?7A77� =5A77� 65A>4�
#6�� 677A77� 57A77� >:A57� 96A;7�
#6��� ?4A5:� =7A77� 67A5>� =>A:5�
#6��� 677A77� 6=A?;� 9A9:� =6A9:�
#6��� 7A77� ?7A77� 6?A77� 65A>4�
#6��� 7A77� =6A64� 6?A57� >>A>>�
#6�#� 677A77� 677A77� :>A>>� 44A4;�

Chapter 7: Summarised results
- 118 -
#6�$� 69A9:� 97A77� >9A>9� ?5A77�
#6�%� 677A77� 677A77� >>A>>� 99A9:�
#6�&� 677A77� 677A77� 47A77� =7A77�
#6�'� 677A77� 677A77� 677A77� 47A77�
#6��� 7A77� 5:A6=� >>A>>� +�
#6��� 677A77� 677A77� 677A77� 4:A57�
Table 7.39: Process B 'unsatisfied' results in case studies, in standardised format
Table 7.40 identifies the percentage of ‘not applicable’ results of each ISO9001 clause observed
for each quality model considered, when applied to case study process B.
���� �� �
+������
������
����
����2���#�-�
��������2���#�3�
�������4��-�
������0�6��
-�
�74����0�6��
-�
#6�� 7A77� 7A77� 7A77� >A:7�
#6�� 7A77� 7A77� 7A77� 7A77�
#6�� 7A77� 7A77� 7A77� 7A77�
#6#� 7A77� 7A77� 7A77� 6A:5�
#6$� 7A77� 7A77� 7A77� 7A77�
#6%� =7A77� 7A77� 7A77� 6=A?;�
#6&� 7A77� 7A77� >>A>>� 7A77�
#6'� 7A77� 7A77� 7A77� 7A77�
#6�� 7A77� 7A77� 7A77� 7A77�
#6��� 7A77� 7A77� 7A77� 9A?5�
#6��� 7A77� 7A77� 7A77� 4A>>�
#6��� 7A77� 7A77� 7A77� 7A77�
#6��� 7A77� 7A77� 7A77� =A6:�
#6�#� 7A77� 7A77� 7A77� 7A77�
#6�$� 7A77� 7A77� 7A77� ?5A77�
#6�%� 7A77� 7A77� 7A77� 7A77�
#6�&� 7A77� 7A77� 7A77� 7A77�
#6�'� 7A77� 7A77� 7A77� 7A77�
#6��� 7A77� 7A77� 7A77� +�
#6��� 7A77� 7A77� 7A77� 7A77�
Table 7.40: Process B 'not applicable' results in case studies, in standardised format
Table 7.41 summarises the number and percentage of model element satisfaction results that are
‘satisfied’, ‘not satisfied’ and ‘not applicable’ for each of the quality models considered, when
applied to case study process B.
����+�������
��0���
����
����2���#�
-�
��������2���#�3�
�������4��
-�
������0�6��
-�
�74����0�6��
-�
(����+�� � 5?A5=� =;A5;� =;A6=� 5=A;4�����+�� � ==A7:� 57A=6� 57A77� =?A::�,3� >A>;� 7A77� 7A49� ?A?5�
Table 7.41: Summarised measured satisfaction levels of process B in case studies
7.3.3 Criteria for success of empirical evaluation procedure
A number of criteria for success are defined in Table 5.1 of Chapter 5. The success of the
theoretical evaluation procedure is judged through the level of conformance of the actual
implemented process with this defined set of criteria for success. The possible levels of
conformance are outlined in Table 7.42. For an evaluation procedure to be considered
successful, all criteria for success are to be satisfied. Summarised results are shown in Table

Chapter 7: Summarised results
- 119 -
7.43. More detail on the conformance of the procedure to the criteria for success can be found in
‘Chapter 10: Evaluation of results’.
?����� ��������
*� ������������ ���������������������
�� ���������������� ���������������������
,� ������������������������������������
(� ��������� ��� ��&�$�����������
����������� ��� ��
Table 7.42: Conformance levels
� ����+���� <�0����+��>��0� �
���+��������
��6�� ��
��6�� ��
��6�� ��
��6#� ��
��6$� ��
��6%� ��
���� ��
��6'� ��
��6�� ��
��6��� ��
��6��� ��
��6��� ��
��6��� ��
��6�#� ��
��6�$� ��
Table 7.43: Level of conformance of procedure to criteria for success
Table 7.43 indicates that for all criteria for success other than CE.7, the procedure is in full
conformance. The process was found to be only partially in conformance with criterion CE.7.
No criteria were found for which the process was completely non-conforming, or for which it
was not possible to assign a reliable measurement value.

Chapter 8: Evaluation of results
- 120 -
Chapter 8: Evaluation of results
8.1 Overview of evaluation of results
The purpose of this chapter is to perform evaluation and analysis of the results presented in
‘Chapter 7: Summarised results’, taken from the implementation of procedures defined in
Chapters 4 and 5 relating to theoretical and empirical evaluation of models.
The purpose of the evaluation process is to produce findings from the implementation
of an experimental procedure and the corresponding results data sets obtained. This is achieved
through examination and interpretation of experimental results to determine if the proposed
hypotheses can be shown to hold true, or if the arguments they contain can be shown to be
flawed. In the former situation, it is necessary to provide evidence and backing arguments to
support this position. In the latter situation, it is also necessary to provide evidence of this
position, but there is an additional requirement to examine the information available to propose
and explain alternative positions. Observations germane to the analysis of the process quality
models are examined to identify possible findings and their relevance to the overall
understanding of the field of models obtained through the experimental process.
The findings of the experimental procedures and the analysis of the associated results
sets are assembled and utilised in ‘Chapter 10: Conclusions’ to draw high-level conclusions on
the field of software process quality models and associated issues from the lower-level products
of this chapter.
8.2 Theoretical evaluation results
8.2.1 Theoretical evaluation results overview
The purpose of this section of Chapter 8 is to consider the results of application of the
theoretical evaluation procedure for process quality models. These results were summarised in
Chapter 7, but also include consideration of additional information and observations recorded
during this process. Some of this information is to be found in Appendices E, F, G, H and I.
Evaluation is performed both on the results of application of experimental process to models
and on the experimental process itself. In evaluation of the models, as there is no ‘ideal’ model
in existence to make comparison to, instead comparison is made with a set of properties which
would hold true of an ‘ideal’ model. In evaluation of the theoretical evaluation procedure,
comparison is performed between the implemented procedure and a set of criteria for success.

Chapter 8: Evaluation of results
- 121 -
8.2.2 Comparative evaluation of models
8.2.2.1 Comparison of model content and scope
Evaluation of the content of the process quality models in the evaluation set is performed
through mapping the content elements of each model to those in the definition of a reference
standard model. This method is described in ‘Appendix H: Mapping between elements of
quality models’, and the results of its application are presented in ‘Appendix I: Results of
mapping between quality models’. The ISO 9001:1994 model is selected as the standard
reference model, without the associated ISO 9000-3 guidelines for use in the context of software
engineering, for reasons explained in Appendix H. The evaluation set of process quality models
is defined in Appendix M, Table M.1.
Each model in the evaluation set is considered in turn, performing two forms of
evaluation procedure on each. The first evaluation procedure establishes the extent of coincident
content in the evaluated model and the reference model, to measure the level of similarity in
content type. This is performed by identifying content element types in the reference standard
model for which there is no equivalent in the evaluated model. It is considered that the greater
the proportion of content in the reference standard model for which there is an equivalent in the
assessed model, the higher the quality of the assessed model. The second evaluation procedure
establishes differences in content type between the evaluated model and the reference standard
model, identifying content element types present in the evaluation model for which there is no
equivalent in the reference standard model. It is considered that the existence of additional
content not found in the reference standard model is indicative of higher quality. Where
reference is made to user classes, these are taken from Table C.1 of ‘Appendix C: Derivation of
user classes’.
8.2.2.1.1 Model 1: ISO 9001:1994 / ISO 9000-3 [ISO9001], [ISO9000-3]
From the results, it can be seen that there are no ISO 9001:1994 elements for which there are no
corresponding elements in the model formed from the combination of ISO 9001:1994 / ISO
9000-3. There is a strong correlation, as the ISO 9000-3 usage guidelines were designed
specifically to operate with the ISO 9001 model, and in some cases the former quotes verbatim
from the latter. The defined content elements of the ISO 9001:1994 / ISO 9000-3 model are a
superset of those in the ISO 9001:1994 model. Therefore, there are no content types present in
ISO 9001:1994 that are not present in ISO 9001:1994 / ISO 9000-3. It can therefore be
concluded that ISO 9001:1994 / ISO 9000-3 provides coverage of a similar range of content
types to ISO 9001:1994, albeit with a greater level of detail. ISO 9001:1994 / ISO 9000-3 can
be considered to be comparable to ISO 9001:1994, and therefore of comparable quality in
respect of content type and scope. It can be seen that the scope of ISO 9001:1994 / ISO 9000-3
is a superset of the scope of ISO 9001:1994.

Chapter 8: Evaluation of results
- 122 -
There is one content element present in the ISO 9001:1994 / ISO 9000-3 model for
which there is no mapping from the ISO 9001:1994 model. Examination of the ISO 9000-3
definition [ISO9000-3] reveals that ISO 9001:1994 / ISO 9000-3 has additional content,
described in Table 8.1:
����
�������
�� ���
� � ���
� ���������������������� ����� � ������
����������������������������� ��
�����������������������
��� � �� ��
�� ��
���� ��
����
�������
� ���� ��
��������
������ ��
��������
����������������������� �������������������� ������
�������� ����� ����� ��!���"� ���� ���� ������ ����
� ���������� ��� �#������������ ������ �� ���������
�� ����������� ���� ��� �� $%&'()))�*+�� %�� ����� ,��
�- ������ ����� �� � ����� ,�� ��� ����� �� ��� ������ �
��� ����� ������� �������������.� �������������
�������� ���� "��������� �����������������������
������ �������� ��
/�"�/0�
Table 8.1: Content types in ISO 9001:1994 / ISO 9000-3 having no equivalent in ISO 9001:1994
From this analysis, it can be concluded that the scope of ISO 9001:1994 / ISO 9000-3 extends
beyond that of ISO 9001:1994.
8.2.2.1.2 Model 2: SPICE v1.0 [SPI95]
From the results, it can be seen that there are no ISO 9001:1994 elements for which there are no
corresponding elements in the SPICE model. It can therefore be concluded that SPICE provides
coverage of a similar range of content types as those supported by the ISO 9001:1994 model. In
respect of content types and scope, SPICE can be considered to be comparable to ISO
9001:1994 as it provides coverage of the same content types, and can therefore be considered to
be of comparable quality in respect of content type and scope. It can be seen that the scope of
SPICE is a superset of the scope of ISO 9001:1994. This is to be expected, as SPICE is intended
to consider process quality and process improvement, the latter of which is not intended to be
covered by ISO 9001:1994. In addition, the SPICE model provides a greater level of content
definition detail than ISO 9001.
There are eight elements present in the SPICE model for which there are no mappings
from the ISO 9001:1994 model. Examination of the SPICE definition [SPI95] identifies the
following content areas, described in Table 8.2:
� �!"�
�� ���
� � ���
� ���������������������� ����� � ������
� �!"��� ��
�� ��#��
��� � �� ��
�� ��
���� ��
12'���
�1��� ��!�������
������
��� ��� ������ ��, �������������� �� �����
����������������������������� ��!������3� �
�����,���������� ����������� ����������
�����"� ��������������������� ��������
���� ��
/0�
�4����
�1���������5� ��
1������ ��
��� ��� � ���������������,� �� ������ �����
� ���������.� ������ ����6��� ����� ������
�� ��������3� � ��������� ������� ��.������ ���
�� �������� ���� ��
/�"�/0"�/*�
�40���
�1������
��� ��� ����� �������������������� �����������
�������� ���� "�� ������� ����� �����
/0�
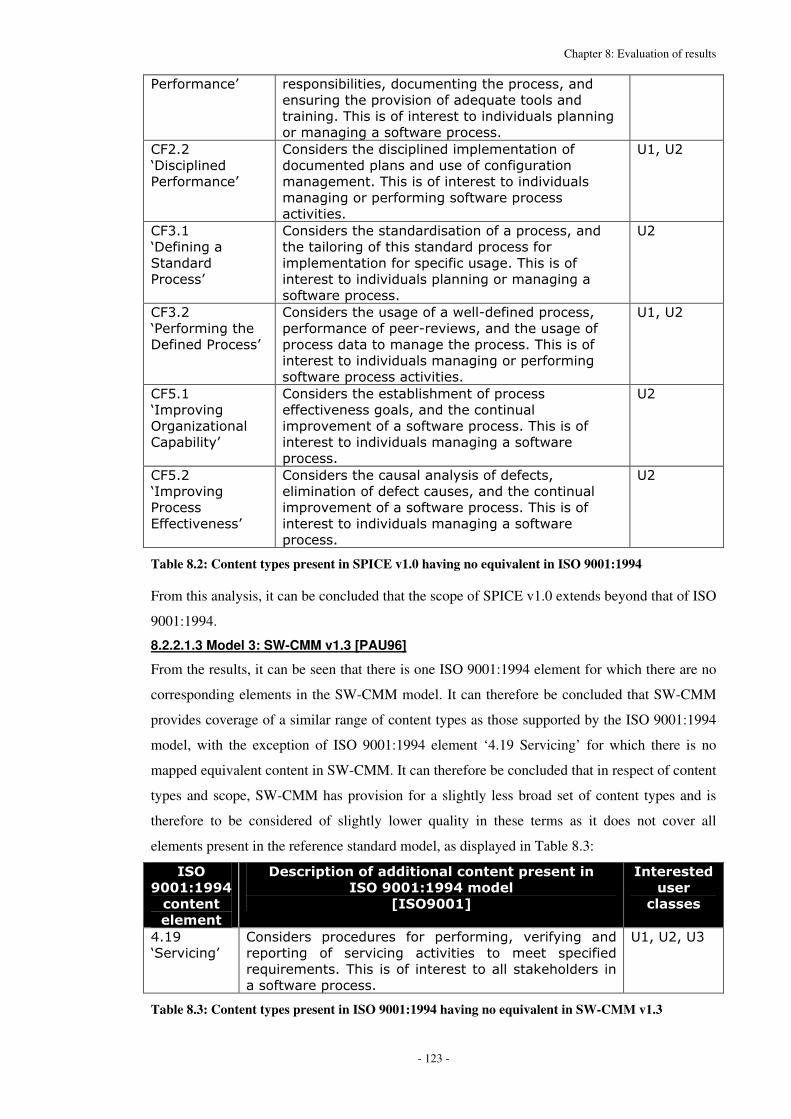
Chapter 8: Evaluation of results
- 123 -
1������������ �� �� ,�� "���������������� ���� "�����
�� ��������� ��� ���������#�������� �����
��������3� � ��������� ����������� � ������
������������� �������� ���� ��
�40�0�
�7 � ����
1������������
��� ��� ������ � ����� �������������
����������� �� ������ �����������������
������������3� � ��������� ����������� �
����������� ��������� �������� ���� �
������ ��
/�"�/0�
�4*���
�7��������
&��������
1���� ��
��� ��� ����� ������� ���������� ���� "�����
���������������� � �������� ���� �����
� �������������� ������ �����3� � ����
����� ����������� � �������������������
�������� ���� ��
/0�
�4*�0�
�1�������������
7������1���� ��
��� ��� ������ ������������������� ���� "�
�������������� ��������� "���������� �������
���� �������������������� ���� ��3� � ����
����� ����������� ������������ ���������
�������� ���� ������� ��
/�"�/0�
�4����
�%� ������
'����8������
�� �,����
��� ��� ������ ��, ��������� ���� �
���������� ���� "�����������������
� �������������� �������� ���� ��3� � ����
����� ����������� ����������� ��������
���� ��
/0�
�4��0�
�%� ������
1���� �
9��������� ��
��� ��� �������� ������ ���������� "�
��������������������� � "�����������������
� �������������� �������� ���� ��3� � ����
����� ����������� ����������� ��������
���� ��
/0�
Table 8.2: Content types present in SPICE v1.0 having no equivalent in ISO 9001:1994
From this analysis, it can be concluded that the scope of SPICE v1.0 extends beyond that of ISO
9001:1994.
8.2.2.1.3 Model 3: SW-CMM v1.3 [PAU96]
From the results, it can be seen that there is one ISO 9001:1994 element for which there are no
corresponding elements in the SW-CMM model. It can therefore be concluded that SW-CMM
provides coverage of a similar range of content types as those supported by the ISO 9001:1994
model, with the exception of ISO 9001:1994 element ‘4.19 Servicing’ for which there is no
mapped equivalent content in SW-CMM. It can therefore be concluded that in respect of content
types and scope, SW-CMM has provision for a slightly less broad set of content types and is
therefore to be considered of slightly lower quality in these terms as it does not cover all
elements present in the reference standard model, as displayed in Table 8.3:
����
����������
�� ���
� � ���
� ���������������������� ����� � ������
���������������� ��
����������
��� � �� ��
�� ��
���� ��
:��(�
�&��������
��� ��� � �������� � ���� ��������"� �������� ����
�� ������ ��� ������� ������ � ��� ����� ������
��#������� ��3� � ��������� ������� ��.������ ���
�� �������� ���� ��
/�"�/0"�/*�
Table 8.3: Content types present in ISO 9001:1994 having no equivalent in SW-CMM v1.3
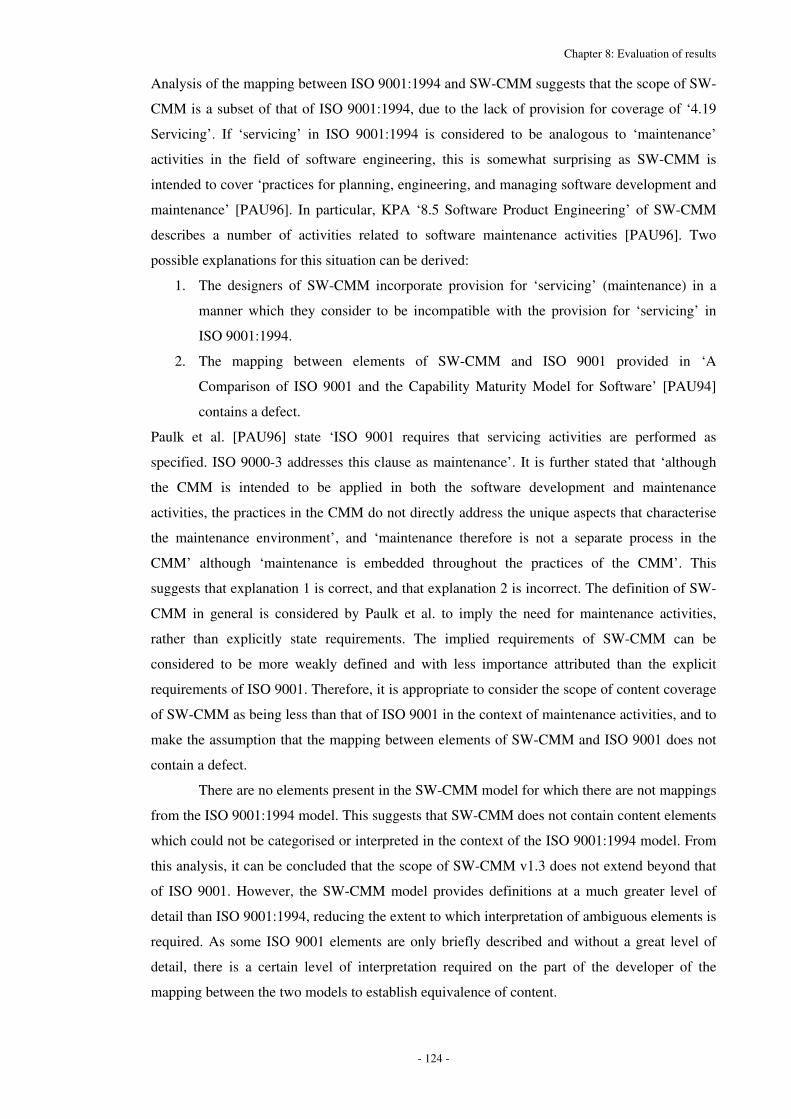
Chapter 8: Evaluation of results
- 124 -
Analysis of the mapping between ISO 9001:1994 and SW-CMM suggests that the scope of SW-
CMM is a subset of that of ISO 9001:1994, due to the lack of provision for coverage of ‘4.19
Servicing’. If ‘servicing’ in ISO 9001:1994 is considered to be analogous to ‘maintenance’
activities in the field of software engineering, this is somewhat surprising as SW-CMM is
intended to cover ‘practices for planning, engineering, and managing software development and
maintenance’ [PAU96]. In particular, KPA ‘8.5 Software Product Engineering’ of SW-CMM
describes a number of activities related to software maintenance activities [PAU96]. Two
possible explanations for this situation can be derived:
1. The designers of SW-CMM incorporate provision for ‘servicing’ (maintenance) in a
manner which they consider to be incompatible with the provision for ‘servicing’ in
ISO 9001:1994.
2. The mapping between elements of SW-CMM and ISO 9001 provided in ‘A
Comparison of ISO 9001 and the Capability Maturity Model for Software’ [PAU94]
contains a defect.
Paulk et al. [PAU96] state ‘ISO 9001 requires that servicing activities are performed as
specified. ISO 9000-3 addresses this clause as maintenance’. It is further stated that ‘although
the CMM is intended to be applied in both the software development and maintenance
activities, the practices in the CMM do not directly address the unique aspects that characterise
the maintenance environment’, and ‘maintenance therefore is not a separate process in the
CMM’ although ‘maintenance is embedded throughout the practices of the CMM’. This
suggests that explanation 1 is correct, and that explanation 2 is incorrect. The definition of SW-
CMM in general is considered by Paulk et al. to imply the need for maintenance activities,
rather than explicitly state requirements. The implied requirements of SW-CMM can be
considered to be more weakly defined and with less importance attributed than the explicit
requirements of ISO 9001. Therefore, it is appropriate to consider the scope of content coverage
of SW-CMM as being less than that of ISO 9001 in the context of maintenance activities, and to
make the assumption that the mapping between elements of SW-CMM and ISO 9001 does not
contain a defect.
There are no elements present in the SW-CMM model for which there are not mappings
from the ISO 9001:1994 model. This suggests that SW-CMM does not contain content elements
which could not be categorised or interpreted in the context of the ISO 9001:1994 model. From
this analysis, it can be concluded that the scope of SW-CMM v1.3 does not extend beyond that
of ISO 9001. However, the SW-CMM model provides definitions at a much greater level of
detail than ISO 9001:1994, reducing the extent to which interpretation of ambiguous elements is
required. As some ISO 9001 elements are only briefly described and without a great level of
detail, there is a certain level of interpretation required on the part of the developer of the
mapping between the two models to establish equivalence of content.

Chapter 8: Evaluation of results
- 125 -
8.2.2.1.4 Weaknesses of ISO 9001:1994
From the above, it is possible to identify types of content not present in ISO 9001:1994 but that
are present in other evaluated models. Improvement of the ISO 9001:1994 model could include
redevelopment to include provision for these content types, which include:
• Support for project life-cycle planning
• Greater discipline in planning a process
• Greater discipline in performing a process
• Support for defining an organisation-wide standard process
• Support for tailoring an organisation-wide standard process to a particular project
8.2.2.2 Recommended model by scope analysis
It is considered desirable for the scope of a process quality model to be as large as possible. A
model with larger, broader scope can consider a greater proportion of a software process, and
therefore produce assessment results that are more representative of the true quality of a
software process. A larger, broader scope allowing more representative results is associated with
higher quality models. Therefore, a list of models in the evaluation set ranked in order of
decreasing scope is equivalent to a list of models ranked in order of decreasing quality. Table
8.4 presents this list, in which the reference standard model (which is not a member of the
evaluation set) is shown in italics and is not assigned a rank, but is displayed for purposes of
reference.
$��%� &� ��
�� ;����0�<&1%�9����)=�
0� ;������<%&'�())���((:�6�%&'�()))�*=�
�� �������������� ������� �������
*� ;����*�<&>��;;����*=�
Table 8.4: Models ranked in order of decreasing quality, as determined by assessment of scope
8.2.2.2.1 Rationale for ranking of models in Table 8.4
Model 3 (SW-CMM) was found to have smaller scope than the reference model, so appears
below it at the bottom of the ranked list. Models 1 (ISO 9001:1994 / ISO 9000-3) and 2 (SPICE
v1.0)�were found to have larger scope than the reference model, so appear above it in the ranked
list, occupying the top two places. Model 2 was found to have larger scope than Model 1, as it
featured more content items not present in the reference model than Model 1 was found to have.
Therefore, Model 2 would be recommended as the model with the greatest scope. However, the
scope of all models was found to be broadly similar with only relatively small differences
observed.
8.2.2.3 Recommended model by size of model content
Table 7.23 in Chapter 7 lists the number of content elements for each of the models in the
evaluation set, which is a measure of the size of the model content if the assumption is made
Chapter 8: Evaluation of results
- 126 -
that a greater number of elements is associated with a larger model. In Table 7.23, models are
ranked in order of increasing size. There are advantages and disadvantages to a larger model. A
larger model may be assumed to provide greater depth of coverage and greater detail in
definition. However, this is at the expense of increased assessment cost, time, administrative
overhead, and amount of results data to be analysed and understood. Therefore, it is assumed
that the ‘best’ choice of model for purposes of practicality of application is the smallest model
for which all of the user requirements are fulfilled. If it is assumed that the scope of all models
in the evaluation set is adequate for the purposes of measuring the quality of a software process
(see ‘Models ranked in order of decreasing scope’ in this chapter), it can be seen that of models
1-3, model 1 ‘ISO 9001:1994 / ISO 9000-3’ has the smallest number of content elements.
Therefore, this model would be recommended from examination of these criteria, as it is
expected to have the lowest level of implementation overheads.
8.2.2.4 Model detail level
It is possible to perform comparative evaluation of the level of detail in the documented
definitions for the models in the evaluation set. If variable X represents a numerical measure of
model scope and variable Y represents a numerical measure of model content size, then dividing
X by Y would provide a numerical rating of the level of detail where higher values correspond
to higher levels of detail.
However, absolute numerical measures are not produced in this study for measurements
of model scope. Therefore, comparison must be performed by examining ranked lists of
decreasing model scope and decreasing model content size. If the order of both ranked lists is
not identical, this indicates that the model content size difference cannot be explained solely
through model scope size, where a model with larger scope would always be found to have a
larger content size. If model X has more content elements than model Y, yet the scope of model
X is smaller than that of model Y, this is explained by model X examining the quality issues
within its scope at a higher level of detail. Therefore, if the orders of models in ranked lists of
decreasing model scope and decreasing model content size are not identical, this indicates that
models in the evaluation set are defined at different levels of detail as scope size is not directly
proportional to content size.
Table 8.5 indicates that this was found to be the case for the evaluation set of models,
which are correspondingly found to have been defined at non-equivalent levels of detail (data
taken from Tables 7.23 and 8.4). It is therefore concluded that the models in the evaluation set
are not defined at an equal level of detail.
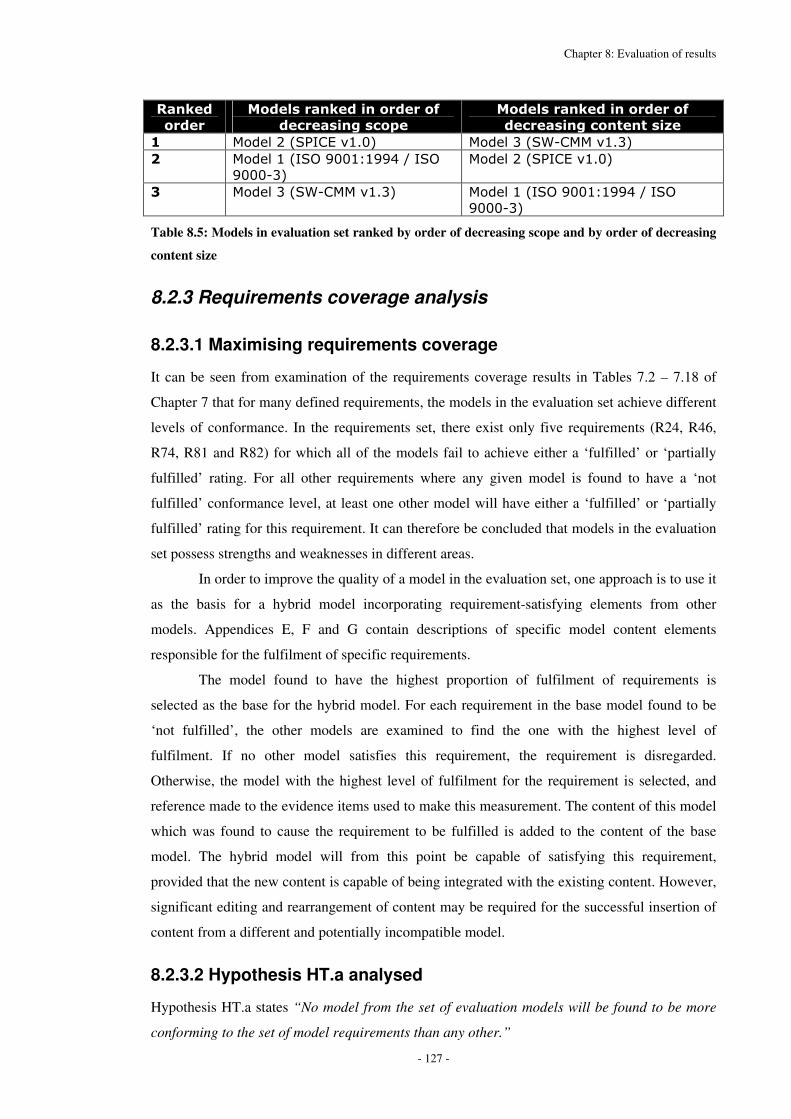
Chapter 8: Evaluation of results
- 127 -
$��% ��
�� ��
&� ������% ������� ����
� � ����'��� �
&� ������% ������� ����
� � ����'��� �����( �
�� ;����0�<&1%�9����)=� ;����*�<&>��;;����*=�
)� ;������<%&'�())���((:�6�%&'�
()))�*=�
;����0�<&1%�9����)=�
�� ;����*�<&>��;;����*=� ;������<%&'�())���((:�6�%&'�
()))�*=�
Table 8.5: Models in evaluation set ranked by order of decreasing scope and by order of decreasing
content size
8.2.3 Requirements coverage analysis
8.2.3.1 Maximising requirements coverage
It can be seen from examination of the requirements coverage results in Tables 7.2 – 7.18 of
Chapter 7 that for many defined requirements, the models in the evaluation set achieve different
levels of conformance. In the requirements set, there exist only five requirements (R24, R46,
R74, R81 and R82) for which all of the models fail to achieve either a ‘fulfilled’ or ‘partially
fulfilled’ rating. For all other requirements where any given model is found to have a ‘not
fulfilled’ conformance level, at least one other model will have either a ‘fulfilled’ or ‘partially
fulfilled’ rating for this requirement. It can therefore be concluded that models in the evaluation
set possess strengths and weaknesses in different areas.
In order to improve the quality of a model in the evaluation set, one approach is to use it
as the basis for a hybrid model incorporating requirement-satisfying elements from other
models. Appendices E, F and G contain descriptions of specific model content elements
responsible for the fulfilment of specific requirements.
The model found to have the highest proportion of fulfilment of requirements is
selected as the base for the hybrid model. For each requirement in the base model found to be
‘not fulfilled’, the other models are examined to find the one with the highest level of
fulfilment. If no other model satisfies this requirement, the requirement is disregarded.
Otherwise, the model with the highest level of fulfilment for the requirement is selected, and
reference made to the evidence items used to make this measurement. The content of this model
which was found to cause the requirement to be fulfilled is added to the content of the base
model. The hybrid model will from this point be capable of satisfying this requirement,
provided that the new content is capable of being integrated with the existing content. However,
significant editing and rearrangement of content may be required for the successful insertion of
content from a different and potentially incompatible model.
8.2.3.2 Hypothesis HT.a analysed
Hypothesis HT.a states “No model from the set of evaluation models will be found to be more
conforming to the set of model requirements than any other.”

Chapter 8: Evaluation of results
- 128 -
Examination of the summarised results presented in Tables 7.19 – 7.21 show that this
hypothesis does not hold true upon examination of the evaluation set of process quality models.
For each model considered, a value was derived for the proportion of requirements for which
the model was found to be at a conformance level of ‘fulfilled’, ‘partially fulfilled’ and ‘not
fulfilled’ for the total set of requirements of an ideal process quality model defined in
‘Appendix B: Requirements of an ideal process quality model’.
� &������� &�*����� $��' ���( �
+������ ��
� ,��� � ����
??@�
&>��;;����*�
A�@�
%&'�())���((:�6�
%&'�()))�*��
�@�
-�������� ��
� ,��� � ����
�(@�
����� ���������
����� ���
0A@�
&>��;;����*�
B@�
Table 8.6: Measured ranges of requirement fulfilment levels
Table 8.6 displays measured proportions of ‘fulfilled’ requirements, a measure of the level of
conformance for the models, with a range size of 5% between the minimum and maximum
observed values. Table 8.6 also displays measured proportions of ‘not fulfilled’ requirements, a
measure of the level of non-conformance for the models, with a range size of 8% between the
minimum and maximum observed values.
These sizes of range indicate a significant, although relatively small, difference in overall
level of conformance of the set of models to the set of requirements. From these measurements
in these tables, the models can be ranked in order of decreasing conformance:
1. Model 1 (ISO 9001:1994 / ISO 9000-3)
2. Model 2 (SPICE v1.0)
3. Model 3 (SW-CMM v1.3)
It can therefore be seen that the null hypothesis HT.a has been disproved through this
experimental procedure. This indicates that there are genuine differences in the content and
quality of the models. The ranked list above of decreasing conformance can therefore be
considered to act as a list ranked by decreasing quality, where ‘quality’ is defined in terms of
conformance to requirements of an ideal process quality model.
8.2.3.3 Hypothesis HT.b analysed
Hypothesis HT.b states “No model from the set of evaluation models shall be found for which it
is more relevant to the needs of one user class than any other identified user class.”
Examination of the summarised results presented in Tables 7.19 – 7.21 show that this
hypothesis does not hold true upon examination of the evaluation set of process quality models.
For each model considered, a value was derived for the proportion of requirements for which
the model was found to be at a conformance level of ‘fulfilled’, ‘partially fulfilled’ and ‘not
fulfilled’, for each of the user classes mapped to requirements in ‘Appendix D: Relationship
between user classes and requirements’.

Chapter 8: Evaluation of results
- 129 -
For each model in the evaluation set, there was an observable range between the highest and
lowest measured conformance values for the defined user classes.
The level of relevance of a model to a user class can be determined by considering the
proportion of ‘fulfilled’ requirements for the particular combination of user class and model.
This takes into consideration only those requirements which are relevant to the user class, as the
proportion of these that are successfully fulfilled represents the relevant provision of content for
the user class. Lists are presented for each model of user classes, in ranked order of deceasing
relevance to user class. All values are rounded to the nearest significant figure.
8.2.3.3.1 Model 1 (ISO 9001:1994 / ISO 9000-3):
1. U1: Software developer (80%)
2. U3: Customer (77%)
3. U2: Software process manager (73%)
Conformance is over 50% in all cases, so the model satisfies the majority of requirements of all
user classes. Range size between minimum and maximum observed conformance values is 7%.
It can be seen that there remains a significant difference in the conformance values for the user
classes in the list. Therefore, there exists a significant difference in the relevance of this model
to the needs of different user classes. This process quality model is most suited to user class U1,
and least suited to user class U2. However, the range is not so large that the model is unfairly
biased toward the needs of any given user class. A key aim of the ISO 9001 model is to allow
for the ‘assessment of the capability of a supplier by external parties’ [ISO9001], and so it is
important that the needs of user class U3 are sufficiently satisfied.
8.2.3.3.2 Model 2 (SPICE v1.0)
1. U3: Customer (68%)
2. U2: Software process manager (67%)
3. U1: Software developer (65%)
Conformance is over 50% in all cases, so the model satisfies the majority of requirements of all
user classes. Range size between minimum and maximum observed conformance values is 3%.
The difference in conformance values for the user classes in the list is small. As this difference
is not large enough to be considered significant, there does not exist a significant difference in
the relevance of this model to the needs of members of the different user classes. This process
quality model is most suited to user class U3, and least suited to user class U1. However, the
values for U3 and U2 are very close, and therefore as the difference in value for these two
models is so small there is not a significant difference in suitability. This model is not unfairly
biased towards the needs of any given user class, as the range of values is so small.
8.2.3.3.3 Model 3 (SW-CMM v1.3)
1. U2: Software process manager (74%)
2. U1: Software developer (69%)
3. U3: Customer (63%)

Chapter 8: Evaluation of results
- 130 -
Conformance is over 50% in all cases, so the model satisfies the majority of requirements of all
user classes. Range size between minimum and maximum observed conformance values is
11%. It can be seen that there remains a significant difference in the conformance values for the
user classes in the list. Therefore, there exists a significant difference in the relevance of this
model to the needs of different user classes. This process quality model is most suited to user
class U2, and least suited to user class U3. However, the range is not so large that the model is
unfairly biased toward the needs of any given user class.
It can therefore be seen that the null hypothesis HT.b has been disproved, as there are
models for which there is a significant observable difference in relevance to user classes
(models 1 and 3). Therefore, models are more suited to the needs of members of some user
classes than others. In this situation, when selecting between alternative candidate process
quality models, it would be necessary to identify user classes and the requirements associated
with each user class, and to determine which model best meets the needs of these user classes.
As both hypotheses have been disproved, then it is the case that there are fundamental
differences in the theoretical content of the models which must be considered when proposing a
candidate model for selection for usage within an organisation. These would be fundamental
differences which would not disappear through the application of specialised utilisation
procedures.
8.2.3.4 Recommended model by requirement satisfaction level: for
all requirements
From the results presented in Tables 7.19 – 7.21, it is possible to identify a candidate model for
which the proportion of ‘fulfilled’ requirements is the highest and the proportion of ‘not
fulfilled’ requirements is the lowest, when considering the total set of requirements R1 – R85.
This model can be considered to be the most suitable candidate for recommendation for usage
where the intended user is a combination of the defined user class U1 – U3. This model is also
to be recommended where the intended user is not a member of these defined user classes, but
whose requirements are thought to be largely in line with those defined in the set of
requirements from ‘Appendix B: Requirements of an ideal process quality model’. Therefore,
this model is the recommended selection from the viewpoint of the software process as a whole,
rather than that of a specific user class, as this approach considers all requirements of all user
classes.
It is desirable for as large as possible a proportion of requirements to be fulfilled by a
model. Therefore, a list ranked in order of decreasing compliance with the requirements set is
equivalent to a list ranked in order of decreasing quality of model, as presented in Table 8.7. All
percentages are rounded to the nearest significant figure. The range size is 5% between the
maximum and minimum ‘fulfilled requirements’ proportion, which is relatively small although
large enough to be of significance when selecting between models.
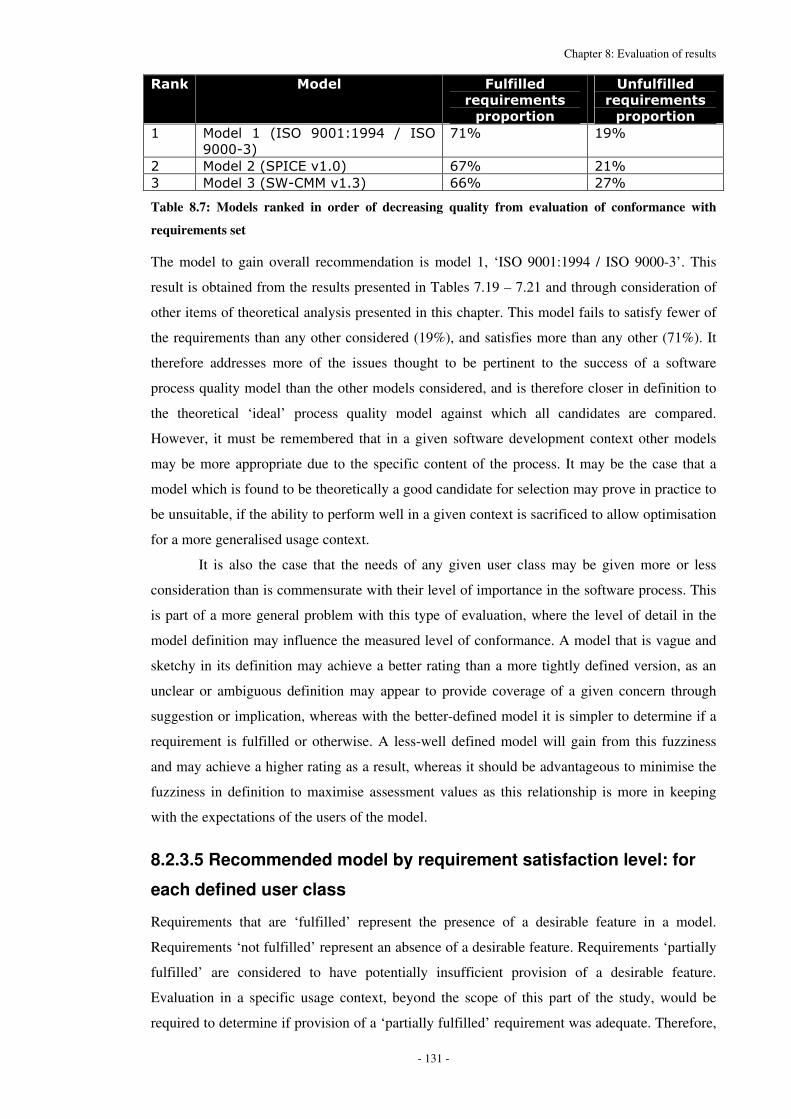
Chapter 8: Evaluation of results
- 131 -
$��%� &� �� +������ ��
� ,��� � ����
��������
-�������� ��
� ,��� � ����
��������
�� ;���� �� <%&'� ())���((:� 6� %&'�
()))�*=�
A�@� �(@�
0� ;����0�<&1%�9����)=� ?A@� 0�@�
*� ;����*�<&>��;;����*=� ??@� 0A@�
Table 8.7: Models ranked in order of decreasing quality from evaluation of conformance with
requirements set
The model to gain overall recommendation is model 1, ‘ISO 9001:1994 / ISO 9000-3’. This
result is obtained from the results presented in Tables 7.19 – 7.21 and through consideration of
other items of theoretical analysis presented in this chapter. This model fails to satisfy fewer of
the requirements than any other considered (19%), and satisfies more than any other (71%). It
therefore addresses more of the issues thought to be pertinent to the success of a software
process quality model than the other models considered, and is therefore closer in definition to
the theoretical ‘ideal’ process quality model against which all candidates are compared.
However, it must be remembered that in a given software development context other models
may be more appropriate due to the specific content of the process. It may be the case that a
model which is found to be theoretically a good candidate for selection may prove in practice to
be unsuitable, if the ability to perform well in a given context is sacrificed to allow optimisation
for a more generalised usage context.
It is also the case that the needs of any given user class may be given more or less
consideration than is commensurate with their level of importance in the software process. This
is part of a more general problem with this type of evaluation, where the level of detail in the
model definition may influence the measured level of conformance. A model that is vague and
sketchy in its definition may achieve a better rating than a more tightly defined version, as an
unclear or ambiguous definition may appear to provide coverage of a given concern through
suggestion or implication, whereas with the better-defined model it is simpler to determine if a
requirement is fulfilled or otherwise. A less-well defined model will gain from this fuzziness
and may achieve a higher rating as a result, whereas it should be advantageous to minimise the
fuzziness in definition to maximise assessment values as this relationship is more in keeping
with the expectations of the users of the model.
8.2.3.5 Recommended model by requirement satisfaction level: for
each defined user class
Requirements that are ‘fulfilled’ represent the presence of a desirable feature in a model.
Requirements ‘not fulfilled’ represent an absence of a desirable feature. Requirements ‘partially
fulfilled’ are considered to have potentially insufficient provision of a desirable feature.
Evaluation in a specific usage context, beyond the scope of this part of the study, would be
required to determine if provision of a ‘partially fulfilled’ requirement was adequate. Therefore,

Chapter 8: Evaluation of results
- 132 -
selection of a model for recommendation is achieved through determining which has the highest
proportion of ‘fulfilled’ requirements, i.e. is associated with the highest proportion of desirable
features.
8.2.3.5.1 U1: Software developer
From the results presented in Tables 7.19 – 7.21, it is possible to identify that model 1 ‘ISO
9001:1994 / ISO 9000-3’ produces a higher proportion of ‘fulfilled’ requirements (80%) and a
lower proportion of ‘not fulfilled’ requirements (14%) than the alternatives considered for this
user class. Table 8.8 shows a ranked list of models in the evaluation set in order of decreasing
relevance (and hence quality) in the context of this user class. The range size is 15%, which is of
sufficient significance to be of interest when selecting between models. All percentages are
rounded to the nearest significant figure.
$��%� &� �� +������ ��
� ,��� � ����
��������
-�������� ��
� ,��� � ����
��������
�� ;���� �� <%&'� ())���((:� 6� %&'�
()))�*=�
B)@� �:@�
0� ;����*�<&>��;;����*=� ?(@� 0A@�
*� ;����0�<&1%�9����)=� ?�@� 0:@�
Table 8.8: Models ranked in order of decreasing quality from evaluation of conformance with
requirements set for user class U1
8.2.3.5.2 U2: Software process manager
From the results presented in Tables 6.19 – 6.21, it is possible to identify that model 3 ‘SW-
CMM v1.3’ produces a higher proportion of ‘fulfilled’ requirements than the alternatives
considered for this user class (74% ‘fulfilled’, 19% ‘not fulfilled’ and 7% ‘partially fulfilled’),
although model 1 ‘ISO 9001:1994 / ISO 9000-3’ has fewer ‘not fulfilled’ requirements (72%
‘fulfilled’, 17% ‘not fulfilled’ and 10% ‘partially fulfilled’). Therefore, for this user class, model
3 ‘SW-CMM v1.3’ is identified as the recommended model.
Table 8.9 shows a ranked list of models in the evaluation set in order of decreasing
relevance (and hence quality) in the context of this user class. The range size is 7% which,
although relatively small, is of sufficient significance to be of interest when selecting between
models. All percentages rounded to the nearest significant figure.
$��%� &� �� +������ ��
� ,��� � ����
��������
-�������� ��
� ,��� � ����
��������
�� ;����*�<&>��;;����*=� A:@� �(@�
0� ;���� �� <%&'� ())���((:� 6� %&'�
()))�*=�
A0@� �A@�
*� ;����0�<&1%�9����)=� ?A@� 00@�
Table 8.9: Models ranked in order of decreasing quality from evaluation of conformance with
requirements set for user class U2
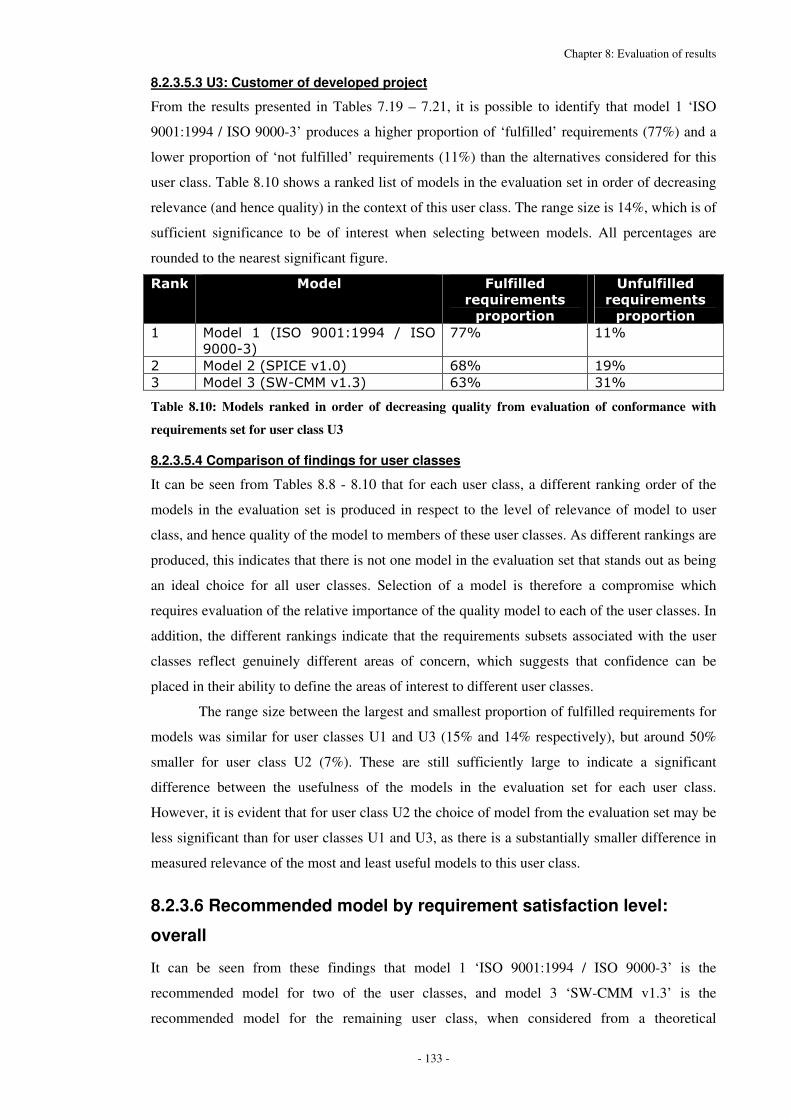
Chapter 8: Evaluation of results
- 133 -
8.2.3.5.3 U3: Customer of developed project
From the results presented in Tables 7.19 – 7.21, it is possible to identify that model 1 ‘ISO
9001:1994 / ISO 9000-3’ produces a higher proportion of ‘fulfilled’ requirements (77%) and a
lower proportion of ‘not fulfilled’ requirements (11%) than the alternatives considered for this
user class. Table 8.10 shows a ranked list of models in the evaluation set in order of decreasing
relevance (and hence quality) in the context of this user class. The range size is 14%, which is of
sufficient significance to be of interest when selecting between models. All percentages are
rounded to the nearest significant figure.
$��%� &� �� +������ ��
� ,��� � ����
��������
-�������� ��
� ,��� � ����
��������
�� ;���� �� <%&'� ())���((:� 6� %&'�
()))�*=�
AA@� ��@�
0� ;����0�<&1%�9����)=� ?B@� �(@�
*� ;����*�<&>��;;����*=� ?*@� *�@�
Table 8.10: Models ranked in order of decreasing quality from evaluation of conformance with
requirements set for user class U3
8.2.3.5.4 Comparison of findings for user classes
It can be seen from Tables 8.8 - 8.10 that for each user class, a different ranking order of the
models in the evaluation set is produced in respect to the level of relevance of model to user
class, and hence quality of the model to members of these user classes. As different rankings are
produced, this indicates that there is not one model in the evaluation set that stands out as being
an ideal choice for all user classes. Selection of a model is therefore a compromise which
requires evaluation of the relative importance of the quality model to each of the user classes. In
addition, the different rankings indicate that the requirements subsets associated with the user
classes reflect genuinely different areas of concern, which suggests that confidence can be
placed in their ability to define the areas of interest to different user classes.
The range size between the largest and smallest proportion of fulfilled requirements for
models was similar for user classes U1 and U3 (15% and 14% respectively), but around 50%
smaller for user class U2 (7%). These are still sufficiently large to indicate a significant
difference between the usefulness of the models in the evaluation set for each user class.
However, it is evident that for user class U2 the choice of model from the evaluation set may be
less significant than for user classes U1 and U3, as there is a substantially smaller difference in
measured relevance of the most and least useful models to this user class.
8.2.3.6 Recommended model by requirement satisfaction level:
overall
It can be seen from these findings that model 1 ‘ISO 9001:1994 / ISO 9000-3’ is the
recommended model for two of the user classes, and model 3 ‘SW-CMM v1.3’ is the
recommended model for the remaining user class, when considered from a theoretical

Chapter 8: Evaluation of results
- 134 -
evaluation viewpoint. In addition, model 1 ‘ISO 9001:1994 / ISO 9000-3’ is found to be the
recommended model when considered from the viewpoint of the process as a whole, rather than
that of a specific user class. The process of theoretical evaluation finds model 1, ‘ISO
9001:1994 / ISO 9000-3’, to be closest to the theoretical ‘ideal’ model against which all others
are to be evaluated.
8.2.3.7 Comparison of requirement group coverage
It is plausible that an organisation or individual wishing to select between a number of candidate
process quality models will place greater significance on some areas of software processes than
others. ‘Appendix B: Requirements of an ideal process quality model’ divides the set of
requirements into groups corresponding to particular areas of potential concern. For example, if
an organisation wishes simply to measure the quality of an existing process and has no interest
using the same model to plan and manage process improvement activities in ‘Group G: Process
development’, then measures of process quality that do not take process improvement into
consideration in the formulation of an assessment value can be considered to have an advantage
over those that do. However, other groups of requirements are likely to be of interest to most
users of software processes, for example ‘Group C: Fairness’. It is therefore useful to compare
the coverage of process areas afforded by each of the process quality models in the evaluation
set. Table 7.22 in Chapter 7 presents this information.
Examination of these results does not result in the emergence of any clear pattern. For
Model 1, the range of values is 33-100% (range size 77%). For Model 2, the range of values is
0-100% (range size 100%). For Model 3, the range of values is 0-100% (range size 100%). This
shows that for any given group, the distribution of requirement fulfilment proportions for the
models in the evaluation set may be greater and feature a larger range between minimum and
maximum, than the equivalent distribution for the entire set of requirements (as displayed in
Tables 7.19 - 7.21).
In consideration of the whole set of requirements the range size between minimum and
maximum proportion of ‘fulfilled’ requirements is 5%, with a minimum value of 66% from
Model 3 and a maximum value of 71% from Model 1. In consideration of individual groups of
elements, the largest observed range size between minimum and maximum proportion of
‘fulfilled’ requirements is 100% in the case of Group I, with a minimum value of 0% from
Model 2 and a maximum value of 100% from Models 1 and 3. The observed difference in range
sizes of 95% is significant.
This indicates that the concept of grouping requirements can be of importance when
selecting between different models in the evaluation set, if the user is only interested in
measurement certain aspects of the software process. For example, if the user is interested only
in Group I issues, these results show that the selection of model may have a far greater influence
on the relevance of the process assessment results produced through model application, than if
Chapter 8: Evaluation of results
- 135 -
the user is interested in the issues relevant to all requirement groups. It is therefore
demonstrated that the intended usage context of the model is an important consideration when
selecting a model, and that a ‘one-size-fits-all’ model does not exist in the evaluation set.
8.2.3.8 Recommended model by breadth of requirement group
coverage
If the primary concern of the user is to ensure that no requirements group is entirely neglected,
perhaps to ensure the model considers the broadest possible range of content, then Model 1
would be considered the most appropriate choice as there are no groups for which 0% fulfilment
of group requirements is observed. (See Tables 7.2 - 7.18) Both Model 2 and Model 3 feature
one group (although not the same group) for which a 0% fulfilment of group requirements is
observed. Therefore, if the user’s concept of quality is based on the principle that each type of
content should be covered to at least a minimal extent, this would find Model 1 to be of higher
quality than Models 2 and 3, which would both be found to be at an equivalent level of quality
lower than that of Model 1. Therefore, in this context, Model 1 (ISO 9001:1994 / ISO 9000-3)
would be the recommended candidate model for selection from the evaluation set.
8.3 Empirical evaluation results
8.3.1 Empirical evaluation results overview
The purpose of this section of Chapter 8 is to consider the results of application of the empirical
evaluation procedure for process quality models and software processes. These results were
summarised in Chapter 7, but also include consideration of additional information and
observations recorded during this process. Some of this information is found in Appendices H,
I, P, Q, R, S, T and U. Evaluation is performed of both the results of application of experimental
procedure and of the experimental procedure itself. Evaluation of processes identified in
Appendix N is performed through the application of models identified in Appendix M.
Evaluation of processes is achieved through comparative analysis of these findings. Evaluation
of the empirical evaluation procedure is performed through comparison between the
implemented procedure and a set of criteria for success. None of the case study processes had
been developed in accordance with any of the case study process quality models; therefore the
content of the processes was not biased towards any given model.
8.3.2 Evaluation of processes
Evaluation results of case studies 1a-3b (see Table N.4 of ‘Appendix N: Case study
information’) are presented below. Summarised results are found in Tables 7.26-7.33. The
purpose of this section is to consider each combination of process and model in isolation, then
perform comparison to prove or disprove hypothesis HE.a. Results are analysed in the ‘native

Chapter 8: Evaluation of results
- 136 -
format’ i.e. the results produced through application of a model remain in a format specific to
the model throughout analysis. For each case study, process strengths and weaknesses are
considered in the context of the relevant process quality model.
8.3.2.1 Case study 1a: ISO 9001:1994 / ISO 9000-3 and SEG
Summarised results are presented in Table 7.26. More detailed source data are found in
‘Appendix P: Evidence for results of case studies 1a and 1b’.
For ISO 9001:1994 alone, 54.24% of requirements were satisfied and 40.68% of
requirements not satisfied. For ISO 9001:1994 / ISO 9000-3, 49.14% of requirements were
satisfied and 42.24% of requirements unsatisfied. Therefore, the process is not compliant with
ISO 9001 either with or without ISO 9000-3 usage guidelines, as compliance requires
satisfaction of all requirements. Application of ISO 9000-3 usage guidelines reduces the level of
requirement satisfaction.
8.3.2.1.1 Process strengths
ISO 9001: ‘4.1 Management responsibility’, ‘4.4 Design control’, and ‘4.15 Handling, storage,
packaging, preservation and delivery’.
ISO 9000-3: ‘5 Quality system – Life-cycle activities’. In these areas, a majority of
requirements were fulfilled.
8.3.2.1.2 Process weaknesses
ISO 9001: ‘4.2 Quality system’, ‘4.5 Document and data control’, ‘4.10 Inspection and testing’,
‘4.13 Control of nonconforming product’ and ‘4.14 Corrective and preventative action’.
ISO 9000-3: ‘4 Quality system – Framework’ and ‘6 Quality system – Supporting activities (not
phase dependent)’.
8.3.2.1.3 Process elements of acceptable performance
Those elements not stated in ‘strengths’ or ‘weaknesses’ are considered to perform acceptably.
8.3.2.2 Case study 1b: ISO 9001:1994 / ISO 9000-3 and GNU GCC
Summarised results are presented in Table 7.30. More detailed source data are found in
‘Appendix P: Evidence for results of case studies 1a and 1b’.
For ISO 9001:1994 alone, 52.54% of requirements were satisfied and 44.07% of
requirements not satisfied. For ISO 9001:1994 / ISO 9000-3, 48.23% of requirements were
satisfied and 50.00% of requirements unsatisfied. Therefore, the process is not compliant with
ISO 9001 either with or without ISO 9000-3 usage guidelines, as compliance requires
satisfaction of all requirements. Application of ISO 9000-3 usage guidelines reduces the level of
requirement satisfaction.
8.3.2.2.1 Process strengths
ISO 9001: ‘4.1 Management responsibility’, ‘4.2 Quality system’, 4.5 Document and data
control’, and ‘4.15 Handling, storage, packaging, preservation and delivery’.
ISO 9000-3: ‘5.7 Testing and validation’ and ‘6.1 Configuration management’.

Chapter 8: Evaluation of results
- 137 -
8.3.2.2.2 Process weaknesses
ISO 9001: ‘4.4 Design control’, ‘4.6 Purchasing’, ‘4.10 Inspection and testing’, and ‘4.14
Corrective and preventative action’.
ISO 9000-3: ‘4 Quality system’, ‘5.6 Design and implementation’, and ‘6.4 Measurement’.
8.3.2.2.3 Process elements of acceptable performance
Those elements not stated in ‘strengths’ or ‘weaknesses’ are considered to perform acceptably.
8.3.2.3 Case study 2a: SPICE and SEG
Summarised results are presented in Tables 7.27 and 7.28 in Chapter 7. More detailed source
data are found in ‘Appendix Q: Evidence for results of case studies 2a and 2b’.
8.3.2.3.1 Generic practices
It was found that there was total coverage of generic practices at level 1 (100.00% of elements
attaining L or F), and very good coverage of generic practices at levels 2 and 3 (91.67% and
100.00% of elements attaining L or F respectively). There was no coverage at levels 4 and 5
(0.00% and 0.00% of elements attaining L or F respectively). Therefore, this organization has
reached level 3, ‘Well-defined’.
8.3.2.3.2 Process strengths
Base practice categories ‘PRO: Project process‘ and ‘ENG: Engineering process’
8.3.2.3.3 Process elements of acceptable performance
Base practice category ‘SUP: Support process’.
8.3.2.3.4 Process weaknesses
Base practice categories ‘CUS: Customer-Supplier process’ and ‘ORG: Organisation process’.
8.3.2.4 Case study 2b: SPICE and GNU GCC
Summarised results are presented in Tables 7.31 and 7.32 in Chapter 7. More detailed source
data are found in ‘Appendix Q: Evidence for results of case studies 2a and 2b’.
8.3.2.4.1 Generic practices
It was found that there was total coverage of generic practices at level 1 (100.00% of elements
attaining L or F), very good coverage of generic practices at levels 2 and 3 (66.67% and 60.00%
of elements attaining L or F respectively), and insignificant coverage of level 4 (0.00% of
elements attaining L or F) and no coverage of level 5 (0.00% of elements attaining L or F).
Generic practice ‘3.2.3 Use well-defined data’ is rated ‘N: Not adequate‘ preventing attainment
of level 3. Therefore, this organization has reached level 2, ‘Planned-and-Tracked’.
8.3.2.4.2 Process strengths
Base practice categories ‘ENG: Engineering process’ and ‘SUP: Support process’.
8.3.2.4.3 Process elements of acceptable performance
Base practice category ‘PRO: Project Process’.

Chapter 8: Evaluation of results
- 138 -
8.3.2.4.4 Weaknesses of the process
Base practice categories of ‘CUS: Customer-Supplier Process’ and ‘ORG: Organisation
Process’
8.3.2.5 Case study 3a: SW-CMM and SEG
Summarised results are presented in Table 7.29 in Chapter 7. More detailed source data are
found in ‘Appendix R: Evidence for results of case studies 3a and 3b’.
26.24% of requirements of ‘Level 2: Repeatable’ were ‘unsatisfied’. 32.80% of the
requirements of ‘Level 3: Defined’ were unsatisfied. The process does not satisfy the all
requirements of these levels, and so has not attained them, although it is close to doing so.
5.41% of ‘Level 4: Managed’ requirements were satisfied, an insignificant small proportion, and
0.00% ‘Level 5: Optimising’ requirements were satisfied.
This software process does not satisfy all requirements of Level 2, and hence attains
only Level 1: ‘Initial’ as a basic software engineering process is in place. Although Level 2 is
not attained, many Level 3 requirements are fulfilled, indicating the process is not at a uniform
level of maturity.
8.3.2.5.1 Process strengths
Level 2: KPAs ‘7.1 Requirements Management’ and ‘7.2 Software Project Planning’.
Level 3: KPA‘8.3 Training Programme’.
8.3.2.5.2 Process elements of acceptable performance
Level 2: KPA ‘7.5 Software Quality Assurance’.
Level 3: KPAs ‘8.1 Organisation Process Focus’, ‘8.5 Software Product Engineering’ and ‘8.7
Peer Reviews’.
8.3.2.5.3 Weaknesses of the process
Level 2: KPAs ‘7.3 Software Project Tracking and Oversight’ and ‘7.6 Software Configuration
Management’.
Level 3: KPAs ‘8.2 Organisation Process Definition’ and ‘8.4 Integrated Software
Management’.
Level 4: KPAs ‘9.1 Quantitative Process Management’ and ‘9.2 Software Quality Management’
Level 5: KPAs ’10.1 Defect Prevention’, ’10.2 Technology Change Management’ and ’10.3
Process Change Management’.
8.3.2.6 Case study 3b: SW-CMM and GNU GCC
Summarised results are presented in Table 7.33 in Chapter 7. More detailed source data are
found in ‘Appendix R: Evidence for results of case studies 3a and 3b’.
61.70% of requirements of ‘Level 2: Repeatable’ were ‘unsatisfied’. 77.60% of the
requirements of ‘Level 3: Defined’ were unsatisfied. The process does not satisfy the all
requirements of these levels, and so has not attained them. 8.11% of ‘Level 4: Managed’

Chapter 8: Evaluation of results
- 139 -
requirements were satisfied, an insignificant proportion, and 0.00% ‘Level 5: Optimising’
requirements were satisfied.
This software process does not satisfy all requirements of Level 2, and hence attains
only Level 1: ‘Initial’ as a basic software engineering process is in place. Some requirements are
fulfilled at Levels 2, 3 and 4, indicating the process is not at a uniform level of maturity.
8.3.2.6.1 Process strengths
Level 2: KPA ‘7.6 Software Configuration Management’
8.3.2.6.2 Process elements of acceptable performance
Level 2: KPA ‘7.5 Software Quality Assurance’
Level 3: KPA ‘8.7 ‘Peer Reviews’
8.3.2.6.3 Process weaknesses
Level 2: KPAs ‘7.1 Requirements Management’, ‘7.2 Software Project Planning’, ‘7.3 Software
Project Tracking and Oversight’ and ‘7.4 Software Subcontract Management’.
Level 3: KPAs ‘8.1 Organisation Process Focus’, ‘8.2 Organisation Process Definition’, ‘8.3
Training Program’, ‘8.4 Integrated Software Management’, ‘8.5 Software Product Engineering’
and ‘8.6 Intergroup Coordination’.
Level 4: KPAs ‘9.1 Quantitative Process Management’ and ‘9.2 Software Quality
Management’.
Level 5: KPAs ‘10.1 Defect Prevention’, ‘10.2 Technology Change Management’ and ‘10.3
Process Change Management’.
8.3.2.7 Comparison of processes through case studies
Comparison can be performed between different processes where an identical process quality
model and quality assessment procedure is used in each case study. For each model, a
recommended process is established that has higher measured quality levels.
8.3.2.7.1 Model 1: ISO 9001:1994 / ISO 9000-3
For processes A and B, the proportions of requirements that are satisfied are similar (49.14%
and 48.23% respectively), and the proportions of requirements that are unsatisfied are similar
(42.24% and 50.00% respectively). The differences in values are too small to be significant, and
neither process conforms to the model overall. Therefore, both processes are found by this
model to be of very similar quality. Although process A would be recommended due to a
slightly higher measured level of quality, the difference is too small to be considered significant.
For processes A and B, the measured proportions of ‘not applicable’ requirements were
8.62% and 1.72% respectively. Therefore, this model is less applicable in the context of process
A than process B, although not by a sufficiently large margin to render findings incomparable
between processes. Neither model has too high a proportion of ‘not applicable’ requirements to
be considered unusable.

Chapter 8: Evaluation of results
- 140 -
8.3.2.7.2 Model 2: SPICE
Process A is judged to be at process maturity Level 3, whereas process B is judged to be at
Level 2. Therefore, process A would be recommended as it is at a higher process maturity level.
For processes A and B, the measured proportions of ‘not applicable requirements’ were
7.05% and 1.32%. Therefore, this model is less applicable in the context of process A than
process B, although not by a sufficiently large margin to render findings incomparable between
processes. Neither model has too high a proportion of ‘not applicable’ requirements to be
considered unusable.
8.3.2.7.3 Model 3: SW-CMM
Both process A and process B are judged to be at Level 1. Therefore, recommendation of
process must be through examination of the proportion of Level 2 requirements that are
unsatisfied and hence preventing attainment of Level 2. For processes A and B, the proportion
of requirements that are satisfied at Level 2 are 53.90% and 38.30% respectively, and the
proportions of unsatisfied requirements are 26.24% and 61.70%. These differences in
requirement satisfaction are significant, where a substantially larger proportion of Level 2
requirements are satisfied by process A. Therefore, process A is recommended through
application of this model due to a higher measured level of quality, and this process would
require less modification to attain Level 2 status.
For processes A and B, the measured proportions of ‘not applicable requirements’ were
13.59% and 0.82%. Therefore, this model is less applicable in the context of process A than
process B, although not by a sufficiently large margin to render findings incomparable between
processes. The proportion of ‘not applicable’ requirements in the context of process A is
significant (>10%), and would require careful attention before using this model on this process
in practice.
8.3.2.7.4 Overall recommendation of process from case study application results
From application of each model, the recommended process is A. Models 2 and 3 find process A
to be significantly higher in quality than process B, and model 1 finds process A to be broadly
similar (though slightly higher) in quality than process B. It can therefore be concluded that
process A is of higher quality than process B.
For each combination of model and process, the proportion of non-applicability of the
model content in the context of the process was not sufficiently high to render the model
unusable. However, the combination of process A and model 3 non-applicability level was
sufficiently high to require attention to ensure suitability as models with more relevance to the
context of this process may be available.
8.3.2.8 Hypothesis HE.a analysed
Hypothesis HE.a states: “For models in the evaluation set of models, no case study process will
be found to be more conforming and hence judged to be at a higher level of quality than any
other.” Models 2 and 3 identified significant differences in measured quality of processes A and

Chapter 8: Evaluation of results
- 141 -
B. Therefore, it is possible to refute null hypothesis HE.a. Accordingly, it is possible to state
that processes can be found to have different measured levels of quality. This indicates that
process content varies between members of the evaluation set, and that this variation influences
process quality. This indicates that some software processes may be considered to be of higher
quality than others. Therefore, software developers require a mechanism to measure the quality
of software processes (and process types) to identify those of higher quality, which are more
desirable for selection for deployment.
8.3.3 Comparison of case study results
The purpose of this section is to perform comparison of case study results, transformed into a
standard format to identify the extent to which content of models differs, to prove or disprove
hypothesis HE.b. Results are compared at the level of clauses of the standard model format, and
the level of the entire model. Comparison of results at these detail levels establishes if similar
levels of conformance of process to model requirements is observed at all levels of detail, or if
differences are exaggerated or masked at different levels. Summarised results are presented in
section ‘Results of case studies transformed to common format’ of Chapter 7 and analysis at the
level of the standard model clause is provided in ‘Appendix T: Analysis of case study results at
the level of the standard model clause’.
8.3.3.1 Comparison of results at level of standard model clause
‘Appendix T: Analysis of case study results at the level of the standard model clause’ performs
analysis of results obtained for all models in the evaluation set at the level of the standard model
clause, from which the findings are summarised below.
This section measures the similarity of provision of coverage of process content issues
between models. The content of each model is transformed into a standard model format (based
on ISO 9001) where each standard model clause represents a particular set of related process
issues. This transformation groups all model content elements into comparable categories,
regardless of their original ‘native’ groupings.
It is defined that where the measured satisfaction levels for all models in standardised
format fall within a range of 20.00%, this indicates a process satisfies all models to a similar
extent. In the context of a given standard model clause, this indicates all models produce similar
measures of quality when applied to the same process and therefore may be considered broadly
equivalent in measured content. This equivalence is thought to hold true where different models
appear in low-level definition to measure slightly different although closely related issues, and
indicates that in this clause context there is little reason to select any model in preference to
another.
Where the range of measured satisfaction levels for all models exceeds 20% this
indicates that at least one model may use different process evaluation criteria. Accordingly it
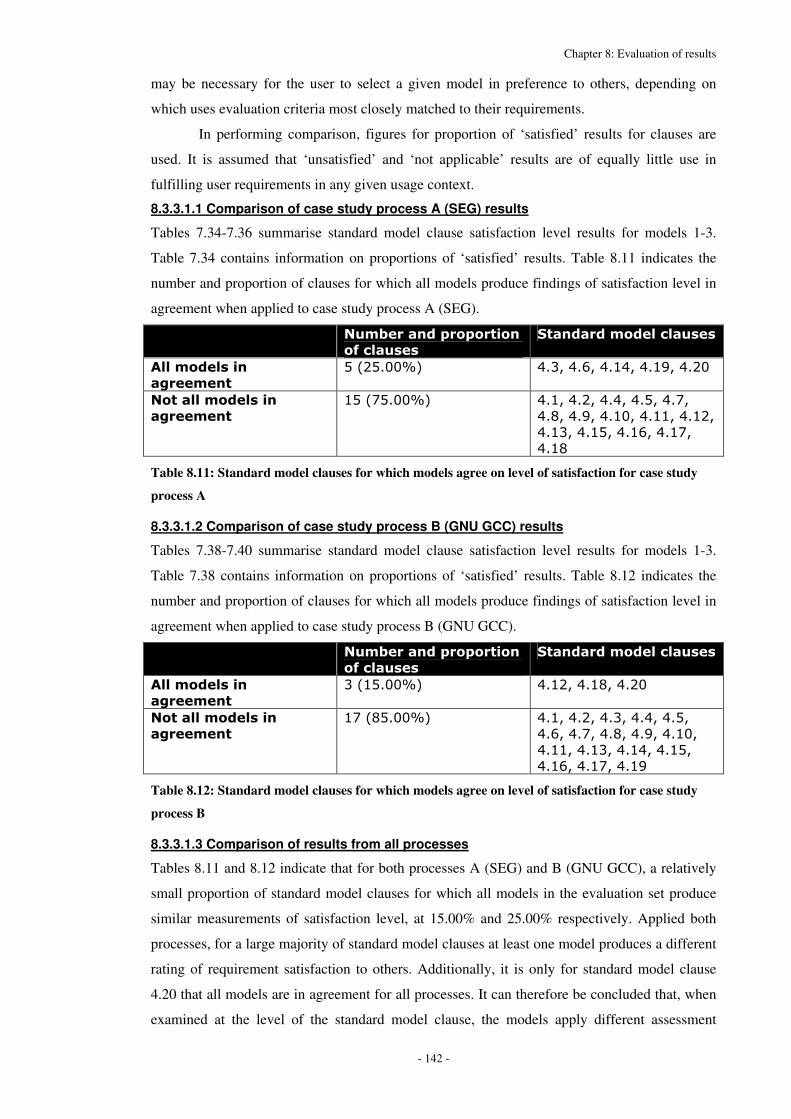
Chapter 8: Evaluation of results
- 142 -
may be necessary for the user to select a given model in preference to others, depending on
which uses evaluation criteria most closely matched to their requirements.
In performing comparison, figures for proportion of ‘satisfied’ results for clauses are
used. It is assumed that ‘unsatisfied’ and ‘not applicable’ results are of equally little use in
fulfilling user requirements in any given usage context.
8.3.3.1.1 Comparison of case study process A (SEG) results
Tables 7.34-7.36 summarise standard model clause satisfaction level results for models 1-3.
Table 7.34 contains information on proportions of ‘satisfied’ results. Table 8.11 indicates the
number and proportion of clauses for which all models produce findings of satisfaction level in
agreement when applied to case study process A (SEG).
� .��/ ��������������
������ ��
����������� ������ ��
0����� ������
�'� � ���
��<0��))@=� :�*"�:�?"�:��:"�:��("�:�0)�
.�������� ������
�'� � ���
���<A��))@=� :��"�:�0"�:�:"�:��"�:�A"�
:�B"�:�("�:��)"�:���"�:��0"�
:��*"�:���"�:��?"�:��A"�
:��B�
Table 8.11: Standard model clauses for which models agree on level of satisfaction for case study
process A
8.3.3.1.2 Comparison of case study process B (GNU GCC) results
Tables 7.38-7.40 summarise standard model clause satisfaction level results for models 1-3.
Table 7.38 contains information on proportions of ‘satisfied’ results. Table 8.12 indicates the
number and proportion of clauses for which all models produce findings of satisfaction level in
agreement when applied to case study process B (GNU GCC).
� .��/ ��������������
������ ��
����������� ������ ��
0����� ������
�'� � ���
*�<���))@=� :��0"�:��B"�:�0)�
.�������� ������
�'� � ���
�A�<B��))@=� :��"�:�0"�:�*"�:�:"�:��"�
:�?"�:�A"�:�B"�:�("�:��)"�
:���"�:��*"�:��:"�:���"�
:��?"�:��A"�:��(�
Table 8.12: Standard model clauses for which models agree on level of satisfaction for case study
process B
8.3.3.1.3 Comparison of results from all processes
Tables 8.11 and 8.12 indicate that for both processes A (SEG) and B (GNU GCC), a relatively
small proportion of standard model clauses for which all models in the evaluation set produce
similar measurements of satisfaction level, at 15.00% and 25.00% respectively. Applied both
processes, for a large majority of standard model clauses at least one model produces a different
rating of requirement satisfaction to others. Additionally, it is only for standard model clause
4.20 that all models are in agreement for all processes. It can therefore be concluded that, when
examined at the level of the standard model clause, the models apply different assessment

Chapter 8: Evaluation of results
- 143 -
criteria to the evaluated process. This indicates that models are comprised of non-equivalent
content, rather than equivalent content simply rephrased and reorganised. Accordingly, entities
wishing to perform process assessment require a mechanism to select a process quality model
with content most relevant to their requirements.
8.3.3.2 Comparison of results at level of entire model
8.3.3.2.1 Comparison of case study process A (SEG) results
Table 7.37 summarises the number and percentage of model element satisfaction results that are
‘satisfied’, ‘not satisfied’ and ‘not applicable’ for each of the quality models considered, when
applied to case study process A (SEG).
0
10
20
30
40
50
60
Satis. Unsatis. N/A
0: ISO9001
1: ISO9001 /ISO9000-3
2: SPICE
3: CMM
Figure 8.1: Results of evaluation of case study process A from all models in standardised format
Table 7.37 and Figure 8.1 indicate the proportion of model requirements considered non-
applicable in the context of process A is relatively small, in the range 5.17% for SPICE to
8.36% for SW-CMM (ISO 9001:1994 without ISO 9000-3 is at 5.08%. but is not in the
evaluation set of models). This is sufficiently small for process evaluation results from
application of models in the evaluation set to be considered meaningful and suitable for
analysis.
The range size of ‘satisfied’ results for models is in the range 42.77% for SW-CMM to
49.59% for ISO 9001:1994 / ISO 9000-3. The range size is 6.82% which, although too
substantial to disregard completely, is sufficiently small to conclude that the overall findings of
these models are broadly similar. The SPICE result of 47.99% is found in this interval. The
result for ISO 9001:1994 without ISO 9000-3 is slightly lower at 40.68%, but is not in the
evaluation set of models. Each model finds satisfaction of a significant minority of quality
requirements. All models conclude a similar proportion of quality requirements are satisfied by
process A, and therefore produce a similar rating of overall process quality.
8.3.3.2.2 Comparison of case study process B (GNU GCC) results
Table 7.41 summarises the number and percentage of model element satisfaction results that are
‘satisfied’, ‘not satisfied’ and ‘not applicable’ for each of the quality models considered, when
applied to case study process B (GNU GCC).

Chapter 8: Evaluation of results
- 144 -
0
10
20
30
40
50
60
Satis. Unsatis. N/A
0: ISO9001
1: ISO9001 /ISO9000-3
2: SPICE
3: CMM
Figure 8.2: Results of evaluation of case study process B from all models in standardised format
Table 7.41 and Figure 8.2 indicate the proportion of model requirements considered non-
applicable in the context of process A is relatively small, in the range 0.00% for ISO 9001:1994
/ ISO 9000-3 to 2.25% for SW-CMM (ISO 9001:1994 without ISO 9000-3 is at 3.39%. but is
not in the evaluation set of models). This is sufficiently small for process evaluation results
from application of models in the evaluation set to be considered meaningful and suitable for
analysis.
The range size of ‘satisfied’ results for models is in the range 42.77% for SW-CMM to
50.41% for ISO 9001:1994 / ISO 9000-3. The range size is 7.64% which, although too
substantial to disregard completely, is sufficiently small to conclude that the overall findings of
these models are broadly similar. The SPICE result of 50.00% is found in this interval. The
result for ISO 9001:1994 without ISO 9000-3 is also within this interval at 44.70%, but is not in
the evaluation set of models. Each model finds satisfaction of a significant minority or a small
minority of quality requirements. All models conclude a similar proportion of quality
requirements are satisfied by process B, and therefore produce a similar rating of overall process
quality.
8.3.3.2.3 Comparison of results from all processes
It is assumed that process quality correlates with the number of quality requirements in a
process model that are found to be satisfied. It has been shown above that all models in the
evaluation set produce broadly similar ratings of process quality when applied to both case
study processes, as determined by proportion of model quality requirements found to be
satisfied.
It can therefore be concluded that each model in the evaluation set produces a similar
rating of overall process quality when applied to the same process, when considered at the level
of the entire quality model. This would indicate that there would be little to recommend the
selection of one model over another when performing assessment of a process.

Chapter 8: Evaluation of results
- 145 -
8.3.3.3 Comparison of findings at levels of standard model clause
and entire model
It has been shown above that when the models in the evaluation set are applied to a given
process, the similarity of findings between models is dependent on the level at which
examination occurs. When results are compared at the level of the standard model clause, it is
found that the models produce significantly different findings of process quality. When results
are compared at the level of the entire model, it is found that the models produce broadly similar
findings of process quality.
It can therefore be concluded that the models in the evaluation set differ substantially in
underlying content, which is of significance if a model user is interested in the quality of
specific elements of a software process. In this situation, careful evaluation of model content
would be required to ensure compatibility with user requirements. However, it can also be
concluded that these differences in underlying content do not affect the overall rating of process
quality when all quality elements are considered as a whole. In this situation, it is found that all
models in the evaluation set are broadly similar in their findings.
8.3.3.4 Hypothesis HE.b analysed
Hypothesis HE.b states: “For each case study process, no model from the evaluation set of
models will be found to produce a higher rating of quality than any other.” The validity of this
hypothesis was found to depend on the level of detail at which the rating of quality is produced.
Where quality is considered at the highest level as a desirable although somewhat vague concept
which is not defined in terms of specific quality issues, each model was found to produce a
similar quality rating when applied to a given process, and so this hypothesis would hold true.
However, if quality is considered at a lower level as a set of related desirable concepts
in which each concept concerns a subset of the overall notion of quality, it was shown that
different models could produce different findings of quality when applied to a given process. In
this context, this hypothesis is disproved.
This hypothesis does not hold true for all situations in which it applies to the production
of quality ratings. Therefore, it is possible to refute null hypothesis HE.b.
8.4 Chapter 8: Summary
In this chapter, analysis was performed of the summarised results produced by application of the
defined methods for theoretical evaluation and empirical evaluation of software process quality
models to a specific set of software process quality models, as presented in Chapter 7. Data
produced by evaluation methods was examined and analysed to produce a set of findings. These
findings included the refutation of hypotheses HT.a, HT.b, HE.a and HE.b.
Chapter 9: Evaluation of experimental procedures
- 146 -
Chapter 9: Evaluation of experimental procedures
9.1 Overview of evaluation of experimental procedures
The purpose of this section is to perform evaluation and analysis of the results presented in
Chapter 7 concerning the implementation of procedures defined in Chapters 4 and 5 relating to
theoretical and empirical evaluation of models.
Typically achieved through determining compliance of the implemented procedure with
a predefined set of criteria for success, this allows measurement of the level of confidence that
may usefully be placed in the results of assessment and the analysis of these. It is possible to
identify strengths and weaknesses in the procedures, in order to identify strengths and
weaknesses in the corresponding results data sets and to identify possible improvements to the
experimental procedure.
The findings of the experimental procedures and the analysis of the associated results
sets are assembled and utilised in Chapter 10 to draw high-level conclusions on the field of
software process quality models and associated issues from the lower-level products of this
chapter.
9.2 Assessment of theoretical evaluation procedure
9.2.1 Overview of criteria-based assessment for theoretical
evaluation procedure
In ‘Chapter 4.2: Theoretical evaluation of models’ a definition is provided of what constitutes
‘success’ in the context of performing the theoretical evaluation process. The success of the
theoretical evaluation procedure is judged through the level of conformance of the actual
implemented process with a set of criteria for success defined in Table 4.3 of Chapter 4. Results
of application of these criteria are in Table 7.25.
9.2.2 Conformance of implemented procedure to criteria for success
for theoretical evaluation
Table 9.1 identifies the level of conformance that can be attributed to each criteria for success
upon consideration of the procedure as actually implemented, based on the procedure defined in
‘Chapter 4.2: Theoretical evaluation of models’. For each criterion, the observed level of
conformance is identified with a description of the evidence used to establish and assign this
value.
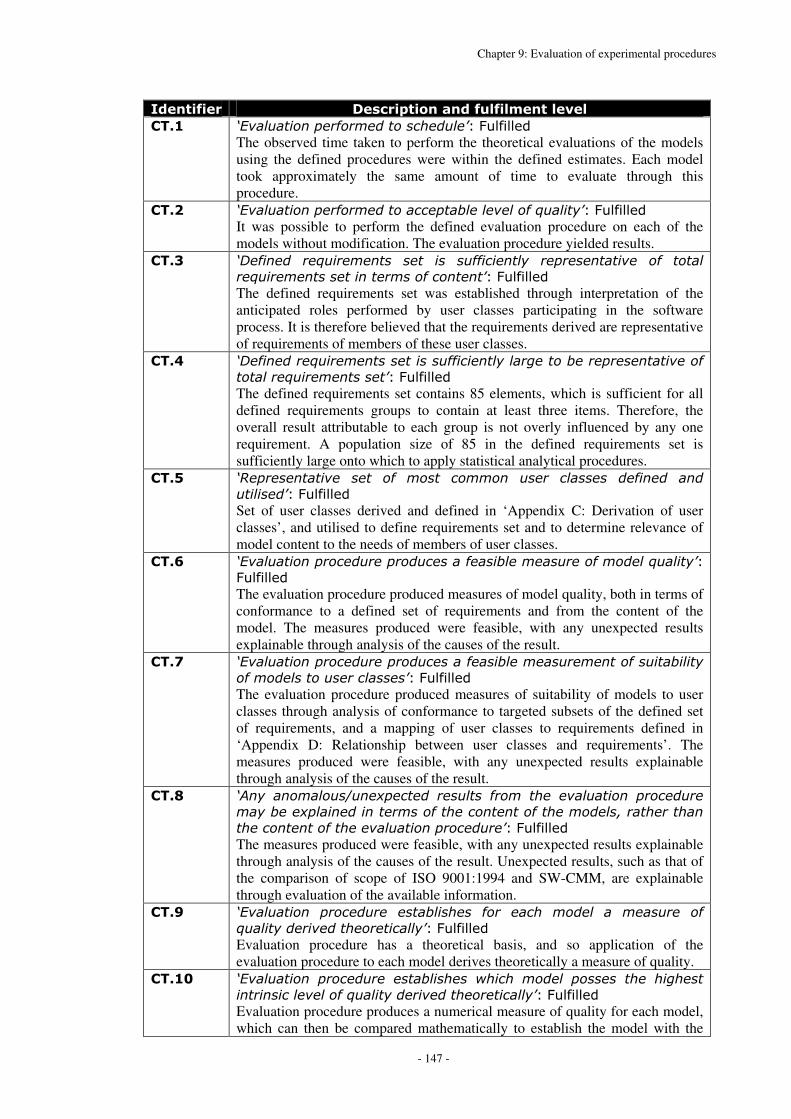
Chapter 9: Evaluation of experimental procedures
- 147 -
���������� ����� ����������������������
���� ����������� ���� ������� ��� ������������
The observed time taken to perform the theoretical evaluations of the models using the defined procedures were within the defined estimates. Each model took approximately the same amount of time to evaluate through this procedure.
���� ����������� ���� ������� ����� �� � �����������������������
It was possible to perform the defined evaluation procedure on each of the models without modification. The evaluation procedure yielded results.
���� �� �� �� � ���� � ��� � �� ��� ������� ���� � �� � ����� � �� �����
� ���� � ���� ����� �������� �������������
The defined requirements set was established through interpretation of the anticipated roles performed by user classes participating in the software process. It is therefore believed that the requirements derived are representative of requirements of members of these user classes.
���� �� �� ��� ���� � ���� ������������ �������� ���� �� �� � ����� ���
������ ���� � ���� �������������
The defined requirements set contains 85 elements, which is sufficient for all defined requirements groups to contain at least three items. Therefore, the overall result attributable to each group is not overly influenced by any one requirement. A population size of 85 in the defined requirements set is sufficiently large onto which to apply statistical analytical procedures.
���� �� �� � ����� � � �� �� ���� ���� �� �� ����� �� � �� �� ���
������ �������������
Set of user classes derived and defined in ‘Appendix C: Derivation of user classes’, and utilised to define requirements set and to determine relevance of model content to the needs of members of user classes.
���� ������������� ��� ������ ����� ����� �� ���� ����� ������������
���������
The evaluation procedure produced measures of model quality, both in terms of conformance to a defined set of requirements and from the content of the model. The measures produced were feasible, with any unexpected results explainable through analysis of the causes of the result.
���� ������������� ��� ������ ����� ����� �� ���� � ����������������
���� ������� ������� �������������
The evaluation procedure produced measures of suitability of models to user classes through analysis of conformance to targeted subsets of the defined set of requirements, and a mapping of user classes to requirements defined in ‘Appendix D: Relationship between user classes and requirements’. The measures produced were feasible, with any unexpected results explainable through analysis of the causes of the result.
���� ���� �������� �� �� �� � ������ ���� �� � �������� ��� ��� �
����� � ����� ����� �������� ��� ������ ��� �������� ������
�� ��� ������ � ����������� ��� ������������
The measures produced were feasible, with any unexpected results explainable through analysis of the causes of the result. Unexpected results, such as that of the comparison of scope of ISO 9001:1994 and SW-CMM, are explainable through evaluation of the available information.�
���� ���������� ��� ��� � �������� �� ��� ���� �� �� �� � ���� � ��
��������� ��� ���� � �������������������
Evaluation procedure has a theoretical basis, and so application of the evaluation procedure to each model derives theoretically a measure of quality.
���� ���������� ��� ��� � �������� �� ����� �� �� ��� �� �� � ���� ���
��������� � ������������� ��� ���� � �������������������
Evaluation procedure produces a numerical measure of quality for each model, which can then be compared mathematically to establish the model with the

Chapter 9: Evaluation of experimental procedures
- 148 -
highest level of intrinsic quality. ����� ������������� ��� � �������� ����� ���������������� �����
�� ���������� ����������������� ��� ������ ��� �������������������
Evaluation procedure establishes a numerical measure of suitability of each model in the evaluation set to each user class defined, by establishing what proportion of requirements are fulfilled that are present in the subset of requirements relevant to each user class.
����� ������������� ��� � �������� ����� ������ ���� ��� ������� ����
������������������� ����������� ������������
A numerical measure of suitability of each model in the evaluation set to each user class is produced. A simple numerical comparison of these values allows this information to be established.
����� ������������� ��� �� ����� ���� ��� ��� ������ ������ ������ �
�������������� ��� ������������������ ������� ���������������
In performing the theoretical evaluation procedure, the models were not applied to any actual processes nor were any case studies used. Determining conformance to requirement R1 considered statistical information on ‘real-world’ usage. Although this did not require actual results of model usage or information from any case studies, statistics were used of ‘real-world’ usage.
����� ���������� ��� ��� � ��! �� �� ��� �� � ������ ���� ����� ���
�� �������������������������
Model definition documentation was used as the primary input information source. Some external information sources were used where information was required on issues that could not be answered using this documentation alone (for example, requirement R20), but only a small minority of information was not derived directly from model definition documentation.
����� ���������� ��� ��� � � ���� �� �� �� �� �� ��� ����� �� ��
��� �� ������������
The evaluation procedure compared the content of all models in the evaluation set with a reference standard model used to provide a baseline, identifying the extent to which the content of the reference model could be found in members of the set of evaluation models..
����� ������������� ��� � �������� ������ � � �� �� �� �� ���� �����
���������
The evaluation procedure compared the content of all models in the evaluation set with a reference standard model used to provide a baseline, and noted content present in members of the evaluation set of models not present in the reference model. �
����� ���������� ��� ��� � ��� �� � ����� �� ����� ���� "#$�� �� � �
����� ����� ��� �������������
Hypothesis HT.a was refuted using evaluation of results performed in this chapter.
����� ���������� ��� ��� � ��� �� � ����� �� ����� ���� "#$�� �� � �
����� ����� ��� �������������
Hypothesis HT.b was refuted using evaluation of results performed in this chapter.�
Table 9.1: Rationale for assignment of values of conformance of the theoretical evaluation
procedures to the defined criteria for success
The results presented in Table 9.1 can be summarised further to Table 9.2 below, in which all
percentages are rounded to two decimal places:

Chapter 9: Evaluation of experimental procedures
- 149 -
!���"�������� #��$����������� %�� ���������������
������������ ��� �������
���� ��������������� �� ������
����� ���������� �� ������
����������� �� ������
Table 9.2: Summarised results for criteria for success of theoretical evaluation procedure
9.2.3 Criteria successfully fulfilled for theoretical evaluation
From Table 9.2, it can be seen that the implemented evaluation procedure is fully compliant
with the vast majority (94.44%) of criteria for success. The only criterion with which the
procedure was not in full compliance (CT.13) was found to be in partial compliance, but in a
manner which does not adversely affect the quality of the results of application of the theoretical
evaluation procedure. It is therefore possible to determine that the theoretical evaluation
procedure can be considered to have been successful, as implemented in practice. Accordingly,
the results produced through application of this procedure can be considered to be sufficiently
reliable to be useful.
9.2.4 Criteria not successfully achieved for theoretical evaluation
From Table 9.1, it can be seen that one criterion (CT.13) was partially fulfilled, and no criteria
were found to have been assigned a value of ‘not fulfilled’. Therefore, there are no criteria for
success for which the implemented process can be considered to be unsuccessful.
Criterion CT.13 was found to have been partially fulfilled. In order to produce a useful
evaluation of the value to assign to requirement R1 for each model in the evaluation set,
information was used from third-party sources. This information relates to ‘real-world’ usage of
process quality models in order to determine a measure of the credibility of the model and of the
results achieved through application of the model. It would be difficult to establish the
perceived credibility of a model without making reference to ‘real-world’ experiences of usage.
Therefore, in this respect the requirements of criterion CT.13 were not fully met. However, it is
not believed that this caused the usefulness of the evaluation of models to be diminished, or that
the quality of the evaluation procedure was significantly diminished as a result. This is because
the actual results of application of models to actual processes or case studies were not used in
the evaluation procedure, and did not influence the results produced other than those relating to
requirement R1. To avoid this issue entirely, requirement R1 could be removed. However, this
would sacrifice coverage of an important issue in the selection of a process quality model for the
purposes of fulfilling a criterion for success, which would not improve the usefulness, reliability
or accuracy of the results. It is therefore thought better to only partially fulfil criterion CT.13,
rather than reduce the quality of evaluation results.
Chapter 9: Evaluation of experimental procedures
- 150 -
9.2.5 Overall success of theoretical evaluation approach
The evaluation approach employed allowed a set of process quality models to be evaluated in a
number of ways. For each model, content and scope was evaluated against a reference standard
model. Conformance of each model to a defined set of requirement was used to measure the
extent to which the model fulfilled the requirements of an ideal process quality model, and the
extent to which the model fulfilled the requirements of user classes participating in the software
process both in isolation and in comparison with the other members of the evaluation set. It is
therefore thought that the results were produced with a sufficient breadth of coverage of the
pertinent issues, without a sacrifice in depth of coverage.
These evaluation procedures produced results when implemented, which allowed the
identification of differences between models in the evaluation set in the context of a defined
notion of quality. The vast majority of criteria for success for the evaluation approach were
found to be fully fulfilled, with the remainder partially fulfilled and no criteria completely
unfulfilled. It is therefore thought that the evaluation approach can be considered to be
successful, as the notion of quality defined in Chapter 4 in terms of criteria for success for
theoretical evaluation of models was successfully achieved in practice.
It is thought that results achieved through implementation of the evaluation procedure
were largely in keeping with expectations, except as noted in this chapter, and as differences
were identified between the quality of models in the evaluation set it is thought that the results
can be considered to be useful. No results were observed that were implausible and could not be
explained through examination of information sources and the application of reason.
The production of data was through methods that minimised subjective judgement. In
cases where this was unavoidable, for example in determining compliance of a model with some
of the defined requirements, the impact of each individual decision on the final results was
minimised through the combination of sets of related results. It is therefore thought that the
results produced can be considered to be reliable. The application of a well-defined procedure
and minimisation of subjectivity ensures that the procedure is sufficiently repeatable and
impartial to be considered useful; it would be expected that another assessor would be able to
reproduce the findings of the procedure, irrespective of any small differences in the results sets.
It was found that the schedule estimates derived from the application of the prototype
procedure were broadly similar to the observed schedule requirements for the first model on
which the non-prototype procedure was applied. Differences observed were used to amend the
expected schedule requirements, which were then found to be realistic in the evaluation of the
remaining two models in the evaluation set.
9.2.6 Assessor skills for theoretical evaluation procedure
The evaluation procedure was designed to not require prior experience or knowledge of any of
the models in the evaluation set. In addition, the evaluation procedure was designed to minimise

Chapter 9: Evaluation of experimental procedures
- 151 -
the application of subjective judgement in favour of the following of well-defined objective
procedures. It was found that the evaluation procedure as implemented did not require the
application of any skills not possessed by the evaluator, as the majority of the elements of the
procedure were decomposable to simple, well-defined steps.
9.2.7 Possible changes to theoretical evaluation procedure
A possible change to the theoretical evaluation procedure which may yield useful results would
be to implement the second approach outlined in the ‘Comparison of model content’ section of
‘Chapter 4.2 Theoretical evaluation of models’. This would allow comparison of the content of
models to be performed at a lower level than the approach selected (the third defined approach
in the aforementioned section of Chapter 4.2) which utilises a relatively high-level overview of
content. This would reduce the level of ambiguity of elements undergoing comparison, as
lower-level elements would be considered than in the implemented procedure. As a result, it
may be possible to identify a greater number of differences in content between the models in the
evaluation set, as more specific definitions are used.
However, this modification risks undermining the repeatability of the experimental
process. The fuzziness of definition of the higher-level model elements has both a negative and
a positive effect. The negative effect is that it masks some of the smaller, subtler differences
between models. The positive effect is that the effects of small differences in differing
interpretation of the model definitions by multiple evaluators are diminished by this effect of
higher-level evaluation to hide small differences, therefore reducing subjectivity. Therefore,
comparing models at a lower level of detail will allow more differences to be identified, but at
the expense of an increased risk of ‘false positive’ detections of difference and hence
diminished repeatability.
This modification would allow more differences to be identified between the models,
operating more at the level of the model definitions as implemented by users rather than the
current approach which is more reliable for identifying differences in model scope than low-
level content. The most effective compromise would be to retain the current procedure, and
implement the proposed modified procedure element in addition to those currently utilised. This
would retain the reliability and repeatability of the current method, while allowing the
opportunity of finding additional information on low-level model details. Provided that the
results of the modified procedure were considered alongside existing results, the influence of
any procedure elements with questionable repeatability would be minimised. These effects
could be further minimised through repetition of the evaluation procedure a number of times by
different evaluators working independently, followed by comparison of the results of each
evaluator. If multiple independent evaluations produce similar results leading to similar
conclusions, this would increase the level of confidence that could be placed in the results.
Chapter 9: Evaluation of experimental procedures
- 152 -
9.2.8 Possible modifications to the requirements set used in model
theoretical evaluation
An increase in the number of requirements would increase the usefulness of the set, provided
that the new requirements were of sufficient quality and relevance. One possible mechanism for
this to be achieved would be to define more user classes, perhaps as subclasses of members of
the existing set. If the associated requirements and mappings between user classes and
requirements were added to those currently existing, this would increase the usefulness of the
experimental approach in producing results relevant to the newly defined user classes. Another
approach in determining the type of requirements to add to the existing set would be to increase
the number of requirements in each group to at least a certain level, for example to ensure that
each group contained at least five requirements. This would reduce the impact of any individual
measurement of conformance of a model to a requirement would have on the overall assessment
result for a requirements group.
9.2.9 Suitability of models in evaluation set for theoretical evaluation
It was found that the models selected in the evaluation set were appropriate choices, as there
was sufficient information available to perform the defined analytical processes and produce
results in which a reasonable level of confidence may be placed. For example, for each model in
the evaluation set there was a mapping of elements to ISO 9001:1994 published by the same
organisation responsible for the model definition. There is no reason in principle why it would
not be possible to extent the evaluation set with additional process quality models, provided a
sufficient amount of information was available on each.
9.3 Assessment of empirical evaluation procedure
9.3.1 Overview of criteria-based assessment for empirical evaluation
procedure
In ‘Chapter 5.1: Empirical evaluation of models’ a definition is provided of what constitutes
‘success’ in the context of performing the theoretical evaluation process. The success of the
theoretical evaluation procedure is judged through the level of conformance of the actual
implemented process with a set of criteria for success defined in Table 5.1 of Chapter 5. Results
of application of these criteria are in Table 7.43.
9.3.2 Conformance of implemented procedure to criteria for success
for empirical evaluation
Table 9.3 identifies the level of conformance that can be attributed to each criteria for success
upon consideration of the procedure as actually implemented, based on the procedure defined in
‘Chapter 5.1: Empirical evaluation of models’. For each criterion, the observed level of

Chapter 9: Evaluation of experimental procedures
- 153 -
conformance is identified with a description of the evidence used to establish and assign this
value.
���������� ����� ����������������������
�&�� ���������� ���� ������� ��� �����������
Case study evaluations were completed within acceptable time parameters, with similar time required for each application of any given model. Case study completion time was reduced through deployment of software support tools.
�&�� ���������� ���� ������� ����� �� � ����������������������
It was possible to perform the defined evaluation procedure on each of the models without modification. The evaluation procedure yielded results.�
�&�� ������������ ��� ���� ��� ������������ ����"�$����� ������ ��
��� ��� ������������
Hypothesis HE.a was refuted using evaluation of results performed in this chapter.�
�&�� ������������ ��� ���� ��� ������������ ����"�$����� ������ ��
��� ��� ������������
Hypothesis HE.b was refuted using evaluation of results performed in this chapter.�
�&�� ������������ ��� ��� ��������� ���� �� ���� �� ������������
Two software processes were used in the evaluation procedure, as identified in ‘Appendix N: Case study information’
�&�� ��������� ��� ��� � �� �� ������� � ��� �� � ��� ������������� ����
���������
Three software process quality models were used in the evaluation procedure, as identified in ‘Appendix M: Case study process quality model selection’.
�&�� ������������ ��� ��� ����� �� � ����� �� ������� �� ���� �� ���
�� ���������������
Process A was modelled on a traditional, ‘waterfall’-style process common in industry. Process B was a non-traditional, Open Source process. More details in ‘������������� �� ��������!� ���’.
�&�� ��������� ��� ��� � �� �� �� � �� � ����� � � �� �� ��� �� � ��� ���
���������� �������������
Model 1 is formed from two international standards, Model 2 is due for ratification as an international standard, and Model 3 is a de facto industry standard. More details in ‘Appendix M: Case study process quality model selection’.
�&�� ��������� ��� ��� � �� �� ���� ������ � �������� �� ��� �� �
��� ��������� �� ���� ������������� ������������
A case study was performed for each possible combination of process and model. �&�� ��������� ��� ��� � ����� �� �� � ����� �� ���� � �� ��� �����������
������������ �������������
The measures produced in Part One were feasible, and within expected boundaries. Any unexpected results were explainable through analysis of the causes of the result.�
�&��� ��������� ��� ��� � ����� �� �������� �� �������� � ������ �� ����
�� �������� ��������� ���� �������������
This form of evaluation was performed in Part Two. �&��� ��������� ��� ��� � ����� �� �������� �� �������� � ������ �� ����
��� ����� ���������� ��� ���������� ������������
This form of evaluation was performed in Part Two. �&��� ��������� ��� ��� � �� ���� � ������ ���� ���� � �� �� ��� ��� ��
������� ��������������������������������������
This was performed in order to perform Part Two. More details in ‘Appendix H: Mapping between elements of quality models’ and ‘Appendix S: Standardised results sets for case studies’.
�&��� ������������ ��� ��� ���� ������ � � ������� �� ������������
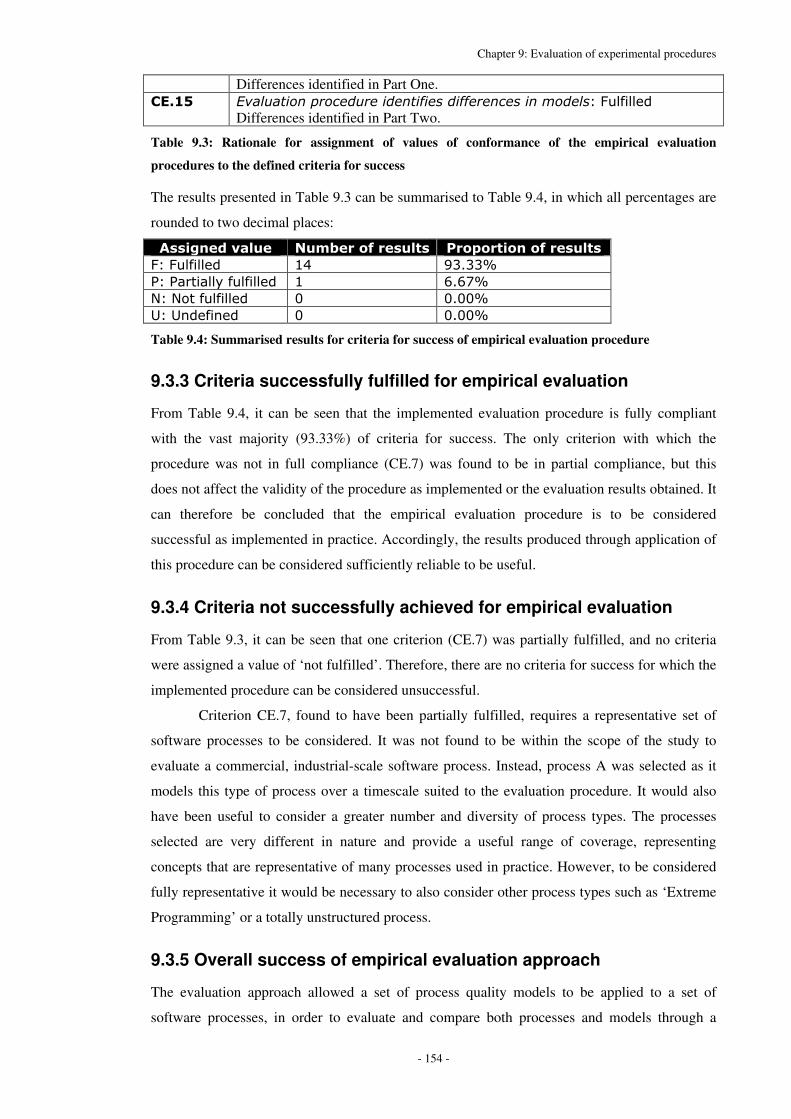
Chapter 9: Evaluation of experimental procedures
- 154 -
Differences identified in Part One. �&��� ������������ ��� ��� ���� ������ � � ������ �������������
Differences identified in Part Two.
Table 9.3: Rationale for assignment of values of conformance of the empirical evaluation
procedures to the defined criteria for success
The results presented in Table 9.3 can be summarised to Table 9.4, in which all percentages are
rounded to two decimal places:
!���"�������� #��$����������� %�� ���������������
������������ ��� �"�""��
���� ��������������� �� ������
����� ���������� �� ������
����������� �� ������
Table 9.4: Summarised results for criteria for success of empirical evaluation procedure
9.3.3 Criteria successfully fulfilled for empirical evaluation
From Table 9.4, it can be seen that the implemented evaluation procedure is fully compliant
with the vast majority (93.33%) of criteria for success. The only criterion with which the
procedure was not in full compliance (CE.7) was found to be in partial compliance, but this
does not affect the validity of the procedure as implemented or the evaluation results obtained. It
can therefore be concluded that the empirical evaluation procedure is to be considered
successful as implemented in practice. Accordingly, the results produced through application of
this procedure can be considered sufficiently reliable to be useful.
9.3.4 Criteria not successfully achieved for empirical evaluation
From Table 9.3, it can be seen that one criterion (CE.7) was partially fulfilled, and no criteria
were assigned a value of ‘not fulfilled’. Therefore, there are no criteria for success for which the
implemented procedure can be considered unsuccessful.
Criterion CE.7, found to have been partially fulfilled, requires a representative set of
software processes to be considered. It was not found to be within the scope of the study to
evaluate a commercial, industrial-scale software process. Instead, process A was selected as it
models this type of process over a timescale suited to the evaluation procedure. It would also
have been useful to consider a greater number and diversity of process types. The processes
selected are very different in nature and provide a useful range of coverage, representing
concepts that are representative of many processes used in practice. However, to be considered
fully representative it would be necessary to also consider other process types such as ‘Extreme
Programming’ or a totally unstructured process.
9.3.5 Overall success of empirical evaluation approach
The evaluation approach allowed a set of process quality models to be applied to a set of
software processes, in order to evaluate and compare both processes and models through a
Chapter 9: Evaluation of experimental procedures
- 155 -
number of means. Each model was applied to each process to perform measurement of process
quality, and the findings compared for all case studies using identical models. This allows
comparison of process quality within the scope of a single model, followed by comparison of
results across models in order to establish which process may be considered to be of higher
quality. Case study results were then analysed to establish the extent to which models produce
different results and findings when applied to the same process, and to determine the suitability
of the models to assessment of the case study processes.
These evaluation procedures produced results allowing the identification of the extent to
which models differed in their evaluations of a model, and therefore the extent to which a user
of a process quality model requires a mechanism to select the most appropriate. If all models
were equivalent, any choice would be equally appropriate and no selection mechanism would be
required. The vast majority of criteria for success for the evaluation approach were found to be
fully fulfilled, with the remainder partially fulfilled and no criteria completely unfulfilled. It is
therefore thought that the evaluation approach can be considered to be successful, as the notion
of quality defined in Chapter 5 in terms of criteria for success was successfully achieved in
practice.
It was found that results achieved through implementation of the evaluation procedure
were within expected boundaries. No anomalous or implausible results were produced that were
not explainable through examination of information sources and the application of reason.
Data production methods were designed to minimise subjective judgement. Where this
subjectivity was unavoidable, for example in the requirement for SW-CMM evaluators to
employ ‘professional judgement’ [PAU96], it is thought that the effects on comparative analysis
will be minimised by the procedure. As the same evaluator is used for all models, any subjective
judgement necessarily employed would be applied similarly across all models. It is considered
therefore that the results produced can be considered reliable. The application of closely defined
procedure and minimisation of subjectivity ensures that the procedure is sufficiently repeatable
and impartial to be considered useful; it would be expected that another assessor would be able
to reproduce the findings of the procedure and comparative analysis, irrespective of any small
differences in the results sets.
It was not possible to test in practice the theory that the required schedule to perform a
case study evaluation would be proportional to the size of the model independent of process
content, as case studies involving model 3 were performed using a software support tool
described in Chapter 6. While this did not affect the results of assessment of processes A and B,
it cannot be guaranteed that the time taken to perform the evaluation would not be affected.
However, for models 1 and 2 it was found that larger models took longer to evaluate.
Chapter 9: Evaluation of experimental procedures
- 156 -
9.3.6 Assessor skills for empirical evaluation procedure
The evaluation procedure was designed to not require prior experience or knowledge of any of
the processes or models used in evaluation. However, the evaluator had prior experience of
process A although not of process B. The evaluation procedure was designed to minimise the
application of subjective judgement in favour of the application of well-defined objective
procedures. In some cases this was not possible, where the content of a model required the
application of subjective judgement. However, this was minimal and is not thought to have
significantly influenced results. It was found that the evaluation procedure as implemented did
not require the application of any skills not possessed by the evaluator as the majority of the
elements of the procedure were decomposable to simple, well-defined steps, either in the design
of the procedure or in the content of the guidelines for application of models.
9.3.7 Possible changes to empirical evaluation procedure
A possible change to the procedure would be to use multiple evaluators with similar skills,
experience and background to perform the procedure independently, then compare results to
ensure the procedure is accurately repeatable. This would mitigate the effects of any subjective
judgement, either as a result of the evaluation procedure or the content of the process quality
models used. A variation of this would be to use multiple non-identical evaluators, for example
to determine if the level of experience of a given model or a given process in any way
influences the content of the evaluation results and any associated findings. However, it was not
within the scope of the study to deploy multiple evaluators, either those considered identical or
those that are representative of some variable such as experience.
Another possible modification would expand upon empirical evaluation procedure ‘Part
Two: Comparison of case study results’ by mapping the content of each model to every other
model in the evaluation set, rather than to a single standard model format as at present.
Repeating the procedure by using every model in turn as the standard model format and
comparing results would ensure no bias would be introduced in results by the level of similarity
between the standard model format and any model used in evaluation. However, this may
involve substantial overheads of time and potentially yield an amount of knowledge not
commensurate with this increased overhead.
9.3.8 Suitability of models and processes in evaluation set for
empirical evaluation procedure
It was found that the models selected in the evaluation set were appropriate choices, as there
was sufficient information available to perform the defined analytical processes and produce
results in which a reasonable level of confidence may be placed. For example, for each model in
the evaluation set there was a mapping of elements to ISO 9001:1994 published by the same
organisation responsible for the model definition. There is no reason in principle why it would

Chapter 9: Evaluation of experimental procedures
- 157 -
not be possible to extent the evaluation set with additional process quality models, provided a
sufficient amount of information was available on each.
It is thought that the processes selected in the evaluation set were appropriate choices,
representing two different process types. This allowed comparison of a traditional ‘waterfall’
model-based process (case study process A: SEG) against a non-traditional Open Source
process (case study process B: GNU GCC). As these model types take a fundamentally different
approach and set of priorities, this allows differences to be usefully determined. A possible
change would be to utilise a greater number of processes to more closely represent the situations
in which models are likely to be deployed. The industrial software production environments in
which process quality models are most likely to be deployed could be better represented by an
actual example rather than a process modelled on this type, although this does not affect the
usefulness of results obtained.
Chapter 10: Conclusions
- 158 -
Chapter 10: Conclusions
10.1 Overview of thesis
This chapter summarises the findings presented in the preceding elements of this thesis. The
structure of the thesis is explained in Chapter 1. Figure 1.1 indicates the influences bearing upon
each thesis element and the logical progression through the work performed.
A literature survey was performed to assess the current state-of-the-art and identify
areas in which research work could usefully be performed. A method was developed for the
theoretical evaluation and empirical evaluation of software process quality models. This method
was applied to a set of case study process software quality models, using the results of a number
of case studies in which case study software processes were assessed using the case study
software process quality models. A software tool was developed to support implementation of
the empirical evaluation method. Results derived from the implementation of the theoretical
evaluation and empirical evaluation method were analysed. This analysis produced a number of
findings. Criteria for success were analysed to determine that the evaluation method can be
considered successful in achieving its aims.
In this chapter, findings from the application of the theoretical evaluation and empirical
evaluation method are used to formulate a number of conclusions germane to the field of
software process quality models, and the comparative evaluation of these models. Criteria for
success are analysed to determine if this thesis can be considered successful in achieving its
aims. Opportunities for further development and extension of the work presented in this thesis
are identified.
10.2 Conclusions
In this section, key findings from Chapter 8 are highlighted and interpreted in the context of
software quality, and software process quality models in particular.
10.2.1 Theoretical analysis of models through content analysis
These conclusions were derived through theoretical analysis of model content definitions.
10.2.1.1 Scope of software process quality models found to be non-equivalent
The scope of models in the evaluation set was analysed to perform measurement of relative
scope size. It is assumed that the larger the scope of the model, the greater the proportion of a
quality process and associated quality factors that are considered, thereby leading to assessment
result that are more representative of the true quality of a software process. Therefore, it is
assumed that larger scope size is associated with higher model quality.
It was found that the scope of models in the evaluation set was not identical for each
model. Table 8.4 presents a list of models in ranked order of decreasing relative scope size,

Chapter 10: Conclusions
- 159 -
corresponding to decreasing model quality. Model 2 ‘SPICE v1.0’ is recommended for selection
by this analysis, as it is found to have the largest scope. However, it was also found that the
scope of all models in the evaluation set was very similar, with little difference between the
largest and the smallest.
10.2.1.2 Content size of software process quality models found to be non-equivalent
The size of the content of models in the evaluation set was determined by measuring the number
of distinct requirements of a software process that are defined in each model. Larger models are
composed of greater numbers of distinct requirements and therefore imply greater overheads of
cost, time and other resources in application. Therefore, the highest quality model is assumed to
be that which has the smallest number of elements whose scope covers all required issues. It
was also found that the scope of all models was similar (see above).
It was found that the content size of models in the evaluation set was not identical for
each model. Table 7.23 presents a list of models ranked in order of increasing size,
corresponding to decreasing quality. Model 1 ‘ISO 9001:1994 / ISO 9000-3’ was recommended
for selection by this analysis, as it is found to have the smallest content size.
10.2.1.3 Detail level of process quality model definitions found to be non-equivalent
Analysis of relative levels of detail in evaluated models was performed through comparison of
ranked lists of models in order of decreasing scope size and decreasing content size. The
rankings of models in these lists were found to be non-identical, indicating that scope size is not
directly proportional to content size. It is concluded that models in the evaluation set are defined
at non-equivalent levels of detail.
10.2.2 Theoretical analysis of models through requirements analysis
These conclusions were derived through analysis of conformance of models to a defined set of
requirements that would be satisfied by an ‘ideal’ software process quality model.
10.2.2.1 Hypothesis HT.a refuted: Conformance levels of models to set of requirements of
an ideal model found to be non-equivalent
Hypothesis HT.a, introduced in section 4.2.1.4, stated: ‘No model from the set of evaluation
models will be found to be more conforming to the set of model requirements than any other’. It
was found that the proportion of requirements satisfied was not identical for each model in the
evaluation set. It is therefore possible to refute this null hypothesis, indicating that some models
are closer than others to satisfying all requirements that would be satisfied by an ideal model.
This indicates differences in model content and quality exist.
10.2.2.2 Model recommendation by conformance to requirements of an ideal model
Some models satisfy a greater number of requirements of an ideal process quality model than
others, indicating their content is closer to that of an ideal model than others. Satisfaction of a
greater proportion of requirements of an ideal model is considered equivalent to a higher level
of model quality. Table 8.7 presents a list of models in ranked order of decreasing conformance
Chapter 10: Conclusions
- 160 -
to requirements of an ideal model, corresponding to decreasing quality. Model 1 ‘ISO
9001:1994 / ISO 9000-3’ was recommended for selection by this analysis, as it is found to have
the greatest level of conformance to requirements.
10.2.2.3 Model recommendation by breadth of requirement group coverage
The requirements set for an ideal process quality model was divided into a number of groups of
related requirements. To maximise the depth of coverage for a given model quality issue, it is
necessary to maximise the number of requirements satisfied in the appropriate requirement
group. To maximise the breadth of coverage of model quality issues, it is necessary to maximise
the number of groups for which the model satisfies at least one requirement. Greater breadth of
requirement group coverage is considered to correspond to higher quality, as it is desirable for a
model to consider as many quality issues as possible. The model for which the broadest range of
requirement coverage is observed is Model 1 ‘ISO 9001:1994 / ISO 9000-3’, which is therefore
recommended for selection in this context.
10.2.2.4 Hypothesis HT.b refuted: Models found to be more appropriate to requirements
of some user classes than others
Hypothesis HT.b, introduced in section 4.2.1.4, stated: ‘No model from the set of evaluation
models shall be found for which it is more relevant to the needs of one user class than any other
identified user class’. It was found that the measured levels of conformance by models in the
evaluation set to the requirements for defined user classes were non-equivalent. It is therefore
possible to refute this null hypothesis, indicating that some models are more appropriate to the
needs of a given user class than others. If the quality of a model in a given usage context is
dependent on appropriateness to the user, this indicates that some models from the evaluation
set may be considered to be of higher quality than others for any given user class.
10.2.2.5 Model recommendation by conformance to requirements of user classes
Conformance to a greater number of requirements associated with a given user class is assumed
to correspond to a greater level of appropriateness to user needs, and therefore greater quality as
perceived by members of this user class. Table 8.8 indicates that Model 1 ‘ISO 9001:1994 / ISO
9000-3’ would be recommended for selection by user class U1 ‘Software developer’. Table 8.9
indicates that Model 3 ‘SW-CMM v1.3’ would be recommended for selection by user class U2
‘Software process manager’. Table 8.10 indicates that Model 1 ‘ISO 9001:1994 / ISO 9000-3’
would be recommended for selection by user class U3 ‘Customer’.
10.2.2.6 Overall model recommendation by level of conformance to requirements
It was found that Model 1 ‘ISO 9001:1994 / ISO 9000-3’ was determined to be the model from
the evaluation set with highest quality in the context of the requirements set for an ideal process
quality model, and the highest quality in the context of two thirds of the defined user classes.
Therefore, analysis of conformance to requirements finds that Model 1 ‘ISO 9001:1994 / ISO
9000-3’ is to be recommended as possessing the highest quality of all models in the evaluation
set.
Chapter 10: Conclusions
- 161 -
10.2.3 Empirical evaluation of processes through case studies
These conclusions were derived through the application of the evaluation set of software
process quality models to the evaluation set of software processes in the performance of case
studies.
10.2.3.1 Process recommendation by analysis of case study results
Results from case studies in their native format can only be compared between processes for a
given model, and not compared between models. Model 1 ‘ISO 9001:1994 / ISO 9000-3’
produced similar quality ratings for software process A ‘University of Durham SEG’ and
process B ‘GNU GCC’, so these results are not used in this analysis. Model 2 ‘SPICE v1.0’ and
Model 3 ‘SW-CMM v1.3’ both assign a significantly higher process quality rating to process A
than process B. Therefore, process A would be recommended for selection over process B as the
overall finding of the evaluation set of process quality models is that process A possesses higher
quality.
One possible source of bias in measurements related to comparison of quality of case
study software processes is the comparative level of familiarity of the assessor with each
process. The assessor was actively involved in the implementation of process A (SEG)
performing a number of roles over an extended period, whereas the assessor was involved in
only passive observation of process B (GNU GCC) over a shorter (although still considerable)
period. There is therefore a risk of confounding, as it is possible that the finding that process A
possesses higher quality than process B may be the result of greater assessor familiarity rather
than different levels of inherent process quality. This situation could only arise if the case study
software process quality models are not independent of assessor familiarity, which is a desirable
property of such a model if it is to be used for the purposes of internal self-assessment and
external assessment by third-party assessors.
To avoid this source of confounding, the experimental procedure could be repeated by
an independent process assessor possessing no familiarity with any case study software process
at the outset of the procedure. Therefore, the finding that process A (SEG) is recommended over
process B (GNU GCC) is dependent on the extent to which the software process quality models
used in case studies produce results independent of the level of familiarity of the assessor with
the assessed processes. As the influence of this issue is restricted to the production of a
recommendation of software process from the set of processes used in case studies, it is not
considered to have a significant adverse effect on the accuracy or usefulness of other thesis
elements or findings.
10.2.3.2 Hypothesis HE.a refuted: Process quality models found to produce non-equivalent
ratings of quality when applied to different processes
Hypothesis HE.a, introduced in section 5.1.1.4, stated: ‘For models in the evaluation set of
models, no case study process will be found to be more conforming and hence judged to be at a
higher level of quality than any other’. From performance of case studies 1a-3b where models

Chapter 10: Conclusions
- 162 -
were applied to two processes, it was found that Model 1 ‘ISO 9001:1994 / ISO 9000-3’
produced similar findings of quality for both processes whereas Model 2 ‘SPICE v1.0’ and
Model 3 ‘SW-CMM v1.3’ produced dissimilar findings of quality for the distinct processes. The
content of the hypothesis definition holds true for Model 1 but not for Models 2 and 3. This
indicates that process content varies between members of the evaluation set, and that this
variation influences process quality. A mechanism for measurement of process quality is
therefore required in order to select the best and most appropriate example.
It is therefore possible to refute this null hypothesis, indicating that when a model is
applied in the measurement of two or more non-equivalent models it is possible for different
ratings of quality to be produced. For models where this is the case, this indicates that the
quality rating produced is dependent on the content of the software process measured, and not
just on the content of the software process quality model. However, for models where it is not
the case that different case study processes were assigned different quality ratings, it is not
necessarily the case that measured process quality is independent of process content.
10.2.4 Empirical evaluation of model content dissimilarity
These conclusions were derived through the performance of case studies, and comparison of the
quality rating produced by each software process quality model for a given software process.
Results were transformed from the original native format to a standard format for comparison.
10.2.4.1 On application to the same process, different process quality models produce
dissimilar ratings of process quality with low-level quality definitions
Table 8.11 defines the standardised format model clauses for which the assessed quality rating
produced by application of each software process quality model to process A ‘University of
Durham SEG’ was similar, indicating all models find a similar level of quality for the process in
the context of the quality issues considered by this standard model clause. Table 8.12 defines a
similar set of clauses for process B ‘GNU GCC’. In each case, it was found that only a
relatively small minority of standard model clauses resulted in agreement between the findings
of the models, indicating that the assessed quality rating is dependent to at least some extent on
model content. Therefore, this indicates that models apply different assessment criteria to the
evaluated process, and are comprised of non-equivalent content rather than equivalent content
that is rephrased and reorganised between models. Accordingly, entities wishing to perform
process assessment require a mechanism to select a process quality model with content most
relevant to their requirements.
10.2.4.2 On application to the same process, different process quality models produce
similar ratings of process quality with high-level quality definitions
Table 7.37 and Figure 8.1 illustrate that the models in the evaluation set produce similar ratings
of overall process quality when applied to case study process A ‘University of Durham SEG’ at
the level of the entire model, by combining the results from all model components. Table 7.41
Chapter 10: Conclusions
- 163 -
and Figure 8.2 illustrate similar findings for case study process B ‘GNU GCC’. It has been
shown above that all models in the evaluation set produce broadly similar ratings of process
quality when applied to both case study processes, as determined by proportion of model quality
requirements found to be satisfied. Therefore, this would indicate that if the user requires only a
general rating of quality there would be little to recommend the selection of one model in the
evaluation set over another when performing quality assessment of a given process.
10.2.4.3 Hypothesis HE.b refuted: Process quality models found to produce non-equivalent
ratings of quality when applied to the same process
Hypothesis HE.b, introduced in section 5.1.1.4, stated: ‘For each case study process, no model
from the evaluation set of models will be found to produce a higher rating of quality than any
other’. The validity of this hypothesis is dependent on the level of detail considered in the
standardised model format. This hypothesis does not hold true for all situations in which it
applies to the production of quality ratings. Therefore, it is possible to refute null hypothesis
HE.b. For different models, similar results are produced for high-level quality analysis but
dissimilar results are produced for low-level quality analysis. This indicates that the underlying
content differs between examples in the evaluation set, performing measurement of different
quality-influencing factors. However, as each model produces a similar overall assessment of
process quality at the level of the entire model, despite these fundamental differences in content.
This may be because each model considers only a subset of all quality-influencing factors but
the subset used by each model is equally representative of the entire set, although this cannot be
confirmed by the results of this study section.
10.3 Success criteria for work performed
In this section, the implemented performance of the work presented in this thesis is compared to
the criteria for success defined in Chapters 1, 4, and 5. Compliance of the work performed to the
defined criteria for success is considered to indicate the work may be considered successful.
10.3.1 Success criteria for theoretical evaluation of models
From the content of Tables 9.1 and 9.2 it can be seen that the vast majority of success criteria
were fulfilled (94.44%), with the remainder partially fulfilled (5.56%). The partially fulfilled
criterion could not be completely fulfilled without modification of the set of requirements of an
ideal model, which would affect its representativeness. This partial fulfilment was not deemed
to adversely affect the usefulness of the findings, although it does compromise to an
insignificant extent the theoretical purity of the evaluation approach deployed.
It is therefore possible to determine that the theoretical evaluation procedure can be
considered to have been successful, as implemented in practice. Accordingly, the results
produced through application of this procedure can be considered to be sufficiently reliable to
be useful.
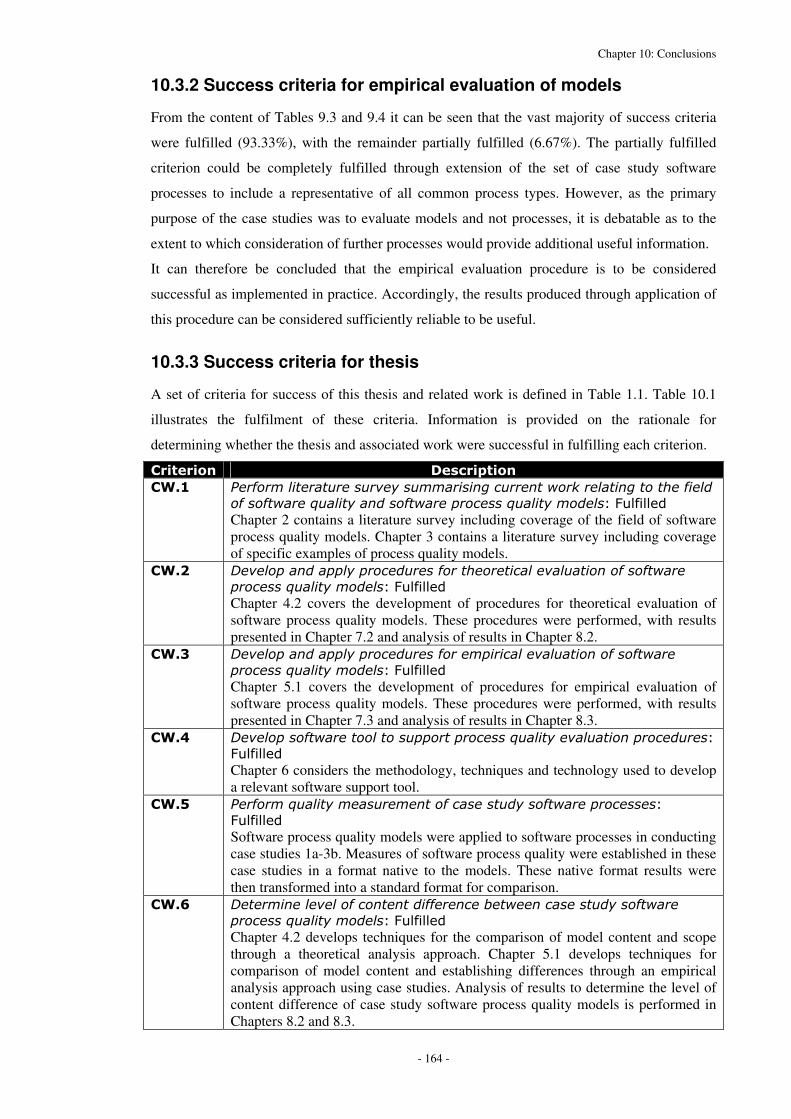
Chapter 10: Conclusions
- 164 -
10.3.2 Success criteria for empirical evaluation of models
From the content of Tables 9.3 and 9.4 it can be seen that the vast majority of success criteria
were fulfilled (93.33%), with the remainder partially fulfilled (6.67%). The partially fulfilled
criterion could be completely fulfilled through extension of the set of case study software
processes to include a representative of all common process types. However, as the primary
purpose of the case studies was to evaluate models and not processes, it is debatable as to the
extent to which consideration of further processes would provide additional useful information.
It can therefore be concluded that the empirical evaluation procedure is to be considered
successful as implemented in practice. Accordingly, the results produced through application of
this procedure can be considered sufficiently reliable to be useful.
10.3.3 Success criteria for thesis
A set of criteria for success of this thesis and related work is defined in Table 1.1. Table 10.1
illustrates the fulfilment of these criteria. Information is provided on the rationale for
determining whether the thesis and associated work were successful in fulfilling each criterion.
���������� ����������
� ��� ���������������� ������ ����� ��������������������������������
��� ����������������� ������������ ������������ �����������
Chapter 2 contains a literature survey including coverage of the field of software process quality models. Chapter 3 contains a literature survey including coverage of specific examples of process quality models.
� ��� ��������������������������� �������������������������� �������
����� ������������ �����������
Chapter 4.2 covers the development of procedures for theoretical evaluation of software process quality models. These procedures were performed, with results presented in Chapter 7.2 and analysis of results in Chapter 8.2.
� ��� ��������������������������� ������������������������� �������
����� ������������ �����������
Chapter 5.1 covers the development of procedures for empirical evaluation of software process quality models. These procedures were performed, with results presented in Chapter 7.3 and analysis of results in Chapter 8.3.
� ��� �������� ������������� ����������� ������������������������� ��
���������
Chapter 6 considers the methodology, techniques and technology used to develop a relevant software support tool.
� ��� ����������������� ������������ �� ���� ������������ � ��
���������
Software process quality models were applied to software processes in conducting case studies 1a-3b. Measures of software process quality were established in these case studies in a format native to the models. These native format results were then transformed into a standard format for comparison.
� ��� ������������������������������������������ �� ���� �������
����� ������������ �����������
Chapter 4.2 develops techniques for the comparison of model content and scope through a theoretical analysis approach. Chapter 5.1 develops techniques for comparison of model content and establishing differences through an empirical analysis approach using case studies. Analysis of results to determine the level of content difference of case study software process quality models is performed in Chapters 8.2 and 8.3.

Chapter 10: Conclusions
- 165 -
� ��� ����������������� ����������� �� ���� ������������ �������
����� ���������� ������ ��������� ������������ �� �����������
Chapter 4.2 develops techniques for measuring suitability of case study software process quality models to the needs of typical user classes, which were performed on a set of models. Chapter 8.2 performs analysis of the results to produce measures of suitability which may be compared between models.
� ��� �������������������������� �� ���� ������������ �������
����� �����������
Chapter 4.2 develops techniques for theoretical analysis of model content to establish ratings of relative quality in the context of a variety of quality concepts. These techniques were applied to a set of case study models, the results of which are analysed in Chapter 8.2.
� ��� �������������������� ����� ������������ ������� �� ���� �������
����� ������������ ��� ����������� �������������������������
���������
Chapter 8 performs analysis of findings from application of evaluation procedures developed in this thesis. These are used to rank the members of the set of case study software process quality models in the context of various quality criteria. For each quality criterion, the highest-ranking model is selected for recommendation.
� ���� �������������������������������� �������������������������� ����
��������������� ������ �����������
Chapters 4 and 5 define success criteria for theoretical evaluation and empirical evaluation methods for software process quality models, reviewed in Chapter 9.
Table 10.1: Rationale for assignment of values of conformance of the thesis and related work to the
defined criteria for success
From the content of Table 1.1, it can be seen that all criteria for success have been fulfilled by
this thesis and the related work. The aims and requirements established at the outset to define
success in this context have been satisfied. Therefore, the production of this thesis and the
related work can be considered to have been successful.
Chapter 10: Conclusions
- 166 -
10.4 Further work
There are numerous directions in which the work described in this thesis could be extended to
develop further the findings presented within. This section briefly describes a number of
possible issues which could be explored in future work.
10.4.1 Further case studies
Further case studies utilising a larger number and broader range of software processes and
software process quality models would be valuable in confirming and extending the findings
presented in this thesis.
10.4.2 Tailoring a software process quality model to a development context
Formalised techniques could be developed to customise a software process quality model to a
specific software development context or organisation, in preference to the current informally
defined approach.
10.4.3 Development of a hybrid model
Work presented in this thesis shows that some content is common to multiple process quality
models. This common content could form the core of a hybrid model, to which would be added
the content unique to specific models. This would retain the content elements considered
important by all models, and augment this with additional content to incorporate the strengths of
multiple models which are currently incompatible.
10.4.4 Absolute measures of software process quality model issues
Work presented in this thesis focuses on comparative evaluation of models, comparing relative
factors of members of a defined set. Development of absolute measures of important factors, for
example the level of detail in a model definition, would be useful in performing statistical
analysis of improvements made to models and production of quantitative estimates.
10.4.5 Integration of software process and software product quality models
Software processes and software products are often inextricably linked, and therefore the related
quality issues are also linked. Techniques could be designed to perform evaluation of software
product quality models analogous to those presented for software process quality models
presented here. Further work could identify compatible pairings of process and product quality
models, integrating them into a unified model to consider the totality of software development.

Chapter 11: References
- 167 -
Chapter 11: References
[ART93] Arthur, LJ (1993) Improving software quality: An insider’s guide to TQM New
York: Wiley ISBN: 0-471-57804-5
[BAS87] Basili, V and Rombach (1987) Implementing Quantitative SQA: A practical
model IEEE Software September 1987 pp. 6-9
[BOE78] Boehm, B et al (1978) Characteristics of Software Quality Amsterdam/New
York/Oxford: North-Holland Publishing Company ISBN: 0 444 85105 4
[BOE87] Boehm, B (1987) Quality Time IEEE Software September 1987 pp. 84-85
[BRO87] Brooks, P (1987) No silver bullet IEEE Computer April 1987 pp. 10-19
[BSI03] British Standards Institute (2003) BSI: Quality Management [online]
Available from:
http://www.bsi-global.com/Education/Quality+Management/Registration.xalter
[accessed 27th February 2003]
[CAP98] Kaputo, K (1998) CMM Implementation Guide: Choreographing software
process improvement Addison-Wesley: New Jersey ISBN: 0-201-37938-4
[CAM03] Cambridge International Dictionary of English (2003) Cambridge Dictionaries
Online [online]
Available from: http://dictionary.cambridge.org/define.asp?key=quality*1+0
[accessed 15th January 2003]
[CHO85] Chow, T ed. (1985) Software quality assurance: a practical approach Silver
Spring MD: IEEE Computer Society Press ISBN: 0-8186-0569-3
[CMM02] CMMI Product Team (2002) Capability Maturity Model® Integration
(CMMISM), Version 1.1: Staged Representation, Technical Report CMU/SEI-
2002-TR-029 ESC-TR-2002-029 Carnegie-Mellon University: Software
Engineering Institute
[CMM93] Paulk, M et al (1993) Capability Maturity Model for Software, Version 1.1,
Technical Report CMU/SEI-93-TR-024 ESC-TR-93-177 Carnegie-Mellon
University: Software Engineering Institute
[CMU93] Software Engineering Institute, Carnegie-Mellon University (1993) The
Capability Maturity Model: A Tutorial [online]
Available from: http://www2.umassd.edu/swpi/sei/CMM_Tutorial.pdf
[accessed 7th January 2003]
[COB90] Cobb, R and Mills, H (1990) Engineering software under statistical quality
control IEEE Software November 1990 pp. 44-54
[COL87] Collofello and Buck (1987) Software quality assurance for maintenance IEEE
Software September 1987 pp. 46-51
Chapter 11: References
- 168 -
[CRO79] Crosby, PB (1979) Quality is free: the art of making quality certain New
York/London: McGraw-Hill ISBN: 0070145121
[DAR88] Darwin, I (1988) Checking C programs with lint Sebastopol: O’Reilly and
Associates ISBN: 0-937175-30-7
[DEM86] Deming, WE (1996) Out of the crisis: Quality, productivity and competitive
position Cambridge: Cambridge University Press ISBN: 0-521-30553-5
[DOU02] Douglas, S and Thompson, H (2002) TEMAA: A testbed study of evaluation
methodologies: Authoring aids [online]
Available from: http://www.ltg.ed.ac.uk/projects/temaa
[accessed 7th December 2002]
[DRO95] Dromey, RG (1995) A model for software product quality IEEE Trans. Soft.
Eng. 21(2) February 1995 pp. 146-162
‘A Model for Software Product Quality’
[DRO96] Dromey, RG (1996) Cornering the chimera IEEE Software January 1996 pp.33-
43
[DUO03] University of Durham (2003) Durham University Online: Software Engineering
& Software Engineering Group (SEG) Project Module [online]
Available from: http://duo.dur.ac.uk/
[accessed 14th May 2003]
[EVA87] Evans, M and Marciniak, J (1987) Software Quality Assurance and
Management New York: Wiley
[FEN91] Fenton, N (1991) Software metrics: a rigorous approach London: Chapman &
Hall ISBN: 0 412 40440 0
[FLO99] Florac, W and Carleton, A (1999) Measuring the software process: statistical
process control for software process improvement Reading Massachusetts:
Addison-Wesley ISBN 0-201-60444-2
[GAU02] Gauthier, CA (National Research Council Canada) (2002) Open Source
Software Quality [online]
Available from: http://seg.iit.nrc.ca/slides/gauthier01s.pdf
[accessed 28th October 2002]
[GCC03] GCC team (2003) GCC home page [online]
Available from: http://www.gnu.org/software/gcc/
[accessed 26th February 2003]
[GIL87] Gilb, T (1987) Principles of Software Engineering Management Reading,
Massachusetts: Addison-Wesley
[GIL96] Gilb, T (1996) Level 6: Why we can’t get there from here IEEE Software
January 1996 pp. 97-98

Chapter 11: References
- 169 -
[GOL02] Goldsmith, R (2002) This or that, V or X? [online]
Available from: http://www.sdmagazine.com/documents/s=7360/sdm0208e/
[accessed 27th July 2003]
[GOO95] Goodman, P (1995) The practical implementation of process improvement
activities. In: Fenton, Whitty and Iizuka ed. Software Quality Assurance and
Measurement: A Worldwide Perspective London: International Thomson
Computer Press ISBN 1-85032-174-4
[GRA87] Grady, R (1987) Measuring and managing software maintenance IEEE
Software September 1987 pp. 35-45
[GRA93] Grady, R (1993) Practical results from measuring software quality
Communications of the ACM 36(11) November 1993 pp. 62-67
[HAL77] Halstead, M (1977) Elements of software science New York: Elsevier North
Holland. 3rd printing ISBN: 0-444-00205-7
[HAT94] Hatton, L (1994) Safer C: Developing software for high-integrity and safety-
critical systems Maidenhead: McGraw-Hill ISBN 0-07-707640-0
[HAT00] Hatton, L (2000) Linux and the CMM version 1.4 [online]
Available from:
http://www.cs.kent.ac.uk/people/staff/lh8/pubs/pubLinuxCMM/Linux_and_CM
M.pdf
[accessed 19th May 2003]
[HAU93] Hausen, H and Welzel, D (1993) Guide to software evaluation [online]
Summary available from:
http://swig.stanford.edu/pub/summaries/dependable/sw_evaluation.html
Document available from: http://www.scope.gmd.de/documents/EvalGuide
[accessed 7th December 2002]
[HET95] Hetzel, B (1995) The sorry state of software practice measurement and
evaluation. In: Fenton, Whitty and Iizuka ed. Software Quality Assurance and
Measurement: A Worldwide Perspective London: International Thomson
Computer Press ISBN 1-85032-174-4
[IEC03] IEC (2003) IEC: Publications [online]
Available from: http://www.iec.org/pubs/
[accessed 17th March 2003]
[ISO02] ISO (2003) Selection and Use of the ISO 9000:2000 family of standards
[online]
Available from:
http://www.iso.org/iso/en/iso9000-
14000/iso9000/selection_use/selection_use.html
[accessed 6th January 2003]
Chapter 11: References
- 170 -
[ISO02b] ISO (2003) Quality management principles [online]
Available from: http://www.iso.org/iso/en/iso9000-14000/iso9000/qmp.html
[accessed 6th January 2003]
[ISO03] ISO (2003) ISO 9000 Index [online]
Available from: http://www.iso.org/iso/en/iso9000-
14000/iso9000/iso9000index.html
[accessed 27th February 2003]
[ISO03b] ISO (2003) ISO – International Organization for Standardization [online]
Available from: http://www.iso.org/iso/en/ISOOnline.frontpage
[accessed 17th March 2003]
[ISO8402] ISO (1994) ISO 8402: Quality management and quality assurance – Vocabulary
2nd edition. Geneva: International Organization for Standardisation (ISO)
[ISO9000-3] ISO (1993) ISO 9000-3: Quality management and quality assurance standards –
part 3: Guidelines for the application of ISO 9001 to the development, supply
and maintenance of software 2nd edition. Geneva: International Organization for
Standardisation (ISO)
[ISO9001] ISO (1994) ISO 9001: Quality systems – Model for quality assurance in design,
development, production, installation and servicing 2nd edition. Geneva:
International Organization for Standardisation (ISO)
[ISO9001b] ISO (2000) ISO9001: Quality management systems – Requirements 3rd edition.
Geneva: International Organization for Standardisation (ISO)
[ISO9126] ISO (2001) ISO 9126: Information technology – Software product quality –
Part 1: Quality Model Geneva: International Organization for Standardisation
(ISO)
[ISO98] ISO Central Secretariat (1998) Publicizing your ISO 9000 or ISO 14000
certification Geneva: International Organization for Standardisation (ISO)
ISBN: 92-67-10278-8
[KAF87] Kafura and Reddy (1987) The use of software complexity metrics in software
maintenance IEEE Software Engineering October 1987
[KEH95] Kehoe, R and Jarvis, A (1995) ISO 9000-3: A Tool for Software Product and
Process Improvement New York: Springer-Verlag ISBN: 0-387-94568-7
[KHO01] Khoshgoftaar, T and Allen, E (2001) Empirical assessment of a software
metric: the information content of operators Software Quality Journal 9 pp. 99-
112
[KIT95] Kitchenham, BA et al (1995) Towards a framework for software measurement
validation IEEE Trans. Software Engineering 21(12) pp. 929-944
[KIT96] Kitchenham and Pfleeger (1996) Software quality: the elusive target IEEE
Software January 1996 pp. 12-21

Chapter 11: References
- 171 -
[LEW89] Lewis, J and Henry, H (1990) On the Benefits and Difficulties of a
Maintainability via Metrics Methodology Software Maintenance: Research and
Practice 2 pp. 113-131
[MAS95] Masters, S and Bothwell, C (1995) CMM Appraisal Framework, Version 1.0
Technical Report CMU/SEI-95-TR-001 ESC-TR-95-001 Carnegie-Mellon
University: Software Engineering Institute
[MCC76] McCabe, T (1976) A complexity measure IEEE Trans. Software Engineering
SE-2(4) December 1976 pp. 308-220
[MCC77] McCall JA et al. (1977) Factors in Software Quality: Volumes 1-3, RADC-TR-
77-369 Sunnyvale CA: General Electric Co.
[MEN98] Mendonca, M et al. (1998) An approach to improving existing measurement
frameworks [online]
Available from: http://www.research.ibm.com/journal/sj/374/mendonca.html
[accessed 8th December 2002]
[MIL90] Mills and Dyson (1990) Using metrics to quantify development IEEE Software
March 1990
[OLS89] Olson, T et al. (1989) Conducting SEI-Assisted Software Process Assessments,
Technical Report CMU/SEI-89-TR-7 ESD-89-TR-7 Carnegie-Mellon
University: Software Engineering Institute
[OMA90] Oman and Cook (1990) The Book Paradigm for Improved Maintenance IEEE
Software January 1990 pp. 39045
[OPE02] Open Source Quality (2002) Open Source Quality Project Homepage [online]
Available from: http://www.cs.berkeley.edu/~weimer/osq/
[accessed 28th October 2002]
[OSI02] Open Source Initiative (2002) Open Source Initiative OSI – Welcome [online]
Available from: http://www.opensource.org/
[accessed 28th October 2002]
[PAU93] Paulk, M et al. (1993) ‘Capability Maturity Model for Software: A Tutorial’
(abstract), CMU/SEI-93-TR-24, DTIC Number ADA263403 Pittsburgh PA:
Software Engineering Institute
[PAU93b] Paulk, M (1993) Comparing ISO 9001 and the Capability Maturity Model for
Software Software Quality Journal 2 pp. 245-256
[PAU94] Paulk, M (1994) A Comparison of ISO 9001 and the Capability Maturity Model
for Software Technical Report CMU/SEI-94-TR-12 ESC-TR-94-12 Carnegie-
Mellon University: Software Engineering Institute
[PAU96] Paulk, M et al. (1996) The Capability Maturity Model: Guidelines for
improving the software process Cambridge MA: Addison-Wesley ISBN: 0-201-
54664-7
Chapter 11: References
- 172 -
[POR90] Porter and Selby (1990) Empirically guided software development using
metrics-based classification trees IEEE Software March 1990 pp. 46053
[PRE97] Pressman, R (1997) Software engineering: a practitioner’s approach 4th edition.
New York: McGraw-Hill ISBN 0-070709411-5
[PUL96] Pulford, K et al. (1996) A Quantitative Approach to Software Management
Reading, Massachusetts: Addison-Wesley ISBN 0-201-87746-5
[RAY98] Raymond, ES (1998) The cathedral and the bazaar [online]
Available from: http://www.firstmonday.dk/issues/issue3_3/raymond/
[accessed 19th May 2003]
[RIF01] Rifkin (2001) What makes measuring software so hard? IEEE Software
May/June 2001 pp. 41-45
[ROT92] Rothery, B (1992) ISO 9000 Aldershot: Gower Publishing Company ISBN: 0-
566-09093-7
[SCH94] Schmauch CH (1994) ISO9000 for software developers Milwaukee: ASQC
Quality Press ISBN: 0-87389-246-1
[SCH96] Schneidewind, N and Fenton, N (1996) Point – Counterpoint; Do standards
improve quality? IEEE Software January 1996
[SCN92] Schneidemind, NF (1992) Methodology for validating software metrics IEEE
Trans. Software Engineering 18(5) pp. 410-422
[SEI03] Software Engineering Institute, Carnegie-Mellon University (2003) An
International Collaboration to Develop a Standard on Software Process
Assessment [online]
Available from: http://www.sei.cmu.edu/iso-15504/
[accessed 12th March 2003]
[SEI03b] Software Engineering Institute, Carnegie-Mellon University (2003) Capability
Maturity Model® for Software (SW-CMM®) [online]
Available from: http://www.sei.cmu.edu/cmm/
[accessed 2nd April 2003]
[SEI03c] Software Engineering Institute, Carnegie-Mellon University (2003) Compiled
list of Organizations who have Publicly Announced their Maturity Levels after
having an Appraisal Performed [online]
Available from: http://seir.sei.cmu.edu/pml/
[accessed 6th May 2003]
[SEI03d] Software Engineering Institute, Carnegie-Mellon University (2003) How Will
Sunsetting of the Software CMM Be Conducted [online]
Available from: http://www.sei.cmu.edu/cmmi/adoption/sunset.html
[accessed 14th August 2003]

Chapter 11: References
- 173 -
[SEG03] University of Durham (2003) Software Engineering & Software Engineering
Group (SEG) Projects [online]
Available from: http://www.dur.ac.uk/seg.administrator/
[accessed 27th February 2003]
[SHE87] Shen, V (1987) Quality Time IEEE Software September 1987, p. 84
[SHE93] Shepperd, M and Ince, D (1993) Derivation and validation of software metrics
Oxford: Clarendon Press ISBN: 0-19-853842-1
[SIM02] Simon Fraser University, Canada (2002) An evaluation framework [online]
Available from: http://www.cs.sfu.ca/CourseCentral/363/D1/2002-
3/lecture_notes/08_framework_modeling.pdf
[accessed 8th December 2002]
[SOM96] Somerville, I (1996) Software engineering 5th edition. Wokingham: Addison-
Wesley ISBN: 0-201-42765-6
[SPI02a] Software Quality Institute, Griffith University, Australia (2002) SPICE: Process
Improvement and Capability dEtermination [online]
Available from: http://www.sqi.gu.edu.au/spice/
[accessed 7th January 2003]
[SPI02b] Software Engineering Institute, Carnegie-Mellon University (2003) An
International Collaboration to Develop a Standard on Software Process
Assessment: ISO/IEC 15504 - An Emerging Standard on Software Process
Assessment [online]
Available from: http://www.sei.cmu.edu/iso-15504/
[accessed 7th February 2003]
[SPI95] SPICE Management Board (1995) SPICE – Consolidated product Working
Draft v1.00 ISO/IEC Software Process Assessment [online]
Available from: http://www.sqi.gu.edu.au/spice/
[accessed 14th February 2003]
[SQI03] Software Quality Institute, Griffith University (2003) SPICE: Software Process
Improvement and Capability dEtermination [online]
Available from: http://www.sqi.gu.edu.au/spice/
[accessed 12th March 2003]
[STR96] Strigini, L (1996) Limiting the dangers of intuitive decision making IEEE
Software January 1996
[VAL02] Valenti, S et al. (2002) Computer based assessment systems: evaluation via the
ISO 9126 model Journal of Information Technology Education [online] 1(3)
Available from: http://jite.org/documents/Vol1/v1n3p1S7-175.pdf
[accessed 8th December 2002]

Chapter 11: References
- 174 -
[VAR02] Varanka, R (2002) Frameworks of evaluation [online]
Available from: http://www.helsinki.fi/~rvaranka/Intersophy/Frameworks.html
[accessed 4th December 2002]
[WIT90] Withrow, C (1990) Error density and size in Ada software IEEE Software
January 1990 pp. 26-30
[ZUS97] Zuse, H (1997) A framework of software measurement Berlin: Walter de
Gruyter ISBN: 3-11-015587-7

Chapter 12: Appendices
- 175 -
Chapter 12: Appendices
This section contains supplementary information. These items are omitted from this document
in the interests of brevity, but are made available in electronic format for any individual wishing
to confirm the findings of this document. Appendices A-T are located on a CD-ROM. Table
12.1 contains an index of the appendices of this thesis.
��������� ����
�� �������������� ������������ �����������
�� ���������������������� ��������������
� �������������� ������
�� ��������������������� ��������������������
�� ����� ����������� ��������������������
������� ���!"�������#$
�� ����� ����������� ���������������������%�&�
�� ����� ����������� ���������������������'#&((
�� (����)�����������������������������
�� ��������������)�������������������
�� �'#&((��������������
�� ��������������� ����������������
�� ���������������� �����
�� &����������� ������������������ ���
�� &�����������������
�� %�� �����������������)�� ���������
�� ����� ������������� ����������������
�� ����� ������������� ���������*����*�
�� ����� ������������� ���������$����$�
�� ������������������������� ���������
� +�������� ������������������������������������������� �����
Table 12.1: Titles of thesis appendices