software estimation: what, why & how nupul kukreja 19 th october 2012 1
TRANSCRIPT
1
Software Estimation: What, Why & How
Nupul Kukreja19th October 2012

2
Based OnSoftware Estimation:
Demystifying The Black ArtSteve McConnellMicrosoft Press.
3
Agenda• What is an “Estimate”?• Purpose of Estimation• In-class quiz to gauge & develop your
estimation skills• What are “Good Estimates”?• Estimation and Cone of Uncertainty• Estimation Techniques
4
3b, 5a, 7b. Cost/schedule/ performance tradeoffs
6, 7c. Refine, execute, monitor & control plans
6a, 7c. State measurement, prediction correction; Milestone synchronization
5a. Investment analysis, Risk analysis
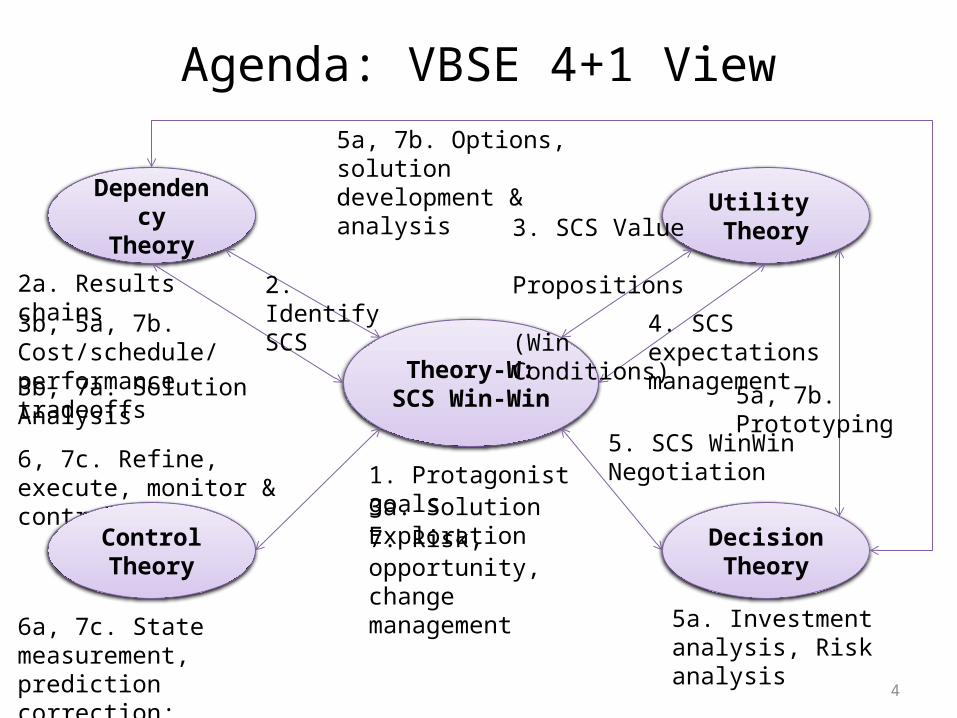
Agenda: VBSE 4+1 View
Theory-W:SCS Win-Win
Dependency Theory
Utility Theory
DecisionTheory
ControlTheory
1. Protagonist goals3a. Solution Exploration7. Risk, opportunity, change management
2. Identify SCS2a. Results chains
3b, 7a. Solution Analysis
5a, 7b. Options, solution development & analysis
3. SCS Value Propositions (Win Conditions)
4. SCS expectations management
5a, 7b. Prototyping
5. SCS WinWin Negotiation
5
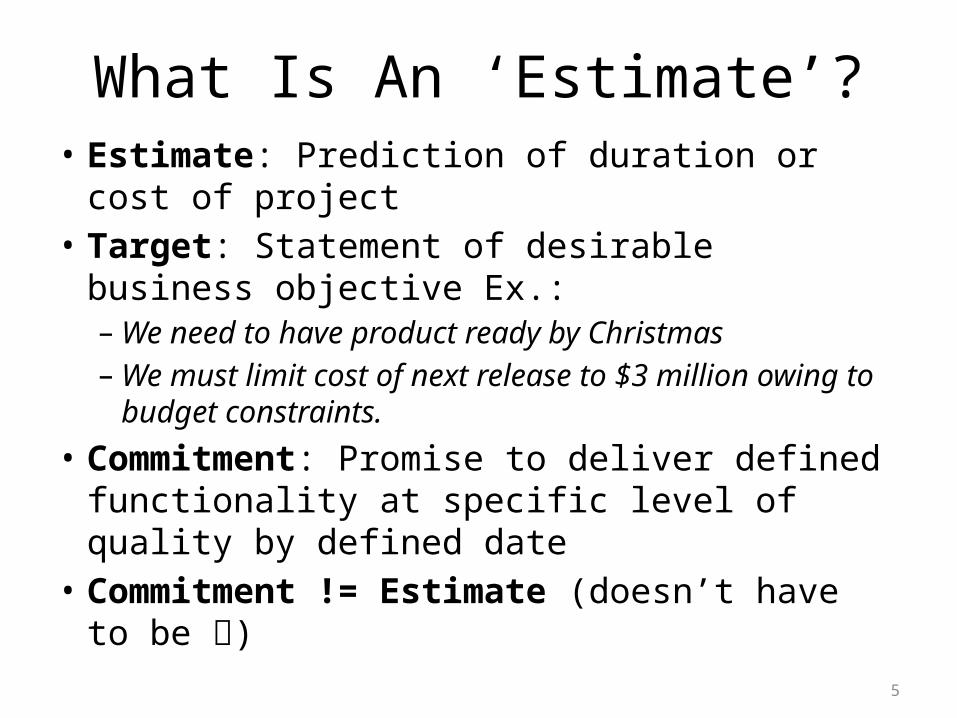
What Is An ‘Estimate’?• Estimate: Prediction of duration or cost of project• Target: Statement of desirable business objective
Ex.:– We need to have product ready by Christmas– We must limit cost of next release to $3 million owing
to budget constraints.• Commitment: Promise to deliver defined
functionality at specific level of quality by defined date
• Commitment != Estimate (doesn’t have to be )

6
Why Do We Estimate?• To determine if project’s targets are realistic
enough to control progress to meet them• And NOT to predict a project’s outcome• Estimate vs. Target Gap:
≤ 20% Easy to control feature set, schedule, team size towards realization
Else Not possible to control project towards successful realization Targets need to be better aligned with reality
7
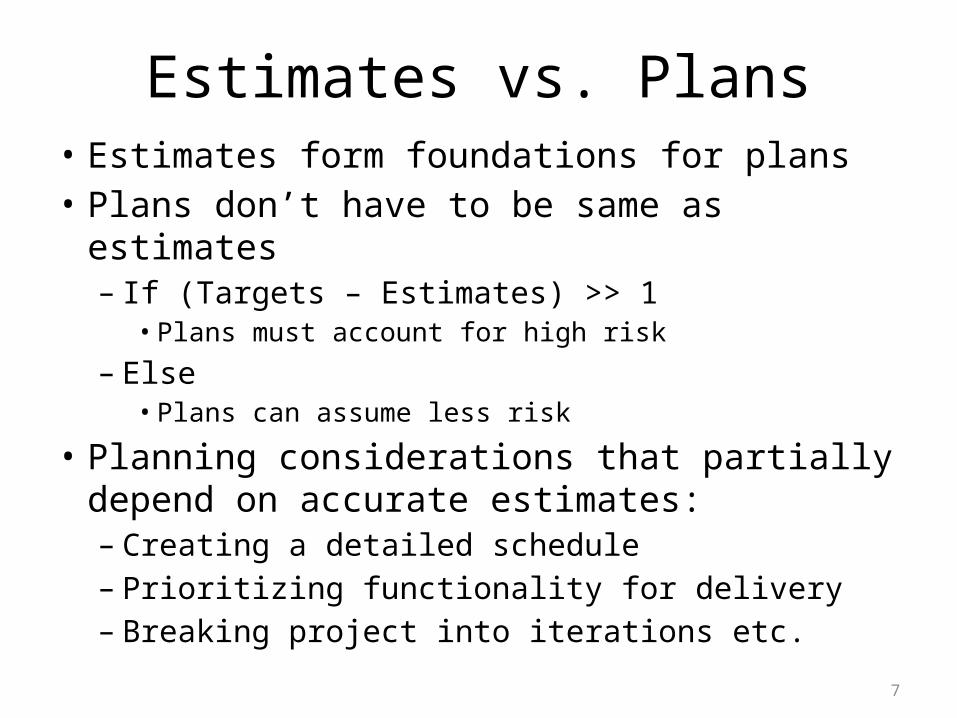
Estimates vs. Plans• Estimates form foundations for plans• Plans don’t have to be same as estimates– If (Targets – Estimates) >> 1
• Plans must account for high risk
– Else• Plans can assume less risk
• Planning considerations that partially depend on accurate estimates:– Creating a detailed schedule– Prioritizing functionality for delivery– Breaking project into iterations etc.
8
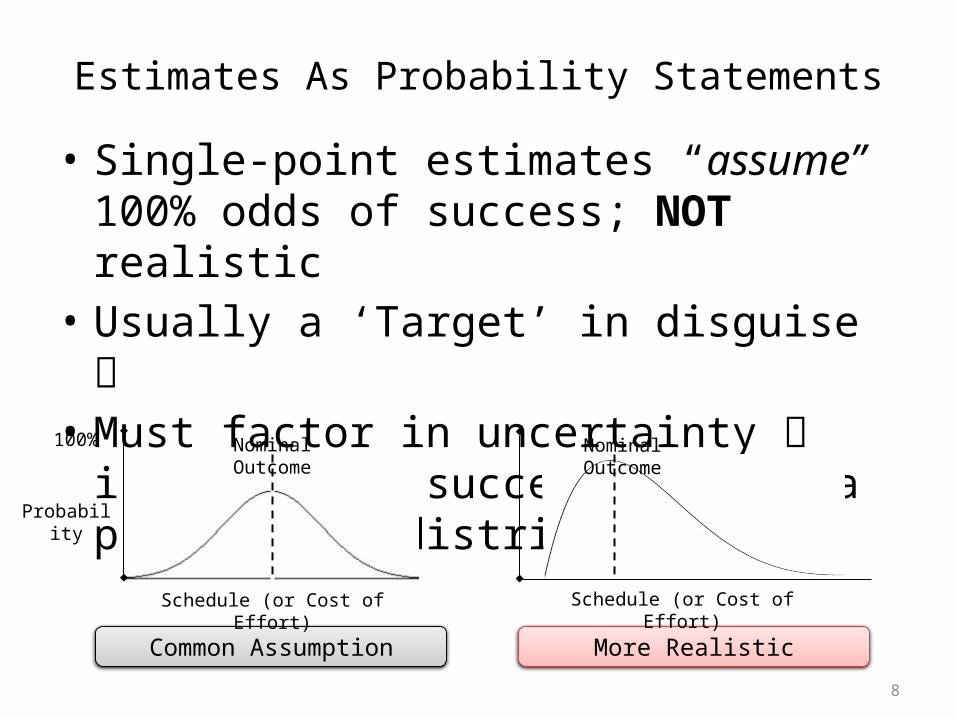
Estimates As Probability Statements• Single-point estimates “assume” 100% odds of
success; NOT realistic• Usually a ‘Target’ in disguise • Must factor in uncertainty i.e. project
success follows a probability distribution
Common Assumption More Realistic
Schedule (or Cost of Effort)
Probability
100% Nominal Outcome
Schedule (or Cost of Effort)
Nominal Outcome

9
What Is A Good Estimate?
“An estimate that provides a clear enough view of the project reality to allow the project leadership to make good decision about how to control the project to hit its targets”
As quoted from Steve McConnell’s book.

10
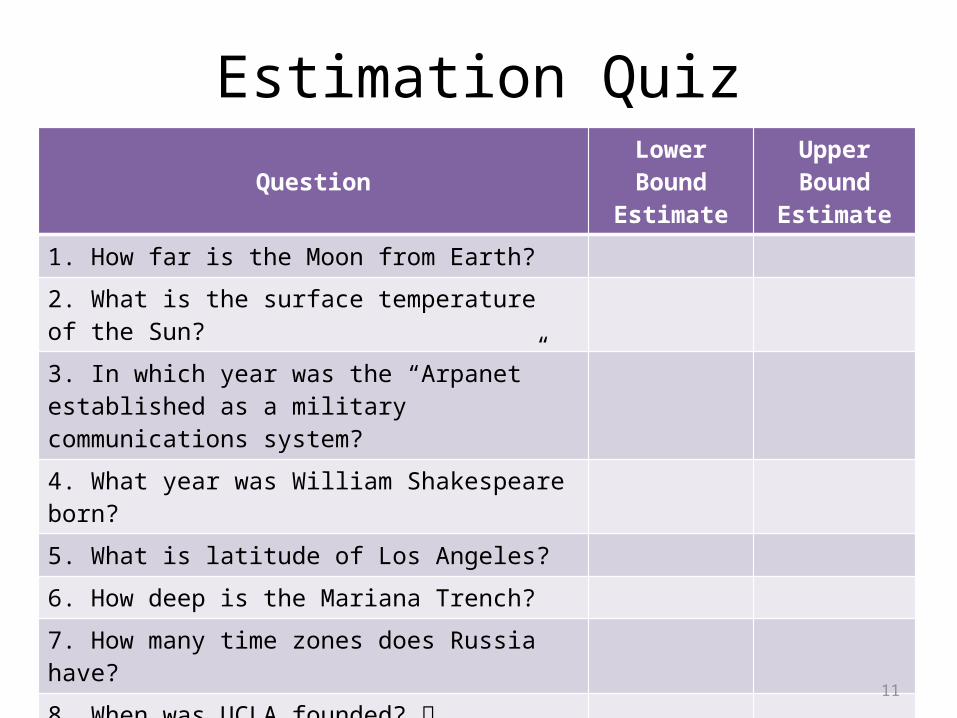
How Good an Estimator Are YOU?• Estimate the questions (in the following slide)
to the best of your ability• Take a few WAGs if you will • Fill lower/upper bound so that there is a 90%
chance of including the correct value• This is a quiz on estimation and NOT on
Googling skills. Estimate without any electronic, human or supernatural help
11
Estimation QuizQuestion Lower Bound
EstimateUpper Bound
Estimate1. How far is the Moon from Earth?
2. What is the surface temperature of the Sun?
3. In which year was the “Arpanet” established as a military communications system?4. What year was William Shakespeare born?
5. What is latitude of Los Angeles?
6. How deep is the Mariana Trench?
7. How many time zones does Russia have?
8. When was UCLA founded? 9. What is the length of an average business card?
10. What percentage of a square could be covered by a circle of the same width?
(Answer with 90% Confidence i.e. 90% chance that answer is within bounds)

12
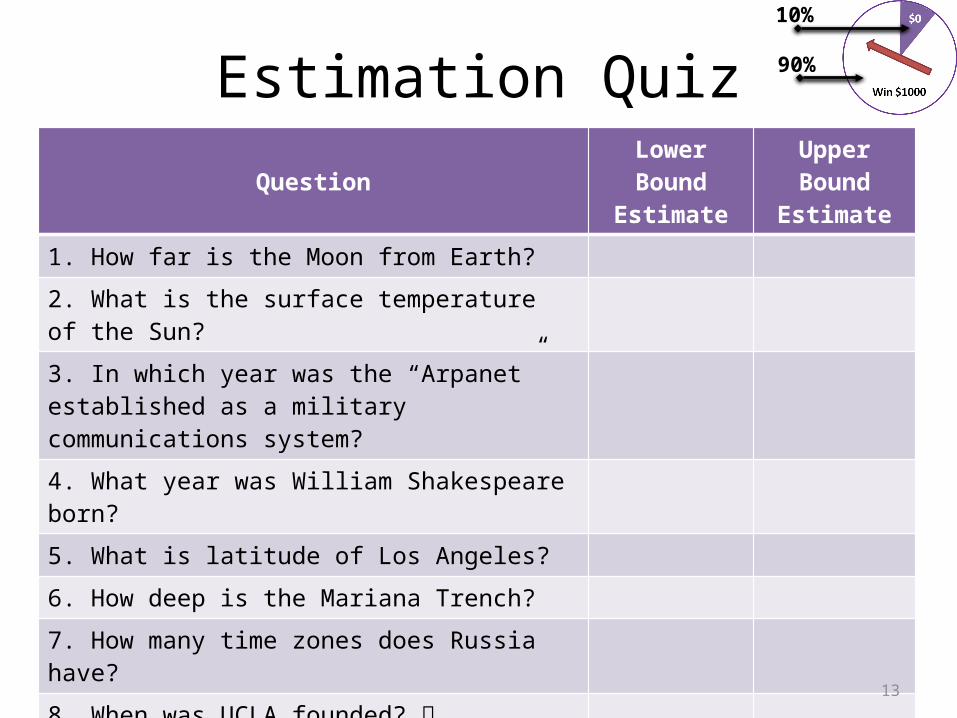
Let’s say we gave you the following proposition:• You win $1000 if the actual answer is within your range• You win $1000 by spinning the wheel below:
• What would you choose? Your estimate/range or spin-the-wheel?
Love to Gamble?
Win $1000
$0 10%
90%
13
Estimation QuizQuestion Lower Bound
EstimateUpper Bound
Estimate1. How far is the Moon from Earth?
2. What is the surface temperature of the Sun?
3. In which year was the “Arpanet” established as a military communications system?4. What year was William Shakespeare born?
5. What is latitude of Los Angeles?
6. How deep is the Mariana Trench?
7. How many time zones does Russia have?
8. When was UCLA founded? 9. What is the length of an average business card?
10. What percentage of a square could be covered by a circle of the same width?
(Answer with 90% Confidence i.e. 90% chance that answer is within bounds)
10%
90%
14
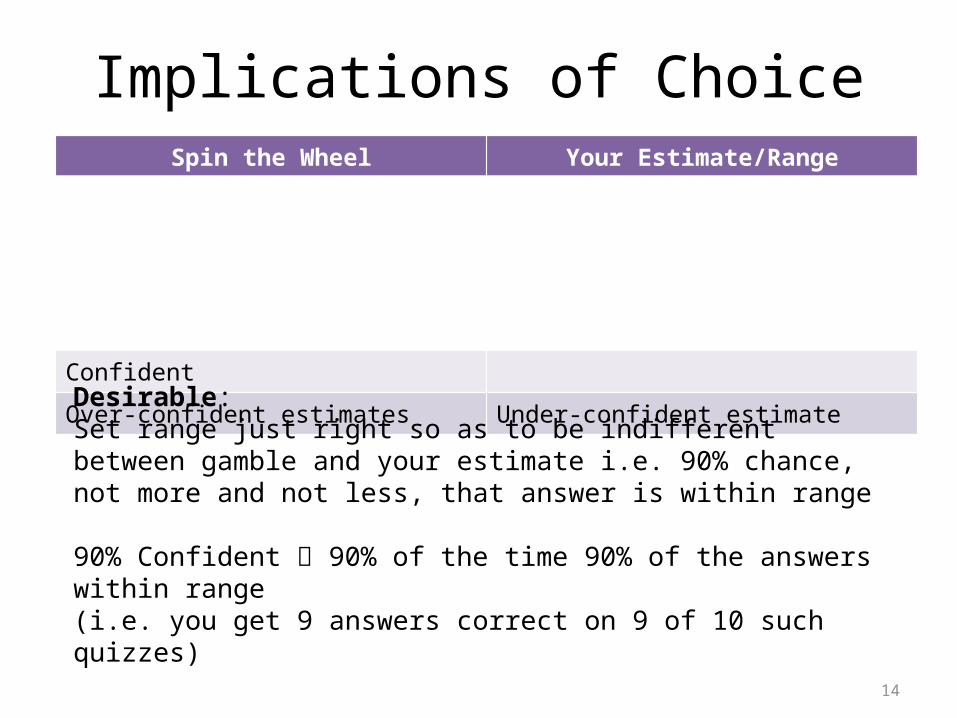
Implications of ChoiceSpin the Wheel Your Estimate/Range
‘Wheel’ has higher chance of payoff Estimate has higher chance of payoff
Estimate range too narrow and thus needs to be widened i.e. it was NOT 90% Confident
Estimate range too wide and needs to be narrowed i.e. it was more than 90% Confident
Over-confident estimates Under-confident estimate
Desirable:Set range just right so as to be indifferent between gamble and your estimate i.e. 90% chance, not more and not less, that answer is within range
90% Confident 90% of the time 90% of the answers within range (i.e. you get 9 answers correct on 9 of 10 such quizzes)

16
Accuracy of Estimates• Is it better to overestimate or underestimate?
Arguments against Overestimation Arguments against Underestimation
Parkinson’s law may kick in: Work expands to fill available volume
Reduced effectiveness of project plans: understaffing, reduced coordination across groups etc.
Goldratt’s Student Syndrome: Procrastinate work until late in project and then hurry to finish it
Statistically reduced chance of on-time completion: developers typically estimate 20-30% lower than actual effort
Motivation for underestimation: To instill a sense of urgency
Poor technical foundations: May spend less time on upstream activities (e.g. requirements) leading to suboptimal designs and reworkDestructive late project dynamics: once late will make project worse than nominal owing to ‘correction’ meetings/activities

17
Accuracy of Estimates
Nonlinear penalty due to planning errors, upstream defects, high-risk practices
Linear penalty due to Parkinson’s Law
←Underestimation Overestimation→
100%< 100% > 100%
Target as a Percentage of Nominal Estimate
Effort, Cost, Schedule
Penalties of underestimation more severe than those for overestimation. If you can’t estimate with complete accuracy, it’s better to err on the side of overestimation
– Steve McConnell
18
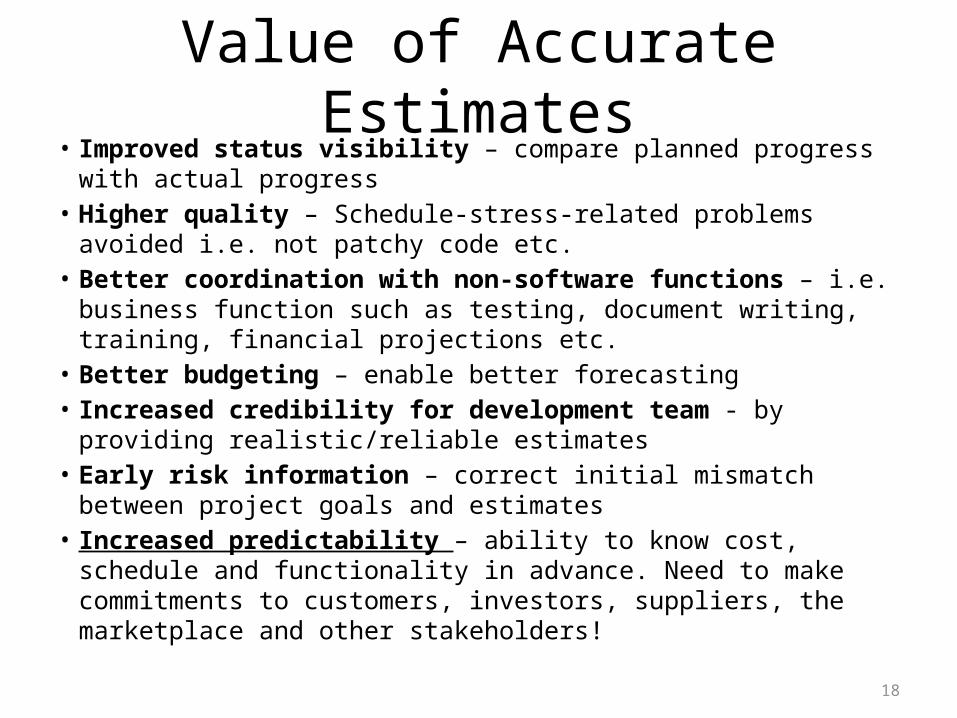
Value of Accurate Estimates• Improved status visibility – compare planned progress with actual
progress• Higher quality – Schedule-stress-related problems avoided i.e. not
patchy code etc.• Better coordination with non-software functions – i.e. business
function such as testing, document writing, training, financial projections etc.
• Better budgeting – enable better forecasting• Increased credibility for development team - by providing
realistic/reliable estimates• Early risk information – correct initial mismatch between project goals
and estimates• Increased predictability – ability to know cost, schedule and
functionality in advance. Need to make commitments to customers, investors, suppliers, the marketplace and other stakeholders!
19
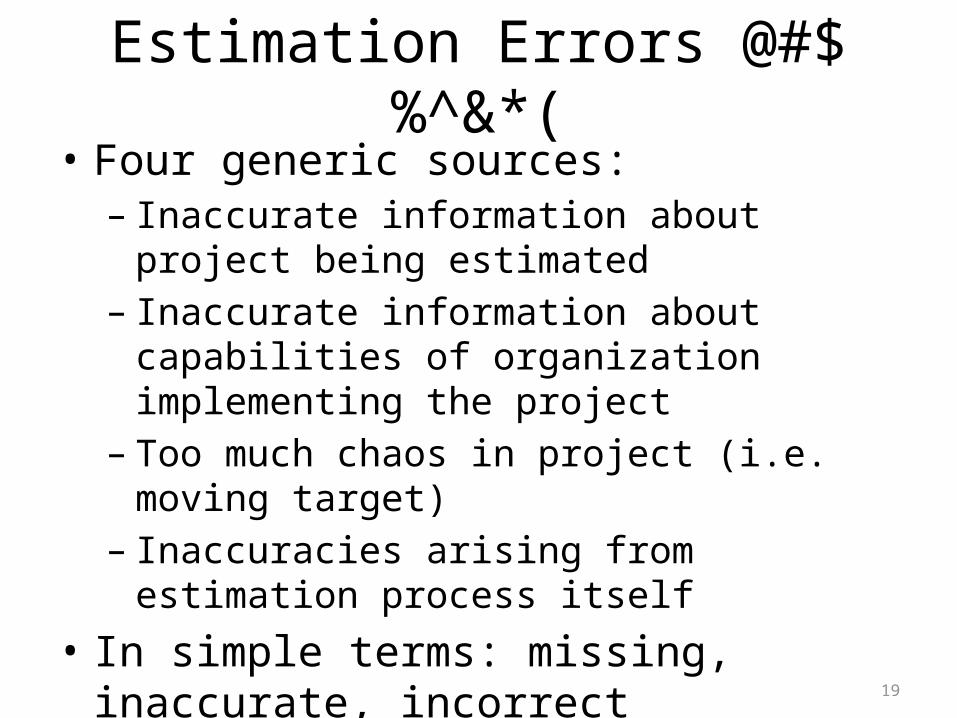
Estimation Errors @#$%^&*(• Four generic sources:– Inaccurate information about project being
estimated– Inaccurate information about capabilities of
organization implementing the project– Too much chaos in project (i.e. moving target)– Inaccuracies arising from estimation process itself
• In simple terms: missing, inaccurate, incorrect understanding of features, costs, schedule, effort etc., owing to the above factors

20
Cone of Uncertainty
1.0x
0.8x
0.67x
0.5x
0.25x
4x
2x
1.5x
1.25x
Initial Concept
Approved Product
Definition
Requirements Complete
User Interface Design
Complete
Detailed Design Complete
Software Complete
16x
Erro
r ran
ge!
The more refined the software’s definition the more accurate the estimate
21
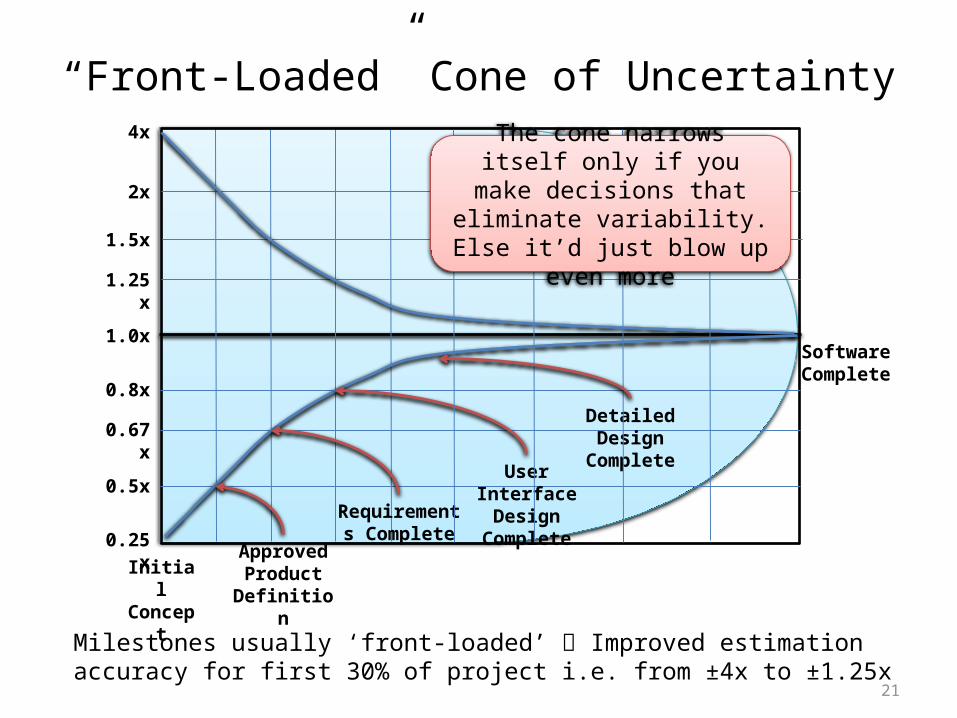
“Front-Loaded” Cone of Uncertainty
1.0x
0.8x
0.67x
0.5x
0.25x
4x
2x
1.5x
1.25x
Initial Concept
Approved Product
Definition
Requirements Complete
User Interface Design
Complete
Detailed Design Complete
Software Complete
Milestones usually ‘front-loaded’ Improved estimation accuracy for first 30% of project i.e. from ±4x to ±1.25x
The cone narrows itself only if you make decisions that
eliminate variability. Else it’d just blow up even more
22
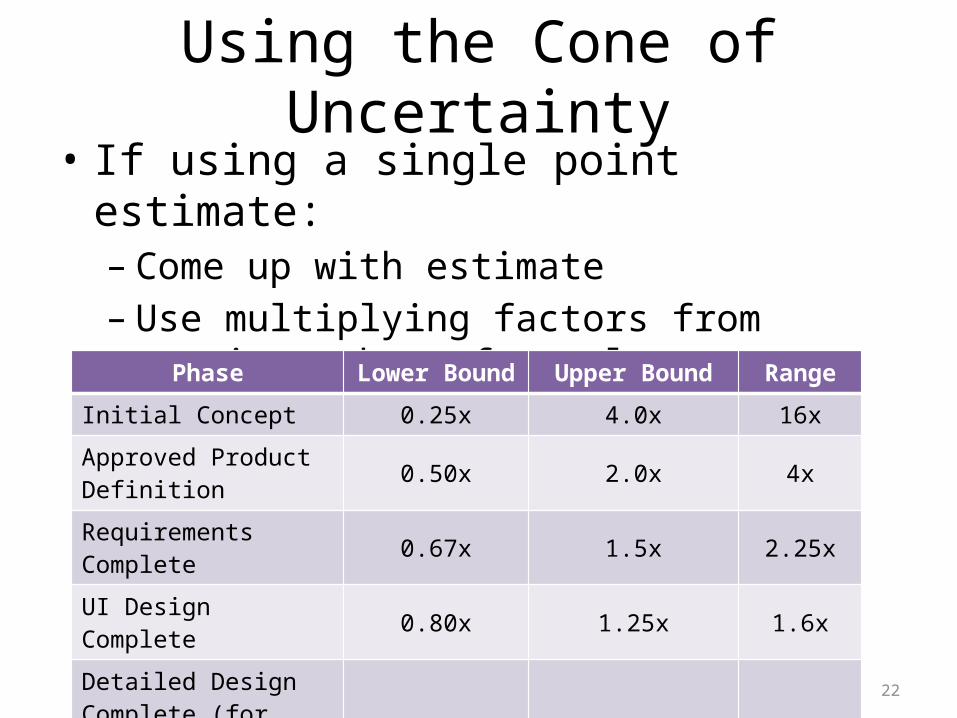
Using the Cone of Uncertainty• If using a single point estimate:– Come up with estimate– Use multiplying factors from previous chart for
relevant milestone to get rangePhase Lower Bound Upper Bound Range
Initial Concept 0.25x 4.0x 16xApproved Product Definition 0.50x 2.0x 4x
Requirements Complete 0.67x 1.5x 2.25xUI Design Complete 0.80x 1.25x 1.6xDetailed Design Complete (for sequential projects) 0.90x 1.10x 1.2x

23
Estimation Techniques
24
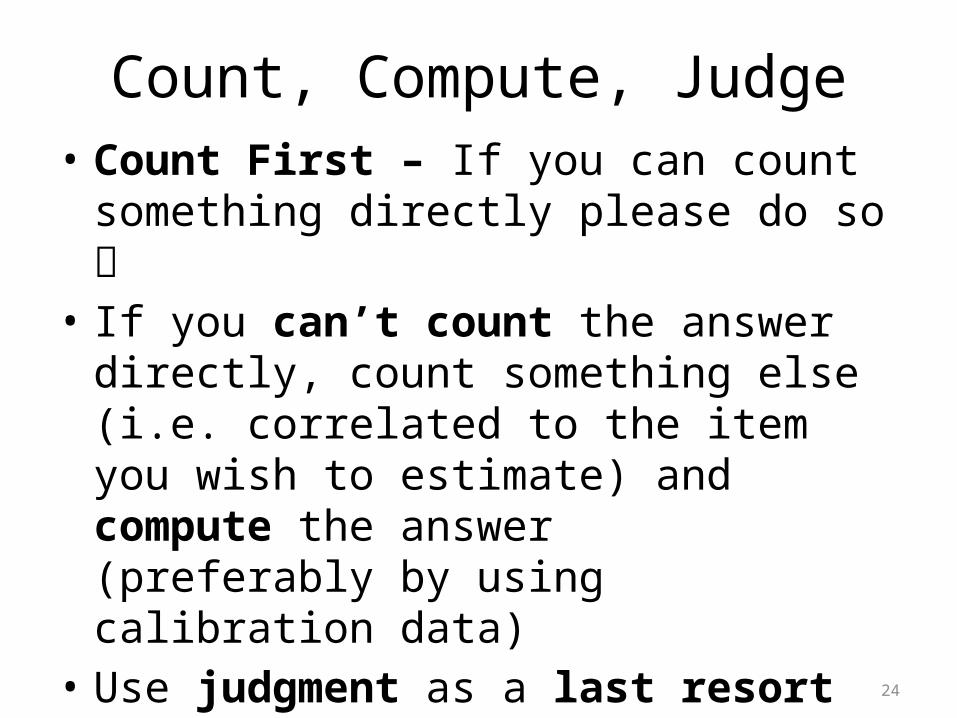
Count, Compute, Judge• Count First – If you can count something
directly please do so • If you can’t count the answer directly, count
something else (i.e. correlated to the item you wish to estimate) and compute the answer (preferably by using calibration data)
• Use judgment as a last resort
25
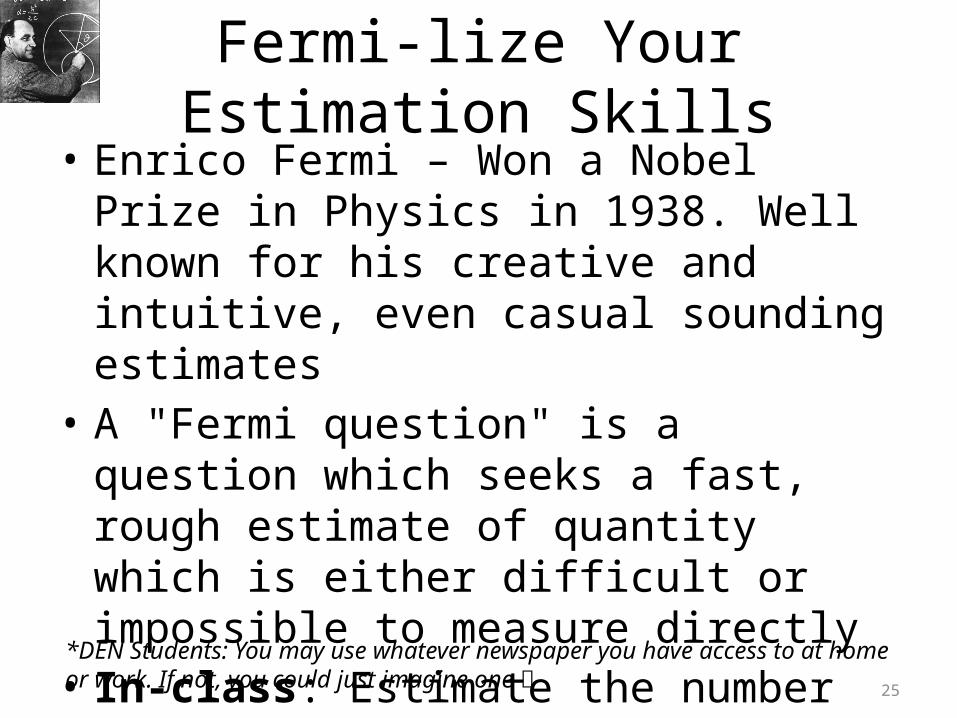
Fermi-lize Your Estimation Skills• Enrico Fermi – Won a Nobel Prize in Physics in
1938. Well known for his creative and intuitive, even casual sounding estimates
• A "Fermi question" is a question which seeks a fast, rough estimate of quantity which is either difficult or impossible to measure directly
• In-class: Estimate the number of words in the today’s newspaper (Daily Trojan @ USC)*
*DEN Students: You may use whatever newspaper you have access to at home or work. If not, you could just imagine one
26
Fermi Decomposition• Figure out something that is known about the
quantity in question• Estimate other things that may have a bearing on
that quantity – it’s okay to have rough approximations
• Sometimes you can just Google some numbers to extrapolate from there!
• It’s ALWAYS possible to estimate and get ballpark idea about the quantity in question
• In-class 2: How many racket-ball or golf balls can fit in this class room

27
Individual Expert Judgment• Most common estimation approach• Experts = those are doing the task • These are ‘task-level’ estimates i.e. specific
tasks like feature development, testing etc.,• Task level estimation: Decompose estimates
into tasks requiring no more than 2 days of effort (rule of thumb to avoid estimation error)

28
Individual Expert JudgmentFeature Estimated Days to CompleteFeature 1 1.5Feature 2 1.5Feature 3 2Feature 4 0.5Feature 5 0.5Feature 6 0.25Feature 7 2Feature 8 1Feature 9 0.75
Feature 10 1.25
Total 11.25
Feature Estimated Days to CompleteBest Case Worst Case
Feature 1 1.25 2Feature 2 1.5 2.5Feature 3 2 3Feature 4 0.75 2Feature 5 0.5 1.25Feature 6 0.25 0.5Feature 7 1.5 2.5Feature 8 1 1.5Feature 9 0.5 1Feature 10 1.25 2Total 10.5 18.25
Example of developer single-point estimates (not preferable)
Example of individual estimation using best case and worst case. Provides better estimates and forces thinking of worst case estimates – leading to better overall range
29
Individual Expert JudgmentFeature Estimated Days to Complete
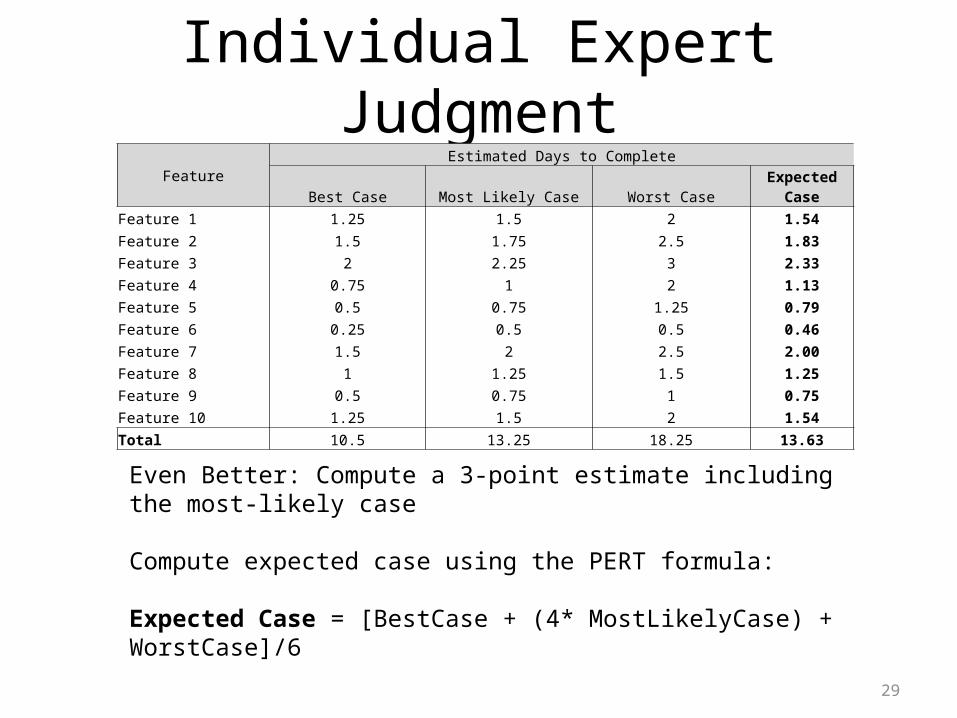
Best Case Most Likely Case Worst Case Expected CaseFeature 1 1.25 1.5 2 1.54Feature 2 1.5 1.75 2.5 1.83Feature 3 2 2.25 3 2.33Feature 4 0.75 1 2 1.13Feature 5 0.5 0.75 1.25 0.79Feature 6 0.25 0.5 0.5 0.46Feature 7 1.5 2 2.5 2.00Feature 8 1 1.25 1.5 1.25Feature 9 0.5 0.75 1 0.75Feature 10 1.25 1.5 2 1.54Total 10.5 13.25 18.25 13.63
Even Better: Compute a 3-point estimate including the most-likely case
Compute expected case using the PERT formula:
Expected Case = [BestCase + (4* MostLikelyCase) + WorstCase]/6
30
Individual Expert JudgmentFeature Estimated Days to Complete
Actual Outcome
MRE (%)
In Range?Best Case Most Likely Case Worst Case Expected Case
Feature 1 1.25 1.5 2 1.54 2 23% YES
Feature 2 1.5 1.75 2.5 1.83 2.5 27% YES
Feature 3 2 2.25 3 2.33 1.25 87% NO
Feature 4 0.75 1 2 1.13 1.5 25% YES
Feature 5 0.5 0.75 1.25 0.79 1 21% YES
Feature 6 0.25 0.5 0.5 0.46 0.5 8% YES
Feature 7 1.5 2 2.5 2.00 3 33% NO
Feature 8 1 1.25 1.5 1.25 1.5 17% YES
Feature 9 0.5 0.75 1 0.75 1 25% YES
Feature 10 1.25 1.5 2 1.54 2 23% YES
Total 10.5 13.25 18.25 13.63 16.25 80% Yes
Average: 29%
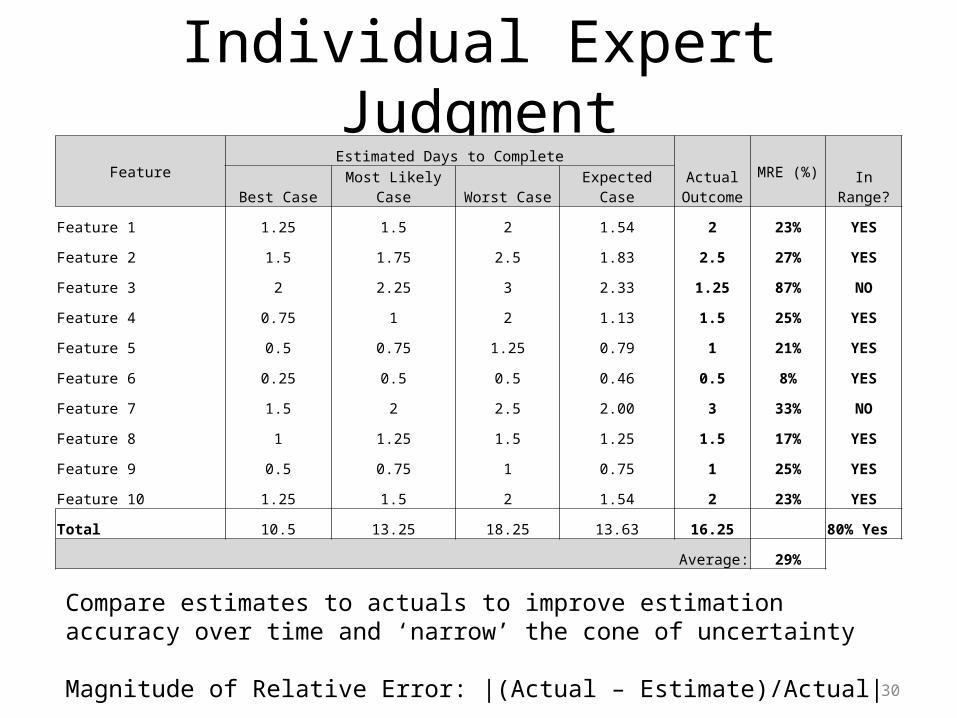
Compare estimates to actuals to improve estimation accuracy over time and ‘narrow’ the cone of uncertainty
Magnitude of Relative Error: |(Actual – Estimate)/Actual|

31
Decomposition & Recomposition• Process:– Separate and estimate into multiple pieces– Estimate each piece individually– Recombine individual estimates into an overall
aggregate estimate• AKA “bottom up” estimation or “Work
Breakdown Structure (WBS)• Very important and highly used technique• Leads to quite accurate estimates
32
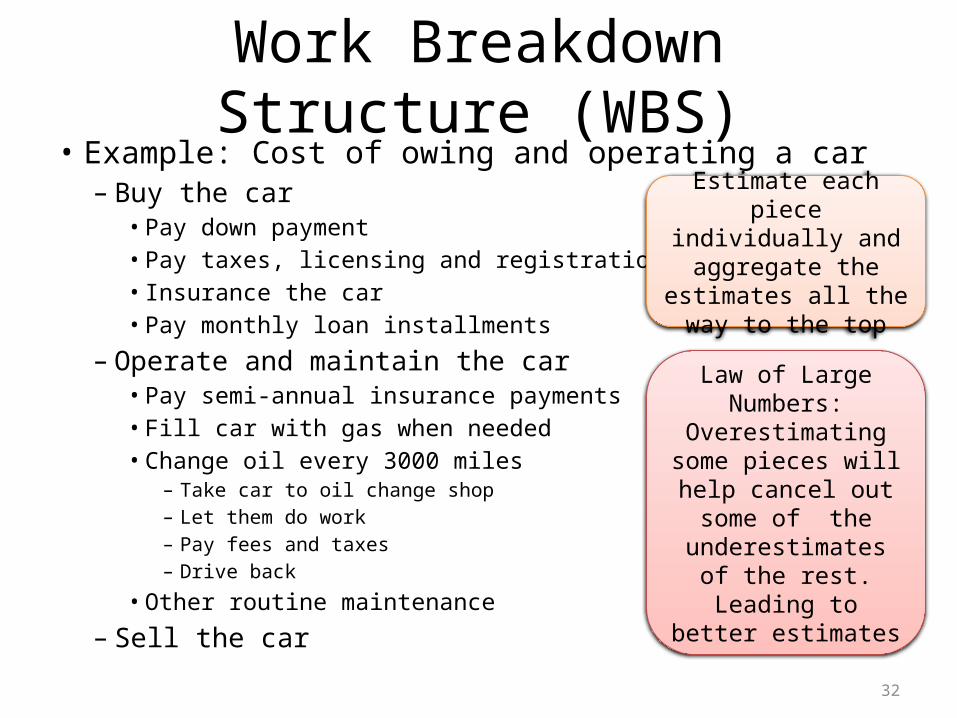
Work Breakdown Structure (WBS)• Example: Cost of owing and operating a car
– Buy the car• Pay down payment• Pay taxes, licensing and registration fees• Insurance the car• Pay monthly loan installments
– Operate and maintain the car• Pay semi-annual insurance payments• Fill car with gas when needed• Change oil every 3000 miles
– Take car to oil change shop– Let them do work– Pay fees and taxes– Drive back
• Other routine maintenance
– Sell the car
Estimate each piece individually and
aggregate the estimates all the way to the top
Law of Large Numbers:Overestimating some pieces will help cancel
out some of the underestimates of the rest. Leading to better
estimates
33
Estimation by Analogy• Create estimates of new project by comparing it to a
similar past project• Can help create accurate estimates (by following the
process below, instead of relying on memory)– Get detailed size, effort and cost results for similar
previous project (WBS is preferable if possible)– Compare size of new, piece-by-piece to previous– Build up estimate for new project’s size as a percentage
of old project’s size– Create an effort estimate based on size of new project
compared to that of previous one– Check for consistent assumptions across the two
34
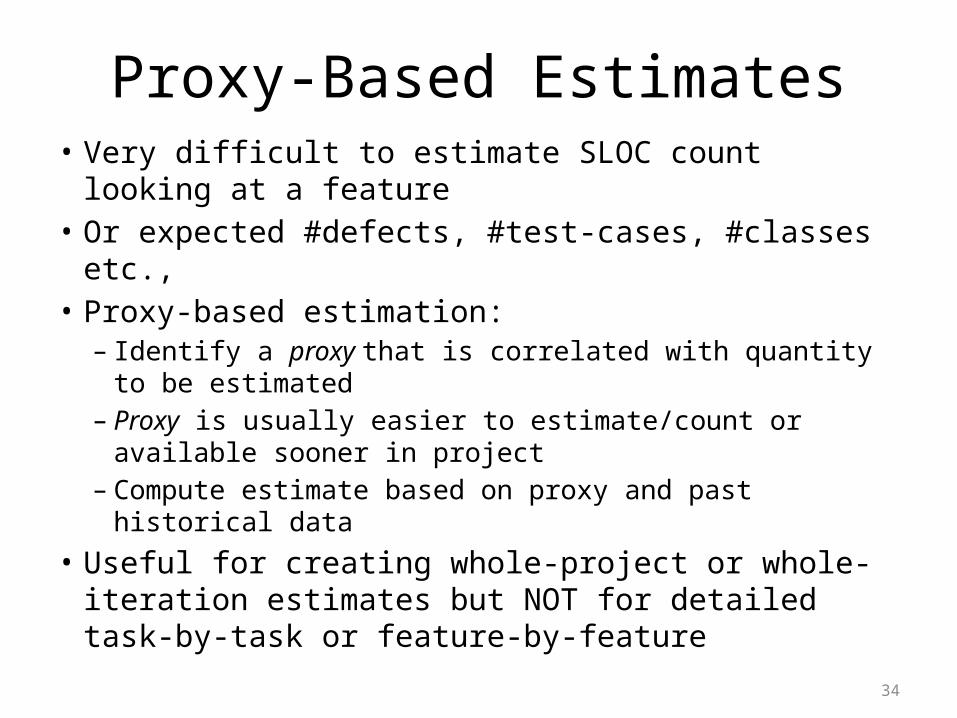
Proxy-Based Estimates• Very difficult to estimate SLOC count looking at a
feature• Or expected #defects, #test-cases, #classes etc.,• Proxy-based estimation:– Identify a proxy that is correlated with quantity to be
estimated– Proxy is usually easier to estimate/count or available sooner
in project– Compute estimate based on proxy and past historical data
• Useful for creating whole-project or whole-iteration estimates but NOT for detailed task-by-task or feature-by-feature

35
Story Points• Unit-less measure of ‘complexity’ or ‘size’ of
feature• Scales:– Powers of 2: 1, 2, 4, 8, 16 …– Fibonacci: 1, 2, 3, 5, 8, 13 …
• #Story-Points per iteration = Velocity i.e. looking at past velocity estimate completion time of project (use historical data if available or forecast or run one iteration)

36
T-Shirt Sizing• Break features into various (albeit fuzzy)
T-shirt sizes– Small, Medium, Large, X-Large, XX-Large etc.
• Estimate Business Value and Ease of Realization using T-shirt sizes for each feature
• Gauge overall feature value based on responses
• Provides crude, sufficiently accurate, initial high-level estimates in the wide part of the cone

37
T-Shirt Sizing Score Chart• Can create one that suits the organization or
use the one below as per Steve McConnell:
• Use scores from above chart to compute approximate net business value for each feature (in sorted order)
Business Value
Development Cost (Ease of Realization)X-Large Large Medium Small
X-Large 0 4 6 7
Large -4 0 2 3
Medium -6 -2 0 1
Small -7 -3 -1 0

38
Expert Judgments in Groups• Similar to planning poker 1. Have each team member estimate pieces of
project individually 2. Meet to compare the estimates3. Reach mutual consensus as group– Without averaging the estimates. You may
average the estimates but you still need to discuss individual results
• Extremely effective technique to help improve estimation accuracy

39
Estimation by Tools• Helps perform tasks that can’t be done manually– Simulating project outcomes (i.e. sensitivity analysis)– Probability Analysis i.e. viewing the (cumulative)
probability distribution of the estimates– What-if analyses– Serves as referee for unrealistic project expectations– Estimation of less common software issues
• Works best if you have historical data for calibration
40
List of Available Tools• COCOMO II• Construx Estimate• Costar (commercial implementation of
COCOMO II)• Price-S• SEER• SLIM-Estimate and Estimate Express• Your own home grown one?

41
Using Multiple Approaches• No single technique is perfect• Best to augment estimation with multiple
approaches• Each approach works best in specific context• Convergence amongst estimates suggests a
good estimate• Divergence helps see if something was
overlooked or needs to be understood better
42
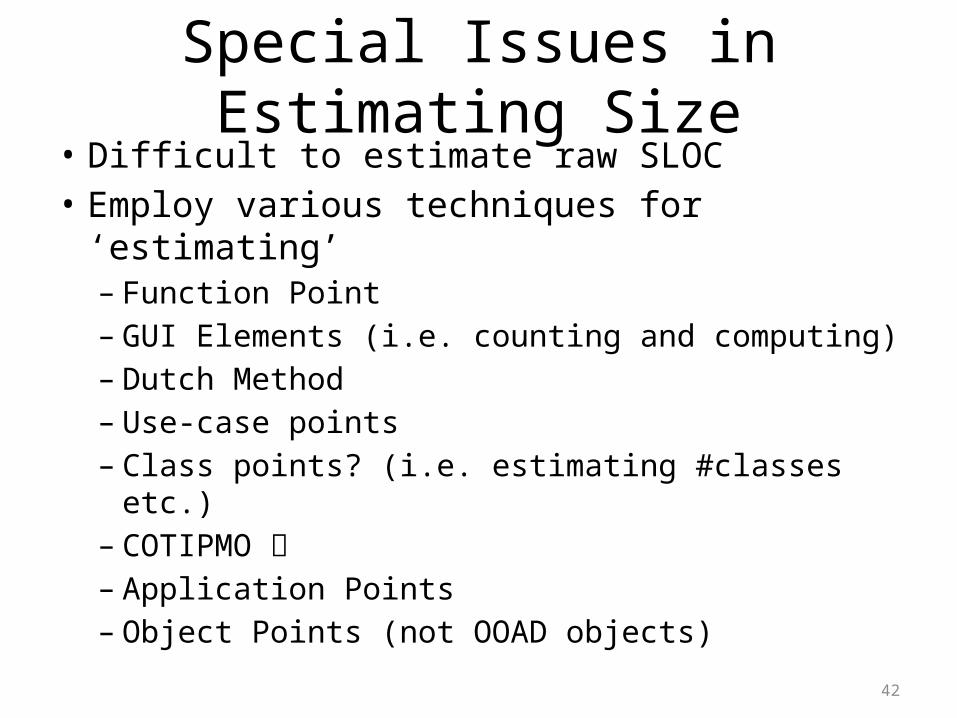
Special Issues in Estimating Size• Difficult to estimate raw SLOC• Employ various techniques for ‘estimating’ – Function Point– GUI Elements (i.e. counting and computing)– Dutch Method– Use-case points– Class points? (i.e. estimating #classes etc.)– COTIPMO – Application Points– Object Points (not OOAD objects)

43
Special Issues in Estimating Effort• Quite difficult to get right• Various techniques maybe employed:– Informal comparison to past projects– Estimation software tools– Industry-average effort graphs– ISBSG Method (International Software
Benchmarking Standards Group)• Has developed various equations fitting various types of
projects that can be used for estimating effort (based on function-points for size)

44
Special Issues in Estimating Schedule• As evident, equally hard as the other two• Various techniques:– Schedule Equation (Courtesy Dr. Boehm ):• ScheduleInMonths = 3.0 x StaffMonths(1/3)
– Informal comparison to past projects– Estimation software tools
45
Conclusion• Estimation is NOT an art (somewhat but not
entirely)• Can effectively be executed as a science• Need not rely purely on intuition or memory • Improves over time especially if historical data is
captured• Requires basic arithmetic to understand• Complex models can be created with the help of
statistics – premise of most ‘tools’• VERYYYYYYYYYYYYYYYY Critical skill-set to have in
the 21st Century