sodium survey england 2011 text to dh final
TRANSCRIPT

A survey carried out on behalf
of the Department of Health
National Diet and Nutrition Survey - Assessment of dietary sodium in
adults (aged 19 to 64 years) in England, 2011
Katharine Sadler, Sonja Nicholson, Toni Steer, Valdeep Gill, Beverley Bates, Sarah Tipping, Lorna Cox, Alison Lennox and Ann Prentice
TABLE OF CONTENTS
Acknowledgements ..................................................................................................2
Executive Summary..................................................................................................3
1 Introduction ......................................................................................................4
2 Background ......................................................................................................4
3 Aims of the study ...............................................................................................5
4 Methodology .....................................................................................................6 4.1 Sample design........................................................................................................................6
4.2 Participant recruitment............................................................................................................7
4.3 Urine collection procedures ....................................................................................................9
4.3.1 Nurse training .....................................................................................................................9
4.3.2 Nurse contact and first nurse visit.......................................................................................9
4.3.3 Urine collection protocol .....................................................................................................9
4.3.4 Second nurse visit ............................................................................................................10
4.4 Urine analysis (HNR) Lab procedure ....................................................................................11
4.5 Assessment of completeness of collection ...........................................................................11
4.6 Methodological differences: comparisons with previous surveys ..........................................12
5 Response and Weighting ...................................................................................13 5.1 RDD and nurse response (boost study)................................................................................13
5.2 Number of useable samples (boost study and NDNS)..........................................................13
5.3 Urine collection days ............................................................................................................14
5.4 Weighting .............................................................................................................................14
6 Results ..........................................................................................................16 6.1 Estimated salt intakes...........................................................................................................16
7 Salt intake Trend Analysis (2000/01 to 2011)...........................................................17 7.1 Trend analysis methodology.................................................................................................17
7.2 Trend analysis results...........................................................................................................18
7.3 Comparisons between estimated salt intakes in the current and previous sodium surveys...19
8 Discussion .....................................................................................................20 Appendix A PABA Information Leaflet..........................................................................................22
Appendix B Consent Form...........................................................................................................23
Appendix C Urine Collection Sheet ..............................................................................................24
Appendix D HNR analytical procedures .......................................................................................26
Appendix E HNR Laboratory quality control procedures...........................................................27
Appendix F PABA adjustment formula – comparison with the previous survey analysis ..........29
9 References and Notes .......................................................................................31
2
Acknowledgements
We would like to thank all those members of the public who gave their time and co-operation to
participate in the survey.
In addition, we would like to thank everyone who contributed to the survey and the production of this
report.
At the Department of Health, our thanks go to Gillian Swan and Frederick Wheeler for their support
throughout the survey.
At MRC Human Nutrition Research (HNR), thanks are due to Polly Page, Gerda Pot, Kate Guberg,
Karen Chamberlain, Nida Ziauddeen, Wing Nip, Elizabeth Stickley, Tabasum, Abhilash Krishnankutty,
Veronica Bell, Katie Dearnley, Darren Cole, Iain Bayes, Luigi Palla and Adam Messenger.
At NatCen Social Research, our thanks go to the telephone interviewers and nurses who worked on
the study, Pauline Burge, Chris Massett, Sue Roche, Megan Hodges, Josephine Taylor, Bladimir
Florez, Olu Alaka, Steve Edwards and Claire Deverill.
At University College London (UCL), thanks are due to Jennifer Mindell (Survey Doctor) and Barbara
Carter-Szatynska.

3
Executive Summary
This survey was designed to provide data to establish progress towards meeting the Department of
Health’s target to reduce the population average of dietary salt intakes to no more than 6g per day.1
The aim was to collect useable 24-hour urine samples from 600 respondents, representative of the
population aged 19 to 64 years living in England in the second half of 2011. Urinary sodium excretion
was used to estimate salt intake. Salt intake was calculated using the equation: 17.1 mmol of sodium
= 1g salt and assumes all of the sodium was derived from salt.2 Urine collections were deemed
complete by either 70% recovery of para-amino benzoic acid (PABA) or where individuals chose not to
take PABA but recorded a complete 24-hour collection. The analysis of urinary sodium excretion was
carried out at MRC Human Nutrition Research, Cambridge (HNR).
Key findings
• The mean estimated salt intake, derived from urinary sodium excretion, for adults aged 19 to 64
years was 8.1g per day, with men having a mean estimated intake of 9.3g per day and women
having a mean estimated intake of 6.8g per day
• Overall, 70% of participants had a daily intake of salt higher than the recommended maximum of no
more than 6g per day; 80% of men and 58% of women exceeded this recommendation
• An analysis of trends in estimated salt intake (g per day), taking into account the previous six
sodium excretion surveys carried out in UK countries between 2000/01 and 2009, and the current
survey carried out in England in 2011, showed a significant downwards trend in mean estimated salt
intake both overall from 9.5g in 2000/01 to 8.1g in 2011 and for men and women separately.
Statistical analysis showed there has been a significant reduction in mean estimated salt intake
between 2000/01 and 2011
• The drop in estimated salt intake in 2011 compared with the previous estimate in 2008 was not
statistically significant

4
1 Introduction
This survey provides data to establish progress towards meeting the Department of Health (DH)’s
target to reduce the average population salt intakes in England to 6g per day.1 This survey builds on
the series of previous urinary sodium excretion surveys reporting salt intakes in the general adult
population in United Kingdom (UK) countries.
Dietary salt intake can be assessed by measuring sodium excretion in urine. A 24-hour urine collection
method was used, as this was consistent with previous surveys. Since the level of sodium in urine
fluctuates according to what was eaten at the last meal and how much fluid an individual has drunk,
and because salt is the predominant source of sodium in the UK diet, a urine collection over 24 hours
is accepted as being the most reliable method for assessing salt intake in the population.1 To be usable
in the final analysis the 24-hour collection has to be complete, which can be measured by analysis of
para-aminobenzoic acid (PABA) excretion.
A sample size of 600 usable urine samples, representative of the population aged 19 to 64 living in
England, was required to be able to detect a difference of 0.5g of salt intake compared with the
previous UK survey in 2008 (calculated from the standard error in that survey).3 These samples were
generated from the National Diet and Nutrition Survey (NDNS) rolling programme,4 with additional
samples generated via a “sodium boost” add-on study to the NDNS, This allowed an estimate of salt
intake at a defined point in time.
2 Background
There is an established relationship between salt intake and health, in particular cardiovascular
disease (CVD).1, 5 CVD remains a major cause of morbidity and mortality in the UK and worldwide.
The British Heart Foundation estimates that CVD costs the UK economy 30 billion pounds each year
and, in 2010, caused 50,000 premature deaths in the UK.6 Diet is a major component in the
preventative strategy to reduce the risk of CVD. High blood pressure (hypertension) is a risk factor for
CVD, and scientific evidence suggests that a high salt intake contributes to the development of high
blood pressure.7
Since the early 1990’s the UK government has recommended a reduction in salt consumption in the
interest of public health. In 1991, the Committee on Medical Aspects of Food and Nutrition Policy’s
(COMA) panel on dietary reference values set the reference nutrient intake of sodium at 1.6g per day
(or 4.2g of salt) for men and women.8 Following this, COMA’s cardiovascular review group

5
recommended that population average salt intakes should be reduced from the then average of 9g per
day to 6g per day for adults.9 The 2000/01 NDNS found that the mean estimated salt intake in adults
in GB was 9.5g per day.10 COMA’s recommendations on salt reduction were later endorsed by the
Chief Medical Officer of England11 as well as by the Scientific Advisory Committee on Nutrition (SACN),
who in their report on salt and health highlighted that a reduction in the salt content of processed foods
and drinks was necessary to achieve the recommended levels of salt intake.1
In 2003 the DH and Food Standards Agency (FSA) committed to a nationwide salt reduction
initiative to reduce the UK population average salt intake to 6g per day. In order to achieve this target
by 2010, in 2006 the FSA introduced voluntary salt reduction targets for the food industry for 85
categories of food.12 Publication of the UK dietary sodium excretion survey (2008) showed that the
average estimated salt intake for adults in the UK was 8.6g per day,3 which was a 10% reduction
compared with 2000/01. In May 2009 the FSA set revised targets for the industry to be achieved by
2012.13 Salt reduction is a key element of the DH’s Public Health Responsibility Deal, which was
launched in 2011 and which outlines a series of pledges to which businesses have been asked to
commit that will help to improve public health.14 The salt reduction pledge sets targets for salt reduction
in 80 categories of food for businesses to meet in 2012, and has the potential to deliver a 1g reduction
in salt intakes (based on 2007 salt levels in food).
Furthermore, there have been targeted salt reduction campaigns that aim to inform the population
about health risks associated with salt consumption. For example, the FSA’s ‘Sid the slug’, ‘check the
label’ and ‘Is your food full of it?’ campaigns.15 More recently the national Change 4 Life16 campaign
has a focus on healthy lifestyles, including salt reduction. Large supermarkets have also introduced
front-of pack labelling providing information about salt content to help consumers make informed
choices.
3 Aims of the study
• To achieve 600 useable 24-hour urine samples over a 4-6 month period using samples
collected in the NDNS rolling programme, supplemented by additional samples collected in a
sodium boost study,
• Urine samples were to be obtained from a representative sample of the population of England,
aged 19 to 64 years
• To estimate dietary salt intakes (g per day) from urinary sodium excretion
• To conduct an analysis of trends in salt intake (g per day) for the sodium surveys carried out
between 2000/01 and 2011

6
Ethical approval for the study was granted by the MREC as a substantial amendment to the main
NDNS study (Ref. No. 07/H0604/113).
4 Methodology
4.1 Sample design
The aim of the study was to collect useable 24-hour urine samples from 600 participants,
representative of the population aged 19 to 64 years living in private households in England. The
participants were recruited from two sources:
• the core England NDNS sample interviewed by nurses in the first five months of Year 4 nurse
fieldwork (visits carried out between 07/07/11 and 14/12/11). It was estimated that 48
participants would be generated from the core England NDNS sample
• a “sodium boost” study that ran separately to, but using the same protocols as NDNS. The boost
fieldwork ran between 05/09/11 and 14/12/11 and was designed to generate an additional 552
cases
Together these two studies form the Sodium Survey England 2011 (called the “Diet and Health Study
2011” in field). A random sample of 43 postcode sectors was selected from the Postcode Address File
for the boost study. The boost sample used the same stratifiers as the main NDNS sample; the file
was initially sorted by Government Office Region, then within each region the file was stratified into five
equal bands based on the Index of Multiple Deprivation. Within each band the file was then sorted by
population density.
Within the 43 postcode sectors a random sample of telephone numbers was drawn using Random
Digit Dialling (RDD). RDD is a method where a representative sample of telephone numbers is
generated at random from a frame of all possible telephone numbers. As well as including ex-directory
numbers, RDD samples include disconnected numbers but as many non-working numbers as possible
were removed before the sample for the boost study was drawn.
The RDD sample covered all eligible telephone area codes located in the 43 selected postcode
sectors. The database lists the first seven digits of all telephone numbers, including ex-directory
numbers, which have been allocated to telephone companies for land lines (e.g. 01234 56XXXX). For
each selected area code, the last four digits were randomly generated. 11,529 telephone numbers
were issued (after removing non-working numbers).

7
A maximum of two people aged 19 to 64 years within each household were eligible to take part in the
study. Where there were more than two eligible adults in a household, two adults were randomly
selected. Females who were pregnant or breastfeeding were not eligible to take part.
The sample from the previous (2007/08) UK Sodium Study3 was skewed towards women (398 women
and 294 men); the smaller sample size for male participants reduced the scope of the analysis that
could be carried out on this group. To increase the number of male participants in this current study,
male household members were given a higher chance of being selected (see section 5.4 for further
detail).
4.2 Participant recruitment
Participants for the boost study were recruited by NatCen’s Multi-mode Unit (MMU) interviewers. Prior
to starting work on the study, MMU interviewers attended a half-day training session which covered the
background and purpose of the study and their role in recruiting individuals to the study. Interviewers
were also given detailed written project instructions covering the aims of the study, methodology and
fieldwork procedures.
The telephone numbers were issued to the MMU in four batches. The MMU interviewers attempted to
make contact with the generated telephone numbers and when successful followed a Computer
Assisted Telephone Interviewing (CATI) script to introduce the study and check the eligibility of
household members. Within each household, up to two adults, aged between 19 and 64 years, were
eligible to take part in the study. If there were three or more eligible adults, two were selected at
random within the CATI programme.
The MMU interviewer then conducted a short telephone interview with eligible households to collect
contact and household information and basic contextual information, e.g. economic circumstances,
shopping and diet habits (recent consumption of general food items such as fruit, cereal, meat and oily
fish) within the household. The interviewer then sought agreement for the nurse to visit the selected
participant(s).
Each household that agreed to take part in the nurse visit stage received a letter thanking them for
their agreement to take part in the study and informing them that the nurse would be in touch shortly to
arrange a visit. They were also sent a leaflet outlining the study in more detail. The details of those
agreeing to be visited were passed on to the assigned nurse, who then arranged an appointment at a
time convenient to the participant(s).

8
Recruitment of participants to the sodium boost study: flow diagram
1
A further 108 samples were collected from NDNS participants
Telephone numbers issued to MMU
11,529
Number of adults aged 19 to 64 visited by a nurse
639
Household screened in (at least one adult aged
19 to 64) 891
Households agreeing to be contacted by a nurse
(issued to nurse) 570
Useable telephone numbers
3,455
Individual non-participation Refused nurse visit 40 Non contact 8 Other unproductive 11
Household non-participation Ineligible (out of area, no-one aged 19 to 64) 1,044 Refused telephone interview 1439 Other unproductive 81
Telephone numbers attempted by MMU
8,880
Adults 19 to 64 providing a sample
6101
Number of adults aged 19 to 64 a nurse attempted to
visit 698

9
4.3 Urine collection procedures
4.3.1 Nurse training
Nurses new to urine collection procedures were briefed in person by the project researchers. The face-
to-face briefings lasted one day and covered all elements of the study process. They included the
study aims, background and methodology, documentation and paperwork, a practise of the CAPI
(computer-assisted personal interview) programme, a practical demonstration of the equipment used to
collect urine and the despatch procedures. Nurses were also given detailed written project
instructions.
If the nurse had recently worked on NDNS (and was therefore familiar with the procedures and urine
protocols) they completed a self-briefing. This involved reading the project instructions, completing a
quiz, practical exercises of labelling and form completion and CAPI practise. The practical exercises
and quiz were marked in the office and feedback given to each nurse.
4.3.2 Nurse contact and first nurse visit
The nurse made initial contact with the participant(s) via telephone, after which they sent a letter
confirming details of the appointment date and time to the participant(s). They then visited participating
households at least twice. The purpose of the first nurse visit was to encourage the participant(s) to
take part, check eligibility, provide the participant(s) with detailed leaflets about PABA (see Appendix
A) and the urine collection instructions, obtain written consent and deliver the equipment. The nurse
also agreed a date with the participant(s) for when they would carry out the 24-hour urine collection,
assigned a serial ID for labelling and booked an appointment for the second visit (usually the day, or
the day after, the 24-hour urine collection finished). The nurse completed an appointment card for the
participant to serve as a reminder of when the nurse would return to pick up the urine sample(s).
4.3.3 Urine collection protocol
After obtaining written consent (see Appendix B), participants were asked to collect all urine they
passed during a 24-hour period starting from the second morning urine pass of the 24-hour collection
day, and ending with the first urine passed the following morning. The nurse discussed with the
participant on which day of the week to make the collection. In order to maximise response participants
were allowed to make the collection on a day of their choice and the majority preferred to collect their
sample at the weekend (or on another non-work / college day). However, in recognition that diet often
differs between weekdays and weekend days, nurses encouraged participants to collect their sample
on a weekday where possible. Females were instructed to collect their urine on non-period days.

10
To do the 24-hour collection, participants were provided with the following equipment:
• 5 litre capacity screw cap (or jerry can) container to serve as the collection container for urine. This
contained a small amount of the preservative boric acid (powder)
• 2 litre capacity screw cap container for collections made away from the home. This was also used
as an overflow container should the participant fill the 5 litre jerry can
• 1 litre plastic jug, kept inside a re-sealable plastic bag when not used
• Funnel kept inside a re-sealable plastic bag when not used
• Plastic carrier bags for transporting the equipment away from home
• An aide-memoire safety pin for the participant to pin the under- and outer garments together during
the period of the collection to remind that the specimen of urine about to be passed should be
collected
• Three PABA tablets to be taken to verify completeness of the 24-hour collection
Participants were instructed to pass urine into the 1 litre plastic jug, and then pour the sample into the 5
litre collection container using the funnel provided. Plastic bags were provided to carry the equipment
(including a smaller 2 litre collection container) if participants were not at home for some of the
collection period.
Participants were also asked to take three PABA tablets at evenly spaced intervals throughout the day
of the collection (the first tablet in the morning at 8am (no later than 12noon), the second at 12 noon
(no later than 4pm) and the last tablet at 6pm (no later than 10pm)). Analysis of PABA excretion
provided a measure of the completeness of the 24-hour urine sample (see section 4.4). However
unlike previous sodium excretion surveys, participants were still eligible to take part if they did not want
to take PABA but were willing to carry out the 24-hour urine collection. Likewise, those who could not
take PABA because of an allergy to vitamin preparations, hair dyes or sunscreen lotions and those
who were taking sulphonamide antibiotics, but were willing to carry out the collection, were eligible.
Before leaving the household the nurse completed the participant details, agreed start date of the 24-
hour collection and whether the participant had consented to take PABA tablets on a Urine Collection
Sheet (see Appendix C). This sheet was then completed by the participant during the collection
period. They recorded the time they took the PABA tablets, the start and finish times of their collection,
any missed urine passes, and any medication or supplements taken during the collection period.
4.3.4 Second nurse visit
At the second nurse visit the nurse collected two sub-samples from the 24-hour urine sample and
disposed of the remaining urine and equipment. To do this the nurse was supplied with the following
equipment:

11
• Scales for weighing the urine collection container.
• 2 x 10ml Sarstedt Urine syringe, 2 x quills, 1 small beaker.
• Disposable gloves, apron, disposable work mat, postal container and packing material for
despatching the samples and despatch note.
• Labels for the urine samples.
The container with the 24-hour collection was weighed twice by the nurse and the weight recorded on
the despatch sheet and in the CAPI. The nurse then carried out the sub-sampling procedure, and
discarded the remainder of the 24-hour collection, labelled the samples and checked that the Urine
Collection Sheet was complete, in particular the start and end time, report of any missed collections or
missed PABA tablets and any medications/supplements taken during the collection period. This
information was entered into CAPI. The nurse then packaged and sent the samples, Urine Collection
Sheet, PABA blister pack and despatch paperwork to the laboratory at HNR.
Finally, each participant was given a £15 promissory note for their participation in the study (a £15 High
Street voucher was subsequently sent out from the office).
4.4 Urine analysis (HNR) Lab procedure
After the second nurse visit, all samples were labelled and despatched to HNR, where the analysis of
sodium was carried out using an ion selective electrode on the Siemens Dimension® Xpand clinical
chemistry system with the QuikLYTE® module. Completeness of 24-hour urine collections was
assessed using the para-amino-benzoic acid (PABA) recovery method.17
4.5 Assessment of completeness of collection
In brief, for those who consented to taking PABA and reported taking each of the three 80mg PABA
tablets spaced at 8-hour intervals, urinary recovery over 24-hours was considered complete if the
collections had a PABA recovery between 70% and 104%18 analysed by a HPLC method.19 Further
details are provided in Appendix D. A recent methodological study (unpublished data) conducted at
HNR showed that for our current analytical HPLC method, the appropriate cut-off for completeness in
healthy adults is 70% (mean - 2SD) which incorporates both biological and methodological variation.
This is a different assay method to those used in previous sodium surveys (see Appendix F).
Urine samples with a PABA recovery under 70% were considered incomplete, whilst samples with a
PABA recovery greater than 104% were considered unfeasibly high and therefore unreliable. No
12
adjustment formulae were applied to the 24-hour sodium excretion for any of the samples in the current
survey.
As on the main NDNS, individuals who elected not to take PABA but recorded they had completed a
24-hour urine collection were also included. Such individuals who recorded start and finish times
within 1 hour of a 24-hour collection period (i.e. recorded urine collected between 23-25 hours) were
deemed to have a complete 24-hour collection. In addition participants who elected to take PABA but
reported that they did not take all three PABA tablets yet still recorded they had completed a 24-hour
urine collection were also included. Excluding the results from these individuals did not materially alter
the results.
4.6 Methodological differences: comparisons with previous surveys
The protocol for analysing PABA in this current survey using a specific HPLC method, is a more secure
way of determining the completeness of a urine collection than the less specific colorimetric methods
used in the past (see Appendix F). The move to HPLC reflects improvements in analytical methods
over time, and results in a more straightforward criterion for interpreting PABA recovery in terms of the
completeness of 24-hour urine collections. HNR has built on the experience of methods used in the
previous surveys, all of which used different protocols for excluding urine samples on the basis of the
likelihood that the 24- hour collection was incomplete. If the more specific (HPLC) analytical method
and revised exclusion criteria from the current survey had been applied to previous survey data the
estimated impact would be a reduction in published estimates of mean salt intake in the region of 1 to
3%, or about 0.1 to 0.3g of salt. Median values would have been less affected and closer to the
published values.

13
5 Response and Weighting
Response at the two stages of the sodium boost study, the usability (i.e. whether the participant was
eligible, the sample was received by the lab and whether it was complete) and collection days of the
sodium boost and NDNS samples is presented below.
5.1 RDD and nurse response (boost study)
Of 8,880 telephone numbers attempted by NatCen’s telephone interviewers 39% (3,455) were
useable. Of these, 26% (891) were households that had at least one eligible adult and agreed to the
telephone interview (30% were ineligible, 42% refused the telephone interview and 2% were
unproductive for another reason).
During the telephone interview 64% (573 / 891) agreed a nurse visit, although three households gave
incorrect or incomplete contact details meaning 570 households were issued to the nurses.
(Table 1)
In total 1,001 individual cases were issued to nurses, of which nurses attempted to visit 70% (698)
(303 (30%) were not attempted due to low nurse capacity during the fieldwork period). Of these, 92%
(639) of individuals had a nurse visit (6% refused and 3% were returned as a non-contact or other
unproductive) and 87% (610) provided a 24-hour urine sample. Table 2 shows this individual response
at the nurse stage by sex.
(Table 2)
5.2 Number of useable samples (boost study and NDNS)
In total, 718 urine samples were collected (610 from the boost study and 108 from NDNS). However,
four samples were collected from participants who were outside the 19 to 64 age range and one
sample was not received by the laboratory.
Therefore, 713 urine samples, from 309 men and 404 women, were processed by the laboratory. Of
these, 77% (547) were classified as ‘complete’ and 23% (166) were classified as ‘incomplete or
unreliable’.
(Table 3)
The majority of urine samples that were classified as ‘incomplete or unreliable’ (162) were excluded
from the dataset on the basis of PABA excretion being outside the range of 70-104% where three
PABA tablets had been taken, or on the basis of the participant’s record where three PABA tablets

14
were not taken. Four samples were excluded because of an incomplete or missing urine collection
form. See details in Table 4.
(Table 4)
The sex of participants included in the analysis was significantly different (p<0.05) from the participants
excluded from the analysis; urine samples from 19% of men (59 / 309) and 26% of women (107 / 404)
were excluded. Of those included in the analysis, 46% were men and 54% were women. However, the
age of participants was not significantly different between the included and excluded sample. The
mean age for men was 47.6 years in the included sample and 46.5 years in the excluded sample. For
women the mean age in the included sample was 48.1 years, and 46.6 years in the excluded sample.
This was similar to previous urinary sodium surveys.
(Table 5)
5.3 Urine collection days
As described in section 4.3.3, where possible nurses encouraged participants to collect their urine
sample on a weekday, so that the collection timings were not concentrated at the weekend when diet
may differ.
Overall, 46% of samples were collected from Monday to Friday, and 54% were collected at the
weekend. Table 6 shows day of 24-hour urine collection by day of the week broken down by age
group and sex.
(Table 6)
5.4 Weighting
There were two stages to the weighting. The first step was to generate a set of weights to correct for
unequal selection probabilities of individuals within households. The second stage was to make an
adjustment for different levels of non-response.
Selection weights
A set of selection weights were generated to adjust the sample for selection of individuals within
eligible households. Selection probabilities varied depending on the sample source. For the sodium
boost sample up to two adults aged 19 to 64 years were selected from each household, with male
household members having a higher chance of being selected. Men in households with three or more
eligible individuals were weighted by a factor of 1.56, whilst women within the households were given a
weight of 1.00. A factor of 1.56 was chosen as it was estimated that this would increase young males
in the responding sample by around 30% (as previous studies had shown that men had lower

15
response rates). Two household members were then selected at random with probability proportional
to this weight. For NDNS, one eligible adult aged 19 years or over was selected, although selected
adults aged 65 or over were not included in this sodium survey.
Selection weights are equal to the inverse of the selection probabilities:
• The selection weights for boost sample members in households with up to two eligible household
members are equal to 1, since all eligible individuals were selected
• The selection probabilities for boost sample members in households with more than two eligible
household members are equal to: 2 X weighting factor / total weighting factor, where the
weighting factor is 1.56 if the individual was male and 1.00 if the individual was female, and the
total weighting factor is the sum of the weighting factors of all eligible household members. The
selection weights are then equal to the inverse of this selection probability
• Within each NDNS household one eligible adult was selected at random with equal probability.
The selection weights are therefore equal to the number of eligible NDNS individuals (aged 19+)
within the household 20
Calibration of the selection weights
The selection weights were then adjusted to create a final set of weights for analysis. All individuals
who provided a useable sample were given an analysis weight. The analysis weights were generated
using calibration methods. The aim was to reduce bias resulting from sampling error and differential
non-response by sex and age and Government Office Region (GOR). An iterative procedure was used
to adjust the selection weight until the distribution of the (weighted) sample matched that of the English
population by age, sex and GOR. The adjustment keeps the values of the final weights as close as
possible to those of the initial weights to ensure the properties of the initial weights are retained in the
final calibrated weights. Population information about individuals aged 19 to 64 and living in England
was taken from the 2010 mid-year population estimates.21 The distributions of the population and
weighted and unweighted samples are shown in Table 7.
(Table 7)
16
6 Results
6.1 Estimated salt intakes
The aims of the 24-hour urine collection analysis were to estimate the mean and population distribution
of 24-hour salt intake (g per day) in England among those aged 19 to 64 years.22 In line with the
2000/01 NDNS of Adults aged 19 to 64 years10 and the previous urinary sodium surveys in England
(2006),23 Scotland (2006),24 Wales (2007),25 UK (2008)3 and Scotland (2009)26 salt intake was
calculated using the equation: 17.1 mmol of sodium = 1 g of salt. This assumes that dietary intake of
sodium is equal to the 24-hour sodium output in urine, and that all sodium in the diet comes from salt.2
Table 8 provides mean urinary sodium excretion by sex and age group expressed as mmol/24hr and
table 9 shows the percentage distribution of urinary sodium excretion. Table 10 provides mean
estimated salt intake by sex and age group expressed as g per day and table 11 shows the percentage
distribution of estimated salt intake. Mean urinary sodium excretion was 159mmol/24hr for men and
117mmol/24hr for women aged 19 to 64 years.
The mean estimated salt intake for adults aged 19 to 64 years was 8.1g per day, with men having a
mean daily intake of 9.3g per day and women having a mean daily intake of 6.8g per day. Table 10
shows that there was a downward trend in mean estimated salt intake in women with increasing age;
however the same pattern was not seen in men.
(Table 10)
Overall, 70% of the participants had a daily intake of salt higher than the recommendation of no more
than 6g per day. Among men 80% exceeded 6g per day compared with 58% of women.
(Table 11)

17
7 Salt intake Trend Analysis (2000/01 to 2011)
This section of the report describes an analysis of trends in estimated salt intake (g per day, calculated
from 24-hour sodium excretion) for the seven sodium surveys carried out in UK countries between
2000/01 and 2011: NDNS 2000/01 (GB),10 England Sodium Survey 2006,23 Scottish Health Survey
Sodium Survey 2006,24 Wales Sodium Survey 2007,25 UK Sodium Survey 2008,3 Scottish Health
Survey Sodium Survey 200926 and the NDNS England Sodium Survey 2011. For the trend analysis,
each survey has been treated as a separate time point. This means that results from different
countries are compared over time. Sodium intake in different UK countries will be affected by a range
of factors. However we consider that there are enough similarities between UK countries to make this
a valid comparison. The key details of these surveys are shown below.
Survey Year Useable urine sample size
Age-range (years)
PABA
Great Britain July 2000 - June 2001 1,152 19-64 None
England October 2005 – July 2006 515 19-64 Required
Scotland March – November 2006 564 19-64 Required
Wales May – November 2006 533 19-64 Required
United Kingdom January – May 2008 692 19-64 Required
Scotland January 2009 – February 2010 702 19-64 Required
England July - December 2011 (majority in September, October and November)
547 19-64 Optional (although encouraged)
7.1 Trend analysis methodology
In some surveys, an adjustment was made to the sodium excretion in a proportion of urine samples to
compensate for incomplete 24-hour collections. The sodium content of these incomplete samples was
adjusted according to the amount of PABA that had been recovered. Further discussion of this
adjustment and the formula used to make the adjustment can be found in Appendix F and the 2009
Scottish Health Survey sodium report.26
Estimated salt intake (g per day) was then calculated using the equation: 17.1 mmol of sodium = 1 g
salt.
No adjustments were made to samples from the NDNS 2000/01 sodium survey (PABA was not used in
this survey) or to samples from the NDNS England 2011 sodium survey (as different inclusion criteria
were applied). The impact of these methodological and analytical differences is described in Section

18
4.6 and Appendix F. In summary if the more specific HPLC method and revised exclusion criteria used
in the NDNS England 2011 survey were applied to previous survey data it would be likely to slightly
reduce previous published mean salt intake values by approximately 1 to 3%, or about 0.1 to 0.3g of
salt.
The data were weighted and clustered. The appropriate survey weights were used for each of the
surveys included in the analysis. The analysis incorporated information about clustering as each
survey had been geographically clustered for practical reasons. The analysis was run using the
complex surveys module in SPSS, which allows information about weights and clusters to be correctly
taken into account when generating estimates and standard errors. Any stratification was ignored
however, since this information was not available for all surveys. Stratification generally improves
survey precision slightly, ignoring it in the analysis makes the estimated standard errors (and therefore
confidence intervals) slightly larger than they would otherwise be, although the impact will be small.
7.2 Trend analysis results
Table 12 shows the mean estimated salt intake (g per day, calculated from 24-hour sodium excretion)
for each sodium survey carried out between 2000/01 and 2011. Figures 1 and 2 plot the mean
estimated salt intakes and 95 per cent confidence intervals for the different survey years. Figure 1
shows mean estimated salt intake overall and Figure 2 shows separate means for men and women.
The focus of this analysis is the trend in salt intake between 2000/01 and 2011 (i.e. the slope).
The table and plots show a downward trend in the mean estimated salt intake (g per day) both overall
and for men and women. Overall, mean estimated salt intake decreased by 1.4g per day, from 9.5g
per day in 2000/01 to 8.1g per day in 2011. Across the same period, mean estimated salt intake
decreased by 1.7g per day for men (from 11.0g per day to 9.3g per day) and by 1.3g per day for
women (from 8.1g per day to 6.8g per day).
(Table 12, Figures 1 and 2)
Linear regression was used to test the trend in mean estimated salt intake across survey years. The
regression model was used to fit a trend line through the data and test the gradient of this trend. There
was a significant downward trend in mean estimated salt intake across the period between 2000/01
and 2011. The decline across survey years was significant (p<0.05).
The same finding held when looking at men and women separately.

19
7.3 Comparisons between estimated salt intakes in the current and previous sodium surveys
The means and percentages for the 2011 survey discussed in this section are presented in Tables 8-
11 of this report and are for stratified data. Means and percentages for the previous England 2006 and
Wales 2007 survey datasets are un-stratified whilst the UK 2008 survey dataset is stratified using
Standard Statistical Region, population density, socio-economic group and car ownership. In addition
the adjustment formulae detailed in Appendix F were applied to marginally incomplete collections in
these datasets. As previously mentioned, the application of the current survey’s analytical methods and
exclusion criteria to previous survey data would be likely to reduce the published mean salt intake
values by approximately 1 to 3%, or about 0.1 to 0.3g of salt (see Section 4.6 and Appendix F). These
small differences do not substantially affect the overall downward trend in salt intake over time.
In the period between 2008 and 2011, the mean estimated salt intake for persons aged 19 to 64 years
decreased by 0.3g per day in men and 0.9g per day in women. However, this decrease in salt intake
was not significant.
Eighty-nine per cent of men and 70% of women aged 19 to 64 years exceeded the 6.0g per day daily
salt target in the 2006 England sodium survey. These figures were compared with the findings
presented in Table 11 and Appendix F, which shows that in 2011 80% of men and 58% of women
aged 19 to 64 years exceeded this salt target. In the 2008 UK sodium survey, 82% of men and 66% of
women aged 19 to 64 years exceeded this salt target, whilst the 2007 Wales sodium survey showed
82% of men and 55% of women exceeded the 6.0g per day salt target.
20
8 Discussion
This report presents the results of a 24-hour urine sample study that was designed to provide an
estimate of salt intake towards the end of 2011 using sodium excretion in urine. The study was carried
out in a representative sample of adults aged 19 to 64 years in England from July to December 2011.
The estimated daily salt intake was 9.3g for men and 6.8g for women (8.1g per day for men and
women aged 19 to 64 years combined).
There was a drop between 2008 and 2011 in the estimated daily salt intake of adults aged 19 to 64
living in England. A comparison of salt intakes from the two years showed that this decrease was not
statistically significant, due in part to the smaller than expected achieved sample size in 2011 (i.e. 549
rather than 600). However, the drop forms part of a wider downward trend and should be viewed in that
context. A number of sodium studies have been carried out since the 2000/01 NDNS. A trend analysis
using these studies showed a significant downward trend in salt intake across this period
The current and previous studies have resulted in a low number of useable samples in the younger
age groups; most notably the 19 to 34 age categories, which highlights the continued challenges of
involving younger adults in 24-hour urine studies.
Ongoing surveys enable the monitoring of progress made towards the UK population target of a mean
intake of no more than 6g per day. It informs progress made by manufacturers in reducing the salt
content of products and public health salt reduction campaigns. This report shows the overall
downward trend in estimated salt intakes in similar surveys carried out over the past decade. It
demonstrates positive progress towards the long term programme of salt reduction in the UK.
However, a notable proportion of participants still have a daily salt intake greater than the
recommendation of no more than 6g per day.
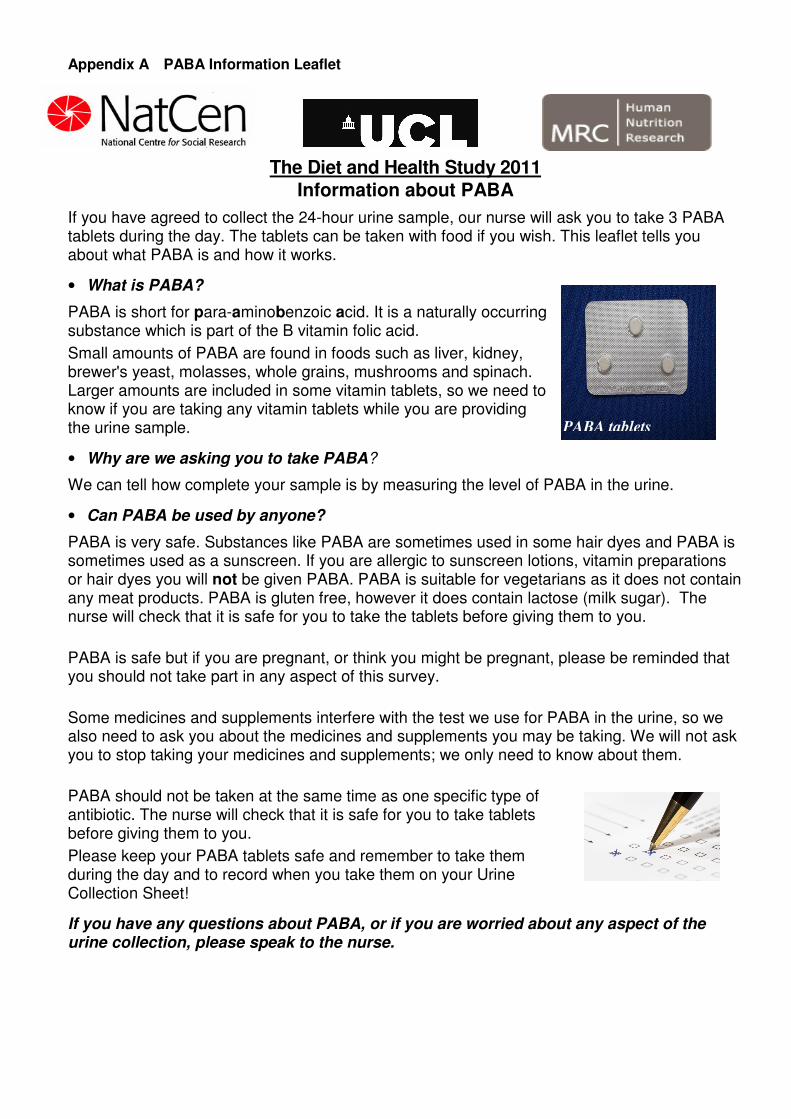
Appendix A PABA Information Leaflet
The Diet and Health Study 2011
Information about PABA
If you have agreed to collect the 24-hour urine sample, our nurse will ask you to take 3 PABA tablets during the day. The tablets can be taken with food if you wish. This leaflet tells you about what PABA is and how it works.
• What is PABA?
PABA is short for para-aminobenzoic acid. It is a naturally occurring substance which is part of the B vitamin folic acid.
Small amounts of PABA are found in foods such as liver, kidney, brewer's yeast, molasses, whole grains, mushrooms and spinach. Larger amounts are included in some vitamin tablets, so we need to know if you are taking any vitamin tablets while you are providing the urine sample.
• Why are we asking you to take PABA?
We can tell how complete your sample is by measuring the level of PABA in the urine.
• Can PABA be used by anyone?
PABA is very safe. Substances like PABA are sometimes used in some hair dyes and PABA is sometimes used as a sunscreen. If you are allergic to sunscreen lotions, vitamin preparations or hair dyes you will not be given PABA. PABA is suitable for vegetarians as it does not contain any meat products. PABA is gluten free, however it does contain lactose (milk sugar). The nurse will check that it is safe for you to take the tablets before giving them to you.
PABA is safe but if you are pregnant, or think you might be pregnant, please be reminded that you should not take part in any aspect of this survey.
Some medicines and supplements interfere with the test we use for PABA in the urine, so we also need to ask you about the medicines and supplements you may be taking. We will not ask you to stop taking your medicines and supplements; we only need to know about them.
PABA should not be taken at the same time as one specific type of antibiotic. The nurse will check that it is safe for you to take tablets before giving them to you.
Please keep your PABA tablets safe and remember to take them during the day and to record when you take them on your Urine Collection Sheet!
If you have any questions about PABA, or if you are worried about any aspect of the urine collection, please speak to the nurse.
PABA tablets

Appendix B Consent Form
Diet and Health Study 2011
CONSENT FORM
Affix serial ID label:
Respondent’s name____________________________________(BLOCK
LETTERS)
§ I have received the information leaflets which explain the nature and purpose of the
study. I have read and understood these leaflets.
§ I am satisfied with any enquiries I have made regarding the study.
§ I have been informed that the results will be kept confidential and presented in a way that protects my identity.
§ I understand that I may withdraw my consent to any or all of the survey elements at any time without needing to give a reason.
I hereby consent to the following aspects of the study:
24 HOUR URINE CONSENTS:
Please initial box if consent given
Taking PABA tablets to support the 24-hour urine collection.
Laboratory analysis of my 24-hour urine collection, to help assess my diet.
Storage of any remaining urine for tests in the future relating to nutrition and health,
provided that the tests are approved by an NHS ethics committee. I understand that I
can withdraw my consent to store my urine at any time, without giving any reason, by
asking the investigators in writing for my urine to be removed from storage and
destroyed. I understand that my data is being used in anonymised form only.
Signature: ……………………………………………Date ……………………..

Appendix C Urine Collection Sheet
Diet and Health Study 2011
24-hour Urine Collection Sheet
SECTION A: NURSE TO COMPLETE
Nurse name
Nurse Number
Please affix serial number
label here
Label UCOLL
Respondent initials: Respondent Sex: M F
Respondent DOB: / / Age: Years
Start date of 24-hour collection
/ /
Respondent consented to take PABA tablets? Yes
No
SECTION B: RESPONDENT TO COMPLETE
1. DATE / TIME OF COLLECTION PERIOD
Date Time (24-hour clock)
24 hour collection: Start / / :
24 hour collection: End / / :
2. DATE / TIME OF PABA TABLETS
PABA tablet PABA tablet taken? (Y / N) Date Time(24-hour clock)
* 1st
tablet – take at 8am / / :
* 2nd
tablet – take at 12noon / / :
* 3rd
tablet – take at 6pm / / :
* Please see 24 hour urine collection information leaflet for detailed instructions. If you forget to take a tablet please take it as soon as you remember and no later than 4 hours after the time stated above.
IMPORTANT: Please turn over and complete the rest of your collection sheet…

25
3. MISSED URINE
It is very important that you collect all the urine you produce in the 24 hour period.
However, if you have MISSED any urine collections, please make a note of the date
and time in the table below:
Date
Time
(24-hour clock)
1 / / :
2 / / :
3 / / :
4 / / :
4. MEDICINES AND DIETARY SUPPLEMENTS
We also need to know about any medicines and dietary supplements you have taken over
the 24 hour period. Please enter the names of these in the table below:
1
2
3
4
5
6
Please give this form to the nurse, along with your urine sample. The nurse may ask you to
confirm some of the details you have recorded.
Many thanks for taking part in this study.
As a token of our appreciation we will send you £15 in High Street vouchers for completing this study.

26
Appendix D HNR analytical procedures
This appendix describes the methods used to analyse sodium and PABA in the Sodium Survey,
England 2011 and details regarding the quality control procedures for these assays are described
in Appendix E.
Sodium measurement
The sodium method on the Siemens Dimension® Xpand clinical chemistry system with the
QuikLYTE® module is an established in vitro diagnostic test intended for the quantitative
measurement of sodium and potassium in urine. An ion-specific electrode is used to develop an
electrical potential proportional to the activity of each specific ion in the sample. The electrical
potential generated by a sample is compared to the electrical potential generated by a calibrator
solution, and the concentration of the desired ions is calculated (in mmol/litre) by use of the Nernst
equation. Sampling, reagent delivery, mixing, processing, calculation and printing of results are
automatically performed by the Dimension® system. Samples are identified with bar codes; the
instrument automatically uploads barcode and concentration information to a results spreadsheet,
thus eliminating transcription errors.
PABA Analysis by HPLC
HPLC was used to analyse PABA in the 2011 sodium survey. PABA metabolites in urine are
hydrolysed under alkaline conditions, the solution is then neutralised and the resultant PABA
determined by HPLC. The HPLC method is a reverse–phase method using an internal standard to
compensate for volume losses during hydrolysis. The PABA HPLC method used at HNR is based
upon that previously used at the MRC Dunn Nutrition Unit which in turn is based upon the method
described by Jakobsen et al.,(1997).19 The PABA HPLC method was then modified at HNR to
replace the acetonitrile in the mobile phase with methanol because of the unavailability of
acetonitrile.
Completeness of hydrolysis is monitored by including a sample containing PAHA (para amino
hippuric acid) with each batch. This is hydrolysed to PABA which is then quantitated by HPLC.
27
Appendix E HNR Laboratory quality control procedures
The quality of the laboratory analyses is assured by rigorous instrument maintenance, staff
training, adherence to standard operating procedures and good laboratory practice. The quality
control and assessment practices used at HNR are all standard procedures for the type of assay
used and HNR is ISO accredited (BS EN ISO 9001:2008).
An aliquot of a urine sample containing PABA is included in every chromatographic run, treated in
exactly the same way as the respondents’ samples. This was frozen when fresh as several
hundred single-use aliquots, one of which was thawed and used each day. The running mean and
standard deviation of the PABA concentration in this sample obtained on each occasion is
recorded in ‘JMP’, a laboratory QC program (www.jmpdesign.com). Each result for this QA
sample is compared with this mean and assay results for the batch are accepted if the QA results
lie between -2SD and +2 SD of the mean. The data for this running control are also examined for
evidence of drift and for evidence of any changes when new calibrators are prepared. Sample
results are reported if these checks indicate that the assay is in control, and repeated if not.
Additionally the following controls are included:
• An internal standard (prepared in-house; meta hydroxybenzoic acid) is used to ascertain
that recovery is within acceptable limits and to correct for any minor discrepancies in
extraction recovery
• A solution of PAHA (para aminohippuric acid) at known concentration is subjected to the
hydrolysis procedure as described in Appendix D and included in the assay, to ensure that
this part of the analysis has proceeded fully
There is no external quality assessment scheme for PABA.
Urine electrolytes (Siemens Dimension Xpand analyser)
Internal commercially-prepared quality control samples (Biorad Liquichek) are run on the analyser
to check for proper calibration and function before the samples are analysed, and included in
every batch. The results are recorded (mean, sd, %cv) and for each quality control (QC) sample a
check is made that the result obtained is within the manufacturer’s specified range and also within
our more stringent criteria, i.e. within 2SD of the mean and standard deviation, both determined at
HNR.
The HNR Nutritional Biomarker Analysis Laboratory is a member of NEQAS (National External
Quality Assessment Scheme) - this scheme sends samples “blind” to all hospital and similar labs

28
in the UK and compares results, therefore providing regular accuracy checks against hundreds of
peer laboratories and against target concentrations. The laboratory’s performance in this scheme
is consistently good.

29
Appendix F PABA adjustment formula – comparison with the previous survey analysis
In previous surveys, where PABA excretion indicated that the collection was marginally
incomplete, the measured sodium content was adjusted to estimate the sodium content had all the
urine passed during the 24-hours been collected. An adjustment was carried out when the PABA
recovered in the urine was between 70% and 85% by the less specific colorimetric method and
between 75 to 78% for those samples additionally analysed by HPLC in some surveys.17 Such an
adjustment was unnecessary in the present survey because of the revised exclusion criteria.
The method used to compensate for incomplete 24-hour collections in the Scotland Sodium
Survey 2009 is described in Johannsson et al 1999.27
Adjusted 24-hour Sodium = Sodium + 0.82 X (93 - Percentage PABA recovery)
This published formula was used in the 2004 Health Survey for England sodium survey.28 In
recent UK sodium surveys including the England Sodium Survey 2006,23 Wales Sodium Survey
200725 and the UK Sodium Survey 20083 a different formula was used. As there was no published
reference for this formula, the original adjustment formula taken from Johannsson et al 199927 has
been used where compensation for incomplete urine collections was required.
Adjusted 24-hour Sodium = Sodium X (93 / Percentage PABA recovery)
Data from the previous England Sodium Survey 2006,23 Wales Sodium Survey 200725 and the UK
Sodium Survey 20083 have been reanalysed using the referenced PABA adjustment formula
taken from Johannsson et al 1999,27 to allow direct comparison with the current survey.
The effect of reanalysing the 2006 to 2008 data using the formula described in Johannsson et al
199927 on mean sodium output and mean estimated salt intakes overall was small, although
differences in individual intakes where adjustment was required were more marked. These
corrected values have been used in the trend analysis and are shown in Table 12.
In previous surveys a colorimetric method was the primary assay method for the measurement of
PABA in 24-hour urine samples. Any samples with high values that suggested gross interference
were repeated using HPLC. Interference arises because the colorimetric assay cannot
discriminate between PABA and other aromatic amines which may originate from drugs, most
commonly paracetamol. HPLC is now used for all samples at HNR instead of the traditional
colorimetric method as such interference can also occur at lower levels and may not produce a
colour signal sufficient to trigger re-analysis by HPLC. This may make incomplete collections

30
appear complete and therefore lead to them being included inappropriately in the dataset. The
move to HPLC reflects improvements in analytical methods over time, and results in a more
straightforward criterion for interpreting PABA recovery in terms of the completeness of 24-hour
urine collections. Applying the more specific HPLC method and revised exclusion criteria for
completeness to previous survey data would result in lower estimates of mean salt intakes than
previously published values in the region of 1 to 3%, or about 0.1 to 0.3g of salt. Median values
would have been less affected and closer to the published values.
31
9 References and Notes
1 Scientific Advisory Committee on Nutrition (2003). Salt and Health. The Stationery Office.
http://www.sacn.gov.uk/pdfs/sacn_salt_final.pdf . (The recommendation is for no more than 6.0g
of salt per day.)
2 Salt (sodium chloride) is the major source of dietary sodium, however, there are other forms of
sodium present in foods. For example, sodium citrate, monosodium glutamate, sodium cyclamate,
sodium bicarbonate, sodium nitrate.
3 National Centre for Social Research. An assessment of dietary sodium levels among adults
(aged 19–64) in the UK general population in 2008, based on analysis of dietary sodium in 24-
hour urine samples. 2008. http://www.food.gov.uk/multimedia/pdfs/08sodiumreport.pdf
4 National Diet and Nutrition Survey. Department of Health.
http://www.dh.gov.uk/en/Publicationsandstatistics/Publications/PublicationsStatistics/DH_12816
5 Bibbins-Domingo, K., Chertow, G. M. , Coxson, P.G., Moran, A. , Lightwood, J.M., Pletcher, M. J., and Goldman, L. (2010) Projected Effect of Dietary Salt Reductions on Future Cardiovascular Disease. The New England Journal of Medicine. 362:590-599.
6 Scarborough, P et al. (2010) Coronary Heart Disease Statistics. British Hearth Foundation.
http://www.bhf.org.uk/research/statistics.aspx
7 National Institute for Health and Clinical Excellence (2010). Guidance on the prevention of
cardiovascular disease at the population level.
http://guidance.nice.org.uk/PH25/Guidance/pdf/English
8 Department of Health (1991). Dietary Reference Values for Food, Energy and Nutrients for the
United Kingdom. Report on Health and Social Subjects 41. London: The Stationery Office.
9 Department of Health (1994). Nutritional Aspects of Cardiovascular Disease. Report on Health
and Social Subjects 46. London: The Stationery Office.
10 Henderson L, Irving K, Gregory J, Bates CJ, Prentice A, Perks J, Swan G, Farron M. National
Diet and Nutrition Survey: adults aged 19 to 64 years. Volume 3: Vitamin and mineral intake and
urinary analytes. London: The Stationery Office, 2003.
http://www.food.gov.uk/science/dietarysurveys/ndnsdocuments/ndnsprevioussurveyreports/ndnsv
303
11 Department of Health (2001) The Annual Report of the Chief Medical Officer of the Department
of Health. Department of Health.
12 http://www.food.gov.uk/multimedia/pdfs/salttargetsapril06.pdf
13 http://www.food.gov.uk/scotland/scotnut/salt/saltreduction
14 http://responsibilitydeal.dh.gov.uk/
15 http://tna.europarchive.org/20090810121540/http://salt.gov.uk/index.html
16 http://www.nhs.uk/Change4Life/Pages/change-for-life.aspx
17 Bingham S and Cummings J H. The use of 4-aminobenzoic acid as a marker to validate the
completeness of 24h urine collections in man. Clin Sci (Lond) 1983; 64(6):629-35.
32
18 Recoveries slightly greater than 100% reflect the fact that there is inevitably some error in both
the measurement of the volume (weight) of the 24 hour urine collection and the measurement of
the concentration of PABA in the urine.
19 Jakobsen J, Ovesen L, Fagt S, et al. Para-aminobenzoic acid used as a marker for
completeness of 24-hour urine: Assessment of control limits for a specific HPLC method. Eur J
Clin Nutr 1997; 5: 514.
20 The selection weights for NDNS sample members are based on the chance an individual had
of being selected for the NDNS, where one person was selected out of all those in the household
aged 19 or over. Although we later drop selected individuals aged 65 or over, these individuals
would have been involved in the selection process for younger household members, so should be
included in the weight.
21 Office for National Statistics. Mid 2010 Population Estimates. [Online] Available:
http://www.ons.gov.uk/ons/rel/pop-estimate/population-estimates-for-uk--england-and-wales--
scotland-and-northern-ireland/mid-2010-population-estimates/index.html (accessed 26/04/2012).
22 Analysis of the results in this section and table 10 were done using Stata whereas the trend
analysis in section 7 was done using SPSS. The two packages calculate standard errors and
standard deviations slightly differently.
23 National Centre for Social Research. An assessment of dietary sodium levels among adults
(aged 19–64) in the general population in England, based on analysis of dietary sodium in 24-hour
urine samples. 2006. http://www.food.gov.uk/multimedia/pdfs/englandsodiumreport.pdf
24 National Centre for Social Research. A survey of 24-hour and spot urinary sodium and
potassium excretion in a representative sample of the Scottish population. 2006.
http://www.food.gov.uk/multimedia/pdfs/scotlandsodiumreport.pdf
25 National Centre for Social Research. An assessment of dietary sodium levels among adults
(aged 19–64) in the general population in Wales, based on analysis of dietary sodium in 24-hour
urine samples. 2007. http://www.food.gov.uk/multimedia/pdfs/walessodiumreport.pdf
26 Scottish Centre for Social Research. A survey of 24-hour urinary sodium excretion in a
representative sample of the Scottish population as a measure of salt intake.
http://www.natcen.ac.uk/media/752732/final report aprill 2011 all final report.pdf
27 Johansson G, Bingham S, Vahter M (1999). A method to compensate for incomplete 24-hour
urine collections in nutritional epidemiology studies. Public Health Nutrition:2(4), 587-591.
28 Joint Health Surveys Unit (NatCen and UCL) (July 2004). A spot urine sample for the
assessment of dietary sodium and potassium in HSE: results of a comparison between spot urine
and 24-hour urine collections.