sociological methods & research models of college entry...
TRANSCRIPT
Article
Sociological Methods & Research41(1) 17–56
� The Author(s) 2012Reprints and permission:
sagepub.com/journalsPermissions.navDOI: 10.1177/0049124112440797
http://smr.sagepub.com
Models of College Entryin the United Statesand the Challenges ofEstimating Primary andSecondary Effects
Stephen L. Morgan1
Abstract
In recent work in the sociology of education, the primary effects of stratifi-cation are defined as the effects of social class origins on preparation forfuture educational attainment. The secondary effects are then the net directeffects of social class on the transition to the next higher level of education,which are interpreted as average effects of class conditions on students’choices. In this article, the standard model of primary and secondary effectsis laid out in explicit form, and primary and secondary effects are then esti-mated for college entry among recent high school graduates in the UnitedStates. The challenges of estimating these effects for educational transitionsin the United States are then explained, focusing on the weak warrant forcausal inference that is used to justify the calculation of counterfactual netdifferences across classes. Alternative estimates of associational primary andsecondary effects are then offered, after which the prospects for the identifi-cation of causal secondary effects by conditioning on additional confoundersare assessed. In conclusion, an appeal is made for attention to the policy-relevant patterns of heterogeneity that research on primary and secondaryeffects may be able to reveal, and a case is made for elaboration and direct
1Cornell University, Ithaca, NY, USA
Corresponding author:
Stephen L. Morgan, Department of Sociology, Cornell University, 358 Uris Hall, Ithaca, NY
14853, USA
Email: [email protected]
identification of the presupposed choice mechanism that has been assumedto generate secondary effects in past research.
Keywords
causal effect; college entry; heterogeneity
Since the 1940s, social stratification researchers have devoted considerable
effort to modeling the effects of social background on educational attain-
ment in the United States. Erikson and Jonsson (1996), Erikson et al. (2005),
and Jackson et al. (2007) have developed new methods for estimating back-
ground effects on educational attainment that have shown their value in
empirical models of educational transitions in European societies. Should
these new methods also be adopted by researchers who investigate similar
educational transitions in the United States?
The methods proposed by Erikson and his colleagues adopt a concep-
tually appealing distinction between the primary and secondary effects of
stratification, usually attributed to a model of educational opportunity pro-
posed by Boudon (1974).1 The primary effects of stratification on educa-
tional attainment are the effects of social class origins on the current levels
of performance that constitute preparation for higher levels of educational
attainment. The secondary effects are then the net effects of social class ori-
gins on educational attainment, which are interpreted as choice-based effects
that emerge after preparation-determined effects have been purged from the
total effects of class. These secondary effects, it is maintained, reveal the
prevalence of decisions among lower-class students to forego the option of
pursuing educational degrees that they are sufficiently prepared to pursue.
Erikson et al. (2005:9730) note that their empirical methods are based on
an implied model where ‘‘a student achieves a level of academic perfor-
mance and then makes their choice about whether to continue’’ to the next
level of education. Combining the implicit assumptions of this model with
empirical data, strong conclusions have been offered for educational transi-
tions in Great Britain and Sweden. Jackson et al. (2007:224, italics in origi-
nal), for example, write,
[I]t is a serious error to concentrate attention entirely on class differences in aca-
demic performance. . . . Over and above differences of this kind, class differences
further occur in the choices that are made by students, . . . with students from less
advantaged class backgrounds being less likely to take educationally more
18 Sociological Methods & Research 41(1)
ambitious options than students from more advantaged backgrounds, and even
when their academic performance would make such options entirely feasible for
them. This conclusion in turn raises major theoretical and policy issues.
Jackson et al. (2007:224) then argue for policies that target ‘‘resource and
informational constraints’’ to promote alternative choices among the high
performers in the working class.2
All preexisting work on primary and secondary effects has analyzed edu-
cational transitions in European societies. This article presents estimates of
primary and secondary effects on college entry in the United States and then
demonstrates the methodological challenges that confront the methods of
this new research. These challenges include (a) a weak causal warrant for
interpreting net class coefficients from simple logit models as evidence of
class-based choices, (b) reliance on average log-odds measures of relative
importance, and (c) inattention to consequential forms of unit-level hetero-
geneity. The first challenge may be particularly acute for educational transi-
tions in the United States, but the second and third are quite general.
The article proceeds in five sections. First, the standard model of primary
and secondary effects is laid out in explicit form. Second, primary and sec-
ondary effects are estimated under this formalization. Third, a critique of
the existing model is offered with reference to educational attainment pro-
cesses in the United States. Fourth, a descriptive set of associational models
is developed, which it is argued should represent a first step in future mod-
eling of primary and secondary effects. Fifth, the prospects for causal mod-
els of primary and secondary effects are then assessed with an augmented
model that conditions on some of the variables presumed to lie along the
backdoor paths that confound the causal effects in the standard model. The
article concludes with an appeal for direct modeling of the choice-based
mechanism that is implicitly assumed to generate secondary effects and a
discussion of unexamined forms of policy-relevant heterogeneity.
A Simple Structural Model of Primary andSecondary Effects
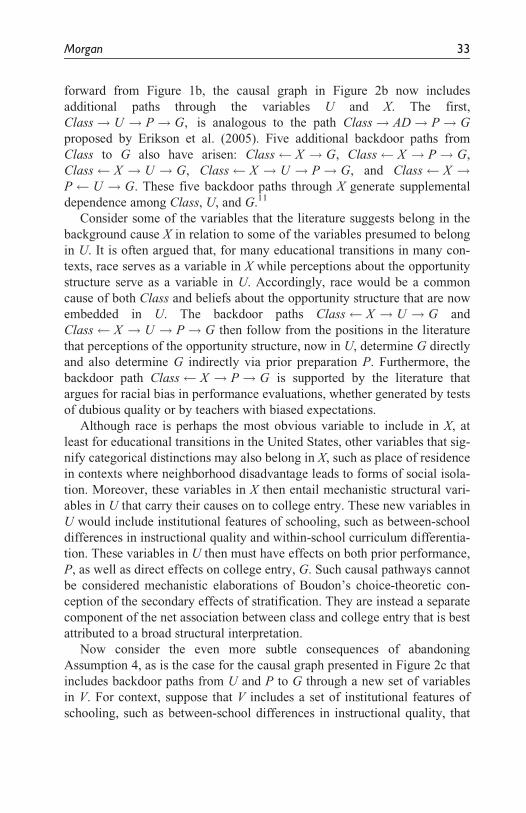
Figure 1a presents a causal graph that, as noted by Erikson et al. (2005), is
the simplest possible causal model of primary and secondary effects. For
the graph in Figure 1a, Class is a categorical measure of social origins, P is
a measure of recent performance in school, and G is an indicator variable
for whether a student goes on to the next level of education. Although
Morgan 19

models in this tradition of analysis are meant to apply to all educational
transitions for which choices are possible, in this article the transition of
interest is entry into four-year colleges among recent high school graduates
in the United States.
For the graph in Figure 1a, the primary and secondary effects are the
causal pathways Class! P! G and Class! G, respectively.3 In path-
modeling language, the primary effect is the indirect effect of class origins
on college entry that is mediated by academic performance in prior school-
ing. The secondary effect is the remaining direct effect of class origins on
college entry.
In the literature inspired by Boudon, the secondary effect has a choice-
theoretic foundation. The causal graph in Figure 1a does not convey in any
way what Boudon means when he writes that ‘‘the primary effects of stratifi-
cation cause the youngsters to be differently distributed as a function of their
family status in . . . such dimensions as school achievement’’ and then that
‘‘the secondary effects of stratification have the result that the probabilities
of choosing [educational course] a rather than b, which are associated with
each point in this space [defined by the dimension of school achievement],
will be greater the higher the social status’’ (Boudon 1974:30). The follow-
ing model brings this choice-theoretic framing in line with the causal graph
in Figure 1a.
Suppose that there are three classes to which students belong based on
the occupations of their parents, as in Erikson et al. (2005) and Jackson et al.
(2007). Membership in these classes is measured by three indicator variables
S, I, and W for the salariat, intermediate, and working classes, respectively.
Figure 1. Two variants of the assumed causal model for the putative primary andsecondary effects of stratification
20 Sociological Methods & Research 41(1)

Suppose that these three classes are mutually exclusive and exhaustive cate-
gories defined by Class in Figure 1a.
The decision of whether to go to college after high school is determined
by
G = 1 if f (P, U ) . t ð1Þ
G = 0 if f (P, U ) � t
where G is an indicator variable for whether a student goes on to college
and P is a measure of performance at the end of high school. In addition, U
is a composite measure that includes all other substantive determinants of
college entry, scaled such that higher values of each component of U always
predispose an individual to go to college.4 Finally, f (:) is an arbitrary func-
tion that is weakly increasing in both P and U, and t is an invariant thresh-
old for the educational transition.5
To now link the model in equation (1) to standard procedures for esti-
mating primary and secondary effects, consider the elaborated causal graph
in Figure 1b, as well as four assumptions about the relationships between
Class, P, U , and G that generate its structure:
� Assumption 1 (Class is a common cause): P and U are increasing in
the levels of Class, such that E½PjS = 1� � E½PjI = 1� � E½PjW = 1�and E½U jS = 1� � E½U jI = 1� � E½U jW = 1�.
� Assumption 2 (P and U are conditionally independent): P and U are
independent of each other within Class, such that Pr½PjClass, U �=Pr½PjClass� and Pr½U jClass, P�= Pr½U jClass�.
� Assumption 3 (no backdoor paths from Class): There are no
variables X that lie along backdoor paths that begin at Class and
end at G, such as Class X ! G, Class X ! P! G, or
Class X ! U ! G.� Assumption 4 (no backdoor paths from P and U): There are no
variables V that lie along backdoor paths that begin at either P or U
and end at G, such as P V ! G or U V ! G:
Consider how these four assumptions, when paired with the model in
equation (1), generate the causal graph in Figure 1b. Assumption 1 stipulates
the existence of the causal effects Class! P and Class! U , and the model
in equation (1) stipulates the existence of the causal effects P! G and
U ! G.6 Assumption 2 stipulates that the causal pathways Class! P! G
Morgan 21
and Class! U ! G are isolated from each other, in the sense that there are
no direct causal effects between P and U that would generate the additional
pathways Class! P! U ! G or Class! U ! P! G. Assumptions 3
and 4 stipulate that there are no causal variables that generate associations
between Class and G, between P and G, or between U and G that do not lie
along the direct causal chains from Class! P! G and Class! U ! G.7
Thus, this assumption states that no common causes of any two variables in
the causal graph in Figure 1b have been erroneously suppressed.
Maintaining the simple structural model in equation (1) and assuming the
causal structure depicted in the graph in Figure 1b based on Assumptions 1
through 4, the primary and secondary effects of stratification are then the two
separable causal pathways Class! P! G and Class! U ! G, respec-
tively. The primary effect is the effect of Class on G that operates indirectly
via P, and the secondary effect is the effect of Class on G that operates indir-
ectly via U. The graph in Figure 1a is best regarded as a simplification of the
graph in Figure 1b, which is permissible because U is unobserved.8
Estimates of Primary and Secondary Effects on CollegeEntry in the United States
In this section, estimates are offered for the primary and secondary effects
of stratification on college entry among high school graduates in the United
States. The data are drawn from the 2002–2006 Education Longitudinal
Study (ELS), which is a national sample of high school sophomores in 2002,
followed up in 2004 and 2006. Additional details of the data source and the
variables used in the analysis are provided in the appendix (which can be
found at http://smr.sagepub.com/supplemental/).
Table 1 presents the distribution of the sample, and the central variables
of the following analysis, across two alternative operationalizations of
‘‘class.’’ The rows of Table 1 are defined using the standard measure of
social class employed in past analyses of primary and secondary effects: the
three-tiered Erikson–Goldthorpe (EG) class schema of salariat, intermediate,
and working classes. This variable is a recoding of the occupational positions
of mothers and fathers into a single ‘‘family class’’ variable. The columns of
Table 1 are defined by the most common measure of family background uti-
lized in the modeling of educational attainment in the sociology of education
in the United States, socioeconomic status (hereafter, SES). The SES variable
that is utilized is a linear composite of mother’s education, father’s educa-
tion, mother’s occupational prestige, father’s occupational prestige, and
22 Sociological Methods & Research 41(1)

family income. For Table 1, and in subsequent analysis, the sample is
divided into SES tertiles, thereby obtaining three equal-sized SES groups for
comparison with the three (not-equal-sized) EG classes more typically ana-
lyzed for models of primary and secondary effects.
Two basic patterns characterize Table 1. First, class and SES groups are
strongly but imperfectly related. Because SES includes parental occupation
as one of its components, SES and class share a common component. Yet the
relationship between the two is not exact because SES is a composite ranking
that is based also on variables for parental education and family income.
Second, both performance in high school and subsequent college entry
vary with both measures of family background in expected ways. The high-
est mean level of performance, .568 on a standardized scale, is observed for
Table 1. College Entry and Performance by Class and SES Group
SES group
ClassHighertertile
Middletertile
Lowertertile Total
SalariatPerformance .568 .021 –.460 .331College entry 65.8% 37.6% 21.4% 54.1%
N 3,424 1,905 399 5,729% of total 30.0% 16.7% 3.5% 50.3%
IntermediatePerformance .465 .051 –.479 –.072College entry 67.6% 43.4% 25.0% 40.6%
N 296 1,117 837 2,250% of total 2.6% 9.8% 7.3% 19.7%
WorkingPerformance –.178 .011 –.404 –.296College entry 29.5% 42.0% 23.9% 23.9%
N 32 813 2,576 3,421% of total 0.3% 7.1% 22.6% 30.0%
TotalPerformance .554 .028 –.426 .076College entry 65.6% 40.2% 23.9% 44.3%
N 3,752 3,835 3,812 11,400% of total 32.9% 33.6% 33.4% 100%
Source: Education Longitudinal Study of 2002–2006.
Notes: Numbers do not always add perfectly across rows and columns because the data are
weighted and then cell sizes are rounded.
Morgan 23

members of the salariat who are also in the highest SES group. This group
represents 30 percent of the full sample, and 65.8 percent of these students
then carried on to a four-year college within six months of graduating from
high school. At the opposite extreme, the 22.6 percent of the sample who
were in the working class and also the lowest SES group had a mean perfor-
mance level of –.404 on a standardized scale. Only 23.9 percent of these
students entered college after high school graduation. The SES and class
marginal distributions in the last row and column of the table, respectively,
show that higher levels of SES and class are always associated with higher
levels of performance and college entry. In the joint distribution in the cells
of the table, slight variation in the pattern is present. Some of the departures
from conditional monotonicity may be genuine, but sampling error for some
of the small cell sizes (especially for high-SES, working-class students) is a
more likely explanation. Classification error is also a candidate explanation.
In the main body of this article, the analysis of primary and secondary
effects is offered for EG classes to preserve fidelity with the extant literature
on primary and secondary effects that is critiqued. In the appendix, equiva-
lent models are presented using SES groups. As detailed there, the overall
patterns are broadly similar, with SES only slightly more predictive.
Models of College Entry and Predicted Entry Rates
Table 2 presents three logit models for high school seniors that predict entry
into a four-year college within six months of high school graduation. All
Table 2. Logit Models for College Entry Among High School Graduates
Model 1 Model 2 Model 3
Constant 0.162 (0.043) –0.236 (0.047) –0.246 (0.048)Class
Intermediate –0.545 (0.058) –0.190 (0.069) –0.187 (0.072)Working –1.081 (0.060) –0.558 (0.067) –0.543 (0.067)
Performance 1.235 (0.038) 1.266 (0.050)3 Intermediate 0.030 (0.085)3 Working –0.142 (0.080)
Wald x2 336.7 1,170.0 1,206.0N 11,400 11,400 11,400
Source: See note to Table 1.
Standard errors in parentheses.
24 Sociological Methods & Research 41(1)

three logit models are weighted by the estimated inverse probability of being
in the analysis sample, multiplied by the panel weight developed by the data
distributors.9
Model 1 is a null model presented to demonstrate that baseline associa-
tions between class and college entry are substantial. The magnitude of
these effects was already presented in the final column of Table 1. As shown
there, the college entry rates are 54.1, 40.6, and 28.5 percent for the salariat,
intermediate, and working classes, respectively. The coefficients of Model 1
demonstrate that, when parameterized in a logit model, the lower observed
rates for the intermediate and working classes are not only substantially dif-
ferent but also highly statistically significant because the coefficients are
high multiples of their standard errors. When performance is added for
Model 2, net class differences decline. When interactions between perfor-
mance and class are included for Model 3, the fit improves slightly. The
association between performance and college entry may be slightly weaker
for the working class, but this difference is just within conventional levels
of expected sampling error.
Either Model 2 or Model 3 could be considered a viable representation of
primary and secondary effects in this tradition of analysis since each model
estimates net class effects that persist after an adjustment for performance.
The recent literature on primary and secondary effects has established the
more highly parameterized Model 3 as the standard model.
Predicted probabilities from Models 2 and 3 are presented in the two
panels of Table 3. The nine cells of each panel give the estimated probability
for each of the three classes that would prevail if the class kept its own per-
formance distribution but transitioned through the estimated college entry
regime for each of the three classes.
The diagonals of each of the panels are the same, as they report simple
unconditional probabilities of college entry, which are .541, .406, and .285
for the salariat, intermediate, and working classes, respectively. These are
simply the predicted entry rates for each of the three classes if they moved
through their own observed college entry regime.
The values off the diagonals of each panel are what-if college entry rates,
labeled ‘‘counterfactual transition rates’’ in the primary and secondary
effects literature (see Jackson et al. 2007, Table 5; also see Erikson and
Rudolphi 2010, Table 2, for corresponding ‘‘counterfactual log odds’’).
Because the results are very similar for Models 2 and 3 from Table 2, con-
sider only the second panel of Table 3, which is based on the standard
model of primary and secondary effects. The value of .423 in the upper-
right-hand cell of the table is the estimated probability that the salariat
Morgan 25

would enter college, assuming that the salariat retained its performance dis-
tribution but moved through the college entry regime of the working class.
Rather than moving through a logit model with an index function of
�:246 + (1:266) Performance as its argument, the salariat moves through a
logit model with an index function of (� :246� :543) + (1:266� :142)
Performance as its argument. Thus, the observed college entry rate of 54.1
percent on the diagonal is reduced in this counterfactual scenario to 42.3
percent. Similar comparisons reveal a strict ordering of transition rates, as
determined by the distribution of performance and the estimated logit para-
meters. Higher classes have lower college entry rates when they pass
through the college entry regimes of lower classes, and vice versa.
From College Entry Models to Estimates of Primary and SecondaryEffects
Where are the primary and secondary effects in Table 3? This section pre-
sents two ways of converting the predicted probabilities in Table 3 into esti-
mates of causal primary and secondary effects: probability-based estimates
and odds-based estimates.
Probability-based estimates. Six secondary effects exist for counterfactual
movement in both directions between the three classes. For the comparison
of the salariat to the working class, there are two contrasts
Table 3. College Entry Rates by Class Origins, Estimated From the Models inTable 2 That Adjust for Prior Performance in the Senior Year of High School
Model 2 (from Table 2): What-if class transition probability
Salariat Intermediate Working
Salariat 0.541 (0.011) 0.504 (0.014) 0.433 (0.013)Intermediate 0.441 (0.012) 0.406 (0.014) 0.340 (0.013)Working 0.382 (0.011) 0.348 (0.013) 0.285 (0.011)
Model 3 (from Table 2): What-if class transition probability
Salariat Intermediate Working
Salariat 0.541 (0.011) 0.507 (0.015) 0.423 (0.014)Intermediate 0.439 (0.012) 0.406 (0.014) 0.336 (0.013)Working 0.380 (0.011) 0.346 (0.013) 0.285 (0.011)
Source: See note to Table 1.
See note to Table 2.
26 Sociological Methods & Research 41(1)

SES to W [X
p
fE½GjW = 1, P� � E½GjS = 1, P�g Pr½PjS = 1�, ð2Þ
SEW to S[X
p
fE½GjS = 1, P� � E½GjW = 1, P�g Pr½PjW = 1�: ð3Þ
where the summation is over the countable set of values p that performance,
P, can take on. For the comparison of the salariat to the intermediate class,
there are two analogous contrasts:
SES to I [X
p
fE½GjI = 1, P� � E½GjS = 1, P�g Pr½PjS = 1�, ð4Þ
SEI to S[X
p
fE½GjS = 1, P� � E½GjI = 1, P�g Pr½PjI = 1�: ð5Þ
For the comparison of the intermediate class to the working class, there are
two final contrasts:
SEI to W [X
p
fE½GjW = 1, P� � E½GjI = 1, P�g Pr½PjI = 1�, ð6Þ
SEW to I [X
p
fE½GjI = 1, P� � E½GjW = 1, P�g Pr½PjW = 1�: ð7Þ
Accordingly, point estimates of these six effects can be calculated
directly from the cells in Table 3. For the standard model in the second
panel, the secondary effects are as follows:
SES to W = :423� :541 = � :118,
SEW to S = :380� :285 = :095,
SES to I = :507� :541 = � :034, ð8Þ
SEI to S = :439� :406 = :033,
SEI to W = :336� :406 = � :070,
SEW to I = :346� :285 = :061:
Notice the patterned directionality of the effects, which is determined by the
structure of the definitions and the parameter estimates from the underlying
logit model. Counterfactual downward moves generate negative effects on
Morgan 27

college entry, and counterfactual upward moves generate positive effects on
college entry. For example, SES to W = � :118, but SEW to S = :095. These
shifts are interpretable in clear substantive terms, if they are regarded as
causal effects. For example, they suggest that 11.8 percent of the salariat
that entered college would not have chosen to enter college if they instead
had the choice-based secondary effect that applied to the working class.
Given the scale of typical effects in college entry research, 11.8 percent of
students in one class and 9.5 percent of students in another class would rep-
resent large purported effects of choice.
Primary effects are then defined as the portion of the total class differen-
tial that is not attributed to the secondary effect,
PES to W [½E(GjW = 1)� E(GjS = 1)� � SES to W ,
PEW to S[½E(GjS = 1)� E(GjW = 1)� � SEW to S ,
PES to I [½E(GjI = 1)� E(GjS = 1)� � SES to I , ð9Þ
PEI to S[½E(GjS = 1)� E(GjS = 1)� � SEI to S ,
PEI to W [½E(GjW = 1)� E(GjI = 1)� � SEI to W ,
PEW to I [½E(GjI = 1)� E(GjW = 1)� � SEW to I ,
where the differences in brackets in each definition are direction-defined
total class differentials. For the standard model in the second panel of Table
3, the primary effects would then be,
PES to W = ½:285� :541� � (� :118) = � :138,
PEW to S = ½:541� :285� � :095 = :161,
PES to I = ½:406� :541� � �:034ð Þ= � :101, ð10Þ
PEI to S = ½:541� :406� � :033 = :102,
PEI to W = ½:285� :406� � (� :070) = � :051,
PEW to I = ½:406� :285� � :061 = :060,
where the differences in brackets are total class differentials extracted from
the diagonal of the panel and the values of the secondary effects are taken
from equation (8).
28 Sociological Methods & Research 41(1)

Under these definitions of primary and secondary effects, the model
allows for six class-referenced comparisons of the relative sizes of primary
and secondary. For example, the observed total class differential for upward
movement from the working class to the salariat is .256, which can be
decomposed into a primary effect of .161 and a secondary effect of .095. In
the opposite direction, the total class differential is –.256, which can be
decomposed into a primary effect of –.138 and a secondary effect of –.118.
Thus, each pairwise class comparison is decomposable in two ways, depend-
ing on the direction of the estimate of the secondary effect.
The extant literature on these effects does not discuss why these two
decompositions differ. The reason should be clear from the definitions in
equations (2) through (7). The secondary effect estimates are averages of
individual-level effects over the performance distribution in the class from
which counterfactual movement originates. Because the existence of pri-
mary effects generates class differences in performance, the direction of the
calculation of the secondary effects will generate differences in the magni-
tudes of estimated secondary effects.
Odds-based estimates. Before carrying on to analyze the weaknesses of
the underlying model that generates these estimates, it is necessary to con-
sider how primary and secondary effects are defined and calculated in the
work of Erikson et al. (2005), Jackson et al. (2007), and others following
their lead. Although not too dissimilar from what has just been introduced,
there are differences of note that result from (a) shifting away from prob-
ability differences to log odds ratios and (b) averaging further to produce
combined estimates of primary and secondary effects that ignore the direc-
tion of counterfactual movement.
To make the differences clear, consider an equivalent demonstration of
the calculations for movements between the salariat and the working class
(again based on Model 3, using the four probabilities in the corners of the
second panel of Table 3: .541, .423, .380, and .285). The relevant four steps,
as outlined most clearly in Jackson et al. (2007), are the following:
1. Convert the predicted probabilities to odds:
Observed odds for salariat ::541
1� :541= 1:179,
Odds for salariat if working::423
1� :423= :733,
Morgan 29

Odds for working if salariat ::380
1� :380= :613,
Observed odds for working::285
1� :285= :399:
2. Calculate three log odds ratios:
Observed log odds ratio for salariat vs: working: ln1:179
:399
� �= 1:083,
What�if log odds ratio for salariat : ln1:179
:733
� �= :475,
What�if log odds ratio for working: ln:613
:399
� �= :429,
where the order of division for the what-if log odds ratios is chosen
to result in positive log odds ratios only.
3. Calculate the relative importance of primary and secondary effects
as two ratios of the log odds ratios calculated in the last step:
Relative importance for salariat to working::475
1:083= :439, ð11Þ
Relative importance for working to salariat ::429
1:083= :396: ð12Þ
4. Take the average of these two relative importance measures:
:439 + :396
2= :418: ð13Þ
The secondary effect of class origins in a comparison of the salariat to the
working class is then equal to 41.8 percent of the total class differential in the
log odds ratio. That which is left over, in this case 58.2 percent, is the primary
effect. Following this procedure for all comparisons of classes would result in
30 Sociological Methods & Research 41(1)

three measures of average relative importance (by equation (13)), which them-
selves would be averaged versions of six underlying relative importance mea-
sures calculated from log odds ratios (as in equations (11) and (12)).
Notice that, in Step 4, two nominal relative importance measures are
averaged together in pursuit of a single number summary for the whole
class comparison. The difference in the sizes of the two measures of relative
importance in equations (11) and (12) receives no attention, even though
the differences are produced by genuine individual-level heterogeneity that
is then averaged across alternative distributions of performance that exist in
the two reference classes.
Should probability-based effects be preferred?. In comparison to the odds-
ratio-based measures of primary and secondary effects, the probability-
based primary and secondary effects (equations (2) through (7) as well as
equation (9)) have an advantage of transparency. The causal effects are
defined as differences in probabilities, and the direction of counterfactual
movement is clearly denoted by sign. Probability differences are more natu-
ral than odds ratios when rates of entry are being calculated, as is commonly
the case for models of college entry in the United States. Probabilities have
clear frequency interpretations, which allow for straightforward interpreta-
tions as expected shifts in portions of the relevant subpopulation. The
probability-based effects also make clear that secondary effects are averages
of individual-level effects that are weighted by the distribution of perfor-
mance in the class from which counterfactual movement originates.
The odds-ratio-based effects have one clear advantage. They can be
brought more easily into dialogue with classic results from social mobility
studies, where odds ratios are often decomposed in intergenerational models
of class entry. Other advantages may exist, but these have not been fully
articulated by the developers of these methods.
On balance, a case can be made that the probability-based effects should
be preferred, at least for college entry in the United States. For this reason,
probability-based effects are offered in more detail in this article.
Causal Identification of the Standard Model
Beyond the choices of the measure for class and log-odds representations of
counterfactual rates, there are more fundamental challenges to these methods
if the estimated effects are meant to be imbued with causal interpretations
that yield policy implications (as they have been in the past). As mentioned
earlier, these challenges may be more acute when the methods are applied to
educational transitions in the United States.
Morgan 31

Return to Figure 1b and the Assumptions 1 through 4 that justify it as a
causal model of primary and secondary effects. Is there any support for the
Assumptions 2, 3, and 4 that stipulate that the primary and secondary effects
can be isolated from each other and that confounding common causes do not
exist?
First, consider Assumption 2, which states that P and U are independent
conditional on Class. The recent literature on primary and secondary effects
has challenged this assumption. Erikson et al. (2005:9733) recognized that
the causal interpretations of their results rest on the tenability of the ‘‘impli-
cit potentially causal model’’ that is depicted in this article as Figure 1a.
They then noted that a ‘‘more realistic model has an unobserved compo-
nent, early choice,’’ and they then offered a causal graph, for discussion,
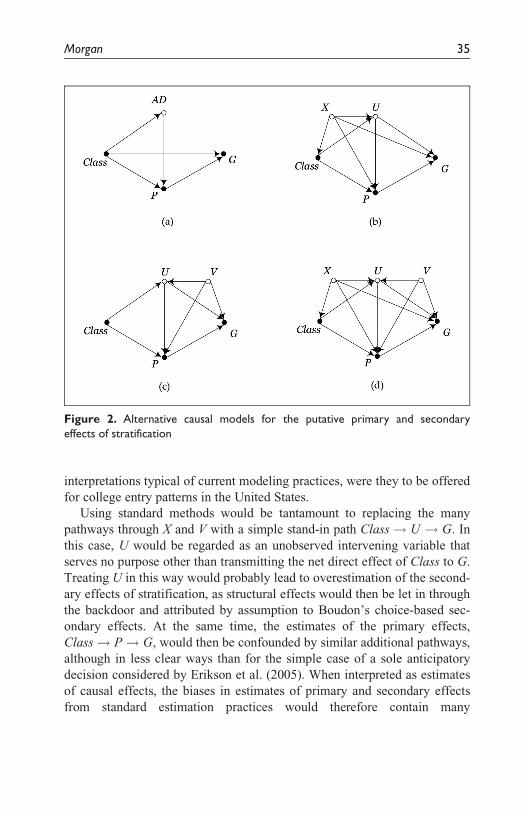
that is similar to what is presented in Figure 2a in this article.
This augmented causal graph in Figure 2a includes a third path,
Class! AD! P! G. For Erikson et al. (2005), AD is an unobserved
anticipatory decision to go on to the next level of education, but one that is
taken some years prior to the actual educational transition. As a result, the
anticipatory decision structures P in the run up to the educational transition,
which they note will lead to an underestimate of the secondary effect
(Class! G) if the anticipatory decision is unobserved. Their point,
expressed with Figure 2a, is that the secondary effect of stratification now
operates through two causal pathways, Class! G and
Class! AD! P! G. If AD is unobserved, then the pathway
Class! AD! P! G is absorbed into Class! P! G. The effect of
Class on P via AD is then implicitly attributed to the direct effect of Class
on P, which shifts some of the true secondary effect to the estimated pri-
mary effect. As a consequence, by their reasoning, the estimate of the sec-
ondary effect is downwardly biased and the estimate of the primary effect is
upwardly biased. Jackson et al. (2007) and Erikson and Rudolphi (2010)
offer similar interpretations.
This conclusion is not necessarily incorrect, but it is certainly sanguine.
Based on the literature on college entry in the United States, I would argue
instead that the causal graph in Figure 2a is too simple as well.10 I would
include exogenous variables that determine Class, U , and G and then also
allow the intermediate unobserved variable U to be more inclusive than just
an anticipatory decision or an unobserved choice-based mechanism.
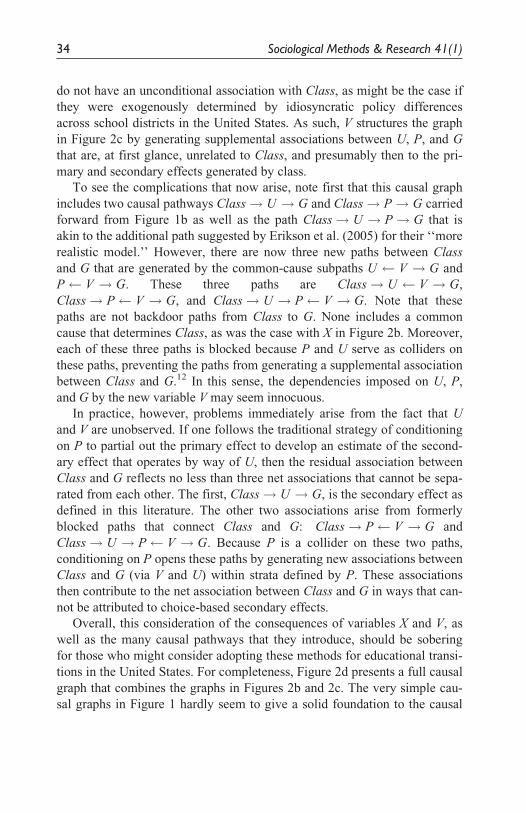
Accordingly, consider the more general causal graph presented in Figure
2b, which is an elaboration of the causal graph in Figure 1b after
Assumptions 2 and 3 are abandoned in relation to Class and U. In addition
to the two causal pathways Class! U ! G and Class! P! G carried
32 Sociological Methods & Research 41(1)
forward from Figure 1b, the causal graph in Figure 2b now includes
additional paths through the variables U and X. The first,
Class! U ! P! G, is analogous to the path Class! AD! P! G
proposed by Erikson et al. (2005). Five additional backdoor paths from
Class to G also have arisen: Class X ! G, Class X ! P! G,
Class X ! U ! G, Class X ! U ! P! G, and Class X !P U ! G. These five backdoor paths through X generate supplemental
dependence among Class, U, and G.11
Consider some of the variables that the literature suggests belong in the
background cause X in relation to some of the variables presumed to belong
in U. It is often argued that, for many educational transitions in many con-
texts, race serves as a variable in X while perceptions about the opportunity
structure serve as a variable in U. Accordingly, race would be a common
cause of both Class and beliefs about the opportunity structure that are now
embedded in U. The backdoor paths Class X ! U ! G and
Class X ! U ! P! G then follow from the positions in the literature
that perceptions of the opportunity structure, now in U, determine G directly
and also determine G indirectly via prior preparation P. Furthermore, the
backdoor path Class X ! P! G is supported by the literature that
argues for racial bias in performance evaluations, whether generated by tests
of dubious quality or by teachers with biased expectations.
Although race is perhaps the most obvious variable to include in X, at
least for educational transitions in the United States, other variables that sig-
nify categorical distinctions may also belong in X, such as place of residence
in contexts where neighborhood disadvantage leads to forms of social isola-
tion. Moreover, these variables in X then entail mechanistic structural vari-
ables in U that carry their causes on to college entry. These new variables in
U would include institutional features of schooling, such as between-school
differences in instructional quality and within-school curriculum differentia-
tion. These variables in U then must have effects on both prior performance,
P, as well as direct effects on college entry, G. Such causal pathways cannot
be considered mechanistic elaborations of Boudon’s choice-theoretic con-
ception of the secondary effects of stratification. They are instead a separate
component of the net association between class and college entry that is best
attributed to a broad structural interpretation.
Now consider the even more subtle consequences of abandoning
Assumption 4, as is the case for the causal graph presented in Figure 2c that
includes backdoor paths from U and P to G through a new set of variables
in V. For context, suppose that V includes a set of institutional features of
schooling, such as between-school differences in instructional quality, that
Morgan 33
do not have an unconditional association with Class, as might be the case if
they were exogenously determined by idiosyncratic policy differences
across school districts in the United States. As such, V structures the graph
in Figure 2c by generating supplemental associations between U, P, and G
that are, at first glance, unrelated to Class, and presumably then to the pri-
mary and secondary effects generated by class.
To see the complications that now arise, note first that this causal graph
includes two causal pathways Class! U ! G and Class! P! G carried
forward from Figure 1b as well as the path Class! U ! P! G that is
akin to the additional path suggested by Erikson et al. (2005) for their ‘‘more
realistic model.’’ However, there are now three new paths between Class
and G that are generated by the common-cause subpaths U V ! G and
P V ! G. These three paths are Class! U V ! G,
Class! P V ! G, and Class! U ! P V ! G. Note that these
paths are not backdoor paths from Class to G. None includes a common
cause that determines Class, as was the case with X in Figure 2b. Moreover,
each of these three paths is blocked because P and U serve as colliders on
these paths, preventing the paths from generating a supplemental association
between Class and G.12 In this sense, the dependencies imposed on U, P,
and G by the new variable V may seem innocuous.
In practice, however, problems immediately arise from the fact that U
and V are unobserved. If one follows the traditional strategy of conditioning
on P to partial out the primary effect to develop an estimate of the second-
ary effect that operates by way of U, then the residual association between
Class and G reflects no less than three net associations that cannot be sepa-
rated from each other. The first, Class! U ! G, is the secondary effect as
defined in this literature. The other two associations arise from formerly
blocked paths that connect Class and G: Class! P V ! G and
Class! U ! P V ! G. Because P is a collider on these two paths,
conditioning on P opens these paths by generating new associations between
Class and G (via V and U) within strata defined by P. These associations
then contribute to the net association between Class and G in ways that can-
not be attributed to choice-based secondary effects.
Overall, this consideration of the consequences of variables X and V, as
well as the many causal pathways that they introduce, should be sobering
for those who might consider adopting these methods for educational transi-
tions in the United States. For completeness, Figure 2d presents a full causal
graph that combines the graphs in Figures 2b and 2c. The very simple cau-
sal graphs in Figure 1 hardly seem to give a solid foundation to the causal
34 Sociological Methods & Research 41(1)
interpretations typical of current modeling practices, were they to be offered
for college entry patterns in the United States.
Using standard methods would be tantamount to replacing the many
pathways through X and V with a simple stand-in path Class! U ! G. In
this case, U would be regarded as an unobserved intervening variable that
serves no purpose other than transmitting the net direct effect of Class to G.
Treating U in this way would probably lead to overestimation of the second-
ary effects of stratification, as structural effects would then be let in through
the backdoor and attributed by assumption to Boudon’s choice-based sec-
ondary effects. At the same time, the estimates of the primary effects,
Class! P! G, would then be confounded by similar additional pathways,
although in less clear ways than for the simple case of a sole anticipatory
decision considered by Erikson et al. (2005). When interpreted as estimates
of causal effects, the biases in estimates of primary and secondary effects
from standard estimation practices would therefore contain many
Figure 2. Alternative causal models for the putative primary and secondaryeffects of stratification
Morgan 35
countervailing sources, making a priori claims about the direction of total
bias impossible.
A Simpler Associational Model
When one steps back from strong causal interpretations, a natural question
arises: Should an even simpler descriptive approach to estimation and inter-
pretation be embraced? Two points support this position. First, class-
referenced differences based on Table 3 invite unwarranted causal interpre-
tations from readers, both because of the influence of past analyses and
because the differences are ineluctably tied to particular observed individu-
als in particular classes. Efforts to avoid ‘‘what-if’’ counterfactual language
when considering such differences are unnatural, and such language is used
throughout Erikson et al. (2005), Jackson et al. (2007), Erikson and
Rudolphi (2010), and other articles following in this tradition. Second, the
differences estimated (e.g., in equations (8) and (10)) cannot be easily
mapped back to classes themselves, instead only in pairs for directional
movement between classes. When more than three classes are considered,
the interpretive advantage of having a smaller number of class-specific
descriptive parameters grows.13
From Marginal Means to Associational Effects
A simpler associational analysis strategy is presented in Table 4. For three
separate models, the table reports marginal means, which are the mean col-
lege entry rates for the full sample as if the full sample transitioned through
the college entry regime of a particular class, under the specification of a
particular model. In this subsection, I interpret only the models that are
labeled the ‘‘null model’’ and the ‘‘standard model.’’
Consider first the null model of college entry where the sole predictors
in the logit are two dummy variables for class (i.e., Model 1 from Table 2).
The marginal mean entry rate is the predicted college entry rate for each
class implied by the model if all members of the sample were in that class.
Since the model includes no additional information beyond class, the mar-
ginal mean entry rates are equal to the observed college entry rates for the
three classes.
Now consider the standard model of college entry for classes, where the
standardized measure of performance in the senior year of high school and
its interactions with class are added to the null model (which is then Model
3 from Table 2). For this model, the marginal means are calculated in the
36 Sociological Methods & Research 41(1)

same way as for the null model, but now the model incorporates the perfor-
mance characteristics of all individuals as well as the class-specific relation-
ship between performance and college entry. Accordingly, the marginal
mean for each class is the predicted college entry rate of all individuals in
the sample if they kept their performance levels but transitioned through the
relevant college-entry regime of the referenced class.
Associational primary effects can be calculated using the marginal means
from the null and standard models. For the salariat, the marginal mean for
college entry under the standard model is .476.14 Rather than 54.1 percent
of salariat entering college, as in the null model, the standard model predicts
that only 47.6 percent of the salariat would enter college if the salariat had
the performance distribution of the full sample rather than its own observed
performance distribution. The difference between these two numbers is
therefore a meaningful measure of an associational primary effect because
it reflects the difference in the college entry rate that can be attributed to the
particular performance distribution acquired by the class. Under this logic,
class-specific associational primary effects can be calculated by subtracting
marginal means of the standard model from the marginal means of the null
model:
Associational PES = :541� :476 = :065,
Associational PEI = :406� :442 = � :036, ð14Þ
Associational PEW = :285� :367 = � :082:
Associational secondary effects can then be formed by taking differences
between the marginal means from the standard model, since the remaining
class differences reflect net direct associations with class after the model
adjusts for performance differences. Associational secondary effects for
class comparisons are then,
Associational SES to W = :367� :476 = � :109,
Associational SEW to S = :476� :367 = :109,
Associational SES to I = :442� :476 = � :034, ð15Þ
Associational SEI to S = :479� :442 = :034,
Associational SEI to W = :367� :442 = � :075,
Associational SEW to I = :442� :367 = :075:
Morgan 37

Tab
le4.
Pre
dic
ted
Mar
ginal
Mea
ns
for
Colle
geEntr
yby
Cla
ssO
rigi
ns
Null
model
(Model
1fr
om
Table
2)
Stan
dar
dm
odel
(Model
3fr
om
Table
2)
Augm
ente
dm
odel
:St
andar
dm
odel
+ex
pec
tations,
imm
edia
tepla
ns,
and
sign
ifica
nt
oth
ers’
influ
ence
Mar
ginal
mea
nen
try
rate
Mar
ginal
mea
nen
try
rate
Mar
ginal
mea
nen
try
rate
Sala
riat
0.5
41
(0.0
11)
0.4
76
(0.0
10)
0.4
55
(0.0
10)
Inte
rmed
iate
0.4
06
(0.0
14)
0.4
42
(0.0
14)
0.4
45
(0.0
12)
Work
ing
0.2
85
(0.0
11)
0.3
67
(0.0
12)
0.4
03
(0.0
12)
Sourc
e:Se
enote
toTa
ble
1.
N=
11,4
00fo
ral
lm
odel
s.St
andar
der
rors
inpar
enth
eses
.
38
Tab
le5.
Mea
ns
and
Stan
dar
dD
evia
tions
ofA
dditio
nal
Var
iable
sU
tiliz
edfo
rth
eA
ugm
ente
dM
odel
Sala
riat
clas
sIn
term
edia
tecl
ass
Work
ing
clas
sFu
llsa
mple
MSD
MSD
MSD
MSD
Added
for
‘‘augm
ente
dm
odel
’’Educa
tional
expec
tations
(yea
rs)
16.8
231.9
68
16.2
34
2.0
94
15.8
96
2.1
67
16.4
48
2.0
91
Imm
edia
tepla
ns
(ref
:N
ofu
rther
schoolin
g)G
oto
four-
year
colle
ge0.7
40
0.6
38
0.5
50
0.6
67
Go
totw
o-y
ear
colle
ge0.2
03
0.2
59
0.3
13
0.2
45
Moth
er’s
expec
tations
(yea
rs)
16.7
652.0
88
16.3
24
2.3
31
16.0
05
2.4
76
16.4
65
2.2
75
Fath
er’s
expec
tations
(yea
rs)
16.7
342.1
64
16.3
46
2.2
99
15.8
67
2.4
48
16.4
15
2.3
03
Sign
ifica
nt
oth
ers’
influ
ence
0.7
46
0.3
19
0.7
06
0.3
27
0.6
38
0.3
64
0.7
08
0.3
37
Sour
ce:S
eenote
toTa
ble
1.
N=
11,4
00.A
modes
tam
ount
ofdat
aw
ere
impu
ted
with
bes
tsu
bse
tre
gres
sion
met
hods.
39

The symmetry across pairs of these associational secondary effects is
generated by the method of calculating marginal means, where the entire
sample is moved through each of the three class-specific college entry
regimes. All of the underlying individual-level associations are averaged over
the full distribution of performance, not the class-specific distributions of per-
formance for the differences presented earlier in equations (2) through (7). As
a result, the associational secondary effects for class comparisons differ only
in sign within pairs, and these signs indicate only the direction of movement.
Differences between pairs are attributable solely to the class-specific index
functions implied by the estimated coefficients of the logit model.
Finally, if one wishes to then have class-specific associational secondary
effects, which can be compared to class-specific primary effects, then these
can be formed by taking the difference between the marginal mean for each
class from the standard model and appropriately chosen reference values for
each class. In descriptive analysis, where the goal is simply to summarize
the data in an efficient and organized way, alternative types of reference
values could be chosen. I would argue that it makes sense to favor one more
than others: class-sized-weighted averages of the marginal means of the
other classes, as in,
Associational SES = :476� :197
:197 + :300
� �(:442) +
:300
:197 + :300
� �(:367)
� �
= :476� :397 = :079,
Associational SEI = :442� :503
:503 + :300
� �(:476) +
:300
:503 + :300
� �(:367)
� �
= :442� :435 = :007,
Associational SEW = :367� :503
:503 + :197
� �(:476) +
:197
:197 + :503
� �(:442)
� �
= :367� :466 = � :099: ð16Þ
where, as shown in Table 1, .503, .197, and .300 are the probability masses
associated with the relative sizes of the three classes. With these chosen ref-
erence values, the associational secondary effect of a class is then the pre-
dicted probability of college entry if all members of the sample were in that
class minus the predicted probability of college entry if no member of the
40 Sociological Methods & Research 41(1)
sample were in that class but instead were in the alternative classes in pro-
portion to the observed sizes of those alternative classes.
A benefit of having class-specific primary and secondary effects, as in
equations (14) and (16), is that relative sizes of these effects can then be
constructed. For the salariat, the associational primary effect is about the
same size as the associational secondary effect, at .065 and .079, respec-
tively. For the intermediate class, the associational primary effect is smaller
and negative at –.036, and the associational secondary effect is close to 0 at
.007. For the working class, the associational primary effect and the associa-
tional secondary effects are both relatively large and negative, at –.082 and
–.099, respectively. In combination, the associational primary and second-
ary effects of the working class are more negative than the combined effects
are positive for the salariat.
Of course, offering interpretations labeled associational primary and sec-
ondary effects is itself awkward and unnatural. This will be a legacy of this
research tradition as long as the word effect continues to be used in a general
way. Semantic clarity would be well served by using the word effect only
for contrasts that have a strong causal warrant, but it is perhaps too late for
this particular set of models.
Toward Causal Models of Primary and SecondaryEffects
Having laid out a simple method for estimating associational primary and
secondary effects in the last section, this section has two goals. First, a
demonstration is offered on how to use standard conditioning techniques to
attempt to develop more credible estimates of causal primary and secondary
effects in the United States. The chief constraints on this strategy, as is
shown, are the dearth of data on students’ choice behavior as well as the
additional assumptions that must be introduced (and which are unlikely to
be regarded as uncontroversial by researchers with opposing theoretical
orientations). Second, an explanation is offered for why research on primary
and secondary effects will be especially valuable when patterns of underly-
ing heterogeneity can be effectively analyzed. These patterns are central to
an understanding of the consequences of hypothetical interventions on the
cost of higher education, which has been of particular interest in both the
primary and secondary effects literature in Europe and in the college entry
literature in the United States.
Morgan 41

Evaluating Alternative Strategies for Causal Identification
The causal identification issues discussed earlier are challenging, but they
are not fundamentally insurmountable. The first step to address them is to
understand the predictive power of other variables that fall along the causal
pathways that emanate from social class. This is part and parcel of an
attempt to understand whether backdoor associations that confound esti-
mates of genuine choice-based secondary effects can be partialed out of the
analysis.
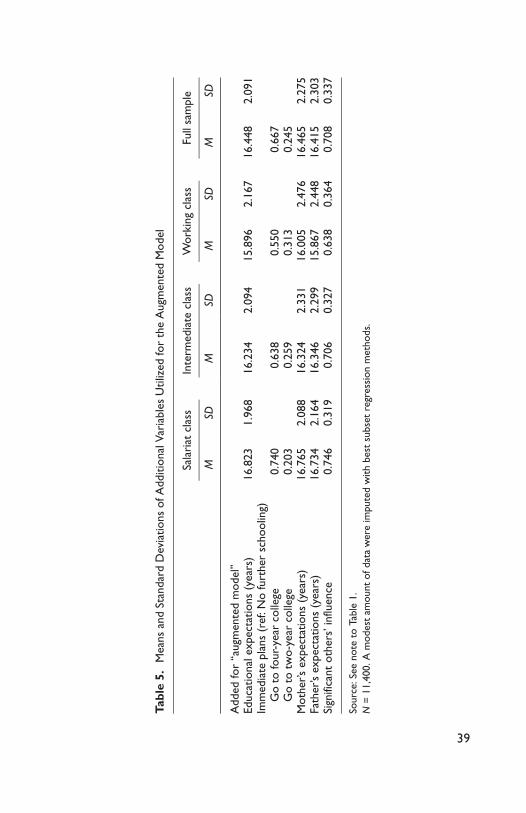
The final column of Table 4 presents additional marginal means based
on a logit model that includes additional predictors alongside and interacted
with class. For this augmented model, six additional variables are added to
the standard model, resulting in a logit model for college entry predicted
from performance, educational expectations, immediate plans, and signifi-
cant others’ influence. As summarized in Table 5, the three educational
expectations variables are for high school seniors’ own expected years of
education as well as the expectations maintained for them by their mothers
and fathers. The two immediate plans variables signify whether seniors
expect to attend either a four-year college or a two-year college immedi-
ately following high school (in comparison to either a vocational school or
no further education). The significant others’ influence variable is a compo-
site of whether a respondent reports, as of the senior year, that his or her
parents, peers, and teachers expect that the respondent will go to college
after high school. All six variables are standard predictors of college entry
in sociology from the status attainment tradition (see Sewell, Haller, and
Portes 1969 and citations to it).
For the augmented model, class differences in the marginal means
decline substantially, with, for example, the marginal mean for the salariat
decreasing from .476 to .455, while the marginal mean for the working class
increases from .376 to .403. How should one interpret the narrowing of
these marginal means? Does the augmented model suggest that one can pur-
sue estimation of causal secondary effects after conditioning on these addi-
tional variables? One could certainly substitute the marginal means for the
augmented model for those derived from the standard model into the same
difference-based estimators of associational primary and secondary effects
in equations (14) through (16). Associational interpretations can then be
offered.
But can one go further to (a) generate predicted values for counterfactual
movement, as in Table 3, and then (b) offer causal primary and secondary
42 Sociological Methods & Research 41(1)

effects by recalculating primary and secondary effects with analogous esti-
mators to those used in equations (8) and (10) for the standard model?
The answer to this question requires taking a position on the location of
the variables for expectations, immediate plans, and significant others’ influ-
ence in the causal model in Figure 2d. Because these variables are used in
empirical models derived from many alternative theoretical traditions (see
Morgan 2005), one could argue for at least two positions for models of col-
lege entry in the United States.
The most common interpretation in the sociology of education would
follow directly from the status attainment tradition. Expectations and plans
would be considered characteristics of individuals that are shaped by socia-
lization processes (measured by significant others’ influence), which then
crystallize in early adolescence and remain stable through early adulthood.
From this perspective, educational expectations, plans, and significant oth-
ers’ influence are components of U that are determined by both Class and X
(and perhaps with significant others’ influence as a mediating variable that
transmits the effects of Class and X to expectations and plans). Moreover,
because these variables are not explicit components of a choice process,
they are not the choice component of U that is thought to generate the cau-
sal secondary effects suggested by Boudon.
Under this interpretation of where the additional variables belong in the
causal graph, one could then reestimate the predicted probabilities in Table
3 and then assert that resulting causal secondary effects akin to those defined
in equations (2) through (7) are closer to the true causal secondary effects
than those offered in equation (8). One could then calculate estimates of
refined causal primary effects, as in equations (9) and (10). At a minimum,
the resulting causal secondary effects could then be regarded as upper-bound
estimates of the true secondary effects, since there may still be some addi-
tional backdoor confounding produced by other causal pathways through X
and U (and perhaps as induced through V when conditioning on P).
A permissible alternative interpretation would suggest that this conclu-
sion is mistaken because expectations, plans, and significant others’ influ-
ence should be considered indicators of the anticipatory decision that
Erikson et al. (2005) argue may be an essential component of secondary
effects. By conditioning out these effects, the augmented model artificially
biases the secondary effect estimates toward zero. Under this second inter-
pretation, the prior secondary effect estimates presented earlier in equation
(8) based on Table 2 would be preferred, and might even be regarded as
lower-bound estimates for the reasons stated earlier in the discussion of
Figure 2a.15
Morgan 43

The lesson that is suggested by these results is therefore quite sobering for
the prospects of standard conditioning strategies: It is unlikely that efforts to
model backdoor paths with existing national data in the United States (or per-
haps in any country) will deliver clear identification of net direct effects that
can then be imbued with choice-based causal interpretations. For most data
with which these models have been estimated in the past, rich sets of adjust-
ment variables are not available at all. Even when they are available, as is the
case for the ELS data analyzed in this article, it is unclear how one should
interpret direct effects net of variables whose measurement is motivated by
other theoretical traditions. As a result, scholars are unlikely to agree that any
particular set of available conditioning variables will be effective at removing
the desired portion of the association between class and college entry for each
of the classes, leaving a net effect of class that is widely agreed can be inter-
preted as the sole product of choice.
Because the data that currently exist are ill-suited for efforts to purge
non-choice-based contamination from educational choice processes, it
would seem that a necessary step in an analysis of causal primary and sec-
ondary effects is to directly model the choice mechanism that constitutes
the genuine secondary effect of interest. If what is desired in this research
tradition is an estimate of the number of students in each class who choose
not to enter postsecondary education even though they are prepared to do
so, then research needs to shift toward models of the causal pathways that
are embedded in the implicitly assumed choice processes, as in Gabay-
Egozi, Shavit, and Yaish (2010) and Stocke (2007) for regional samples in
Israel and Germany, respectively. There is much sociology to be completed
in this effort. We still have a poor understanding of how information about
costs and benefits is differentially available and differentially utilized by
students and parents from alternative locations in the structure of social
advantage in the United States (see Dominitz and Manski 1996; Avery and
Kane 2004; Grodsky and Jones 2007).
Implied Heterogeneity
One reason to pursue causal identification within a primary and secondary
effects framework is that such identification will permit the examination of
important heterogeneity of causal effects, as discussed in this subsection.
Recall that when discussing the estimates of causal secondary effects,
based on the predicted values from Table 3 and presented in equation (8),
the magnitudes of these effects were not equal within pairs. For example,
the value for SES to W was –.118 while the value for SEW to S was .095.
44 Sociological Methods & Research 41(1)

As stated earlier, such differences are attributable to the definitions of the
estimators in equations (2) through (7), which weight individual-level effects
over class-specific distributions of performance. This explanation then begs
a question: Why should this matter?
Recall the formalization of the standard model presented earlier in equa-
tion (1). For this model, the parameter t is a fixed threshold for enrollment,
based in the choice-theoretic tradition on the relative costs and benefits of
education. Now consider a graphical depiction of this basic model for the
salariat and the working class, presented in Figure 3, that strips away the
randomness that occurs in real contexts, assumes linearity of f (:) that is pos-
itive in P and U, assumes that U varies by class by a structural constant, and
assumes that U does not vary directly with P beyond the constant class dif-
ference. In this scenario, the uppermost line in Figure 3 depicts for the salar-
iat only the expected relationship between f (P + U ) and college entry. The
parallel line just below it is the same relationship for the working class, with
the space between the two lines representing the assumed structural constant
difference in U between the two classes.
Figure 3. A simplified model of the relationships between performance (P), anunobserved variable (U), and college entry (G) for the salariat and the working class
Morgan 45

Note how students are distributed along these lines, assuming each class
has 10 students within it. Because of the primary effects, the average level
of performance P is higher for the salariat. As a result, students from the sal-
ariat are, on average, farther to the right-hand side in the figure.
Now consider college entry patterns. Students shaded black enter college
because they are above the threshold t, and students shaded gray do not
enter college because they are below the threshold t. Accordingly, 9 of the
10 students from the salariat enter college, and only 2 of the 10 students
from the working class enter college. These differences in college entry are
produced solely by class differences in both P and U.
The heart of the explanation for the lack of equality within pairs of sec-
ondary effects can be found in the interval around the threshold t, delineated
by dashed vertical gray lines. Note first that a counterfactual shift that moves
students from one class to the other class is equivalent in this simplified
model to moving the students vertically from their line to the line of the
alternative class. Under this operation, consider first the students from the
salariat to the upper right of the delineated interval. If all eight of these stu-
dents fell straight down to the line for the working class, they would still
remain above the threshold and hence still enter college. In effect, each stu-
dent would swap her or his prior value of U for the lower value of U that
characterizes working-class students with the same level of performance.
For these students, the swap would be inconsequential. Similarly, the student
in the salariat who is already to the lower-left of the delineated interval
would still not go to college if she or he fell to the working class line. Only
the sole student from the salariat who is within the delineated interval would
cross the threshold in the counterfactual scenario. Thus, applying the expres-
sion in equation (2), we have :8� :9 = � :1 for SES to W .
An equivalent set of counterfactual moves from the working class line to
the salariat line would result in three students crossing the threshold for col-
lege entry. The two students to the upper right of the interval would still
enter college after shifting to the salariat line, and the five students to the
lower left of the interval would still not enter college after an equivalent
shift. However, each of the three students within the interval would cross the
threshold when moving to the salariat. Thus, applying the expression in
equation (3), we have :5� :2 = :3 for SEW to S . Overall, for this simple exam-
ple, SES to W does not equal SEW to S , as was suggested in the discussion ear-
lier of equations (2) and (3).
Now consider what would happen if, under the same exact scenario, t
increased as in Figure 4. Fewer student would enter college, and the relative
magnitude of SES to W and SEW to S would flip signs. The value for SES to W
46 Sociological Methods & Research 41(1)

would be :2� :8 = � :6, while SEW to S would be :2� :1 = :1: The result
would be SES to W + SEW to S = � :5, not :2 as for Figure 3.
As Figures 3 and 4 suggest, one could build a general model for how
these patterns of heterogeneity would unfold under alternative fixed thresh-
olds and under alternative specific functions for f (:) in f (P, U ). Such a
model will not be pursued here because the goal of this section is more
modest. I only wish to make two simple points. First, if primary effects
exist, then the distribution of P will vary by class. This alone will ensure
that different proportions of the classes will almost always fall on either side
of the threshold that determines who moves on to the next higher level of
education (i.e., except for a single threshold value, unlikely ever to obtain,
that would perfectly balance the asymmetry conditional on U). Second,
because primary effects will necessarily generate such an asymmetry, direc-
tional shifts will not generally be equal in expectation.
These asymmetries are meaningful and highly relevant if, as recent scho-
larship on primary and secondary effects has contended, this scholarship is
meant to be relevant to the evaluation of policies that promote access to
Figure 4. The same model as in Figure 3 but with a higher threshold for collegeentry
Morgan 47

higher education. Policy interventions that shift values for U will have dif-
ferential effects for different classes, and these are the expected effects of
informational changes that were advocated by Jackson et al. (2007) and
Erikson and Rudolphi (2010) in Great Britain and Sweden, respectively.
Likewise, shifts in the costs of higher education, which is another common
policy proposal, would shift t downward, inducing more students to enter
college, but differentially so for different classes depending on the propor-
tions of the classes in the interval across which the threshold traverses. All
of these effects will vary with the strength of primary effects that structure
P differentially for classes. To the extent that primary effects are powerful,
classes will approach the college entry decision from very different profiles
of observed characteristics, and the expected effects of interventions will
then vary accordingly.
Overall, the current literature on causal primary and secondary effects
does not attempt to account for these heterogeneous effects, even though the
framework is ideally suited for pursuing their estimation. This is an area of
as-yet-unfulfilled promise for these models, and it will be greatly aided if
causal identification of the secondary effects can be achieved, as outlined in
the prior subsection.
Conclusion
Boudon’s model of primary and secondary effects of stratification on educa-
tional transitions is a promising conceptual framework for separating the
effects of students’ own choices from the standard baseline family back-
ground and preparation effects that are known to also determine patterns of
educational attainment in the United States. This article has demonstrated
that the empirical methods that have been used recently in the sociology of
education to examine educational transitions in many European societies,
and which are inspired by Boudon’s distinction, do not yield sufficiently
strong conclusions about the sizes of these causal effects in the United
States, and perhaps elsewhere. Instead, the models yield contrasts that can
be misleading because they invite unwarranted causal interpretations.
As an alternative, this article proposes a simple model of associational
analysis that is less prone to unwarranted causal interpretation and also
yields straightforward descriptive decompositions of estimated primary and
secondary effects (albeit ones that permit only associational interpretations).
In addition, the article demonstrates that backdoor conditioning with avail-
able national data is unlikely to lead to estimates of primary and secondary
effects that have clear and sufficiently convincing causal interpretations.
48 Sociological Methods & Research 41(1)

It is likely that direct examination of the choice-based mechanism itself
is the most fruitful way forward for estimating secondary effects. But, here,
we await future data collection, since no known national data appear able to
furnish the desired information for deeper modeling in any country.
Accordingly, this article can be read as yet another appeal for better data on
students’ beliefs about their alternative futures and on their subsequent
choices, for without them only marginal progress in the causal modeling of
educational transitions is likely.
Appendix
Additional Details of the ELS Data
Data were drawn from the 2002 through 2006 waves of the Education
Longitudinal Study (ELS), which is a nationally representative sample of
students in public and private high schools collected by the National
Center for Education Statistics (NCES) of the U.S. Department of
Education. Respondents were sampled as enrolled high school sopho-
mores in 2002, and follow up surveys were also conducted in both 2004
and 2006. The analysis sample for this article was first restricted to
respondents who participated in all three waves of the survey, using a
weight to account for sample attrition between the sophomore and senior
years. From among these students, high school graduates were then
selected for analysis in the college entry models (where high school grad-
uates were de.ned as those who obtained high school diplomas, thereby
excluding GED recipients). The resulting analysis sample includes
11,400 respondents.
College entry is defined strictly as having made the transition to a 4-year
college within 6 months of high school graduation, regardless of whether
high school graduation was delayed. Of the 11,400 students who had com-
plete data for college entry and social class, 44.3 percent entered a four-year
college within 6-months of high school graduation.
Class and SES. To construct EG classes, broad occupational categories
of fathers and mothers (or male and female guardians) were coded into the
standard nine-category EG schema. Then, these nine-category classes were
collapsed into the three tiers of salariat, intermediate, and working, after
which father’s and mother’s class position were collapsed into an overall
family measure. In this family class coding, father’s class was slightly
privileged, such that (1) families were coded as salariat if either parent
had a salariat occupation, (2) families were coded as intermediate class if
Morgan 49

the father had an intermediate class occupation but the mother had an 35
intermediate class or working class occupation, and (3) families were
coded as working class if the father had a working class occupation but
the mother had either an intermediate class occupation or a working class
occupation. This coding provides some consistency with definitions of
class that use only father’s occupation but also gives some weight to
mother’s class position as well.
The SES variable was constructed by the data distributors, which is a lin-
ear composite of mother’s education, father’s education, mother’s occupa-
tional prestige, father’s occupational prestige, and family income. The
underlying data were drawn from both parent-provided information and stu-
dent-provided information, as well as some imputed information developed
by the data distributors.
Performance. Respondents were administered achievement tests in
both the 2002 base year and the 2004 first follow-up waves. Base-year
respondents were administered math and reading achievement tests, but
only math tests were administered in 2004. The 2004 academic perfor-
mance measure, which is used in this article, is a standardized composite
of 2004 math and 2002 reading IRT-estimated scores. It should be noted
that it would have been preferable to have a 2004 measure of academic
performance that included 2004 results from a reading test, but this was
not available. That such a measure is absent, however, should not be very
consequential. One of the reasons that the U.S. Department of Education
employs an updated math test for the 2004 ELS but not an updated read-
ing test is that prior work shows considerable stability in relative rankings
throughout high school for reading achievement. In contrast, math
achievement is more dynamic, mostly because of greater curriculum dif-
ferentiation across students.
College Entry Models with SES Groups
Given the strong preference for modeling educational attainment in the
United States as a function of SES rather than class, Table A1 offers analo-
gous results to those in Table 2 but with two indicator variables for SES
groups rather than classes. (Models were also estimated with quartiles and
quintiles of SES. These alternative models differed very little, merely creat-
ing more finely graded results.)
A comparison of Chi-squared test statistics between Tables 2 and A1
suggests that SES is a stronger predictor than class. In one sense, this is
obviously true; the same number of parameters is .t to the data, and the
50 Sociological Methods & Research 41(1)
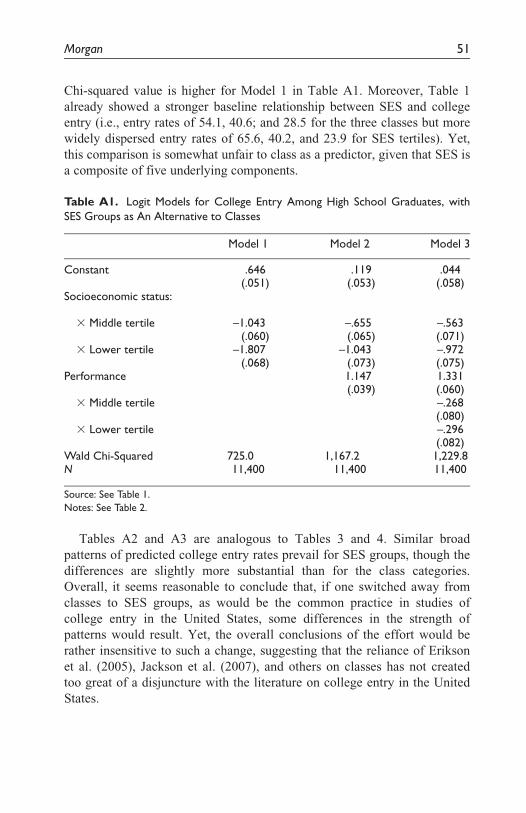
Chi-squared value is higher for Model 1 in Table A1. Moreover, Table 1
already showed a stronger baseline relationship between SES and college
entry (i.e., entry rates of 54.1, 40.6; and 28.5 for the three classes but more
widely dispersed entry rates of 65.6, 40.2, and 23.9 for SES tertiles). Yet,
this comparison is somewhat unfair to class as a predictor, given that SES is
a composite of five underlying components.
Table A1. Logit Models for College Entry Among High School Graduates, withSES Groups as An Alternative to Classes
Model 1 Model 2 Model 3
Constant .646 .119 .044(.051) (.053) (.058)
Socioeconomic status:
3 Middle tertile –1.043 –.655 –.563(.060) (.065) (.071)
3 Lower tertile –1.807 –1.043 –.972(.068) (.073) (.075)
Performance 1.147 1.331(.039) (.060)
3 Middle tertile –.268(.080)
3 Lower tertile –.296(.082)
Wald Chi-Squared 725.0 1,167.2 1,229.8N 11,400 11,400 11,400
Source: See Table 1.
Notes: See Table 2.
Tables A2 and A3 are analogous to Tables 3 and 4. Similar broad
patterns of predicted college entry rates prevail for SES groups, though the
differences are slightly more substantial than for the class categories.
Overall, it seems reasonable to conclude that, if one switched away from
classes to SES groups, as would be the common practice in studies of
college entry in the United States, some differences in the strength of
patterns would result. Yet, the overall conclusions of the effort would be
rather insensitive to such a change, suggesting that the reliance of Erikson
et al. (2005), Jackson et al. (2007), and others on classes has not created
too great of a disjuncture with the literature on college entry in the United
States.
Morgan 51

Table A2. College Entry Rates by SES Group, Estimated from the Models in Table A1
Model 2 (from Table A1) What-If SES Transition Probability
Higher SES Middle SES Lower SES
Higher SES .656 .529 .449(.011) (.012) (.014)
Middle SES .533 .402 .329(.012) (.011) (.012)
Lower SES .422 .301 .239(.012) (.010) (.010)
Model 3 (from Table A1) What-If SES Transition Probability
Higher SES Middle SES Lower SES
Higher SES .656 .522 .431(.011) (.013) (.016)
Middle SES .519 .402 .321(.013) (.011) (.012)
Lower SES .397 .306 .239(.014) (.011) (.010)
Source: See Table 1.Notes: See Table 2.
Table A3. Predicted Marginal Means for College Entry by SES Groups
Null Model(Model 1 from
Table A1)
Standard Model(Model 3 from
Table A1)
Augmented ModelStandard Model +
Expectations, ImmediatePlans, and Significant
Others’ Influence
MarginalMean Entry Rate
MarginalMean Entry Rate
MarginalMean Entry Rate
Higher SES .656 .530 .481(.011) (.012) (.011)
Middle SES .402 .415 .428(.011) (.011) (.011)
Lower SES .239 .335 .383(.010) (.012) (.013)
Source: See Table 1.
Notes: See Table 4.
52 Sociological Methods & Research 41(1)
Acknowledgments
I thank Theo Leenman for data analysis assistance. For their helpful and stimulating
comments, I thank Michelle Jackson, Trey Spiller, Jenny Todd, CIQLE seminar par-
ticipants at Yale, and sociology seminar participants at Nuffield College, Oxford.
Declaration of Conflicting Interests
The author(s) declared no potential conflicts of interest with respect to the research,
authorship, and/or publication of this article.
Funding
The author(s) received no financial support for the research, authorship, and/or publi-
cation of this article.
Notes
1. In addition to Erikson and Jonsson (1996), the renewed interest in Boudon’s
primary and secondary effects is also the result of the theoretical models pro-
posed by Goldthorpe (1996) and Breen and Goldthorpe (1997). Boudon’s book
has been less influential in the United States, in part because of an influential
review essay (Hauser 1976). Hauser argued that Boudon’s assumptions about
class differences in the relative costs and benefits of educational attainment
were incoherent, and he demonstrated that Boudon’s reanalysis of past data on
educational plans in the United States was largely incorrect.
2. These conclusions were echoed most recently by Erikson and Rudolphi
(2010:301), who argue, after estimating similar models with data from Sweden,
that ‘‘it may be possible to motivate children [from the working class] to
choose secondary training by giving full information on the benefits . . . of
higher education.’’ For other recent work, see Kloosterman et al. (2009),
Jackson (2010), and Jonsson and Rudolphi (2011).
3. Erikson et al. (2005:9732-33) present graphs that they label ‘‘path diagrams.’’
They label their graph in Figure 2(a) (which is equivalent to Figure 1a in the
present article) as ‘‘the implicit potentially causal model’’ that underlies their
empirical analysis. They then offer ‘‘a more realistic model’’ in their Figure
2(b), which will be discussed later in the present article.
4. One could elaborate this model by decomposing U into its components. One
could also add random noise, either as an additional input in f (:) or as a com-
ponent of U. Such refinements are not necessary at this stage of the argument
and would not alter the reasoning presented here.
5. From a rational choice perspective, t can be regarded as a function of exogen-
ous costs and benefits of college enrollment (see Manski 1989; Breen and
Goldthorpe 1997; Morgan 2005). Any variation across individuals in the
Morgan 53

relative attractiveness of a college education can then be embedded in U and
hence treated as an individual-level determinant of college entry.
6. Here, the implicit assumption is that inequalities such as E½PjS = 1� �E½PjI = 1� � E½PjW = 1� are causal. This could be made more explicit using the
do(:) operator of Pearl (2009), as in E½Pjdo(S = 1)� � E½Pjdo(I = 1)� �E½Pjdo(W = 1)�.
7. Moreover, background causes may exist that give rise to a distribution for G,
but these background causes do not need to be explicitly represented in the cau-
sal graph that elaborates the effects of Class on G because Assumptions 3 and
4 stipulate that any such additional causes will be independent of Class.
8. In this tradition of causal analysis, such simplifications are permissible because
we often think of causal arrows as black boxes that indicate the existence of an
unobserved mechanism that, in theory, could be observed.
9. The estimated inclusion probabilities were extracted from a baseline logit that
included 26 parameters for gender, race, region, urbanicity, school sector, fam-
ily structure, parents’ education, parents’ occupation, family income, students’
own educational expectations, parents’ expectations, and significant others’
influence.
10. In fact, Erikson et al. (2005) also allow for the direct effect of AD on G, and that
creates unstated complications for the conclusion they offer in the same article
that the anticipatory decision necessarily biases downward estimates of the sec-
ondary effect.
11. Note that, for simplicity, backdoor paths where P causes U, such as
Class! P! U ! G and Class X ! P! U ! G, are not introduced in
this causal graph. If they were included, the same basic conclusions would fol-
low from this identification analysis, but the graph and the explanation of the
conclusions would be more complicated.
12. See Pearl (2009) for a full discussion of the complications generated by collider
variables. See Morgan and Winship (2007, chap. 3) for a gentle introduction.
13. There is little interpretive loss of reporting via class comparisons when only three
classes are present, since only three comparisons are possible. Interpretive losses
mount as more class categories are utilized. For a seven-category EG class schema
(i.e., Classes I, II, IIIa, IIIb, IV, V, VI, and VIIa), standard methods would yield
21 measures of average relative importance (as in equation (13)), which them-
selves would be averaged versions of 42 underlying relative importance measures
calculated from log odds ratios (as in equations (11) and (12)). Having only 7
rather than 21 measures of relative importance would seem to have advantages in
descriptive representations, where parsimony is usually valued.
14. This number is interpretable as the weighted average of the three predicted
entry rates in the first column of the second panel of Table 3, which are .541,
.439, and .380, interpreted earlier as the college entry rates of the three classes
if all members of each class kept their own performance levels but transitioned
through the college entry regime of the salariat.
54 Sociological Methods & Research 41(1)
15. Finally, it is worth considering whether additional conditioning would result in
the elimination of all class differences. If the conditioning set for the augmen-
ted model is expanded by including 15 additional variables for race, family
structure, region of residence, urbanicity, and sector of school, the marginal
means change little. The marginal means are .452, .444, and .398 for the salar-
iat, intermediate, and working classes. It seems fair to conclude, therefore, that
much of the backdoor associations generated by broader demographic factors
and school sector differences are screened off by conditioning on the more
proximate determinants of performance and choice in the augmented model
offered in Table 4.
References
Avery, Christopher and Thomas J. Kane. 2004. ‘‘Student Perceptions of College
Opportunities: The Boston COACH Program.’’ Pp. 355-91 in College Choices:
The Economics of Where to Go, When to Go, and How to Pay for It, edited by C.
M. Hoxby. Chicago: University of Chicago Press.
Boudon, Raymond. 1974. Education, Opportunity, and Social Inequality: Changing
Prospects in Western Society. New York: John Wiley.
Breen, Richard and John H. Goldthorpe. 1997. ‘‘Explaining Educational
Differentials: Towards a Formal Rational Action Theory.’’ Rationality and
Society 9:275-305.
Dominitz, Jeff and Charles F. Manski. 1996. ‘‘Eliciting Student Expectations of the
Returns to Schooling.’’ Journal of Human Resources 31:1-26.
Erikson, Robert, John H. Goldthorpe, Michelle Jackson, Meir Yaish, and D. R. Cox.
2005. ‘‘On Class Differentials in Educational Attainment.’’ Proceedings of the
National Academy of Sciences 102:9730-33.
Erikson, Robert and Jan O. Jonsson. 1996. ‘‘The Swedish Context: Educational
Reform and Long-Term Change in Educational Inequality.’’ Pp. 65-93 in Can
Education Be Equalized? The Swedish Case in Comparative Perspective, edited
by R. Erikson and J. O. Jonsson. Boulder, CO: Westview.
Erikson, Robert and Frida Rudolphi. 2010. ‘‘Change in Social Selection to Upper
Secondary School—Primary and Secondary Effects in Sweden.’’ European
Sociological Review 26:291-305.
Gabay-Egozi, Limor, Yossi Shavit, and Meir Yaish. 2010. ‘‘Curricular Choice: A
Test of a Rational Choice Model of Education.’’ European Sociological Review
26:447-63.
Goldthorpe, John H. 1996. ‘‘Class Analysis and the Reorientation of Class Theory:
The Case of Persisting Differentials in Educational Attainment.’’ British Journal
of Sociology 47:481-505.
Grodsky, Eric and Melanie T. Jones. 2007. ‘‘Real and Imagined Barriers to College
Entry: Perceptions of Cost.’’ Social Science Research 36:745-66.
Morgan 55

Hauser, Robert M. 1976. ‘‘On Boudon’s Model of Social Mobility.’’ American
Journal of Sociology 81:911-28.
Jackson, Michelle. 2010. ‘‘Investigating Inequalities in Educational Attainment.’’
Pp. 163-77 in Spatial and Social Disparities, edited by J. Stillwell, P. Norman,
C. Thomas, and P. Surridge. Dordrecht, Netherlands: Springer.
Jackson, Michelle, Robert Erikson, John H. Goldthorpe, and Meir Yaish. 2007.
‘‘Primary and Secondary Effects in Class Differentials in Educational
Attainment.’’ Acta Sociologica 50:211-29.
Jonsson, Jan O. and Frida Rudolphi. 2011. ‘‘Weak Performance—Strong
Determination: School Achievement and Educational Choice among Children of
Immigrants in Sweden.’’ European Sociological Review 27:487-508.
Kloosterman, Rianne, Stijn Ruiter, Paul M. de Graaf, and Gerbert Kraaykamp. 2009.
‘‘Parental Education, Children’s Performance and the Transition to Higher
Secondary Education: Trends in Primary and Secondary Effects over Five Dutch
School Cohorts (1965–99).’’ British Journal of Sociology 60:377-98.
Manski, Charles F. 1989. ‘‘Schooling as Experimentation: A Reappraisal of the
Postsecondary Dropout Phenomenon.’’ Economics of Education Review 8:305-
12.
Morgan, Stephen L. 2005. On the Edge of Commitment: Educational Attainment and
Race in the United States. Stanford, CA: Stanford University Press.
Morgan, Stephen L. and Christopher Winship. 2007. Counterfactuals and Causal
Inference: Methods and Principles for Social Research. Cambridge, UK:
Cambridge University Press.
Pearl, Judea. 2009. Causality: Models, Reasoning, and Inference. 2d ed. Cambridge,
UK: Cambridge University Press.
Sewell, William H., Archibald O. Haller, and Alejandro Portes. 1969. ‘‘The
Educational and Early Occupational Attainment Process.’’ American Sociological
Review 34:82-92.
Stocke, Volker. 2007. ‘‘Explaining Educational Decision and Effects of Families’
Social Class Position: An Empirical Test of the Breen-Goldthorpe Model of
Educational Attainment.’’ European Sociological Review 23:505-19.
Bio
Stephen L. Morgan, Ph.D, is Professor of Sociology and the Director of the Center
for the Study of Inequality at Cornell University.
56 Sociological Methods & Research 41(1)