sociological analysis of road safety situation in · pdf filetitle sociological analysis of...
TRANSCRIPT

Sociological Analysis of Road Safety Situation in Cambodia
Hasselt University:
Marjolein DE JONG
Tom BRIJS
Kris BRIJS
HIB Cambodia:
Socheata SANN
Soveasna OL

Sociological Analysis of Road Safety Situation in Cambodia
Marjolein DE JONG, Tom BRIJS, Kris BRIJS, Socheata SANN, Soveasna OL

Document description
Title Sociological Analysis of Road Safety Situation in Cambodia
Number of pages 50
Publication
Author(s) Marjolein DE JONG, Tom BRIJS, Kris BRIJS, Socheata SANN, Soveasna OL
Constituent Handicap International Belgium
Issued by Transportation Research Institute (IMOB)
01 February 2011
Transportation Research Institute (IMOB) Hasselt University | Campus Diepenbeek Wetenschapspark 5 bus 6 | BE-3590 Diepenbeek T +32 (0)11 26 91 11 F +32 (0)11 26 91 99 E [email protected] I www.imob.uhasselt.be
Transportation Research Institute (IMOB) 3
Abstract
Sociological Analysis of Road Safety Situation in Cambodia
The global objective of the study is to explore the conceptual understanding of road crashes as a social issue among general road users and to understand better the behavioral determinants of motorcycle helmet wearing among youth.
Both researches show some interesting similarities about how the interviewed think about wearing a helmet. Both questionnaires reveal that there is good understanding of why you should wear a helmet and the respondents have a positive attitude towards helmet wearing. Moreover, the Helmet Questionnaire showed that most of the questioned people believe that they are able to wear a helmet.
Although people express the intention to wear a helmet, in practice there are still a lot of people not wearing a helmet. From the helmet research we can learn that there are a few important factors playing a role. Although people agree on the fact they should wear a helmet they also state that there are specific situation in which they find it more difficult to wear a helmet: in situations that are perceived as ‘safe’ (driving slow or over a short distance) and when it is not convenient (when dressed up). Another important issue is the fact that the opinion of the family is stated to be important for the intention to wear a helmet but that the actual behavior of friends often plays a stronger role in the final decision to wear a helmet. It is likely that although family is very important people mirror their behavior on that of friends and more in general on people on the street. Seeing more people wearing a helmet encourages wearing a helmet themselves. While the general awareness about the need of wearing a helmet is very high, wearing a helmet is not a habit yet, but part of a ‘decision-making-process’. This could explain the difference between the intention of people and the actual helmet wearing rate.
One of the conclusions is that the target population was very much aware of the fact that wearing a helmet protects them from head injuries (i.e. knowledge about the benefits of helmet wearing is good). The actual wearing of a helmet, though, was linked to the perceived risk and not all situations are considered risky by the road user. Therefore, further effort needs to focus on changing the perception on which situations constitute a risk, namely that all situations without a helmet are risky. The aim will be to make helmet wearing a habit at all times through raising public awareness, targeting youth and strengthening helmet law enforcement.

Transportation Research Institute (IMOB) 4
Table of contents
1 INTRODUCTION ................................................................................................... 7
1.1 Objective.................................................................................................. 7
1.2 Research questions .................................................................................... 8
1.3 Way of working ......................................................................................... 8
1.4 Content of this report ...............................................................................10
2 GENERAL ROAD USER SURVEY .................................................................................11
2.1 Methodology ............................................................................................11
2.2 Results ....................................................................................................11
3 HELMET SURVEY .................................................................................................13
3.1 Methodology ............................................................................................13
3.2 Findings ..................................................................................................14
4 CONCLUSIONS GENERAL SURVEY AND HELMET SURVEY ....................................................20
4.1 Setting up an awareness campaigns ...........................................................20
4.2 Recommendations ....................................................................................17
4.3 Practical suggestions ................................................................................18
LITERATURE ............................................................................................................24
APPENDIX 1: GENERAL QUESTIONNAIRE .....................................................................25
APPENDIX 2: DESCRIPTIVE STATISTICS HELMET SURVEY ..................................................31
Background variables .........................................................................................31
Socio-cognitive variables ....................................................................................31
APPENDIX 3: INFERENTIAL STATISTICS .......................................................................40
Concept structure and reliability ..........................................................................40
Comparison of subgroups (t-tests) .......................................................................40
Correlations ......................................................................................................43
Regressions ......................................................................................................45
Overall findings inferential statistics .....................................................................46

Transportation Research Institute (IMOB) 5
List of figures
Figure 1 Overview of work process ........................................................................ 9
Figure 2 Theory of Planned Behavior ....................................................................13
Figure 3 Visual overview of results for regression analyses......................................14
Figure 4 How concerned are you about the following issues ....................................25
Figure 5 How confident are you in abilities of the government .................................25
Figure 6 How much consideration should the government give to the following road users ...................................................................................................26
Figure 7 Effectives ways to prevent accidents ........................................................26
Figure 8 What do you think of the following ways to prevent road accidents ..............27
Figure 9 How acceptable is it that some drivers do the following things ....................28
Figure 10 How acceptable is the opinion of people you consider important about the following behavior .................................................................................28
Figure 11 How often have you done YOURSELF the following things ..........................29
Figure 12 How often have you done OTHER drivers doing the following things ............29
Figure 13 opinion of the respondents about a series of statements ............................30

Transportation Research Institute (IMOB) 6
List of tables
Table 1 Overview of descriptive findings of the different concepts ...............................16
Table 2 Practical suggestions for implementation ......................................................18
Table 3 Different media types ................................................................................22
Table 4 Background variables .................................................................................31
Table 5 Behavioral beliefs (1 = disagree & 5 = agree) ...............................................32
Table 6 Normative beliefs (1 = disagree & 5 = agree) ...............................................32
Table 7 Control beliefs (1 = hard to wear helmet & 5 = easy to wear helmet) ..............33
Table 8 Attitude (semantic differential)....................................................................34
Table 9 Descriptive norm (1 = disagree & 5 = agree) ................................................34
Table 10 Personal norm (1 = disagree & 5 = agree)..................................................35
Table 11 Subjective norm (1 = disagree & 5 = agree) ...............................................36
Table 12 Perceived behavioural control - ability (1 = disagree & 5 = agree) .................36
Table 13 Perceive behavioural control - dependency (1 = disagree & 5 = agree) ..........36
Table 14 Perceive vulnerability (1 = disagree & 5 = agree) ........................................37
Table 15 Perceive severity (1 = disagree & 5 = agree) ..............................................37
Table 16 Response cost (1 = disagree & 5 = agree) ..................................................38
Table 17 Cues to action � buying a helmet (1 = disagree & 5 = agree) ......................38
Table 18 Cues to action � wearing helmets (1 = disagree & 5 = agree) ......................38
Table 19 Behavioural intentions (1 = disagree & 5 = agree) ......................................39
Table 20 Behaviour (1 = disagree & 5 = agree) ........................................................39

Transportation Research Institute (IMOB) 7
1 INTRODUCTION
Road traffic injuries are a huge public health and development issue, killing more than 3,000 people every day in the world and disabling for life more than 15,000. They are the second leading cause of death globally among young people aged 5 to 29. Ninety percent of fatalities related to road crashes occur in low and middle-income countries (World Health Organization 2004). Whereas in recent decades, high-income countries have steadily and systematically reduced the number and severity of road crashes by implementing coordinated multi sector prevention programs.
Cambodia’s relative stability and growth in recent years has been characterized by a rapid increase in the volume of road traffic (20% per year on average). Growth in vehicles numbers, insufficient law enforcement, lack of Road Safety (RS) education, speed increases and the inadequacy of health services have led to a rapidly rising number of road fatalities and injuries.
In 2007, according to Cambodia’s Road Traffic Accident and Victim Information System (Belgium 2007), more than 4 persons die and many others are injured daily on the roads of Cambodia. As a result, from 2001 to 2007, the number of fatalities has more than tripled. With fatalities at 17 per 10,000 registered vehicles, Cambodia has the highest mortality rate in the ASEAN region.
Motorcycles is one of the most common modes of transport in Cambodia and head injuries account for more than 80% of all fatalities. Data from the Cambodian Road Traffic Accident and Victim Information System (RTAVIS) shows that only 3% of fatalities involved in a road crashes in Cambodia were wearing a motorcycle helmet, 19% of the casualties suffer from fractures and more than 50% suffer from serious cuts/wounds.
1.1 Objective
To tackle the growing road safety crisis, Handicap International Belgium - Cambodia (HIB-C) launched an extensive road safety programme in 2003, aiming at the prevention of fatalities, injuries and disabilities due to road accidents. Since its launch, the programme has expanded its activities and geographical coverage, and is aligned to the Royal Government of Cambodia’s national road safety policy and action plan.
Education and awareness campaigns are a very important part of the work of HIB in Cambodia and HIB would like to continue with it as effective as possible. Analyses of accident data from RTAVIS show that human errors are one of the main reasons of accidents. A lot of crashes are related to high speed and the use of alcohol, but also weak traffic regulation and lack of experience with the new traffic situation might be a reason of the – expected - high increase of road accidents. Therefore, it seems to be logical to focus on these items in education and awareness campaigns. However, international literature shows that effectiveness of education and awareness campaigns depends on a lot of specific elements like target group, type of message, and relation with other measures. In order to design more effective education programs and awareness campaigns, HIB-Cambodia would like to have a better understanding of the factors leading to safe and unsafe attitudes and actual behavior in traffic and transportation. What is for example the effect of education if enforcement is weak? And what is a good strategy for a shift in the road safety culture?
Handicap International Cambodia would like to improve their education and awareness campaigns. The messages should be based on a clear understanding of the attitudes and actual behavior of road users in order to design more effective strategies.
The objective of this study was twofold. Firstly, to understand better the attitude of Cambodian citizens towards road safety when compared to other social problems, the confidence that Cambodians have in government agencies to do something about road safety, their confidence and support for particular countermeasures and their personal
Transportation Research Institute (IMOB) 8
road safety experiences. The second objective of the study was to measure the behavioral determinants of motorcycle helmet wearing among youth between 16 and 25. The study should reveal elements that can be adopted in setting up awareness campaigns, educational and enforcement activities with respect to helmet wearing.
1.2 Research questions
In the TOR the specific objectives and expected key outputs have been formulated and they will play an important role in the research design and the analysis of the results. In short, the research has to give an answer to the following, not limitative, list of questions:
Target groups
- What are the most important target groups concerning road safety and what are the socio-economic characteristics of those groups?
- Is there a difference between target groups when you look at age, gender and area type (rural, urban)?
- What is the opinion of these target groups about road safety and their own behavior and what does research say and what is the ‘norm’ of the country?
Road Safety Policy and implementation - Is their an impact of social-political aspects on road safety?
- Who are the main stakeholders and what is their attitude about road safety?
- Which difficulties/opportunities do these stakeholders have to anticipate on implementing the national road safety policy, action plan and law enforcement?
- What are the most important gaps in the national road safety policy, action plan, and law enforcement in terms of the critical issues identified in the research (such as priorities in specific target groups, educational message)?
Measures
- Which actions are effective according to the target group and according to other research results?
- How does an effective action look like in terms of ‘sender’, design, way of communication, etc?
- What is an effective type of campaign (educational, persuasive, shocking or ‘soft’) for different target groups according to themselves and according to other research?
- What are success and failure factors based on examples from Cambodia and other countries and how can they be used for a road safety culture shift?
- Is there a link between driver education/testing system and road (un)safety according to target groups and research?
1.3 Way of working
The research has been organized in 3 phases: preparation, field research and analysis with a visit in between each phase (see Figure 1). Each visit has been prepared beforehand by the local team and IMOB. During the visit the work has been very

Transportation Research Institute (IMOB) 9
intensive and practical. Preparatory work has been reviewed and the next phases have been prepared like the field research that had to be carried out by the local team afterwards.
Figure 1 Overview of work process
The visits have been carried out by Tom Brijs and Marjolein de Jong (IMOB) during 2009. During the first working visit, the focus of the research has been defined, the questionnaires have been prepared and tested and
a. Background information
During the first phase information has been collected about the type of problems Cambodia is facing in the field of road safety. Moreover, stakeholders have been interviewed to get an actual impression of current strength, weaknesses, opportunities and threats in current road safety policy.
b. Training
During both visits, capacity building played an important role. During the first visit, a 1-day intensive training course was organized for staff of HIB-C, CRY and NRSC about setting up and evaluating road safety awareness campaigns. The focus of the training during the second visit was more on data analysis with the use of statistical techniques (with SPSS) and drawing conclusions from the data. The main findings from the
Visit
Visit

Transportation Research Institute (IMOB) 10
questionnaires have been linked to the different steps for setting up awareness campaigns.
c. Setting-up questionnaires
An important part of the visit consisted of creating a set of questionnaires that could be used as the basis for setting up a road safety awareness campaign later in the project. In fact, during the training it was already treated that setting up successful campaigns should be based on in-depth research about beliefs, attitudes, intentions, etc. in the target group. Typically, this information is collected through questionnaires among members of the target group. Therefore, two types of questionnaires were prepared in advance based on good international examples: one questionnaire dealing with general road safety issues and one focusing on helmet wearing.
d. Pilot interviews
After constructing the questionnaires, staff members of HIB-C were trained about the needed sample size for both questionnaires and how to conduct the interviews with the respondents. The procedure was then tested in the field (i.e. on the road) where HIB-C staff conducted a limited number of questionnaires and IMOB observed the interviewing process. Afterwards, feedback was given during a group discussion on how to improve the interviewing procedure, i.e. how to keep interviewing time within acceptable limits, how to avoid other people to disturb the interviewing process, etc. Based on this discussion, a few adaptations were also made to the final questionnaires.
e. Interviews and data entry
The interviews have been carried out by a team of HIB-C on the street. The data has been entered by HIB-C in SPSS. IMOB has given advice on the structure of the database and some basic functionality.
f. Training statistical analysis
During the second visit a training has been given on statistical analysis of data using SPSS. The training contained a theoretical part, but also a very practical component as we wanted to draw tentative conclusions already during the second visit.
g. First conclusions
Already during the second visit the first conclusions based on the surveys have been translated into consequences for setting up an awareness campaign. Focus groups and stakeholders have been involved in the interpretation of the results and the impact for policy.
1.4 Content of this report
In the main part of this report the results from two researches, General Road User Survey (chapter 2) and the Helmet Survey (chapter 3) can be found. In chapter 4 we come to conclusions and recommendations based on the results of the two researches. This chapter is divided into three sections: how to use the results for setting up an awareness campaign, general recommendations and practical suggestions.
In the appendixes more detailed information can be found about the General Road User Survey (appendix 1) and the Helmet Survey (appendix 2). These appendixes give an overview of the most important outcomes, including tables representing different questions and an interpretation of the results. In Appendix 3, Inferential Statistic, we go deeper into the relevant relations between different variables and look for explaining variables. This chapter is background information for chapter 3, the Helmet Survey.

Transportation Research Institute (IMOB) 11
2 GENERAL ROAD USER SURVEY
2.1 Methodology
A general road user survey was carried out among a random sample of 729 road users in Phnom Penh city and Battambang province. The general road user survey consisted of several parts and the questions dealt with issues like:
- the importance of road safety when compared to other social problems;
- the confidence that people have in government agencies to do something about those problems;
- the respondent’s attitudes towards road safety;
- the respondent’s support for countermeasures;
- personal experience;
- socio-demographics background.
The first part focused on the importance of road safety when compared to other social problems like domestic violence, unemployment, drug use, HIV/AIDS, traffic congestion, etc. and the confidence that Cambodian citizens have in government to do something about those problems. In the next part of the survey, road users were probed about their attitudes toward particular road safety problems (e.g. drink driving, speeding, not wearing the helmet, talking on a cell phone while driving, red light running, etc.) and their perceived effectiveness of and support for several road safety counter measures (e.g. awareness campaigns, stricter enforcement, stricter laws, infrastructural improvements, improved road safety education, etc.). The general road user survey was also specifically adapted to the local Cambodian situation, for example by adding extra options related to motorcycle use or by rephrasing the questions in such a way that they are understandable for Cambodians.
The interviews were pre-tested and based on this pre-test, the questionnaire was slightly adapted. Unclear or ambiguous wording has changed and the translation into Khmer has kept as close as possible to the English version. Also the interview procedure was improved in order to minimize the influence of the interviewer. During the test-interviews it appeared that the interviewers were keen to introduce themselves and explain the context of the research and to discuss the outcomes with the interviewee and the public standing around. By doing this there is a change that the interviewer influences the answers. Therefore we’ve made additional instruction on how to introduce the research and how to deal with this kind of situations. We also made clear that it shouldn’t be mentioned that the interviews were dealing with road safety as this is only true for the second part of the questionnaires. In the first part we want to find out how important road safety is considered compared to other relevant problems in Cambodia.
2.2 Results
If we look at the general characteristics of the people interviewed, we see that the majority of the interviewed live in a town/city (44%) or along a national road (42%) and 14% lives in a rural area. The amount of women and men is almost the same. More than half of the interviewed (58%) is younger than 25. The overall level of women is lower than that of men: only 17% of the young females and 8,6% of the women older than 25 years has at least a high school degree compared to 27% of the young males and 37,3% of the men older than 25 years.
Asking about the importance of road safety when compared to other social problems, 64% of the Cambodian road users expressed that they were extremely concerned about

Transportation Research Institute (IMOB) 12
road crashes. Drugs use, crime and unemployment had a similar high score. Traffic congestion and global warming counted with 24% and 18% for the lowest amount of people that were extremely concerned. Other problems in society such as domestic violence, price on the gas pump and HIV had scores ranging from 38 up 55%. It is remarkable that respondents were more positive about the abilities of the government to improve road safety and traffic congestion than to improve the other questioned issues.
Between 80% and 90% of the interviewed perceive speeding, drink driving, driving through the red light, dangerous overtaking and not alert driving as very serious problems in traffic. Throughout the whole questionnaire we see that the interviewed are aware of the fact they should wear a helmet to prevent themselves from injury. Stricter traffic laws (57%), reduction of speed (73%) and helmet use (69%) are considered as the most effective way to prevent accidents.
The presence of pedestrians on the street and the bad state of the road though are only by less than half of the people considered as a very serious problem. The interviewed also state that the government should mainly focus on motorized modes of transport and not at cyclists and pedestrians. When asking about the most effective way to prevent from injuries we see that almost al proposed measures are supported by more than 65% of the people with exception of the increase of fines which was supported by only 20%. Two types of measures get a stronger support: those dealing with wearing – quality – helmets and those dealing with education and awareness. A state-approved driver course got a support of almost 100%. Generally spoken, we can conclude that there is a rather high level of knowledge about the need to wear a helmet. This may be the result of recent change in law which makes wearing a helmet as driver compulsory and the media campaigns to communicate the new law. Within this context it is remarkable that only 50% of the interviewed answer that driving without a helmet is unacceptable compared to speeding, driving through red light and driving when not attentive with scores higher than 80%. We see about the same scores if we ask about behavior they have performed themselves and they have seen others doing. The study indicated that the family is perceived as more influential for their own behavior than friends or colleagues.
In the reflection to the general knowledge and their perceptions toward the traffic accident, the research showed the individual experiences of the accident. 40% of the participants state that they consider the probability to get personally involved in an accident very small or small and another 41% considers the risk medium. At the same time more than half of the people state that they have no or limited control whether they will be involved in accidents or not. Only 15% states they have good or total control. In other words: accidents happen sometimes, but you cannot do a lot yourself to prevent them from happening, but wearing a helmet reduces the severance of the injuries.
Transportation Research Institute (IMOB) 13
3 HELMET SURVEY
3.1 Methodology
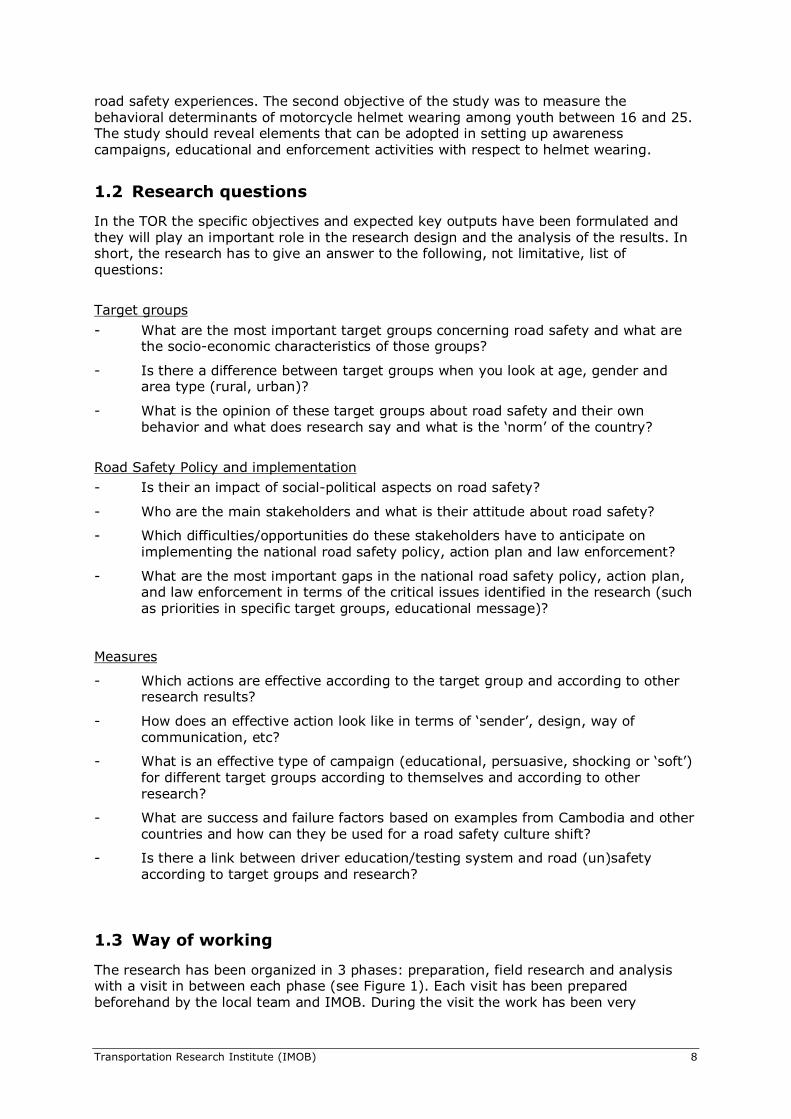
The helmet questionnaire undertaken with young people focused on the beliefs, attitudes and behavioral intentions on helmet use and is based on the Theory of Planned Behavior (Ajzen, 1991)
Figure 2 Theory of Planned Behavior
The theory states that behavior (e.g. wearing a helmet) is determined by people’s intentions to carry out the desired behavior and the individual’s perceived behavioral control (the individual’s perceived ease or difficulty to wear a helmet). Intentions to wear the helmet, in turn, are dependent on people’s attitudes toward helmet wearing (positive and negative attitudes), subjective norms (the individual’s perception about how important others think about whether he/she should wear a helmet) and perceived behavioral control. The basic Theory of Planned Behavior model was however extended with concepts from other theories, like the Protection-Motivation Theory (Rogers, 1975; 1983) and the Health-Belief Model (Rosenstock, 1966; 1974). These additional concepts were ‘perceived vulnerability’ (does the individual consider himself vulnerable to the risk of having a motorcycle crash), ‘perceived severity’ (does the individual think that the consequences of having a motorcycle crash while not wearing a helmet are severe enough), ‘response cost’ (the effort/cost associated with wearing a helmet), ‘response efficacy’ (perceived effectiveness of wearing a helmet) and finally ‘behavioral willingness’ (to what extent the individual is willing to wear a helmet in specific circumstances).
Before designing the interviews, in-dept interviews were conducted with key stakeholders such as the National Road Safety Committee (NRSC), the Cambodian Red Cross (CRC), the Japan International Cooperation Agency (JICA), a local non governmental organization (the Coalition for Road Safety), the Ministry of Education, Youth and Sports (MoEYS) and the Office of the Municipal Traffic Police, in order to get an overview of the road safety situation in Cambodia. The first results of the interviews have been discussed with a focus group consisting of a mix of ages and professions and the stakeholders as mentioned before.

Transportation Research Institute (IMOB) 14
3.2 Findings
The helmet survey has been carried out in Phnom Penh amongst 344 students and consequently most interviewed are younger than 25 and have a relatively high education: around 60% has a bachelor degree. 3.2.4.2. Aspects about helmet wearing in the questionnaire included:
- behavioral beliefs - normative beliefs - control beliefs - attitudes - subjective norms - perceived behavioral control - behavioral intentions - behavior - habits - perceived vulnerability - perceived severity - response cost - response efficacy - behavioral willingness
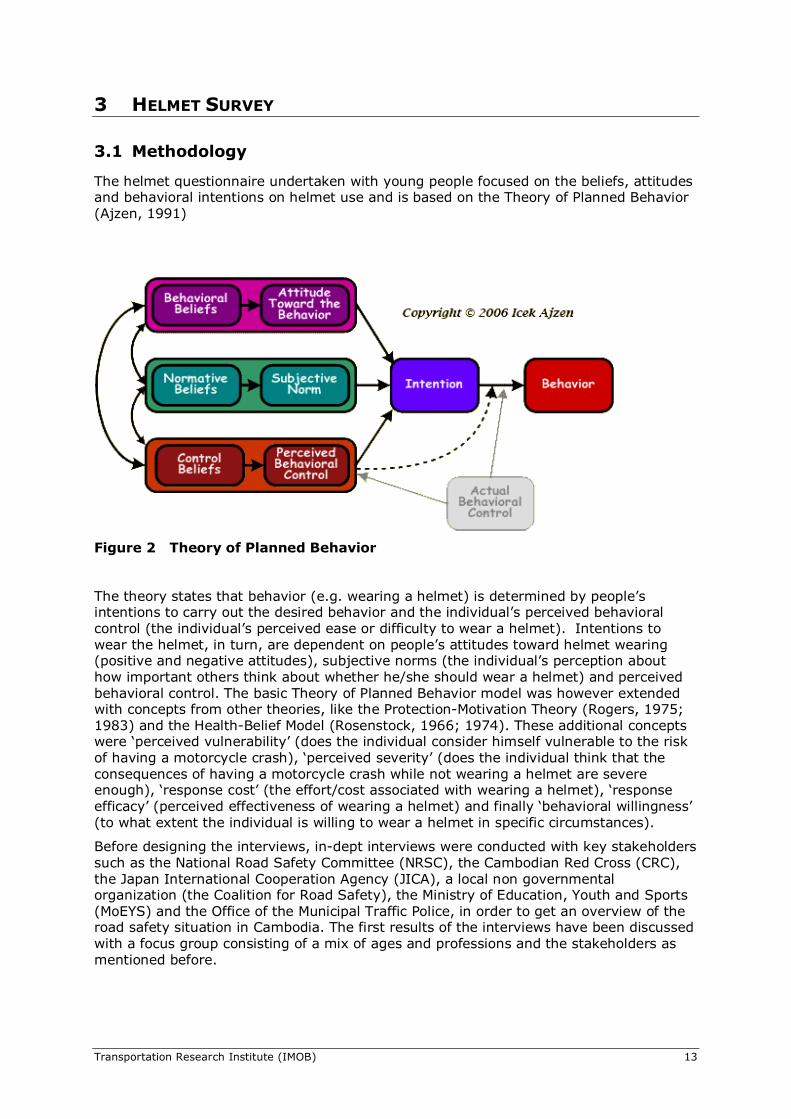
We carried out different types of analyses on the data like factor analyses, calculation of means and regressions. Detailed tables of the findings and a description of the analyses can be found in the appendix on page 25. The findings highlighted a number of factors associated with observed helmet use and the actual intention towards wearing a motorcycle helmet. Figure 2 gives an overview of the results of the regression analyses (see paragraph 0 for more information).
Figure 3 Visual overview of results for regression analyses
.15
.47
.46
.28

Transportation Research Institute (IMOB) 15
Behavioral intentions are considered as an important step towards actual behavior. Therefore it is interesting to note that he interviewed expressed a very strong intention to wear a helmet the next time they would drive a motorcycle. The study showed that there is a high correlation of attitudes and perceived behavioral control to behavioral intention. First we will discuss this two explaining issues before we go to the role of the subjective norm and the normative beliefs.
Attitude is influenced by behavioral beliefs and with a factor analyses on the questions about behavioral beliefs we found two clearly different groups of answers: one group dealing with positive attitudes and one with negative attitudes. More than 50% of the respondents have a positive attitude towards the behavioral intention to wear a helmet while driving their motorcycle. The positive beliefs played a more important role than the negative beliefs, but the predicting power is not very high. Therefore we also looked into detail at the individual questions dealing with positive attitudes. From this exercise we can learn that the fact that wearing a – good quality – helmet protects from head injury is more important than protection against getting into trouble with police or protection from dust. We might conclude most interviewed have a good general knowledge about the risks of getting injured when driving a motorbike and the fact that wearing a helmet protects them from head injuries. This is also supported by questions about the perceived vulnerability and severity of being injured when not wearing a helmet.
With a factor analysis on perceived behavioral control we found a set of three related questions with a high explaining value, expressing a strong internal ability to wear a helmet even if others don’t do or if there is no police on the street. If we look more into detail at the control beliefs we can see that the interviewed consider it easy to wear a helmet when driving in the city and being in a hurry. These items had a strong relation with the perceived behavioral controls. On the other hand it seems to be more difficult to wear a helmet when driving slowly or for a short distance or in relation with convenience like when dressed up or during the night. This could mean that wearing a helmet is related to a perceived risk and that not all situations are perceived equally risky. Being in a hurry for example could be considered more dangerous than driving slowly or only on a short distance.
The third element having influence on the behavioral intentions are the subjective norms and the normative beliefs. Here the pattern is not that clear as with the attitude and the perceived behavioral controls and we can find two tendencies. The first one deals with normative beliefs about the opinion of the own family and the Cambodian society in general. There is a correlation between their opinion about the fact that you should wear a helmet and the behavioral intentions, meaning that the interviewed stated that the opinion of their family and society in general is important. However, if we look at the relation between the normative beliefs and the subjective norm, it seems that the behavior of friends plays a more important role. The effect of what others do can also be found if we look at the barriers to effectuate behavioral intentions into actually wearing a helmet. There are two elements that are perceived as a barrier, namely the fact if other people wear a helmet and the cost of buying a – good quality – helmet.
The table below links the descriptive findings for each of socio-cognitive concepts included in the study with the findings obtained for the regression analyses on behavioural intentions and behaviour. Green boxes indicate concepts that could be associated in a statistically significant manner with intentions and/or behaviour. Red boxes stand for concepts that were excluded as significant determinants of intentions and/or behaviour.

Transportation Research Institute (IMOB) 16
Table 1 Overview of descriptive findings of the different concepts
CONCEPTS DESCRIPTION Effect on behavioural intentions?
Effect on behaviour?
Behavioural beliefs
The sample thinks favourably about using helmets. Helmets protect from serious head injury, from dust/wind/rain and from trouble with the police. Helmets are not uncomfortable, unfashionable and they do not impede seeing and hearing traffic.
No
No
Normative beliefs The sample thinks parents, partners and Cambodian society at large support the use of helmets while this is less the case for friends.
No
No
Control beliefs The sample thinks driving at night, while being dressed up and for only short distances might negatively affect their personal confidence/ability to wear a helmet. The sample thinks that driving slowly, while hot, while in a hurry and being inside or outside the city will not negatively affect their personal confidence/ability to wear a helmet.
No
Yes (.46)
Attitude The sample evaluates helmet usage as safe and responsible and doesn’t find it an unpleasant or embarrassing experience.
Yes (.28)
No
Descriptive norm The sample indicates that parents, friends and Cambodian society at large are observed to wear helmets while driving.
No
No
Personal norm The sample itself is supportive towards helmets usage, also from a moral/normative point of view.
Yes (.15)
Yes (.14)
Subjective norm The sample experiences enough helmet-supportive pressure from important reference groups.
No
No
Perceived Behavioural Control (Ability)
The sample is quite confident in its ability to resist non-usage in case other drivers do not wear helmets or when there is no police on the street.
Yes (.47)
Yes (.27)
Perceived Behavioural Control (Dependency)
The sample questioned is sensitive to what the driving circumstances are and that the assessment of these situational conditions might be an essential component in choosing whether to wear the helmet or not.
No
No
Perceived vulnerability
The sample is quite convinced that not wearing the helmet while driving implies an increased risk exposure. An interesting observation is that, ‘not wearing a helmet in the city is very risky’ is somewhat less agreed with.
No
Yes (.16)
Perceived severity The sample clearly recognizes that driving without helmets may cause serious problems in terms of health, finances and quality of life.
No
No
Response cost The sample indicates that buying and storing helmets is not too costly, The sample agreed openly with the statement that buying a HIGH QUALITY helmet was too expensive!
No
No
Cues to action
The sample agreed with the idea that more police enforcement, higher fines and more people wearing helmets stimulate the use of helmets.
No
No
Behavioural intentions
The sample expresses favourable intentions to wear the helmet while driving.
-
No
Transportation Research Institute (IMOB) 17
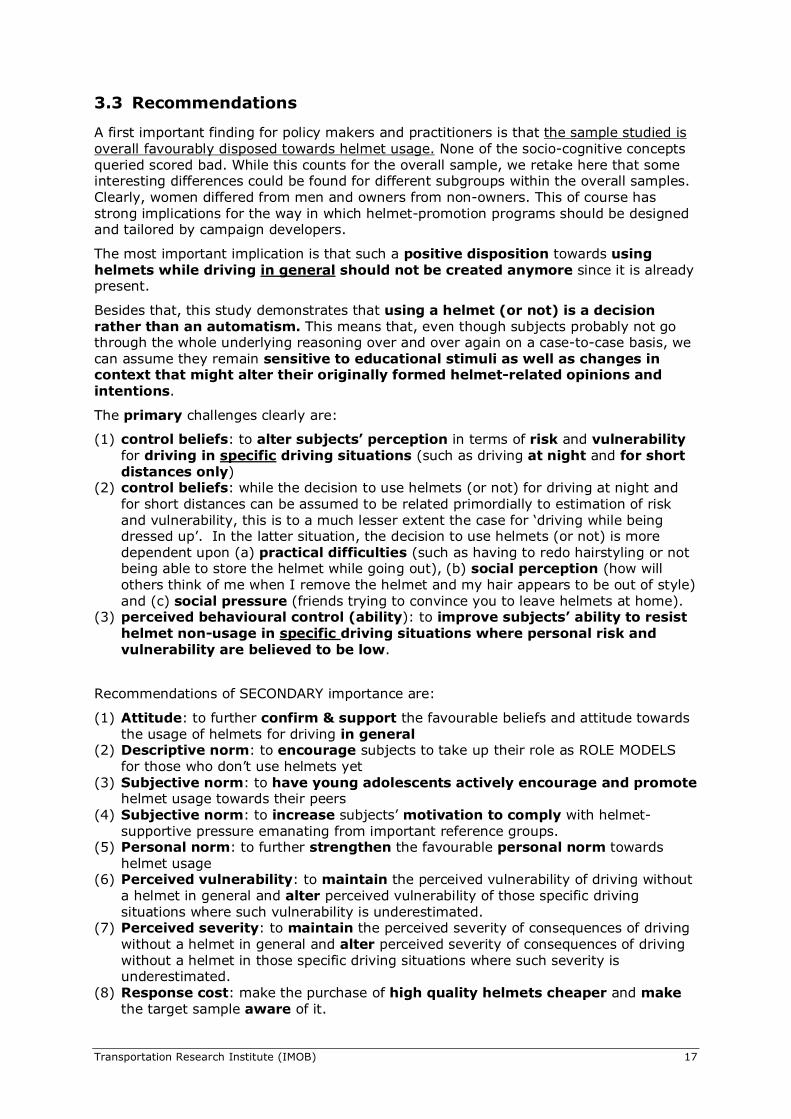
3.3 Recommendations
A first important finding for policy makers and practitioners is that the sample studied is overall favourably disposed towards helmet usage. None of the socio-cognitive concepts queried scored bad. While this counts for the overall sample, we retake here that some interesting differences could be found for different subgroups within the overall samples. Clearly, women differed from men and owners from non-owners. This of course has strong implications for the way in which helmet-promotion programs should be designed and tailored by campaign developers.
The most important implication is that such a positive disposition towards using helmets while driving in general should not be created anymore since it is already present.
Besides that, this study demonstrates that using a helmet (or not) is a decision rather than an automatism. This means that, even though subjects probably not go through the whole underlying reasoning over and over again on a case-to-case basis, we can assume they remain sensitive to educational stimuli as well as changes in context that might alter their originally formed helmet-related opinions and intentions.
The primary challenges clearly are:
(1) control beliefs: to alter subjects’ perception in terms of risk and vulnerability for driving in specific driving situations (such as driving at night and for short distances only)
(2) control beliefs: while the decision to use helmets (or not) for driving at night and for short distances can be assumed to be related primordially to estimation of risk and vulnerability, this is to a much lesser extent the case for ‘driving while being dressed up’. In the latter situation, the decision to use helmets (or not) is more dependent upon (a) practical difficulties (such as having to redo hairstyling or not being able to store the helmet while going out), (b) social perception (how will others think of me when I remove the helmet and my hair appears to be out of style) and (c) social pressure (friends trying to convince you to leave helmets at home).
(3) perceived behavioural control (ability): to improve subjects’ ability to resist helmet non-usage in specific driving situations where personal risk and vulnerability are believed to be low.
Recommendations of SECONDARY importance are:
(1) Attitude: to further confirm & support the favourable beliefs and attitude towards the usage of helmets for driving in general
(2) Descriptive norm: to encourage subjects to take up their role as ROLE MODELS for those who don’t use helmets yet
(3) Subjective norm: to have young adolescents actively encourage and promote helmet usage towards their peers
(4) Subjective norm: to increase subjects’ motivation to comply with helmet-supportive pressure emanating from important reference groups.
(5) Personal norm: to further strengthen the favourable personal norm towards helmet usage
(6) Perceived vulnerability: to maintain the perceived vulnerability of driving without a helmet in general and alter perceived vulnerability of those specific driving situations where such vulnerability is underestimated.
(7) Perceived severity: to maintain the perceived severity of consequences of driving without a helmet in general and alter perceived severity of consequences of driving without a helmet in those specific driving situations where such severity is underestimated.
(8) Response cost: make the purchase of high quality helmets cheaper and make the target sample aware of it.

Transportation Research Institute (IMOB) 18
(9) Cues to action: improve the quality of police enforcement by (a) increasing the perceived vulnerability of getting fined (make sure people know they will be controlled and make sure people are indeed enforced), (b) by increasing the perceived severity of getting fined (by increasing the fines), (c) by increasing the immediacy of the fines (make people have to pay their fines immediately), (d) by communicating why such enforcement is necessary (it is for the safety of all, rather than for financial purposes) and (e) by giving feedback of the positive effects of enforcement (let people know how (much) helmet usage increased
A third series of strategic recommendations would be:
(1) to actively reward positive behaviour (i.e., helmet usage) (2) to further facilitate positive behaviour (3) to have people plan helmet usage more
3.4 Practical suggestions
Remains the issue of how to implement the various strategic recommendations formulated throughout the previous sections. Table 2 gives a structured overview of how each of these can be further worked out.
Table 2 Practical suggestions for implementation
CONCEPTS TO DO? Control beliefs � driving at night � driving short distance
Target group should be: 1. aware of the risk 2. aware of its vulnerability
Control beliefs � driving dressed up
Target group should be: 1. offered measures to cope with practical difficulties 2. aware of measures to cope with practical difficulties 3. convinced of the effectiveness of these coping measures 4. convinced they are able to implement these measures 5. able to cope with negative social perception 6. able to resist negative social pressure
Perceived behavioural control (ability)
Target group should be: 1. able to resist helmet non-usage
Attitude Target group should be: 1. supported and confirmed in its positive attitude towards helmet usage
Descriptive norm Target group should be: 1. made aware of their function as role model 2. encouraged to take up its function as role model
Subjective norm Peers should be: 1. should encourage helmet usage among friends Young adolescents should be 2. more motivated to comply with the opinion of important reference
groups (friends, parents, partner, society at large) Personal norm Target group should be:
1. encouraged to take up its function as role model supported and confirmed in its conviction that using helmets is a (moral) obligation
Perceived vulnerability Target groups’ perceived vulnerability 1. should encourage helmet usage among friends 2. of driving AT NIGHT or FOR SHORT DISTANCES should be altered Young adolescents should be 1. more motivated when driving without helmet IN GENERAL should be
confirmed Perceived severity Target groups’ perceived severity of consequences of driving without
helmet

Transportation Research Institute (IMOB) 19
1. in general should be confirmed 2. at night or for short distances should be altered
Response cost 1. the price of high quality helmets should be lowered 2. target group should be made aware of lower price for high quality
helmets Cues to action Target group’s perceived
1. vulnerability of getting fined should increase 2. severity of getting fined should increase 3. immediacy of fines should increase Target group should 4. be aware of and acknowledge the necessity to enforce 5. receive feedback of the effect of enforcement on helmet usage
REWARD Helmet users should be rewarded for their positive behaviour FACILITATE Helmet usage should become easier PLAN Target group should PLAN helmet usage for driving at night , for short
distances or when dressed up (i.e., target group should specify for themselves the precise when and where they will use helmets -> for instance, next 3 weeks, each night I go out with my friends, I will use my helmet)
Transportation Research Institute (IMOB) 20
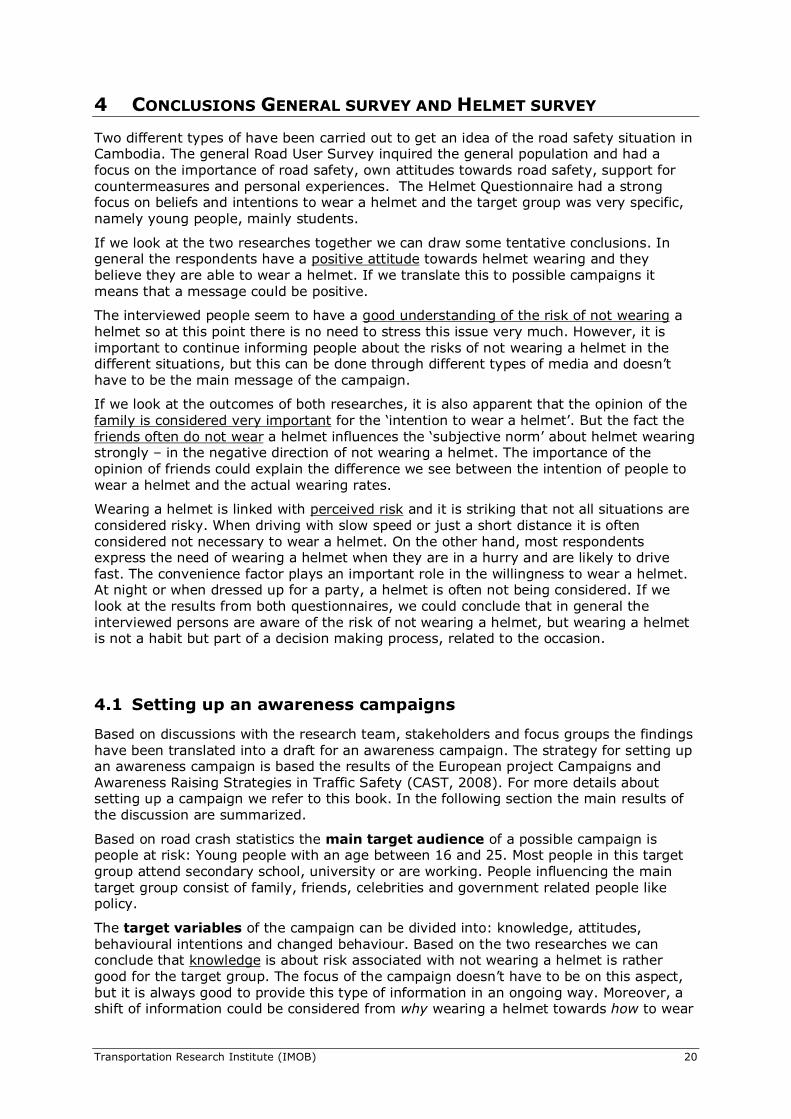
4 CONCLUSIONS GENERAL SURVEY AND HELMET SURVEY
Two different types of have been carried out to get an idea of the road safety situation in Cambodia. The general Road User Survey inquired the general population and had a focus on the importance of road safety, own attitudes towards road safety, support for countermeasures and personal experiences. The Helmet Questionnaire had a strong focus on beliefs and intentions to wear a helmet and the target group was very specific, namely young people, mainly students.
If we look at the two researches together we can draw some tentative conclusions. In general the respondents have a positive attitude towards helmet wearing and they believe they are able to wear a helmet. If we translate this to possible campaigns it means that a message could be positive.
The interviewed people seem to have a good understanding of the risk of not wearing a helmet so at this point there is no need to stress this issue very much. However, it is important to continue informing people about the risks of not wearing a helmet in the different situations, but this can be done through different types of media and doesn’t have to be the main message of the campaign.
If we look at the outcomes of both researches, it is also apparent that the opinion of the family is considered very important for the ‘intention to wear a helmet’. But the fact the friends often do not wear a helmet influences the ‘subjective norm’ about helmet wearing strongly – in the negative direction of not wearing a helmet. The importance of the opinion of friends could explain the difference we see between the intention of people to wear a helmet and the actual wearing rates.
Wearing a helmet is linked with perceived risk and it is striking that not all situations are considered risky. When driving with slow speed or just a short distance it is often considered not necessary to wear a helmet. On the other hand, most respondents express the need of wearing a helmet when they are in a hurry and are likely to drive fast. The convenience factor plays an important role in the willingness to wear a helmet. At night or when dressed up for a party, a helmet is often not being considered. If we look at the results from both questionnaires, we could conclude that in general the interviewed persons are aware of the risk of not wearing a helmet, but wearing a helmet is not a habit but part of a decision making process, related to the occasion.
4.1 Setting up an awareness campaigns
Based on discussions with the research team, stakeholders and focus groups the findings have been translated into a draft for an awareness campaign. The strategy for setting up an awareness campaign is based the results of the European project Campaigns and Awareness Raising Strategies in Traffic Safety (CAST, 2008). For more details about setting up a campaign we refer to this book. In the following section the main results of the discussion are summarized.
Based on road crash statistics the main target audience of a possible campaign is people at risk: Young people with an age between 16 and 25. Most people in this target group attend secondary school, university or are working. People influencing the main target group consist of family, friends, celebrities and government related people like policy.
The target variables of the campaign can be divided into: knowledge, attitudes, behavioural intentions and changed behaviour. Based on the two researches we can conclude that knowledge is about risk associated with not wearing a helmet is rather good for the target group. The focus of the campaign doesn’t have to be on this aspect, but it is always good to provide this type of information in an ongoing way. Moreover, a shift of information could be considered from why wearing a helmet towards how to wear

Transportation Research Institute (IMOB) 21
a helmet in a correct a way as to ensure if from being effective. As can be concluded from the researches, the perceived risk varies based on the location and the situation. It is therefore important to stress Attitudes do play an important role, as is also revealed by the researches. A campaign therefore should focus on the attitude towards wearing a helmet. The role of people influencing the main target group should be taken into account. Behavioural intentions with respect to helmet wearing are also considered a very important target variable. Wearing a helmet as part of a habit should be one of the main focuses. Finally the result of the campaign, the changed behaviour (so wearing helmet more often or always as part of a habit) can be observed or based on self-reported behaviour.
For each campaign it is important to involve different relevant stakeholders. A strong coalition increases the chances of success of the campaign. Early involvement of the different stakeholders is needed and a strong police leadership needed to ensure that strong enforcement is accepted by police officers. In this case the following developers and funders should be considered:
� Public authorities
o Ministries
o National Road Safety Council
o World Bank, ADB, …
� Road authorities
� Ngo’s: HIB, CRY, GRSP, …
� Insurance companies
� Vehicle and safety equipment manufacturers
� Charities
If we look at Implementers the following groups should be considered:
� Enforcement authorities
o Cambodian National Traffic Police
o Local police
� Universities, schools, student associations
� Driver education training centers
� Private organizatons, e.g.
o Petrol stations
o Tuktuk association, motorcycle manufacturers
o Festival and event organizers
o ….
� Volunteer organizations
� Hospitals, doctors
Based on the two researches the campaign objectives can be summarized as follows. At the end of the campaign more young people wear a helmet while making all kind of trips. In other words: wearing a helmet is part of daily routine, a habit and not part of a decision making process in which inconveniences are valued against possible risks. Reduction of head injuries is an important goal of the campaign. To reach those goals

Transportation Research Institute (IMOB) 22
fewer offences should be committed – in other words: more people have to wear a helmet during all periods of the day and everywhere. A positive attitude towards helmet wearing is a crucial element in this and is therefore also one of the campaign objectives.
The message of the campaign should be positive: wearing a helmet is not a problem; it is something you just do in all circumstances. It is important to realize that the campaign message is not the campaign slogan. Influencing people, groups and organizations can be asked to communicate the message. Apart from the positive message (wearing helmet is ok), a minor focus should be on situations that are risky but not perceived as such. In other words: there is always a risk for an accident. Different types of media can be chosen to communicate the message. Table 3 gives an overview of different types of media and the positive and negative aspects of them.
Table 3 Different media types
Positive Negative
TV Large reach, high frequency, accessible to everyone
High production cost, short lived messages (seconds)
Radio Large reach, also local reach, dynamic, low production cost
Low attention, short lived messages, not suitable for complicated messages
Cinema Selective, high attention, allows for more complexity
High production cost
Newspapers Large reach, geographical selectivity, high credibility, high information capacity, short lead time
Short lifespan, poor demographic selectivity, poor reproduction quality, high noise ration
Magazines Excellent for segmented audience, relatively long lifespan, good reproduction quality
High insertion cost, low frequency
Flyers, leaflets, brochures
High selectiveness, allows for complex messages, low cost
Low attention
Billboards, small-size posters/banners
High exposure, on-the-spot presence, geographically selective, long life span
Low attention, low information capacity
Face-to-face contacts
Effective, interaction with target group
Low exposure, high cost per contact
As said before, the aim of the campaign is a positive, emotional message about helmet wearing. Television is a good medium for this kind of messages. Emotions to support this message could be love, happiness, pleasure. The more rational message about the fact you should always wear a helmet and the risk of not wearing a helmet or not wearing a helmet correctly could be sent through other media.
A media campaign should be planned beforehand which means that there should be a scheduling of the distribution of the campaign materials like spots, billboards, website, and supportive activities like education and enforcement. For each of the elements the duration and the frequency should be decided, e.g. single-phase versus multi-phase. It is also important to consider the period of the year for the implementation. Seasonal

Transportation Research Institute (IMOB) 23
influences and event related considerations (e.g. drink driving around Khmer New Year) should be taken into account.
If possible, a campaign should be pre-testing, especially campaigns with a large investment in time and money. Questions that should be taken into consideration are:
� Is the message appropriate for the target audience?
� Is the message understood as intended?
� Is the message clearly stated?
� Is the message perceived as useful to the target group?
� Is the message well recalled or remembered?
� Is the message provoking unexpected feelings or reactions in the target group?
A campaign can be pre-tested with interviews, questionnaires, focus groups and associative techniques (thought listing). Setting up a campaign, campaign design and pre-testing are often done by specialized organizations.

Transportation Research Institute (IMOB) 24
LITERATURE
Ajzen, I. (1991). The theory of planned behavior. Organizational Behavior and Human Decision Processes, 50, 179-211.
CAST (2008). Campaigns and Awareness Raising Strategies in Traffic Safety. European project in the 6th Framework.
HIB (2007). Road Traffic Accident Victim Information System (RTAVIS). Handicap International Belgium, Phnom Penh, Cambodia.
Rogers, R. W. (1975). A protection motivation theory of fear appeals and attitude change. Journal of Psychology, 91, 93-114.
Rosenstock, I. M. (1966). Why People Use Health Services. Milbank Memorial Fund Quarterly 44:94–124.
Rosenstock, I. (1974). Historical Origins of the Health Belief Model. Health Education Monographs. Vol. 2 No. 4.
World Health Organization (2004). The World Health Report 2004. Changing history, WHO.

Transportation Research Institute (IMOB) 25
Appendix 1: GENERAL QUESTIONNAIRE
4.1.1 General opinion about road safety in relation to other domains
The following graphs show how the interviewees think about road safety in relation to other domains. Road safety is one of the main concerns. If we look at the confidence about the abilities of the government to improve the situation we see a relative positive score for improving road safety.
Figure 4 How concerned are you about the following issues
0% 20% 40% 60% 80% 100%
Improve the state of the health care system
Reduce Domestic violence
Reduce The price of gas at the pumps
Reduce drug use
Fight crime
Improve road safety
Improve the economy
Fight global warming
Traffic Congestion
HIV/AIDS
not all all confident fairly confident confident very confident extremely confident
Figure 5 How confident are you in abilities of the government
How concerned are you about the following issues
0% 20% 40% 60% 80% 100%
The state of the health care system
Domestic violence
The price of gas at the pumps
Drug use
Crime
Road traffic accident
Unemployment
Global warming
Traffic Congestion
HIV/AIDS
Not at all concerned Fairly concerned Concerned Very concerned Extremely concerned

Transportation Research Institute (IMOB) 26
4.1.2 Importance of different road users
According to the following graph, the government should mainly considerate motorized transport modes, with motorbikes at the first positions. Pedestrians and cyclist are not considered that important. In a way these results reflect the attention that is given at the moment to different road users. Motorcyclist are the main transport mode and therefore very visible. In terms of road safety they are high on the agenda because of the vulnerability, especially when not wearing a helmet.
Figure 6 How much consideration should the government give to the following road users
4.1.3 Ways to prevent accidents
Several questions dealt with ways to prevent accidents. The following graphs show that the interviewees consider speed and helmet wearing as two important components. Drunk driving is somewhere halve way and not mentioned as a main way to reduced accidents. Fines and infrastructural measures have to lowest score.
Figure 7 Effectives ways to prevent accidents
0% 10% 20% 30% 40% 50% 60% 70% 80% 90% 100%
Add guardrails or median barriers
Add more lanes to the highways
Increase the level of fines or demerit points
Improve the condition of the roads
Improve driver education and training before obtaining the driving license
Have more police to enforce laws
Do more road safety awareness campaigns (e.g. on television or by using billboards)
Set up checkpoints to catch drunk drivers
Stricter/tougher laws
helmet use
Reduce speed on the roads
Effective way to prevent accident
0%
10%
20%
30%
40%
50%
60%
70%
80%
90%
100%
Pedestrians Cyclists Motorcyclists Cars Lorries Public transport
not much consideration few consideration consideration much consideration very much consideration
Transportation Research Institute (IMOB) 27
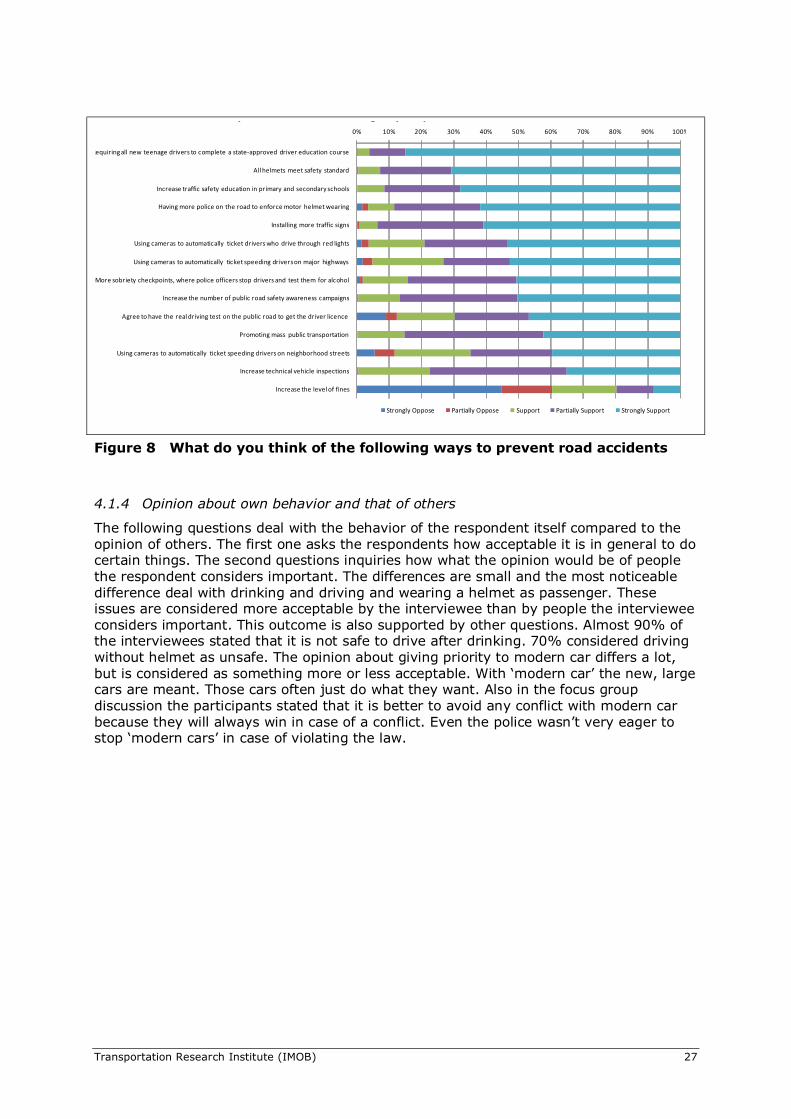
Figure 8 What do you think of the following ways to prevent road accidents
4.1.4 Opinion about own behavior and that of others
The following questions deal with the behavior of the respondent itself compared to the opinion of others. The first one asks the respondents how acceptable it is in general to do certain things. The second questions inquiries how what the opinion would be of people the respondent considers important. The differences are small and the most noticeable difference deal with drinking and driving and wearing a helmet as passenger. These issues are considered more acceptable by the interviewee than by people the interviewee considers important. This outcome is also supported by other questions. Almost 90% of the interviewees stated that it is not safe to drive after drinking. 70% considered driving without helmet as unsafe. The opinion about giving priority to modern car differs a lot, but is considered as something more or less acceptable. With ‘modern car’ the new, large cars are meant. Those cars often just do what they want. Also in the focus group discussion the participants stated that it is better to avoid any conflict with modern car because they will always win in case of a conflict. Even the police wasn’t very eager to stop ‘modern cars’ in case of violating the law.
0% 10% 20% 30% 40% 50% 60% 70% 80% 90% 100%
Requiring all new teenage drivers to complete a stateapproved driver education course
All helmets meet safety standard
Increase traffic safety education in primary and secondary schools
Having more police on the road to enforce motor helmet wearing
Installing more traffic signs
Using cameras to automatically ticket drivers who drive through red lights
Using cameras to automatically ticket speeding drivers on major highways
More sobriety checkpoints, where police officers stop drivers and test them for alcohol
Increase the number of public road safety awareness campaigns
Agree to have the real driving test on the public road to get the driver licence
Promoting mass public transportation
Using cameras to automatically ticket speeding drivers on neighborhood streets
Increase technical vehicle inspections
Increase the level of fines
What do you think of the following ways to prevent road accidents
Strongly Oppose Partially Oppose Support Partially Support Strongly Support
Transportation Research Institute (IMOB) 28
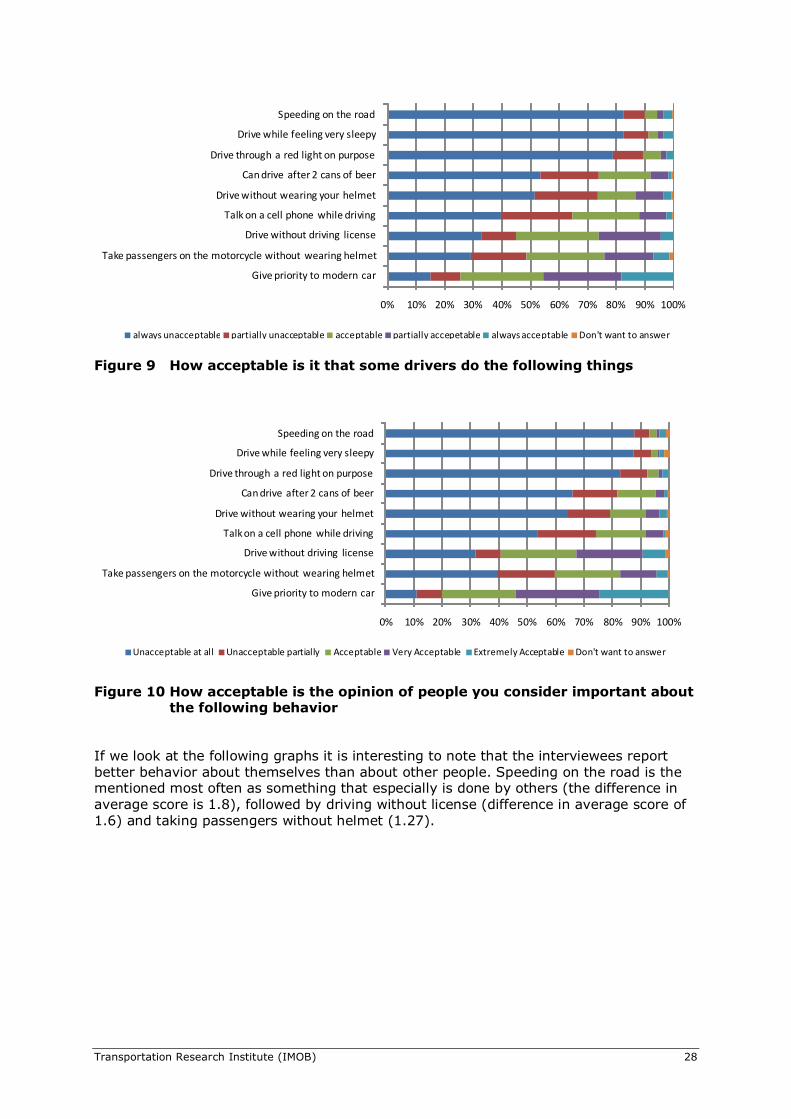
Figure 9 How acceptable is it that some drivers do the following things
Figure 10 How acceptable is the opinion of people you consider important about the following behavior
If we look at the following graphs it is interesting to note that the interviewees report better behavior about themselves than about other people. Speeding on the road is the mentioned most often as something that especially is done by others (the difference in average score is 1.8), followed by driving without license (difference in average score of 1.6) and taking passengers without helmet (1.27).
0% 10% 20% 30% 40% 50% 60% 70% 80% 90% 100%
Give priority to modern car
Take passengers on the motorcycle without wearing helmet
Drive without driving license
Talk on a cell phone while driving
Drive without wearing your helmet
Can drive after 2 cans of beer
Drive through a red light on purpose
Drive while feeling very sleepy
Speeding on the road
always unacceptable partially unacceptable acceptable partially accepetable always acceptable Don't want to answer
0% 10% 20% 30% 40% 50% 60% 70% 80% 90% 100%
Give priority to modern car
Take passengers on the motorcycle without wearing helmet
Drive without driving license
Talk on a cell phone while driving
Drive without wearing your helmet
Can drive after 2 cans of beer
Drive through a red light on purpose
Drive while feeling very sleepy
Speeding on the road
Unacceptable at all Unacceptable partially Acceptable Very Acceptable Extremely Acceptable Don't want to answer

Transportation Research Institute (IMOB) 29
Figure 11 How often have you done YOURSELF the following things
Figure 12 How often have you done OTHER drivers doing the following things
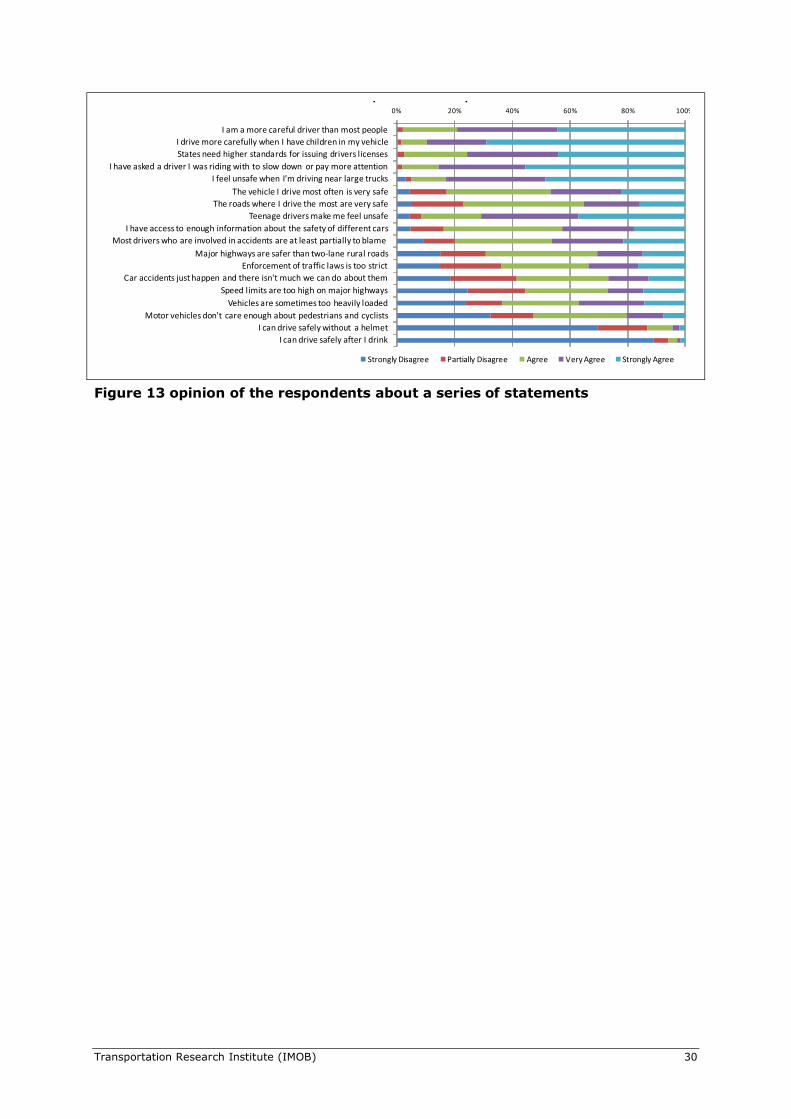
Also the following statements support the results as described above. The interviewees consider themselves as careful and they know about the risks. Questions that are related to the behavior of other types road users and infrastructure don’t show such a strong division between agree or not agree.
0% 10% 20% 30% 40% 50% 60% 70% 80% 90% 100%
Drive while feeling very sleepy
Drive through a red light on purpose
Did drive after 2 cans of beer
Drive without driving license
Give the priority to the modern car
Tailgated another vehicle
Speeding on the road
Drive without wearing your helmet
Become extremely angry at something that another driver did
Talk on a cell phone while driving
Take passengers on your motorcycle without wearing their helmet
Never Rarely Sometimes Often Very Often Don't want to answer
0% 20% 40% 60% 80% 100%
Drive while feeling very sleepy
Drive through a red light on purpose
Did drive after 2 cans of beer
Drive without driving license
Give the priority to the modern car
Tailgated another vehicle
Speeding on the road
Drive without wearing your helmet
Become extremely angry at something that another driver did
Talk on a cell phone while driving
Take passengers on your motorcycle without wearing their helmet
Never Rarely Sometimes Often Very Often Don't want to answer
Transportation Research Institute (IMOB) 30
Figure 13 opinion of the respondents about a series of statements
0% 20% 40% 60% 80% 100%
I am a more careful driver than most people
I drive more carefully when I have children in my vehicle
States need higher standards for issuing drivers licenses
I have asked a driver I was riding with to slow down or pay more attention
I feel unsafe when I'm driving near large trucks
The vehicle I drive most often is very safe
The roads where I drive the most are very safe
Teenage drivers make me feel unsafe
I have access to enough information about the safety of different cars
Most drivers who are involved in accidents are at least partially to blame
Major highways are safer than twolane rural roads
Enforcement of traffic laws is too strict
Car accidents just happen and there isn't much we can do about them
Speed limits are too high on major highways
Vehicles are sometimes too heavily loaded
Motor vehicles don't care enough about pedestrians and cyclists
I can drive safely without a helmet
I can drive safely after I drink
Opinon of the respondent about a series of statements
Strongly Disagree Partially Disagree Agree Very Agree Strongly Agree
Transportation Research Institute (IMOB) 31
Appendix 2: DESCRIPTIVE STATISTICS HELMET SURVEY
Background variables
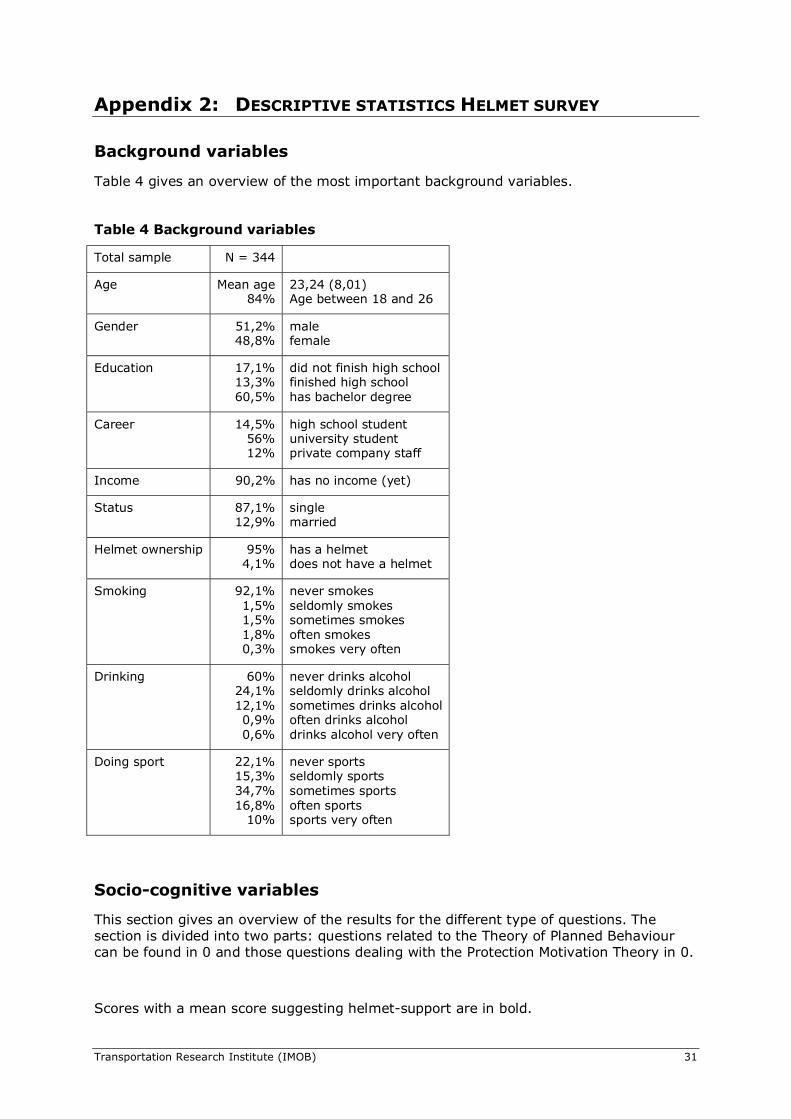
Table 4 gives an overview of the most important background variables.
Table 4 Background variables
Total sample N = 344
Age Mean age 84%
23,24 (8,01) Age between 18 and 26
Gender 51,2% 48,8%
male female
Education 17,1% 13,3% 60,5%
did not finish high school finished high school has bachelor degree
Career 14,5% 56% 12%
high school student university student private company staff
Income 90,2% has no income (yet)
Status 87,1% 12,9%
single married
Helmet ownership 95% 4,1%
has a helmet does not have a helmet
Smoking 92,1% 1,5% 1,5% 1,8% 0,3%
never smokes seldomly smokes sometimes smokes often smokes smokes very often
Drinking 60% 24,1% 12,1% 0,9% 0,6%
never drinks alcohol seldomly drinks alcohol sometimes drinks alcohol often drinks alcohol drinks alcohol very often
Doing sport 22,1% 15,3% 34,7% 16,8%
10%
never sports seldomly sports sometimes sports often sports sports very often
Socio-cognitive variables
This section gives an overview of the results for the different type of questions. The section is divided into two parts: questions related to the Theory of Planned Behaviour can be found in 0 and those questions dealing with the Protection Motivation Theory in 0.
Scores with a mean score suggesting helmet-support are in bold.
Transportation Research Institute (IMOB) 32
� Positive: score > 2.5 (bold)
� Negative: score < 2,5 (bold)
Theory of Planned Behaviour
In this section we give an overview per variable of the different answers and a short interpretation afterwards.
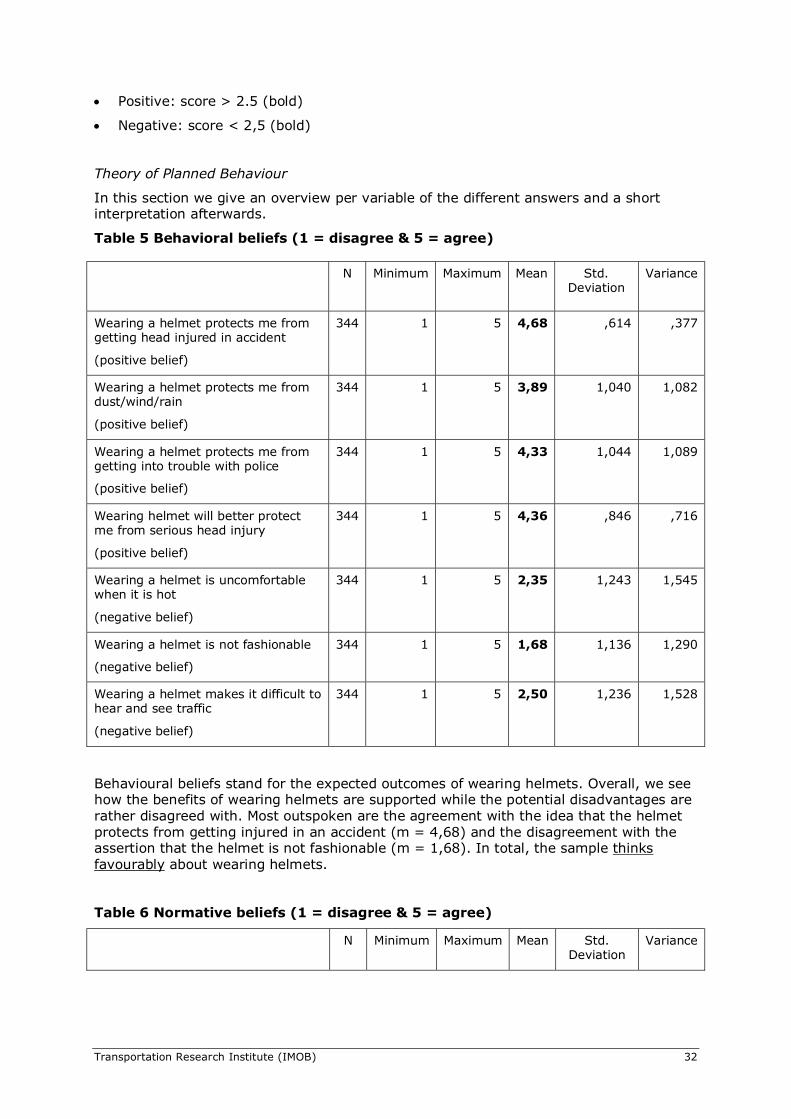
Table 5 Behavioral beliefs (1 = disagree & 5 = agree)
Behavioural beliefs stand for the expected outcomes of wearing helmets. Overall, we see how the benefits of wearing helmets are supported while the potential disadvantages are rather disagreed with. Most outspoken are the agreement with the idea that the helmet protects from getting injured in an accident (m = 4,68) and the disagreement with the assertion that the helmet is not fashionable (m = 1,68). In total, the sample thinks favourably about wearing helmets.
Table 6 Normative beliefs (1 = disagree & 5 = agree)
N Minimum Maximum Mean Std. Deviation
Variance
N Minimum Maximum Mean Std. Deviation
Variance
Wearing a helmet protects me from getting head injured in accident
(positive belief)
344 1 5 4,68 ,614 ,377
Wearing a helmet protects me from dust/wind/rain
(positive belief)
344 1 5 3,89 1,040 1,082
Wearing a helmet protects me from getting into trouble with police
(positive belief)
344 1 5 4,33 1,044 1,089
Wearing helmet will better protect me from serious head injury
(positive belief)
344 1 5 4,36 ,846 ,716
Wearing a helmet is uncomfortable when it is hot
(negative belief)
344 1 5 2,35 1,243 1,545
Wearing a helmet is not fashionable
(negative belief)
344 1 5 1,68 1,136 1,290
Wearing a helmet makes it difficult to hear and see traffic
(negative belief)
344 1 5 2,50 1,236 1,528

Transportation Research Institute (IMOB) 33
My parents think that I should never drive without wearing a helmet
341 1 5 4,12 1,099 1,208
My friends think that I should never drive without wearing a helmet
339 1 5 2,92 1,397 1,952
My husband/wife think that I should never drive without wearing a helmet
286 1 5 4,26 1,115 1,243
Most Cambodian people consider it is advisable to wear a helmet
342 2 5 4,64 ,700 ,490
Normative beliefs stand for what the individual subject supposes important reference groups think about wearing helmets. In general, the sample thinks important reference groups support the use of helmets. Interestingly however, respondents rather disagree with the statement that their friends think one should never drive without the helmet (m = 2,92). This indicates less support for the helmet among peers.
Since the majority of the sample contains adolescents as well as young adults and prior research finds peer pressure in particular to be most influential during these stages of development, this might be a potential barrier towards the promotion of helmets.
The overall finding here is that, according to the subjects questioned, parents, partners and Cambodian society at large support the use of helmets while this is less the case for friends.
Yet, in order to gain insight into which particular reference group(s) can be expected to really have an impact on the individual, one should probe for the sample’s motivation to comply with the opinions of the different reference groups included in the study.
Table 7 Control beliefs (1 = hard to wear helmet & 5 = easy to wear helmet)
N Minimum Maximum Mean Std. Deviation
Variance
How hard is it for you to wear a helmet when only travelling a short distance
340 1 5 2,49 1,388 1,926
How hard is it for you to wear a helmet when driving slowly
342 1 5 3,05 1,358 1,845
How hard is it for you to wear a helmet when it is hot
342 1 5 4,01 1,071 1,147
How hard is it for you to wear a helmet when driving at night
340 1 5 2,67 1,502 2,257
How hard is it for you to wear a helmet when you are in a hurry
342 1 5 3,94 1,140 1,299
How hard is it for you to wear a helmet when you are dressed up for going out
340 1 5 2,70 1,411 1,991
How hard is it for you to wear a helmet when driving in the city
341 1 5 3,71 1,101 1,211
Transportation Research Institute (IMOB) 34
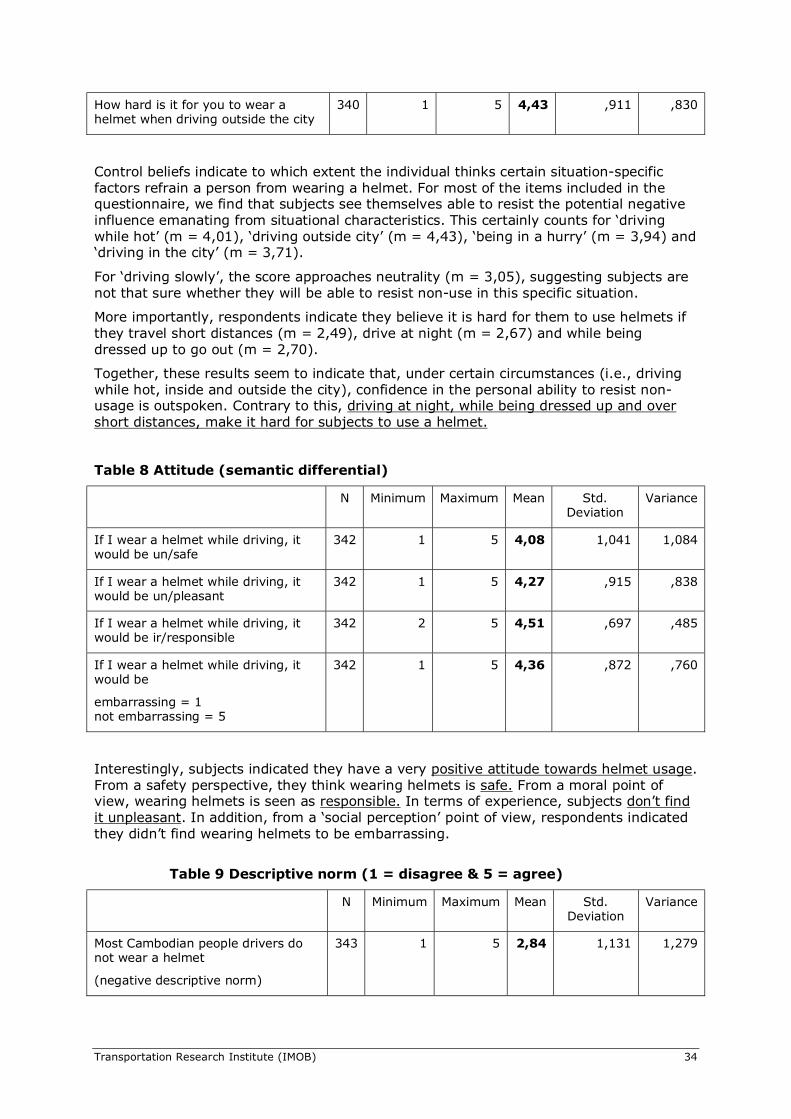
How hard is it for you to wear a helmet when driving outside the city
340 1 5 4,43 ,911 ,830
Control beliefs indicate to which extent the individual thinks certain situation-specific factors refrain a person from wearing a helmet. For most of the items included in the questionnaire, we find that subjects see themselves able to resist the potential negative influence emanating from situational characteristics. This certainly counts for ‘driving while hot’ (m = 4,01), ‘driving outside city’ (m = 4,43), ‘being in a hurry’ (m = 3,94) and ‘driving in the city’ (m = 3,71).
For ‘driving slowly’, the score approaches neutrality (m = 3,05), suggesting subjects are not that sure whether they will be able to resist non-use in this specific situation.
More importantly, respondents indicate they believe it is hard for them to use helmets if they travel short distances (m = 2,49), drive at night (m = 2,67) and while being dressed up to go out (m = 2,70).
Together, these results seem to indicate that, under certain circumstances (i.e., driving while hot, inside and outside the city), confidence in the personal ability to resist non-usage is outspoken. Contrary to this, driving at night, while being dressed up and over short distances, make it hard for subjects to use a helmet.
Table 8 Attitude (semantic differential)
N Minimum Maximum Mean Std. Deviation
Variance
If I wear a helmet while driving, it would be un/safe
342 1 5 4,08 1,041 1,084
If I wear a helmet while driving, it would be un/pleasant
342 1 5 4,27 ,915 ,838
If I wear a helmet while driving, it would be ir/responsible
342 2 5 4,51 ,697 ,485
If I wear a helmet while driving, it would be
embarrassing = 1 not embarrassing = 5
342 1 5 4,36 ,872 ,760
Interestingly, subjects indicated they have a very positive attitude towards helmet usage. From a safety perspective, they think wearing helmets is safe. From a moral point of view, wearing helmets is seen as responsible. In terms of experience, subjects don’t find it unpleasant. In addition, from a ‘social perception’ point of view, respondents indicated they didn’t find wearing helmets to be embarrassing.
Table 9 Descriptive norm (1 = disagree & 5 = agree)
N Minimum Maximum Mean Std. Deviation
Variance
Most Cambodian people drivers do not wear a helmet
(negative descriptive norm)
343 1 5 2,84 1,131 1,279

Transportation Research Institute (IMOB) 35
Drivers who wear a helmet are exceptions
(negative descriptive norm)
343 1 5 1,57 1,106 1,223
Most of my friends and acquaintances do not wear a helmet
(negative descriptive norm)
341 1 5 2,49 1,298 1,686
My parents don't wear a helmet
(negative descriptive norm)
315 1 5 1,67 1,261 1,590
Most of my friends wear a helmet when driving in the city
(positive descriptive norm)
339 1 5 3,34 1,247 1,556
Most of my friends wear a helmet when driving outside the city
(positive descriptive norm)
336 1 5 4,08 1,080 1,167
Descriptive norm stands for what the individual thinks others’ opinion towards helmets is like, based on mere observation of their behaviour. Put differently it is an ‘inferred’ norm.
Items indicating important reference groups do not wear helmets were clearly disagreed with. In combination with that, items standing for a helmet-favourable descriptive norm were agreed with.
This implies that important reference groups (i.e., parents, friends, society at large) are reported to use helmets while driving and that, implicitly, it can be assumed that for these reference groups, helmets are considered to be important.
Table 10 Personal norm (1 = disagree & 5 = agree)
N Minimum Maximum Mean Std. Deviation
Variance
I consider myself as someone who always wear a helmet
343 1 5 3,83 1,217 1,482
Not wearing a helmet makes me feel guilty
342 1 5 4,07 1,075 1,156
There is no excuse to not wear a helmet
338 1 5 3,92 1,219 1,486
Personal norm indicates whether morally, one accepts or rejects a person, object, issue, idea or event. Together, scores on items measuring this concept indicate a favourable personal norm towards helmets. Not wearing helmets makes subjects feel guilty (m = 4,07). In addition, they indicate there is in fact no excuse for not using helmets (m = 3,92) and that they see themselves as consistent helmet users (m = 3,83).
Thus, not only from a purely cognitive perspective, but also from a normative point of view, the sample questioned is positive towards wearing helmets.

Transportation Research Institute (IMOB) 36
Table 11 Subjective norm (1 = disagree & 5 = agree)
N Minimum Maximum Mean Std. Deviation
Variance
People who are important to me would want me to wear a helmet while driving
341 1 5 4,26 ,849 ,720
Subjective norm stands for the perceived pressure felt from important others. A mean score of 4,26 on this item indicates that there seems to be enough helmet-supportive influence going out from important reference groups.
Table 12 Perceived behavioural control - ability (1 = disagree & 5 = agree)
N Minimum Maximum Mean Std. Deviation
Variance
I believe I have the ability to wear a helmet
342 1 5 3,88 1,113 1,238
I can wear a helmet even if the other do not
342 1 5 4,14 1,008 1,016
I can wear a helmet even if there is no police on the street
342 1 5 3,94 1,205 1,451
As will become clear throughout the following section, exploratory principal component factor analysis found the concept ‘Perceived Behavioural Control’ to split up into two separate factors.
The first factor – ability – contains items that stand for the individual’s estimated confidence or ability to resist the eventual negative influence emanating from the driving context-related factors.
The values obtained for these items indicate the sample is quite confident in its ability to resist non-usage (m = 3,88), for instance, in case other drivers do not wear helmets (m = 4,14) or when there is no police on the street (m = 3,94). On the other hand does the sample also indicate that having more police on the street would stimulate them to wear a helmet more often (see Table 18).
Table 13 Perceive behavioural control - dependency (1 = disagree & 5 = agree)
N Minimum Maximum Mean Std. Deviation
Variance
Whether or not I wear a helmet during the next month is entirely up to me
339 1 5 3,72 1,282 1,645
Whether or not I wear a helmet depends on the circumstances, not on me
(reverse coded)
341 1 5 4,63 2,597 6,746

Transportation Research Institute (IMOB) 37
The second factor – dependency – within the ‘Perceived Behavioural Control’ construct, stands for the idea of helmet usage being dependent upon the individual itself (i.e., internal locus of control), or upon circumstances (i.e., external locus of control).
Scores for these items are quite interesting. On the one hand, subjects seem quite convinced of the idea that wearing helmets or not is entirely up to themselves (m = 3,72). However, the value obtained for the statement where it is posited that wearing helmets is mainly dependent upon the situational circumstances, is remarkably higher (m = 4,63)!
This seems to suggest that the sample questioned is (highly) sensitive to what the driving circumstances are and that the assessment of these situational conditions might be an essential component in choosing whether to wear the helmet or not.
Protection motivation theory and Health belief model
Table 14 Perceive vulnerability (1 = disagree & 5 = agree)
N Minimum Maximum Mean Std. Deviation
Variance
Wearing a helmet significantly increases the risk of getting involved into an accident
340 1 5 1,41 ,932 ,868
Not wearing a helmet in the city is very risky
341 1 5 3,87 1,165 1,358
Not wearing a helmet outside the city is very risky
341 1 5 4,08 1,106 1,223
How often do you worry about having a serious head injury without wearing a helmet?
340 1 5 4,07 1,033 1,066
Perceived vulnerability indicates to which extent subjects see themselves exposed to any potential risks related to not wearing helmets.
Results for this concept show that the sample studied is quite convinced of the fact that not wearing the helmet while driving implies an increased risk exposure. An interesting observation is that, even though the score for the item ‘not wearing a helmet in the city is very risky’ (m = 3,87) indicated agreement with this statement, it was somewhat lower than the values above 4, obtained for the other items.
Table 15 Perceive severity (1 = disagree & 5 = agree)
N Minimum Maximum Mean Std. Deviation
Variance
Being injured in an accident due to not wearing a helmet could leads to long-term health problems, costs and income losses
342 1 5 4,38 ,851 ,724
My whole life might change due to not wearing a helmet
342 1 5 4,30 ,856 ,733

Transportation Research Institute (IMOB) 38
Perceived severity represents the gravity of consequences following helmet non-usage while driving. Respondents clearly recognize that driving without helmets may cause serious problems in terms of health, finances and quality of life.
Table 16 Response cost (1 = disagree & 5 = agree)
N Minimum Maximum Mean Std. Deviation
Variance
Buying and storing a helmet costs me too much money
341 1 5 2,54 1,223 1,496
Buying a high quality helmet is too expensive to me
342 1 5 4,13 1,044 1,090
Response cost refers to the implicit cost for the individual related to implementing a safety measure (in this case, using the helmet). This cost is not necessarily financial, but can be understood in terms of invested time or effort as well.
Although subjects indicated buying and storing helmets is not too costly, they agreed openly with the statement that buying a high quality helmet was too expensive (m = 4,13)!
Table 17 Cues to action buying a helmet (1 = disagree & 5 = agree)
N Minimum Maximum Mean Std. Devevation
Variance
Providing a good quality helmet at subsidized cost would stimulate me to buy that helmet
342 1 5 4,42 ,764 ,584
Suppose the government would set a standard for a high quality helmet, would you be willing to spend more money to buy a better helmet
338 1 5 3,94 1,056 1,116
Some questions were asked in relation with the protection motivation theory. ‘Cues to action’ is considered as one of the key background questions as it deals with the intentions to purchase or wear a helmet. Table 17 and Table 18 show that both questions suggest an encouragement to buy a helmet as the mean is positive.
Table 18 Cues to action wearing helmets (1 = disagree & 5 = agree)
N Minimum Maximum Mean Std. Deviation
Variance
More traffic police enforcing the helmet law would stimulate me to wear a helmet more often
342 1 5 4,38 ,840 ,705
Higher fines for violating the helmet law would stimulate me to wear a helmet more often
342 1 5 4,47 ,905 ,819
If more people would wear a helmet, then I would also wear a helmet more often
342 1 5 4,32 ,854 ,730

Transportation Research Institute (IMOB) 39
Cues to action can be described as factors of which subjects believe that they might be effective in encouraging and/or facilitating the use of helmets.
Respondents agreed with the idea that more police enforcement (m = 4,38), higher fines (m = 4,47) and more people wearing helmets (m = 4,32) would be effective in stimulating the use of helmets.
Table 19 Behavioural intentions (1 = disagree & 5 = agree)
N Minimum Maximum Mean Std. Deviation
Variance
I intend to wear the helmet the next time I drive my motorcycle
341 1 5 4,11 1,000 ,999
My intention from now on to never drive without wearing helmet is very large
342 1 5 4,29 ,853 ,728
I am willing to wear a helmet more often in the future
338 1 5 4,29 ,867 ,751
Overall, the sample expresses favourable intentions to wear the helmet while driving with mean scores between 4,11 and 4,29.
Table 20 Behaviour (1 = disagree & 5 = agree)
N Minimum Maximum Mean Std. Deviation
Variance
How often do you wear a helmet when you drive in the city?
341 1 5 3,70 1,116 1,244
How often do you wear a helmet when you drive outside the city?
339 1 5 4,38 ,913 ,834
How often do you wear a helmet in general?
339 1 5 4,04 ,999 ,998

Transportation Research Institute (IMOB) 40
Appendix 3: INFERENTIAL STATISTICS
Concept structure and reliability
boxes = unacceptable values
boxes = marginally acceptable values
boxes = acceptable values
CONCEPTS Cronbach’s alpha Variance explained
Behavioural beliefs (positive) .59 45,00%
Behavioural beliefs (negative) .60 55,81%
Normative beliefs .58 45,29%
Control beliefs .85 49,80%
Attitude .84 67,60%
Descriptive norm (positive) .74 21,20%
Descriptive norm (negative) .54 36,48%
Personal norm .56 53,38%
Subjective norm 1 item 1 item
Perceived Behavioural Control (Ability) .88 81,04%
Perceived Behavioural Control (Dependence) .28 58,22%
Perceived vulnerability* .70 63,67%
Perceived severity .73 78,49%
Response cost .35 60,44%
Cues to action .80 71,69%
Behavioural intentions .90 82,82%
Behaviour .85 77,10%
* The item ‘wearing helmet significantly increases risk of getting involved into an accident’ was dropped
Cut off Cronbach’s alpha .64. Dit type onderzoek, variantie boven 50%
Comparison of subgroups (t-tests) Males vs. Females
In order to find out whether significant differences could be found between males and females in terms of mean values on the different variables questioned, an independent

Transportation Research Institute (IMOB) 41
sample t-test was performed, on the mean values obtained for the different concepts questioned
CONCEPTS MALES
(n = 172)
FEMALES
(n = 164)
p
Behavioural beliefs (positive) - - n.s.
Behavioural beliefs (negative) - - n.s.
Normative beliefs - - n.s.
Control beliefs 3,27 3,49 .023
Attitude 4,22 4,41 .017
Descriptive norm (positive) - - n.s.
Descriptive norm (negative) 2,27 2,05 .015
Personal norm - - n.s.
Subjective norm 4,11 4,43 .000
Perceived behavioural control (ability) 3,82 4,28 .001
Perceived behavioural control (dependency) - - n.s.
Perceived vulnerability 3,90 4,14 .009
Perceived severity - - n.s.
Response cost - - n.s.
Cues to action - - n.s.
Behavioural intentions 4,12 4,36 .010
Behaviour 3,87 4,21 .000
n.s. = ‘not significant’
Some interesting differences in function of gender could be detected. Overall, female subjects are more favourably disposed towards helmet usage than males. More in detail, we find that:
� Females more than males, think it is easy to wear the helmet under various situational conditions.
� Females have a more favourable attitude towards helmet usage than males. � Females more than males, observe important reference groups to wear helmets, on
the basis of which it can be inferred that those referents support helmet usage. � Females more than males experience helmet-supportive pressure from important
reference groups. � Females, more than males, report they are confident/able to wear helmets under
various situational conditions. � Females, more than males, think they are vulnerable to risks associated with helmet
non-usage. � Females report higher intentions to wear helmets in the future than males.
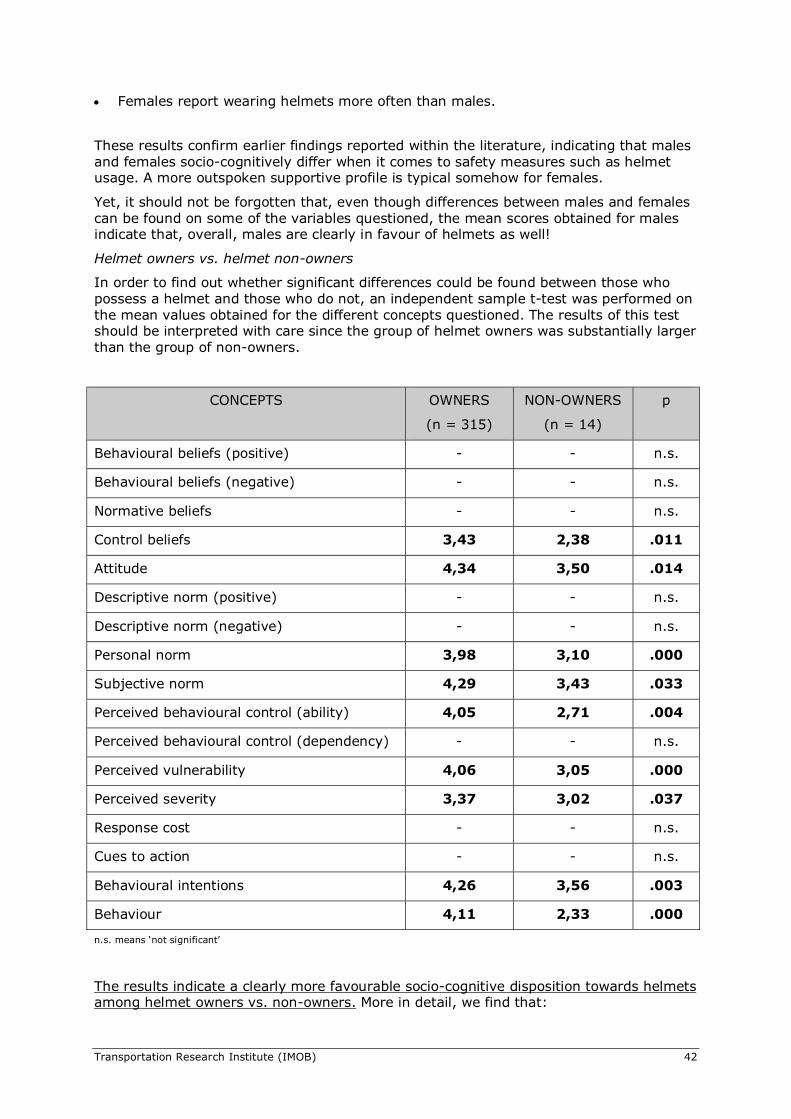
Transportation Research Institute (IMOB) 42
� Females report wearing helmets more often than males.
These results confirm earlier findings reported within the literature, indicating that males and females socio-cognitively differ when it comes to safety measures such as helmet usage. A more outspoken supportive profile is typical somehow for females.
Yet, it should not be forgotten that, even though differences between males and females can be found on some of the variables questioned, the mean scores obtained for males indicate that, overall, males are clearly in favour of helmets as well!
Helmet owners vs. helmet non-owners
In order to find out whether significant differences could be found between those who possess a helmet and those who do not, an independent sample t-test was performed on the mean values obtained for the different concepts questioned. The results of this test should be interpreted with care since the group of helmet owners was substantially larger than the group of non-owners.
CONCEPTS OWNERS
(n = 315)
NON-OWNERS
(n = 14)
p
Behavioural beliefs (positive) - - n.s.
Behavioural beliefs (negative) - - n.s.
Normative beliefs - - n.s.
Control beliefs 3,43 2,38 .011
Attitude 4,34 3,50 .014
Descriptive norm (positive) - - n.s.
Descriptive norm (negative) - - n.s.
Personal norm 3,98 3,10 .000
Subjective norm 4,29 3,43 .033
Perceived behavioural control (ability) 4,05 2,71 .004
Perceived behavioural control (dependency) - - n.s.
Perceived vulnerability 4,06 3,05 .000
Perceived severity 3,37 3,02 .037
Response cost - - n.s.
Cues to action - - n.s.
Behavioural intentions 4,26 3,56 .003
Behaviour 4,11 2,33 .000
n.s. means ‘not significant’
The results indicate a clearly more favourable socio-cognitive disposition towards helmets among helmet owners vs. non-owners. More in detail, we find that:

Transportation Research Institute (IMOB) 43
� Owners more than non-owners, think it is easy to wear the helmet under various situational conditions.
� Owners have a more favourable attitude towards helmet usage than non-owners. � Owners more than non-owners personally feel a normative/moral pressure to make
use of helmets. � Owners more than non-owners experience helmet-supportive pressure from
important reference groups. � Owners, more than non-owners, report they are confident/able to wear helmets
under various situational conditions. � Owners, more than non-owners, think they are vulnerable to risks associated with
helmet non-usage. � Owners more than non-owners think the potential consequences of not using helmets
are severe. � Owners report higher intentions to wear helmets in the future than non-owners. � Owners report wearing helmets more often than non-owners.
Interestingly, the possession of a helmet itself seems to be associated with an overall more favourable disposition towards helmets. However, from an explanatory perspective, one should be cautious in formulating the underlying mechanism that explains this association.
That is, the possession of helmets might be explained as the result of a favourable disposition towards helmets. For instance, an individual purchases a helmet because s/he thinks it is an effective means to protect oneself against head injuries. This explanation is in line with classical Theory of Planned Behaviour where, in simple terms, ‘thinking determines behaviour’.
Another possibility however, might be that possessing helmets simply leads to a favourable disposition towards helmet usage. That is, a person owning a helmet might (unconsciously) be stimulated to use it while driving, because, otherwise, why would s/he possess a helmet? This explanation is in line with so-called Cognitive Dissonance Theory or Self-Perception Theory where ‘behaviour determines our thinking’.
Correlations
boxes = weak association
boxes = moderate association
boxes = strong association
= strongest association with one of the target variables
Behavioural intentions
Behaviour
Behavioural beliefs (positive) .34** .25**
Behavioural beliefs (negative) n.s. -.23**
Normative beliefs .41** .36**
Control beliefs .55** .80**
Attitude .70** .65**

Transportation Research Institute (IMOB) 44
Descriptive norm (positive) .33** .45**
Descriptive norm (negative) -.12* -.23**
Personal norm .59** .59**
Subjective norm .50** .47**
Perceived Behavioural Control (Ability) .77** .78**
Perceived Behavioural Control (Dependence)
.20** .13*
Perceived vulnerability .51** .58**
Perceived severity .42** .38**
Response cost n.s. n.s.
Cues to action .41** .30**
Behavioural intentions - .66**
n.s. means ‘not significant’
* correlation is significant at the 0.05 level
** correlation is significant at the 0.01 level
Firstly, correlations show us that most of the variables included in the questionnaire have statistically significant relationships with the target variables, i.e., behavioural intentions and behaviour. Only 1 out of 16 variables (i.e., response cost) could not be significantly associated with intentions and behaviour. For negative behavioural beliefs, no statistically significant correlation could be found when focussing on behaviour.
Interestingly from a theoretical point of view is that the variables belonging to the Theory of Planned Behaviour overall performed better than the variables pertaining to Protection Motivation Theory. This is in line with earlier findings reported within the literature.
In terms of size, 7 out of 16 variables are strongly associated with the outcome variables while an additional 5 constructs maintain moderate relationships with intentions and behaviour. 4 variables could only be weakly correlated with intentions and behaviour.
5 variables (i.e., control beliefs, attitude, personal norm, perceived behavioural control (ability) and perceived vulnerability) even had statistically significant and strong correlations with both intentions and behaviour.
The strongest correlation with behavioural intentions (r = .77**) was found for perceived behavioural control (ability). Further completing the top 3, we find attitude (r = .70**) and personal norm (r = .59**). The strongest correlation with behaviour was found for control beliefs (r = .80**), followed by perceived behavioural control (ability) (r = .78**) with behavioural intentions (r = .66**) and attitude (r = .65**) closely at third stake.
Together, the pattern of correlations we find for behavioural intentions is roughly in line with the structural assumptions underlying the Theory of Planned Behaviour: behavioural intentions are most strongly associated with (some) of its most proximal determinants, i.e., perceived behavioural control (ability), attitude and personal norm.
For behaviour however, we find that control beliefs (traditionally believed to be a distal variable) perform slightly better than behaviour’s most proximal variables, i.e., perceived behavioural control (ability) and behavioural intentions. Also, we find a strong significant relationship between behaviour and attitude while originally, the theory predicts the influence of attitudes to be mediated by intentions.

Transportation Research Institute (IMOB) 45
Importantly, the fact that the Theory of Planned Behaviour seems to perform well, suggests somehow that using helmets (or not) is a reasoned action, driven by conscious deliberation, rather than being some kind of unconscious automatism.
Put differently, when individuals plan to travel by bike (or motorcycle), wearing the helmet (or not) is a decision they take instead of being an automatically performed habit.
Therefore, in line with current research on highly repetitive behaviours (such as using seatbelts, choosing transport mode when going to work, etc.) we think helmet usage for this sample can be explained best as a constant recycling of a previously formed intention without the whole reasoning behind the intention itself being performed over and over again.
Interestingly, the results of the correlation analysis clearly indicate that it is mostly the situational context that steers the sample’s decision to wear helmets or not. Notice that the strongest correlations with intentions and behaviour have been established for control beliefs and perceived behavioural control (ability) and that, contrary to other variables within the Theory of Planned Behaviour, both these variables indeed stand for the potential influence emanating from context-related factors!
Regressions First, all the socio-cognitive concepts were entered as independent variables into a stepwise regression with behavioural intentions and behaviour as dependent variables.
Behavioural intentions
� Adjusted R2 = .66 � This means 66% of the variance in the dependent variable could be explained by
Perceived Behavioural Control (ability), Attitude and Personal Norms.
Model
Unstandardized Coefficients
Standardized Coefficients
t Sig. B Std. Error Beta (Constant) ,626 ,198 3,160 ,002 Perceived Behavioural Control (Ability)
,412 ,055 ,472 7,498 ,000
Attitude
,320 ,071 ,279 4,491 ,000
Personal Norms ,144 ,049 ,145 2,958 ,003
Behaviour
� Adjusted R2 = .72 � This means 72% of the variance in the dependent variable could be explained by
Control Beliefs, Perceived Behavioural Control (ability), Perceived Vulnerability and Personal Norms.
Model Unstandardized Coefficients
Standardized Coefficients
t Sig.
B Std. Error Beta (Constant) ,179 ,175 1,025 ,306 Control Beliefs
,482 ,047 ,462 10,234 ,000
Perceived Behavioural Control (Ability)
,251 ,049 ,274 5,105 ,000

Transportation Research Institute (IMOB) 46
Perceived Vulnerability
,155 ,040 ,157 3,876 ,000
Personal Norms ,144 ,045 ,138 3,167 ,002
Overall findings inferential statistics In general, the results of linear stepwise regressions indicate that the variables included into the questionnaire are highly relevant as predictors of both behavioural intentions (adjusted R2 = 66) and behaviour (adjusted R2 = 72).
Although correlation analyses indicated 11 variables could be significantly associated with behavioural intentions, stepwise regression shows 3 variables only sufficed to explain 66% of the variance in behavioural intentions. This suggests that the explanation and prediction of behavioural intentions is determined by a very specific and precise subset of variables, i.e., 1) perceived behavioural control (ability), 2) attitude and 3) personal norm.
The same counts for modelling behaviour. Correlation analysis found 11 significant associations while stepwise regression identifies 4 variables that explain 72% of the variance in behaviour, i.e., control beliefs, perceived behavioural control (ability), perceived vulnerability and personal norm.
Interesting from a formal perspective is that the basic hierarchical structure behind the Theory of Planned Behaviour is only partially confirmed in the sample studied here. A first finding is that neither descriptive norm, nor subjective norm influence behavioural intentions. A second rather unexpected finding is that there is no significant effect found for behavioural intentions towards behaviour, while this is one of the primary hypotheses underlying the theory! In support of our findings however, it should be mentioned that such a ‘missing link’ has been found by several other empirical studies within the literature before and therefore, should not be considered as an abnormal outcome. A third interesting finding is that behaviour was found to be determined predominantly by control beliefs, even though the theory considers the effect of ‘beliefs’ to be mediated by more proximal determinants of behaviour. Again however, we add to this that comparable results are not exceptional and have been reported before within the literature.
A fourth important conclusion that can be drawn from these results, is that the choice to wear helmets (or not) appears to be based on a decision rather than being an automatism. Even though the underlying reasoning is not gone through in every single case where such a decision has to be made, this leaves open some interesting opportunities in terms of education and prevention. We’ll come back on this later on.
Behavioural intentions
Behavioural intentions are determined predominantly by perceived behavioural control (ability). This means that the individual’s perceived confidence in being able to resist negative influences from the situational driving context is the most important factor in deciding whether or not one will use the helmet. The results for control beliefs indicate that some of these situational characteristics indeed appear to be problematic while others are not (or less).
More in detail, we found driving at short distances, at night and while being dressed up for going out to be contexts where the temptation to refrain from using helmets is particularly high.
Since the individual’s perceived ability to cope with problematic situational context factors is the most important determinant of the intentions to use helmets, finding out which situational contexts are believed to be problematic in terms of ‘coping ability’ is a factor of crucial importance for the development of effective interventions where the focus is on stimulating favourable intentions towards using helmets.
Transportation Research Institute (IMOB) 47
Besides perceived behavioural control (ability), attitude towards using helmets is the second most important determinant of behavioural intentions. Positive attitudes imply being more motivated to use helmets while driving. Results for attitude indicated that the attitude itself is clearly a favourable one.
The third determinant of behavioural intentions was personal norm. The more one is convinced of the fact that wearing helmets is in fact a (moral) obligation, the more one will be motivated to use the helmet while driving. I line with results for attitude, the sample’s personal norm towards helmets is positive.
To summarize, if the objective is to stimulate the target sample’s intentions to always wear helmets while driving, policy and practitioners should maximize subjects’ ability to resist certain situational context factors (i.e., driving at night, short distances and while being dressed up). In addition to that, policy makers and program developers should confirm, support and strengthen the positive attitude and personal norm towards helmet usage which are already present in the sample.
Behaviour
Helmet usage itself is mostly determined by the variable labelled ‘control beliefs’. In fact, the effect of control beliefs even surpasses the impact generated by perceived behavioural control (ability), which is based on control beliefs.
This means that the use of helmets is based more on the cognitive assessment of situational factors (i.e., control beliefs), rather than on the perceived ability to cope with these situational characteristics which is derived from the cognitive assessment itself.
To explain this a little bit further, so-called control beliefs are to be seen as the result of a cognitive assessment of the driving situation. By cognitive assessment, we mean the individual makes a rational evaluation of the driving conditions. This rational evaluation typically takes into account situation-specific elements such as ‘the risk inherent to the situation’ and ‘the personal vulnerability inherent to the situation’. If a person thinks a specific situation (for instance driving at night) is not dangerous and that s/he is not vulnerable to danger, the resulting (control) ‘belief’ will be that wearing a helmet becomes less probable. It is this decline of usage probability that leads to a lower score on ‘perceived behavioural control (ability)’. In other words, if one thinks helmet wearing while driving at night is less probable, one will be less confident in wearing a helmet. Normally, this lowered ability results in lower intentions and, finally, lower helmet usage.
However, as already indicated, we find that helmet usage is not primarily determined by intentions or perceived behavioural control (ability), but by the belief that helmet usage is less probable. Since this belief is a function of the risk and vulnerability assessment of the situation at hand (for instance, driving at night), it is these two factors (i.e., risk and vulnerability perception of driving at night) that should be addressed by policy makers and program developers, rather than focussing on the personal ability to cope with the belief that using helmets while driving at night is not really necessary or dangerous.
The fact that perceived vulnerability of not using helmets while driving ‘in general’, is found to be significantly associated with helmet usage itself, subscribes the above reasoning. The important difference however that has to be made, is the one between perceived vulnerability of driving without a helmet in general on the one hand, and driving without a helmet in a specific driving situation (such as ‘at night’, ‘for short distance only’ or ‘when dressed up’) on the other.
While this sample indicated their personal vulnerability for driving in general to be quite high, we strongly believe that they see themselves as much less vulnerable to danger when driving at night, while being dressed up or for short distances only. Again, it is these situation-specific risk and vulnerability perceptions that need to change.
Furthermore, and in line with behavioural intentions, personal norms were found to be a significant determinant of helmet usage itself. The more one feels obligated to wear helmets, the higher the chance that one will effectively wear a helmet.

Transportation Research Institute (IMOB) 48
To end with, the finding that intentions do not have a significant effect on behaviour are not abnormal! This simply means that, for the sample questioned, using helmets or not is rather related to underestimating situation-related risk and vulnerability as well as being able to resist the tendency not to use helmets based on such underestimation, rather than being motivated to use helmets as such.
In summary, helmet usage is dependent mostly upon the believed probability that one will wear a helmet or not in a certain situation. The latter in turn is highly dependent upon the perceived risk and vulnerability one associates with a specific driving situation. Next to that, but to a much lesser extent, helmet usage is determined by the individual’s perceived ability to resist to the tendency of not using the helmet in a situation that is believed to be less dangerous. Perceived vulnerability for driving without a helmet IN GENERAL is also found to be related to helmet usage. Finally, the personally felt obligation to wear helmets is another significant determinant of behaviour.

�����������������������������������������������������������������������������������������������������������������������������������������������������������������������������������������������������������������