socioeconomic position and first-time major cardiovascular
TRANSCRIPT

University of Southern Denmark
Socioeconomic position and first-time major cardiovascular event in patients with type 2diabetesa Danish nationwide cohort studyFalkentoft, Alexander C; Zareini, Bochra; Andersen, Julie; Wichmand, Charlotte; Hansen,Tina B; Selmer, Christian; Schou, Morten; Gæde, Peter Haulund; Staehr, Peter Bisgaard;Hlatky, Mark A; Torp-Pedersen, Christian; Gislason, Gunnar H; Gerds, Thomas Alexander;Bruun, Niels E; Ruwald, Anne-ChristinePublished in:European Journal of Preventive Cardiology
DOI:10.1093/eurjpc/zwab065
Publication date:2021
Document version:Final published version
Document license:CC BY-NC
Citation for pulished version (APA):Falkentoft, A. C., Zareini, B., Andersen, J., Wichmand, C., Hansen, T. B., Selmer, C., Schou, M., Gæde, P. H.,Staehr, P. B., Hlatky, M. A., Torp-Pedersen, C., Gislason, G. H., Gerds, T. A., Bruun, N. E., & Ruwald, A-C.(2021). Socioeconomic position and first-time major cardiovascular event in patients with type 2 diabetes: aDanish nationwide cohort study. European Journal of Preventive Cardiology, 28(16), 1819-1828.https://doi.org/10.1093/eurjpc/zwab065
Go to publication entry in University of Southern Denmark's Research Portal
Terms of useThis work is brought to you by the University of Southern Denmark.Unless otherwise specified it has been shared according to the terms for self-archiving.If no other license is stated, these terms apply:
• You may download this work for personal use only. • You may not further distribute the material or use it for any profit-making activity or commercial gain • You may freely distribute the URL identifying this open access versionIf you believe that this document breaches copyright please contact us providing details and we will investigate your claim.Please direct all enquiries to [email protected]
Download date: 03. Apr. 2022
Socioeconomic position and first-time major
cardiovascular event in patients with type 2
diabetes: a Danish nationwide cohort study
Alexander C. Falkentoft 1*, Bochra Zareini 2, Julie Andersen 3,
Charlotte Wichmand1, Tina B. Hansen1,4, Christian Selmer 5, Morten Schou 2,
Peter Haulund Gæde6, Peter Bisgaard Staehr7, Mark A. Hlatky 8,
Christian Torp-Pedersen9,10, Gunnar H. Gislason 2,3,
Thomas Alexander Gerds 3,11, Niels E. Bruun 1,12, and
Anne-Christine Ruwald 1,2
1Department of Cardiology, Zealand University Hospital, University of Copenhagen, Sygehusvej 10, 4000 Roskilde, Denmark; 2Department of Cardiology, Herlev-GentofteHospital, University of Copenhagen, Gentofte, Denmark; 3The Danish Heart Foundation, Copenhagen, Denmark; 4Department of Regional Health Research, University ofSouthern Denmark, Odense, Denmark; 5Department of Endocrinology, Bispebjerg and Frederiksberg Hospital, University of Copenhagen, Copenhagen, Denmark; 6Departmentof Endocrinology, Regional Hospital, Slagelse, Denmark; 7Department of Cardiology, North Denmark Regional Hospital, Hjørring, Denmark; 8Department of Medicine, StanfordUniversity School of Medicine, Stanford, CA, USA; 9Department of Cardiology, Nordsjaellands Hospital, Hillerød, Denmark; 10Department of Cardiology, Aalborg UniversityHospital, Aalborg, Denmark; 11Section of Biostatistics, Department of Public Health, University of Copenhagen, Copenhagen, Denmark; and 12Departments of Clinical Medicine,Faculty of Health and Medical Sciences, Copenhagen and Aalborg Universities, Denmark
Received 15 January 2021; revised 22 March 2021; editorial decision 3 April 2021; accepted 8 April 2021
Aims The association between socioeconomic position and cardiovascular disease has not been well studied in patientswith type 2 diabetes. We aimed to examine the association between socioeconomic position and first-time majoradverse cardiovascular events (MACE) in patients with type 2 diabetes.
...................................................................................................................................................................................................Methodsand results
Through the Danish nationwide registers, we identified all residents with newly diagnosed type 2 diabetes between2012 and 2017. Based on sex-stratified multivariable cause-specific Cox regression models, we calculated thestandardized absolute 5-year risk of the composite outcome of first-time myocardial infarction, stroke, orcardiovascular mortality (MACE) according to income quartiles. A total of 57 106 patients with type 2 diabeteswere included. During 155 989 person years, first-time MACE occurred in 2139 patients. Among both men andwomen, income was inversely associated with the standardized absolute 5-year risk of MACE. In men, the 5-yearrisk of MACE increased from 5.7% [95% confidence interval (CI) 4.9–6.5] in the highest income quartile to9.3% (CI 8.3–10.2) in the lowest income group, with a risk difference of 3.5% (CI 2.4–4.7). In women, the risk ofMACE increased from 4.2% (CI 3.4–5.0) to 6.1% (CI 5.2–7.0) according to income level, with a risk difference of1.9% (CI 0.8–2.9).
...................................................................................................................................................................................................Conclusion Despite free access to medical care in Denmark, low-socioeconomic position was associated with a higher 5-year
risk of first-time MACE in patients with incident type 2 diabetes. Our results suggest prevention strategies couldbe developed specifically for patients with low-socioeconomic position.
� � � � � � � � � � � � � � � � � � � � � � � � � � � � � � � � � � � � � � � � � � � � � � � � � � � � � � � � � � � � � � � � � � � � � � � � � � � � � � � � � � � � � � � � � � � � � � � � � � � � � � � � � � � � � � � � � � � � � � � � � � � � � � � � � � � � � � � � � � � � � � � � � � � � � � � � � � � � � � � � � � � � � � � � � � � � � � � � � � � � � � � � � � � � � � � � � � � � � � � � � � � � � � � � � � � �
Keywords Type 2 diabetes • Cardiovascular disease • Socioeconomic position
* Corresponding author. Tel: þ45 509 08969, Email: [email protected] The Author(s) 2021. Published by Oxford University Press on behalf of the European Society of Cardiology.This is an Open Access article distributed under the terms of the Creative Commons Attribution-NonCommercial License (https://creativecommons.org/licenses/by-nc/4.0/),which permits non-commercial re-use, distribution, and reproduction in any medium, provided the original work is properly cited. For commercial re-use, please [email protected]
European Journal of Preventive Cardiology FULL RESEARCH PAPERdoi:10.1093/eurjpc/zwab065 Diabetes and Metabolic Syndrome
Dow
nloaded from https://academ
ic.oup.com/eurjpc/advance-article/doi/10.1093/eurjpc/zw
ab065/6283885 by Odense U
niverstetsbibliotek user on 14 October 2021
..
..
..
..
..
..
..
..
..
..
..
..
..
..
..
..
..
..
..
..
..
..
..
..
..
..
..
..
..
..
..
..
..
..
..
..
..
..
..
..
..
..
..
..
..
..
..
..
..
..
..
..
..
..
..
..
..
..
..
..
..
..
..
..
..
..
..
..
..
..
..
..
..
..
..
..
..
..
..
..
..
..
..
..
..
..
.Introduction
Patients with type 2 diabetes (T2D) have excess rates of adversecardiovascular outcomes and all-cause mortality, two-fold higherthan the general population.1,2 Identification of patients with T2D athigher risk of these events could help target primary prevention strat-egies and improve long-term outcomes.
Socioeconomic factors are known to affect health and, thus,socioeconomic position (i.e. an individual’s social position relative toother members of a society) may be a good marker of disadvantagedpatients.3 In high-income countries, low-socioeconomic positionhas consistently been associated with a higher incidence of T2D,4
myocardial infarction,5 and stroke.6 However, there is a paucity ofstudies investigating whether socioeconomic disparities in cardiovas-cular disease also exist in patients with T2D. Most of theavailable evidence suggest an inverse association with socioeconomicposition.7–11 Yet, the evidence is inconsistent.12,13 Further, priorstudies did not systematically account for confounders likecomorbidities,7 individual-level socioeconomic data,7,8 type or dur-ation of diabetes,7,11,12 or did not examine first-time cardiovascularevents.7–10,12,13 In addition, no large cohort study has investigated theassociation between socioeconomic position and cardiovascularevents in a contemporary population of patients with T2Dafter implementation of glycated haemoglobin (HbA1c) in thediagnostic criteria, emphasizing the need for updated research ofthis topic.14
In Denmark, the healthcare system offers free, equal, and universalaccess for all residents and, thus, provides a setting without the influ-ence of financial barriers in access to medical care. We aimed toexamine the association between socioeconomic position and first-time cardiovascular event in a Danish nationwide cohort of patientswith incident T2D.
Methods
Data sourcesWe conducted a nationwide cohort study using the registers in Denmarkwhere all residents are provided with a unique and personal civil registra-tion number that enables individual-level linkage of nationwide registers.In this study, we combined information from (i) the Danish NationalPatients Register that holds information on all admissions to hospitalssince 1977, and outpatient visits since 1995, coded according to theInternational Classification of Diseases (ICD)-8 from 1977 to 1993, andthe ICD-10 system since 199415; (ii) the Register of Medicinal ProductStatistics (the national prescription register) that holds information aboutall dispensed prescriptions since 1995 according to the anatomical thera-peutical chemical (ATC) classification system16; (iii) the Danish CivilRegistration System register that holds information on sex, date of birth,immigration, emigration, cohabitation status, and vital status17; (iv) theDanish Income Statistics Register with information on income18; (v) theDanish Student Register with information on highest attained educationallevel19; and (vi) the Danish Register of Causes of Death that holds infor-mation on causes of death from death certificates.
Study populationWe identified all Danish residents with incident diabetes between1 January 2012 and 31 December 2017. The date of diagnosis was defined
as the time of first redeemed prescription of an antidiabetic drug (ATCA10) or as the time of first registered code of diabetes as primary diagno-sis (ICD-10 codes E10–E14, O24, or H36.0), whichever came first. In theDanish registers, these two approaches have a positive predictive valueof 95% and 97% and a sensitivity of 72% and 64%, respectively.20
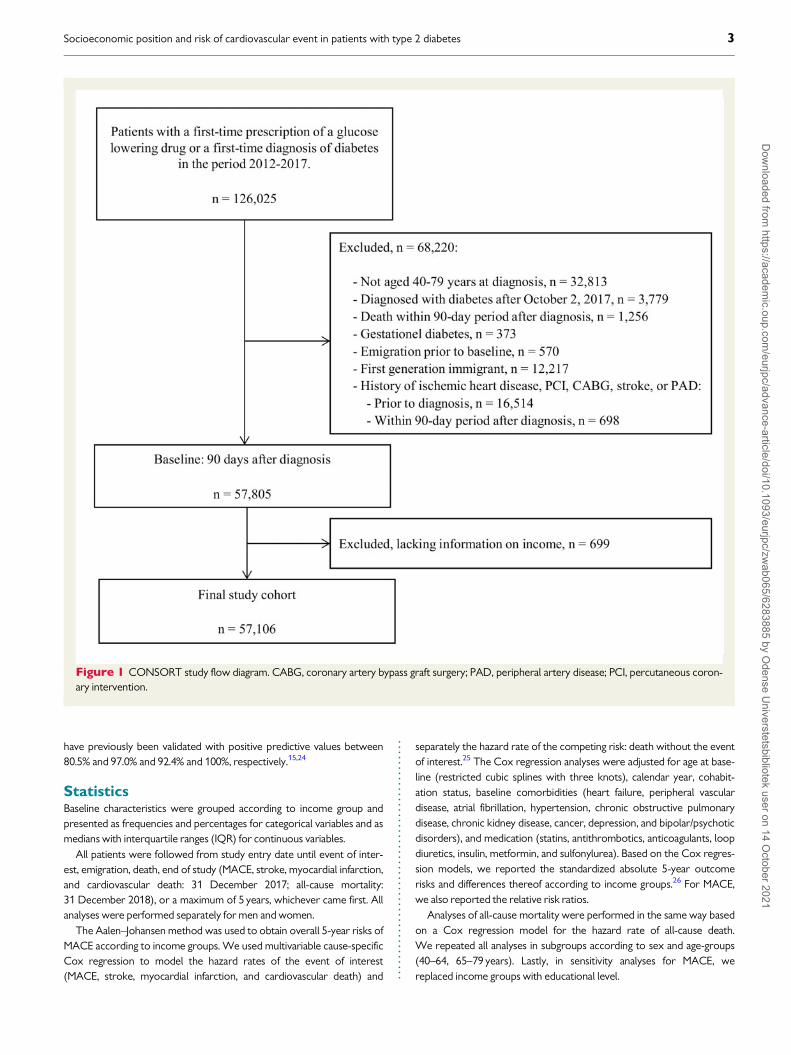
We excluded patients younger than 40 years of age at time of diagnosisin order to exclude patients with type 1 diabetes and since income is rela-tively stable after 40 years of age.21 Further exclusion criteria are pre-sented in the population flowchart (Figure 1). Moreover, we accountedfor polycystic ovary syndrome by only including prescriptions of metfor-min in women after they had turned 40 years, if they were in metforminmonotherapy and without a code of diabetes. Lastly, patients with gesta-tional diabetes were not considered initially but were included if they sub-sequently developed diabetes (definition in Supplementary materialonline, Table S1).
Since initial treatment of T2D (antidiabetic, antihypertensive, and lipid-lowering treatment) is likely to be changed during the first months afterdiagnosis and in order to exclude patients with pre-existing, non-clinicallyrecognized ischaemic heart disease, study entry date was set to 90 daysafter date of incident diabetes diagnosis. Thus, all incident T2D patientswithout existing ischaemic heart disease, prior stroke, and/or peripheralartery disease, who were alive at this time were included in the study.
Socioeconomic positionWe used equivalized disposable income as the primary proxy for socioe-conomic position. This was measured as the total disposable income ofthe household and divided by the weighted number of individuals living inthe household, using the Organization for Economic Co-operation andDevelopment (OECD) modified scale where first adult counted as 1, fur-ther adults as 0.5, and individuals younger than 14 years as 0.3.18 Incomewas corrected for inflation to year 2015. In order to minimize the effectof yearly variations, income was measured as the 5-year mean prior tothe study entry date (90 days after diagnosis of T2D) and was groupedaccording sex- and age-group-specific quartiles (40–64, 65–79 years).Thus, patients were assigned to one of four income groups (lowest, se-cond lowest, second highest, and highest).
Patients’ highest attained educational level were divided into threegroups according to the International Classification of Education(ISCED)23; (i) basic education (ISCED level 0–2); (ii) high school or voca-tional education (ISCED level 3); and (iii) higher education includingshort-term higher education, bachelor’s/master’s/doctoral degree orequivalent (ISCED level 5 or higher).
Baseline medication and comorbiditiesMedical treatment at baseline was identified through ATC-codes anddefined as at least one redeemed prescription 180 days prior to baseline(Supplementary material online, Table S2). Comorbidities were definedaccording to hospital ICD-codes from the Danish National Patientregister (10 years before study entry) (Supplementary material online,Table S1, definitions and ICD-codes). Moreover, dispensation of relevantpharmacotherapy was also applied for defining hypertension, chronic ob-structive pulmonary disease/asthma, depression, and bipolar or psychoticdisorders (Supplementary material online, Table S1).
OutcomesThe primary outcome was first-time major adverse cardiovascular event(MACE), defined as stroke, myocardial infarction, or cardiovascular death(defined by ICD-10 codes in Supplementary material online, Table S1),whichever came first. The first occurrence of stroke, myocardial infarc-tion, cardiovascular mortality, and all-cause mortality was examined assecondary outcomes. The diagnoses of stroke and myocardial infarction
2 A.C. Falkentoft et al.D
ownloaded from
https://academic.oup.com
/eurjpc/advance-article/doi/10.1093/eurjpc/zwab065/6283885 by O
dense Universtetsbibliotek user on 14 O
ctober 2021
..
..
..
..
..
..
..
..
..
..
..
..
..
..
..
..
..
..
..
..
..
..
..have previously been validated with positive predictive values between80.5% and 97.0% and 92.4% and 100%, respectively.15,24
StatisticsBaseline characteristics were grouped according to income group andpresented as frequencies and percentages for categorical variables and asmedians with interquartile ranges (IQR) for continuous variables.
All patients were followed from study entry date until event of inter-est, emigration, death, end of study (MACE, stroke, myocardial infarction,and cardiovascular death: 31 December 2017; all-cause mortality:31 December 2018), or a maximum of 5 years, whichever came first. Allanalyses were performed separately for men and women.
The Aalen–Johansen method was used to obtain overall 5-year risks ofMACE according to income groups. We used multivariable cause-specificCox regression to model the hazard rates of the event of interest(MACE, stroke, myocardial infarction, and cardiovascular death) and
separately the hazard rate of the competing risk: death without the eventof interest.25 The Cox regression analyses were adjusted for age at base-line (restricted cubic splines with three knots), calendar year, cohabit-ation status, baseline comorbidities (heart failure, peripheral vasculardisease, atrial fibrillation, hypertension, chronic obstructive pulmonarydisease, chronic kidney disease, cancer, depression, and bipolar/psychoticdisorders), and medication (statins, antithrombotics, anticoagulants, loopdiuretics, insulin, metformin, and sulfonylurea). Based on the Cox regres-sion models, we reported the standardized absolute 5-year outcomerisks and differences thereof according to income groups.26 For MACE,we also reported the relative risk ratios.
Analyses of all-cause mortality were performed in the same way basedon a Cox regression model for the hazard rate of all-cause death.We repeated all analyses in subgroups according to sex and age-groups(40–64, 65–79 years). Lastly, in sensitivity analyses for MACE, wereplaced income groups with educational level.
Figure 1 CONSORT study flow diagram. CABG, coronary artery bypass graft surgery; PAD, peripheral artery disease; PCI, percutaneous coron-ary intervention.
Socioeconomic position and risk of cardiovascular event in patients with type 2 diabetes 3D
ownloaded from
https://academic.oup.com
/eurjpc/advance-article/doi/10.1093/eurjpc/zwab065/6283885 by O
dense Universtetsbibliotek user on 14 O
ctober 2021

..
..
..
..
..
..
..
..
..
..
..
..
..
..
..
..
..
..
..
..
..
..
..
..
..
..
..
..
..
..
..
..
..
..
..
..
..
..
..
..
..
..
..
..
..
..
..
..
..
..
..
..
..
..
..
..
..
..
..
..
..
..
..
..
..
..
..
..
..
..
..
..
..
..
..
..
..
..
..
..
..
..
..
..
..
..
.All analyses were performed in R, version 4.0.3.27 The level of statistic-
al significance was set at 5%, and the 95% confidence intervals (CIs) werereported for all the outcomes of interest.
EthicsRetrospective register-based studies do not need ethical approval inDenmark. Permission to use data from the Danish national registries forresearch has been granted by the Knowledge Center on Data ProtectionCompliance—The Capital Region of Denmark (approval number:P-2019-348).
Results
Study cohort and baseline characteristicsDiabetes was diagnosed in 126 025 patients in Denmark between2012 and 2017. After applying the exclusion criteria (Figure 1), 57 106patients were included in the final study cohort. The median agewas 60 years (IQR, 52–68 years) among men and 61 years (IQR,52–69 years) among women. Baseline characteristics varied by in-come (Table 1). In both men and women, patients in the lowest in-come group were less educated, more likely to live alone, had ahigher comorbidity-burden, and were more likely to be treated withcardiovascular medications. Yet, among men, the use of statins andrenin-angiotensin system (RAS) inhibitors increased with increasingincome level.
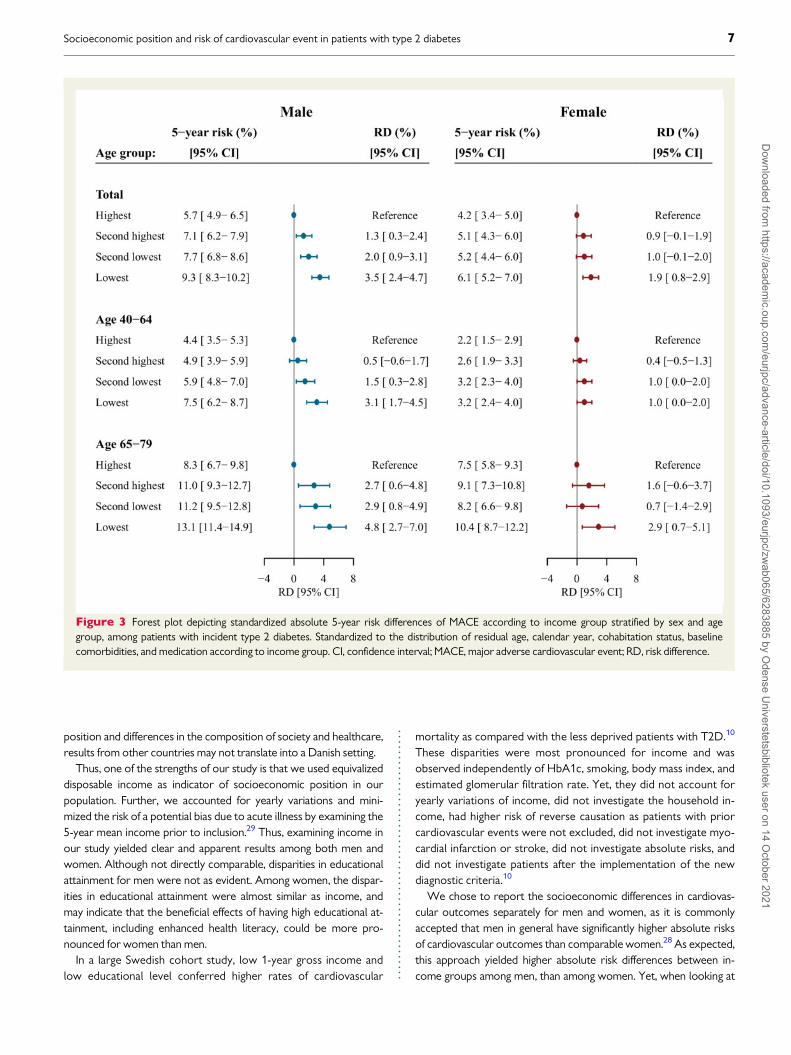
Major adverse cardiovascular eventsDuring 155 989 person years, first-time MACE occurred in 2139patients. Among both men and women, the crude, unadjusted 5-yearrisk of MACE increased with lower income group: among men, from5.1% (CI 4.4–5.9) in the highest income group to 10.6% (CI 9.6–11.6)in lowest income group; among women, from 3.9% (CI 3.1–4.6) to7.6% (CI 6.6–8.6). After standardization, income remained inverselyassociated with the risk of MACE (Figure 2). In men, the standardized5-year risk of MACE increased from 5.7% (CI 4.9–6.5) in the highestincome group to 9.3% (CI 8.3–10.2) in the lowest income group. Inwomen, the standardized 5-year risk of MACE increased from 4.2%(CI 3.4–5.0) to 6.1% (CI 5.2–7.0). When comparing the lowest andhighest income groups, we observed an absolute risk difference of3.5% (CI 2.4–4.7) among men and 1.9% (CI 0.8–2.9) among women(Figure 3). When looking at relative measures, we observed 5-yearrisk ratios of MACE of 1.6 (CI 1.4–1.9; highest vs. lowest incomegroup) among men and of 1.5 (CI 1.1–1.8; highest vs. lowest incomegroup) among women. In age-subgroups, the inverse association be-tween income and MACE was consistent (Figure 3). Yet, among theyoungest (40–64 years) women, the association was borderline sig-nificant. Further, risk differences of MACE increased with male sexand with older age.
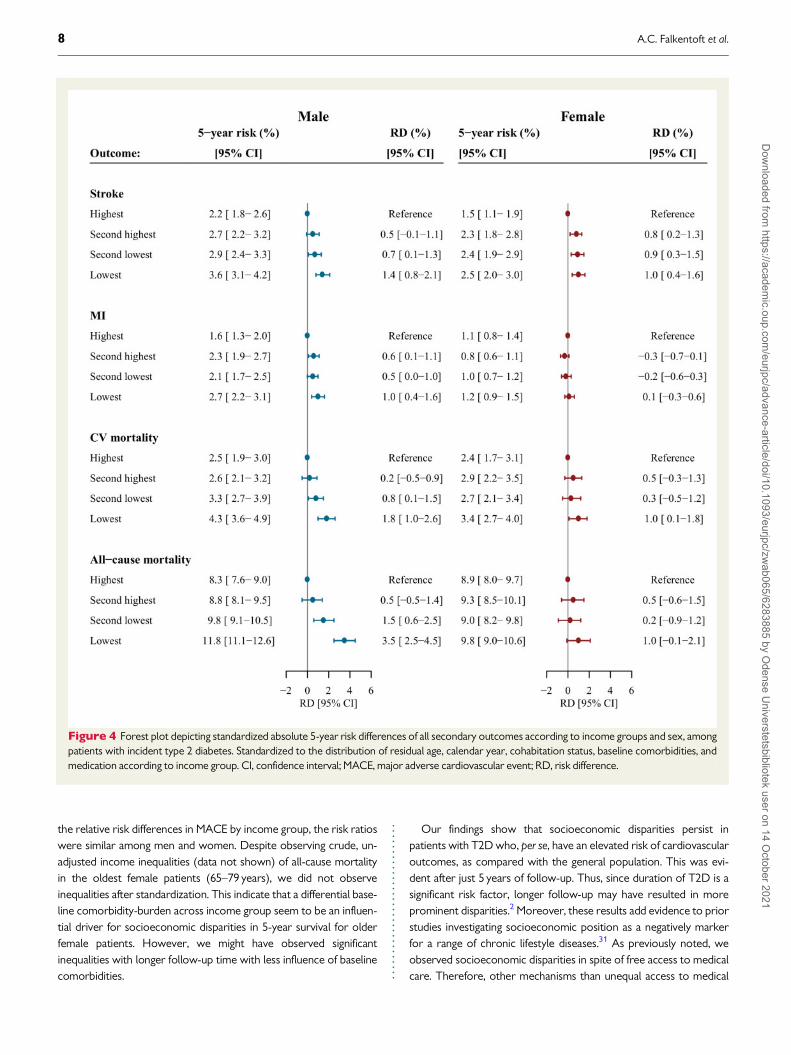
Secondary outcomesOverall, stroke occurred in 1058 patients, myocardial infarction in708 patients, cardiovascular death in 1021, and all-cause mortality in4158 patients. Among men, low income was associated with anincreased risk of all secondary outcomes: stroke, myocardial infarc-tion, cardiovascular death, and all-cause mortality (Figure 4). In sub-group analyses, this pattern was observed in both age-groups for all
secondary outcomes (Supplementary material online, Figures S1–S4).Among women, an inverse significant association by income groupwas observed for the specific secondary outcomes of stroke andcardiovascular death (Figure 4). However, we did not observe asignificant inverse association by income group with myocardialinfarction or all-cause mortality. In subgroup-analyses among theyoungest female patients (40–64 years), income reached borderlinestatistical significance for cardiovascular mortality and all-causemortality, whereas statistically significance was reached only forstroke among the oldest patients (65–79 years) (Supplementary ma-terial online, Figures S1–S4).
Educational levelIn general, educational level was associated with baseline characteris-tics in a pattern similar to income levels (Supplementary materialonline, Table S3). Among both men and women, attained educationallevel was also inversely associated with MACE (Supplementarymaterial online, Figure S5). Among men, patients with lowest educa-tional level had a 1.4% (CI 0.4–2.5) higher 5-year risk of MACEthan patients in the highest educational level (Supplementary materialonline, Figure S5). The risk difference among women was 1.9%(CI 0.9–2.8). In women, this inverse relation was evident in both agegroups (Supplementary material online, Figure S5). Among men, theinverse relation between educational level and MACE was significantfor youngest patients (40–64 years) but not significant for the oldestpatients (65–79 years).
Discussion
This nationwide study is the first large cohort study investigating theassociation between socioeconomic position and the risk of first-time cardiovascular outcomes in a contemporary population ofpatients with incidence T2D. Low-socioeconomic position was asso-ciated with higher absolute risks of adverse cardiovascular events, in-dependently of comorbidities, among both men and women inpatients with T2D. This was observed despite a strong Danish socialwelfare system, with free access to medical care and education andsocioeconomic differences minimized by state, regions, and munici-palities. Differences in outcome by socioeconomic position are likelyto be more prominent in countries without the strong social safetynet found in Scandinavia. Moreover, despite being implemented as arisk modifier in the 2016 European guidelines on cardiovasculardisease prevention in clinical practice,28 socioeconomic position isneither included in systematic cardiovascular risk stratification nor asa risk modifier in the 2019 European guidelines on diabetes, pre-dia-betes, and cardiovascular disease.2 In this context, our findings under-score the importance of considering socioeconomic position inprimary preventive strategies for cardiovascular disease amongpatients with T2D.
Some prior cohort studies have investigated the rates of cardiovas-cular outcomes according to socioeconomic differences in patientswith T2D before the new definition of diabetes.7–13 Moreover, thesestudies differed from our study by either usingarea-based socioeconomic position as a proxy for individual-levelsocioeconomic position,7,8 not adjusting for comorbidities ormedication,7,12 using educational levels as primary exposure,9,13 or by
4 A.C. Falkentoft et al.D
ownloaded from
https://academic.oup.com
/eurjpc/advance-article/doi/10.1093/eurjpc/zwab065/6283885 by O
dense Universtetsbibliotek user on 14 O
ctober 2021

....
....
....
....
....
....
....
....
....
....
....
....
....
....
....
....
....
....
....
....
....
....
....
....
....
....
....
....
....
....
...
....
....
....
....
....
....
....
....
....
....
....
....
....
....
....
....
....
....
....
....
....
....
....
....
....
....
....
....
....
....
....
....
....
....
....
....
....
....
....
....
....
....
....
....
....
....
....
....
....
....
....
....
....
....
....
....
....
....
....
....
....
....
....
....
....
....
....
....
....
....
....
....
....
....
....
....
....
....
....
....
....
....
....
....
....
....
....
....
....
....
....
....
....
....
....
....
....
....
....
....
....
....
Tab
le1
Base
lin
ech
ara
cte
rist
ics
ofth
e57
106
pati
en
tsw
ith
typ
e2
dia
bete
sacco
rdin
gto
qu
art
iles
ofin
co
me
an
dse
x
Vari
ab
les
Male
Fem
ale
Inco
me
gro
up
Inco
me
gro
up
Lo
west
Seco
nd
low
est
Seco
nd
hig
hest
Hig
hest
Lo
west
Seco
nd
low
est
Seco
nd
hig
hest
Hig
hest
(n5
7879)
(n5
7877)
(n5
7877)
(n5
7877)
(n5
6399)
(n5
6399)
(n5
6399)
(n5
6399)
Age
59(5
0–70
)59
(50–
68)
60(5
3–67
)61
(55–
67)
60(5
0–71
)61
(50–
70)
61(5
2–68
)61
(54–
67)
Inco
me
adju
sted
to20
15
leve
lsin
Euro
s
2093
5(1
867
4–22
612)
2775
5(2
594
7–30
280)
3551
5(3
333
2–38
131)
4872
5(4
411
4–57
514)
2045
7(1
879
8–22
445)
2644
6(2
325
3–29
100)
3303
8(2
885
9–36
365)
4520
7(4
092
4–52
442)
Educ
atio
nall
evel
Basi
ced
ucat
ion
3829
(50.
0)30
33(3
9.2)
2152
(27.
7)12
15(1
5.6)
3713
(59.
2)29
12(4
6.1)
2023
(31.
9)12
34(1
9.4)
Hig
hsc
hool
/voc
atio
nal
3252
(42.
5)39
55(5
1.1)
4171
(53.
6)35
82(4
5.9)
2048
(32.
6)25
64(4
0.6)
2884
(45.
4)26
75(4
2.1)
Hig
her
educ
atio
n57
6(7
.5)
747
(9.7
)14
57(1
8.7)
3003
(38.
5)51
5(8
.2)
839
(13.
3)14
39(2
2.7)
2448
(38.
5)
Mis
sing
222
142
9777
123
8453
42
Livi
ngal
one
4839
(61.
4)30
02(3
8.1)
1863
(23.
7)14
05(1
7.8)
4099
(64.
1)29
95(4
6.8)
1878
(29.
3)11
66(1
8.2)
Com
orbi
ditie
s,(%
)
Hea
rtfa
ilure
344
(4.4
)27
6(3
.5)
221
(2.8
)16
6(2
.1)
174
(2.7
)14
8(2
.3)
126
(2.0
)89
(1.4
)
Atr
ialfi
brill
atio
n52
2(6
.6)
525
(6.7
)43
8(5
.6)
466
(5.9
)29
3(4
.6)
278
(4.3
)26
7(4
.2)
213
(3.3
)
Hyp
erte
nsio
n33
01(4
1.9)
3444
(43.
7)33
60(4
2.7)
3348
(42.
5)28
85(4
5.1)
2964
(46.
3)29
17(4
5.6)
2769
(43.
3)
CO
PD/a
sthm
a11
84(1
5.0)
1046
(13.
3)74
5(9
.5)
621
(7.9
)12
05(1
8.8)
1130
(17.
7)92
3(1
4.4)
757
(11.
8)
Chr
onic
kidn
eydi
seas
e20
6(2
.6)
218
(2.8
)19
1(2
.4)
163
(2.1
)15
4(2
.4)
133
(2.1
)14
0(2
.2)
97(1
.5)
Can
cer
627
(8.0
)71
1(9
.0)
746
(9.5
)78
6(1
0.0)
571
(8.9
)64
3(1
0.0)
698
(10.
9)78
9(1
2.3)
Dep
ress
ion
1167
(14.
8)86
6(1
1.0)
677
(8.6
)46
9(6
.0)
1737
(27.
1)14
77(2
3.1)
1118
(17.
5)82
6(1
2.9)
Bipo
lar/
psyc
hotic
diso
rder
s65
0(8
.2)
465
(5.9
)15
6(2
.0)
91(1
.2)
667
(10.
4)55
7(8
.7)
298
(4.7
)16
3(2
.5)
Phar
mac
othe
rapy
,(%
)
Stat
ins
3551
(45.
1)37
67(4
7.8)
3845
(48.
8)39
00(4
9.5)
3066
(47.
9)31
14(4
8.7)
3047
(47.
6)30
06(4
7.0)
RA
Si36
30(4
6.1)
3961
(50.
3)39
82(5
0.6)
4026
(51.
1)28
39(4
4.4)
2995
(46.
8)29
31(4
5.8)
2859
(44.
7)
Ant
ithro
mbo
tics
1066
(13.
5)10
58(1
3.4)
993
(12.
6)10
13(1
2.9)
804
(12.
6)72
8(1
1.4)
695
(10.
9)63
7(1
0.0)
Ant
icoa
gula
nts
570
(7.2
)58
2(7
.4)
487
(6.2
)47
2(6
.0)
327
(5.1
)29
6(4
.6)
296
(4.6
)25
5(4
.0)
Beta
bloc
kers
1363
(17.
3)13
74(1
7.4)
1199
(15.
2)11
39(1
4.5)
1197
(18.
7)12
06(1
8.8)
1146
(17.
9)10
13(1
5.8)
Loop
diur
etic
s91
0(1
1.5)
749
(9.5
)51
9(6
.6)
388
(4.9
)86
8(1
3.6)
740
(11.
6)60
7(9
.5)
440
(6.9
)
Thi
azid
e92
3(1
1.7)
875
(11.
1)77
2(9
.8)
749
(9.5
)11
87(1
8.5)
1235
(19.
3)12
08(1
8.9)
1108
(17.
3)
Ca
chan
nelb
lock
ers
1674
(21.
2)18
44(2
3.4)
1742
(22.
1)17
08(2
1.7)
1276
(19.
9)12
59(1
9.7)
1190
(18.
6)11
19(1
7.5)
Insu
lin66
5(8
.4)
593
(7.5
)58
3(7
.4)
526
(6.7
)39
6(6
.2)
340
(5.3
)34
8(5
.4)
380
(5.9
)
Met
form
in71
75(9
1.1)
7162
(90.
9)71
37(9
0.6)
7092
(90.
0)57
54(8
9.9)
5775
(90.
2)56
96(8
9.0)
5503
(86.
0)
Sulfo
nylu
rea
254
(3.2
)21
4(2
.7)
191
(2.4
)16
2(2
.1)
181
(2.8
)15
0(2
.3)
161
(2.5
)14
6(2
.3)
DPP
-4in
hibi
tors
210
(2.7
)19
6(2
.5)
192
(2.4
)20
4(2
.6)
170
(2.7
)16
2(2
.5)
170
(2.7
)13
6(2
.1)
GLP
-1re
cept
orag
onis
ts10
0(1
.3)
100
(1.3
)13
3(1
.7)
179
(2.3
)14
0(2
.2)
154
(2.4
)21
8(3
.4)
361
(5.6
)
SGLT
-2in
hibi
tors
55(0
.7)
34(0
.4)
52(0
.7)
61(0
.8)
35(0
.5)
31(0
.5)
40(0
.6)
36(0
.6)
Dat
aar
epr
esen
ted
asm
edia
nva
lues
[inte
rqua
rtile
rang
es(IQ
R)]
for
cont
inuo
usva
riab
les
and
asnu
mbe
rs(p
erce
ntag
es)
for
cate
gori
calv
aria
bles
.C
OPD
,chr
onic
obst
ruct
ive
pulm
onar
ydi
seas
e;D
PP-4
,dip
eptid
ylpe
ptid
ase
4;G
LP-1
,glu
cago
n-lik
epe
ptid
e1;
RA
S,re
nin-
angi
oten
sin
syst
em;S
GLT
-2,s
odiu
mgl
ucos
eco
-tra
nspo
rter
2.
Socioeconomic position and risk of cardiovascular event in patients with type 2 diabetes 5D
ownloaded from
https://academic.oup.com
/eurjpc/advance-article/doi/10.1093/eurjpc/zwab065/6283885 by O
dense Universtetsbibliotek user on 14 O
ctober 2021

..
..
..
..
..
..
..
..
..
..
..
..
..
..
..
..
..
..
..
..
..
..
..
..
..
..
..
..
..
..
..
..
..
..
..
..
..
..not excluding patients with prevalent cardiovascular disease.7–10,12,13
Moreover, they all differed from our study by reporting rates and notabsolute risks, and not investigating patients with T2D after the im-plementation of the new diagnostic criteria.7–13 Our findings wereconsistent with most of the studies,7–11 yet, inconsistent with afew.12,13
One Scottish cohort study examined socioeconomic position,based on an area score, and found a strong inverse associationwith age-adjusted rates of ischaemic heart mortality and cerebro-vascular mortality.7 These results were observed, despite usingarea-based socioeconomic position, which is likely to underesti-mate the true individual-level effect due to non-differential mis-classification.29 Furthermore, they did not adjust for comorbiditiesnor medication and did not investigated first-time cardiovascularevents.
Socioeconomic position may determine health. However, healthmay also determine patients’ current socioeconomic position, gener-ating social selection.30 Therefore, to take this limitation into account,we aimed to reduce the risk of reverse causation between income,T2D, and MACE by excluding patients with prevalent cardiovasculardisease and by investigating patients with incident T2D. Moreover,we accounted for baseline comorbidities by standardization and alsoexamined attained educational level in which reverse causation is lesslike as it is usually determined in the young adulthood before theonset of T2D and cardiovascular disease.
One Swedish cohort study,9 one Italian cohort study,12 and onelarge sub-study of a multinational, randomized controlled study,13
investigated differences in educational attainment among patientswith T2D without excluding patients with prior cardiovascularevents. The Swedish study found only minor socioeconomic differ-ences on major cardiovascular events.9 Inconsistent with our find-ings, the large clinical sub-study reported no significantsocioeconomic differences in the rates of major cardiovascularevents in subgroup analysis of patients from countries with estab-lished market economies.13 Likewise, the Italian cohort study didnot find any socioeconomic differences in incidence rates of car-diovascular mortality, stroke, and myocardial infarction in overallanalysis of a mixed population of patients with type 1 diabetes andT2D.12 Yet, in sub-group analysis, they found significant differencesin patients aged 20–64 years.
Despite being more robust against reverse causality, educationallevel may not be optimal in an elderly population and may result innon-differential misclassification towards no effect.3 Thus, for patientsin the active professional life and during the first years of retirement,income and wealth are suggested as the most proper indicators ofsocioeconomic position.3 Further, crude dichotomized categoriza-tions of educational level and not accounting for differences in educa-tional systems across countries, may also have explained the lack ofsignificant findings in the large multinational sub-study.13 Lastly, dueto cultural and regional differences in markers of socioeconomic
Figure 2 Average standardized absolute risk of first-time MACE according to income group and sex, among patients with incident type 2 diabetes.Time zero indicates 90 days after diagnosis of type 2 diabetes. Standardized to the distribution of residual age, calendar year, cohabitation status, base-line comorbidities, and medication according to income group. MACE, major adverse cardiovascular event.
6 A.C. Falkentoft et al.D
ownloaded from
https://academic.oup.com
/eurjpc/advance-article/doi/10.1093/eurjpc/zwab065/6283885 by O
dense Universtetsbibliotek user on 14 O
ctober 2021
..
..
..
..
..
..
..
..
..
..
..
..
..
..
..
..
..
..
..
..
..
..
..
..position and differences in the composition of society and healthcare,results from other countries may not translate into a Danish setting.
Thus, one of the strengths of our study is that we used equivalizeddisposable income as indicator of socioeconomic position in ourpopulation. Further, we accounted for yearly variations and mini-mized the risk of a potential bias due to acute illness by examining the5-year mean income prior to inclusion.29 Thus, examining income inour study yielded clear and apparent results among both men andwomen. Although not directly comparable, disparities in educationalattainment for men were not as evident. Among women, the dispar-ities in educational attainment were almost similar as income, andmay indicate that the beneficial effects of having high educational at-tainment, including enhanced health literacy, could be more pro-nounced for women than men.
In a large Swedish cohort study, low 1-year gross income andlow educational level conferred higher rates of cardiovascular
mortality as compared with the less deprived patients with T2D.10
These disparities were most pronounced for income and wasobserved independently of HbA1c, smoking, body mass index, andestimated glomerular filtration rate. Yet, they did not account foryearly variations of income, did not investigate the household in-come, had higher risk of reverse causation as patients with priorcardiovascular events were not excluded, did not investigate myo-cardial infarction or stroke, did not investigate absolute risks, anddid not investigate patients after the implementation of the newdiagnostic criteria.10
We chose to report the socioeconomic differences in cardiovas-cular outcomes separately for men and women, as it is commonlyaccepted that men in general have significantly higher absolute risksof cardiovascular outcomes than comparable women.28 As expected,this approach yielded higher absolute risk differences between in-come groups among men, than among women. Yet, when looking at
Figure 3 Forest plot depicting standardized absolute 5-year risk differences of MACE according to income group stratified by sex and agegroup, among patients with incident type 2 diabetes. Standardized to the distribution of residual age, calendar year, cohabitation status, baselinecomorbidities, and medication according to income group. CI, confidence interval; MACE, major adverse cardiovascular event; RD, risk difference.
Socioeconomic position and risk of cardiovascular event in patients with type 2 diabetes 7D
ownloaded from
https://academic.oup.com
/eurjpc/advance-article/doi/10.1093/eurjpc/zwab065/6283885 by O
dense Universtetsbibliotek user on 14 O
ctober 2021
..
..
..
..
..
..
..
..
..
..
..
..
..
..
..the relative risk differences in MACE by income group, the risk ratioswere similar among men and women. Despite observing crude, un-adjusted income inequalities (data not shown) of all-cause mortalityin the oldest female patients (65–79 years), we did not observeinequalities after standardization. This indicate that a differential base-line comorbidity-burden across income group seem to be an influen-tial driver for socioeconomic disparities in 5-year survival for olderfemale patients. However, we might have observed significantinequalities with longer follow-up time with less influence of baselinecomorbidities.
Our findings show that socioeconomic disparities persist inpatients with T2D who, per se, have an elevated risk of cardiovascularoutcomes, as compared with the general population. This was evi-dent after just 5 years of follow-up. Thus, since duration of T2D is asignificant risk factor, longer follow-up may have resulted in moreprominent disparities.2 Moreover, these results add evidence to priorstudies investigating socioeconomic position as a negatively markerfor a range of chronic lifestyle diseases.31 As previously noted, weobserved socioeconomic disparities in spite of free access to medicalcare. Therefore, other mechanisms than unequal access to medical
Figure 4 Forest plot depicting standardized absolute 5-year risk differences of all secondary outcomes according to income groups and sex, amongpatients with incident type 2 diabetes. Standardized to the distribution of residual age, calendar year, cohabitation status, baseline comorbidities, andmedication according to income group. CI, confidence interval; MACE, major adverse cardiovascular event; RD, risk difference.
8 A.C. Falkentoft et al.D
ownloaded from
https://academic.oup.com
/eurjpc/advance-article/doi/10.1093/eurjpc/zwab065/6283885 by O
dense Universtetsbibliotek user on 14 O
ctober 2021

..
..
..
..
..
..
..
..
..
..
..
..
..
..
..
..
..
..
..
..
..
..
..
..
..
..
..
..
..
..
..
..
..
..
..
..
..
..
..
..
..
..
..
..
..
..
..
..
..
..
..
..
..
..
..
..
..
..
..
..
..
..
..
..
..
..
..
..
..
..
..
..
..
..
..
..
..
..
..
..
..
..
..
..
..
..
.care may explain the link between socioeconomic disparities and ad-verse cardiovascular outcomes in Denmark in patients with T2D.Such mechanisms may include differences in individual health behav-iour (smoking, exercise, adherence to diets, medications, and annualdiabetes check-ups), factors that influence health behaviour (healthliteracy, stress, mental health, and social network) and in part havedirect effects (stress), quality of care, and biological cardiovascularrisk factors (lipids, HbA1C, or blood pressure).5,32,33 As we aimed toinvestigate patients’ current socioeconomic position in newly diag-nosed patients with T2D, we tried to capture some of these effectsprior to diagnosis of T2D by adjusting for baseline comorbidities andmedication. Therefore, these mechanisms may be particularly evidentafter diagnosis of T2D in our study and might reflect areas forintervention.
Clinical implicationsFrom a clinical perspective, multiple interventions may be required inorder to reduce the disparities observed in this study. First, incorpor-ation of socioeconomic position in cardiovascular risk assessmentmight be beneficial. Second, patient-centred interventions, includingeducation, empowerment, and self-management strategies may beparticularly important for these patients in order to modify undesir-able health behaviour. Third, these patients may benefit from earlyrisk screening for cardiovascular disease, more frequent follow-up,and aggressively targeting biological cardiovascular risk factors (lipids,glucose-levels, blood pressure, and albuminuria) that have associa-tions with low-socioeconomic position.34,35 However, since socioe-conomic disparities may be a result of accumulative exposurethroughout life, it is unknown whether these strategies can level outthe social gradient for cardiovascular events after diagnosis withT2D.21 Randomized clinical trials focusing on this subject are neededin order to gain further insight.
Strengths and limitationsThe major strengths of our study is the large sample size with minimalloss to follow-up, minimal risk of selection bias, and detailed individ-ual-level data ensured by the Danish nationwide registers. Moreover,due to the prospective data collection in the registers, we had no re-call bias and minimal differential drop-out bias.
However, our study has some limitations that we have to address.First, our cohort relies on redeemed prescriptions for antidiabeticdrugs and discharge diagnoses of diabetes with high positive predict-ive values but a sensitivity of 72% and 64%, respectively.20 Therefore,although the combined sensitivity is most likely higher, we may haveexcluded some patients with untreated T2D.
Second, outcomes relied on discharge codes. Yet, discharge diag-noses of myocardial infarction, and stroke have been validated withhigh positive predictive values.15,24
Third, we cannot completely rule out that some of the observedsocioeconomic disparities in MACE were attributable to socialselection. Thus, despite introducing a blanking period of 90 days afterdiagnosis of T2D, some patients might have had undetected cardio-vascular disease at study entry which may have led to a reduction inworking capacity and, hence, income. Moreover, some of theobserved disparities may have been attributable to residual con-founding, as we did not have access to information on behavioural
(alcohol consumption, smoking status, diet, exercise, body massindex), biological (lipids, HbA1C, or blood pressure), or psychologic-al (such as stress or health literacy) cardiovascular risk factors atstudy entry. However, we did account for those risk factors that hadcaused comorbidities or initiation of medication prior to 90 days afterdiagnosis of T2D.
Fourth, we had a potential detection bias underestimating theobserved socioeconomic disparities, since the lowest socioeconomicgroup may be underdiagnosed with myocardial infarction and stroke.However, we also investigated fatal events from death certificates.
Lastly, as our study is observational, it represents associations, andno causal conclusions can be drawn.
Conclusions
In patients with incident T2D, low-socioeconomic position was asso-ciated with a significantly higher 5-year risk of first-time MACE amongboth men and women. This excess risk was independent of comor-bidities and occurred despite of a universal health care system withfree access to medical care. Our results indicate the importance ofprimary preventive strategies targeting patients with low-socioeco-nomic position. Future research investigating mediating pathways andintervention studies targeting patients with low-socioeconomic pos-ition are needed to improve outcomes in disadvantaged patients.
Supplementary material
Supplementary material is available at European Journal of PreventiveCardiology online.
FundingThis work was supported by grants from ‘Region Sjaelland DenSundhedsvidenskabelige Forskningsfond’; and from ‘Murermester LauritzPeter Christensen og hustru Kirsten Sigrid Christensens Fond’.
Conflict of interest: A.C.F. reports grants from ‘Region Sjaelland DenSundhedsvidenskabelige Forskningsfond’ and from ‘Murermester LauritzPeter Christensen og hustru Kirsten Sigrid Christensens Fond’ for theconduct of this study. T.B.H. reports personal fees from Novo Nordisk,outside the submitted work. M.S. reports lecture fees from NovoNordisk, AstraZeneca, and Boehringer Ingelheim, outside the submittedwork. C.T.P. reports grants from Bayer and Novo Nordisk, outside thesubmitted work. N.E.B. reports grant from Novo Nordisk, outside thesubmitted work A.C.R. reports speaker honorarium from Novartis, out-side the submitted work. All other authors have no conflicts of interest.
References1. Rawshani A, Rawshani A, Franzen S, Eliasson B, Svensson A-M, Miftaraj M,
McGuire DK, Sattar N, Rosengren A, Gudbjornsdottir S. Mortality and cardiovas-cular disease in type 1 and type 2 diabetes. N Engl J Med 2017;376:1407–1418.
2. Cosentino F, Grant PJ, Aboyans V, Bailey CJ, Ceriello A, Delgado V, Federici M,Filippatos G, Grobbee DE, Hansen TB, Huikuri HV, Johansson I, Juni P, LettinoM, Marx N, Mellbin LG, Ostgren CJ, Rocca B, Roffi M, Sattar N, Seferovi�c PM,Sousa-Uva M, Valensi P, Wheeler DC; ESC Scientific Document Group. 2019ESC Guidelines on diabetes, pre-diabetes, and cardiovascular diseases developedin collaboration with the EASD. Eur Heart J 2020;41:255–323.
Socioeconomic position and risk of cardiovascular event in patients with type 2 diabetes 9D
ownloaded from
https://academic.oup.com
/eurjpc/advance-article/doi/10.1093/eurjpc/zwab065/6283885 by O
dense Universtetsbibliotek user on 14 O
ctober 2021

..
..
..
..
..
..
..
..
..
..
..
..
..
..
..
..
..
..
..
..
..
..
..
..
..
..
..
..
..
..
..
..
..
..
..
..
..
..
..
..
..
..
..
..
..
..
..
..
..
..
..
..
..
..
..
..
..
..
..
..
..
..
..
..
..
.3. Galobardes B, Shaw M, Lawlor DA, Lynch JW, Davey Smith G. Indicators of soci-
oeconomic position (part 1). J Epidemiol Commun Health 2006;60:7–12.4. Agardh E, Allebeck P, Hallqvist J, Moradi T, Sidorchuk A. Type 2 diabetes
incidence and socio-economic position: a systematic review and meta-analysis.Int J Epidemiol 2011;40:804–818.
5. Schultz WM, Kelli HM, Lisko JC, Varghese T, Shen J, Sandesara P, Quyyumi AA,Taylor HA, Gulati M, Harold JG, Mieres JH, Ferdinand KC, Mensah GA, SperlingLS. Socioeconomic status and cardiovascular outcomes: challenges and interven-tions. Circulation 2018;137:2166–2178.
6. Andersen KK, Steding-Jessen M, Dalton SO, Olsen TS. Socioeconomic positionand incidence of ischemic stroke in Denmark 2003-2012. A nationwide hospital-based study. J Am Heart Assoc 2014;3:e000762. doi:10.1161/jaha.113.000762.
7. Jackson CA, Jones NRV, Walker JJ, Fischbacher CM, Colhoun HM, Leese GP,Lindsay RS, McKnight JA, Morris AD, Petrie JR, Sattar N, Wild SH; ScottishDiabetes Research Network Epidemiology Group. Area-based socioeconomicstatus, type 2 diabetes and cardiovascular mortality in Scotland. Diabetologia2012;55:2938–2945.
8. Booth GL, Bishara P, Lipscombe LL, Shah BR, Feig DS, Bhattacharyya O, BiermanAS. Universal drug coverage and socioeconomic disparities in major diabetesoutcomes. Diabetes Care 2012;35:2257–2264.
9. Ostgren CJ, Sundstrom J, Svennblad B, Lohm L, Nilsson PM, Johansson G.Associations of HbA1c and educational level with risk of cardiovascular events in32,871 drug-treated patients with Type 2 diabetes: a cohort study in primarycare. Diabetic Med 2013;30:e170–e177.
10. Rawshani A, Svensson A-M, Zethelius B, Eliasson B, Rosengren A,Gudbjornsdottir S. Association between socioeconomic status and mortality,cardiovascular disease, and cancer in patients with type 2 diabetes. JAMA InternMed 2016;176:1146–1154.
11. Andersson T, Pikkemaat M, Schioler L, Hjerpe P, Carlsson AC, Wandell P,Manhem K, Kahan T, Hasselstrom J, Bengtsson Bostrom K. The impact of dia-betes, education and income on mortality and cardiovascular events in hyperten-sive patients: a cohort study from the Swedish Primary Care CardiovascularDatabase (SPCCD). PLoS One 2020;15:e0237107.
12. Gnavi R, Canova C, Picariello R, Tessari R, Giorda C, Simonato L, Costa G.Mortality, incidence of cardiovascular diseases, and educational level among thediabetic and non-diabetic populations in two large Italian cities. Diabetes Res ClinPract 2011;92:205–212.
13. Blomster JI, Zoungas S, Woodward M, Neal B, Harrap S, Poulter N, Marre M,Williams B, Chalmers J, Hillis GS. The impact of level of education on vascularevents and mortality in patients with type 2 diabetes mellitus: Results from theADVANCE study. Diabetes Res Clin Pract 2017;127:212–217.
14. World Health Organization. Use of Glycated Haemoglobin (HbA1c) in theDiagnosis of Diabetes Mellitus: Abbreviated Report of a WHO Consultation,https://www.who.int/diabetes/publications/report-hba1c_2011.pdf (accessedApril 28 2021).
15. Schmidt M, Schmidt SA, Sandegaard JL, Ehrenstein V, Pedersen L, Sørensen HT.The Danish National Patient Registry: a review of content, data quality, and re-search potential. Clinical epidemiology. 2015;7:449–90
16. Pottegard A, Schmidt SAJ, Wallach-Kildemoes H, Sørensen HT, Hallas J, SchmidtM. Data Resource Profile: The Danish National Prescription Registry.International journal of epidemiology. 2017;46:798–f.
17. Schmidt M, Pedersen L, Sørensen HT. The Danish Civil Registration System as atool in epidemiology. European journal of epidemiology. 2014;29(8):541–9.
18. Baadsgaard M, Quitzau J. Danish registers on personal income and transferpayments. Scandinavian journal of public health. 2011;39(7 Suppl):103–5.
19. Jensen VM, Rasmussen AW. Danish Education Registers. Scandinavian journal ofpublic health. 2011;39(7 Suppl):91–4
20. Carstensen B, Kristensen JK, Marcussen MM, Borch-Johnsen K. The NationalDiabetes Register. Scand J Public Health 2011;39:58–61.
21. Kriegbaum M, Hougaard CO, Andersen I, Brønnum-Hansen H, Lund R. Lifecourse analysis on income and incident AMI: a Danish register-based cohortstudy. J Epidemiol Commun Health 2019;73:810–816.
22. Organisation for Economic Co-operation and Development. What are equiva-lence scales? http://www.oecd.org/els/soc/OECD-Note-EquivalenceScales.pdf (10June 2020).
23. ISCED. 2011. http://uis.unesco.org/sites/default/files/documents/international-standard-classification-of-education-isced-2011-en.pdf (10 June 2020).
24. Sundboll J, Adelborg K, Munch T, Frøslev T, Toft Sørensen H, Erik Bøtker H,Schmidt M. Positive predictive value of cardiovascular diagnoses in the DanishNational Patient Registry: a validation study. BMJ Open 2016;6:e012832.
25. Ozenne B, Sørensen AL, Scheike T, Torp-Pedersen C, Gerds TA. riskRegression:predicting the risk of an event using Cox regression models. R J 2017;9:440–460.
26. Ozenne BMH, Scheike TH, Staerk L, Alexander Gerds T. On the estimation ofaverage treatment effects with right-censored time to event outcome and com-peting risks. Biom J 2020;62:751–763.
27. R Core Team. R: A Language and Environment for Statistical Computing. Vienna,Austria: R Foundation for Statistical Computing; 2019. https://www.R-project.org/ (2 September 2020).
28. Piepoli MF, Hoes AW, Agewall S, Albus C, Brotons C, Catapano AL, Cooney M-T, CorrA U, Cosyns B, Deaton C, Graham I, Stephen Hall M, Richard Hobbs FD,Løchen M-L, L—llgen H, Marques-Vidal P, Perk J, Prescott E, Redon J, Richter DJ,Sattar N, Smulders Y, Tiberi M, van der Worp HB, van Dis I, MoniqueVerschuren WM, Binno S; ESC Scientific Document Group. 2016 EuropeanGuidelines on cardiovascular disease prevention in clinical practice: the SixthJoint Task Force of the European Society of Cardiology and Other Societies onCardiovascular Disease Prevention in Clinical Practice (constituted by represen-tatives of 10 societies and by invited experts): developed with the special contri-bution of the European Association for Cardiovascular Prevention &Rehabilitation (EACPR). Eur J Prev Cardiol 2016;23:Np1–Np96.
29. Galobardes B, Lynch J, Smith GD. Measuring socioeconomic position in healthresearch. Br Med Bull 2007;81-82:21–37.
30. Solar OIA. World Health Organization. A conceptual framework for action onthe social determinants of health. Social Determinants of Health Discussion.Paper 2 (Policy and Practice). 2010. https://www.who.int/sdhconference/resources/ConceptualframeworkforactiononSDH_eng.pdf (20 March 2021).
31. Sommer I, Griebler U, Mahlknecht P, Thaler K, Bouskill K, Gartlehner G, MendisS. Socioeconomic inequalities in non-communicable diseases and their risk fac-tors: an overview of systematic reviews. BMC Public Health 2015;15:914.
32. Brown AF, Ettner SL, Piette J, et al. Socioeconomic position and health amongpersons with diabetes mellitus: a conceptual framework and review of the litera-ture. Epidemiologic reviews 2004; 26: 63-77. 2004/07/06. DOI: 10.1093/epirev/mxh002.
33. Magnani JW, Mujahid MS, Aronow HD, et al. Health Literacy and CardiovascularDisease: Fundamental Relevance to Primary and Secondary Prevention: AScientific Statement From the American Heart Association. Circulation 2018; 138:e48-e74. 2018/06/06. DOI: 10.1161/cir.0000000000000579.
34. Walker RJ, Smalls BL, Campbell JA, Strom Williams JL, Egede LE. Impact of socialdeterminants of health on outcomes for type 2 diabetes: a systematic review.Endocrine 2014;47:29–48.
35. Wolf G, Busch M, Mller N, Mller UA. Association between socioeconomic statusand renal function in a population of German patients with diabetic nephropathytreated at a tertiary centre. Nephrol Dial Transplant 2011;26:4017–4023.
10 A.C. Falkentoft et al.D
ownloaded from
https://academic.oup.com
/eurjpc/advance-article/doi/10.1093/eurjpc/zwab065/6283885 by O
dense Universtetsbibliotek user on 14 O
ctober 2021