socioeconomic and demographic profiles of immigrants in prince edward island: 1981-2008
DESCRIPTION
This report presents a detailed analysis of socioeconomic and demographic profiles of immigrants in Prince Edward Island for the period 1981-2008 by updating an earlier report that analyzed immigrant inflow data for the period 1981-2005 and resident immigrant data for the period 1981-2001.TRANSCRIPT

SOCIOECONOMIC AND DEMOGRAPHIC PROFILES OF IMMIGRANTS IN PRINCE EDWARD ISLAND: 1981-2008
by
Wimal Rankaduwa
Department of Economics, University of Prince Edward Island,
Charlottetown, PE C1A 4P3, Canada
December, 2009

Profiles of Immigrants in Prince Edward Island
ACKNOWLEDGEMENTS
We acknowledge the support and assistance of the following individuals and partners of the Atlantic Metropolis Centre for this update:
1. Population Secretariat, Province of Prince Edward Island
2. Sobey School of Business, Saint Mary‟s University, Halifax, NS

Profiles of Immigrants in Prince Edward Island i
TABLE OF CONTENTS
LIST OF TEXT TABLES ................................................................................................ ii
LIST OF CHARTS ........................................................................................................ iii
LIST OF APPENDIX TABLES ...................................................................................... iv
EXECUTIVE SUMMARY ............................................................................................... v
I. INTRODUCTION ................................................................................................ 1
II. OBJECTIVES OF THIS STUDY ......................................................................... 2
III. METHODOLOGY ................................................................................................ 3
IV. AN OVERVIEW OF IMMIGRATION TO PRINCE EDWARD ISLAND ................ 3
IV.1 The Composition of Immigrants ............................................................... 4
IV.2 Broad Demographic Trends ..................................................................... 6
IV.3 Where Immigrants Come From .............................................................. 10
IV.4 Where Immigrants Go ............................................................................ 12
IV.5 The Retention of Immigrants .................................................................. 14
V. IMMIGRANTS IN THE LABOUR MARKET IN PRINCE EDWARD ISLAND ..... 15
V.1 Labour Force Growth ............................................................................. 15
V.2 Human Capital ....................................................................................... 16
V.3 Labour Market Outcomes ....................................................................... 19
VI. SKILLED AND BUSINESS IMMIGRANTS IN THE PRINCE EDWARD
ISLAND ECONOMY……………………………………………………………….....23
VI.1 Immigration of Highly Skilled Workers .................................................... 25
VI.2 Business Immigration ............................................................................. 35
VII. INTERNATIONAL STUDENTS IN PRINCE EDWARD ISLAND ....................... 38
VIII. MAJOR FINDINGS AND DIRECTIONS FOR FUTURE RESEARCH………….40
APPENDIX ................................................................................................................. 44

Profiles of Immigrants in Prince Edward Island ii
LIST OF TEXT TABLES Page TABLE 1: Prince Edward Island Population Net Growth Rate and Contribution of Recent Immigrants to the Growth of the Provincial Population ....... 8 TABLE 2: Age Distribution of New Prince Edward Island Immigrants (Principal Applicants) and Non-immigrants, 1981-2006 (%) ............................... 9 TABLE 3 Top Five Source Countries of Immigrants (Principal Applicants)
Destined for Prince Edward Island, by Year, 1981-2008………………11 TABLE 4: Geographic Distribution of Prince Edward Island Population by
Immigrant Status, 2006 ..................................................................... 12 TABLE 5: Immigrant Retention Rates for Prince Edward Island, 1981-2006 .... 14 TABLE 6: Prince Edward Island Labour Force Net Growth Rate and
Contribution of Recent Immigrants to the Growth of the Provincial Labour Force, 1981-2006 ................................................................. 16
TABLE 7: Immigrant Managers and Professionals in Prince Edward Island by Industry of Employment, 2001 .......................................................... 28 TABLE 8: Professionals in Prince Edward Island by Selected Occupations: Immigrants and Non-immigrants, 1991-2006 Censuses, Prince Edward Island ....................................................................... 30 TABLE 9: Managers and Professionals in Prince Edward Island by Employment Income, Unemployment Rate, and Country/Region of Birth, 2001 .................................................................................... 33 TABLE 10: Geographic Distribution of Highly Skilled Immigrants, Prince Edward Island, 2001 ………..…………………………………..34 TABLE 11: Immigrant Businesspersons by Industry, 2001 ................................. 36 TABLE 12: Immigrant Businesspersons in Prince Edward Island by Country/Region of Origin, 2001…………………………………………37 TABLE 13: Immigrant Businessmen and Businesswomen in Prince Edward Island by Geographic Distribution, 2001 ................... 37 TABLE 14: International Students Studying in Prince Edward Island by Top Source Countries, 2005-2008, as of December 1 ................ 39 TABLE 15: International Students Studying in Prince Edward Island by Gender and Level of Study, 2003-2007, as of December 1 ........ 39
Profiles of Immigrants in Prince Edward Island iii
LIST OF CHARTS Page CHART 1: Birth and Death Rates (Per Thousand) in Prince Edward Island (1946-2008) .............................................................................. 1 CHART 2: Immigrants (Principal Applicants) Destined for Prince Edward Island by Category, 1981-2008 ................................... 5 CHART 3: Immigrants (Principal Applicants and Dependents) Destined for the Atlantic Provinces, 1981-2008 ................................................. 7 CHART 4: Population Distribution in Prince Edward Island, 2006……………… 13 CHART 5: Immigrants Destined for Prince Edward Island and Non-immigrants with High School or Less Education ................ 17 CHART 6: Immigrants Destined for Prince Edward Island and Non-immigrants with University Degrees ................................... 18 CHART 7: Prince Edward Island Labour Force Participation Rates, Immigrants and Non-Immigrants, 1981-2006 .................................... 20 CHART 8: Unemployment Rates among Immigrants and Non-immigrants in Prince Edward Island, 1981-2006 ................................................. 21 CHART 9: Employment Incomes of Immigrants and Non-immigrants in Prince Edward Island, 1981-2006 ..................................................... 22 CHART 10: Percentage of Total Income Received as Government Transfers by Immigrants and Non-immigrants in Prince Edward Island,1981-2006 ...................................................... 23 CHART 11: Immigrants Destined for the Prince Edward Island Labour Force by Major Skill Classifications, 1981-2008 ................... 26

Profiles of Immigrants in Prince Edward Island iv
LIST OF APPENDIX TABLES Page A Note on Estimates of Population Published by Statistics Canada…………………………………………………….…..44 TABLE A1: Immigrants (Principal Applicants) Destined for Prince Edward Island in the Defined Period by Year, Category, Education Level, Language Ability (English, French or both), Age, Gender, and Occupation, 1994-2005 ..................................................................... 46
TABLE A2: Immigrants (Principal Applicants and Dependents) Destined
for Prince Edward Island, 1981-2008…………………………..………49 TABLE A3: Prince Edward Island Labour Market Statistics: Participation Rate,
Unemployment Rate, Employment Income, and Government Transfer Payments as a Percentage of Total Income for Immigrants and Non-immigrants, 1981-2006 .................................... 50
TABLE A4: Prince Edward Island Distribution of Population by Immigrant Status and Zone of Urban Influence, 2006 ....................................... 51

Profiles of Immigrants in Prince Edward Island v
EXECUTIVE SUMMARY
This report presents a detailed analysis of socioeconomic and demographic profiles of immigrants in Prince Edward Island for the period 1981-2008 by updating an earlier report that analyzed immigrant inflow data for the period 1981-2005 and resident immigrant data for the period 1981-2001. The earlier report was also entitled Socioeconomic and Demograhic Profiles of immigrants in Prince Edward Island and was co-authored by Ather H. Akbari, Scott Lynch, James Ted McDonald and Wimal Rankaduwa in 2007. This report extends the analysis of immigrant inflows data to 2008 and of resident immigrant data to 2006.
The term “immigrant” in the study refers to all foreign-born individuals who are
permanent residents of Canada. The primary data sources for the study are Citizenship and Immigration Canada (CIC) and Statistics Canada. Much of the required data are not available in the public domain so had to be acquired through specific data sharing agreements with Statistics Canada and CIC or the Internet Data Library System (IDLS) or by outright purchase from Statistics Canada. The period of analysis of this study is 1981-2008.
The CIC data on immigrant inflows are obtained from the landing documents of immigrants (mainly for the period 1981-2005) and Facts and Figures (various issues). The Statistics Canada data are drawn from the six population censuses conducted during the period, the latest of which was conducted in 2006. These data provide information on the resident immigrant population and also on non-immigrants. Thus, whenever a comparison of immigrant inflows with resident immigrants and non-immigrants was required, the period of analysis ended in 2006.
General immigration trends
PEI‟s share of the immigrant population falls well blow its share of the national population. Immigrants account only for less than 4 percent of PEI‟s total population, whereas they account for about 18 percent of Canada‟s national population. Until recently, PEI has typically attracted only less than one-tenth of a percentage point of annual immigrant inflows to Canada. The province‟s share of annual immigrant inflows has steadily increased since 2003 and reached a high of 0.6 percent in 2008.
Current and projected demographic trends in the province indicate that, as is the case with many other Canadian provinces, positive population growth can only be sustained through increased immigration. Immigrant inflows have become the most significant determinant of PEI‟s population growth in the recent past. The population growth of PEI during the period 2001-2006 was entirely due to the inflow of new immigrants.
Immigrants have been a relatively small but important source of growth in the labour force. Their contribution to the labour force growth more than tripled from 3 percent in the period 1981-86 to over 9 percent in the period 2001-2006. The overall

Profiles of Immigrants in Prince Edward Island vi
trend indicates that the contribution of immigrants relative to that of non-immigrants is increasing over time.
A majority of recent immigrants to PEI have been in the family class despite the federal government‟s increasing focus on skills-based immigration. In 2008, about 53 percent of recent immigrants to PEI have been in the family class, 31 percent in the refugee class, and 16 percent in the skilled class. The business class immigrant inflows have been very small.
Countries of origin and settlement patterns
The United States and the United Kingdom remained on the list of top five source countries of immigrants throughout the period except for 1991-95, when the UK was not among the top five for principal applicants and dependents, and in 2007, when US was not among the top five for principal applicants and dependents. Also, the combined share of US and UK immigrants decreased as the sources of immigrants diversified and increased over time. Most recently, Asian countries such as China, Korea and Taiwan together have accounted for more than the combined share of US and UK immigrants. In 2008, China alone accounted for 52 percent of immigrants About 70 percent of immigrants living in PEI live in Queens County, where more than 50 percent of the PEI population also lives. The second most important destination for immigrants has been Prince County. The Queens County and Prince County, where the two cities of Charlottetown and Summerside are located, respectively, jointly account for about 88 percent of immigrant population. Demographic profile The age profile of immigrants to PEI is tilted toward the lower age groups. More than 60 percent of principal applicants arriving in recent years were between 25 and 44 years of age and about 8 percent were aged 15-24. Another 26 percent were between 45 and 64 in the period 2001- 2005. The number of new immigrants aged 65 or more has been very small. Reliance on government transfer payments and services Government transfers as a percentage of total income for recent immigrants was lower than for non-immigrants and all immigrants, except in 1996. In 2006, recent immigrants received 16 percent of their income in government transfers, while non-immigrants and all immigrants received about 18 percent and 21 percent, respectively. New immigrants may receive a relatively lower proportion of their income in government transfers due to their younger age, which makes them ineligible for Canada Pension Plan and Old Age Security income. Also, they may not be eligible for Guaranteed Income Supplements or employment insurance due to their shorter length of stay.

Profiles of Immigrants in Prince Edward Island vii
Labour market outcomes Compared to non-immigrants, immigrants in PEI have attained higher education levels, earn higher employment income, and have lower unemployment rates. Recent immigrants are even more highly educated, with 42 percent of recent immigrants having one degree or more in 2006 compared to 16 percent of non-immigrants. The proportion of recent immigrants with a degree has increased over time, reflecting the increased focus on skills in federal government immigration policy. Recent immigrants have lower labour force participation rates than non-immigrants and immigrants. They also have unemployment rates higher than those of immigrants but lower than those of non-immigrants One issue of some concern is that the labour market outcomes of recent arrivals (those who arrived within five years of a census year) have not improved. A possible cause, as indicated by some researchers, is the non-recognition of immigrants‟ educational credentials and experience as more immigrants now come from non-traditional source countries. Skill levels Since the late 1980s, the numbers of low- and medium-skilled immigrants have displayed a downward trend. In the very recent past, these trends continued while the number of highly skilled immigrants steadily increased. Following a marked decrease in 2002, the number of skilled immigrants intending to settle in PEI increased beginning in 2003. In 2001, highly-skilled immigrants accounted for 52 percent of all skilled worker immigrants while low-skilled immigrants accounted for 10 percent. The proportion of highly- skilled immigrants increased to 87 percent while the share of low-skilled immigrants decreased to 4 percent in 2008. The proportion of medium-skilled immigrants declined from 39 percent to 9 percent between 2001 and 2008. Again, this is partly due to the strong skill bias inherent in the Canadian immigration points-based system. Highly skilled immigrants Throughout the period 1981-2005, highly skilled immigrants (managers and professionals) have comprised a significant and increasing proportion of immigrants destined for the labour force in PEI. In 2001, about 55 percent of highly skilled immigrants in PEI were professionals, 32 percent were middle and other managers, and 13 percent were senior managers. In 2008, these percentages had changed to 68, 26 and 6, respectively. The number of professionals increased while the number of managers decreased between 2001 and 2008. In 2001, immigrant professionals and managers were overwhelmingly engaged in the service sector. The service sector accounts for 67 percent of immigrant senior managers, 58 percent of immigrant middle managers and 100 percent of immigrant professionals. About 43 percent of immigrant middle and other managers were

Profiles of Immigrants in Prince Edward Island viii
employed in wholesale/retail trade and in accommodation and food services. Another 14 percent of immigrants employed as middle or other managers were in public administration. The proportion of professionals in PEI who were immigrants is relatively small (5 percent in 2001) and has declined over time. For immigrants employed as professionals, the two most important industries of employment were education (50 percent) and health care/social assistance (25 percent), therefore accounting together for about 75 percent of the total number of immigrant professionals. Overall, immigrants constitute a small but significant proportion of total professionals in PEI. However, over the 1991-2001 period, the number of non-immigrants employed as professionals increased at a faster rate than the number of immigrants employed as professionals. Nevertheless, despite their slower growth rates, immigrant professionals constituted a relatively small but important proportion during 1981-2005. Business immigration Business immigration is a potentially potent source of economic growth as it brings entrepreneurship, capital, innovation and expertise into the provincial economy. The total number of immigrant business persons in PEI has decreased from 596 to 585 between 2001 and 2006. In 2001, Immigrant business people were most active in agriculture (25 percent), followed by the categories of „other services‟, manufacturing, educational services, and health and social services (each about 12 percent).The United States and Netherlands have been the top source countries, with each accounting for about 31 percent of PEI‟s business immigrants. They are followed by the UK, which accounted for about 19 percent of PEI‟s business immigrants. The main county of residence for both male and female business persons is Queens County but with a significant gender disparity (385 immigrant businessmen to 200 immigrant businesswomen in 2006). Both sexes are much more likely to have unincorporated businesses than incorporated. Retention of immigrants In order to benefit from immigration, an immigration policy which not only counters adverse demographic trends in the long term but also manages the composition of skills to match the evolving needs of the province is of vital importance. The Provincial Nominee Program (PNP) has been an importance step in the formulation of such an immigration policy. Low rates of retention will only ensure that the gains from immigration do not last for a long term. Our findings indicate that the retention rate of recent immigrant arrivals in PEI decreased from 59 percent to 51 percent from the early 1980s to the early 1990s. In the census periods of 1996-2001 and 2001-2006, the retention rate of new immigrants increased again to 60 percent and 72 percent, respectively. The retention rate of PEI is relatively higher than that of Newfoundland and Labrador, but lower than that of New Brunswick, Nova Scotia and the Atlantic Region as a whole. Adoption of policies that facilitate economic and social integration of immigrants in PEI will be critical for further increases in the rate of retention. Such

Profiles of Immigrants in Prince Edward Island ix
policies must focus on improving the quality of settlement services and on expediting the process of foreign credential recognition, among other things. International Students International students enrolled in Canadian educational institutions are an increasingly important source of both revenue and human capital for the government and the economy. The top source countries for international students studying in PEI are the US, China, Japan, Korea India Saudi Arabia and Bangladesh. The top source countries for foreign students studying in PEI are the US, China, Japan, Korea, Nigeria, Germany and Australia. At present, PEI also receives students in smaller numbers from a large number of different countries. The data also reveal that the university-level international students account for the majority of all international students in PEI. Some research gaps and suggestions for future research The information presented in this report needs to be enhanced through surveys and additional research to inform policymakers about the economic impacts of immigrants and how best to attract immigrants and retain them. All of this information will be helpful in formulating immigrant retention policies by the province. The following are some of the key areas that should be addressed in future research.
Who out-migrates from PEI and why.
What factors specific to PEI motivate immigrants, whether skilled workers, business immigrants, refugees or family class immigrants, to leave or to stay.
The extent to which the human capital is being lost by failing to retain immigrants.
The extent to which the human capital of skilled immigrants from non-traditional sources is being lost through underemployment if they are pushed into low-skill, low-wage employment because their foreign-earned credentials are not recognized.
Whether immigrants out-migrate at rates different from the native born.
What specific factors deter business immigration to PEI or how enterprises set up by immigrants perform and what difficulties they face.
In addition to the above, systematic research is also needed to explore what mix of skills should be encouraged to meet current shortages and projected labour market needs of the province. Research on the effects of immigrants on the earnings and employment of non-immigrants, as well as their effects on the public treasury, can also provide useful information to understand their role in the economic development of PEI The data that will help fill the above research gaps are either lacking or are difficult to access. Additional information will have to come from surveys, which can provide the input for both quantitative and qualitative analyses of these issues so that effective policies can be formulated.
Profiles of Immigrants in Prince Edward Island 1
I. INTRODUCTION
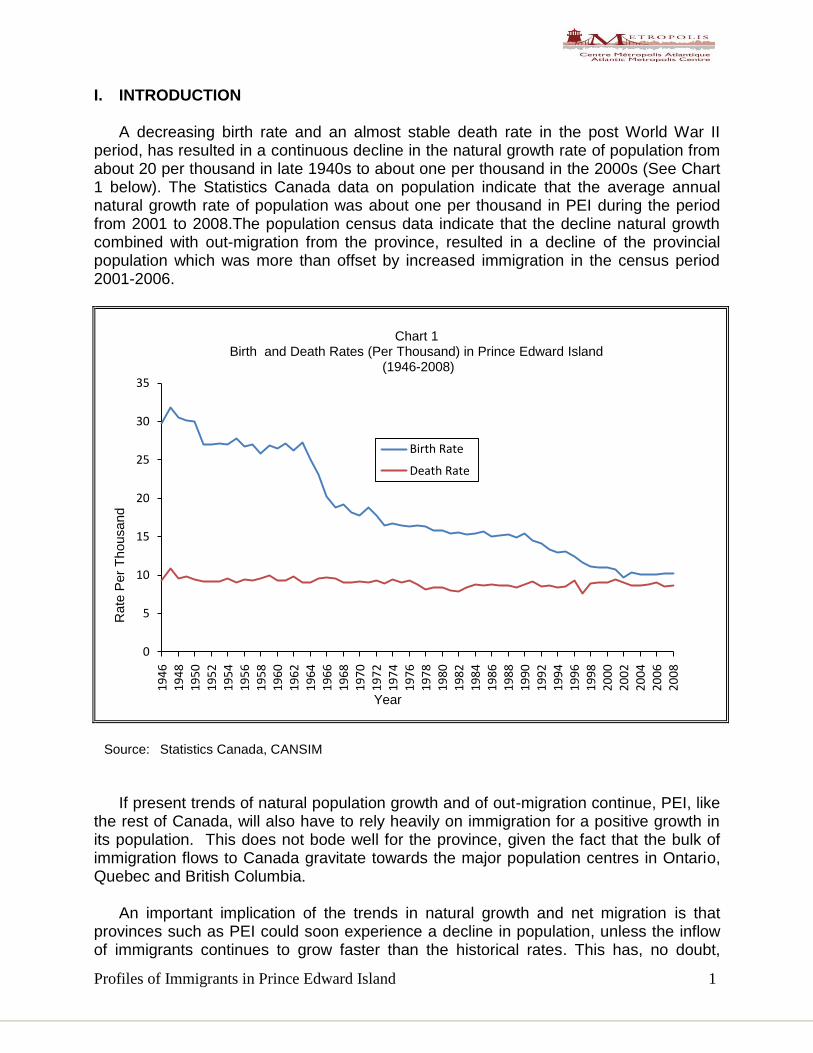
A decreasing birth rate and an almost stable death rate in the post World War II period, has resulted in a continuous decline in the natural growth rate of population from about 20 per thousand in late 1940s to about one per thousand in the 2000s (See Chart 1 below). The Statistics Canada data on population indicate that the average annual natural growth rate of population was about one per thousand in PEI during the period from 2001 to 2008.The population census data indicate that the decline natural growth combined with out-migration from the province, resulted in a decline of the provincial population which was more than offset by increased immigration in the census period 2001-2006.
Source: Statistics Canada, CANSIM
If present trends of natural population growth and of out-migration continue, PEI, like
the rest of Canada, will also have to rely heavily on immigration for a positive growth in its population. This does not bode well for the province, given the fact that the bulk of immigration flows to Canada gravitate towards the major population centres in Ontario, Quebec and British Columbia.
An important implication of the trends in natural growth and net migration is that provinces such as PEI could soon experience a decline in population, unless the inflow of immigrants continues to grow faster than the historical rates. This has, no doubt,
0
5
10
15
20
25
30
35
19
46
19
48
19
50
19
52
19
54
19
56
19
58
19
60
19
62
19
64
19
66
19
68
19
70
19
72
19
74
19
76
19
78
19
80
19
82
19
84
19
86
19
88
19
90
19
92
19
94
19
96
19
98
20
00
20
02
20
04
20
06
20
08
Rate
Per
Thousand
Year
Chart 1Birth and Death Rates (Per Thousand) in Prince Edward Island
(1946-2008)
Birth Rate
Death Rate

Profiles of Immigrants in Prince Edward Island 2
raised concerns about possible adverse economic consequences on the province, which would exacerbate regional imbalances in the standard of living, among other things. Negative population growth in PEI would slow the rate of growth of human capital formation, as well as of physical capital formation, both of which would impact adversely on the well-being of the resident population. Shortages in the availability of skilled workers, a decline in innovators, and shrinking markets of goods and services are all serious possible consequences of negative population growth. Such demographic projections raise questions about the roles of immigration and immigration policy can play in long-term economic development of PEI. It is not surprising, therefore, that the PEI government has recognized the need to boost immigration to the province in the categories of skilled workers and entrepreneurs, in articular. In this regard, important issues arise from the perspectives of attracting, integrating, and retaining new immigrants to the province and also of their impacts on labour markets, economic growth, and public finances. Unfortunately, research-based knowledge on the economic role of immigrants in PEI, which is essential for effective policy formation and implementation, is lacking.
This report is an effort towards building a broader and deeper stock of knowledge in
relation to the many economic issues that immigration to Prince Edward Island raises. Our focus in this report is to outline the important economic dimensions of immigration to PEI in promoting economic growth and development in the province. The report is organized as follows. Section II defines the objectives of the study, while Section III outlines the methodology used. Section IV presents a statistical outline of the economic, demographic and geographic characteristics of immigration to PEI since 1981. Sections V and VI review in greater detail the nature of economic immigration to PEI, and Section VII analyzes the trends in PEI‟s international student population. Section VIII presents our conclusions and outlines some areas for future research.
II. OBJECTIVES OF THE STUDY
The purpose of this report is to update an earlier report, which presented a detailed analysis of socioeconomic and demographic profiles of immigrants in Prince Edward in 2007, using more recent data obtainable from Statistics Canada (mainly population census data in 2006) and Citizenship and Immigration Canada. The earlier report, which was also entitled Socioeconomic and Demographic Profiles of immigrants in Prince Edward Island, analyzed immigrant inflow data for the period 1981-2005 and resident immigrant data for the period 1981-2001. This report extends the analysis of immigrant inflow data to 2008 and of resident immigrant data to 2006. The earlier report was co-authored by Ather H. Akbari, Scott Lynch, James Ted McDonald and Wimal Rankaduwa.
The primary objective of the study that resulted in the earlier and present reports is to analyze the socioeconomic and demographic profiles of immigrants in Prince Edward Island. This is achieved by the collection and tabulation of data on immigration to PEI for the period 1981-2008, and analyzing them with a focus on the socioeconomic, demographic and geographic dimensions of immigration. The analysis also helps identify some gaps in research that can provide necessary information for the formulation and implementation of policies and strategies relating to immigrant

Profiles of Immigrants in Prince Edward Island 3
attraction, integration and retention. Broadly, the study is expected to deepen our understanding of the challenges faced by immigration and economic policymakers in PEI.
III. METHODOLOGY
Following previous literature, the term “immigrant” is used in this study to refer to all foreign-born individuals who are permanent residents of Canada. To meet the objectives of the study, we tried to ensure that the approaches used for data collection and their analyses were reliable and easy to replicate. The primary data sources for this study are
Citizenship and Immigration Canada (CIC)
Statistics Canada
Some data used in this study were obtained from the web sites of the above government sources. However, much of the required data were not available in the public domain and had to be acquired through different channels. Some data were made available to the authors under the specific data sharing agreements of the Metropolis project team with Statistics Canada and CIC. Some Statistics Canada data were accessed through the Internet Data Library System (IDLS). Being a member of the Canadian Association of Research Libraries Data Consortium (CARLDC), the Patrick Power Library at Saint Mary‟s University shares this access with the University of Western Ontario under the Data Liberation Initiative (DLI). Some data were also purchased from Statistics Canada through a customized request, while some were provided by them as a courtesy, for which we are grateful.
The analysis we conducted was based primarily on descriptive tools. A distinction was made between immigrants destined for PEI and those who actually stayed in the province. Among those who stayed, separate data were also analyzed for more recent immigrants, i.e., those who arrived within five years before a population census, when possible. Some parts of the analysis also use data on the non-immigrant population to facilitate comparisons with immigrants.
The period of analysis of this study is 1981-2008. The CIC data, mainly on immigrant inflows, are based on the landing documents of immigrants and various issues of Facts and Figures. The Statistics Canada data are drawn from the six population censuses conducted during the period, the latest of which was conducted in 2006. The census data provide information on the resident immigrant and non-immigrant populations. Thus, whenever a comparison of immigrant inflows with resident immigrants and non-immigrants was required, the period of analysis ended in 2006.
IV. AN OVERVIEW OF IMMIGRATION TO PRINCE EDWARD ISLAND
This section analyzes annual immigration trends in PEI over the period 1981- 2008. These trends are based on micro data obtained from the Permanent Resident Data System (PRDS) and various issues of Facts and Figures provided by CIC.

Profiles of Immigrants in Prince Edward Island 4
Statistical profiles of immigrants resident in the province are also analyzed at five-year intervals along with a range of socioeconomic, demographic and geographic variables. These profiles are based on the six Canadian population censuses conducted by Statistics Canada in 1981, 1986, 1991, 1996, 2001 and 2006. The Public Use Microdata Files (PUMF) obtained from the 1981, 1986, 1991, 1996 and 2001 are used in analyzing the profiles during period from 1981 to 2005. By the time of writing this report, the PUMF from 2006 census have not been released for public use. These micro data were accessed through IDLS and CARLDC using the 2 percent individual sample. The microdata files include a weight variable to allow estimates of the population. However, for confidentiality reasons, Statistics Canada suppresses any variable frequency that falls below 25. Following the definition of immigrants found in immigration literature, foreign-born individuals are viewed as immigrants and Canadian-born as non-immigrants.
Immigration matters fall under federal jurisdiction although provinces can (and do) enter into intergovernmental agreements to tailor immigration to suit perceived provincial needs. However, the broad contours that define who gets in are largely set by the federal government. Under federal regulations, immigrants permitted to enter and stay in Canada can do so as refugees, family immigrants, or economic immigrants. In addition, individuals can also enter as provincial nominees according to criteria agreed on through provincial-federal agreements. IV. 1 The Composition of Immigrants
Summary Points
Family class immigrants comprise the largest category of immigrants destined for PEI, accounting for almost 53 percent of the total inflow in 2008, followed by refugees (about 31 percent) and skilled immigrants (16 percent).
The number and proportion of skilled immigrants decreased from 1981 to 2008. On average, the annual share of skilled immigrants decreased from 28 percent in the 1981-85 period to 11 percent in the 2006-08 period.
Business immigration accounts only for a small percentage of immigrant inflows to PEI. On average, the annual share of business immigrants was only about 2 percent of total principal applicants during the 2001-2008 period. This number was about 10 percent for the 1980s and 13 percent for the 1990s
Refugee class immigration reflects Canada‟s commitment to humanitarian principles, while the family class category is intended to foster family re-unification – that is, facilitating individuals to enter Canada if they have close relatives who are already permanent residents/citizens. Economic immigrants, on the other hand, are chosen because they are expected to make a direct positive economic contribution to Canada through the skills, expertise, entrepreneurship, or capital they bring with them. The economic class category itself comprises two major sub-categories: skilled workers

Profiles of Immigrants in Prince Edward Island 5
and business immigrants. In this study, the primary (but by no means exclusive) focus is on economic immigrants. Table A1 (Appendix) provides annual immigration inflows (of principal applicants) by class of immigrant destined for PEI over the 1981-2005 period. The trends in annual immigration inflows (of principal applicants) by class of immigrants destined for PEI are displayed in Chart 2. The number of immigrants (principal applicants) entering the province annually tripled between 1981 and 2008 as their number increased from 50 to 150. Immigrants entering in the family class of immigration to Canada constituted the largest category of immigrant inflows to PEI over the 1981-2008 period. The share of family class immigrants increased from 30 percent in 1981 to 53 percent in 2008. In the very recent past, the proportion of immigrants in the family class displays an upward trend. In general, annual inflow of family class immigrants was greater than that of skilled immigrants in number and proportion during the period from 1981-2008. In 1984 and 2004, family class immigration reached the highest level, constituting about 58 percent of total immigrants.
Source: Permanent Resident Data System (PRDS - microdata) 1981-2005, CIC and Facts and Figures 2008, RDM, CIC
The total number of immigrants entering PEI in the skilled class displayed a downward trend during the period from 1981 to 2002. The trend has been reversed since then. As a result the share of skilled immigrants increased from 9 percent to 16 percent between 2002 and 2008.However, the relatively low share of skilled immigrants should be of some concern to the policy makers.
0
10
20
30
40
50
60
70
80
90
1981 1984 1987 1990 1993 1996 1999 2002 2005 2008
Num
ber
Year
Chart 2Immigrants (Principal Applicants) Destined for Prince Edward Island by Category,
1981-2008
Family class
Skilled Workers
Business
Refugees

Profiles of Immigrants in Prince Edward Island 6
Also of concern is the decrease in the number of business immigrants. The number of immigrants entering on business visas has been consistently low over the entire period under study. The greatest decline in the business immigrant inflow was recorded in the recent past, with only two new arrivals on business visas over the period 2003-05, and none thereafter.
The number of immigrants in the refugee class showed an upward trend in the recent past, since 1998 in particular. The number of refugee class immigrants decreased between 2001 and 2004 but increased between 2005 and 2007. The number of refugee class immigrants increased to its highest at 83 in 2007 and declined to 46 in 2008. This class still accounts for about 31 percent of total immigrant inflows.
IV.2 Broad Demographic Trends
Summary Points
During the period 1981-2005, Prince Edward Island‟s share of annual immigration into Canada was about one-tenth of one percentage. Recently the province‟s share increased noticeably, reaching 0.22 percent in 2006, 0.45 percent in 2007 and a high of 0.60 in 2008.
The proportion of PEI‟s immigrant population fell steadily from 3.7 percent in 1981 to 3.6 percent in 2006
New immigrants accounted for about 10.4 percent of the population growth in the province during 1981-1986. In 1991- 1996, the contribution of immigrants increased to 10.6 percent of population growth. However, during the periods 1996-2001 and 2001-2006, the contribution increased significantly to 49.2 percent and 104.3 percent, respectively. Immigrants‟ contribution to population growth relative to that of non-immigrants has also increased over the three periods.
For the period 1981-2006, the age profiles of PEI‟s non-immigrant population and of newcomers to the province indicate that, at time of their arrival, immigrants were younger than the resident non-immigrant population, and this age difference has widened over time.
The fact that immigrants are younger than the resident population at the time of arrival suggests that for a long time after their arrival, immigrants are not likely to be heavy users of such age-related components of Canada‟s social security system as Canada Pension, Old Age Security benefits, and health care.
Chart 3 shows annual inflows of principal applicants and dependents into each of the Atlantic Provinces. In contrast to the other three Atlantic provinces, the inflow of new immigrants to PEI was relatively steady over the period 1981-2003, averaging slightly over 146 principal applicants and family members per year. More recently, new arrivals continuously increased from 310 in 2004 to 1483 in 2006, averaging over 736 annually

Profiles of Immigrants in Prince Edward Island 7
over the three years. It remains to be seen whether this increase over the historical trend will only be temporary.
Source: Permanent Resident Data System (PRDS - microdata) 1981-2005, CIC and Facts and Figures
2008, RDM, CIC
Prince Edward Island receives only a very small percentage of annual immigration flows into Canada. During the period 1981-2005, Prince Edward Island‟s share of annual immigration inflows to Canada was about one tenth of a percentage point. For most part of that period, it was less than one tenth of a percentage point. This share did not significantly change until 2006. On average, the annual share has fallen from 0.12 percent in the period 1981-1985 to 0.085 percent in the period 2001-2005. Recently, the province‟s share increased significantly and reached the highest of 0.599 percent in 2008. The share was 0.22 percent and 0.45 percent in 2006 and 2007 respectively. However, the PEI‟s immigrant inflow as a proportion of current provincial population is very small relative to other provinces outside of Atlantic Canada – particularly Ontario, Quebec, Alberta and British Columbia.
Table 1 below shows that immigration has become the most important component of population growth in PEI in the recent past. During the period 1981-1986, about 10.4 percent of the population growth was due to the arrival of new immigrants. In the period 1991-1996, only 10.6 percent of population growth was due to immigration. In the periods of 1996-2001, and 2001-2006, immigration accounted for 49.2 percent and 104.3 percent of total population growth of the province, respectively, becoming the most important component of population growth on the Island. As a result, the contribution by immigrants to population growth relative to that of non immigrants has also increased over time: 11.7 percent in 1981-1986; 11.9 percent in 1991-1996, 97.0 and percent in 1996-2001. The growth of new immigrants, however, could not
0
500
1000
1500
2000
2500
3000
3500
4000
1981 1984 1987 1990 1993 1996 1999 2002 2005 2008
Nu
mb
er
Year
Chart 3Immigrants (principal applicants and dependents) destined for the Atlantic
provinces 1981-2008.
NS
NB
NL
PEI

Profiles of Immigrants in Prince Edward Island 8
completely reverse the decline in population growth during 1996-2001. As a consequence, the population growth rate fell from 3.71 percent to 0.4 percent between the two periods of 1991-96 and 1996-2001. It is important to note that, during the most recent period of 2001-2006, the entire growth of population was due to the number of recent immigrants which more than offset the decline in the population without immigration.
Table 1: Prince Edward Island population net growth rate and contribution of recent immigrants to the growth of the provincial population
Period 1981-1986 1986-1991 1991-1996
1996-2001
2001-2006
End of period population 125,050 128,100 132,855 133385 134205*
Population change (1) 3830 3050 4755 530 820
Change without immigration (2) 3430 2930 4251 269 -35
Recent immigrants (3)1 400 120 504 261 855
Percentage contribution of immigration to population growth [(3/2)×100]
11.7 4.1 11.9 97.0 -2442.9
Percentage contribution of immigration to population growth [(3/1)×100]
10.4 3.9 10.6 49.2 104.3
Sources and notes: 1) For end of year population, Statistics Canada Catalogue number 97F0009XCB2001001 and Community Profiles 2006. 2) For recent immigrant data: a) 2006 census: Statistics Canada catalogue no. 97-564-XCB2006008.
b) 2001 census: Statistics Canada Catalogue number 97F0009XCB-2001004, c)1996 census: Statistics Canada Catalogue number 93F0023XDB96003, d) 1991 census: We thank Statistics Canada for providing us these data form their archive, e) 1986 census: Census 1986 PUMF-microdata, individual file, variable used: Year of immigration and immigrant status indicator.
3) Recent immigrants include those who arrived within five years prior to the census date. 4) PUMF data are not adjusted for undercoverage. Statistics Canada advises that trends exhibited in adjusted and unadjusted data are identical.
Note that Table 1 indicates only the direct contribution of recent immigrants to
population growth. Immigrants also contribute to population growth through reproduction and migration from other provinces of Canada. The proportion of immigrants in PEI‟s provincial population has been greater than that in Newfoundland and Labrador and slightly less than that in the rest of the Atlantic provinces and the Atlantic region as a whole. While the region‟s proportion decreased from 3.8 percent to 3.75 percent, the PEI‟s proportion decreased from 3.7 percent to 3.6 percent between 1981 and 2006. A detailed analysis of these changes is beyond the scope of this report. However, it is evident from the above numbers that if population growth resulting from natural growth and net interprovincial migration of non-immigrants remains negative, the promotion of immigration will be an important demographic policy tool in arresting the decline in population.

Profiles of Immigrants in Prince Edward Island 9
Table 2: Age distribution of new immigrants (principal applicants) and non-immigrants in Prince Edward Island 1981-2006 (%).
Age group
Immigrants
arriving
1981-1985
Non-
immigran
ts in 1986
Immigrants
arriving 1986-
1990
Non-
immigrants
in 1991
Immigrants
arriving 1991-
1995
Non-
immigrants
in 1996
Immigrants
arriving
1996-2000
Non-
immigrants
in 2001
Immigrants
arriving
2001-2005
Non-
immigrants in
2006
15-24 22.09 23.87 16.63 20.82 12.61 18.49 14.91 18.57 8.03 17.2
25-44 39.40 38.53 54.63 39.04 59.38 39.77 63.96 35.21 62.91 31.7
45-64 20.90 22.28 14.25 22.16 20.17 27.28 17.62 30.94 26.03 34.5
65+ 17.61 15.31 14.49 17.98 7.84 14.46 3.52 15.28 3.04 16.5
Total 100.00 100.00 100.00 100.00 100.00 100.00 100.00 100.00 100.00 100
Source: Recent immigrant data are based on 1) PRDS for 1986-2001 and 2) Facts and Figures (2008, special tabulations) for 2006. Non-immigrant data for 1986-2001 are based on Canadian population censuses (Public Use Micro data Files PUMF, individual files), Statistics Canada. For the period 1991-2001, the non-immigrant data are based on the variable "immigrant status indicator", while for 1986, these are based on the variable "year of immigration" since the "immigrant status indicator" was not provided with 1986 census PUMF. The 2006 census-based data are from Statistics Canada Cat. No. 97-556-X2006012 available on www.statcan.gc.ca
The demographic implications of population growth due to natural increase and new immigration can be very different. Much depends on the age profile (and fertility) of immigrants. Table 2 compares the age distributions of immigrant and non-immigrant residents of PEI. The declining proportion of population in the age group 15-24 years provides clear evidence for an aging population in the province. While immigrants to PEI are consistently younger on average than other residents, the gap in the age distributions between immigrants and non-immigrants has widened over the period: the proportion of new immigrants in the 25-44 year old age group increased from 39 percent in 1981-85 to 63 percent in 2001-05, while the proportion of new immigrants in the 65+ category fell from 18 percent in 1981-85 to 3 percent in 2001-05. These facts confirm the important implication of the economic theory of human capital investment that younger people are more likely to migrate than older people, because they have a longer time available in their lives to reap the benefits from their investment in migration. These facts also suggest that recent immigrants typically will not be heavy users of such age-related components of Canada‟s social security system as Canada Pension Plan, Old Age Security benefits, and health care since more than 70 percent of immigrants arriving in 2001-05 were less than 45 years of age on arrival.

Profiles of Immigrants in Prince Edward Island 10
IV.3 Where Immigrants Come From
Summary Points
The United States and the United Kingdom remained on the list of top five source countries throughout the period except for 1991-95, when the UK was not among the top five for principal applicants and dependents, and in 2007, when US was not among the top five for principal applicants and dependents.
The combined share of immigrants from the US and UK decreased as the sources of immigrants diversified and increased.
Most recently, Asian countries such as China, Korea and Taiwan together have accounted for more than the combined share of immigrants from the US and UK.
In 2008 China alone accounted for 52 percent of immigrants.
Table 3 indicates the top five source countries for immigrants to Prince Edward Island in terms of principal applicants and dependents. The proportion of immigrants accounted for by the top five countries varied between 41percent and 72 percent. The US and the UK remained on the list of top five source countries throughout the period except for 1991-95 when the UK was not among the top five, and in 2007 when US was not among the top five. The share of immigrants from US declined from 36 percent in 1981-85 to 4 percent in 2008. Between the same two time periods, the share of UK immigrants decreased from 11 percent to 4 percent. The combined share of US and UK immigrants decreased as the sources of immigrants diversified and increased over time. Since the early 1990s, the mix of top five source countries has shifted from the US, UK and other European countries towards Asian countries, although the US and UK remained in the top five source countries throughout the period. Other studies have shown that this shift started in the 1970s in terms of Canadian national immigrant inflows. Most recently, Asian countries such as China, Korea and Taiwan together have accounted for more than the combined share of US and UK immigrants. For example, in 2008, the share of immigrants from China, Korea and Taiwan was about 72 percent compared to the combined share of US and UK immigrants, which was about 8 percent. In 2008 China alone accounted for 52 percent of immigrants. The number and proportion of immigrants to Canada who settle in PEI are similarly very small. The general patterns are comparable whether principal applicants are considered alone or with their dependents

Profiles of Immigrants in Prince Edward Island 11
Table 3: Top Five Source Countries of Immigrants (Principal Applicants and Dependents) Destined for Prince Edward Island, by Year, 1981-2008
Principal Applicants and Dependents
1981-1985 1986-1990 1991-1995 1996-2001 2002 2003 2004 2005 2006 2007 2008
Rank Country Count Country Count Country Count Country Count Country Count Country Count Country Count Country Count Country Count Country Count Country Count
1 USA 221 USA 255 USA 157 Bosnia-Hercegovina
107 Sudan 18 USA 21 Korea 38 Korea 69 China 178 China 391 China 763
2 UK 66 UK 67 Bosnia-Hercegovina
81 USA 92 USA 14 Colombia 17 UK 36 USA 40 Korea 124 Korea 173 Korea 191
3 Netherlands 64 Poland 66 Hong Kong 71 Yugoslavia 69 Bosnia-Hercegovina
10 UK 13 China 32 China 39 USA 45 Taiwan 77 Taiwan 93
4 Vietnam 38 Netherlands 58 El Salvador 45 China 47 Iran 8 China 10 USA 27 UK 32 Taiwan 43 UK 48 USA 58
5 Iran 34 Vietnam 45 Iraq 45 UK 47 UK 6 Afghanistan 7 Afghanistan 25 Taiwan 28 UK 21 Serbia 40 UK 56
Total for 5 countries
423 491 399 362 56 68 158 208 411 729 1161
Province total 618 814 786 888 107 153 310 330 565 992 1456
Source: Permanent Resident Data System (PRDS - microdata) 1981-2005, CIC and Facts and Figures 2008, RDM, CIC

Profiles of Immigrants in Prince Edward Island 12
IV.4 Where Immigrants Go
Summary Points
About 70 percent of immigrants in PEI live in Queens County, where more than 50 percent of PEI‟s population also lives.
More than 80 percent of the immigrants destined for PEI during the 1990s indicated Queens County as their intended destination. In 2005, this percentage increased to 90%, a finding that is very important for population planners interested in developing new immigrant destinations that are smaller and predominantly rural to reverse the declining trend of rural populations.
Table 4 shows the geographic distributions of immigrants and native-born population (non-immigrants) in the 2006 census year. The table also shows the geographic distribution of recent immigrants. More detailed annual data on intended destinations of new arrivals are also included in Table A1 for the period 1981-2005.
Table 4: Geographic distribution of Prince Edward Island population by immigrant status, 2006.
CENSUS METROPOLITAN AREA
POPULATION NON-IMMIGRANTS
IMMIGRANTS IMMIGRANTS ARRIVING 2001-2006
Prince Edward Island
134250 129150 4785 855
Kings County 18420 17840 545 25
Queens County 71665 68125 3325 580
Prince County 44120 43185 910 250
Source: 2006 community profiles, Statistics Canada.
Immigrants in general, and recent immigrants in particular are more likely to live in Canada‟s larger urban centers. Similarly, immigrants to PEI are more likely to live in Queens County and Prince County where the two cities of Charlottetown and Summerside are located, respectively. The two counties jointly account for about 88 percent of immigrant population and about 86 percent of non-immigrant population. About 70 percent of immigrants in PEI live in Queens County, as does about 53 percent of the PEI population. In both of the other two counties (Kings and Prince), proportions of immigrant population are smaller than those of non-immigrants. Table A2 shows that more than 80 percent of the immigrants destined for PEI during the 1990s indicated Queens County as their intended destination. In 2005, this percentage increased to 90 percent. One possible explanation may be that those immigrants initially settling in the more populous counties are also more likely either to move to other areas of PEI or to leave the province entirely. Therefore, the fact that only
Profiles of Immigrants in Prince Edward Island 13
a smaller proportion of recent immigrants was destined to other areas of PEI should be a concern in averting rural depopulation in PEI. This issue should also be a subject of future research owing to a growing interest among Canadian population planners in developing new immigrant destinations outside larger urban centers.
Further insights into the geographic distribution of immigrants in Prince Edward Island is offered by the more direct classification system of population into rural and urban areas as used by Statistics Canada: the Metropolitan Influenced Zone (MIZ), which better differentiates areas of Canada outside of census metropolitan areas (CMA) and census agglomerations (CA). Census subdivisions outside these areas are classified into one of four zones of influence ranging from "strong" to "no" influence, according to the degree of influence that CMA/CAs have on them. This type of categorization has proven useful for developing rural-urban profiles because it highlights differences between types of rural-based labour market integration as a proxy for rurality.
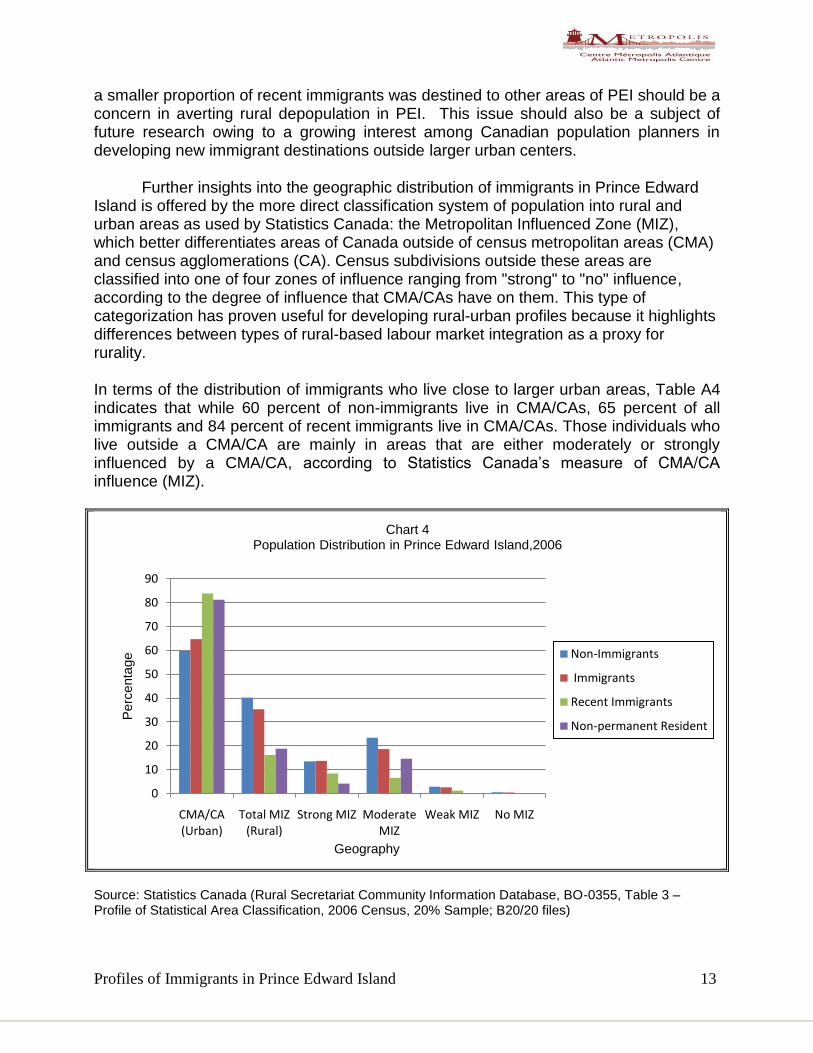
In terms of the distribution of immigrants who live close to larger urban areas, Table A4 indicates that while 60 percent of non-immigrants live in CMA/CAs, 65 percent of all immigrants and 84 percent of recent immigrants live in CMA/CAs. Those individuals who live outside a CMA/CA are mainly in areas that are either moderately or strongly influenced by a CMA/CA, according to Statistics Canada‟s measure of CMA/CA influence (MIZ).
Source: Statistics Canada (Rural Secretariat Community Information Database, BO-0355, Table 3 – Profile of Statistical Area Classification, 2006 Census, 20% Sample; B20/20 files)
0
10
20
30
40
50
60
70
80
90
CMA/CA (Urban)
Total MIZ (Rural)
Strong MIZ Moderate MIZ
Weak MIZ No MIZ
Perc
enta
ge
Geography
Chart 4Population Distribution in Prince Edward Island,2006
Non-Immigrants
Immigrants
Recent Immigrants
Non-permanent Resident

Profiles of Immigrants in Prince Edward Island 14
In general, the particular settlement patterns of immigrants pose a major policy challenge not simply because the pull of urban centers is strong for immigrants and non-immigrants alike, but also because of subsequent out-migration by immigrants currently living on PEI. This is the problem to which we will turn in the next section. IV.5 The Retention of Immigrants
Summary The retention rate of recent immigrants in PEI decreased from 59 percent to 51 percent from the early 1980s to the early 1990s. In the census periods of 1996-2001 and 2001-2006, the retention rate of new immigrants increased again to 60 percent and 72 percent, respectively. The retention rate of PEI is relatively higher than that of Newfoundland and Labrador, but lower than that of New Brunswick, Nova Scotia and the Atlantic Region as a whole.
If immigration is to make a lasting contribution to the PEI economy, retaining recent
arrivals is as important as attracting them. Table 5 shows that the retention rate of recent arrivals in PEI decreased from 59 percent to 51 percent from the early 1980s to the early 1990s. In the census periods of 1996-2001 and 2001-2006, the retention rate of new immigrants increased again to 60 percent and 72 percent, respectively. PEI‟s retention rate is relatively higher than that of Newfoundland and Labrador (60 percent), but lower than that of New Brunswick, (91 percent), Nova Scotia (75 percent) and the Atlantic Region as a whole (77 percent). Out-migration rates are likely to be highest in the first years after arrival, so retention rates of more established immigrants might be expected to be higher.
Table 5: Immigrant retention rates for Prince Edward Island, 1981-2006*
Period New immigrants arriving in PEI**
New immigrants residing in PEI at the
end of period Retention rate (%)
(1) (2) (3)=(2)/(1)×100
1981 - 1986 679 400 59
1986 - 1991 867 565 65
1991- 1996 835 430 51
1996 - 2001 807 485 60
2001-2006 1185 855 72
Source and notes: Column (1) data are based on tabulation requested from CIC. Column (2) data are based on Census of Canada (1986, 1991, 1996, 2001, 2006). *Retention rates may be slightly higher than reported because no provision can be made for deaths among new arrivals. **Data for the census year are only for the first five months.

Profiles of Immigrants in Prince Edward Island 15
Other evidence for Atlantic Canada suggests that out-migration occurs across all categories of immigrants and schooling levels. Specifically, a study by the Atlantic Provinces Economic Council (APEC, 2001) found that more than 70 percent of refugees destined for Atlantic Canada over the 1980-1995 period had out-migrated, while the corresponding rate was 55-60 percent for business immigrants and about 45 percent for skilled workers. The data required for computing these rates for individual provinces in Atlantic Canada are not available at the time of writing this report. However, it is likely that the numbers for Atlantic Canada also reflect the pattern of out-migration from PEI. Greater economic opportunities in large urban centers such as Toronto, Montreal, Vancouver and Calgary, combined with the presence of ethnic clusters, exert a strong pull on immigrants in PEI, except perhaps on those with secure employment and other ties to the region. The lack of adequate recognition of foreign credentials in the professions and trades and inadequate resources for settlement support are also likely to affect the retention rate of immigrants. This loss of economic immigrants is equivalent to a reduction in the provincial economy‟s stock of human capital, with damaging implications for long-term growth.
V. IMMIGRANTS IN THE LABOUR MARKET IN PRINCE EDWARD ISLAND Immigrants represent a vital human resource that can bring major economic and other benefits to Prince Edward Island. One way to assess how immigrants are doing in the economic sphere is to look at their contributions to the quantity and quality of human capital in the province and how they compare to the native born in terms of both various labour market outcomes and the level of their dependence on social transfers. We examine these in turn. V.1 Labour Force Growth
Summary New immigrants make a small but increasingly important contribution to the growth of labour force in PEI. Their contribution more than tripled from 3 percent to over 9 percent between the periods of 1981-86 and 2001-2006.
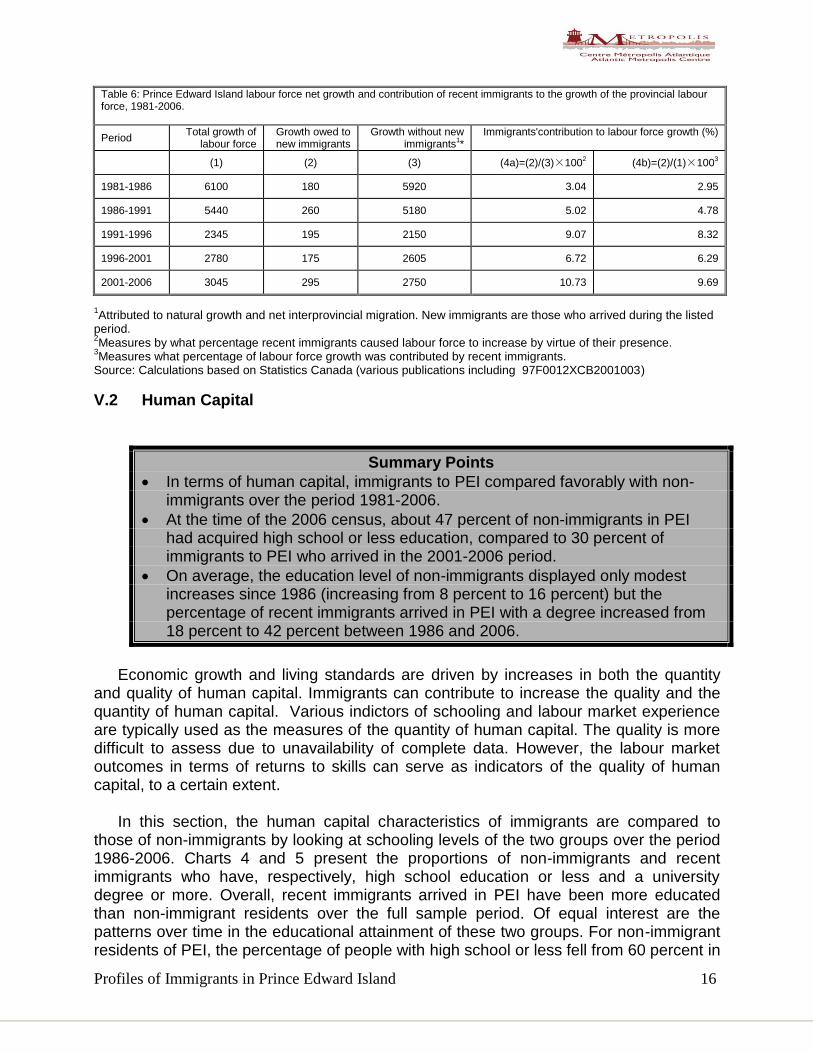
Labour force growth is an increase in the quantity of human capital and therefore contributes to improving an economy‟s productive capacity and the standard of living of its residents in the long term. Labour force growth in PEI over the period under study has slowed substantially. The number by which the labour force increased continuously decreased from the 1981-86 to 1990-96 period and slightly increased thereafter during the 1991-2006 period. The contribution of immigrants to the labour force growth decreased during the 1986-2001 period in absolute terms. However, in relative terms, their contribution to labour force growth more than tripled from 3 percent in the 1981-1986 period to over 9 percent in the 2001-2006 period. . The overall trend indicates that the contribution of immigrants relative to that of non-immigrants is increasing over time. Therefore, immigration very likely will be an increasingly important future source of growth in the provincial labour.
Profiles of Immigrants in Prince Edward Island 16
Table 6: Prince Edward Island labour force net growth and contribution of recent immigrants to the growth of the provincial labour force, 1981-2006.
Period Total growth of
labour force Growth owed to new immigrants
Growth without new immigrants
1*
Immigrants'contribution to labour force growth (%)
(1) (2) (3) (4a)=(2)/(3)×1002
(4b)=(2)/(1)×1003
1981-1986 6100 180 5920 3.04 2.95
1986-1991 5440 260 5180 5.02 4.78
1991-1996 2345 195 2150 9.07 8.32
1996-2001 2780 175 2605 6.72 6.29
2001-2006 3045 295 2750 10.73 9.69
1Attributed to natural growth and net interprovincial migration. New immigrants are those who arrived during the listed
period. 2Measures by what percentage recent immigrants caused labour force to increase by virtue of their presence.
3Measures what percentage of labour force growth was contributed by recent immigrants.
Source: Calculations based on Statistics Canada (various publications including 97F0012XCB2001003)
V.2 Human Capital
Summary Points
In terms of human capital, immigrants to PEI compared favorably with non-immigrants over the period 1981-2006.
At the time of the 2006 census, about 47 percent of non-immigrants in PEI had acquired high school or less education, compared to 30 percent of immigrants to PEI who arrived in the 2001-2006 period.
On average, the education level of non-immigrants displayed only modest increases since 1986 (increasing from 8 percent to 16 percent) but the percentage of recent immigrants arrived in PEI with a degree increased from 18 percent to 42 percent between 1986 and 2006.
Economic growth and living standards are driven by increases in both the quantity and quality of human capital. Immigrants can contribute to increase the quality and the quantity of human capital. Various indictors of schooling and labour market experience are typically used as the measures of the quantity of human capital. The quality is more difficult to assess due to unavailability of complete data. However, the labour market outcomes in terms of returns to skills can serve as indicators of the quality of human capital, to a certain extent. In this section, the human capital characteristics of immigrants are compared to those of non-immigrants by looking at schooling levels of the two groups over the period 1986-2006. Charts 4 and 5 present the proportions of non-immigrants and recent immigrants who have, respectively, high school education or less and a university degree or more. Overall, recent immigrants arrived in PEI have been more educated than non-immigrant residents over the full sample period. Of equal interest are the patterns over time in the educational attainment of these two groups. For non-immigrant residents of PEI, the percentage of people with high school or less fell from 60 percent in

Profiles of Immigrants in Prince Edward Island 17
1986 to 47 percent in 2006, while the percentage of people with a university degree or more increased from 8 percent to 16 percent over the same period. In contrast, the proportion of recent immigrants with high school or less fell from about 56 percent in 1986 to 30 percent in 2006, while the percentage of recent immigrants with a university degree more than doubled from 18 percent to 42 percent over the same period. This likely reflects in part the increasing preference for more highly educated immigrants through the immigration points system.
Source: Authors‟ special tabulations based on 1) Permanent Resident Data System (PRDS, CIC, microdata) for immigrants, and 2) the Canadian population censuses from 1981 to 2006 for non-immigrants; (for 1986-2001 PUMF individual files). Data are reported for those who aged 15 and over at the time of the census.
0
10
20
30
40
50
60
70
1986 1991 1996 2001 2006
Perc
enta
ge
Census Year
Chart 5Immigrants Destined for Prince Edward Island and Non-immigrants with High
School or Less Education
Recent immigrants
Non-immigrants

Profiles of Immigrants in Prince Edward Island 18
Source: Authors‟ special tabulations based on 1) Permanent Resident Data System (PRDS, CIC, microdata) for immigrants, and 2) the Canadian population censuses from 1981 to 2006 for non-immigrants; (for 1986-2001 PUMF individual files). Data are reported for those who aged 15 and over at the time of the census. The findings of this section point to increasing skill levels among immigrants in general. More significantly, they show that the educational level of immigrants is generally superior to that of non-immigrants in PEI. As we note later in our discussion of economic immigrants, they are also engaged in high-skill occupations in greater proportions than non-immigrant residents of PEI. Therefore, the human capital of immigrants makes a proportionately more positive economic contribution to the province than would otherwise be the case. The human capital characteristics represent a potentially higher economic contribution. However, this potential may not be fully realized if the quality of human capital that immigrants bring with them is not recognized, and overqualified workers are working in lower paying occupations. However, without data in requisite detail, it is impossible to assess the extent to which this is happening. Nevertheless, actual labour market outcomes can give us a sense of how immigrants perform in labour markets. This question is addressed in the next subsection.
0
5
10
15
20
25
30
35
40
45
1986 1991 1996 2001 2006
Perc
enta
ge
Census Year
Chart 6Immigrants Destined for Prince Edward Island and Non- immigrants with
University Degrees
Recent Immigrants*
Non-Immigrants

Profiles of Immigrants in Prince Edward Island 19
V.3 Labour Market Outcomes
Summary Points
Labour market outcomes (labour force participation rates, unemployment rates, and employment income) for immigrants in PEI differ from those of non-immigrant residents in a number of important respects: immigrants are less likely to be unemployed, have higher labour incomes on average, and receive slightly higher amounts of government transfers on average.
Recent immigrants have markedly different labour market outcomes compared to both non-immigrant residents and immigrants who arrived earlier. Recent immigrants are more likely to be in the labour force, be unemployed, and have lower earned incomes on average and receive lower levels of government transfers. While part of the difference is likely due to recent immigrants being younger and less experienced, it may also be due to a lack of recognition of recent immigrants‟ educational credentials.
Receipts of government transfers by recent immigrants were relatively lower in all census years but 1996. In 2001, the average amount of transfers received by recent immigrants was about 3 percent of their income, compared to 19 percent and 20 percent for non-immigrants and all immigrants, respectively. However, the gap between the non-immigrant and all immigrant groups in the proportions of income received in the form of government transfers has narrowed over time.
It is likely that immigrants‟ contribution to the PEI economy is not being fully realized.
Chart 7 displays labour market participation rates among non-immigrants and immigrants for the census years 1981-2006. Over the period 1981-2006, the labour force participation rate of non-immigrants was higher than that of the entire immigrant population aged 15 and over and also of recent immigrants, except for 1981. Over time, in general, the participation rate of non-immigrants slightly increased. In contrast, participation rates of all immigrants and recent immigrants decreased. By 2006, recent immigrants and all immigrants in PEI had labour force participation rates of about 46 percent and 55 percent, respectively. The rate for non-immigrants was 69 percent in 2006. The gap between the participation rates of recent immigrants and non-immigrants has increased over time.

Profiles of Immigrants in Prince Edward Island 20
*Recent immigrants are those who arrived within five years of the census year.
Source: See Table A3
Chart 8 provides data on the unemployment rates among immigrants and non-immigrants in the Census years during the period 1981-2006. In 1981, the unemployment rate for recent immigrants was slightly higher than that for non-immigrants. Since then, the unemployment rate among the entire immigrant population was generally lower than that of non-immigrants. Between 1981 and 2006, unemployment rates for all the three groups (all immigrants, recent immigrants and non-immigrants) decreased. Data for 2006 reveal that recent immigrants experience an unemployment rate lower than that of non-immigrants and noticeably higher than that for all immigrants. Changes over time in the unemployment rate of recent immigrants relative to non-immigrants may be explained in part by the changing composition of immigrants by source country. These changes coincide with the increasing importance of countries like China, Bosnia-Hercegovina and others in Asia as sources for PEI‟s immigrants.
0
10
20
30
40
50
60
70
80
1981 1986 1991 1996 2001 2006
Perc
enta
ge
Census Year
Chart 7Prince Edward Island labour Force Participation Rates,Immigrants and Non-
Immigrants,1981-2006
Non-immigrants
Immigrants
Recent immigrants*

Profiles of Immigrants in Prince Edward Island 21
*Recent immigrants are those who arrived within five years of the census year.
Source: See Table A3
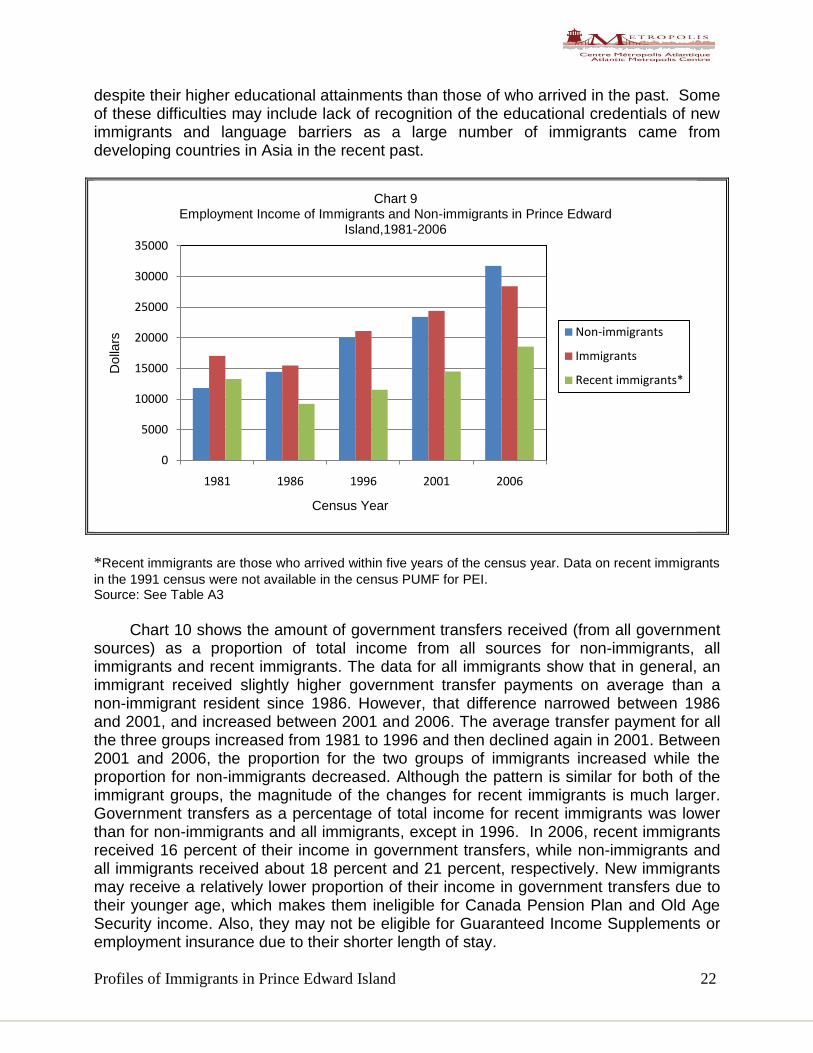
Chart 9 presents data on employment earnings in the Census years over the period 1981-2006. The data indicate that, on average, the employment income of immigrants was higher than that of non-immigrants until 2001. The employment income of recent immigrants was less than that of non-immigrants except in 1981. Their employment income has been lower than that of all immigrants throughout the period. In 2006, the employment incomes of both recent immigrants and all immigrants were lower than that of non-immigrants. As such, the recent immigrants earned about 42 percent less income than non-immigrants in 2006 while the category of all immigrants earned 11 percent less than non-immigrants. In general, immigrants earned more employment income on average than non-immigrant residents of PEI in each census year until 2001. The recent immigrants (arrived within five years of the census year) earned consistently less than non-immigrants, except in 1981, again likely due in part to recent immigrants being younger and less experienced. However, it has been established that even after controlling for those factors, recent immigrants earn less than comparable non-immigrant Canadians. Of comparable importance is the rate of increase of earnings of these recent immigrants as they become established in the local labour markets. Though this topic is examined in great detail at the national level, future work should examine trends in earnings for particular groups of immigrants such as those in PEI and the other Atlantic provinces. In general, the above findings on income disadvantage of recent immigrants in relation to non-immigrants and also on their rising unemployment rates indicate that newer immigrant arrivals face some difficulties in their labour market adjustments in PEI
0
2
4
6
8
10
12
14
16
18
20
1981 1986 1991 1996 2001 2006
Perc
enta
ge
Census Year
Chart 8Unemployment Rates among Immigrants and Non-immigrants in Prince Edward
island,1981-2006
Non-immigrants
Immigrants
Recent immigrants*
Profiles of Immigrants in Prince Edward Island 22
despite their higher educational attainments than those of who arrived in the past. Some of these difficulties may include lack of recognition of the educational credentials of new immigrants and language barriers as a large number of immigrants came from developing countries in Asia in the recent past.
*Recent immigrants are those who arrived within five years of the census year. Data on recent immigrants
in the 1991 census were not available in the census PUMF for PEI. Source: See Table A3
Chart 10 shows the amount of government transfers received (from all government sources) as a proportion of total income from all sources for non-immigrants, all immigrants and recent immigrants. The data for all immigrants show that in general, an immigrant received slightly higher government transfer payments on average than a non-immigrant resident since 1986. However, that difference narrowed between 1986 and 2001, and increased between 2001 and 2006. The average transfer payment for all the three groups increased from 1981 to 1996 and then declined again in 2001. Between 2001 and 2006, the proportion for the two groups of immigrants increased while the proportion for non-immigrants decreased. Although the pattern is similar for both of the immigrant groups, the magnitude of the changes for recent immigrants is much larger. Government transfers as a percentage of total income for recent immigrants was lower than for non-immigrants and all immigrants, except in 1996. In 2006, recent immigrants received 16 percent of their income in government transfers, while non-immigrants and all immigrants received about 18 percent and 21 percent, respectively. New immigrants may receive a relatively lower proportion of their income in government transfers due to their younger age, which makes them ineligible for Canada Pension Plan and Old Age Security income. Also, they may not be eligible for Guaranteed Income Supplements or employment insurance due to their shorter length of stay.
0
5000
10000
15000
20000
25000
30000
35000
1981 1986 1996 2001 2006
Dolla
rs
Census Year
Chart 9Employment Income of Immigrants and Non-immigrants in Prince Edward
Island,1981-2006
Non-immigrants
Immigrants
Recent immigrants*

Profiles of Immigrants in Prince Edward Island 23
*Recent immigrants are those who arrived within five years of the census year. Data on recent immigrants
in the 1991 census were not available in the census PUMF for PEI. Source: See Table A3
Overall, the evidence in this section suggests that labour market outcomes for immigrants are generally superior to those of non-immigrants in terms of lower rates of unemployment and higher levels of earned income. However, this is not true of recent immigrants, who appear to face greater difficulty in their labour market adjustment than those who arrived in the past. On the other hand, recent immigrants rely less on social transfers for income support than both the native born and immigrants in general. It is likely that the potential economic contribution to PEI‟s economy by immigrants is not being fully realized even though unemployment rates are relatively lower and employment incomes are higher for them. This becomes more apparent in the next section in which we review various aspects of economic immigration to Prince Edward Island. VI. SKILLED AND BUSINESS IMMIGRANTS IN THE PRINCE EDWARD ISLAND
ECONOMY
Skilled workers and business immigrants make up the so-called “economic” immigrant class. CIC defines the skilled worker class of immigrants as “people who may become permanent residents because they are able to become economically established in Canada.” (www.cic.gc.ca).
“Business immigrants are people who can invest in, or start businesses in Canada and are expected to support the development of a strong and prosperous Canadian economy. The Business Immigration Programs seek to attract to Canada
0
5
10
15
20
25
30
35
1981 1986 1996 2001 2006
Perc
enta
ge
Census Year
Chart 10Percentage of Total Income Received as Government Transfers by Immigrants
and Non-immigrants in Prince Edward Island,1981-2006
Non-immigrants
Immigrants
Recent immigrants*

Profiles of Immigrants in Prince Edward Island 24
people experienced in business. Business immigrants are selected based on their ability to become economically established in Canada.” (www.cic.gc.ca).
CIC also divides business immigrants into three classes. These include investor, entrepreneur, and self employed. Investors are experienced persons who must demonstrate business experience, have a minimum net worth of $800,000, and make an investment of $400,000. Entrepreneurs are experienced persons who will own and actively manage a business in Canada that will contribute to the economy and create jobs. Entrepreneurs must have business experience and a minimum net worth of $300,000 and are subject to conditions on arrival in Canada that include creation of at least one job for original Canadians. Finally, the self-employed are persons who must have the intention and ability to create their own employment by operating a business in Canada. They are also expected to contribute to the cultural or athletic life of Canada.
While PEI abides by national objectives that allow immigration on humanitarian grounds for refugees and others for family re-unification, the need to foster economic immigration suited to the long-term needs of the province is paramount. Immigration policy falls under federal jurisdiction, but all provinces can (and do) work out special arrangements for promoting immigration perceived to be in their interest. Quebec has had such an arrangement for many years, but smaller provinces such as Prince Edward Island have only fairly recently started to engage in such initiatives. The recently launched Provincial Nominee Program for Prince Edward Island reflects this new thinking towards enhancing the positive impact of immigration in the smaller provinces of Canada that traditionally have attracted relatively few immigrants. Since economic immigration is likely to be central to policy in PEI, it is important to examine it in detail. Therefore, this section analyzes data from a number of sources to shed light on the various dimensions of economic immigration to PEI. Our discussion will be divided into two parts – one dealing with skilled workers and the other with business immigrants. While LIDS provides data on the arrival of immigrants under the skilled and business classes, no direct data are available on the economic performance of those who arrived under these classes. However, the economic performance of immigrants who practiced different occupations in Canada can be assessed. This section of this study focuses on those immigrants who can establish themselves economically in Canada, so census data are analyzed only for those who worked as professionals and managers. The occupational matrix prepared by Human Resources and Social Development Canada (HRSDC) lists these two occupations among the top in terms of their educational and skill requirements. Finally, to assess the performance of immigrants in the business sector, data are analyzed for those who declared themselves “self-employed” on the census questionnaire.

Profiles of Immigrants in Prince Edward Island 25
VI.1 Immigration of Highly Skilled Workers
Summary Points
Since the late 1980s, the inflow of highly skilled immigrants has displayed a declining trend which has been completely reversed since 2003. The inflows of medium- and low-skilled immigrants have also shown declining trends between 1989 and 2003.
Between 2001 and 2008, the proportion of highly skilled immigrant workers increased from 52 percent to 87 percent while the proportion of low-skilled immigrant workers decreased from 10 percent to 4 percent
LIDS provides data on the occupational classifications of immigrants destined for the labour force according to the five classifications used by HRSDC. These classifications are used to derive the three occupational groups of “highly skilled”, “medium-skilled”, and “low-skilled” immigrants. Chart 10 provides annual trends of these three occupational groups of immigrants destined for PEI‟s labour force, showing that throughout the period 1981-2008, highly skilled immigrants (managers and professionals, i.e., groups “O and “A”) comprised a significant proportion of those destined for the labour force in PEI. Since the late 1980s, the numbers of low- and medium-skilled immigrants have displayed a downward trend. In the very recent past, these trends have changed and the number of highly skilled immigrants increased faster. Following a marked decrease in 2002, the number of skilled immigrants intending to settle in PEI increased as of 2003. In 2001, highly skilled immigrants accounted for 52 percent of all skilled worker immigrants while low-skilled immigrants accounted for 10 percent. The proportion of highly skilled immigrants increased to 87 percent, while the share of low-skilled immigrants decreased to 4 percent in 2008. The proportion of medium-skilled immigrants declined from 39 percent to 9 percent between 2001 and 2008. Recent changes in the skill level composition of immigrants (from low to high skilled) may be partly due to the strong skill bias inherent in the Canadian immigration points-based system and the provincial emphasis on attracting skilled immigrants to fill skill shortages in domestic labour markets.

Profiles of Immigrants in Prince Edward Island 26
1National Occupational Classifications (NOC) were further classified as highly skilled = “O” and “A”;
medium skilled = “B”, low skilled = “C” and “D”. Detailed definitions of NOC are provided in Table A1. Source: Permanent Resident Data System (PRDS, microdata, CIC) for 1981-2005 and Facts and Figures 2008, RDM, CIC.
0
25
50
75
100
125
150
175
200
225
250
275
300
325
350
375
1981 1984 1987 1990 1993 1996 1999 2002 2005 2008
Num
ber
Year
Chart 11 Immigrants Destined for the Prince Edward Island Labour Force by Major Skill
Classifications1, 1981-2008
Highly skilled
Medium skilled
Low skilled

Profiles of Immigrants in Prince Edward Island 27
Where Immigrant Managers and Professionals Work
Summary Points
About 55 percent of highly skilled immigrants in PEI in 2001 were professionals, 32 percent were middle and other managers, and 13 percent were senior managers. In 2008, these percentages had changed to 68, 26 and 6, respectively. The number of professionals increased while the number of managers decreased between 2001 and 2008.
Immigrant professionals and managers were overwhelmingly engaged in the service sector, which accounts for 67 percent of immigrant senior managers, 58 percent of immigrant middle managers, and 100 percent of immigrant professionals.
About 43 percent of immigrant middle and other managers were employed in the wholesale/retail trade and in accommodation and food services. Another 14 percent of immigrants employed as middle or other managers were in public administration.
For immigrants employed as professionals, the two most important industries of employment were education (50 percent) and health care/social assistance (25 percent).
Overall, immigrants constitute a small but significant proportion of total professionals in PEI, although over the 1991-2001 period, the number of non-immigrants employed as professionals grew at a faster rate than the number of immigrants employed as professionals.
. Table 7 depicts the distribution of managers (subdivided into two subgroups) and professionals by industry of employment in PEI in 2001. These immigrants may or may not have entered Prince Edward Island in the „skilled‟ immigrant visa class so may or may not be included in Chart 10. However, their current occupations are described as highly skilled occupations as they conform to the HRSDC definitions. Several facts emerge from this table. In 2001, among highly skilled immigrants, 55 percent were professionals, 14 percent senior managers and the rest, about 32 percent, middle and lower level managers. In 2008, these percentages had changed to 68, 26 and 6, respectively. In absolute terms, the number of professionals increased while the number of managers decreased between 2001 and 2008.
The data are not yet available for a detailed analysis of occupational distribution of immigrants in 2008. The data for 2001 show that immigrant professionals and managers are overwhelmingly engaged in the service sector: About 67 percent of immigrant senior managers, 58 percent of immigrant middle managers and 100 percent of immigrant professionals were employed in the service sector. About 43 percent of immigrant middle and other managers were employed in wholesale/retail trade and in accommodation and food services. Another 14 percent of immigrants employed as middle or other managers were in public administration. For immigrants employed as professionals, the two most important industries of employment were education (50

Profiles of Immigrants in Prince Edward Island 28
percent) and health care/social assistance (25 percent), together accounting for about 75 percent of the total number of immigrant professionals. Of the remainder of professionals, about 17 percent were employed in arts entertainment and recreation services and about 8 percent were employed in professional, scientific and technical services. There were only 112 immigrants employed as senior managers, out of which 75 were in other services excluding public administration and 37 were in manufacturing.
Source: Authors‟ special tabulations based on the Canadian population censuses 2001 (PUMF, individiual file) and 2006. Variables used: "Immigrant Status Indicator", "Occupation – Employment Equity Designations – based on the National Occupational Classification", and "Industry – based on the 1997 North American Industry Classification System [Naics]".
Table 8 provides the occupational distribution of highly skilled immigrants employed
as professionals in PEI for the 1991, 1996, 2001 and 2006 census years based on a 20 percent sample of individuals. Statistics Canada cautions that some numbers in Table 8 may be inaccurate due to the miscoding of some occupations; however, the data do permit comparisons between immigrants and non-immigrants and also between these groups and recent immigrants. Overall, immigrants constitute a small but significant proportion of total professionals in PEI. However, over the 1991-2006 period, the number of non-immigrants employed as professionals grew at a faster rate than the number of immigrants employed as professionals. In many categories of professionals, the number
Table 7: Immigrant Managers and Professionals in Prince Edward Island by Industry of Employment, 2001
Industry Managers Professionals
Senior Middle &
Other
No. %
No. % No. %
Agriculture, mining and utilities 0 0.0 0 0.0 0 0.0
Construction 0 0.0 0 0.0 0 0.0
Manufacturing 37 33.0 74 28.4 0 0.0
Service Industries: 75 67.0 150 57.5 448 100.0
Wholesale & Retail 0 0.0 38 14.6 0 0.0
Transportation, Warehousing, Information & Culture 0 0.0 0 0.0 0 0.0
Finance & Insurance 0 0.0 0 0.0 0 0.0
Real Estate, Rental & Leasing 0 0.0 0 0.0 0 0.0
Professional, Scientific, & Technical 0 0.0 0 0.0 38 8.5
Admn. Support, Waste Management & Remediation 0 0.0 0 0.0 0 0.0
Education 0 0.0 38 14.6 223 49.8
Health Care & Social Assistance 0 0.0 0 0.0 112 25.0
Arts, Entertainment & Recreation 0 0.0 0 0.0 75 16.7
Accommodation & Food Services 0 0.0 74 28.4 0 0.0
Other (excluding Public Administration) 75 67.0 0 0.0 0 0.0
Public Administration 0 0.0 37 14.2 0 0.0
Other (not specified) 0 0.0 0 0.0 0 0.0
TOTAL in 2001 112 100.0 261 100.0 448 100.0
TOTAL in 2006 45 100.0 200 100.0 520 100.0

Profiles of Immigrants in Prince Edward Island 29
of immigrants decreased or remained the same, while the number of non-immigrants increased. The net result was that the proportion of immigrants employed as professionals in many categories declined. Quantitatively, immigrant professionals are most likely to be employed as teachers and professors, but the immigrant share of this occupational group has remained relatively stable over the period even though the absolute number of teachers and professors actually increased between 1991 and 2006. Since 1991, the numbers of non-immigrants employed in most occupational groups grew significantly, including in business and finance occupations, computers and information systems, health-related occupations and occupations in the category of social science, education, government services and religion. In particular, the number of non-immigrants employed as other health professionals and other scientists increased by 417 percent and 394 percent over the period 1991-2006, while the number of immigrants employed in these occupations increased only by 200 and 180 percent. Immigrants constituted only about 0.77 percent and 0.72 percent of these professionals in 2006 while non immigrants constituted about 7.67 percent and 13.65 percent. Most other occupational groups showed either a decline or no growth at all in the number of immigrants employed in these jobs.

Profiles of Immigrants in Prince Edward Island 30
Table 8: Professionals in Prince Edward Island by selected occupations: immigrants and non-immigrants, 1991-2006 Censuses, Prince Edward Island
Census Year
PROFESSIONALS BY OCCUPATIONS 1991 1996 2001 2006
Business and Finance
Auditors, Accountants & Other Investment professionals
Non-immigrants 395 425 770 715
Immigrants 20 15 0 35
Recent immigrants 0 0 0 10
Other professionals in business and finance*
Non-immigrants 155 115 190 265
Immigrants 5 20 20 10
Recent immigrants 0 0 0 0
Natural and Applied Science and related
Engineers
Non-immigrants 165 320 240 240
Immigrants 10 25 25 0
Recent immigrants 0 0 0 0
Computer & Information Systems
Non-immigrants 285 330 1105 695
Immigrants 0 35 40 35
Recent immigrants 0 10 10 10
Other Scientists*
Non-immigrants 270 300 335 1335
Immigrants 25 25 30 70
Recent immigrants 0 5 10 15
Health professionals
Physicians, dentists and veterinarians
Non-immigrants 220 225 270 300
Immigrants 30 75 50 55
Recent immigrants 10 0 0 10
Other health professionals*
Non-immigrants 145 240 215 750
Immigrants 25 30 5 75
Recent immigrants 5 10 0 10

Profiles of Immigrants in Prince Edward Island 31
Contd.
Social science, education, government services & religion*
Judges, lawyers, Quebec notaries
Non-immigrants 160 175 225 200
Immigrants 10 0 10 10
Recent immigrants 0 0 0 0
Teachers and professors
Non-immigrants 2,355 2,210 2060 2405
Immigrants 165 145 135 185
Recent immigrants 15 15 10 10
Other professionals in Social Science, Education, Govt. Services and Religion*
Non-immigrants 1480 1535 1715 1460
Immigrants 75 95 95 60
Recent immigrants 15 0 0 10
Arts, culture, recreation, and sports
Musicians & singers
Non-immigrants 70 135 145 100
Immigrants 10 0 20 25
Recent immigrants 0 0 10 0
Other professionals in art and culture*
Non-immigrants 355 405 385 600
Immigrants 40 45 65 80
Recent immigrants 0 0 0 0
*Computed total of all other professionals in the occupation. Health professionals exclude nurse supervisors and registered nurses. Source: "Occupation - 1991 Standard Occupational Classification (Historical) (707B), Selected Labour Force, Demographic, Cultural, Educational and Income Characteristics (252) and Sex (3) for Population 15 Years and Over, for Canada, Provinces, Territories and Census Metropolitan Areas 1 , 1991 to 2001 Censuses - 20% Sample Data". Statistics Canada. Catalogure number 97F0012XCB2001048. Occupation - National Occupational Classification for Statistics 2006 (720C), Sex (3) and Selected Demographic, Cultural, Labour Force, Educational and Income Characteristics (273) for the Population 15 Years and Over of Canada, Provinces, Territories, Census Metropolitan Areas and Census Agglomerations, 2006 Census - 20% Sample Data

Profiles of Immigrants in Prince Edward Island 32
Employment Income, Unemployment Rates and Country of Origin of Highly Skilled Immigrants Table 9 reports data from PUMF on Managers and professionals in Prince Edward Island in 2001 by employment income, unemployment rate, country/region of birth. Statistics Canada has not yet released the PUMF data for public use for 2006. The data available at present show that the number of immigrants in each of the categories of managers has declined in 2006 compared to 2001. However, the total number of professionals has increased from 2001 to 2006. Table 9 shows that in each of the categories of all managers and professionals, immigrants accounted for about 5 percent of their respective total in 2001. Immigrant managers and professionals earned significantly less employment income compared to non-immigrant managers and professionals, respectively. On average, an immigrant senior manager earned 71 percent less than corresponding non-immigrant managers in 2001, while immigrant other managers earned 25 percent less than their non-immigrant counterparts. Immigrants in the category of all managers earned 34 percent less than their non-immigrant counterparts. Among professionals, the earnings gap was much larger, as immigrant professionals earned 39 percent less than non-immigrant professionals. Interestingly, unemployment rates for immigrant managers were much higher than for the corresponding non-immigrant groups. For the group of professionals, however, the unemployment rate among immigrants was nearly zero. Table 9 also shows that the United States and United Kingdom are the primary source countries of highly skilled immigrants, together accounting for 90 percent of all managers and 58 percent of professionals. Among managers, the third most common source region was continental Europe. Among professionals, the third most common sources were other Europe and the Netherlands, each accounting for about 17 percent of all immigrant professionals.

Profiles of Immigrants in Prince Edward Island 33
Table 9: Managers and Professionals in Prince Edward Island by Employment Income, Unemployment Rate, and Country / Region of Birth, 2001
Senior Managers Other Managers All Managers Professionals
Employment income ($)
Immigrants 15055 28085.03 25898.38 20770.63
Non-immigrants 52096.74 37453.41 39239.71 33810.33
Unemployment rate (%)
Immigrants 50 28.46 33.33 0
Non-Immigrants 0 8.29 7.35 4.40
Immigrants' Country / Region of birth
United States 0 112 112 149
United Kingdom 75 149 224 112
Germany 0 0 0 0
Netherlands 0 0 0 75
Other Europe 38 0 38 74
Asia 0 0 0 0
Other countries / regions 0 0 0 38
Total immigrants in 2001 113 261 374 448
Non-immigrants in 2001 746 6227 6973 9077
Total Immigrants in 2006 45 200 245 520
Source & notes: Special tabulations by authors based on Canadian population censuses 2001 (PUMF, individual file) and 2006. Mean employment income is calculated only for those employed in the reference week and includes wages and salaries and self-employment incomes. Unemployment rate = unemployed / (unemployed + employed) Total immigrants & non-immigrants include employed, unemployed and not in the labour force. Variables used: "Province or territory", "Place of birth", "Immigrant status indicator", "Labour Force Activity – In Reference Week", "Occupation – Employment Equity Designations – based on the National Occupational Classification", "Wages and Salaries", "Self-Employment Income".

Profiles of Immigrants in Prince Edward Island 34
Geographic Distribution of Highly Skilled Immigrants Table 10 shows the distribution of highly skilled immigrants by county of residence in PEI for 2001. Similar data for 2006 have not yet been released by Statistics Canada for public use. The table indicates that in 2001 highly skilled immigrants were located in all of the three counties but highly concentrated in Queens County, where Charlottetown is located. The distributions of managers and all immigrants reported in Table 4 appear to be very similar. That is, managers are distributed across the province similarly to the settlement patterns of immigrants to PEI overall. For professionals, the largest concentrations of immigrants are again in Queens County, with the distribution very similar to that of managers. Overall, immigrant professionals and managers are distributed across all PEI counties but are most highly concentrated in Queens County, where the provincial capital is located. Highly skilled immigrants earn less than highly skilled non-immigrants but also are more likely to be unemployed. As the previous section illustrated, the numbers of highly skilled immigrants grew more slowly than did the numbers of highly skilled non-immigrants, perhaps suggesting a failure to retain skilled managers and professionals in PEI. Whether productive potential is lost because of immigrants‟ departure is not known but needs to be explored.
Table 10: Geographic Distribution of Highly Skilled Immigrants, Prince Edward Island, 2001
County Senior Managers Other Managers Total for Managers Professionals
Kings 10 0 10 40
Queens 35 190 225 395
Prince 0 20 20 55
Other (not specified) 68 51 119 -42
Total in 2001 113 261 374 448
Total in 2006 45 200 245 520
Source: Census 2001 and 2006, Target Group Profile, Statistics Canada (customized tabulations).The “Other” category is computed as the difference between totals in Target Profile data and the PUMF data (Table 9). The negative numbers in the „other‟ category are intended to adjust the „rounded‟ column totals so they equal the actual total numbers for PEI as a whole.

Profiles of Immigrants in Prince Edward Island 35
VI.2 Business Immigration
Summary Points
The total number of immigrant business persons in PEI has decreased from 596 to 585 between 2001 and 2006.
In 2001, immigrant businesspeople were most active in the category of agriculture (25 percent), „other services‟, manufacturing, educational services, and health and social services (each about 12 percent).
The United States and the Netherlands have been the top source countries, with each accounting for about 31 percent of PEI‟s business immigrants, followed by the United Kingdom, which accounts for about 19 percent of PEI‟s business immigrants.
. Queens County is the main county of residence for business persons.
There is a significant gender disparity among business immigrants (325 immigrant businessmen to 195 immigrant businesswomen).
Both sexes are much more likely to have unincorporated, rather than incorporated, businesses.
While data on the economic performance of business immigrants are not directly available, census micro data permit the analysis of the performance of self-employed immigrants, some of whom will have recently arrived in Canada as business immigrants. The self-employed reported under the census terminology are those who were actually running their own business, incorporated or unincorporated, at the time of the census. The purpose of this section is to review the contribution of resident immigrants to PEI‟s business sector, so census data on the performance of self-employed immigrants will give a rough idea about the economic performance of these important immigrants. In the discussion that follows, the terms business immigrants and self-employed immigrants are used interchangeably.

Profiles of Immigrants in Prince Edward Island 36
Table 11: Immigrant Businesspersons by Industry, 2001
1
Industry Number
Agriculture 148
Other primary 0
Manufacturing 74
Construction 37
Transportation & storage 0
Communication & other utilities 0
Wholesale trade 0
Retail trade 38
Finance, insurance, & real estate 0
Business services 38
Educational services 74
Health & social services 74
Accommodation, food & beverage services 37
Other services 75
Total in 2001 596
Total in 2006 585
1 Data reported in this table are for those who reported as being self-employed in the year 2000.
Source: Special tabulations by authors based on the Canadian population censuses 2001(PUMF, individual file) and 2006. Variables used: "Province or territory", "Immigrant status indicator", "Class of worker", "Industry - based on the 1980 Standard Industrial Classification".
The Distribution of Immigrant Businesspersons in PEI by Industry and Country of Origin Table 11 shows the distribution of immigrant businesspersons by industry in 2001 and broadly indicates the industry in which that capital is located, although data are not available on the amounts invested. Immigrant business people are most active in agriculture (25 percent), followed by the categories of „other services‟, manufacturing, educational services, and health & social services (each about 12 percent). Comparable data are not yet available for 2006. However, the data available from the 2006 Census indicate that the total number of immigrant business persons in PEI has decreased from 596 to 585 between 2001 and 2006.

Profiles of Immigrants in Prince Edward Island 37
Table 12: Immigrant Businesspersons in Prince Edward Island by Country / Region of Origin, 2001
1
Country Number
United States 187
United Kingdom 111
Germany 37
Netherlands 186
Other Europe 37
Asia 0
Other 38
Total in 2001 596
Total in 2006 585
1 Data are for those immigrants who reported to be self employed in 2000.
Source: Special tabulations by authors based on Canadian population censuses in 2001 (PUMF, 2001, individiual file) and 2006 . Variables used: "Province or territory", "Immigrant status indicator", "Class of worker", "Place of birth".
Table 12 depicts the number of self-employed immigrants in 2001 by country of origin. The United States and the Netherlands were the top source countries, with each accounting for about 31 percent of PEI‟s business immigrants, followed by the United Kingdom, which accounts for about 19 percent of PEI‟s business immigrants.
Table 13: Immigrant Businessmen and Businesswomen in Prince Edward Island by Geographic Distribution 20011
County Men aged 15 years and over Women aged 15 years and over County
Self-employed (incorporated)
Self-employed (un-incorporated)
Total Male
Self-employed (incorporated)
Self-employed (un-incorporated)
Total Female
Grand Total
Kings 10 20 30 0 10 10 40
Queens 80 170 250 50 105 155 405
Prince 15 30 45 20 10 30 75
Total
(2001) 105 220 325 70 125 195 520
Total
(2006) 145 240 385 40 160 200 585
1 Data reported in this table are for those who reported they were self-employed in 2000.
Source: Censuses 2001 and 2006 Target Group Profile, Statistics Canada (customized tabulations in B20/20 format). The difference between the totals reported in Tables 11 and 13 could be because the geographic location of some respondents could not be identified on the census.
Immigrant Businesspersons in PEI by Type of Business, Gender and Geographic Distribution Table 13 shows for self-employed business immigrants the type of business set-up (incorporated or not) by gender, as well as by geographic distribution, in 2001 and that the main county of residence for male and female businesspersons is Queens County. Other counties get relatively small numbers of business immigrants. Thus, as in the case

Profiles of Immigrants in Prince Edward Island 38
for highly skilled immigrants, there is marked inequality in the distribution of business immigrants across PEI counties.
There is also a significant gender disparity in business immigration, with 385 immigrant businessmen to 200 immigrant businesswomen in 2006. For both men and women, businesses are much more likely to be unincorporated than incorporated, implying that the size of the typical business in PEI probably is not very large.
Entrepreneurial Investment by Industry in PEI An important category under business immigration is that of immigrant entrepreneur. CIC defines entrepreneurs as “experienced persons that will own and actively manage businesses in Canada that will contribute to the economy and create jobs. Entrepreneurs must demonstrate business experience, a minimum net worth of CDN $300,000 and are subject to conditions upon arrival in Canada.” The previous section viewed all self-employed individuals as business immigrants. Therefore, given CIC‟s definition of an entrepreneur, the self-employed in the census data could also include some entrepreneurs who manage their own business. However, since entrepreneurial immigrants are also required to present evidence of compliance with certain conditions established by the province, some industry-level data are available for the period 1995-2004 on the amounts of their investment and were obtained from CIC through special request. Unfortunately, for PEI, the data are available only for 1997, which indicates that immigrant entrepreneurs invested $15,000 in food and beverage services and $25,000 in shoe, apparel, fabric and yarn-related retail businesses in that year. VII INTERNATIONAL STUDENTS IN PRINCE EDWARD ISLAND
Summary Points
The top source countries for international students studying in PEI are the US, China, Japan, Korea India Saudi Arabia and Bangladesh.
At present, PEI also receives smaller numbers of students from a large number of different countries.
University students comprise the majority of international students.
International students are an important source of both income and human capital for both the provincial and national economies. The increasing competitiveness for international students among the main destination countries of Canada, the US, Australia and the UK has created increasing challenges for universities in Atlantic Canada wanting to attract high-quality students, with intense competition even within Canadian universities.

Profiles of Immigrants in Prince Edward Island 39
Table 14: International Students Studying in Prince Edward Island by Top Five Source Countries 2005-08 ,as of December 1.
2005 2006 2007 2008
United States of America 123 113 111 98
China, People's Republic of 38 59 96 135
Japan 18 12 13 21
Korea, Republic of 14 29 60 45
Bangladesh 12 13 X X
India X X 21 X
Saudi Arabia X X X 22
Top Five Source countries 205 226 301 321
Other Countries 140 179 175 200
Total with other source countries 345 405 476 521
Source: Facts and Figures 2008, RDM, CIC.
Table 14 presents the top source countries of immigrants studying in PEI for the period 2005-08, while Table 15 provides information about international students in PEI by gender and level of study for the period 2003-2007. The data for 2005-2008 indicate that the total number of international students is higher than the sum of the students from the top five source countries and is growing at a noticeable rate. This indicates that at present, PEI receives students from a large number of different countries in smaller numbers. Table 15 also reveals that university-level students account for the majority of international students. Their proportion increased from 61 percent to 75 percent from 2001 to 2006. This percentage has decreased in the following year to 68 percent. Female students accounted for the majority during the period from 2001to 2007. Table 15: International Students Studying in Prince Edward Island by Gender and level of Study, 2003-07 ,as of December 1 .
2003 2004 2005 2006 2007
Males 114 119 138 175 229
Secondary or less 29 17 22 22 43
University 73 89 98 132 151
Other sub-categories 12 13 18 21 35
Females 175 190 207 230 247
Secondary or less 35 26 22 42 55
University 125 152 170 171 172
Other sub-categories 15 12 15 17 20
Total 289 309 345 405 476
Secondary or less 64 43 44 64 98
University 198 241 268 303 323
Other sub-categories 27 25 33 38 55
Source: Facts and Figures 2007, RDM, CIC.

Profiles of Immigrants in Prince Edward Island 40
VIII. MAJOR FINDINGS AND DIRECTIONS FOR FUTURE RESEARCH The research conducted in this study analyzed, in some detail, the socioeconomic and demographic dimensions of immigration to PEI, with an emphasis on its economic role in the province since 1981. PEI‟s share of Canada‟s immigrant population is small and falls well short of its share in the national population, making it an immigrant-scarce province in relation to other provinces such as British Columbia, Ontario and Quebec. The province also receives a small share of annual immigrant inflows to Canada. Net out-migration from the province and falling fertility rates have raised questions about the adverse long-term implications for economic growth and development and therefore placed immigration at the centre of policy discussion. Policy formulation and implementation are, however, hampered by the limited body of research-based knowledge on many economic and social issues that immigration raises. This study is a step toward enhancing our understanding primarily of the economic dimensions of immigration to PEI. However, a number of information gaps need to be addressed. In concluding this report, we provide a sample of those gaps below. Our findings indicate that immigration flows to PEI are smaller than those of the other Atlantic provinces. Most of the immigrants who choose to live in PEI tend to settle in Queens and Prince counties that contain the province‟s two main cities– Charlottetown and Summerside. That only a very small fraction of immigrants chooses to settle in other more rural areas of the province highlights the need for developing immigrant destinations in rural areas. Research that investigates the factors that determine provincial choices of new immigrants, as well as their destination choices within a province, should interest rural population planners such as the Rural Secretariat, for whom re-population of rural areas is a priority. Such research could also be of interest to provincial immigration policymakers interested in attracting more immigrants to the province. The age profiles of previous and new immigrants to PEI indicate that greater proportions are in the younger age groups, confirming the economic theory that the young migrate. Due to the small inflows of immigrants each year, their age distribution would affect the age distribution of the PEI population only marginally. However, if their share increases, it could have a moderating effect on the aging trend in PEI directly and also indirectly over the longer term if immigrants have higher fertility rates. This will also increase labour force participation and contribute positively to long-term economic growth in the province. An investigation into the extent to which the current aging trend in the PEI population might be averted by various policy and strategic initiatives on immigration over the next few decades, under various possible fertility rates among immigrants, can provide useful information to population planners in the province. If immigration is viewed as one means to reverse the slowing down and declining population trends and the aging of the province‟s population, then an investigation of the labour market effects of immigrants is also important because an increase of immigrant workers has certain wage and employment implications for the host population. In this regard, two important research questions are 1) how do immigrants affect the wages paid to workers in PEI, and 2) do immigrants displace the original PEI workers in the province‟s labour force. While these questions have been answered in the past using
Profiles of Immigrants in Prince Edward Island 41
Canada-wide data, evidence for provincial labour markets and also for labour markets in small areas is lacking. This information would be useful for the debate on the role of immigration in the economic development of PEI. Some evidence on the labour market effects of immigration in small areas is particularly important if public policy is to encourage immigrant workers to settle in rural areas. One common notion among the public, which often appears in the media, is that immigrants are a drain on the public purse as they tend to consume more public transfers than the host population. It is also held that immigrants pay lower taxes than the amount of public transfers they consume. Our findings that immigrants are young at the time of their arrival and relatively highly educated, and that recent immigrants receive a relatively smaller proportion of their income in the form of government transfers, do not support such views. That many public transfers are age related (such as Canada Pension Plan and Old Age Security payments) and immigrants do not become eligible for these and some other transfers, such as employment insurance, for a period of time after arrival into the country support this view. Immigrants are also not likely to demand much health care service for a long time after arrival. However, they start to pay taxes, such as the sales tax, soon after arrival. Therefore, logically, over their lifetime immigrants would make a positive contribution to the provincial economy. A separate research project could also confirm or deny these implications by analyzing available data on immigrant earnings and their use of public transfers, health care services and education services. We also found that inflows of highly skilled immigrant (managers and professionals) have increased and exceeded both medium- and low-skilled flows in recent years despite the fact that family class immigrants are the largest group of immigrants into PEI by visa category. It is important to investigate 1) whether there is a shortage of professionals in the province and in what fields, 2) in which fields immigrant professionals can fill the shortages, and 3) in what fields immigrant professionals are more likely to face difficulties in getting their credentials and professional qualifications recognized. The role of entry barriers to certain regulated professions, such as health care and law, in preventing immigrants from practicing in those professions should also be investigated. Finally, a research study should also examine why the share of immigrant professionals has declined in some fields. Our analysis of data on skilled immigrants indicates that their labour market outcomes do not compare favourably with those of their non-immigrant counterparts. Immigrant managers and professionals earned significantly less employment income compared to non-immigrant managers and professionals, respectively. On average, an immigrant senior manager earned 71 percent less than corresponding non-immigrant managers in 2001, while immigrant other managers earned 25 percent less than their non-immigrant counterparts. Immigrants in the category of all managers earned 34 percent less than their non-immigrant counterparts. In the case of professionals, the earnings gap is much larger, as an immigrant professional earned 39 percent less employment income than non-immigrant professionals. Interestingly, unemployment rates for immigrant managers were much higher than for the corresponding non-immigrant groups. For professionals, the unemployment rate

Profiles of Immigrants in Prince Edward Island 42
among immigrants is nearly zero, but the tepid or negative growth of highly skilled immigrants in many professions over the 1991-2001 period might reflect a failure to retain these professionals. The loss of productive potential resulting from their departure is not known but needs to be explored. While this report provides a broad industrial breakdown of the employment of the skilled immigrants in the province, more detailed industrial and occupational breakdowns, as well as information on the size of the firms in which they are employed, could shed some light on the stability of their employment. Evidence gathered in this project also reveals that PEI does not fare well in terms of immigrant retention. The retention rate of recent arrivals in PEI decreased from 59 percent to 51 percent from the early 1980s to the early 1990s. However, in the most recent census period, the retention rate of new immigrants increased to 72 percent. Time and other resource limitations did not permit us to obtain data on out-migration of various classes of immigrants, but evidence suggests that new immigrants likely face adjustment problems in the labour market, as is evident by their higher unemployment rates and lower employment income. In general, the earnings of recent immigrants are markedly lower than those of non-immigrants and immigrants. Recent immigrants also tend to be younger, more educated and more highly skilled, so the earnings gap is of significant concern. Part of this poorer performance may be the result of non-recognition of immigrant credentials as a greater number of immigrants now come from “non-traditional” countries in Asia. Based on these findings, at least five important research questions emerge: 1) do immigrants from the newer source countries face a lack of credential recognition due to discrimination, 2) how does the rate of out-migration vary among immigrant classes, 3) do immigrants out-migrate at a rate different from non-immigrants, 4) how much human capital is lost due to out-migration of skilled immigrants from the province, and 5) what factors motivate immigrants to leave the province. Further research could shed light on these important issues. The census data used in this study to analyze the earnings of skilled and business immigrants do not distinguish between entry classes of immigrants. In other words, these immigrants may have arrived in Canada under other non-economic classes, such as the family or refugee class, but may have opened a business or begun to practice as professionals. Highly skilled immigrants are concentrated mainly in the service sector, particularly in education and health care/social assistance. The Longitudinal Immigration Data Base (IMDB) does permit analysis of the incomes of different entry classes of immigrants, however, so an analysis of these data might provide a more direct economic outcome of immigration policy. Business immigration is potentially an imortant source of economic growth in PEI because it brings entrepreneurship, capital, innovation and expertise to the provincial economy. In PEI, immigrant businesspeople are most active in agriculture (25 percent), followed by the categories of „other services‟, manufacturing, educational services, and health and social services (each about 12 percent). The United States and the Netherlands have been the top source countries, with each accounting for about 31 percent of PEI‟s business immigrants. They are followed by the United Kingdom, which accounts for about 19 percent of PEI‟s business immigrants. As, overall, business immigration has been a very small percentage of total immigrant inflows to PEI, future research should identify why PEI does not attract more business immigrants and

Profiles of Immigrants in Prince Edward Island 43
entrepreneurs. As in the case of skilled immigrants, data on out-migration of business class immigrants from the province could also not be obtained for this study due to time limitations but could be analyzed in a separate research study. We also need more detailed and reliable data on the amounts invested by business immigrants, the types of industries / businesses they invested in, the performance of their businesses, the industries/sectors in which immigrant entrepreneurs tend to do better, and the job creation of immigrant businesses in the province. This information will help draw overall conclusions about the role of business immigration in the economy of PEI. Some data that can answer the questions raised above are not published but can be obtained from Statistics Canada and CIC through special request. Additional information will have to come from surveys, which can then provide the basis for both quantitative and qualitative analyses to shed light on these issues so that more effective immigration policies can be formulated.

Profiles of Immigrants in Prince Edward Island 44
APPENDIX

Profiles of Immigrants in Prince Edward Island 45
A Note on Estimates of Population Published by Statistics Canada
Chart 1 of this report is based on population estimates published by the Demography Division of Statistics Canada. These data are different from the more accurate census data used elsewhere in the report.
To explain the discrepancy, the following information is reproduced from Statistics Canada‟s web site under the title Estimates of Population by Age and Sex for Canada, Provinces and Territories
The estimates program of Statistics Canada provides annual estimates of population by age and sex for Canada, provinces and territories. Demographic estimates can be categorized as either intercensal or postcensal. Intercensal estimates correspond to estimates between censuses, whereas postcensal estimates correspond to non-census years after the most recent census. In producing up-to-date figures, postcensal estimates are obviously more timely, albeit less accurate. The production of intercensal estimates involves the retrospective adjustment of past figures with the availability of new census data. Estimation
Postcensal estimates are obtained by adding the number of births, subtracting the number of deaths and by adding or subtracting the net impact of international and internal migration on the most recent census population adjusted for census coverage error (i.e. both census undercount and census overcount). The inclusion of non-permanent residents in the target population dictates that net change in the size of this subpopulation in Canada be added or subtracted from the base period.
Quality evaluation
The Census is considered to be a reliable benchmark for validating the postcensal population estimates. The error of closure (the difference between the postcensal estimate and the enumerated census population, adjusted for net undercoverage) provides a measure of accuracy for the postcensal estimates. It should be noted that it represents errors that have accumulated over the five-year period since the previous census. At the national level, the differences are small (0.32% for 1986, 0.15% for 1991 and 0.61% for 1996). At the provincial/territorial level, however, the differences are understandably larger, since the provincial/territorial estimates are affected by errors in estimating interprovincial migration, in addition to the other components which affect the total population estimates. Nevertheless, excluding the territories, the provincial postcensal estimates fall within 1% of the census counts with few exceptions (Newfoundland and Labrador in 1986, 1991 and 1996; Alberta in 1986; Prince Edward Island and Saskatchewan in 1991; and Quebec in 1996.

Profiles of Immigrants in Prince Edward Island 46
Data accuracy
The estimates of population by age and sex contain certain inaccuracies stemming from (1) errors in corrections for net census undercoverage and (2) imperfections in other data sources and the methods used to estimate the components. Errors due to estimation methodologies and data sources other than censuses are difficult to quantify but not insignificant. The more detailed the breakdown of the data, the larger the inaccuracy coefficient becomes. The component totals contain a certain amount of initial error, and the methodology used to classify them by sex and age, produces additional error in the figures at each stage. Nevertheless, the components can be divided into two categories according to the quality of their data sources: births, deaths, immigration and non-permanent residents, for which the sources of final data may be considered very good; emigrants, returning emigrants, net temporary emigrants and interprovincial migration for which the methods used may be a more substantial source of error. Lastly, the size of the error due to component estimation may vary by province, sex, and age and errors in some components (births and emigration) may have a greater impact on a given age group or sex. Intercensal estimates contain the same types of errors as postcensal estimates, as well as errors resulting from the way in which the errors present at the end of the period were distributed, that is, on the basis of the time elapsed since the reference Census.

Profiles of Immigrants in Prince Edward Island 47
Table A1: Immigrants (Principal Applicants) Destined for Prince Edward Island in the Defined Period by Year, Category, Education Level, Language Ability (English, French or both), Age, Gender, and Occupation, 1994-2005
Age group and
gender
1994 1995 1996 1997 1998 1999 2000 2001 2002 2003 2004 2005
Under 15
Male 0 2 0 0 0 1 1 4 0 0 1 1
Female 2 3 1 2 1 1 1 3 0 3 7 5
15-24
Male 2 7 4 2 3 7 12 3 5 4 6 0
Female 5 6 6 3 4 6 8 4 4 4 1 6
25-44
Male 22 28 26 35 30 31 34 32 24 30 37 49
Female 17 13 16 14 12 16 22 19 16 19 40 24
45-64
Male 6 9 9 10 4 8 14 7 6 12 27 35
Female 4 6 3 3 5 5 4 4 4 8 9 8
65 and up
Male 3 2 0 1 1 1 0 0 0 0 3 4
Female 6 1 3 0 0 3 4 3 4 0 0 0
TOTAL 67 77 68 70 60 79 100 79 63 80 131 132

Profiles of Immigrants in Prince Edward Island 48
Table A1 Continued…
Major
Occupations*
1994 1995 1996 1997 1998 1999 2000 2001 2002 2003 2004 2005
High skilled 18 25 14 14 5 8 14 16 4 19 33 43
Medium skilled 5 16 13 13 17 7 14 10 8 8 17 13
Low skilled 4 4 10 6 4 4 4 3 4 5 5 4
Total for labour
force
27 45 37 33 26 19 32 29 16 32 55 60
Total not for
labour force
36 28 29 37 34 58 67 50 47 48 68 66
TOTAL 63 73 66 70 60 77 99 79 63 80 123 126
Education Level
No education 4 0 1 2 1 2 4 9 2 5 9 5
High school or
less
31 27 31 25 24 32 35 25 34 24 21 23
Post secondary 8 16 16 14 17 17 23 17 10 15 31 36
Some university 4 9 3 5 2 5 9 6 4 5 8 3
University
degree
20 25 17 24 16 23 29 22 13 31 62 65
TOTAL 67 77 68 70 60 79 100 79 63 80 131 132
Language ability
English only 39 46 34 44 30 47 66 56 45 54 99 97
French only 0 2 0 0 1 1 1 0 1 0 1 4
Both English and
French
2 3 0 0 3 2 2 3 3 5 13 9
Neither English
nor French
26 26 34 26 26 29 31 20 14 21 18 22
TOTAL 67 77 68 70 60 79 100 79 63 80 131 132
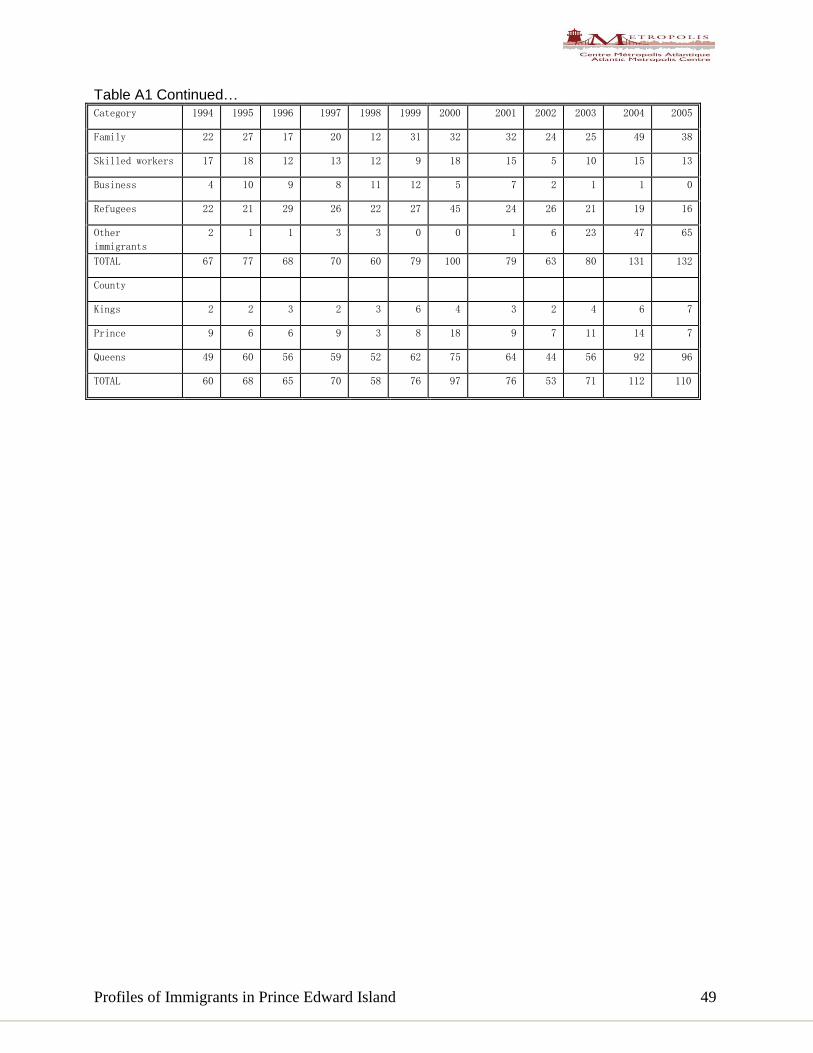
Profiles of Immigrants in Prince Edward Island 49
Table A1 Continued… Category 1994 1995 1996 1997 1998 1999 2000 2001 2002 2003 2004 2005
Family 22 27 17 20 12 31 32 32 24 25 49 38
Skilled workers 17 18 12 13 12 9 18 15 5 10 15 13
Business 4 10 9 8 11 12 5 7 2 1 1 0
Refugees 22 21 29 26 22 27 45 24 26 21 19 16
Other
immigrants
2 1 1 3 3 0 0 1 6 23 47 65
TOTAL 67 77 68 70 60 79 100 79 63 80 131 132
County
Kings 2 2 3 2 3 6 4 3 2 4 6 7
Prince 9 6 6 9 3 8 18 9 7 11 14 7
Queens 49 60 56 59 52 62 75 64 44 56 92 96
TOTAL 60 68 65 70 58 76 97 76 53 71 112 110

Profiles of Immigrants in Prince Edward Island 50
Table A2: Immigrants (principal applicants and dependents) destined for Prince Edward Island, 1981-2008
Year PEI NB NS NL Total Atlantic Canada
Total Canada
1981 126 988 1403 480 2997 128642
1982 165 751 1254 407 2577 121179
1983 105 554 833 275 1767 89192
1984 109 600 1035 299 2043 88276
1985 113 607 972 323 2015 84345
1986 168 640 1094 274 2176 99353
1987 160 641 1223 455 2479 152069
1988 152 674 1298 410 2534 161574
1989 158 902 1473 466 2999 191550
1990 176 853 1571 552 3152 216445
1991 150 686 1499 636 2971 232803
1992 151 757 2360 788 4056 254818
1993 163 706 3022 804 4695 256703
1994 161 627 3469 565 4822 224397
1995 161 643 3579 573 4956 212872
1996 150 717 3224 581 4672 226073
1997 144 663 2833 414 4054 216038
1998 136 723 2042 402 3303 174197
1999 135 660 1595 424 2814 189955
2000 189 759 1610 417 2975 227458
2001 134 798 1699 392 3023 250638
2002 107 705 1419 407 2638 229049
2003 153 665 1474 359 2651 221349
2004 310 795 1770 579 3454 235823
2005 330 1091 1929 496 3846 262240
2006 565 1646 2586 508 5305 251643
2007 992 1643 2523 546 5704 236758
2008 1483 1845 2653 623 6604 247243
Source: Facts and Figures 2008, RDM, CIC

Profiles of Immigrants in Prince Edward Island 51
Table A3: Prince Edward Island labour market statistics: participation rate, unemployment rate, employment income, and government transfer payment as Percentage of total income for immigrants and non-immigrants, 1981-2006
Census year 1981 1986 1991 1996 2001 2006
Labour force participation rate
Non-immigrants 63.8 66.9 70.8 69.6 70.4 68.9
Immigrants 61.4 64 59.3 58.5 56.4 54.5
Recent immigrants1 71.1 61 63.4 62.9 56.5 46.1
Unemployment rate (%)
Non-immigrants 15.7 17.9 15.7 15.8 15 11.1
Immigrants 12.3 12 10.9 11.2 9.4 9.3
Recent immigrants1 15.9 8.3 11.5 10.3 14.3 10.2
Employment income ($)
Non-immigrants (1) 11805.85 14455.77 18777.21 20078.27 23421.32 31759.00
Immigrants (2) 17043.79 15483.42 23282.10 21131.18 24395.37 28418.00
Recent immigrants1 (3) 13281.64 9213.33 N.A. 11539.00 14514.12 18558.00
Ratio (3/1) 1.13 0.64 N.A. 0.57 0.62 0.58
Government transfers (% of total income)
Non-immigrants 12.89 20.87 20.40 21.97 18.61 17.80
Immigrants 6.59 23.24 19.92 24.10 19.48 20.50
Recent immigrants1 1.67 10.39 N.A. 32.62 2.56 15.80
1. Recent immigrants those who arrived within five years of the census data. Since they include those who arrived in
the census year and in the prior year; hence, their entire year‟s performance is not reflected. Sources and notes: 1. Labour force participation and unemployment rates are based on "Historical Labour Force Activity (Based on the 1971 Concepts) (8), Immigrant Status and Period of Immigration (10), Age Groups (18), Marital Status (7) and Sex (3) for Population 15 Years and Over, for Canada, Provinces and Territories, 1971, 1981 to 2001 Censuses - 20% Sample Data". Ottawa: Statistics Canada, March 25, 2003, Census of Canada, Catalogue number 97F0012XCB2001003. The rest of the data are based on special tabulations performed by the author based on population censuses (PUMF, 1981-2001, individual files). 2. All income data are averages. Data on recent immigrants include those who arrived in the census year and in the year prior to it, so do not reflect their entire year‟s performance. Employment income is equal to the sum of wages and salaries and self-employment income and is reported only for those who were employed. 3. The following variables were used to obtain government transfers as a percentage of total income: For the 1991, 1996 and 2001 censuses, "total income" and "total government transfer payments" were available directly. For the 1986 census, "total income", "Old age sec pension & guaranteed income supplement (OASGIP)", "Canada, Quebec pension plan benefits (CQPPBP)", "Family allowances (FAMALP)", "Federal child tax credits (CHDCRP), "Unemployment insurance benefits (UICBNP)" and "Other government transfer payments (GOVTIP)" were added. For the 1981 census, "total income", "OAS, GIS, CQPP", "Unemployment insurance benefits (UICBN)" and "Other government transfer payments (GOVTI)" were added. 4. All labour force and income information are for the year prior to the census year. 5. The 1991 PUMF does not does not provide separate data on recent arrivals in the Atlantic provinces. 6. The 2006 census-based data are from target group profile,B20-20 files.

Profiles of Immigrants in Prince Edward Island 52
Table A4: Prince Edward Island Distribution of Population by Immigrant Status and Zone of Urban Influence, 2006 Table A4: Prince Edward Island Distribution of Population by Immigrant Status and Zone of Urban Influence,2006
Non-Immigrants
Immigrants
Recent Immigrants
Non-permanent Resident
Total Population
CMA/CA (Urban) 70225 3005 700 195 74125
Total MIZ (Rural) 47280 1640 135 45 49100
Strong MIZ 15830 635 70 10 16545
Moderate MIZ 27490 865 55 35 28445
Weak MIZ 3290 120 10 0 3420
No MIZ 670 20 0 0 690
Non-Immigrants
Immigrants
Recent Immigrants
Non-permanent Resident
Total Population
CMA/CA (Urban) 59.76 64.69 83.83 81.25 60.15 Total MIZ (Rural) 40.24 35.31 16.17 18.75 39.85
Strong MIZ 13.47 13.67 8.38 4.17 13.43
Moderate MIZ 23.39 18.62 6.59 14.58 23.08
Weak MIZ 2.80 2.58 1.20 0.00 2.78
No MIZ 0.57 0.43 0.00 0.00 0.56
Source: Statistics Canada (Rural Secretariat Community Information Database, BO-0355, Table 3 – Profile of Statistical Area Classification, 2006 Census, 20% Sample; B20/20 files)

Profiles of Immigrants in Prince Edward Island 53
THE END