socio-economic framework -...
TRANSCRIPT

SOCIO-ECONOMIC FRAMEWORK
The European Union, with its almost four millionsquare kilometres, has a surface area equal to approx-imately two-fifths that of the United States and China.The surface area of Italy, at 301,336 km2, accountsfor 7.7% of the entire European surface area.
In terms of population, the European Union’s ap-proximately 459 million inhabitants put it in thirdplace worldwide, after China and India. Within the 25-member European Union, Italy ranks after Germany,France and the United Kingdom among the mostpopulous European countries, with 59,131,287 res-idents as of 31 December 2006.
The population density in Italy is 195 inhabitants persquare kilometre. Though regions such as Campania(426), Lombardy (397) and Latium (308) registerfigures for population density well above the nation-al level.
Thanks to the expansion of the European Union from15 to 25 member countries, the Gross Domestic Prod-uct (GDP), meaning the sum of the goods and serv-ices produced by the European Economy is nowgreater than that of the GDP of the United States.
A number of the main territorial and demograohic statistics for Italy
Maximum extension (km) 1,200
Territorial surface area (km2) 301,336
Regions 20
Provinces 107
Municipalities 8,101
Resident population 59,131,287
Foreign residents 2,670,514
Families 23,600,370
Members per family 2.5
Population density (inhab./km2) 195
1
SOCIO-ECONOMIC FRAMEWORK

Between 1970 and 2006 the main aggregates of theincome statement for national resources and invest-ments registered considerable growth, with the GDPdoubling, along with consumption and investments,while imports and experts were quadrupled.
Looking at the specific figures for 2006, the nation-al GDP stood at 1,255,848 billion euro, calculated invalues keyed to the reference year of 2000, while na-tional consumption (75% of which was determined bythe spending of resident families) was equal to991,544 billion euro.
In all the European Union member States (EU25),more than 60% of the GDP (69.3% in Italy) is gener-ated by the tertiary sector (which includes banking ac-tivities, tourism, transport and insurance). Industryand agricultural, though they still play significantroles, have declined in economic importance in recentyears. In Italy, the incidence of the primary sector interms of value added for 2006 was only 1.9 percent-age points (as compared to 8.1% in 1970), while theindustrial sector (meaning industry in the strict sense,plus construction) accounted for 28.8% (as com-pared to 41.4% in 1970).
Main aggregates of the income statement of resources andinvestments.
*= values keyd to the references year of 2000
200
400
600
800
1,000
1,200
1,400
1970 1976 1982 1988 1994 2000 2006
Gross domestic product at market prices
Imports of goods and services (Fob)
National consuption
Gross fixed investments
Exports of goods and services (Fob)
billi
ons
of e
uro*
ENVIRONMENTAL DATA YEARBOOK VADEMECUM
2

CLIMATE CHANGE
During 2007, the scientific community, political deci-sion-makers and public opinion focused their attentionon the issue of climate change.
Global warming is unmistakable, and it is highly like-ly probable that anthropogenic emissions of green-house gases are the cause.
Recent worldwide analyses confirm the estimate of anaverage warming of the earth’s surface of approxi-mately 0.74°C over the last century; over the last 50years, the rate of warming (+0.13°C per decade)has nearly doubled, as compared to the last 100years. As far as Italy is concerned, the most recent es-timates obtained by APAT point to a decrease of0.6°C in the average temperature between 1961and 1981, followed by an increase of 1.54°C through2006, for an overall increase of approximately 0.94°Cin 45 years.
Mean temperature anomaly series (with respect to 1961-1990 normals) and estimated trend between 1961 and2006. Global (blue) and Italy (red)
- 1
0
1
2
Global Global Trend
Italy Trend for Italy
19
61
19
64
19
67
19
70
19
73
19
76
19
19
19
82
19
85
19
88
19
91
19
94
19
97
20
00
20
03
20
06
°C
1.5
0.5
-0.5
CLIMATE CHANGE
3

In the case of Italy, the probability of impact from cli-mate change is highest for water resources, biodiver-sity and forests, plus soil, marine-coastal environ-ments, agriculture and fishing activities and tourism.
In terms of the main greenhouse gas, the averageglobal concentration of carbon dioxide has risen from280 ppm during the period 1000-1750 to 379 ppmin 2005, paralleling a rise in carbon dioxide emissionsfrom practically zero to approximately 26.6 billion tons,taking into account only emissions generated byprocesses of combustion.
Italy is not exempt from this upward trend in the emis-sion of greenhouse gases: the most recent figuresfrom the National Inventory show that emissions in-creased from 516.85 to 579.55 million tons CO2eqduring the period 1990-2005, for a 12.1% rise, while,according to the Kyoto Protocol, Italy should reduceits emissions, during the period 2008-2012, to levels6,5% lower than those of 1990, i.e. to 483.26 MtCO2eq; as of 2005, therefore, greenhouse gas emis-sions exceeded the objective by slightly more than 96million tons (approximately +20%).
Total greenhouse gas emissions and level set for compliancewith the Kyoto Protocol
~ 20%
Greenhouse gas emissions Kyoto protocol
equ
ival
ent
ENVIRONMENTAL DATA YEARBOOK VADEMECUM
4

Within the European Union (EU15), there is no ques-tion that the great majority of the countries are not inline with the objectives set under the Kyoto Protocol.Germany has met the objectives, while the United King-dom, Finland, France and Sweden reduced emis-sions in 2005 beyond the objectives set for the peri-od of 2008-2012.
The main response measures involve mitigation(meaning the reduction of greenhouse gas emis-sions) and adaptation to the climate changes under-way.The policy framework defined by the European Coun-cil for the EU sets the following objectives for 2020: – reduction of greenhouse-gas emissions by 20%
compared to 1990; – 20% of total energy consumption to be contributed
by renewable sources;
CLIMATE CHANGE
5
Comparison of greenhouse gas emissions levels in 2005, com-pared to the benchmark year of 1990, and the Kyoto objec-tive for the period 2008-2012 in the European countries(EU27)
Cyprus; 63.7Malta; 54.8Spain; 53.3; 15.0
Greece; 26.6; 25.0Ireland; 26.3; 13,0
Austria; 18.0; -13.0Italy; 12.1; -6.5
Slovenia; 0.4; -8.0
Netherland; -0.4; -6.0Belgium; -1.3; -7.5France; -1.6; 0.0
Denmark; -7.0; -21Finland; -2.5; 0.0
Sweden; -7.3; 4.0United Kingdom; -14.8; -12.5
Hungary; -30.7; -6.0Polond; -32.0; -6.0
Romania; -45.6; -8.0Bulgaria; -47.2; -8.0Estonia; -50.9; -8.0Lithuania; -54.1; 8.0Latvia; -58.9; -8.0
-70 -50 -30 -10 10 30 50 70%
% 2005-1990
Kyoto Objective
Germany; -18.4; -21.0Czech Republic; -25.8; -8.0
Slovakia; -33.6; -8.0
Luxemburg; 0.4; -28
Portugal; 42.8; 27.0

Overall production of energy from renewable sources in fos-sil replacement equivalent
0
2
4
6
8
10
12
14
16
18
Hydroelectric Wind PowerPhotovoltaic Thermal solarGeothermic Biomasses and wasteWood and similar Bio-combustiblesBiogas
ktep
19
91
19
93
19
95
19
97
19
99
20
01
20
03
20
05
ENVIRONMENTAL DATA YEARBOOK VADEMECUM
6
– reduction of energy consumption by 20% comparedto forecasts;
– 10% of total transport energy consumption to be con-tributed by bio-fuels.
In Italy, the production of energy from renewablesources still plays a relatively limited role (7.8% of thetotal gross domestic supply in 2005), but the level ison the rise (+60.6% during the period 1991-2005). Ingreater detail, while the contribution of hydroelectricpower shows annual fluctuations tied to meteorolog-ical conditions, the contribution of non-traditionalsources – wind, solar, waste, wood (excluding woodfor burning), bio-combustibles and biogas – increasedby 339% between 1991 and 2005.

AIR QUALITY
7
ENVIRONMENT AND QUALITY OF LIFE: AIR QUALITY
Air quality is one of the environmental emergenciesthat most worries administrators of local and centralgovernments, involving all citizens on a daily basis.
The most critical pollutants, given the high concentra-tions found in the air, are O3, PM10 and NO2.
The emission reductions of fine dust (PM10), nitrogenoxides (NOx) and non-methane volatile organic com-pounds (NMVOC) registered in recent years, both inEurope and domestically, have not led to improved inair quality, on account of the complexity of the prob-lem of “air pollution”, which calls not for emergencymeasures but long-term integrated initiatives.
In Italy, 61% of the PM10 monitoring stations exceed-ed the daily upper limit in 2006; in the summer of2007, exceedances of the reference level for the pro-tection of human health were registered by 93% of thestations monitoring ozone.
Even accounting for the readily apparent difference inmonitoring density between Northern and SouthernItaly (greater in the North than in the South), the citiesof the Po River area “use up” the 35 days per year al-lowed under the law for levels of PM10, in excess of 50 μg/m3 more rapidly than the rest of Italy.

PM10 – Date on which limit on days over daily limit is reachedand total number of days over limit (2005-2006)
ENVIRONMENTAL DATA YEARBOOK VADEMECUM
8
PM10 2005-2006: date of 36th day over VL24h
7-Jun
28-Jul
23-Dec
24-Mar
13-Oct
4-Mar
23-Oct
17-Feb
10-Feb
9-Feb
29-Oct
19-Mar
30-Jun
28-Jun
15-Feb
6-Feb
7-Feb
Palermo
Bari
Naples
Rome
Florence
Bologna
Genoa
Venice
Milan
Torin 20062005
36° giorno dell'anno: 5 febbraio
[54]
[dd] day overlimit
[110]
[66]
[110]
[83]
[172]
[155]
[184]
[92]
[153]
[199]
[102]
[40]
[100]
[55]
[39]
[57]
[80]
Jannuary February March April May June July August September October November December
16-Feb
Summer O3 – Monitoring stations by categories of days in ex-cess of long-term objective for the protection of human he-alth (120 μg/m3) (2007)
Number of daysover limits
Number of station
< 1 14≥ 1 e < 20 49≥ 20 e < 60 85≥ 60 51Total 199Time coverage less than 5 29summer months out of 6
Urban and Suburban 172Rural and Farrmland 49Not classified 7

AIR QUALITY
9
In Italy, in 2005, 43% of PM10, 65% of NOx and 43%of NMVOC were caused by transport sector. In detail,harmful gas emissions during the period 1990-2005showed two contrasting trends: emissions tend to in-crease because of the continuous growth in the vehi-cle pool and in the distances travelled, though, in re-ality, they decrease, thanks to the renewal of the ve-hicle pool.
As part of efforts to improve air quality, Italy has en-dorsed, under its Legislative Decree no. 351 of 4 Au-gust 1999, European Directive 96/62/EC, whichsets criteria for assessing and managing air quality,based on, among other elements, plans and programsof reclamation.
Between 2003 and 2005 there was a noteworthy in-crease in the measures taken to restore air quality inthe regions of Piedmont and Lombardy, while the num-ber of such measures fell in the Latium Region.
0
50
100
150
200
250
2003 2004 2005 2003 2004 2005 2003 2004 2005
Northern Italy Central Italy Southern Italy and Islands
Mobility Domestic/commercial activities Production activities Other
n.
Measures taken to restore air quality

PM10 – Number of monitoring stations with time coverage ofmore than 75% and total number of stations
39 52
104135
162
250
6077
150173
236
304
0
50
100
150
200
250
300
350
2001 2002 2003 2004 2005 2006
Stations with time coverage of more than 75%
Total stations
n.ENVIRONMENTAL DATA YEARBOOK VADEMECUM
10
The single most frequent type of measure undertak-en by Italian regions involves sustainable mobility(16%), followed by clean vehicles in private and pubictransport (15% and 14% respectively).
In terms of actions for the restoration of air quality,investigative initiatives should not be neglected, withparticular mention going to the unmistakable im-provements made in the monitoring and communica-tion of information on the local and national levels.

WATER QUALITY
11
ENVIRONMENT AND QUALITY OF LIFE: WATER QUALITY
Until just a few years ago, water was considered a“natural” resource available to everyone, complete-ly renewable and free: of noteworthy “value”, but with-out a price. In contrast, today water has acquired adual role: as an environmental component (it plays akey role in preserving ecological and territorial bal-ances, as well as the quality of landscape and of lifeand health) and as raw material (on account of thescarcity that afflicts extensive areas, water has tak-en on strategic importance in terms of sustaining amodel of life and development).
Water body quality is assessed with regard both to thedesignated use (production of drinking water, swim-ming, mussel growing etc.) and to the specific objec-tives of environmental quality (SECA, SEL, SCAS).
The data for 2006 on the Ecological State of Water-ways (SECA) points to a not especially critical situa-tion, with 22% of the monitoring stations positionedin water bodies of inferior quality, while 43% of thesites monitored fall within quality classes 1 and 2,meaning a “high” (5%) or “good” (38%) rating.Looking at lake quality (SEL – Ecological Status ofLakes), out of a total of 173 stations in 14 regions, 74%are ranked in the classes from “moderate” to “high”,a figure that has risen by 4% compared to 2005.
The Chemical State of Underground Waters (SCAS)points to the zones that present the most critical prob-lems in terms of quality. The number of sampling points in the regions vary sig-nificantly (from 29 to 600). In the Marches, Trent, Cam-pania, Val d’Aosta and Venetia, the percentage of sam-pling points ranked in classes 1 to 3 falls between56% to 96%, while the sampling points in Emilia Ro-magna and Tuscany fall within classes 4 and 0 at re-spective percentages of 70% and 60%.
The massive human settlement of the territory, togeth-

16%
6% 5%
38%
35%
Class 1“High”
Class 2“Good”
Class 3“Moderate”
Class 4“Poor”
Class 5“Bad”
The quality status of underground bodies on the regional le-vel (2,863 points monitored – 10 regions) (2006)
ENVIRONMENTAL DATA YEARBOOK VADEMECUM
12
Percentage distribution of the classes of the SECA qualityindex (2006)
Class 1 Class 2 Class 3 Class 4 Class 0
Region Sampling pointsPiedmont 600Val D’Aosta 43Lombardy 471Trent 29Venetia 229Emilia Romagna 420Tuscany 468Umbria 208The Marches 242Campania 157

WATER QUALITY
13
er with the dimensions of the production system, placenoteworthy pressure on domestic water resources.The quality of water resources is influenced not onlyby wide spread pollution from fertiliser and plant-careproducts, but also by localised pollution from indus-trial discharges and shortcomings in the purifica-tion system.
The quantitative factor, expressed as the water de-mand on the national level, found Italy among the Eu-ropean leaders at the end of the 90’s, in terms of con-sumption per inhabitant (approximately 2,000 l/dayper inhabitant, as compared to the EU15 average of1,677 l/day). The Italian economic sectors that con-sume the most water are Agriculture and Industry(48% and 19%).
The underlying criteria for the most recent national leg-islation (Legislative Decree 152/06, Ministerial De-cree No. 185 of 12 June 2003, Ministerial Decree no.367 of 6 November 2003) and European-Communi-ty measures (Directive 2000/60/EC) set the ground-work for the development of an integrated, sustainableoperating strategy.
The legislation provides numerous instruments for theprotection of waters; the primary tool of strategic plan-ning is the Water Defence (PTA), implemented in fourregions and approved in nine others (the deadline forapproval of the PTA is 31 December 2008).
Also remarkable are the programs of measures for wa-ter bodies used for drinking (whose monitoring in theyears 2002-2004 showed that the Sardinia Regionpresents the most critical problems, followed by Lig-uria and Emilia Romagna), the upgrading measuresfor the reclamation of zones not suitable for swimmingand Community Directive 91/271/EEC on the con-struction and upgrading of collecting systems (in2005 the level of compliance was 82% in sensitive ar-eas and 78% in normal areas) and waste water treat-ment plants (the level of compliance in 2005 was 80%in sensitive areas and 77% in normal areas).

ENVIRONMENTAL DATA YEARBOOK VADEMECUM
14
ENVIRONMENT AND QUALITY OF LIFE: PHYSICAL AGENTS
The term “Physical Agent” refers to the sum total ofthe forms of environmental pollution considered to bephysical in nature, on account of the characteristicsof the agent, the interaction with the individual and theextent of propagation within the environment, such asionising radiation, electromagnetic fields, noise in theinhabited and living environment, vibrations, lightpollution and UV radiation.
Noise pollution is one of the foremost environmentalproblems, at a level of priority that has led the Euro-pean Community to take measures to limit it.The control activities carried out by the Agency Sys-tem, primarily in response to complaints from citizens,show that the types of sources held to be highly dis-turbing are commercial and tertiary activities (38%),production activities (26%), construction sites (11%)and roadway infrastructures (10%).Roadway, railway and air traffic have registered ageneral increase in volume, with distinctive character-istics of the rise tied to the individual sources. The in-crease in these factors is one of the primary obstaclesto be overcome in order to establish virtuous trends.To date, efforts have been undertaken to raise theawareness of local government bodies, in order to pro-mote preventive actions, such as the acoustical clas-sification of municipal territories and the resultingreclamation plans.Unfortunately, the response of local governmentshas not been fully satisfactory, with an analysis of theresults as of 2006 showing the situation to be station-ary compared to previous years, as no more than 32%of Italian municipalities have approved acousticalclassifications.The most positive situations are found in Tuscany(84%), Liguria (77%), Venetia (69%) and Piedmont(64%).

Percentage of municipalities that have approved acousticalclassifications, out of the total number of municipalities foreach region/autonomous province (2006)
PHYSICAL AGENTS
15
Prolonged exposure to electromagnetic fields isconsidered a potential threat to human health. There are two main categories of sources of electro-magnetic fields: sources of low frequency fields (0-300Hz), or ELF fields, (electric power lines, substations,home appliances etc.); sources of high-frequencyfields (100 kHz - 300 GHz), or RF fields, (radio, TV, cellphones, radar).Between 2003 and 2006, there were increases in vi-olations of the legal limits by both radio and televisionplants (RTV) (+25%) and radio base stations (RBS)(+50%). Even though the density of RBS plants is al-most double that of RTV plants, and the RBS site den-sity is five times that of RTV, the higher level of envi-ronmental pressure is exercised by RTV plants, at8,570 kW, as compared to 1,777 kW for RBS plants.In terms of both radio frequencies (RTV and RBS) andextremely low frequencies (ELF), control activitiesconstitute a fundamental operation on the part of theresponsible authorities (ARPA/APPA).

ENVIRONMENTAL DATA YEARBOOK VADEMECUM
16
Analysis of the data from the NIR (Non-Ionating Radi-ation) Observatory, between 2004 and 2006 showsa decrease in the number of preliminary opinions forRBS (-8.9%), an increase in the number of opinionsfor RTV (+4.2%), a decrease in the number of controlsfor RBS (-2.8%) and a slight increase for RTV (+0.8%).In terms of restoration initiatives undertaken to date,regarding the violations observed during the controlactivities, it is interesting to note the differences be-tween the two types of sources: RTV and RBS. In2006, a significantly higher percentage of restorationefforts were concluded for RBS (76%) than for RTV(46%). However, the smaller number of operationscompleted for RTV plants, as compared to RBS, istraceable to their greater complexity.
Light pollution is an alteration in the natural quanti-ty of light caused by the introduction of artificiallight. The increased luminosity of the night-time skyhas negative repercussions on the quality of the en-vironment, on human life and on astronomical re-search.The regions highlighted in blue (in the figure) are thosewhere weak stars, meaning the less luminous ones,can still be seen from more than 60% of the region-al territory.
The main source of light pollution is the flow of lightdispersed towards the sky, originating primarily fromprivate electrical plants and, to a lesser degree, pub-lic systems (25%-30%).The increase in the luminosity of the night-time sky,due to the diffusion of artificial light, should not ex-ceed 10% of the lowest natural level. Otherwise thesky should be considered “polluted”. Italy has themost advanced laws to be enacted for the protectionof the night-time sky and the promotion of energy sav-ings, with no fewer than 17 of 20 regions, plus an au-tonomous province, having passed such laws.
The control of environmental radioactivity in Italy is jus-

Italian regions (in blue) in which weak stars are still visiblefrom more than 60% of the regional territory
PHYSICAL AGENTS
17
tified by the need to protect the population and work-ers from exposure to ionising radiations. It got under-way following the first tests of nuclear warheads car-ried out in the atmosphere in the 50’s and the 60’s.A rough idea of radioactivity in Italy can be obtainedby observing the concentration of artificial radio nu-clide activity over time.The main sources of ionising radiation are thosetied to the cross-border circulation of radioactive ma-terials, natural sources (radon) and exposure fortherapeutic purposes. The state of radon exposure isexpressed by the results of a survey carried out dur-ing the 80’s and the 90’s, but still valid for the char-acteristics of such exposure, illustrating the notewor-thy differences in the average concentrations of Rn-222 in the various Italian regions.
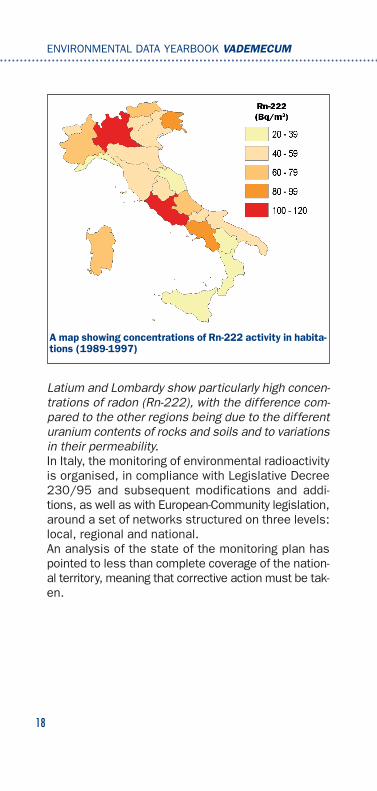
A map showing concentrations of Rn-222 activity in habita-tions (1989-1997)
ENVIRONMENTAL DATA YEARBOOK VADEMECUM
18
Latium and Lombardy show particularly high concen-trations of radon (Rn-222), with the difference com-pared to the other regions being due to the differenturanium contents of rocks and soils and to variationsin their permeability.In Italy, the monitoring of environmental radioactivityis organised, in compliance with Legislative Decree230/95 and subsequent modifications and addi-tions, as well as with European-Community legislation,around a set of networks structured on three levels:local, regional and national.An analysis of the state of the monitoring plan haspointed to less than complete coverage of the nation-al territory, meaning that corrective action must be tak-en.

SOIL CONTAMINATION
19
ENVIRONMENT AND QUALITY OF LIFE:SOIL CONTAMINATION
Soil plays a fundamental function in protecting the en-vironment, serving as a filter and a barrier, so as tomitigate the effect of pollutant dispersion. Soil con-tamination, if heavily contaminated by hazardoussubstances, may lose its intrinsic properties modify-ing its protective functions, and its productive and eco-logical functions are degraded. Impacts of soil contam-ination also regard surface and ground waters, the at-mofphere and the food chain, giving rise to risks to hu-man health. Soil contamination may impact on limit-ed and well defined areas, corresponding to knownpoint sources (contaminated sites), or it can affect ex-tensive areas by release into the environment oflarge quantities of polluting substances from multiplesources dispersed throughout the territory (diffusecontamination).At present, there are 54 contaminated Sites of Nation-al Interest in Italy, the restoration efforts for which arebeing coordinated directly by the Ministry of the En-vironment, Land and Sea. Approximately 15,000contaminated sites fall under the responsibility of theregions, with 4,000 of these sites calling for reclama-tion. A national homogeneous overview of diffuse soilcontamination is not yet available, even though the re-lated problems are present in almost all the regions.In Italy, the main activities responsible for local con-tamination are the refining of petroleum products, thechemical industry, the metallurgical industry, themanufacture of asbestos and certain waste manage-ment activities.
In the case of diffuse contamination, contributing caus-es can be atmospheric fall-out and intensive agricul-tural/farming or other human activities scatteredthroughout the territory and/or prolonged over timeand that cannot be easily identified as individual orpoint contaminant sources. Industrial and vehicle

Localisation, dimensions and relevant legislation on Sites ofNational Interest (2006)
ENVIRONMENTAL DATA YEARBOOK VADEMECUM
20
emissions into the atmosphere lead to fall-out insoil of acidifying contaminants, heavy metals and or-ganic compounds. Intensive farming practices, mak-ing abundant use of pesticides, chemical fertilisersand manure, can result in an excess of nutritional el-ements, in accumulation of heavy metals and in thespread of biocide substances. The most effective re-sponse is to undertake initiatives designed to mitigatethe pressures. The observed trend of excess ni-trates has gradually decreased in almost all Italian re-gions in the last decades, thanks to the measures tak-en to comply with the current legislation.
Soil contamination problems affect all industrialisedcountries. Over the last 15 years, numerous interna-tional initiatives have been developed to define jointstrategies for the management of the problem. In2006, the European Commission implemented the“Thematic Strategy for the Protection of Soil”, in
Relevant Legislation
Areas of the sites

Regional surplus of nitrogen on Utilised Agricultural Area(UAA)
Liguria
Calabria
Basilicata
Apulia
Sicily
Abruzzo
Val d’Aosta
Sardinia
Tuscany
Molise
The Marches
Umbria
Campania
Trent Alto Adige
Latium
ITALY
Friuli Venetia Julia
Piedmont
Emilia Romagna
Venetia
Lombardy
SOIL CONTAMINATION
21
which contamination is identified as one of the “pri-ority threats” to the functions of soil. The proposedFramework Directive on the Protection of Soil was ap-proved by the European Parliament in November2007.

ENVIRONMENTAL DATA YEARBOOK VADEMECUM
22
BIODIVERSITY AND NATURAL, AGRICULTURALAND FOREST AREAS
Italy is one of Europe’s richest countries, in terms ofbiodiversity, possessing half of the European vegetalspecies and a third of its animal species. Italy also possesses an especially rich stock offorests, and the national forest index is constantlygrowing, thanks to both forestation activities andnatural forest expansion. Offsetting this trend, how-ever, is the incidence of forest fires, which showed aresurgence in the first eight months of 2007, follow-ing the gradual decline registered through 2006.
In addition to natural environments, agricultural areasalso play an important role. In Italy, almost 44% ofthe national territory is earmarked for agriculture, anda portion of this area, the equivalent of approximate-ly 21% of the UAA (Utilised Agricultural Area), presentscharacteristics of noteworthy naturalistic value, interms of biodiversity and as connecting zones with nat-ural spaces.
This wealth of biodiversity, however, is seriouslythreatened, with the risk of it being lost forever. Thepercentage of Vertebrate species at risk fluctuates,depending on which author is consulted, from 47.5 %to 68.4%. The situation is especially dire for Fishesin inland waters, Amphibians and Reptiles. In addition,15% of the higher plants are at risk and 40% of thelower plants.
The main threats to the natural heritage are tied to theimpact of human activities and to the growing demandfor natural resources and ecosystem services. For ex-ample, the transformation and modification of natu-ral habitats constitutes an indirect threat to approx-imately 50% of the Vertebrate animal species, whilemajor direct threats include poaching and illegal fish-ing.

Domestic distribution of surface areas and number of protec-ted areas (excluding RAMSAR Areas)
0
100
200
300
400
500
ha.*
10
,00
0
0
500
1,000
1,500
2,000
2,500
Surface area Number of protected areas
number
SPAs SCIs Terrestrialprotected
areas
Marineprotectedsurfaces
BIODIVERSITY AND NATURAL, AGRICULTURAL AND FOREST AREAS
23
There is controversy over the role of activities tied toagriculture as causes of impact on the natural her-itage. On the one hand, agricultural surface areas aresubject to the negative impacts of other activities andother spheres of production, though, at the same time,they can cause pollution, loss of stability of ter-rains, loss of biodiversity, simplification of the land-scape etc..
To attempt to overcome these problems, Italy has en-dorsed numerous conventions and internationalagreements designed to safeguard biodiversity.Internationally, Italy signed the Ramsar Convention of1971 on wetlands of international importance. On theEuropean level, the EU has issued two key directivesfor the preservation of biodiversity: the Bird Directive(79/409/EEC) on the protection of wild birds and theHabitat Directive (92/43/EEC) on the preservation ofthe natural and semi-natural habitats of wild flora andfauna. The specific objectives of the Habitat Directiveinclude the creation of a cohesive European ecolog-ical network entitled Nature 2000. On the national lev-

el, a fundamental reference for the conservation of bio-diversity is the Framework Law no. 394 of 6 Decem-ber 1991 on protected areas.
At present, 14.5% of Italian territory holds Special Pro-tection Areas (SPAs), 15% holds Sites of CommunityImportance (SCIs) (all approved by the EuropeanCommission) and 9.7% contains protected terrestri-al areas, while 30% of domestic coastal waters areprotected. There are also 50 protected Ramsar sites.
In terms of relations between agriculture and the en-vironment, special attention has been focussed on bi-ological agriculture. In Italy, the surface areas involvedin or being converted to biological agriculture in2006 were equal to 1,148,162 hectares (+2.42%compared to 2005), representing 9% of the nationalUAA.
24
ENVIRONMENTAL DATA YEARBOOK VADEMECUM
Number and UAA of farming enterprises run under the biolo-gical method in Europe (2005)
,
Biological UAA in haNumber of farms
num
bers
(in
100
0’s)
hect
ares
(in
100
0’s)

USE OF RESOURCES AND PRODUCTION OF WASTE:USE OF MATERIAL RESOURCES IN THE ITALIANECONOMY
The use of material resources plays a crucial role ingenerating environmental pressures, in terms ofboth the demand for natural resources (input) and theirtransformation (output).Domestic Total Material Requirement (Domestic TMR)provides information on the resources found within thenational territory, as well as the potential pressuresborne by the territory as a result of their extraction.During the period 1980-2004, the TDE showed adownward trend overall, in contrast to growth in theGDP (+53%). In absolute terms, growth was decoupledfrom environmental pressure, though the trend inquestion shows little stability.
Domestic Material Consumption (DMC) provides infor-mation not only on the quantity of materials neededto satisfy domestic demand, but also on the potentialof the Italian economy to generate direct pressure interms of outlet materials.The time series 1980-2004 do not show a well definedtrend for the DMC over the long term. Specifically, it
25
Domestic Total Material Requirement, GDP and their ratio
Inde
x 1
98
0=
10
0
DOMESTIC TMR DOMESTIC TMR/GDP GDP
USE OF MATERIAL RESOURCES IN THE ITALIAN ECONOMY

Domestic Material Consumption, Economic resources (GDP+ imports - exports) and their ratio
Inde
x 1980=100
DMCResources for domestic useDMC/Resources for domestic use
Total Material Consumption, economic resources (GDP + im-ports –exports) and their ratio
Inde
x 1980=100
TMCResources for domestic useTMC/Resources for domestic use
ENVIRONMENTAL DATA YEARBOOK VADEMECUM
26
cannot be held that there is decoupling in absoluteterms, seeing that no noteworthy decrease in the in-dicator has been observed.What can be observed is a noteworthy decoupling inrelative terms, meaning a tendency for the values of

USE OF MATERIAL RESOURCES IN THE ITALIAN ECONOMY
27
the goods purchased and the services used in ourcountry not to depend on the quantities of materialsused domestically.
Total Material Consumption (TMC) serves as a refer-ence for evaluating a contribution made by a countryto the extraction of resources globally, as well as tothe potential pressure tied to the output side of theuse of materials, triggered directly or indirectly by thecountry in question.
The ratio between the TMC and the total economic re-sources available for domestic use shows a notewor-thy improvement in efficiency, sign of a relative decou-pling.In short, though the use of resources has becomemore efficient, and the quantity of resources extract-ed directly from Italian territory has decreased, the po-tential pressures in Italy have remained essentiallystable, while the demand for natural resources andenvironmental services borne by the environmenthas actually increased.
28
ENVIRONMENTAL DATA YEARBOOK VADEMECUM
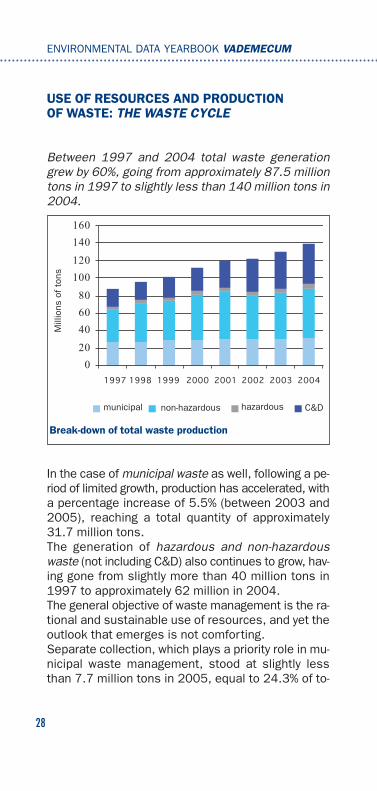
In the case of municipal waste as well, following a pe-riod of limited growth, production has accelerated, witha percentage increase of 5.5% (between 2003 and2005), reaching a total quantity of approximately31.7 million tons.The generation of hazardous and non-hazardouswaste (not including C&D) also continues to grow, hav-ing gone from slightly more than 40 million tons in1997 to approximately 62 million in 2004. The general objective of waste management is the ra-tional and sustainable use of resources, and yet theoutlook that emerges is not comforting.Separate collection, which plays a priority role in mu-nicipal waste management, stood at slightly lessthan 7.7 million tons in 2005, equal to 24.3% of to-
USE OF RESOURCES AND PRODUCTION OF WASTE: THE WASTE CYCLE
Between 1997 and 2004 total waste generationgrew by 60%, going from approximately 87.5 milliontons in 1997 to slightly less than 140 million tons in2004.
Break-down of total waste production
Mill
ions
of
tons
municipal non-hazardous hazardous C&D

29
THE WASTE CYCLE
tal municipal waste generation, a figure significantlylower than the target of 35% set for 2003.
Significant differences can be noted between the threemacro-areas: the North, with a percentage of 38.1%,exceeds the target of 35%, while the central regions(19.4%) and the South (8.7%) still fall short of the tar-get.
In terms of the management of municipal waste, ananalysis of the data for 2005 points to a decrease inlandfilling (-2.7%) and a rise in other types of manage-ment: specifically incineration (+7.4%), other forms ofmaterial recovery (+5.0%), mechanical-biologicaltreatment (+13.6%) and composting from selected ma-trixes (+12.9).The total amount of hazardous and non-hazardouswaste managed in 2004 stood at slightly less than 95million tons, of which 46.7 were sent to be recovered,34.8 were earmarked for disposal and nearly 12.8were placed in storage.
Percentage of separate collection of municipal waste
target 2003
target 2001
target 1999
5
%
North Centre Sud ITALY

ENVIRONMENTAL RISK: RISK OF NATURAL ORIGIN
Natural risk manifests itself through the occurrenceof events of endogenous origin (volcanic and tecton-ic activities) and of exogenous origin (erosion of ele-vations and sedimentation of low-lying areas). Italy is one of the European countries facing thegreatest seismic risk.
The areas facing the greatest seismic risk are foundin the Friuli sector, along the central-southern spineof the Apennine range (inter-Apennine basin), along the
Distribution throughout the national territory of major seismicevents (magnitude ≥5.5)
ENVIRONMENTAL DATA YEARBOOK VADEMECUM
30

Level of landslide alert on the municipal level
NATURAL RISK
31
Calabrian edge of the Tyrrhenian and in southeast Sici-ly.Worldwide, Italy is one of the countries facing the great-est volcanic risk.
The conditions of greatest volcanic risk are found inthe Vesuvius and Phlegraean areas, the Island of Is-chia, the Etna sector, the Aeolian Islands and the Al-ban Hills.Italy is also a fragile in terms of “hydrogeological dis-arrays: roughly 10% is classified as facing a high riskof flooding, landslides or avalanches, and more than2/3 of the areas at risk hold urban centres, infrastruc-tures or production areas. Landslides, in addition tobeing the most frequent type of natural disaster, al-
Level of attention
Very high
High
Moderate
Negligible
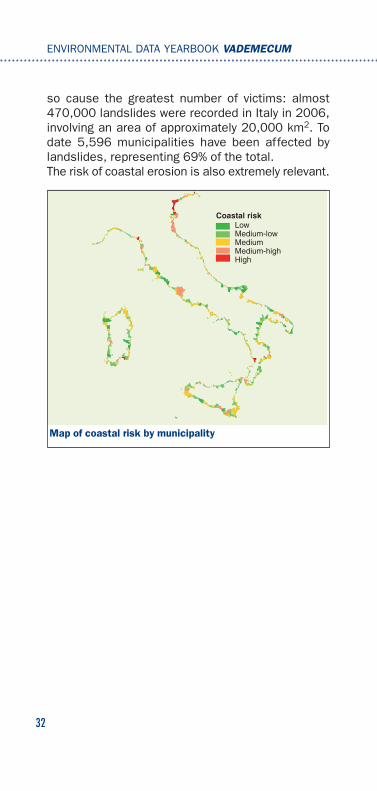
so cause the greatest number of victims: almost470,000 landslides were recorded in Italy in 2006,involving an area of approximately 20,000 km2. Todate 5,596 municipalities have been affected bylandslides, representing 69% of the total.The risk of coastal erosion is also extremely relevant.
32
ENVIRONMENTAL DATA YEARBOOK VADEMECUM
Map of coastal risk by municipality
Coastal riskLowMedium-lowMediumMedium-highHigh

ENVIRONMENTAL RISK: ANTHROPOGENIC RISK
“Anthropogenic risk” is that which arises (directly orindirectly) from human activities that are potentiallyhazardous to the environment and to human life.Knowledge of the number and the distribution through-out the territory of the Major Accident Hazards (MAH)establishments makes it possible to draw up riskmaps; Knowledge of the activities of a plant, on theother hand, makes possible a general identificationof the associated hazard.The regions with the greatest concentrations of MAHestablishments are: Lombardy, Emilia Romagna,Venetia and Piedmont, followed by Lazium, Campaniaand Sicily.
The main types of establishments are chemicaland/or petrochemical plants, plus depots of liquefiedgas (mainly LPG).
33
Regional distribution of MAH establishments
n.
Pied
mon
tVa
l d’A
osta
Lom
bard
yPr
ov.
of B
olza
noPr
ov.
of T
rent
oVe
netia
Friu
li Ve
netia
Jul
iaLi
guria
Emili
a R
omag
naTu
scan
yU
mbr
iaTh
e M
arch
esLa
tium
Abru
zzo
Mol
ise
Cam
pani
a
Apul
iaB
asili
cata
Cal
abria
Sic
ily
Sar
dini
a
ANTHROPOGENIC RISK

Distribution of MAH establishments by type of activity
0 20 40 60 80 100 120 140 160 180 200
n.Art.6 Art.8
1
Other
Treatment plants
Steel and metallurgy plants
Production and/or storage of technical gases
Electroplating works
Thermoelectric power plants
Production and/or storage of explosives
Distillation plants
Storage of toxic sunstances
Storage of pesticides
Storages of mineral oils
Petroleum refining
Storage of liquefied gas
Chemical and petrochemical establishments
ENVIRONMENTAL DATA YEARBOOK VADEMECUM
34

INSTRUMENTS FOR ENVIRONMENTAL KNOWLEDGE AND AWARENESS
An effective action of response, in accordance with theDPSIR model, is environmental education, meaning aform of activity not limited to school but extending in-to adulthood, in the field of continuing education andprofessional training. The tools used by the Agency System to arrive at abroader and more in-depth environmental knowledgeand awareness include reporting activities and theirproducts, the level of use of telematic equipment foraccessing environmental data/information, libraryservices and environmental training and education inthe strict sense, plus the activities carried out by theSystem’s Measurement Laboratories and the enact-ment of the European EMAS and Ecolabel regula-tions. In recent years, the supply of environmental informa-tion over websites has registered a growth phase, interms of periodic bulletins, databases with connectedcartography and general services; there has alsobeen an increase in direct dialogue with users. In2006, 179 laboratories participated in PTS and inter-laboratory comparisons organised free of charge by theAPAT. The most widely used reporting product of theSystem was the “thematic report”.The Agency System has promoted a variety of environ-mental education initiatives and training courses,both face-to-face and remote. In 2006, there were 224
Environmental training offerings
nu
mb
er
Partecipants Total hours Courses held
nu
mb
erKNOWLEDGE AND AWARENESS
35

Number of EMAS registration certificates issued in Italy overtime
1
number
Total registration certificates issuedAnnual increase
ENVIRONMENTAL DATA YEARBOOK VADEMECUM
36
environmental education projects and 160 traininginitiatives, with more than 5,000 participants.Training efforts include the cooperation project betweenAPAT and the Egyptian Environmental Affair Agency, aswell as that between APAT and the Moroccan Ministryof the Environment. As for penetration of the EMAS andEcolabel European Regulations, from 1997 to thepresent the annual growth has been continuous and sig-nificant. As of October 2007, the number of EMAS reg-istrations issued was 754. The most virtuous regions,in terms of the number of EMAS registered organisa-tions, are: Emilia Romagna, Tuscany, Lombardy, Pied-mont and Venetia, with Campania holding sixth place,demonstrating a certain amount of attention on the partof Southern Italian regions. The lack of uniformity in de-velopment throughout the territory reflects the differ-ent levels of local awareness and/or incentives.Between 1998 and 2007 a total of 145 Ecolabel licens-es were issued, making for 1,827 products/services la-belled. The trend was positive for both licenses and prod-ucts/services. Last year, the largest increase was reg-istered in the tourism accommodation sector.

37

38
ENVIRONMENTAL DATA YEARBOOK VADEMECUM

39
QUADRO SOCIO-ECONOMICO