socialism kills - cato institute · a s the world approaches the 20th anniversary of the fall of...
TRANSCRIPT

As the world approaches the 20th anniversary of thefall of communism, it is worth investigating thecosts borne by countries like India that did not
become communist but drew heavily on the Soviet model.For three decades after its independence in 1947, Indiastrove for self-sufficiency instead of the gains of interna-tional trade, and gave the state an ever-increasing role incontrolling the means of production. These policies yieldedeconomic growth of 3.5 percent per year, which was halfthat of export-oriented Asian countries, and yielded slowprogress in social indicators, too. Growth per capita inIndia was even slower, at 1.49 percent per year. It accelerat-ed after reforms started tentatively in 1981, and shot up to6.78 percent per year after reforms deepened in the currentdecade.
What would the impact on social indicators have beenhad India commenced economic reform one decade earlier,and enjoyed correspondingly faster economic growth andimprovements in human development indicators? Thispaper seeks to estimate the number of “missing children,”“missing literates,” and “missing non-poor” resulting fromdelayed reform, slower economic growth, and hence, slowerimprovement of social indicators. It finds that with earlierreform, 14.5 million more children would have survived,261 million more Indians would have become literate, and109 million more people would have risen above the pover-ty line. The delay in economic reform represents an enor-mous social tragedy. It drives home the point that India’ssocialist era, which claimed it would deliver growth withsocial justice, delivered neither.
the cato institute1000 Massachusetts Avenue, N.W., Washington D.C. 20001-5403
www.cato.orgPhone (202) 842-0200 Fax (202) 842-3490
O C T O B E R 2 1 , 2 0 0 9 ● n o . 4
Socialism KillsThe Human Cost of Delayed Economic Reform in India
by Swaminathan S. Anklesaria Aiyar
Swaminathan Aiyar is a research fellow at the Cato Institute’s Center for Global Liberty and Prosperity and has been editor of India’s two biggest financialdailies, the Economic Times and Financial Express.
Executive Summary

Introduction
As the world approaches the 20th anniver-sary of the fall of communism, many analystswill recount the failure of Soviet policies thatgave the State a commanding role in produc-tion, and discouraged foreign trade andinvestment as imperialist traps. Similar poli-cies were also adopted by developing coun-tries like India, which were socialist and notcommunist. India was greatly influenced bythe success of the Soviet Union in buildingup its economic strength in the 1930s, evenas Western countries plunged into the GreatDepression.
India gained its independence in 1947. Forthe first three decades after India embarked onsocialist planning in 1950, such policies yield-ed annual GNP growth of 3.5 percent and percapita growth of 1.49 percent. In the 1960sand 1970s, the four East Asian tigers (Korea,Taiwan, Singapore, and Hong Kong) achieved7–8 percent annual GNP growth. Later, themini-tigers of the Association of SoutheastAsian Nations (Thailand, Malaysia, and In-donesia) also achieved 7–8 percent growth. SoIndia’s socialism made it an economic laggardin Asia. India’s share of global exports fell from2.2 percent at its independence in 1947 to 0.45percent by 1985, but socialists viewed this as asuccess of self-sufficiency rather than a disas-trous loss of the gains of trade.1
India experimented with creeping economicreform in the 1980s, but the reforms becamemainstream policy only after India’s balance ofpayments crisis of 1991.2 The fall of the SovietUnion that same year helped convince Indianpoliticians that more socialism could not be theway out of India’s crisis, and Deng Xiaoping’ssuccessful market-oriented reforms in Chinashowed that economic liberalization couldyield major dividends. The Indian reform pro-cess was gradual and fitful, but its cumulativeimpact enabled India to become a miracle econ-omy in 2003–2008, averaging almost 9 percentannual GNP growth, and more than 7 percentannual GNP growth per capita. This improvedboth incomes and social indicators.
How different would living standards andsocial indicators have been if India’s reformprocess had begun one decade earlier? Thispaper estimates how many children wouldhave been saved from death by lower infantmortality; how many more Indians wouldhave become literate; and how many morepeople would have risen above the povertyline. Obviously, such counterfactual estimatescannot be precise. But they do give an idea ofthe human tragedy inflicted on the weak andpoor by misguided policies.
The Case forSimple Estimates
History tells us that even tiny changes canhave large, unanticipated effects. Pascalfamously said that if Cleopatra’s nose hadbeen shorter, the history of the world wouldhave been different. That is, she would nothave been so beautiful;3 Mark Anthony wouldnot have fallen in love with her; the civil warbetween Mark Anthony and Octavius wouldnot have occurred; and so the whole of Romanhistory, and ultimately world history, wouldhave been different. However, the theory ofCleopatra’s nose has never stopped econo-mists or historians from raising “what if”questions, and attempting to answer suchquestions on the basis of broad assumptions.
For instance, Amartya Sen, Nobel laureatein economics, has popularized the notion of“100 million missing women” on account ofgender discrimination in developing coun-tries.4 He has also done much to popularizethe estimate that almost 30 million Chinesedied because of Mao’s blunders during theGreat Leap Forward in 1958–61.5
It is worth quoting Sen’s methodology forhis estimate of “missing women”:
To get an idea of the numbers of peopleinvolved in the different ratios ofwomen to men, we can estimate thenumber of missing women in a country,say, China or India, by calculating thenumber of extra women who would
2
India was greatlyinfluenced by the
Soviet Union.

have been in China or India if thesecountries had the same ratio of womento men as obtained in areas of the worldin which they receive similar care. If wecould expect equal populations of thetwo sexes, the low ratio of 0.94 womento men in South Asia, West Asia, andChina would indicate a 6-percent deficitof women; but since, in countries wheremen and women receive similar care, theratio is about 1.05, the real shortfall isabout 11 percent. In China alone thisamounts to 50 million missing women,taking 1.05 as the benchmark ratio.When that number is added to those inSouth Asia, West Asia, and North Afri-ca, a great many more than 100 millionwomen are missing. These numbers tellus, quietly, a terrible story of inequalityand neglect leading to the excess mor-tality of women.6
Now, such a methodology is obviously sim-plistic and open to objections. It does notcontrol for a host of possible other influenceson female mortality. Stephen J. Dubner andSteven D. Levitt, the well-known authors ofFreakononomics, have highlighted an alterna-tive explanation that was first put forward byEmily Oster, an economist at Chicago Uni-versity.7 She suggested that the high propor-tion of male births in Asian countries may bedue not so much to female foeticide (and oth-er forms of gender discrimination) as to hep-atitis B infections of mothers.8 Other schol-ars, like Monica Das Gupta, say Oster is guiltyof gross exaggeration: the chances of a secondchild in China being male are far higher if thefirst child is a daughter than if it is a son, andthis suggests selective foeticide rather thanhepatitis B.9 A separate careful review of Sen’sanalysis by demographer Ansley Coale sug-gests that the number of missing womenmight be 60 million, not 100 million.10
Besides, several factors other than gender dis-crimination could affect the proportion ofboys and girls born in any society. Hence anyestimate of “missing women” is fraught withuncertainties.
Nevertheless, such estimates carry weight.Sen’s analysis highlights, in simple language,the enormity of social disasters that can flowfrom gender discrimination. The key issue isnot the precision of the data, but the magni-tude of social disaster. Sen’s estimate hasbeen used in debates around the world, andhis phrase “missing women” has becomestandard lexicon in gender discussions.
In the same spirit of inquiry—but withoutimplicating Sen—I seek to estimate the num-ber of “missing children,” “missing literates,”and “missing non-poor” in India. Infant mor-tality, illiteracy, and poverty have multiplecauses, and it is difficult to quantify theimpact of each cause. This leads to estimationuncertainties, as in Sen’s exercise on missingwomen. Nevertheless, I make attempts to esti-mate the social impact of slow GNP growtharising from delayed economic reform.
Methodology11
GNP growth in India was slow until 1980,but accelerated after economic reforms beganin 1981 and gathered strength in 1991 whenthe reforms deepened.12 India’s per capitaGNP growth was only 1.49 percent in thethree decades from 1950 to 1980. In this peri-od, socialism was the avowed policy of thegovernment, the peak income-tax rate rose toa record 97.75 percent, several industries werenationalized, and the government sought tocapture the commanding heights of the econ-omy.
Mild economic liberalization helped percapita GNP growth accelerate to 2.89 percentper year in the 1980s. Per capita GNP growthaccelerated further to 4.19 percent after sub-stantial liberalization in the 1990s, and to 6.78percent after 2001.What would have happenedif the reform process had started earlier? WhenIndia achieved 3.5 percent growth in the 1950s,this was hailed by many economists as atripling of the growth rate achieved in the finalhalf-century of the British Raj. Socialistsclaimed this was vindication of India’s eco-nomic strategy, which was inward-looking and
3
India’s socialism made it an economic laggard in Asia.

India had every reason to
commence economic
liberalization by1971, a decade
before the processactually began.
4
public-sector dominated. However, in the1960s, the East Asian tigers (South Korea,Taiwan, Singapore, and Hong Kong) grew attwice India’s rate, showing the superior out-comes of economic policies that were outward-looking and private-sector friendly. Hence,India had every reason to commence econom-ic liberalization by 1971, a decade before theprocess actually began.
This paper considers what would have hap-pened if reforms had begun in 1971. It projectsan early-reform, high-growth scenario in whichthe per capita GNP growth rate in each decadewould have been as high as that actuallyachieved one decade later. That is, this scenarioenvisages that the trend per capita GNP growthrate actually achieved in the 1980s (2.89 percentper year) would have been achieved in the1970s; the trend rate actually achieved in the1990s (4.19 percent per year) would have beenachieved in the 1980s; and the trend rate actu-ally achieved in the early 21st century (6.78 per-cent per year) would have been achieved in the1990s. I assume no further acceleration ofgrowth for the 21st century. These conservativeassumptions stay well within the limits of what,at the time, was achievable.
We can now pose the question: whatwould have happened to the three key para-meters—the infant mortality rate, literacyrate, and poverty head-count ratio—had eco-nomic reform started a decade earlier?
From official Indian data, I calculate theelasticity of each of these three parameters withrespect to per capita GNP (or the rate of changeof each variable with respect to change in percapita GNP), and based on these elasticities, Ithen estimate how different things might havebeen had reforms come one decade earlier withaccompanying income and social improve-ments. Specifically, I estimate the following ina high-growth scenario
(a) How many infants would have died ineach year from 1971 to 2008;
(b) How many people would have becomeliterate in each year; and
(c) How many people would have risenabove the poverty line each year.
The difference between these high-growthestimates and the actual outcomes then con-stitutes the “missing” people.
Per Capita Growth,Assuming Earlier Reform
and Faster GrowthAs a first step, I estimate per capita GNP
in a fast-growth early-reform scenario, usingthe methodology explained in the earlier sec-tion. In this scenario, the growth rate in eachdecade is taken to be the one actuallyachieved in the next decade. Table 1 gives thedetails. With fast reform, per capita GNP in2008 would have been 54,460 rupees (Rs)($1,089) against the actual outcome of Rs28,970 ($579) at 1999–2000 prices.13 For2001–2008, the table assumes 6.78 percentgrowth, the rate actually achieved in2001–2006. GNP growth per capita wasfaster (7–8 percent) in the years 2005 to 2007.But I assume an average of 6.78 percent forthe decade, recognizing that the global reces-sion will slow growth for the rest of thedecade.
The Impact ofEarly Reforms onInfant Mortality
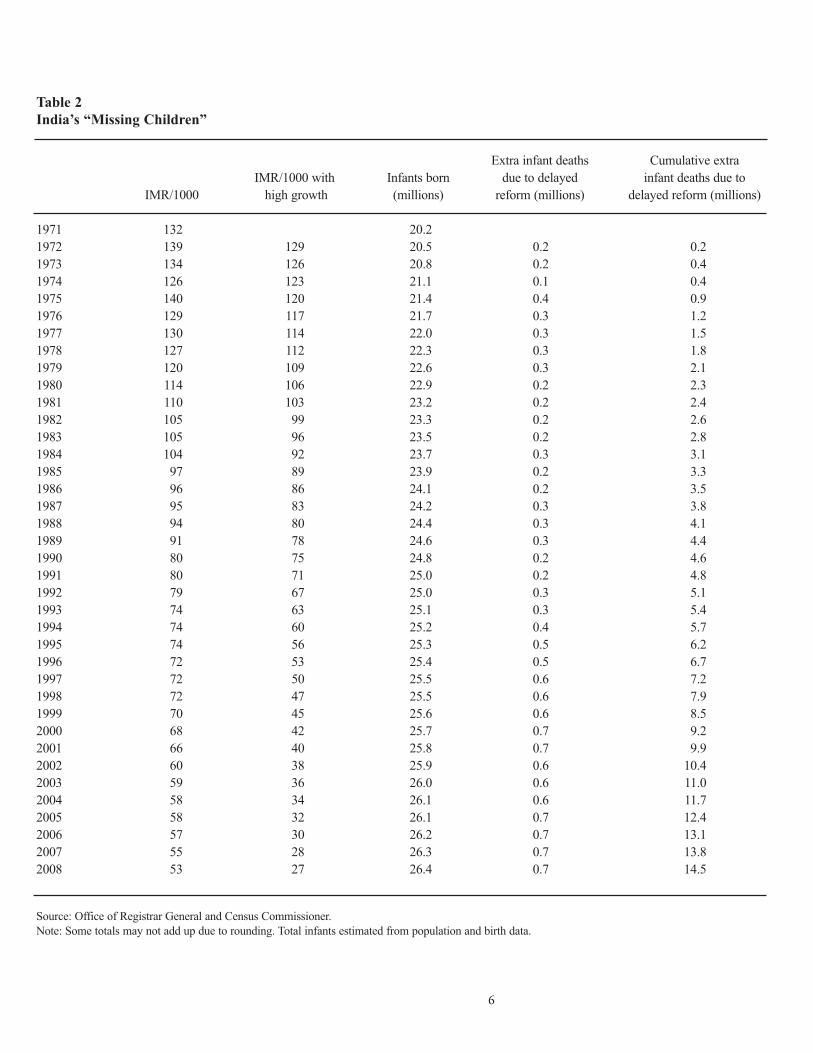
India’s infant mortality rate (IMR) drop-ped from 132 per thousand births in 1971 to53 per thousand in 2008. Over this 37-yearperiod, the elasticity of IMR reduction withrespect to the growth of per capita GNP was-0.82. That is, for every 1 percent increase inGNP per capita, IMR declined 0.82 percent.Based on this elasticity, I estimate infantmortality in a fast-growth, early-reform sce-nario (see Table 2). That allows us to calcu-late, year-by-year, the extra number of infantswho died because of delayed reform. Thecumulative number of infants who diedbecause of delayed reform works out to 14.5million. This can only be described as ahuman tragedy on a monumental scale.

5
Table 1
Estimate of GNP per Capita in a Fast-Reform Scenario
Fast-reform scenario:
Per capita population GNP, Rs Decadal average Fast-reform, per capita GNP,
(millions) (hundreds) annual growth fast-growth scenario Rs (hundreds)
1971 548 85.8 1.49% for 1971–1980 2.89% for 1971–1980 85.8
1972 562 83.6 88.2
1973 575 85.5 90.8
1974 589 84.7 93.4
1975 602 90.3 96.1
1976 616 89.6 98.9
1977 629 94.2 101.8
1978 643 97.3 104.7
1979 656 90.2 107.7
1980 670 94.5 110.9
1981 683 97.8 2.89% for 1981–1990 4.19% for 1981–1990 115.5
1982 700 98.1 120.3
1983 716 103.6 125.4
1984 732 105.1 130.6
1985 749 107.2 136.1
1986 765 109.5 141.8
1987 781 110.7 147.7
1988 797 119.0 153.9
1989 814 123.7 160.4
1990 830 127.3 167.1
1991 846 126.5 4.19% for 1991–2000 6.78% for 1991–2000 178.4
1992 865 130.6 190.5
1993 883 135.5 203.5
1994 901 141.4 217.3
1995 919 148.7 232.0
1996 938 157.8 247.7
1997 956 161.9 264.5
1998 974 169.3 282.5
1999 992 176.9 301.6
2000 1010 180.8 322.1
2001 1029 187.7 6.78% for 2001–2006 6.78% for 2001–2008 344.0
2002 1047 192.3 367.3
2003 1065 205.5 392.2
2004 1083 217.4 418.8
2005 1102 234.7 447.2
2006 1120 254.0 477.6
2007 1138 273.7 510.0
2008 1156 289.7 544.6
Sources: Central Statistical Organization, Government of India; and Office of the Registrar-General and Census Commissioner.
Note: Per capita GDP is at 1999–2000 constant prices. Population is recorded in the census once in ten years, on a calendar-year basis. GNP is measured on
a fiscal-year basis from April 1 to March 30. The data in the table for any listed year, say 1971, refer to population for the calendar year 1971 and per capita
GNP for 1971–72. Figures have been extrapolated by simple averaging for years in between censuses/NSSO surveys.
6
Table 2
India’s “Missing Children”
Extra infant deaths Cumulative extra
IMR/1000 with Infants born due to delayed infant deaths due to
IMR/1000 high growth (millions) reform (millions) delayed reform (millions)
1971 132 20.2
1972 139 129 20.5 0.2 0.2
1973 134 126 20.8 0.2 0.4
1974 126 123 21.1 0.1 0.4
1975 140 120 21.4 0.4 0.9
1976 129 117 21.7 0.3 1.2
1977 130 114 22.0 0.3 1.5
1978 127 112 22.3 0.3 1.8
1979 120 109 22.6 0.3 2.1
1980 114 106 22.9 0.2 2.3
1981 110 103 23.2 0.2 2.4
1982 105 99 23.3 0.2 2.6
1983 105 96 23.5 0.2 2.8
1984 104 92 23.7 0.3 3.1
1985 97 89 23.9 0.2 3.3
1986 96 86 24.1 0.2 3.5
1987 95 83 24.2 0.3 3.8
1988 94 80 24.4 0.3 4.1
1989 91 78 24.6 0.3 4.4
1990 80 75 24.8 0.2 4.6
1991 80 71 25.0 0.2 4.8
1992 79 67 25.0 0.3 5.1
1993 74 63 25.1 0.3 5.4
1994 74 60 25.2 0.4 5.7
1995 74 56 25.3 0.5 6.2
1996 72 53 25.4 0.5 6.7
1997 72 50 25.5 0.6 7.2
1998 72 47 25.5 0.6 7.9
1999 70 45 25.6 0.6 8.5
2000 68 42 25.7 0.7 9.2
2001 66 40 25.8 0.7 9.9
2002 60 38 25.9 0.6 10.4
2003 59 36 26.0 0.6 11.0
2004 58 34 26.1 0.6 11.7
2005 58 32 26.1 0.7 12.4
2006 57 30 26.2 0.7 13.1
2007 55 28 26.3 0.7 13.8
2008 53 27 26.4 0.7 14.5
Source: Office of Registrar General and Census Commissioner.
Note: Some totals may not add up due to rounding. Total infants estimated from population and birth data.

The number ofinfants who diedbecause ofdelayed reformcan only bedescribed as ahuman tragedyon a monumentalscale.
7
The Impact of FasterGrowth on Literacy
India holds a census every 10 years thatyields definitive data on the literacy rate,defined as the proportion of those above theage of six who can read and write. I extrapolatefrom this census data to get literacy rates andthe absolute number of literate people for theyears in between censuses, and for the periodafter the 2001 census.
The elasticity of literacy improvement withrespect to per capita GNP growth from 1971to 2008 was 0.56. That is, for every 1 percentincrease in GNP per capita, literacy improvedby 0.56 percent. Applying this elasticity to thehigh-growth scenario, it is possible to estimatethe literacy rate and number of literates ineach year. This exercise suggests that earlierreforms and faster growth would have takenIndia to virtually 100 percent literacy by 2007,and made an additional 261 million people lit-erate by 2008 (see Table 3). That is a huge fig-ure, larger than the population of all but a fewcountries in the world.14
The fast-growth scenario assumes a uni-form elasticity over the entire period. In fact,elasticity is volatile, thanks to lags and leads andthe impact of many factors other than GNPgrowth. Actual literacy elasticity in the 1970swas higher than the average elasticity in thefast-growth scenario. That explains why Table 3shows the number of literates falling in the1970s in a fast-growth scenario. The low-baseeffect is evident: growth from a small base canlook more rapid than growth from a large base,but that can prove misleading when other para-meters are considered. In the decade 1971–1981, literacy improved from 37 percent to 46percent, an increase of 9 percentage points, or94 million literates. In the decade 1991–2001,literacy improved from 52.2 percent in 1991 to64.8 percent in 2001, an increase of 12.6 per-centage points, or 206 million literates. In termsof parameters like percentage-point increaseand increase in the number of literates, the1990s were clearly better for literacy than the1970s.
Impact of Faster Growthon Poverty Reduction
The National Sample Survey Organizationof India conducts household surveys every fiveto six years to assess the poverty head-countratio (the proportion of people below thepoverty line). I estimate the ratio for the yearsbetween surveys using simple averaging. In thetime period being considered, the elasticity ofthe poverty head-count ratio with respect toper capita GNP growth was -0.68. That is, forevery 1 percent growth of GNP per capita,poverty declined by 0.68 percent. By applyingthis elasticity to the higher-growth scenario, itis possible to calculate the extra number ofpeople who would have risen above the pover-ty line had economic reforms begun a decadeearlier (see Table 4).
Table 4 shows that delayed reform kept anadditional 109 million people below thepoverty line. Note also that while the povertyhead-count ratio declined steadily throughthe years, the population also increased, and,in consequence, the absolute number of poorwas virtually unchanged after more than threedecades (it was 309 million in 1971 and 298million in the survey of 2004). Had India ben-efited from earlier reforms and faster growth,the number of poor might have declined verysubstantially, from 309 million in 1971 to 197million in 2004, and further to 174 million by2008. This would have meant a huge decreaseof 135 million in the absolute number of poorpeople between 1971 and 2008.
Are the Estimates Plausible?
I use a very simple methodology to estimatethe fast-growth counterfactual. It does not, forinstance, assume any change in populationwith faster growth. In fact, saving babies fromdeath would increase the population, otherthings remaining constant. On the other hand,faster growth would also have improved femaleliteracy and prosperity, two factors that tend todiminish the total fertility rate and hence,

8
Table 3
India’s “Missing Literates”
Literacy rate (%) for No. of literates Literacy rate with No. of literates with Additional literates if
6 + age group (millions) fast growth, % fast growth (millions) earlier reform (millions)
1971 37.0 156
1972 37.9 164 37.6 163 -1.32
1973 38.8 173 38.2 170 -2.67
1974 39.7 182 38.8 178 -4.05
1975 40.6 191 39.4 185 -5.45
1976 41.5 200 40.1 193 -6.87
1977 42.4 210 40.7 201 -8.30
1978 43.3 219 41.4 210 -9.74
1979 44.2 229 42.0 218 -11.80
1980 45.1 239 42.9 227 -12.63
1981 46.0 250 43.7 237 -12.40
1982 46.6 260 44.7 249 -10.51
1983 47.2 270 45.8 262 -8.38
1984 47.9 281 46.8 275 -5.97
1985 48.5 291 47.9 288 -3.29
1986 49.1 302 49.1 302 -0.31
1987 49.7 313 50.2 316 2.97
1988 50.3 325 51.4 331 6.58
1989 51.0 336 52.6 346 10.53
1990 51.6 348 53.8 362 14.83
1991 52.2 359 55.8 384 24.85
1992 53.5 378 57.9 409 31.48
1993 54.7 397 60.1 436 38.99
1994 56.0 416 62.4 464 47.45
1995 57.3 436 64.7 493 56.93
1996 58.5 456 67.2 524 67.51
1997 59.8 477 69.7 556 79.25
1998 61.1 498 72.4 590 92.24
1999 62.3 520 75.1 626 106.56
2000 63.6 542 77.9 662 122.29
2001 64.8 565 80.9 704 139.54
2002 66.1 588 83.9 746 158.38
2003 67.4 611 87.1 790 178.92
2004 68.6 635 90.4 837 201.27
2005 69.9 660 93.8 885 225.52
2006 71.2 685 97.3 936 251.81
2007 72.4 710 100.0 981 271.23
2008 73.7 736 100.0 997 261.00
Source: Office of Registrar General and Census Commissioner.
Note: The literacy rate is the proportion of people above 6 years of age who can read and write. Literacy rates are projected onward from 2001 at the average
change in 1991–2001. Figures may not always add up due to rounding.

9
Table 4
India’s “Missing Non-poor”
Number below Number of fewer
Headcount No. below poverty Head-count ratio poverty line with poor people with
ratio (%) line (millions) with fast growth (%) fast growth (millions) fast growth (millions)
1971 56.3 309
1972 55.6 312 55.2 310 2
1973 54.9 316 53.9 311 5
1974 54.0 318 53.0 312 6
1975 53.1 320 52.0 313 7
1976 52.2 321 51.0 314 7
1977 51.3 323 50.0 314 9
1978 50.2 323 49.0 315 8
1979 49.0 322 48.0 315 7
1980 47.9 321 47.1 315 6
1981 46.8 320 45.7 312 8
1982 45.6 319 44.4 311 8
1983 44.5 318 43.1 309 10
1984 43.1 315 41.9 307 8
1985 41.7 312 40.7 305 7
1986 40.3 308 39.5 302 5
1987 38.9 304 38.4 304 3
1988 38.4 306 37.3 298 8
1989 37.9 308 36.3 295 13
1990 37.4 311 35.2 292 18
1991 36.9 313 33.6 284 28
1992 36.5 315 32.0 277 38
1993 36.0 318 30.6 270 48
1994 35.2 317 29.1 263 55
1995 34.4 317 27.8 255 61
1996 33.7 316 26.5 248 67
1997 32.9 314 25.3 242 73
1998 32.1 313 24.1 235 78
1999 31.4 311 23.0 228 83
2000 30.6 309 21.9 222 87
2001 29.8 307 20.9 215 92
2002 29.0 304 19.9 209 95
2003 28.3 301 19.0 203 98
2004 27.5 298 18.1 197 101
2005 26.7 294 17.3 191 104
2006 26.0 291 16.5 185 106
2007 25.2 287 15.7 179 108
2008 24.4 282 15.0 174 109
Source: National Sample Survey Organization. Figures may not always add up due to rounding.

Delayed reform kept
an additional 109 million
people below the poverty line.
10
reduce the population. I do not attempt to fac-tor in the many virtuous cycles in social out-comes that could arise from rapid growth. Forinstance, rising incomes increase the demand,even from the poor, for education and healthcare from the private sector to supplement thevery inadequate public services. Any reformprocess is replete with lags and leads, unantici-pated twists and turns, and other complicatingfactors. Rapid GNP growth increases tax rev-enue and hence helps increase public spendingon health and education, improving literacyand infant mortality (despite much waste inpublic spending). My limited aim in this paperis to demonstrate the magnitude of the socialtragedy flowing from delayed reform.
Do the estimates look plausible? In thefast-growth scenario, the infant mortality ratefalls from 132 per thousand births in 1971 to27 per thousand births in 2008, comparedwith the actual achievement of 53 per thou-sand births. The fast-growth projection repre-sents a reduction in the IMR of 80 percent over37 years. By way of comparison, South Koreareduced its IMR from 90 per thousand birthsin 1960 (when its reforms began) to 6 per 1000in 1995, a reduction of 93 percent over 35years. My projected trends of both per capitaGNP growth and IMR reduction in India arefar lower than what South Korea actuallyachieved. So, the figure for “missing children”appears conservative.
The fast-growth estimates for literacy arebased on a uniform elasticity of literacy to percapita GNP of 0.56 over the entire period.This is by no means fast. In fact, the actualpace of literacy improvement was faster thanthis between 1971 and 1986. Only in theyears after 1986 does the high-growth sce-nario yield higher literacy rates. So, these esti-mates look quite conservative. They implythat India could have achieved virtually com-plete literacy by 2007 with earlier reforms.
Finally, the fast-growth estimates showthe poverty rate declining from 56.3 percentin 1971 to 15.0 percent in 2008, against therecorded 27.5 percent in the 2004 survey andprojected achievement of 24.4 percent in2008.15 Even economists who emphasize that
growth alone is not enough, such as JosephStiglitz, agree that where redistributionmechanisms exist (as is the case in India), fastgrowth will reduce poverty.16 Hence, the fast-growth estimates look plausible.
I make no claims to great precision, but Ido claim plausibility. Economists are familiarwith the enormous power of compoundinterest, so they should not be surprised thatfaster GNP growth over 35 years would haveyielded far better social outcomes than actu-ally experienced.
Conclusion
India has suffered a major human tragedybecause of its prolonged experiment withsocialism, and its delay in introducing eco-nomic reforms that accelerated growth. Themost horrifying consequence has been 14.5million “missing children.” Almost as bad arethe 261 million “missing literates” and 109million “missing non-poor.”
This exercise is, by intention, a simple one.It is best seen as a first step in more detailedresearch on counterfactual scenarios. Modelsbased on different assumptions might yieldnumbers for “missing children” that are high-er or lower by several million, but these will, inany case, reflect an enormous human tragedy.Demographer Ansley Coale has revised Sen’sestimate of “missing women” from 100 mil-lion to 60 million, which is a big drop. Yet thathas not reduced the importance or relevanceof Sen’s original paper. If another analystreworks my exercise in great detail and con-cludes that socialism killed “only” 11 millionchildren and not 14.5 million, the point willstill stand that delays in economic reformexacted a horrible toll.
The bloody history of the 20th centuryhad no shortage of vicious tyrants who will-fully killed millions. This was not the case inIndia, where socialist leaders were regarded,even by their critics, as benevolent and well-meaning. India’s socialists genuinely wantedto end the poverty and high infant mortalityassociated with the British Raj, and believed

11
that their ideology would rapidly achieve thisaim. And yet these well-intentioned policiesunwittingly killed millions of children. Verily,the way to hell is paved with good intentions.
NotesIndicus Analytica helped prepare the tables in thispaper. I wish to record my appreciation for itsdata gathering and number crunching.
1. Swaminathan S. Anklesaria Aiyar, Escape fromthe Benevolent Zookeepers (New Delhi: Times ofIndia, 2008), p. 9.
2. See Arvind Panagariya, India, the Emerging Giant(New York: Oxford University Press, 2008), and“The Triumph of India’s Market Reforms: TheRecord of the 1980s and 1990s,” Cato InstitutePolicy Analysis no. 554, November 7, 2005.
3. A recent coin discovery in Egypt bearing Cleo-patra’s face has raised a new controversy: perhapsshe was not really beautiful after all.
4. Amartya K. Sen, “More than 100 Million Wom-en Are Missing,” New York Review of Books, Decem-ber 20, 1990.
5. Amartya K. Sen, “Democracy as a UniversalValue,” Journal of Democracy 10, no. 3 (July 1999):3–17.
6. Sen, “More than 100 Million Women AreMissing.”
7. Stephen Dubner and Steven Levitt, “The Searchfor 100 Million Missing Women,” Slate, May 24,2005.
8. Emily Oster, “Hepatitis B and the Case ofMissing Women,” Journal of Political Economy 113,no. 6 (2005): 1163–1216.
9. Monica Das Gupta, “Can Biological Factors likeHepatitis B Explain the Bulk of Gender Imbalancein China? A Review of the Evidence,” World BankResearch Observer 23, no. 2 (2008): 201–17.
10. Ansley Coale, “Excess Female Mortality and theBalance of Sexes in the Population: An EstimatedNumber of Missing Females,” Population andDevelopment Review 7, (1991): 517–23.
11. The statistical analysis in this paper is based ondata from government sources. Data are notalways available for every year: in such cases, themissing values were filled in using simple trendanalysis. India has a per capita GNP series at con-
stant prices with base year 1999–2000 (CentralStatistical Organization, Government of India).Data for earlier years have noncomparable baseyears. I have made them broadly comparable in thefollowing manner: the percentage change betweentwo years was estimated using the series for whichdata were available for those two years, and on thebasis of this percentage change the series with thebase of 1999–2000 was estimated for earlier yearsas well. The annual growth trend for each decadewas estimated by taking a trend over the con-cerned period (this is conducted in MicrosoftExcel using the “logest” command). The Census ofIndia provided the population of India as of thefirst week of March of the first year of every decade(1991, 2001, and so on). Population in interveningyears was calculated by first estimating the annu-alized percentage decadal growth, and using thisgrowth estimate to increase the population everyyear on a compounded basis. A similar estimationstrategy was used to estimate the populationabove age six (the literacy rate in India refers topeople above age six). The Head-Count Ratio is thepercentage of the population below the povertyline, as defined by the Planning Commission ofIndia, Government of India. These figures areavailable at roughly 5-year intervals. (Note: therewas some controversy about the poverty estimatesfor the fiscal year 1999–2000, so they have notbeen used in this analysis.) The HCR in interven-ing years was estimated using a linear-growthmodel based on the percentage of people belowthe poverty line. The elasticity of poverty to GNPper capita growth is estimated as the trend per-centage change in HCR for the period 1971 to2008, divided by the trend growth in per capitaGNP for the same period. Elasticity of literacy andinfant mortality were similarly estimated, as trendgrowth in the literacy rate and infant mortalityrate as a ratio of trend growth in per capita GNP.
12. The fact that economic reform began in Indiain 1980 rather than 1991, and yielded large pro-ductivity gains in the 1980s, is now established inthe academic literature. For example, see DaniRodrik and Arvind Subramanian, “From ‘HinduGrowth’ to Productivity Surge: The Mystery of theIndian Growth Transition,” National Bureau ofEconomic Research Working Paper 10376, March2004.
13. India’s exchange rate was extremely volatile inthe last year, ranging from 47 rupees to 52 rupeesto the U.S. dollar. My dollar estimate of GNP percapita assumes an exchange rate of 50 rupees tothe dollar.
14. The actual decline in literacy in the 1970s wasexceptionally fast—even faster than the decline inmy high-growth scenario—and was followed bymuch slower growth in the 1980s. Because of this,
STUDIES IN THE CATO INSTITUTE DEVELOPMENT POLICY BRIEFING PAPER SERIES
3. Troubling Signs for South African Democracy under the ANC by Marian L. Tupy (April 25, 2007)
2. Kenya’s Fight against Corruption: An Uneven Path to Political Accountability by John Githongo (March 15, 2007)
1. A Second Look at Microfinance: The Sequence of Growth and Credit in Economic History by Thomas Dichter (February 15, 2007)
12
my model gives negative numbers for literacyimprovement for initial years in the table, fol-lowed by rapid improvement later on.
15. Major controversies abound over the appro-priate way of estimating poverty in India, and the
official estimates have been challenged by schol-ars like Surjit Bhalla. I ignore that debate and usethe official data.
16. Joseph Stiglitz, Globalization and its Discontents(New York: WW Norton, 2002).
STUDIES IN THE CATO INSTITUTE POLICY ANALYSIS SERIES
649. Somalia, Redux: A More Hands-Off Approach by David Axe (October 12, 2009)
648. Would a Stricter Fed Policy and Financial Regulation Have Averted the Financial Crisis? by Jagadeesh Gokhale and Peter Van Doren (October 8, 2009)
647. Why Sustainability Standards for Biofuel Production Make Little Economic Sense by Harry de Gorter and David R. Just (October 7, 2009)
646. How Urban Planners Caused the Housing Bubble by Randal O’Toole (October 1, 2009)
645. Vallejo Con Dios: Why Public Sector Unionism Is a Bad Deal for Taxpayers and Representative Government by Don Bellante, David Denholm, and Ivan Osorio (September 28, 2009)
644. Getting What You Paid For—Paying For What You Get: Proposals for theNext Transportation Reauthorization by Randal O’Toole (September 15, 2009)
643. Halfway to Where? Answering the Key Questions of Health Care Reformby Michael Tanner (September 9, 2009)
642. Fannie Med? Why a “Public Option” Is Hazardous to Your Health by Michael F. Cannon (July 27, 2009)
641. The Poverty of Preschool Promises: Saving Children and Money with theEarly Education Tax Credit by Adam B. Schaeffer (August 3, 2009)
640. Thinking Clearly about Economic Inequality by Will Wilkinson (July 14, 2009)
639. Broadcast Localism and the Lessons of the Fairness Doctrine by John Samples (May 27, 2009)
638. Obamacare to Come: Seven Bad Ideas for Health Care Reformby Michael Tanner (May 21, 2009)
637. Bright Lines and Bailouts: To Bail or Not To Bail, That Is the Questionby Vern McKinley and Gary Gegenheimer (April 21, 2009)
636. Pakistan and the Future of U.S. Policy by Malou Innocent (April 13, 2009)
635. NATO at 60: A Hollow Alliance by Ted Galen Carpenter (March 30, 2009)
634. Financial Crisis and Public Policy by Jagadeesh Gokhale (March 23, 2009)
633. Health-Status Insurance: How Markets Can Provide Health Securityby John H. Cochrane (February 18, 2009)
632. A Better Way to Generate and Use Comparative-Effectiveness Researchby Michael F. Cannon (February 6, 2009)
631. Troubled Neighbor: Mexico’s Drug Violence Poses a Threat to the United States by Ted Galen Carpenter (February 2, 2009)
630. A Matter of Trust: Why Congress Should Turn Federal Lands into Fiduciary Trusts by Randal O’Toole (January 15, 2009)
629. Unbearable Burden? Living and Paying Student Loans as a First-Year Teacher by Neal McCluskey (December 15, 2008)
628. The Case against Government Intervention in Energy Markets: Revisited Once Again by Richard L. Gordon (December 1, 2008)
627. A Federal Renewable Electricity Requirement: What’s Not to Like?by Robert J. Michaels (November 13, 2008)
626. The Durable Internet: Preserving Network Neutrality without Regulation by Timothy B. Lee (November 12, 2008)
625. High-Speed Rail: The Wrong Road for America by Randal O’Toole (October 31, 2008)
624. Fiscal Policy Report Card on America’s Governors: 2008 by Chris Edwards(October 20, 2008)
623. Two Kinds of Change: Comparing the Candidates on Foreign Policyby Justin Logan (October 14, 2008)
622. A Critique of the National Popular Vote Plan for Electing the President by John Samples (October 13, 2008)
621. Medical Licensing: An Obstacle to Affordable, Quality Care by Shirley Svorny (September 17, 2008)
620. Markets vs. Monopolies in Education: A Global Review of the Evidenceby Andrew J. Coulson (September 10, 2008)
619. Executive Pay: Regulation vs. Market Competition by Ira T. Kay and StevenVan Putten (September 10, 2008)
618. The Fiscal Impact of a Large-Scale Education Tax Credit Program by Andrew J. Coulson with a Technical Appendix by Anca M. Cotet (July 1, 2008)
617. Roadmap to Gridlock: The Failure of Long-Range Metropolitan Transportation Planning by Randal O’Toole (May 27, 2008)
616. Dismal Science: The Shortcomings of U.S. School Choice Research andHow to Address Them by John Merrifield (April 16, 2008)
615. Does Rail Transit Save Energy or Reduce Greenhouse Gas Emissions? by Randal O’Toole (April 14, 2008)
614. Organ Sales and Moral Travails: Lessons from the Living Kidney Vendor Program in Iran by Benjamin E. Hippen (March 20, 2008)
613. The Grass Is Not Always Greener: A Look at National Health Care Systems Around the World by Michael Tanner (March 18, 2008)
612. Electronic Employment Eligibility Verification: Franz Kafka’s Solution to Illegal Immigration by Jim Harper (March 5, 2008)

611. Parting with Illusions: Developing a Realistic Approach to Relations with Russia by Nikolas Gvosdev (February 29, 2008)
610. Learning the Right Lessons from Iraq by Benjamin H. Friedman, Harvey M. Sapolsky, and Christopher Preble (February 13, 2008)
609. What to Do about Climate Change by Indur M. Goklany (February 5, 2008)
608. Cracks in the Foundation: NATO’s New Troubles by Stanley Kober (January 15, 2008)
607. The Connection between Wage Growth and Social Security’s FinancialCondition by Jagadeesh Gokhale (December 10, 2007)
606. The Planning Tax: The Case against Regional Growth-Management Planning by Randal O’Toole (December 6, 2007)
605. The Public Education Tax Credit by Adam B. Schaeffer (December 5, 2007)
604. A Gift of Life Deserves Compensation: How to Increase Living KidneyDonation with Realistic Incentives by Arthur J. Matas (November 7, 2007)
603. What Can the United States Learn from the Nordic Model? by Daniel J. Mitchell (November 5, 2007)
602. Do You Know the Way to L.A.? San Jose Shows How to Turn an UrbanArea into Los Angeles in Three Stressful Decades by Randal O’Toole (October 17, 2007)
601. The Freedom to Spend Your Own Money on Medical Care: A Common Casualty of Universal Coverage by Kent Masterson Brown (October 15, 2007)
600. Taiwan’s Defense Budget: How Taipei’s Free Riding Risks War by Justin Logan and Ted Galen Carpenter (September 13, 2007)
599. End It, Don’t Mend It: What to Do with No Child Left Behind by Neal McCluskey and Andrew J. Coulson (September 5, 2007)
598. Don’t Increase Federal Gasoline Taxes—Abolish Them by Jerry Taylor and Peter Van Doren (August 7, 2007)

ANNE APPLEBAUMWASHINGTON POST
GURCHARAN DASFORMER CEO, PROCTER
& GAMBLE, INDIA
ARNOLD HARBERGERUNIVERSITY OF CALIFORNIA
AT LOS ANGELES
FRED HUGOLDMAN SACHS, ASIA
PEDRO-PABLO KUCZYNSKIFORMER PRIME MINISTER OF PERU
DEEPAK LALUNIVERSITY OF CALIFORNIA
AT LOS ANGELES
JOSÉ PIÑERAFORMER MINISTER OF LABOR AND
SOCIAL SECURITY, CHILE
T he Center for Global Liberty and Prosperity was established to promotea better understanding around the world of the benefits of market-lib-eral solutions to some of the most pressing problems faced by develop-
ing nations. In particular, the center seeks to advance policies that protect humanrights, extend the range of personal choice, and support the central role of eco-nomic freedom in ending poverty. Scholars in the center address a range of economic development issues, including economic growth, international finan-cial crises, the informal economy, policy reform, the effectiveness of official aid agencies, public pension privatization, the transition from socialism to the mar-ket, and globalization.
For more information on the Center for Global Liberty and Prosperity, visit www.cato.org/economicliberty/.
Nothing in this Development Briefing Paper should be construed as necessarily reflecting the views of the
Center for Global Liberty and Prosperity or the Cato Institute or as an attempt to aid or hinder the passage of
any bill before Congress. Contact the Cato Institute for reprint permission. Additional copies of Development
Briefing Paper are $6 each ($3 for five or more). To order, contact the Cato Institute, 1000 Massachusetts
Avenue, N.W., Washington, DC, 20001, (202) 842-0200, fax (202) 842-3490, www.cato.org.
OTHER STUDIES ON DEVELOPMENT FROM THE CATO INSTITUTE
BOARD OF ADVISERS
“An International Monetary Fund Currency to Rival the Dollar? Why Special Drawing RightsCan’t Play That Role” by Swaminathan S. Anklesaria Aiyar, Development Policy Analysis no. 10(July 7, 2009)
“The False Promise of Gleneagles: Misguided Priorities at the Heart of the New Push for AfricanDevelopment” by Marian L. Tupy, Development Policy Analysis no. 9 (April 24, 2009)
“El Salvador: A Central American Tiger?” by Juan Carlos Hidalgo, Development Policy Analysisno. 8 (March 9, 2009)
“The Benefits of Port Liberalization: A Case Study from India” by Swaminathan S. AnklesariaAiyar, Development Policy Analysis no. 7 (December 3, 2008)
“Zimbabwe: From Hyperinflation to Growth” by Steve H. Hanke, Development Policy Analysisno. 6 (June 25, 2008)
“A Decade of Suffering in Zimbabwe: Economic Collapse and Political Repression under RobertMugabe” by David Coltart, Development Policy Analysis no. 5 (March 24, 2008)
“Fifteen Years of Transformation in the Post-Communist World: Rapid Reformers OutperformedGradualists” by Oleh Havrylyshyn, Development Policy Analysis no. 4 (November 9, 2007)
“Securing Land Rights for Chinese Farmers: A Leap Forward for Stability and Growth” by ZhuKeliang and Roy Prosterman, Development Policy Analysis no. 3 (October 15, 2007)