social simulation for sensemaking final - cynthia kurtz 2009c social simulation for...
TRANSCRIPT

1
Social Simulation for Sensemaking
Cynthia F. Kurtz
Abstract
This paper describes a simulation of social networks that applies the ideas of Blau space to the issues of social group formation and collective goal achievement. The simulation was originally intended to help people plan Social Network Stimulation (SNS) projects, whose goal is to seed the emergence of collectively beneficial network connections within an organization or community. However, the utility of the simulation expanded beyond its original intention into general support of sensemaking about group formation in social networks. The theoretical background of the simulation is described and some thought-provoking patterns of group formation and goal achievement are described. Example patterns are the value of a sorting-out process for matching individual and group goals and the value of low barriers to small-scale contribution. The paper concludes with an opinion about the best uses of social simulation.
Citation
This is a white paper released under a Creative Commons Attribution-Noncommercial-No Derivative Works 3.0 Unported License. Please cite the paper as follows:
Kurtz, C.F. 2009c. Social Simulation for Sensemaking. White paper available at http://www.cfkurtz.com.
On a technical note, the simulation program I describe here was written for the Cognitive Edge company and their government client. I received permission from Cognitive Edge to publish this paper but not to distribute the program or its source code. If you are interested in details of the simulation program please contact Cognitive Edge at http://www.cognitive-edge.com.
Introduction
The simulation described in this paper was built as part of a project whose goal was to help a client plan and carry out Social Network Stimulation (SNS) projects (Snowden 2005). Briefly, the goal of a SNS project is to seed the emergence of collectively beneficial network connections within an organization or community. The idea of SNS originated from studying the ideas behind the Grameen Bank phenomenon (see e.g., Yunus 2003) and thinking about how they could be applied to organizational dynamics. The process of an SNS is to set up three sets of conditions that promote self-organization, thus:
1. An intractable problem that represents a common threat or opportunity will motivate groups towards a shared goal. Such a problem will typically be nebulous and possibly already considered impossible to solve via conventional means. But solving the intractable problem is actually not the goal of the SNS; the goal is to improve collective functioning in general, and the intractable problem is a means towards that end.
2. A group reward full of meaning and linked with the identity of the community yet normally difficult to obtain. These rewards will vary based on unique features of the community. For some communities the chance to make a presentation before senior executives would be compelling; for others a week to do whatever work they think is necessary would be best. A

2
well-designed reward will resonate with the collective hopes of the community.
3. A set of group formation rules designed to create new linkages between previously unlinked parts of the community. An example of such a rule might be that at least one and not more than two members of the group must have been in the community for less than six months.
These initial conditions, if well planned and grounded in the community, can lead to increased coherence for collective problem solving.
The initial goal of this research project was to build a simple proof-of-concept simulation that would help people make decisions about how to plan the rules for group formation in an SNS. However, as the project progressed it became obvious that this was an excessively narrow view. In fact, using the simulation to make decisions for an SNS turned out to represent only a small portion of its useful breadth. The simulation can be used to explore the dynamics of any network, familiar, friendly or hostile, in the past, present or future. It can be used to think about external groups such as terrorists or competitors or customers or allies, for thinking about how to proactively change the dynamics of their networks and collective achievements, with or without reference to SNS.
Theoretical background
The field of social simulation is large and varied, yet fragmented. In their book Computational Modeling of Behavior in Organizations Ilgen and Hulin (2000) present simulations of work stoppage, faking on personality tests, pay-for-performance reward systems, group discussion, team collaboration, the evolution of cultural norms, group formation, and organizational adaptation to market forces. Many other such books and papers describe other simulations on other topics.
For this research project I was particularly interested in the simulation of voluntary group formation and collective goal achievement. Gilbert (2000b) describes a simulation by Chattoe and Gilbert (1997) in which individuals make choices about how to budget their income into “categories such as rent, food, leisure, travel, and so on.” In their simulation people make these choices using “both individualistic calculation (based for example on a projection of likely expenditures) and social imitation of others' budgeting strategies.” Chattoe and Gilbert found that even though people were given uniformly distributed incomes, they eventually formed a number of “lifestyle pattern” clusters similar to social classes through the positive feedback of social imitation.
Edmonds (2006) described a simulation in which similarity tags (markers useful for identification) were used by individuals to decide to whom they were willing to donate excess resources. Individuals were given “skills” to collect a range of different “food types” and could donate excesses of one type to others without the necessary skills. Edmonds found cycles in which reciprocal-donation groups arose, were taken over by “selfish” individuals (who took but did not give) and dissolved, followed by the emergence of new such groups. They characterized these reciprocalist-selfish cycles as similar to predator-prey cycles. They also found that the greater the degree of specialization (hence need for donation from others) the less stable the groups that form.
Zeggelink et al. (2000) described a simulation in which three strategies for giving aid were compared:
1. the social strategy, in which people preferentially gave aid to those to whom they had given more than they had received;
2. the asocial strategy, in which people preferentially gave aid to those from whom they had received more than they had given; and
3. the commitment strategy, in which people preferentially gave aid to those who had helped them the most (regardless of their own behavior).

3
They found that only the commitment strategy produced stable groups, because in the other two cases people kept tit-for-tat lists that (given the random nature of the need for aid) were frequently equal. The commitment strategy had a staying power that allowed people to form longer-term preferences.
Palmer (2006) described a simulation which studied two processes at work in teams:
1. elaboration (in which people in a group benefit from diverse viewpoints) and
2. categorization (in which people in a group don't benefit from diverse viewpoints because they under-value viewpoints of different categories).
Simulated teams were given tasks to perform which required the input of all members to be maximally effective. The simulation showed an upside-down U-shaped curve of group performance with diversity.
Windrum and Birchenhall (1998) modeled research groups competing for funding from a “research council.” The groups proposed projects to complete based on “theories” of the “world” (a function of which they were incompletely aware) and were awarded funds based on how closely their theories matched the actual world function. Since it takes money to improve on theories, a positive feedback loop appeared: a small number of research groups came to receive most of the funding and thereafter dominated the research agenda.
Blau space
McPherson and colleagues have used simulation to explore the evolution of group memberships in large networks (see e.g., McPherson and Ranger-Moore 1991, McPherson 2004). This work relies heavily on the use of Blau space, which is based on the ideas of Peter Blau (e.g., Blau 1960). Blau space is defined as an n-dimensional space made up of many characteristics which matter in how people relate to each other: race, gender, politics, outlook, values, and so on. Blau space is not uniformly dense; there are vast empty areas in which particular configurations of characteristics are not found together. For example, it is hard to find illiterate millionaires, but it is easier to find vegetarian opera lovers.
According to Blau, early hunter-gatherer societies covered relatively few dimensions, and were flat in their structure and “multiplex” in their network connections: similar people maintained many strong connections. Today, the Blau space of most societies contains many dimensions (meaning people vary in more ways), and people have fewer and weaker numbers of “simplex” network connections. Says McPherson (2004):
The division of labor, and the accompanying social differentiation which coevolves with new multiplicities of ways of making a living lead to a proliferation of social dimensions that make a difference in human interaction.... The relationship based upon the whole person gives way to the unpacking of increasingly limited and specialized connections.... The number of observable characteristics that can affect social interaction are virtually unlimited.
An important theorem in this body of work is the homophily principle, which says that people are more likely to communicate with people closer to them in Blau space. This has been amply proven in voluntary associations (though the inclusion of complementarity as well as homophily has been suggested). Since Blau space has so many dimensions, there may be many “close” locations, depending on which dimensions matter more at any time or in any context. Diplomats are experts at finding dimensions on which they are close to negotiators and making use of them to create bonds of mutual respect.
Using this conception of Blau space, McPherson derives a simulation model that describes groups in networks as niches in an ecology (McPherson 2000). Homophilous groups emerge from the

4
interactions of individuals, and groups compete with each other for the time and resources of individuals. Thus McPherson models groups as entities upon which the pressures of variation, selection and retention apply. The Blau-space landscape on which groups interact is similar to Sewall Wright's adaptive landscape used in evolutionary biology. McPherson differentiates his modeling approach from individual-based models thus (from McPherson 2004):
The points in Blau space are social positions described by the values of the Blau dimensional variables. Each position may be occupied by multiple people. The values of the Blau dimensions are not attributes of individuals, but are quantities that locate social positions in relationship to one another. This shift in emphasis, while subtle, is essential to an understanding of our model. Each locus in Blau space is defined by its position relative to all the other positions. Two positions are characterized by their distance from one another in this multidimensional space, rather than their distances from the mean. The Blau variables create a map of social space within which social process is carried out. The most disturbing aspect of the mainstream approach to these variables is that it is fundamentally atomizing. These regression models are rooted in an essentialist view of reality. Characteristics of individuals are treated by the conventional approach as though they originate in the individuals, and do not derive from social process.
When I first read about Blau space I recognized that the idea of a “map of social space” was similar to the mapping created by narrative capture and emergent construct derivation (see e.g., the description of narrative complex-space mapping in Kurtz 2009b). This, in addition to its emphasis on avoiding atomistic individual modeling, made Blau space seem a good foundation for building an SNS planning simulation.
The simulation framework
The simulation that resulted from the SNS research project, which I named SNSim, layers the principal elements of SNS over those of McPherson's Blau space simulations. The environment of the simulation is defined by several Blau-space dimensions. Some of these are factual dimensions, or things like age, experience, agency, position, ethnic origin, geographic location, and the like. Factual dimensions are directly tied to a simple description of the population (how many in each age group, etc). The purpose of the simulation also affects which factual dimensions are chosen. For example, if the goal of the project is to get more people talking across groups, group membership would be an obvious factual dimension.
Constructs and construct dimensions
Other dimensions are based on emergent constructs such as personifications and have to do with socially relevant characteristics of people: interests, perspectives, skills, biases, and the like. Constructs are packages of meaning that integrate understandings about a population which may be hard to articulate in isolation. They capture essential elements of what matters about the population in ways that evoke understanding in those who talk about them. In a group in which such constructs are part of a shared language, a reference to "Eager beavers" produces a different understanding than a reference to "Figureheads." Constructs can be derived from workshop-based emergent processes (for more information on this process see Kurtz 2008) or they may be formed in discussion, though workshop methods are always better. Such reference-packages arise naturally in most social groups; deriving them in a workshop is just a way of helping them surface more easily.
Construct dimensions are created by first deriving a "family" of emergent constructs, then examining the constructs to find dimensions of meaning which will capture the essential similarities and differences among them. When all of the constructs can be placed, the set of construct dimensions is

5
complete. To give an example, here are some construct dimensions derived from a clustering exercise to describe ways of working: scope (broad to focused), urgency (urgent to relaxed), structure (structured to unstructured), authority (in charge to no authority), whether politics and public opinion guides behavior (matters most to matters least), collaboration versus conflict (harmony to discord), and transparency (open to closed).
How dimensions are used
Before the simulation starts, individuals are given “profiles” along defined dimensions in Blau space. Individuals are never defined directly, one at a time. Rather, distributions of characteristics are spread across the population in layers. In effect Blau space is overlaid on the whole population one dimension at a time, building up a series of probability density functions in a vertical stack over a baseline plane.
For factual dimensions, values are determined by “population rules” which spread either normal (bell-shaped) or uniform distributions across the dimensional axis. Any number of such distributions can be combined to describe any one dimension, so that a population might for example overlay a uniform age distribution on two bell-shaped peaks to represent complex demographics.
How constructs are used
Each emergent construct is a package of population rules, one for each dimension involved in that construct. Thus the “Nose to the grindstone” construct might specify narrow high means in the structure and urgency dimensions, a broader but low mean in authority, and a uniform distribution in scope. Once the constructs are thus defined, it is a simple matter of deciding what mix of constructs one wants to use to represent the population (twenty percent "Nose to the grindstone," forty percent "Big picture thinkers" and so on).
For each person, dimensional values are applied one dimension at a time. For construct dimensions, a construct is chosen, then its population rule for that dimension is applied. What this does is avoid creating a population of pure constructs. Rather it creates a population in which the characteristics of the defined constructs are present in the proportions desired, but no one person embodies any construct. Each individual is unique, but as a whole the population inhabits the dimensions as defined by the constructs and their mix. I believe this is the closest we can get to modeling shifting human identities.
Correlation rules
Correlation rules tie together values given in any two or more dimensions (factual or construct or both). This amounts to a structuring of Blau space independent of construct definition. For example, the “Age” and “Experience” dimensions might be correlated within any one person; or the “Interested in Music” and “Interested in Jazz” dimensions might be correlated. Correlations can also be negative, which means that certain sets of dimensions are not likely to be found at similar values.
Tie formation
Once the simulation begins, individuals form dyadic ties of mutual acquaintance probabilistically, though the probability is increased by homophily (how close two individuals are in Blau space) and group co-membership (how many groups they share). The impact of homophily and co-membership on tie formation is controlled by parameters which range from completely random tie formation to tie formation based (almost) solely on similarity and co-membership.
New ties are created in this way. Each day, each individual determines how many new ties they should

6
form. This is based solely on the “Tie Probability” parameter and typically is one tie every few days. Then, they go randomly through the population attempting to form ties with other individuals. The probability of each of these potential ties goes up as homophily and group co-membership go up (if those parameters are set above zero). The homophily factor is simply the Blau-space distance between the two potential acquaintances divided by the highest Blau-space distance between any two individuals in the simulation. The co-membership factor is the number of groups they share divided by the number of groups either of them belong to (basically an and/or comparison). The probability of forming any particular tie is the average of the homophily factor and the co-membership factor (plus a small “extra” probability that only matters if both of those parameters are set to zero).
One might argue that individuals should not move randomly around the population searching for a tie to make but should evaluate all possible ties and choose one based on the best possible tie. In fact I did have the simulation work this way in an early version. However, it proved to be computationally intractable as every person needed to consider a tie with every other person every day. But after changing it to a two-step model, I realized that it was actually more realistic this way, since people never have the luxury of knowing about every single person in a population before they choose people to meet. Rather, people really do meet with some degree of randomness. In the simulation, individuals do not automatically form a tie with the first individual they meet but “sample” the population some number of times and choose the best of those probabilities before actually attempting to make the tie (meaning, draw a random number and see if it falls below the probability).
Individuals in the simulation also “forget” acquaintanceships over time, probabilistically, and affected by homophily and co-membership. Thus if two individuals start out knowing each other and join dissimilar groups, they will “drift apart” and be more likely to stop associating with each other.
Group formation
When two individuals form a tie, they sometimes attempt to form a two-individual group. Three factors affect whether this happens. First, a simple probability is drawn. Second, creating such a group may or may not be allowed, according to group formation rules. An example of a group formation rule might be "a group can only form if at least one person under consideration is under 20 years old." Another might be "no group can contain more than two individuals from any one corporate division."
Third, forming the group may or may not be achievable, since joining a group takes time and energy (“TAE”), of which each person has a fixed (though randomly varying in a normal distribution) budget per day. Since contributions to existing groups are made before new groups are created, individuals may have already used up their available TAE. This is so as to give a priority to existing groups, which is realistic (though the priority can be changed via a parameter).
In any case, at least some individuals must form some dyadic groups, because this is the only way new groups can form. The assumption here is that the formation of groups is not mandated but emerges from the self-organized collective activities of people who have met, activities which rarely take the form of several strangers deciding all at the same time to form a group together.
In addition to forming dyadic groups, individuals who are acquainted introduce each other to the groups they belong to over time. This is of course subject to the group formation rules and whether the person has enough time-and-energy to join the group on that day. This is another central tenet of Blau-space theory, which is that people join people, not groups.
Contributions to groups
Individuals contribute their time and energy (TAE) to groups preferentially based on two things: how close they are in Blau-space distance to the centroid of the group (if the homophily bias parameter is

7
set high enough); and how well the group is doing (collectively). This second factor produces positive feedback cycles in which better groups get better and worse groups get worse.
Individuals contribute to groups before they join new groups, but they may “save” a portion of their TAE (as determined by a parameter) in order to join new groups later in the day. (It might have been a good idea to have group contribution and new group formation compete for TAE, but I didn't think of that at the time.)
Goal achievement and failure
When groups collect a certain amount of time and energy (as determined by a parameter), they achieve their goal. Goals can either be automatically achieved when the required amount of TAE is acquired, or they can be achieved by competition, in which only some number of the best performing groups achieve their goals on any day or throughout any time period.
If the group fails to collect another parametric amount of TAE for some number of days in a row, it will “fail” and no longer be able to achieve its goal. Thus groups compete with each other not only for membership but also for the ability to attain their goals without failing.
Leaving groups
Individuals leave groups based on three factors. First, there is a general small probability of leaving groups when no other factors are in effect (these “default” probabilities are mainly to deal with parameter settings that would otherwise create pathological conditions).
Second, groups compete with each other for the time and attention of members. This is done by calculating the Blau-space distance between the person and the group's average, then calculating the distance between the person and all of the individuals they know who are not in that group. If the person is closer to the group than to the rest of their acquaintance, they are more likely to stay in the group. If they are closer to the other individuals they know, they are less likely to stay in the group.
Third, a group's collective performance affects whether individuals leave it or not. A group can be active, inactive, achieving, or failed, and which of these states it is in has an affect on whether individuals are more or less likely to leave it. Usually, individuals will be more likely to stay if a group has achieved its goal and more likely to leave if a group has failed or is inactive. These things are all subject to parameters, however, so if it suits the simulator's purpose they can reverse the effect of these states.
Simulation parameters
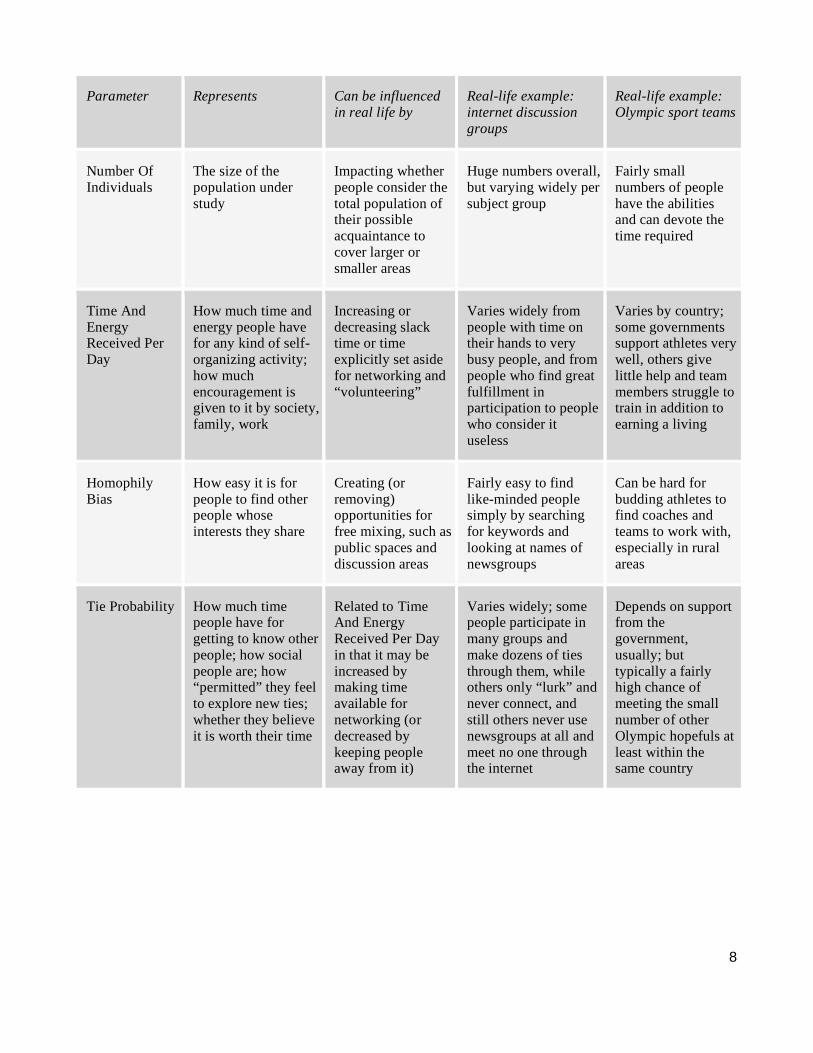
In addition to dimensions, population rules, group formation rules, and correlation rules, 24 systemic parameters determine the initial conditions of a SNSim simulation. They are described in the following table, with explanations of the elements of the real-life aspects they represent, what can influence them, and two examples of how they play out in real situations.
8
Parameter Represents Can be influenced in real life by
Real-life example: internet discussion groups
Real-life example: Olympic sport teams
Number Of Individuals
The size of the population under study
Impacting whether people consider the total population of their possible acquaintance to cover larger or smaller areas
Huge numbers overall, but varying widely per subject group
Fairly small numbers of people have the abilities and can devote the time required
Time And Energy Received Per Day
How much time and energy people have for any kind of self-organizing activity; how much encouragement is given to it by society, family, work
Increasing or decreasing slack time or time explicitly set aside for networking and “volunteering”
Varies widely from people with time on their hands to very busy people, and from people who find great fulfillment in participation to people who consider it useless
Varies by country; some governments support athletes very well, others give little help and team members struggle to train in addition to earning a living
Homophily Bias
How easy it is for people to find other people whose interests they share
Creating (or removing) opportunities for free mixing, such as public spaces and discussion areas
Fairly easy to find like-minded people simply by searching for keywords and looking at names of newsgroups
Can be hard for budding athletes to find coaches and teams to work with, especially in rural areas
Tie Probability How much time people have for getting to know other people; how social people are; how “permitted” they feel to explore new ties; whether they believe it is worth their time
Related to Time And Energy Received Per Day in that it may be increased by making time available for networking (or decreased by keeping people away from it)
Varies widely; some people participate in many groups and make dozens of ties through them, while others only “lurk” and never connect, and still others never use newsgroups at all and meet no one through the internet
Depends on support from the government, usually; but typically a fairly high chance of meeting the small number of other Olympic hopefuls at least within the same country

9
Parameter Represents Can be influenced in real life by
Real-life example: internet discussion groups
Real-life example: Olympic sport teams
Number Of Random People Sampled Before Choosing Best For Tie
Same as previous, and also attitudes about what is a “good enough” acquaintance
Providing or taking away opportunities to evaluate others without entering into full acquaintance-ships, such as common areas and publication venues
Some people may “lurk” for months or years before making their presence known; but others blunder right in, ask silly questions, and don't mind the remonstrances that result; people more familiar with the technology are more likely to sample less before forming ties
Since competing together is so risky, people may evaluate the performances of others for years before deciding to work together
Tie Comembership Bias
Whether people are allowed and encouraged to invite others to join in voluntary groups, or whether group membership is kept separate from other social links
Changing the way in which people introduce others to groups; for example if one wanted to decrease this one could publically raise suspicions that infiltrators are everywhere, causing scrutiny of possible new members to increase
Some groups allow anyone in and advertise for new members; others require application and approval; others require invitation (but those are few); for the majority of groups there is little barrier to entry; though people do sometimes hear about groups from people they know, they are as likely to just find such a group while searching the internet
The barrier to membership in an Olympic sports team is usually very high; people must prove themselves through other competitions as well as auditions, and people must also sometimes have good connections and enough money to participate on their own; knowing someone “in the business” is a big help
Tie Memory The turnover rate within the community; whether people have permitted long-term venues to socialize and reinforce existing ties
Manipulating the consistency of meeting places (physical and virtual)
Some discussion groups are venerable at this point, but some come and go quickly; in few of them do the same people contribute for long time periods
People often stay involved in the Olympics over their entire lifetimes, sometimes becoming coaches later in life

10
Parameter Represents Can be influenced in real life by
Real-life example: internet discussion groups
Real-life example: Olympic sport teams
Probability Of Tie Creating Dyad Group
Whether it is easy or difficult to do what needs to be done to be recognized (internally or externally) as a “project group” which is allowed to work on projects related to goals
Changing how easy it is for people to create small informal groups; something as simple as allowing people to set up discussion boards for project groups (or disrupting such boards) would have a big affect on this input
Starting a group is very easy, so easy that people do it quite often, even if they don't plan to put energy into maintaining the group; starting a group with only two people is as easy as emailing back and forth
People rarely form completely new teams in the Olympics, but one could imagine people wanting to start a team for the first time in a country that has never had one before; such a move would probably be pondered long and seriously before such a step was taken
Days Knowing Person Before Full Probability Of Joining Their Groups
How much people are able, willing, and encouraged to invite others into their project groups (rather than say having some central control decide who may join)
Changing how open or secretive groups are, which would change how free people felt to invite new acquaintances into their groups
People often tell each other about discussion groups and sometimes explicitly invite them by sending them links and asking them to join in a discussion; it is not something people consider difficult or unwelcome
People on Olympic teams who meet are fairly unlikely to invite each other to join their teams, simply because switching teams is a decision that is not taken lightly, and people would not presume to suggest it

11
Parameter Represents Can be influenced in real life by
Real-life example: internet discussion groups
Real-life example: Olympic sport teams
Competition Bias
How much people pay attention to other people they know who are not in their groups
Changing how absorbed people are in group projects (so that they do or do not pay attention to competition for their time); helping them multi-task and deal with multiple groups; changing how permitted they feel to participate in multiple groups
Participating in internet discussion groups is for most people an extremely peripheral activity, and they give it a low priority related to other tasks; they also don't show great allegiance to any particular group, but may keep tabs on several groups at once and shift their attention constantly depending on what is going on in each group and how it relates to their interests
People on Olympic sport teams tend to be highly motivated and absorbed in their work and their teams, and are not likely to be pulled away from them easily
TAE To Join Group
How time-and-energy consuming it is to join an existing group – do you need a password, do you need to wait for permission from some higher authority, does there have to be a debate, etc
Changing the threshold for existing group entry
Some discussion groups require you to read the FAQ or some “netiquette” rules before contributing (or asking questions), so this can be a barrier to entry
People who want to join an Olympic team usually have to prove themselves by performing as advertised in a trial period
Proportion Of Daily TAE Saved For New Group Formation
How “loyal” people are to existing groups; how hard it is for them to allocate time to new things; how interested they are in change
Keeping people busy with existing groups, or giving them time to join new ones
People seem to spend a lot of time looking out for new groups and often follow links mentioning them just to find out what is happening there; they want to know “what is going on” in the whole world of discussion, not just in the groups they already belong to
People in Olympic sports teams do not usually spend much time considering other groups, unless there are situations where they feel unhappy

12
Parameter Represents Can be influenced in real life by
Real-life example: internet discussion groups
Real-life example: Olympic sport teams
TAE To Contribute To Group If Active
How much groups ask of people who belong to them when there is activity going on
Increasing or decreasing the demand on people exacted by groups
The amount of contribution people need to make to keep a group active varies by the group; some simply send lots of brief Q&A messages; others write long treatises (and everyone knows what the expectations are)
The demands on people to belong to active Olympic sports teams are legendary
TAE To Contribute To Group If Inactive
How much groups ask of people who belong to them when the group is quiescent
Increasing or decreasing the “maintenance” tasks required to keep a group existing but inactive
Inactive discussion groups don't require much effort above checking to see if things have picked up (which people may forget to do)
In times of rest, such as just after an Olympics is finished, there is still a strong demand on group members to keep themselves fit and not let their performance slip
Group Active If TAE For Day Above
How much collective effort it takes for a group to be considered active by its members (and by authority, if that matters); the turning point where people start paying attention to what is going on in the group
Making it easier or harder for people to see activity of others and thus register that the group is active; solutions that increase “social translucence” lower this parameter
It is fairly easy in internet groups to see activity, but different groups develop different norms of what is considered an active discussion
There is a high expectation of time and energy put into training before someone on an Olympic sport team is considered to be actively preparing for a contest
Group Fails If Inactive For Consecutive Days
How willing people are to keep track of groups where nothing is happening
Making it easier or harder to “forget” about inactive groups, perhaps by making their information closer or farther from daily notice
People tend to abandon discussion groups quickly if there is no chatter, probably because they know there are so many other groups they could participate in
There is generally some tolerance of a sport team “taking a break”, but it does not extend very long before people start to eye other teams

13
Parameter Represents Can be influenced in real life by
Real-life example: internet discussion groups
Real-life example: Olympic sport teams
Max Group Size
What sorts of capacities there are for accommodating groups in whatever milieu they take place (physical, technological, in more formal circumstances)
Providing or taking away capacity in spaces or technologies for meeting
Limits on group size are mainly cognitive, in terms of how many posters people can remember, but there are no technological limits at this point (and it is difficult to change them)
The size limit of most Olympic sport teams is mandated by the sport
Group Leaving Probability
How loyal people are to groups in general; how serious membership in such groups is seen to be; how much support is given to groups
Supporting or denying support to groups; making being in the group have a more positive or negative effect on other things (like employment and income)
There is a wide range of loyalty to discussion groups, with most being very ready to walk away, but people in a few venerated groups (such as SlashDot) being much more likely to stay
These teams are very loyal and do not leave easily
TAE Group Must Collect To Achieve Reward
What level of collective effort is required to achieve goals group members want to achieve, or that have been set up externally
Increasing or decreasing the difficulty of performing the collective task
Discussion groups often produce long and well written “FAQs” which, taken all together, form an impressive encyclopedia of information; however, many groups never advance to the point of being able to compile such a document
The amount of effort required for an Olympic sport team to win a medal in competition is very large
Number Of Top Groups Achieving Reward On Any Day
How “success” of a group is measured, and whether it depends on the relative success of other groups
Changing the rules of how groups compete
Success of groups having discussions on the internet is more helped than hindered by the success of other groups, since more successes bring more people in to participating
Success of Olympic sports teams is heavily competitive, and only a few can win in any category, and not frequently either

14
Parameter Represents Can be influenced in real life by
Real-life example: internet discussion groups
Real-life example: Olympic sport teams
Inactive Multiplier For Leaving Probability
How quickly people lose interest when a group is inactive; how fickle they are and how easily drawn to other interests; how much their participation depends on what others are doing (as opposed to forging on themselves to bring the group back into action)
Making inactivity more obvious and less attractive, or making inactivity less obvious and less alarming
People in discussion groups tend to surmise if a group is going downhill and abandon it quickly, though there are exceptions especially in the case of famous and well-respected groups, or groups in which people have formed close emotional ties, such as in mutual support groups
People working towards the Olympics are usually heavily motivated and are not likely to leave a team when it has one bad placement
Failure Multiplier For Leaving Probability
How quickly people lose interest when a group fails in its collective goals
Publicizing failures or minimizing them
When a discussion group is obviously unable to fulfill its goals, whether they are just to have lively and productive conversation or to actually produce useful documents, people are usually very quick to abandon it and look for other avenues to discuss the same thing
Decisions to leave a team are usually long studied with all the alternatives weighed
Reward Multiplier For Leaving Probability
How much more (or less) likely people are to stick around after a group has met its goals
Publicizing achievements or hiding them
Discussion groups with lively debate and organised infrastructure (FAQs, archives, etc) usually maintain a good “buzz” as long as this appearance continues
Having a winning season is no particular guarantee that people will stay in the team; they are always looking out for something better, though (as with group failure) they will deliberate long and hard on what is the best course

15
An example simulation run
To give you an idea of what using the simulation is like, I'll step through a run. In the simple data set I use here, the factual dimensions are age, experience, and division. The construct dimensions are detail (big picture to detail oriented), conviction (relaxed to zealot) and structure (anything goes to regimented). Two constructs, anarchists (low detail, high conviction, lowish structure) and bureaucrats (high detail, high conviction, high structure) have been created. The population is made up of 60% bureaucrats and 40% anarchists. Age and experience distributions are bimodal, and the division distribution is uniform. The only correlation rule is that linking age with experience.
Here I have only run the simulation for ten days. Two groups have formed, as you can see in the upper graph (showing the number of groups) and in the three Blau-space graphs. The gray lines show that they are active. A few dyadic ties are marked in green.
These graphs show the simulation after ten more days have passed. The total number of groups has increased to seven. Note that some of the groups are now an orange color that denotes inactivity.
At day 50, you can see that some groups have achieved their goals (they are shown in red). Some have failed (in black). The time series shows the time and energy (TAE) contributed to each group over time. There appears to be some "sorting out" going on in how much TAE groups are getting.

16
On day 160, 15 of 45 existing groups have achieved their goals. The graph of group size shows a small number of large groups and many smaller ones.
Now the simulation has run for 620 days. The number of groups has begun to level off at around 130. Group size averages between two and three members, though some groups are much larger. The largest group has 20 members. The time series of individual memberships shows that the bulk of people have about 3-5 group memberships. I've changed the Blau space graphs in search of interesting patterns. Note how in the Age-Structure graph there are two "clots" of redness, meaning two dimensional locations where groups perform better than others. Something similar is going on in the Structure-Detail graph, though the pattern is much more spread out.
Simulation behavior
To explore the baseline behavior of the simulation, I simply set up the simulation with "default" parameters and ran it to see what would happen. I set default parameters based on what seemed reasonable expectations for a normal group of people, and at first no group formation rules were applied. The dimensions used were several real construct dimensions identified in a client workshop as well as some (fake) factual dimensions. The following are some of the patterns I saw.

17
This is what a simulation with default parameters looks like. This graph shows the size of each group as a blue line over time. New group creation usually slows down around 500 days and peaks at around 120-140 groups. Group size usually forks into a large number of small groups of 2-5 people, with a smaller number of larger (10 -20 person) groups. You can see some of the largest groups arching up over the smaller ones.
A similar pattern obtains with ties; individuals seem to sort themselves into two classes of behavior. The majority of individuals end up with around five or six ties, with a few social individuals maintaining 12 or more.
Group memberships are similarly distributed as well: most individuals belong to around four or five groups, but a smaller number maintain ten or more group memberships. It is hard to see it in these pictures because the data for different groups and individuals are overlaid, but individuals seem to oscillate back and forth in how many ties and memberships they maintain. This is a result of stochastic elements of the simulation.
The accumulation of time and energy (TAE) towards goals also shows a sorting process, with most groups achieving only a small amount of TAE each day, but some groups occasionally receiving spurts of contribution. This is most likely due to the positive feedback that occurs when a group gathers momentum and people start to pay more attention to it. The group then achieves its goal and people go back to more modest contributions to other groups. Some groups move quickly to achievement; others oscillate between active and inactive states, and some finally fall down to failure (from which they do not return).

18
The rate of achievement (originally called rewards) seems almost always to follow an S-shaped curve. It is high during the early days of the simulation, then decreases and finally plateaus. This is most likely because the best-performing groups form early on, then (since they cannot achieve any additional goals) take up the most homophilous space and cause the subsequently formed groups to perform less well. This pattern can also be seen in the “Group: TAE today” graph above (in red), where there is a slowly downward-shifting mean group contribution as the “best” groups become saturated. This pattern would be different if groups were allowed to achieve multiple goals, and that is an obvious extension that would add utility to the simulation.
Group failure, in which individuals stop contributing to the group because it has been too long inactive, also follows a characteristic S-curve, though slight and in the opposite direction. This is probably due to the fact that later groups, not being as productive, will fail more frequently.
A common pattern is seen in all pairwise dimension comparisons: goal-achieving groups tend to be located closest to the centroid of all the individual Blau-space locations in the population. Failed groups (in black) can usually be seen at the peripheries of the distribution of points.

19
Where individual Blau-space locations are more widely distributed, two or more clusters of goal-achieving groups tend to form. These represent multiple optima for group contribution.
With the default (“reasonable”) set of parameters you get these characteristics in the final population. This graph is from 100 runs of 500 days each. As you can see from the standard deviations over 100 runs (purple bars) simulation behavior is fairly stable with identical parameter sets. You can see that there is considerable flux in group membership — note the high numbers of new and lost members, meaning individuals shift allegiances often. For example, the number of new memberships created is three times the number of memberships kept.
Varying parameters
After looking at the simulation results with only default parameters, I ran 90 single-parameter manipulations, usually with two or three values for each parameter, to get an idea of the shape of the phase space created by the simulation. For each set of parameter values I ran the simulation for 500 days, since I had noticed in previous runs that conditions such as the number of groups seemed to stabilize after that length of time. I always used a population size of 50 individuals. This was determined mainly by computational limitations: at larger population sizes the simulation takes much longer to run, since the number of potential ties goes up exponentially. I did do some runs at 80 and 100 individuals and found the results pretty much the same. McPherson (2000) reports having this same issue and reporting the same limit to population size in practice.
Rather than going through all the 90 permutations of parameters on which the sensitivity analysis was run, I will simply go through some of the conditions that produced the most interesting results.

20
Few groups
These are some of the parameter values that produced pathologically small numbers of groups. For each I consider real-life situations that could lead to the same results.
Parameter setting Graph Real-life analogue
When the parameter "Time And Energy Received Per Day" was set low (10 units per day), or when the parameter "TAE to Join Group" was set high (60 units), no groups formed. Individuals simply didn't have the required energy to form groups. They also maintained few dyadic ties, so group co-membership wasn't able to support group joining either.
This graph of the total number of dyadic ties in the system over time shows random variation in, and paucity of, ties between individuals. For this and all subsequent graphs, the X axis is time in "days" between 0 and 500.
When people are impoverished and struggling just to survive, they don't have the energy to join together for mutual benefit. When prisoners are closely watched, group formation has high cost and high risk.
When the parameter "Tie Probability" was set low (0.001, or a 1 in 1000 chance of forming a tie on any one day), few groups formed (about 10 instead of the usual 120-140). individuals rarely formed acquaintances (dyads), so groups could not form.
This graph of the total number of dyadic ties in the system over time shows the slow increase in tie numbers.
Shoppers in a store or drivers on a road have little opportunity to connect, so few connections (dyadic or otherwise) form.
When the parameter "Group Leaving Probability" was set very high (0.1, or a 1 in 10 chance of leaving a group on any one day), few groups resulted (35 instead of the usual 120-140). Groups did form, but individuals left them so quickly that few groups
This graph of the number of groups in the
Internet chat groups and other modes of activity considered to be of trivial importance (by most) tend to have high turnover.

21
Parameter setting Graph Real-life analogue
survived for very long. They "flared out."
system over time shows few groups (ending at about 35 groups, when 120 was the normal number).
When the parameter "Group Fails If Inactive For Consecutive Days" was set high (100 days), few groups formed (48 instead of the usual 120-140). Individuals joined groups and stayed in them because groups never failed. Thus new groups could not form because all available participants were used up.
This graph of group size over time (one line per group) shows a comparative lack of flux in the number of individuals per group.
In situations like this, apparent failure is denied or explained away. For example, it has been often said that it is hard to start new political parties when attempts to discredit existing parties are met with "spin."
When the parameter "Group Active If TAE For Day Above" was set high (80 units per day), some but not a lot of groups formed (91 instead of the usual 120-140). Groups were inactive most of the time, so they failed and people didn't stay in them. As a result the simulation ended up with few ties and few memberships.
This graph of two-dimensional Blau space shows many small failed groups. For this and all subsequent Blau-space graphs, the two dimensions to show were simply selected by choosing a combination that showed the pattern well (usually the pattern was the same across all pairwise groupings of dimensions).
A real-life analogue of such a situation might be group formation among people who cannot engage in a task together, as with the mentally ill.
Many groups
These are some of the parameter values which caused the greatest number of groups to form and persist. I should mention that looking at these particular parameter values is difficult because as the number of groups grows the probability of having problems with computation also grows. All of these runs either timed out (took longer than several seconds to run a single day of the simulation, which at 500 days per run would make sensitivity analysis impossible) or were cut off at 150 groups to avoid “out of memory” errors in keeping track of all the groups and group memberships.

22
Parameter setting Graph Real-life analogue
When the parameter "Group Leaving Probability" was set low (0.01, or one chance in 100 that people will leave a group on any day), individuals don't leave groups, but they keep joining them, so individuals maintain many memberships and there are many groups. Many of these groups are non-performing, however, and so they fail at their goals. Instead of groups being abandoned, they either succeed or fail (and then stay on forever).
This graph of two-dimensional Blau space shows how much larger the winning groups are in this condition (the red winning group has many members while the many black losing groups have fewer).
Some people subscribe to online discussion groups, then stop paying attention to them, but never make the effort to unsubscribe (it requires too much time or attention). Their information stays there, so they don't leave the group officially, but they don't contribute to the success of the group either, simply remaining as "dead wood."
When the parameter "Group Fails If Inactive For Consecutive Days" is set low (10 days), many groups form. Because groups can fail quickly, individuals leave them and have the time and energy (TAE) to maintain many memberships. However, nearly all of the groups fail to achieve their goals because people don't stick around through the hard times (are quick to leave).
This graph of two-dimensional Blau space shows many failed groups.
Internet discussion groups are a good example of this phenomenon; sometimes people don't give groups much of a chance to get started before they give up on them and move on to the next big thing. Fads are a similar phenomenon.
23
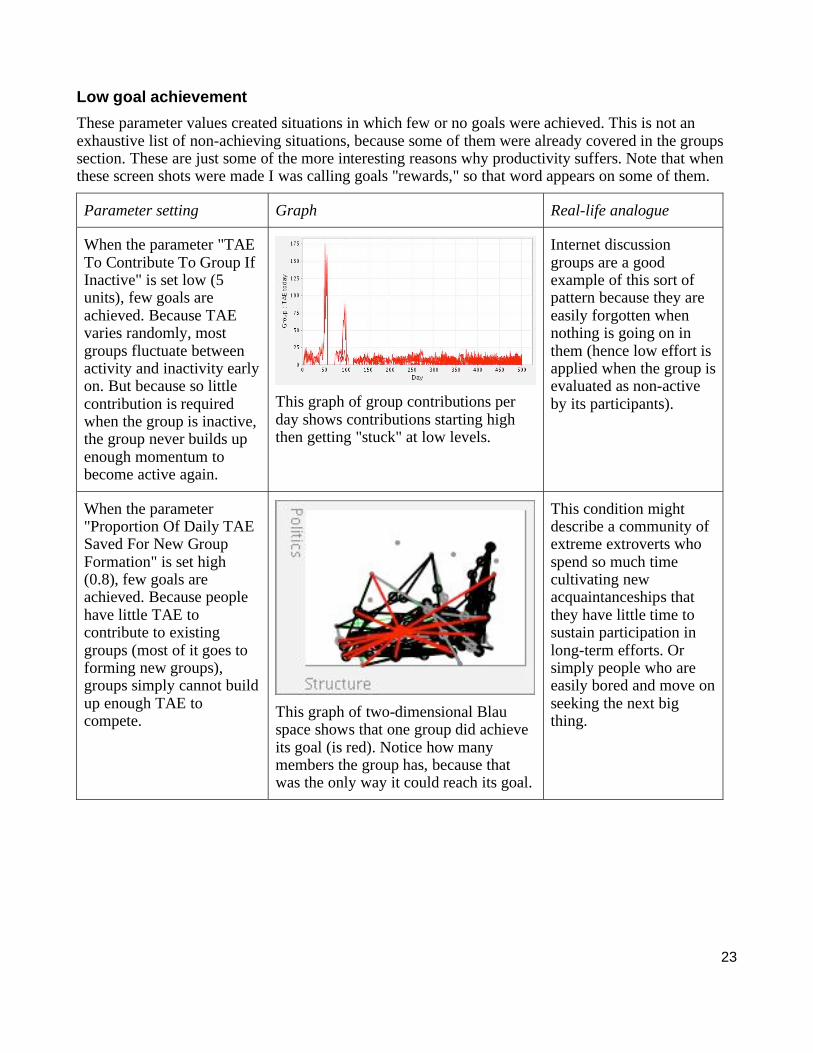
Low goal achievement
These parameter values created situations in which few or no goals were achieved. This is not an exhaustive list of non-achieving situations, because some of them were already covered in the groups section. These are just some of the more interesting reasons why productivity suffers. Note that when these screen shots were made I was calling goals "rewards," so that word appears on some of them.
Parameter setting Graph Real-life analogue
When the parameter "TAE To Contribute To Group If Inactive" is set low (5 units), few goals are achieved. Because TAE varies randomly, most groups fluctuate between activity and inactivity early on. But because so little contribution is required when the group is inactive, the group never builds up enough momentum to become active again.
This graph of group contributions per day shows contributions starting high then getting "stuck" at low levels.
Internet discussion groups are a good example of this sort of pattern because they are easily forgotten when nothing is going on in them (hence low effort is applied when the group is evaluated as non-active by its participants).
When the parameter "Proportion Of Daily TAE Saved For New Group Formation" is set high (0.8), few goals are achieved. Because people have little TAE to contribute to existing groups (most of it goes to forming new groups), groups simply cannot build up enough TAE to compete.
This graph of two-dimensional Blau space shows that one group did achieve its goal (is red). Notice how many members the group has, because that was the only way it could reach its goal.
This condition might describe a community of extreme extroverts who spend so much time cultivating new acquaintanceships that they have little time to sustain participation in long-term efforts. Or simply people who are easily bored and move on seeking the next big thing.

24
Parameter setting Graph Real-life analogue
When the parameter "Group Leaving Probability" is set high (0.01, or a 1 in 100 chance of leaving a group on any one day), few goals are achieved. There is a lot of volatility in group membership and group size. This churning causes “good groups” to quickly appear and achieve their goals. Later, groups of lesser merit (to which people contribute less) predominate (recall that groups cannot achieve goals twice). Note however that when this parameter was even higher (0.1) groups could not cohere long enough to collaborate. There seems to be a sweet spot between flux and stagnation where achievement works best.
This graph of group contributions per day shows a lack of TAE contribution to groups after the initial surge of contribution to the "best" groups.
This sort of sorting process takes place at "open space" conferences, where people switch quickly between groups initially then settle down to longer membership. Some degree of churn at the start of a group collaboration process seems to be useful; but too much churn can lead to lack of production.
When the parameter "Competition Bias" is set low (0.1), few goals are achieved. Recall that this parameter is a measure of absorption in the group, or how much other groups can compete for the individual's time and attention. A low setting for competition bias means that individuals who join groups are not likely to leave them due to absorption in the activities of the group. In this condition, more goals than usual are achieved up front because individuals stay in
This graph of accumulated rewards (goals achieved) over time shows an early accumulation of goals and a low total number.
Communities in which people are heavily committed and passionate about group efforts, such as people trying to save their homes, will achieve their collective goals more quickly than those who form groups for trivial reasons. However, comparatively few people are intensely motivated to pursue common goals, and groups that don't offer moderately-motivated people other attractions to stay in a group often

25
Parameter setting Graph Real-life analogue
groups for longer and thus the groups have a chance to build up to the achievement level. However, the “good” groups then get used up and fewer goals are achieved later.
end up with all of the work being done by a passionate few.
High goal achievement
These are some of the more interesting ways in which the number of goal achievements can be very great.
Parameter setting Graph Real-life analogue
When the parameter "Group Active If TAE For Day Above" is set low (10 units), many goals are achieved. Because there is a very low threshold to participation in the group, many incremental gains can be made that would otherwise be lost (because no TAE accumulates when the group is inactive).
This graph of accumulated TAE per group over time (one line per group) shows incremental accumulation of TAE towards goal achievement. (Horizontal lines show flat-lining of TAE after goals are achieved).
This graph of accumulated goals achieved in the entire system shows a linear increase in goals achieved. This condition and the condition of low “TAE To Contribute To Group If Inactive” were the only parameter
A perfect analogue to this incremental-improvement situation is found in groups that require very little effort to contribute, with no absolute barrier. For example, on Wikipedia one can correct one comma without an account, or much knowledge, or much difficulty. One could argue that this very low barrier to contribution (similar to a low activity threshold) has been behind the success of Wikipedia (though certainly there have been other factors as well, such as commitment and passion).

26
Parameter setting Graph Real-life analogue
settings to produce such a linear increase. All others created an S-shaped curve of overall goal achievement. My guess is that the S shape indicates a period when groups are sorting out between active and inactive. These two parameter settings avoided that process (one with good results the other with poor results).
When the parameter "Days Knowing Person Before Full Probability Of Joining Their Groups" is set high (100 days), many goals are achieved. Many small groups form as people form ties, but because people don't drag each other into their mutual groups, the groups stay small and compete heavily for TAE. There is huge flux in group membership, and people have more freedom to sort into the best groups quickly, so the groups that do persist are “good” groups that perform well.
These two graphs, of group size and individual memberships over time, show the effects of intense competition for members on group size (blue) and the number of memberships per person (purple). These graphs show much more flux (fine movement) than similar graphs with default parameters.
What this seems to say (to me) is that people often have many societal constraints on forming groups and volunteering for causes. A classic example is a story I heard from a Peace Corps volunteer who said that in some parts of Africa, anyone who gets a little money or makes a good business connection is obliged by tradition to share it with his family and village. Thus there is little incentive to innovate. This would say that the more freedom people have to voluntarily contribute to causes of interest without being "dragged away" from those interests by unrelated ties, the better those causes will fare. However, of course, the simulation assumes that ties are unrelated to group membership. Sometimes people drag family members into beneficial contribution. This points out the fact that noting where the simulation departs from reality can be just as

27
Parameter setting Graph Real-life analogue
useful as noting where its mimicking is insightful.
Variation in group size
It is particularly interesting when some groups are very small while others are large, and it is interesting when all groups are the same size. Here is one interesting condition that produced the largest variation in group size.
Parameter setting Graph Real-life analogue
When the parameter "Time And Energy Received Per Day" is set high (100 units), there was high variation in group size (a standard deviation of about twice the mean group size). In this run individuals were basically “rich,” so they formed many groups and jumped about often from group to group. The best groups quickly achieved their goals and were stuck there, and only lesser groups remained.
These graphs show distribution of group sizes and typical “good sorting” achieving-group centrism.
This situation arises whenever people have a lot of time and energy to contribute to something.
And here is a condition that produced the smallest variation in group size.
Parameter setting Graph Real-life analogue
When the parameter "Group Active If TAE For Day Above" was set high (80 units), there was low variation in group size (a standard deviation about half the mean group size). Here there was a general failure of the sorting
The analogous situation here is people for whom contributing to a group is very difficult on a daily basis. This can be because of limitations on the people themselves (they are invalids or very busy) or it can be

28
Parameter setting Graph Real-life analogue
mechanism. Since groups needed so much investment to stay active, they failed and people left them, so groups stayed uniformly small. There were no "winners" at all.
These graphs show small variation in group sizes, little flux, and group failures.
because of problems with the group (the meeting place is hard to get to, the web site is confusing or often broken, the police are watching, and so on). You can imagine that if you wanted groups to fail to achieve their goals (terrorist groups for example) you might want to increase the difficulty of interacting with the group on an everyday basis.
There is an interesting overall pattern here: configurations that produce a “sorting out” effect lead to productive communities in general. It seems that a combination of easy engagement in groups and high mobility to “move up” to better options produces a better overall effect on goal achievement.
Group dispersion
The dispersion of a group describes how far-flung it is across Blau space. I calculated group dispersion as the standard deviation of group centroids, averaged across all dimensions. I could not find a single parameter that could explain the variation found in dispersion. It is possible that increased group dispersion is a result of the intermixing of several “good” conditions. I didn't try combinations of parameters in search of good dispersal conditions, but that would be the obvious next step.
There was, however, a marked link between dispersion and production. The mean group dispersal of all groups was 12.37, but the mean group dispersal of goal-achieving groups was 20.44. Unfortunately I didn't think of comparing goal-achieving versus failed groups when I ran these simulations and calculated the difference, but I would expect an achieved/failed comparison to have been even stronger. Still, this dispersion-productivity link is readily apparent in any of the dimensional graphs run during default conditions, in which the red achieving center is ringed with a periphery of black failed groups. Choosing a few graphs at random to illustrate:
What does that mean? It means that the broader the experience and background of its members the greater the chance a group has to achieve its goal. Why does the simulation produce such a result? Recall that simulated individuals contribute their time and energy to groups preferentially based on how close they are in Blau-space distance to the centroid of the group and how well the group is doing. As groups grow in members, the more their membership covers all available space, the more likely that

29
their centroid will be closer to the locations of any new members. In other words, groups with more internal diversity are more likely to attract new members. Preferential contribution to groups with the closest centroids represents people being more willing to contribute a group if they feel more "in synch" with its spirit. The more diverse a group the more likely new members will be able to find people in the group to connect with. In contrast, groups whose membership does not cover some areas will not be as able to attract new members from that area. Adding in the "rich get richer" pattern just intensifies the effect. Thus groups that form at the periphery of the available space do not have enough requisite diversity to survive and achieve.
Group overlap
Group overlap describes to what extent different groups occupy the same space. In all the single-parameter variations I tried, only one seemed to affect group overlap. That was tie probability. When tie probability was very low, groups didn't get a chance to overlap because there were simply very few of them. When tie probability was high, there were more groups and more likelihood of them being in the same spots. That is a pathological case, however, and probably doesn't deserve attention.
I did see an achieved/failed difference for overlap as for dispersion, however. The mean group overlap of all groups was 15.69, but the mean group dispersal of goal-achieving groups was 10.72. This means that productive groups overlapped with each other less than did other groups, which points to the possibility that they staked out different “niches” in Blau space. This is something McPherson mentions as a social phenomenon. If we look at some dimensional graphs we can see some of the niches in the dimensions where the distribution is spread out enough to cause distinct niche areas.
Group formation rules
I ran five sets of simulation runs with all combinations of these three group formation rules:
1. at least one person under 20 must be in the group at all times (“Age”)
2. no more than 40 percent of the group membership may be from any one division of the client organization (“Agency”)
3. at least one of the members of the group must be not from the main country but from another country in the same region (“Relation”)
I began by contrasting runs that applied this rule set when group size had reached either five members or two members. The two-member rule had so strong an effect that in many cases there were few groups at all. The five-member rule had an intermediate effect. I settled on an intermediate scheme where the rules applied once group size rose to four members.
I then ran five 500-day simulations for each of eight conditions: each group formation rule by itself (age, agency, relation), each combination of the three rules (age+agency, age+relation, agency+relation, age+agency+relation), and with no rules in place. I report the results of those 40 simulation runs here.

30
Effect on group size and number of groups
The most dramatic effect of group formation rules was on variation in group size and the number of groups. In a situation with no group formation rules, groups varied in size from two to 15 or 20, thus:
But in the runs with rules, the graph of group sizes looked like this. Variation in the size of groups, which ranged from 2 to more than 20 in the control case, damped down to almost nothing. (Since this graph overlays group sizes for all groups on top of each other, it appears that there are fewer groups than in the upper graph, but that is not necessarily so.)
Interestingly, mean group size (not variation) was different but not as strikingly so as it seems from these two graphs. Even in the “control” graph most groups are fairly small. This graph shows that mean group size was similar across all runs (rules or no rules). It is in the variation among group sizes that the rules change things, not in mean group sizes. Note: The standard deviations shown here are among the five simulation runs, not among groups within one run. The thin lines show means across each orange or purple set of bars.

31
The effect on group size variation, unlike mean group size, is dramatic. The standard deviation of group sizes is much higher with no rules than with rules. This means that group formation rules standardize group sizes. Also notice that even the standard deviations of group size across the five runs (the purple bars) is different: in the control case there is not only more variation in group size, there is more variation in the variation of group size from run to run. But rules create reduced variation in group size not only within but also among runs.
The fact that group formation rules create uniformly small groups would mean that there are more groups formed when rules exist, which we see here; but the trend is not as strong as you would expect. This may be because even though the variation in group sizes is much greater in the control case, the mean group size is still similar, so the number of groups is similar. It is simply the relative lack of large groups that is different.
It is interesting to see that all of the rules affected the number of groups formed, and the rule combinations did as well. It seems that any rule restricting group membership has an effect. This is a result of course of the particular rules set up and the particular makeup of the simulated population.
Effect on group dispersion and overlap
The most expected outcome of the group formation rules I tested would be to increase group dispersion and overlap, because I wrote the rules specifically to do that. You can see the difference between the control runs and those with rules: groups in which rules were in place were more dispersed than groups with no rules in place. This is how the simulation could be used to plan an SNS, by the way. A successful SNS increases the connectedness of a community or organization by increasing group dispersion through the application of group formation rules and achievement goals. In this respect the simulation could be useful in

32
planning an SNS by trying out different group formation rules and thinking about the results they create.
The effect on group overlap was less dramatic and probably indistinguishable from chance. Another "thought experiment" might be to come up with other rules that create that effect, if it is desired. Group overlap (occupying the same areas of Blau space) might be something planners care about increasing or decreasing.
Effect on dispersion and overlap in goal-achieving groups
Group formation rules also had an effect on the ratio of goal-achieving to all-group dispersion. Recall that earlier I said that goal-achieving groups were more dispersed than the general group population. When group formation rules were applied, goal-achieving groups became less dispersed in relation to the general population.
This difference can be seen by comparing a typical Blau-space graph for a run without rules (on the left) to a run with rules (on the right). In the run without rules the goal-achieving groups form a thick cluster, while in the rule situation the pattern is more of separated smaller clusters of goal achievement.
My interpretation of this pattern is that group formation rules, because they incorporated homophily into them, created diverse niches of homophily to which individuals could contribute, even though the groups did not have the requisite diversity to attract new
no rules rules

33
members at random. In essence, the group formation rules improved group achievement in spite of insufficient diversity. If your goal in using the simulation was to help people achieve goals (rather than form diverse groups), you might find this result useful. If you wanted to increase rather than decrease dispersion in goal-achieving groups, you might then play with some other group formation rules.
Recall that I found goal-achieving groups to be less overlapped than the general population of groups, because they fit into different niches in Blau space. When rules were applied, this effect was intensified. Group formation rules help groups find niches for better performance.
Note the smaller standard deviation among the runs in the “No rules” case, which means that rules also produce increased variation in the ratio of overlap in goal-achieving to all groups.
You can see the increased overlap in comparing two Blau-space graphs. The first image is from a run with no rules; the second is from a run in which the “Less than 40 percent from each agency” rule was applied. Groups on the right are more distinct in their placements than groups on the left.
no rules Agency rule
A few notes on future improvements to simulations incorporating Blau space dimensions are as follows.
1. The attraction of homophily should be coupled with one of complementarity, since this issue has been raised as a possible improvement on simple homophily.
2. Constructs are used to create the simulation via mutually exclusive selection, but in reality these influences should blend together.
3. Groups should be able to come back from an achievement or failure and try again. This is more realistic and would make the simulation more interesting as well.

34
Uses of the simulation
In an earlier paper (Kurtz & Snowden 2003) three limitations involved in simulating human behavior in an agent-based simulation were described, thus.
1. Humans are not limited to one identity; thus simulations that represent people as atomistic decision-making agents will be flawed.
2. Humans are not limited to acting in accordance with predetermined rules, but are able to impose structure on their interactions (or disrupt structure) as a result of collective agreement or individual acts of free will; thus simulations in which agents follow rules are suspect.
3. Humans are not limited to acting on local patterns; thus simulations that represent only local views are limited.
When I began to research ways to build agent-based simulations for SNS support, I wanted to address some of these issues, even if only partially. The use of Blau space does go some small distance in alleviating these problems. But no simulation of human behavior (including this one) can ever provide particular predictive ability, that is, predict what particular people will do in particular circumstances.
Prediction is only one use of simulation, and where human society is concerned it may not be the most important one. Working on this simulation solidified my belief that simulation can be a powerful tool for descriptive self-awareness, multi-perspective understanding, and group sensemaking. Simulation results used in these ways are like I Ching patterns: the results may not answer the question, but they nudge the mind into thought patterns that do answer the question. They answer the question by process rather than by fact; and this may be no less valuable a result. In fact, I have come to the conclusion that an emphasis on simulation for prediction obscures and prevents what are ultimately more beneficial uses of simulation for sensemaking.
One might argue that a simulation could lead people astray and cause them to conclude things about human societies that are simply not true. After all, if statistics can lie, cannot simulation? But if you think of a simulation as a means of brainstorming, or opening up possibilities, instead of a means of concluding, or closing down possibilities, this objection goes away. Typically when people talk about idea generation they say that you should temporarily suspend your critical faculties and let ideas flow freely; then, when the brainstorming phase of your thinking is complete, you should apply severe criticism and sort fact from fiction. When social simulations such as this one are securely housed in the brainstorming phase, they provide greater utility than they possibly can when they are applied to other phases of thought. Lies, or fictions, or narratives, are just as valuable in brainstorming as verifiable truths, because they perform the important function of broadening the scope of thought. When we allow simulations to lie, we can get more out of them — as long as we remember why and how we are using them.
Concerns about, and enthusiasm for, simulation in sensemaking are well represented in the literature on social simulation. Kohler (1999) speaks of “strong” and “weak” social simulation paralleling the definitions of strong and weak artificial intelligence. Strong social simulation would be able to predict future conditions, while weak social simulation simply provides the sense-making benefits mentioned above. Says Kohler (1999) about the benefits of weak social simulation:
[Social simulation] forces all of us to make explicit the many notions we have always held vaguely to be true. It allows us to visualize and analyze what we have not been able to even imagine: the organization generated through the parallel processes of many interacting entities.
Hulin and Ilgen (2000) echo this when they say, “Simulations and modeling offer advantages over the severely bounded rationality of human reasoning.” In other words, simulation provides a means of

35
supplementing reasoning with additional imagination. As one more example, Monge and Contractor (2003) published an excellent diagram that describes the simulation process (which I have reproduced here). One can easily substitute “decision” wherever this diagram reads “research” and use it to explain why I think social simulation is useful for decision support: it gives decision making more internal richness and intricacy.
This idea of confining simulation in complex areas such as human behavior to generative rather than conclusive processes is consistent with an approach to simulation called exploratory modeling which has been applied in the world of policy planning. In the seminal paper on exploratory modeling, Bankes (1993) contrasts exploratory models with consolidative models, which attempt to predict specific systemic behavior. Says Bankes (1993):
Consolidative modeling is the design of models driven by what is known. Many of the great moments in the history of science, Newton's laws of motion, Maxwell's theory of electromagnetism, or Darwin's theory of natural selection, to name a few, are examples of the consolidation of previously determined facts into a single unifying model. Consequently, much of our scientific cultural heritage presupposes a consolidative research strategy. This paradigm for modeling a target system is such a deep part of our culture that many may regard it as obvious.
In reading this I couldn't help but think of the Cynefin framework (Kurtz and Snowden 2003), its emphasis on the use of the right tool in the right context, and its caution against the overuse of ordered techniques: "The case study approach of many M.B.A. programs and the desire for precise recommendations from policy teams and external consultants perpetuate the underlying assumption of universal order."
Bankes goes on to say (my emphasis):
A model can be helpful in suggesting an explanation for a puzzling fact, even if it is eventually proven wrong. Where no explanation previously exists, a model that suggests a plausible explanation can guide the search for other examples, or new data, or provide a basis for decision making superior to guessing if it represents all that is known.... When used for exploratory modeling, the computer functions as a prosthesis for the intellect, supporting the discovery of implications of a priori knowledge, novel explanations of known facts, or unrealized properties of conjectures.
I would go just a bit further than the statements of Bankes and others on exploratory modeling, because the paradigm seems to limit the use of such exploration to some of the simpler forms of sensemaking such as scenario generation. For example, Lempert et al. (2003) say:
When applied to robust decision analysis, exploratory modeling uses the computer to create a large ensemble of plausible future scenarios. Here, the term “scenario” is used to represent one guess about how the world works combined with one choice among many alternative strategies people might adopt to influence outcomes. The approach then uses computer visualization and search techniques to extract information from this ensemble of scenarios that is useful in distinguishing among alternative decision options.
I would challenge proponents of exploratory modeling to broaden their use of simulation beyond the search through plausible future scenarios and "guesses about how the world works" and into the support of sensemaking that considers multiple perspectives, implausible scenarios (perhaps

36
nightmares and fantasies as well as guesses, or guesses about how the world might work after the world doesn't work the way it does now), and dramatic narrative and metaphor. These are a few examples of uses of this and other such simulations in sensemaking:
• People might use the simulation for descriptive self-awareness. Part of my work in the past several years has been researching ways to help people look anew at themselves in order to discover dangers and opportunities. The emphasis has been on helping people do this for themselves rather than having an outside “expert” hand over "findings" or "conclusions" which often fail to discern nuances of situations only visible to those in the community of interest. Working with social simulations can aid in this self-discovery process. Deciding how to portray a population in the abstract terms a simulation provides forces people to ask themselves questions like “How easily can people form new groups?” and “What are the barriers to group achievement?” These are things they might never have thought to ask before. Also, when people make such descriptions in groups, differences in perspective with respect to essential facts about communities will be brought to light.
• People might use the simulation to think about decisions to be made in interacting with a population. For example, one might want to increase “tie probability” by giving individuals more chances to meet (perhaps in large common spaces), or one might want to reduce the “time and energy to form a group” by making discussion spaces freely available without a lengthy approval process. Conversely, if one is studying ways to keep groups from forming in a population, one might want to consider increasing the “failure multiplier for group leaving probability” by making group failures well publicized. People can use the simulation to run "thought experiments" on these ideas and see what happens. People can then consider whether the patterns they see match with empirical observations; and why or why not; and if not, they might investigate what other explanations might produce the same result.
• People might use the simulation to explore hypotheses about how groups form in a particular community. For example, if people were studying paramilitary groups in a conflicted region, they might input some rules based on observations of such groups. They could then compare the simulated patterns with observed patterns to see if there is evidence for the hypotheses.
• People might use the simulation to get ideas for useful probes to find network behaviors of interest. For example, the pathological condition of people not being able to form groups can come about through several parameter constellations. People might play with the parameters in order to come up with conditions which might presage those pathological conditions, as weak signals, and watch for their occurrence.
• People might use the simulation to explore issues of common cause. By definition homophilous groups will not form randomly across the dimensions, but will occur where the greatest potential for common viewpoints can be found. Comparing the average Blau-space distance within groups in each dimension will produce a ranking of dimensions from most to least dispersed. This is not necessarily something that can be surmised simply from the definition of the constructs alone, since their combination requires computational complexity beyond that which people can easily carry out themselves.
• People might use the simulation to explore multiple perspectives on a topic. For example, people from different backgrounds or with different political views might be invited to run the simulation in parallel and come up with interesting trends. Then several such groups might be asked to come together and compare how they put together and interpreted their simulation. Or, people might start with a common set of parameters that describe the way a population works today, then split into different groups and create varying scenarios of how the situation might

37
change over time. Perhaps for one group technology will improve volunteer contribution, while for another a technological crisis might cause people to stop trusting strangers.
• People might use the simulation to expose hidden assumptions about other groups of people. For example, say two groups within an organization model its customers or constituents separately and compare their results. The comparison might show telling differences in customer perception.
• People might use the simulation for counterfactual exploration – what ifs, past as well as future – and for devil's advocate exploration. For example, people might set up a simulation that seems to describe a particular community, then one by one break assumptions about the community and see what happens to the network that forms. Narrative is a particularly useful tool in this sort of assumption breaking. One could imagine a group of people working together to use the simulation as an generator of components for a composite story (Kurtz 2008). Contrasting multiple stories told by groups with different perspectives would broaden thought even further.
• People might use the simulation to support metaphorical perspective shifts. Metaphorical gaming is a tool that helps people free themselves from the particulars of their situation in order to find new perspectives which provide critical insights. For example, one might ask a group of people to construct a story in which sensitive issues of power and responsibility are recast into the world of a fantastical world on another planet or in the ancient past. Social simulation has the same potential, when combined with narrative, to remove thought patterns from the concrete and create serendipitous encounters with patterns that change perspectives. Manipulating simulation parameters, viewing the results, and interpreting them – especially in groups – can lead people to see familiar practices through new eyes.
Conclusion
The initial goal of this work was to find ways to help people plan SNS projects. Some useful ways to help people plan such projects resulted, primarily looking at group dispersion and overlap in response to various parameter and rule sets. Another result of the work is that it demonstrates the utility of Blau space as a foundation for building simulations for sensemaking about human society. The dimensions of Blau space provide meaningful axes around which people can gather their thoughts and find scope for the imagination.
The most striking result of the work, for me, was how much using the simulation helped me to reflect on how groups form and how networks work. Probably the strongest pattern in the simulation runs was that a "sorting out" process improves goal achievement. People need the freedom to self-organize — and re-organize — until good fits are found. Another intriguing pattern was the impact of requisite Blau-space diversity on group achievement. But the simulation didn't prove these points; it reminded me of them. Even though the insights made sense in retrospect, I'm not sure I would have come to them on my own without the stimulation provided by the simulation. I'm not in charge of public policy or involved in the management of an organization, so if doing this gave me food for thought, it would surely do that for others — others who could do more with such nourishment than I can.
In closing, I would like to encourage more use of social simulation for thinking and talking about the workings of any group, internal or external, friendly or hostile, in the past or future, as a valuable sensemaking support tool. Putting aside ideas of simulation perfectly predicting behavior in human societies, though that might seem like defeat, frees people to use simulation in what I think is ultimately a more fruitful endeavor: helping people make the best decisions they can in an uncertain world.

38
Acknowledgements
This work was supported in part by Cognitive Edge and its clients. Thanks to Paul Fernhout for review and discussion.
References cited
Bankes, S. 1993. Exploratory modeling for policy analysis. Operations Research 41(3): 435-449.
Blau, P. 1960. A theory of social integration. The American Journal of Sociology 65: 545.
Chattoe, E., and N. Gilbert. 1997. A simulation of adaptation mechanisms in budgetary decision-making. In R. Conte, Hegselmann and P. Terna (Eds.), Simulating social phenomena (Vol. 456, pp. 401-418). Berlin: Springer.
Edmonds, B. 2006. The emergence of symbiotic groups resulting from skill-differentiation and tags. Journal of Artificial Societies and Social Simulation 9(1).
Gilbert, Nigel. 2000b. Modelling sociality: The view from Europe. In T. Kohler & G. Gumerman (Eds.), Dynamics in human and primate societies: Agent-based modeling of social and spatial processes (pp. 355-372). Oxford: Oxford University Press.
Hulin, C.L, and Ilgen, D. R. 2000. Introduction to computational modeling in organizations: The good that modeling does. In D. R. Ilgen & C. L. Hulin (Eds.), Computational Modeling of Behavior in Organizations: The Third Scientific Discipline (pp. 3-18). Washington, DC: American Psychological Association.
Kohler, T. A. 1999. Putting social sciences together again: an introduction to the volume. In Kohler T A and Gumerman G J (Eds.) Dynamics in human and primate societies: Santa Fe Institute.
Kurtz, C.F. 2009b. The Wisdom of Clouds. White paper available at http://www.cfkurtz.com.
Kurtz, C. 2008. Working with Stories. Online e-book available at http://www.workingwithstories.org.
Kurtz, C & Snowden, D. 2003. The New Dynamics of Strategy: sense making in a complex-complicated world. IBM Systems Journal” 42(3): 462-483.
Lempert, R.J., S.W. Popper and S.C. Bankes. 2003. Shaping the Next One Hundred Years: New Methods for Quantitative, Long-Term Policy Analysis. Santa Monica, CA: RAND.
McPherson, J. M. and Ranger-Moore, J.R. 1991. Evolution on a Dancing Landscape: Organizations and Networks in Dynamic Blau Space. Social Forces 70: 19-42.
McPherson, J. M.. 2004. A Blau Space Primer: Prolegomenon to an Ecology of Affiliation. Industrial and Corporate Change 13: 263–80.
McPherson, J.M. 2000. Modeling change in fields of organizations: some simulation results. In D. R. Ilgen & C. L. Hulin (Eds.), Computational Modeling of Behavior in Organizations: The Third Scientific Discipline (pp. 3-18). Washington, DC: American Psychological Association.Monge, P. R. and Contractor, N. S. (2003) Theories of Communication Networks. New York: Oxford University Press.
Monge, P. R. and N.S. Contractor. 2003. Theories of Communication Networks. New York: Oxford University Press.

39
Palmer, V. 2006. Simulation of the Categorization-Elaboration Model of Diversity and Work-Group Performance. Journal of Artificial Societies and Social Simulation 9(3).
Snowden, D. 2005. From atomism to networks in social systems. The Learning Organization 12(6): 552-562.
Windrum, P., Birchenhall, C.R. 1998. Is life cycle theory a special case?: dominant designs and the emergence of market niches through co-evolutionary learning. Structural Change and Economic Dynamics, 9, pp.109-134.
Yunus, M. 2003. Banker to the Poor: Micro-Lending and the Battle against World Poverty. New York: Public Affairs.
Zeggelink, E.P.H, de Vos, H. and Elsas, D. 2000. Reciprocal altruism and group formation: The degree of segmentation of reciprocal altruists who prefer 'old-helping-partners'. Journal of Artificial Societies and Social Simulation 3(3).